22
Arvid Moss Capital Markets Day 2016 Energy
Arvid MossCapital Markets Day 2016
Energy

Energy asset overview
• 3 production areas
• 26 power stations
• Annual production 10 TWh
• Net spot sales 2-6 TWh
• 41 generators/2260 MVA/2040 MW
• 190 employees
• Competence center on energy for Hydro’s aluminium business
The second largest hydropower operator in Norway
Vigeland
Sogn
Røldal-Suldal
Skafså
Telemark
149
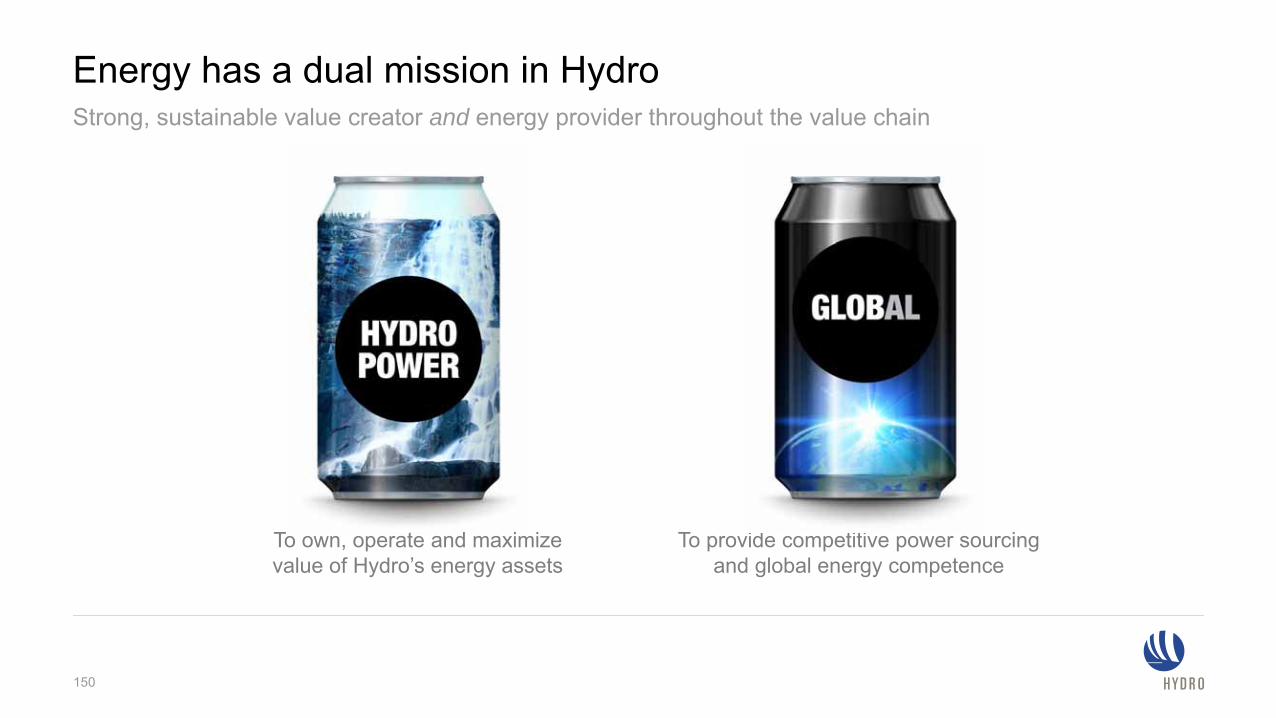
Energy has a dual mission in HydroStrong, sustainable value creator and energy provider throughout the value chain
To own, operate and maximizevalue of Hydro’s energy assets
To provide competitive power sourcing and global energy competence
150

Energy: Securing power supply, maximizing asset value
Hydro Energia in operation in Brazil
Mannsberg power plant in operation
New power contracts to Neuss, Germany. Fully supplied until 2025
Signed wind power contract with Nordic Wind Power DA, Norway
Midtlæger power plant in operation
Amendment to law on ANS/DA Industrial ownership approved in Parliament
CMD 2016
CMD2015
Increased activities to improve industrial framework conditions in Brazil
151

Energy strategic priorities
• Realize full potential of strong asset base and competencies
• Further improve operational and commercial performance
• Provide competitive global energy sourcing and competence
• Capitalize on strong climate position over time
• Capture value of the green certificate scheme in new growth projects
• Promote responsible energy policy in the regions where Hydro operates
• Mature captive growth opportunities
• Raise income potential from market operations and commercial optimization
• Leverage value from Nordic power surplus
152

Power Markets
153

• New renewable generation continues to surprise
• Unsubsidized solar and wind power cost projects at record-low 30 USD/MWh
• Change of behavior among power industry players globally continues after Paris-agreement
Source: BNEF, OECD, UN, UNFCCC
Observed delink between global GDP and CO2 emissions
-
20
40
60
80
100
120
140
160
2006 2007 2008 2009 2010 2011 2012 2013 2014 2015Renewable Fossil
Net increase in global power generation capacity, in GW
Index (2000=100)
160
150
140
130
120
110
100
902000 2005 2010 2015
PopulationGDP
Emissions
Impact of global «Energiewende» becomes evident
154
Transitioning to a low carbon, reliable and affordable energy supply
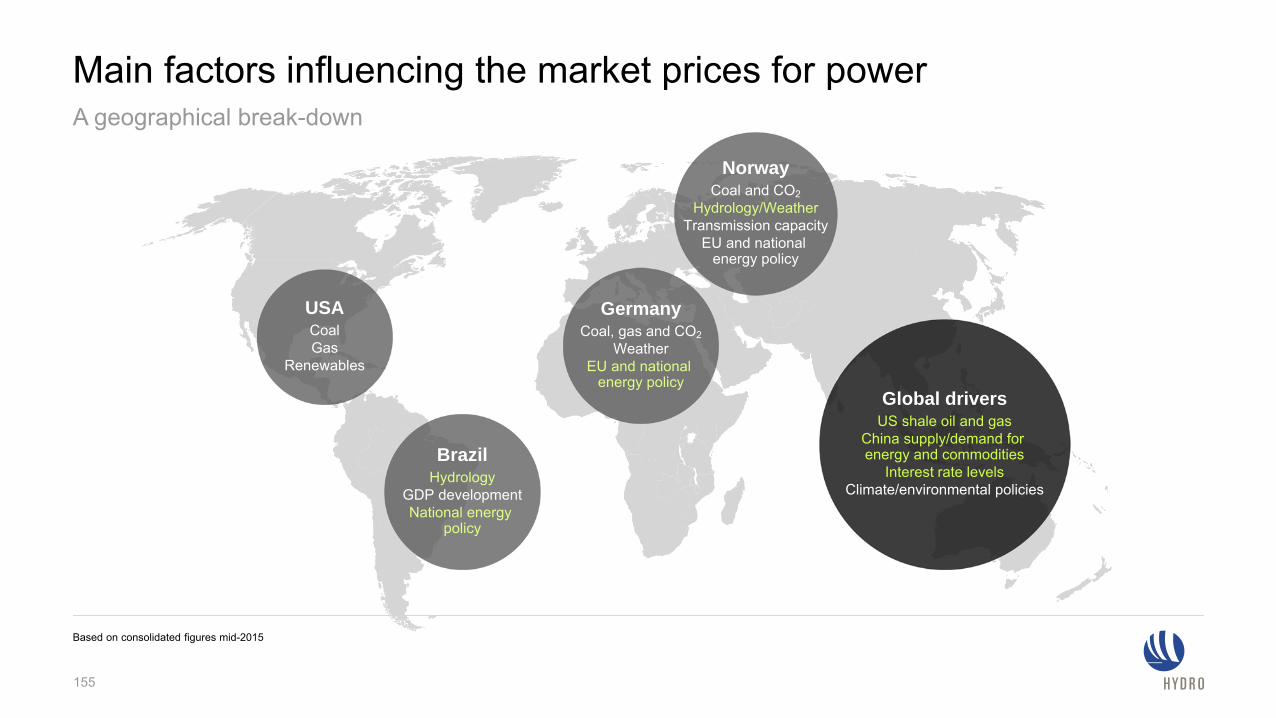
Main factors influencing the market prices for powerA geographical break-down
Based on consolidated figures mid-2015
USACoalGas
Renewables
BrazilHydrology
GDP developmentNational energy
policy
GermanyCoal, gas and CO2
WeatherEU and national
energy policy
NorwayCoal and CO2
Hydrology/WeatherTransmission capacity
EU and national energy policy
Global driversUS shale oil and gas
China supply/demand for energy and commodities
Interest rate levelsClimate/environmental policies
155

Nordic power prices decline over the last yearsLower CO2 and coal prices as key factors. Forward curve reflects current coal, CO2, gas prices and supply side
Source: Nordpool Spot. Prices expressed in yearly averages
0
5
10
15
20
25
30
35
40
45
50
55
60
2000 2002 2004 2006 2007 2009 2011 2013 2014 2016 2018 2020 2021 2023 2025
Historical systemprice Nordpool Forward Market Oct 2014
Nordpool Forward Market Oct 2015 Nordpool Forward Market Oct 2016
0
5
10
15
20
25
30
35
40
45
50
55
60
Mar
ket 2
008
CO
2
Coa
l
Dem
and
2016
E
Hyd
rolo
gy
Nordic power prices halved from 2008 to 2016, EUR/MWh (real 2016) Nordic system price, EUR/Mwh (nominal)
156

Energy in Hydro -Update on selected topics
157

Value creation in Energy dependent on wide array of factors
Power Price
Expiring and new contracts
Sustaining CAPEX
OPEX & taxes
CAPEX and Earnings fornew GWh
Commercialand operational
competence
Volume
Drivers
158

-
10
20
30
40
50
60
70
80
90
2000
2001
2002
2003
2004
2005
2006
2007
2008
2009
2010
2011
2012
2013
2014
2015
2016
2017
2018
2019
2020
Historical nordic systemprice Nordpool Forward Market 01.09.2008EEX Forward Market 01.10.2012 EEX Forward Market 01.07.2015
Nordic system prices and EEX forward curves, in EUR/MWh (nominal)2008:
• Hydro entered into a 250 MW contract for 2013-2020 as part of long-term sourcing efforts to Norwegian smelters (incl Husnes),
2012:
• Geographically optimization of power contract, distributing volumes to Germany (Neuss) and Norway
• Contract volumes allocated to Neuss from 2013-2017 priced at levels achieved in external long term contract
• Current realized losses in Energy of ~200 MNOK pa
2015:
• New external sourcing to Neuss for 2018 and forward - internal contract allocated to Neuss priced at similar levels
• Losses in Energy increasing with ~250 MNOK from 2018, similar improvement in Rolled Products
2021:
• Expiry of contract, improvement of 4-500 MNOK in Energy’s result* without other negative effects for other business areas
Contractual obligations impacting Energy figuresRepricing of internal contracts incurs losses
159

The diagrams on this slide are simplified for illustration purposes
Merge into a larger publicly-owned asset with one or several owners
Hydro ~3 TWh
NewCo>= 9 TWh
>= 6 TWh
• Retain full production as part of a larger asset• Max 1/3 Hydro (private) ownership• No reversion after such a transaction• Need partner(s) with min 6 TWh to maintain equity volume
Maintaining industrial ownership of RSK volumes and value within the reversion regimeJune law amendment allows private industrial ownership and physical hydropower offtake from minority stakes
“NewCo”
Privatecompany
Publiccompany
(-ies)
1/3 ownership
2/3 ownership
Dividendvia power
Dividendvia power
Can use 1/3 of the power
in industrial production
2/3 of the power sold in the market
Model for industrial ownership (ANS/DA)
Approved model for hydropower JVs:• Maximum 1/3 private ownership maintained• Allow private owners access to physical power • Pro-rata power offtake in line with ownership share
160
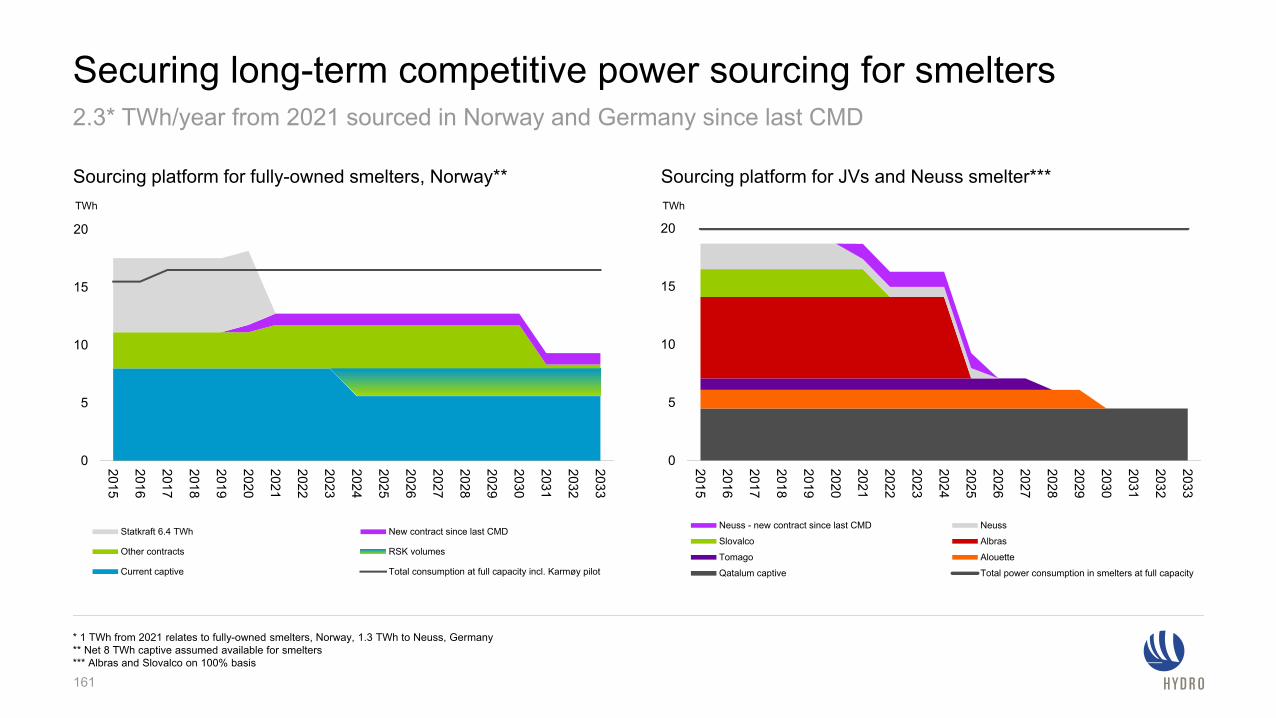
Securing long-term competitive power sourcing for smelters2.3* TWh/year from 2021 sourced in Norway and Germany since last CMD
* 1 TWh from 2021 relates to fully-owned smelters, Norway, 1.3 TWh to Neuss, Germany** Net 8 TWh captive assumed available for smelters*** Albras and Slovalco on 100% basis
0
5
10
15
20
2015
2016
2017
2018
2019
2020
2021
2022
2023
2024
2025
2026
2027
2028
2029
2030
2031
2032
2033
TWh
Statkraft 6.4 TWh New contract since last CMD
Other contracts RSK volumes
Current captive Total consumption at full capacity incl. Karmøy pilot
0
5
10
15
20
2015
2016
2017
2018
2019
2020
2021
2022
2023
2024
2025
2026
2027
2028
2029
2030
2031
2032
2033
TWh
Neuss - new contract since last CMD Neuss
Slovalco Albras
Tomago Alouette
Qatalum captive Total power consumption in smelters at full capacity
Sourcing platform for fully-owned smelters, Norway** Sourcing platform for JVs and Neuss smelter***
161
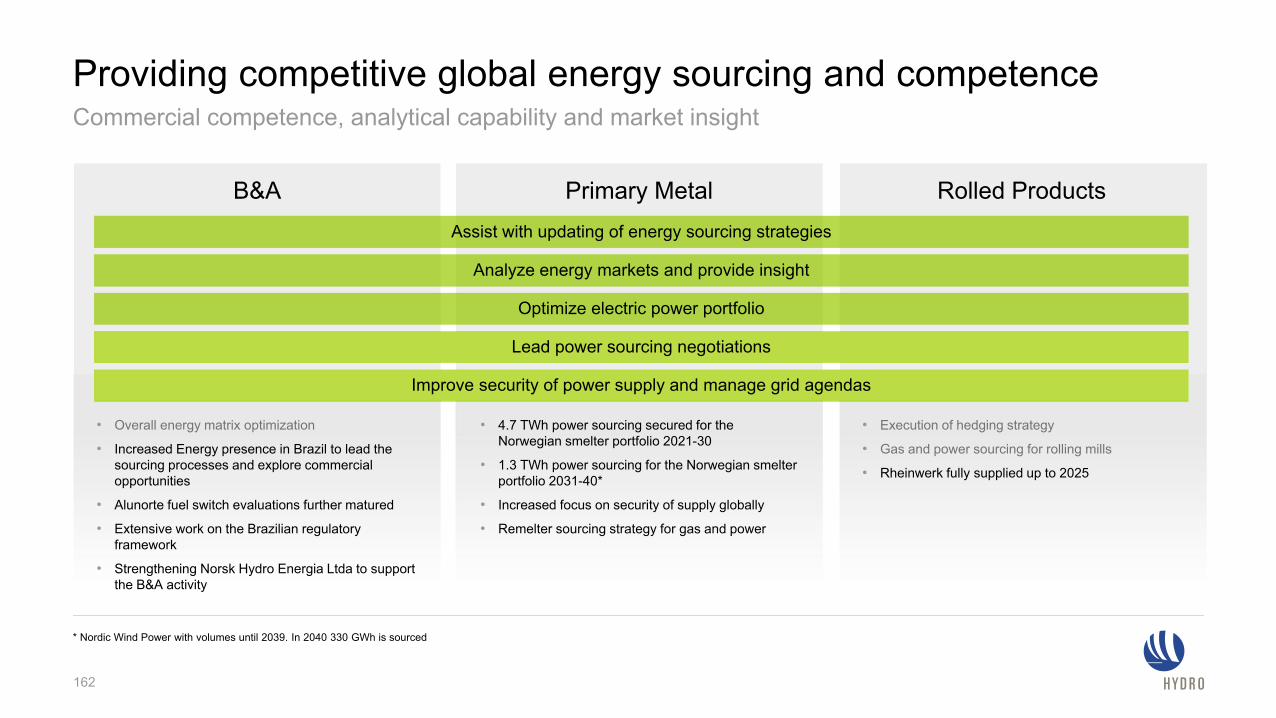
Providing competitive global energy sourcing and competence Commercial competence, analytical capability and market insight
* Nordic Wind Power with volumes until 2039. In 2040 330 GWh is sourced
• Execution of hedging strategy
• Gas and power sourcing for rolling mills
• Rheinwerk fully supplied up to 2025
• 4.7 TWh power sourcing secured for the Norwegian smelter portfolio 2021-30
• 1.3 TWh power sourcing for the Norwegian smelter portfolio 2031-40*
• Increased focus on security of supply globally
• Remelter sourcing strategy for gas and power
• Overall energy matrix optimization
• Increased Energy presence in Brazil to lead the sourcing processes and explore commercial opportunities
• Alunorte fuel switch evaluations further matured
• Extensive work on the Brazilian regulatory framework
• Strengthening Norsk Hydro Energia Ltda to support the B&A activity
Lead power sourcing negotiations
Assist with updating of energy sourcing strategies
Analyze energy markets and provide insight
B&A Primary Metal Rolled Products
Optimize electric power portfolio
Improve security of power supply and manage grid agendas
162

Timeframe
• Improve safety performance, strive for injury free environment • Robust industrial ownership for RSK – maintain physical power
offtake post 2022• Deliver additional production volumes through upgrades/sustaining
investments• Secure new competitive sourcing contracts in Norway post 20203
• Support competitive energy supply as well as energy policy and framework development for other business areas
TRI <23.0 TWh
~0,1 TWh
4-6 TWhProgress
20202022
2020
2020Continuous
Ambitions Target
Energy mid-term goalsCreating shareholder value by maximizing value of own hydropower assets and ensuring reliable and competitive energy supply for Hydro
1) Based on 2016 estimate unless stated otherwise2) YTD Oct-2016, own employees 3) The target of 4-6 TWh reflects the remaining sourcing need for the Norwegian smelters at Capital Markets Day 2015. Since then a sourcing contract of 1
TWh has been entered into. Prior to CMD2015 sourcing contracts of 3.7 TWh were signed for the period 2021-2030 reflecting a total sourcing need of 8-10 TWh, and an additional contract for 0.33 TWh/yr for 2031-2040
0 YTD2
In progress
~50%
1 TWhIn progress
StatusProgress1
Ambition on track and on target
Ambition behind plan, but on target
Ambition will not meet the target

Sustainability and climate agenda
164
0
2
4
6
8
10
12
14
16
18
20
Sout
h Af
rica
Indi
a
Uni
ted
Sta
tes
Chi
na
Aus
tralia
Bah
rain
UAE
Qat
ar
Sau
di A
rabi
a
Rus
sia
Mal
aysi
a
Braz
il
Can
ada
Nor
way
Icel
and
Direct Indirect
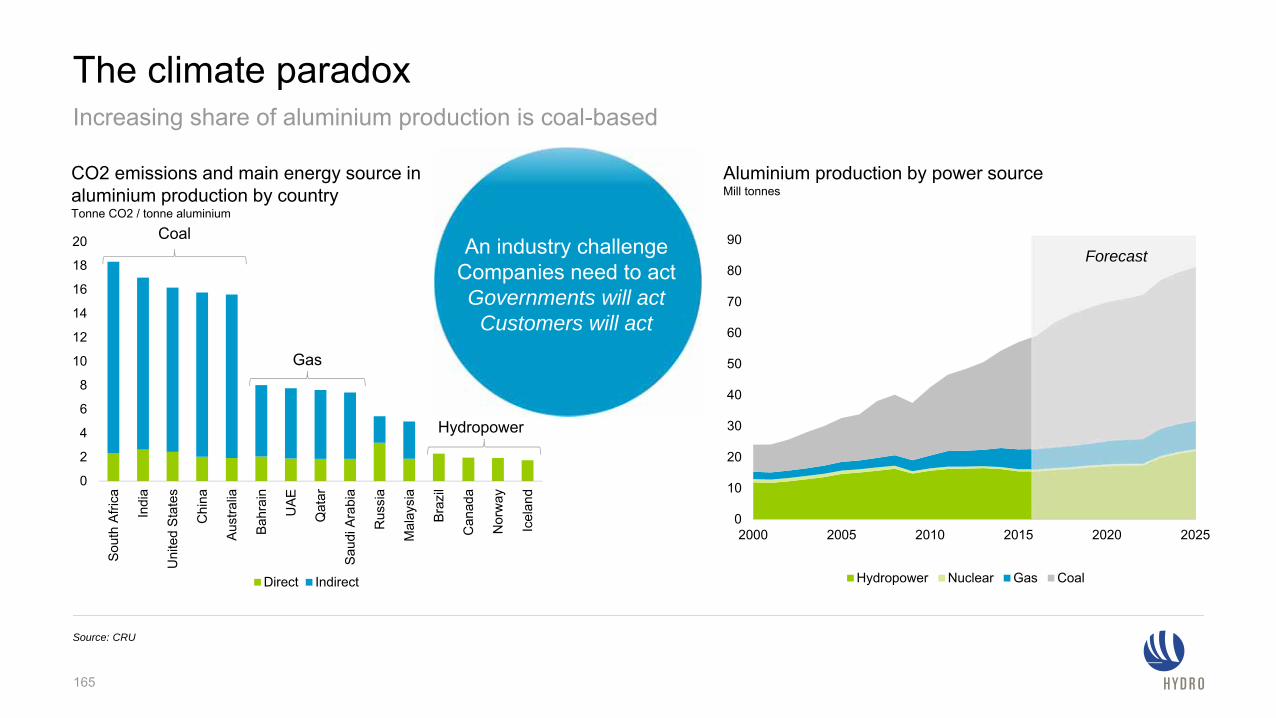
The climate paradox
Source: CRU
0
10
20
30
40
50
60
70
80
90
2000 2005 2010 2015 2020 2025
Hydropower Nuclear Gas Coal
An industry challengeCompanies need to actGovernments will act
Customers will act
Hydropower
Gas
Coal
Aluminium production by power sourceMill tonnes
CO2 emissions and main energy source in aluminium production by countryTonne CO2 / tonne aluminium
Forecast
165
Increasing share of aluminium production is coal-based
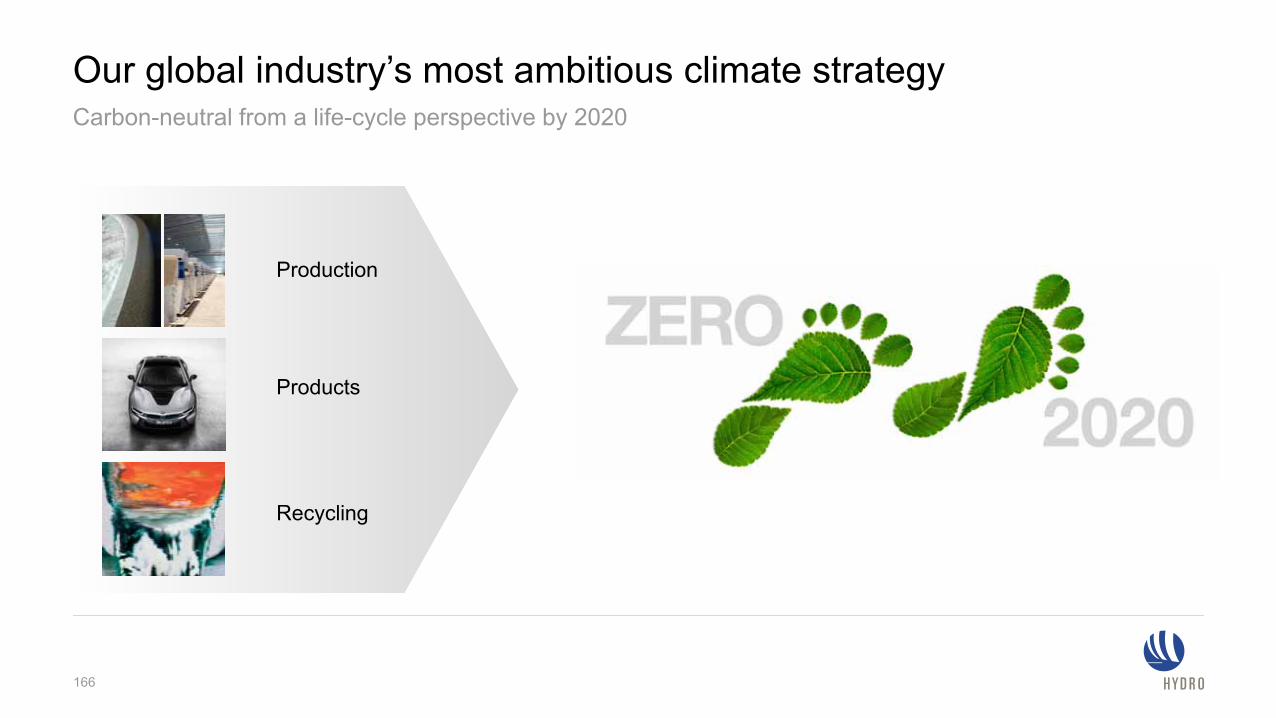
Our global industry’s most ambitious climate strategy
Production
Products
Recycling
166
Carbon-neutral from a life-cycle perspective by 2020
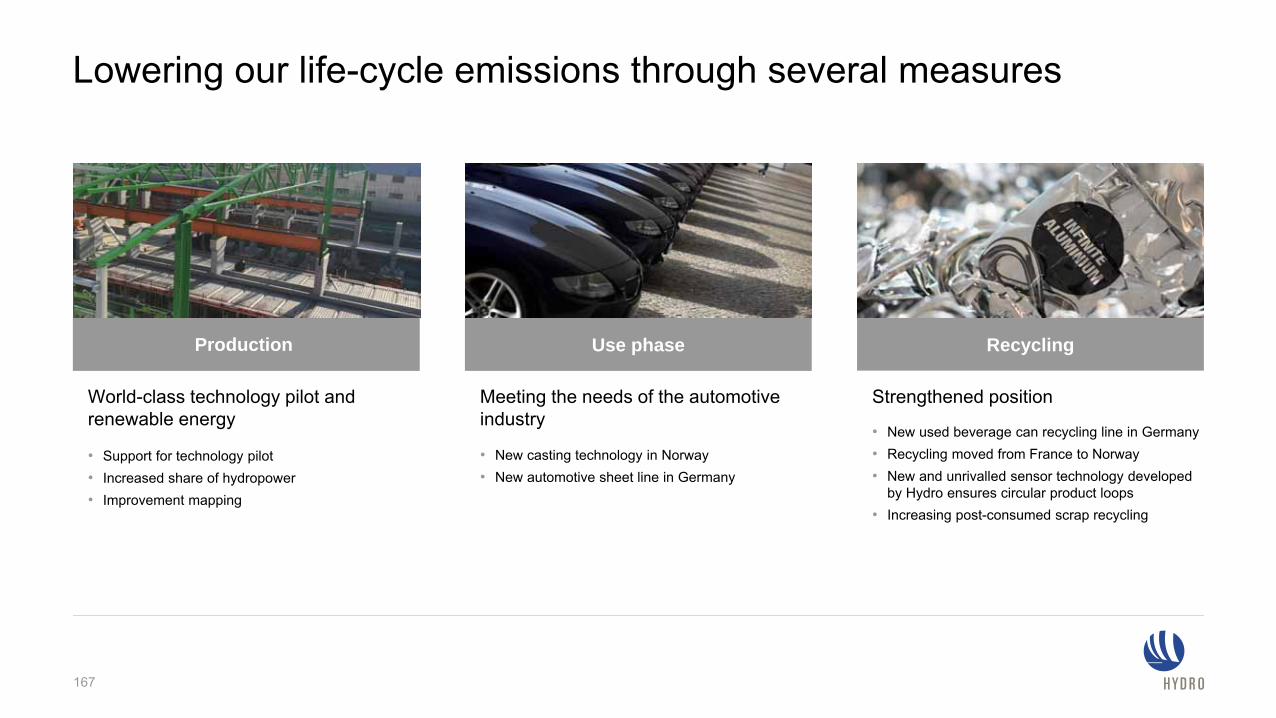
RecyclingUse phaseProduction
Lowering our life-cycle emissions through several measures
Meeting the needs of the automotive industry
• New casting technology in Norway• New automotive sheet line in Germany
World-class technology pilot and renewable energy
• Support for technology pilot• Increased share of hydropower• Improvement mapping
Strengthened position
• New used beverage can recycling line in Germany• Recycling moved from France to Norway • New and unrivalled sensor technology developed
by Hydro ensures circular product loops• Increasing post-consumed scrap recycling
167
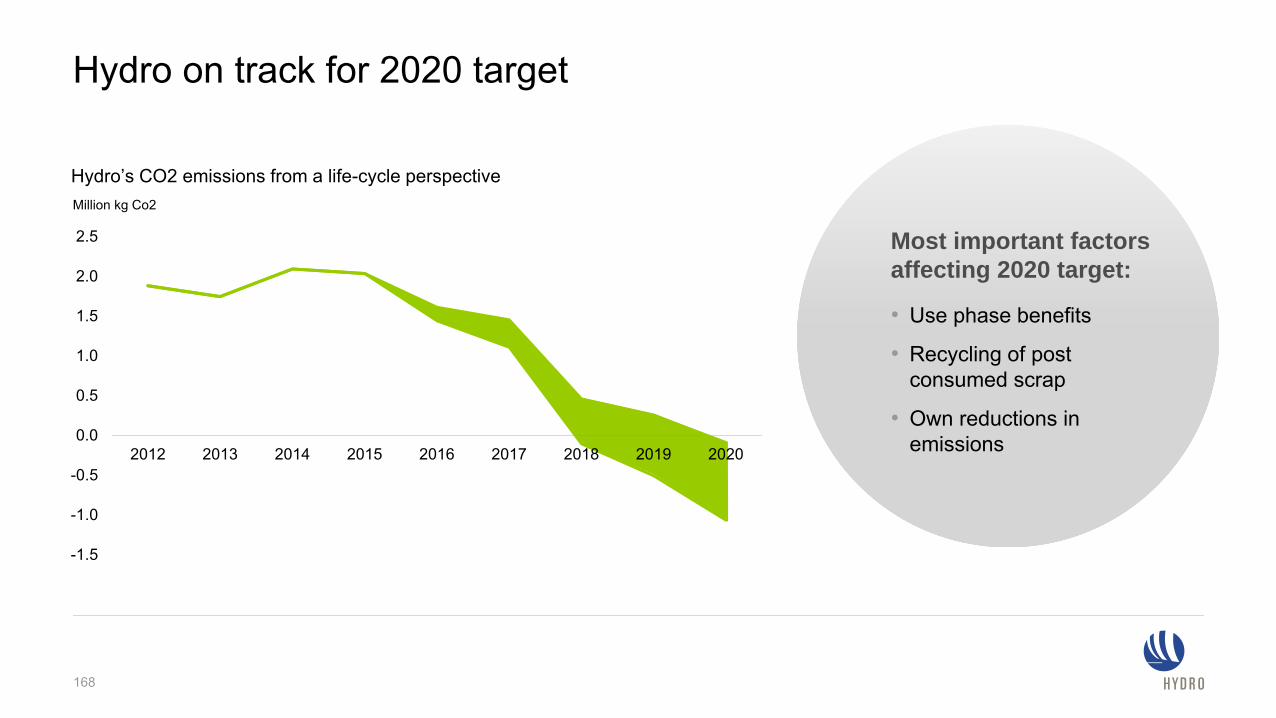
-1.5
-1.0
-0.5
0.0
0.5
1.0
1.5
2.0
2.5
2012 2013 2014 2015 2016 2017 2018 2019 2020
Hydro on track for 2020 target
Most important factors affecting 2020 target:
• Use phase benefits
• Recycling of post consumed scrap
• Own reductions in emissions
Million kg Co2
Hydro’s CO2 emissions from a life-cycle perspective
168
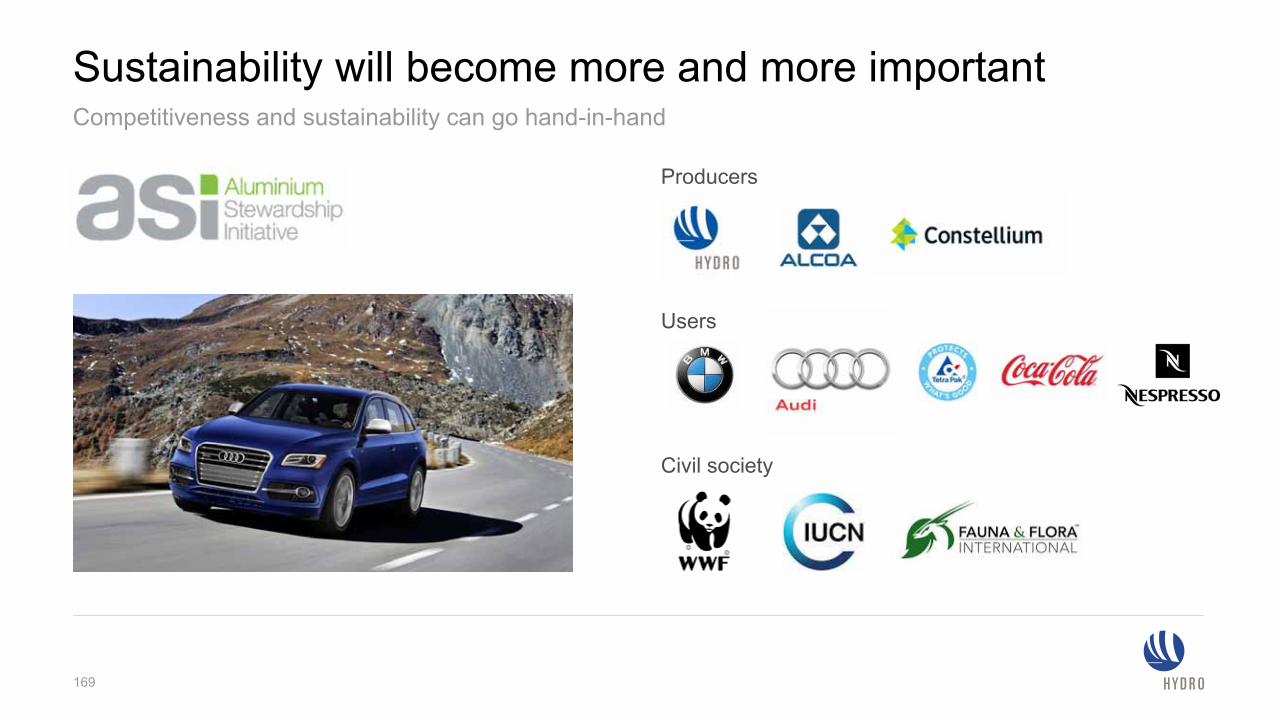
Sustainability will become more and more important
Producers
Users
Civil society
Competitiveness and sustainability can go hand-in-hand
169


