22
Energy policies and management of carbon balance in Estonia Olga Gavrilova, Tiina Randla, Raivo Vilu Tallinn University of Technology
| Date post: | 31-Dec-2015 |
| Category: |
Documents |
| Upload: | hadassah-floyd |
| View: | 17 times |
| Download: | 3 times |
Energy policies and management of carbon balance in Estonia
Olga Gavrilova, Tiina Randla, Raivo Vilu
Tallinn University of Technology

Climate change is one of the greatest concerns for the global community

Overheating of Earth is a real danger
The goal of UNFCCC is ‘stabilization of Greenhouse Gases concentrations in the atmosphere at the level that would prevent dangerous anthropogenic interference with the climate change’
The commitments of Kyoto protocol extend this to ‘achieving of emission limitation and reduction, and protection and enhancement of GHG sinks and reservoirs’

Estonia is an Annex B country of Kyoto Protocol, Estonia has an obligation to reduce CO2 emissions 8% by
2008-2012 in comparison with 1990
20 million tons of oil shale was extracted and used in
1990
10-12 million tons of oil shale has been extracted and used in
1994-2003
1 ton of CO2 is emitted per 1 ton of oil shale on burning
Estonian oil shale enterprises have the right to sell “hot air” for more than €60 million
The price of 1 ton of CO2 quota was yesterday €23

The resources for electricity generation, 2003
Oil Shale, 92.2%
Natural gas, 5.0%
Other, 2.2% Hydro, 0.1%Wind, 0.0%
Peat, 0.2%
Shale oil, 0.3%

Efficiency of electricity production from oil shale
5,068
35,373
0
5
10
15
20
25
30
35
40
Oil shale resource consumption Electricity consumption by end-users
TW
h
Efficiency of electricity generation
14%

Energy intensity of the economy, kgoe (kilogram of oil equivalent) per 1000 Euro (at constant prices, 1995=100)
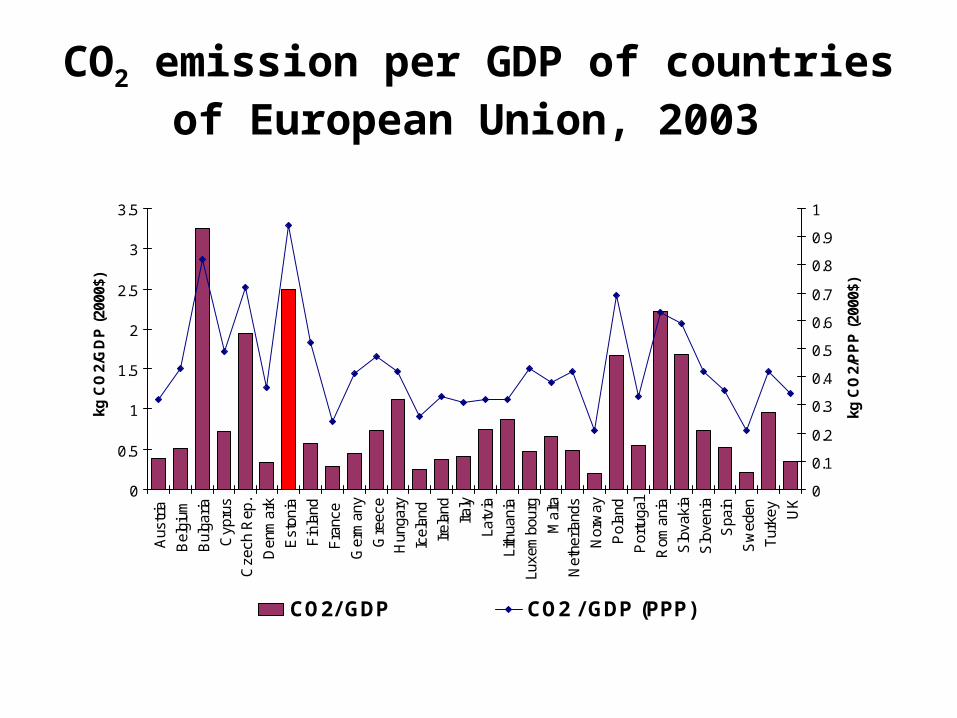
CO2 emission per GDP of countries of European Union, 2003
0
0.5
1
1.5
2
2.5
3
3.5
Aus
tria
Bel
gium
Bul
garia
Cyp
rus
Cze
ch R
ep.
Den
mar
k
Est
onia
Fin
land
Fra
nce
Ger
man
y
Gre
ece
Hun
gary
Icel
and
Irel
and
Italy
Latv
ia
Lith
uani
a
Luxe
mbo
urg
Mal
ta
Net
herla
nds
Nor
way
Pol
and
Por
tuga
l
Rom
ania
Slo
vaki
a
Slo
veni
a
Spa
in
Sw
eden
Tur
key
UK
kg C
O2/
GD
P (
2000
$)
0
0.1
0.2
0.3
0.4
0.5
0.6
0.7
0.8
0.9
1
kg C
O2/
PP
P (
2000
$)
CO2/ GDP CO2 / GDP (PPP)
However, oil shale industry in Estonia is thriving currently
Especially after the price of oil barrel exceeded
$50Estonia is the only offshore territory for oil
shale industry in the world
In this economical and political conditions we are discussing
(oil shale) energy policies…
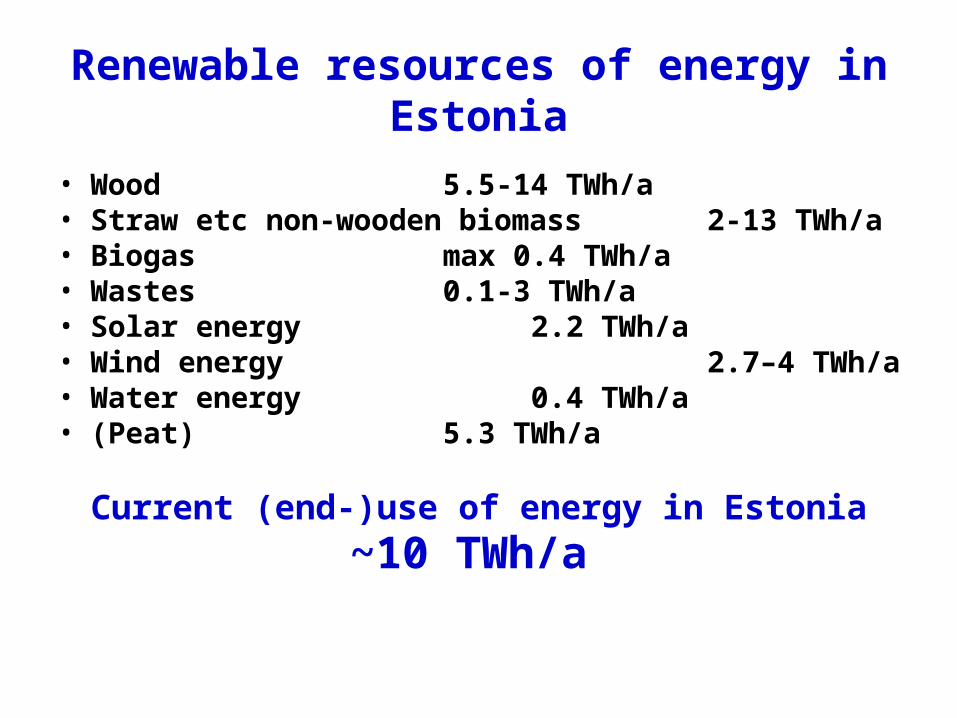
Renewable resources of energy in Estonia
• Wood 5.5-14 TWh/a• Straw etc non-wooden biomass 2-13 TWh/a• Biogas max 0.4 TWh/a• Wastes 0.1-3 TWh/a• Solar energy 2.2 TWh/a • Wind energy 2.7–4 TWh/a • Water energy 0.4 TWh/a• (Peat) 5.3 TWh/a
Current (end-)use of energy in Estonia
~10 TWh/a

Future of energy sector in Estonia will depend on the EU and global post-Kyoto policies
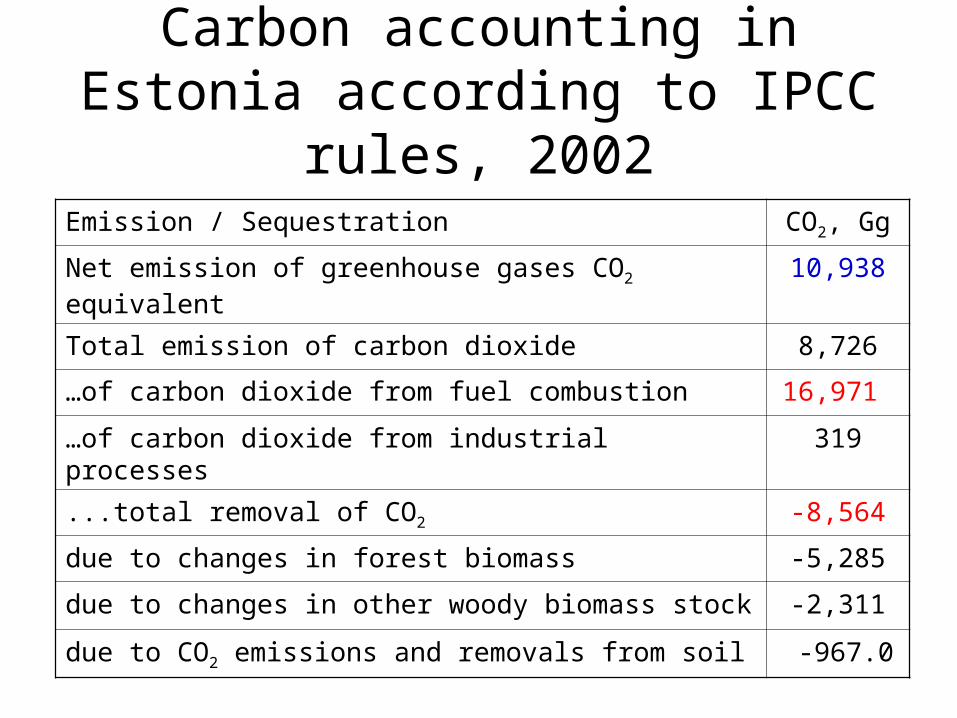
Carbon accounting in Estonia according to IPCC rules, 2002
Emission / Sequestration CO2, Gg
Net emission of greenhouse gases CO2 equivalent 10,938
Total emission of carbon dioxide 8,726
…of carbon dioxide from fuel combustion 16,971
…of carbon dioxide from industrial processes 319
...total removal of CO2 -8,564
due to changes in forest biomass -5,285
due to changes in other woody biomass stock -2,311
due to CO2 emissions and removals from soil -967.0
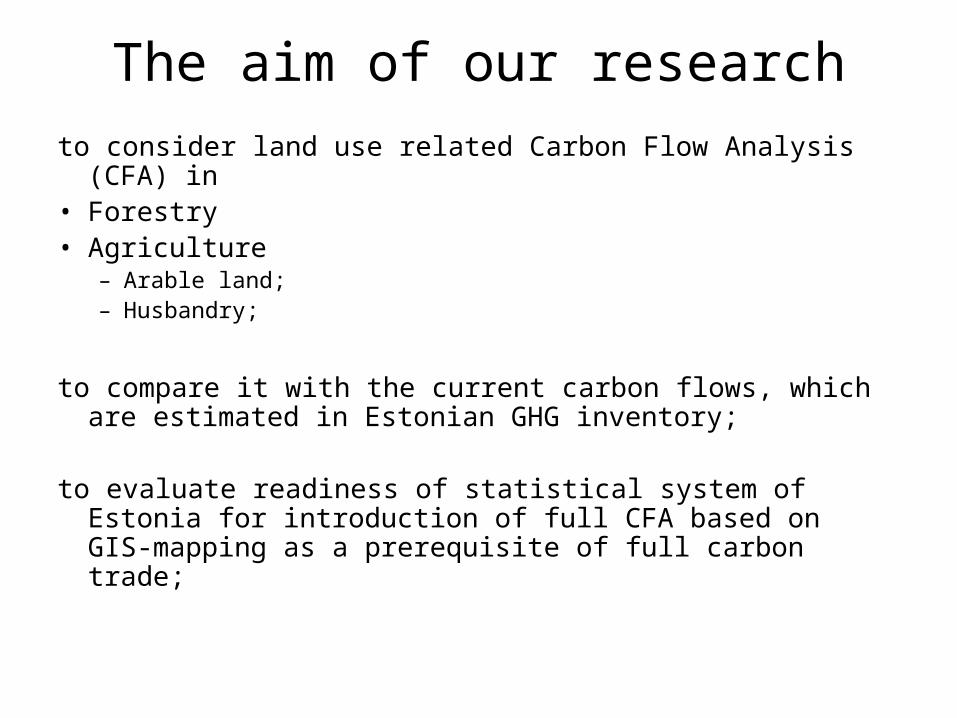
The aim of our research
to consider land use related Carbon Flow Analysis (CFA) in • Forestry• Agriculture
– Arable land;– Husbandry;
to compare it with the current carbon flows, which are estimated in Estonian GHG inventory;
to evaluate readiness of statistical system of Estonia for introduction of full CFA based on GIS-mapping as a prerequisite of full carbon trade;
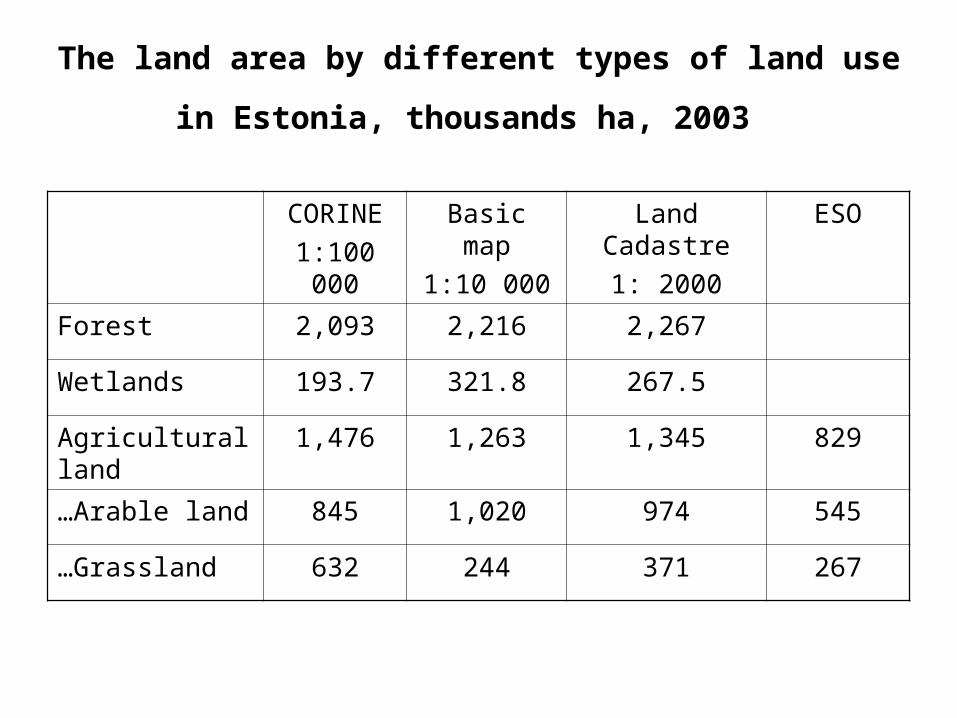
The land area by different types of land use in Estonia,
thousands ha, 2003
CORINE
1:100 000
Basic map
1:10 000
Land Cadastre
1: 2000
ESO
Forest 2,093 2,216 2,267
Wetlands 193.7 321.8 267.5
Agricultural land 1,476 1,263 1,345 829
…Arable land 845 1,020 974 545
…Grassland 632 244 371 267
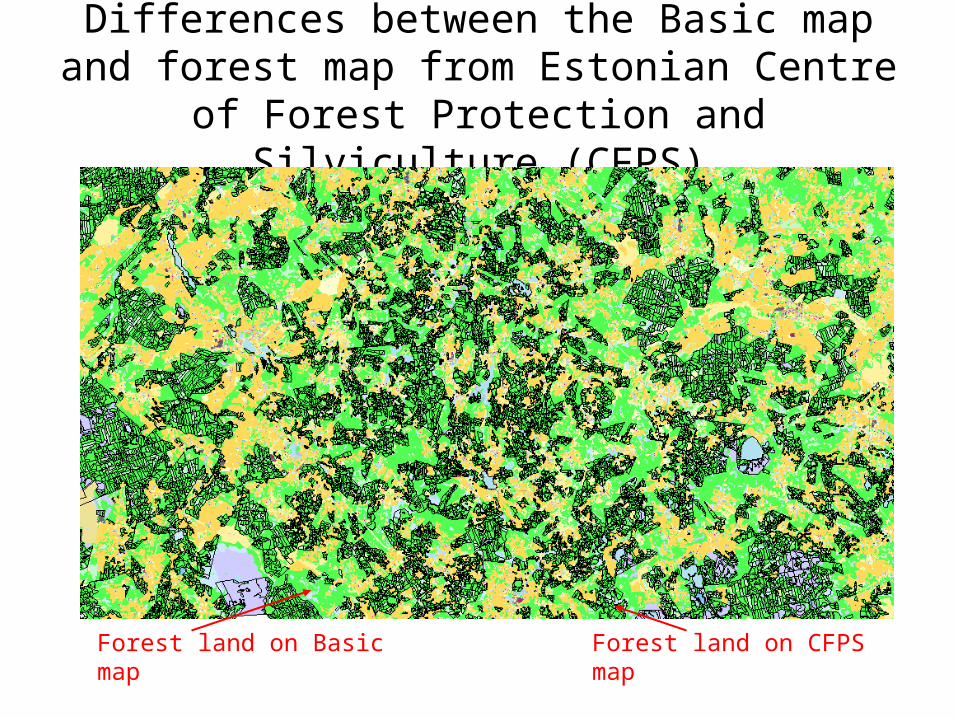
Differences between the Basic map and forest map from Estonian Centre of Forest Protection
and Silviculture (CFPS)
Forest land on Basic map Forest land on CFPS map
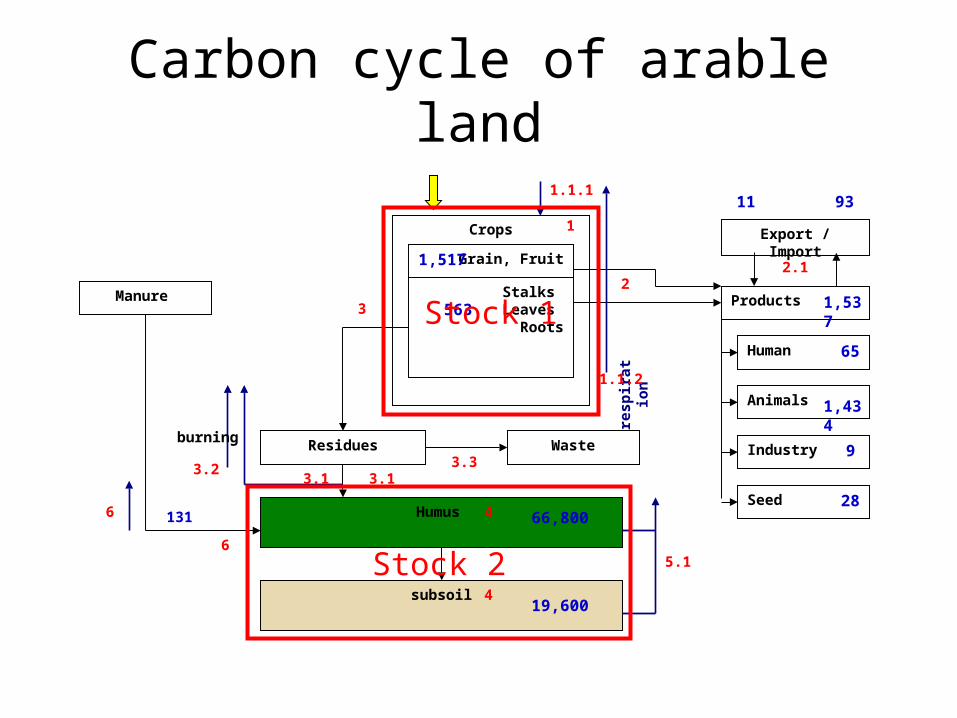
Carbon cycle of arable land
Crops
Grain, Fruit
Stalks Leaves
Roots
Products
Residues
Animals
Humus
subsoil
Human
Industry
Manure
Wasteburning
resp
irat
ion
Export / Import1
1.1.1
1.1.2
2.1
3
3.2 3.3
6
5.1
4
4
6
3.13.1
2
1,517
563
131 66,800
19,600
Seed
1,434
65
9311
9
28
1,537Stock 1
Stock 2
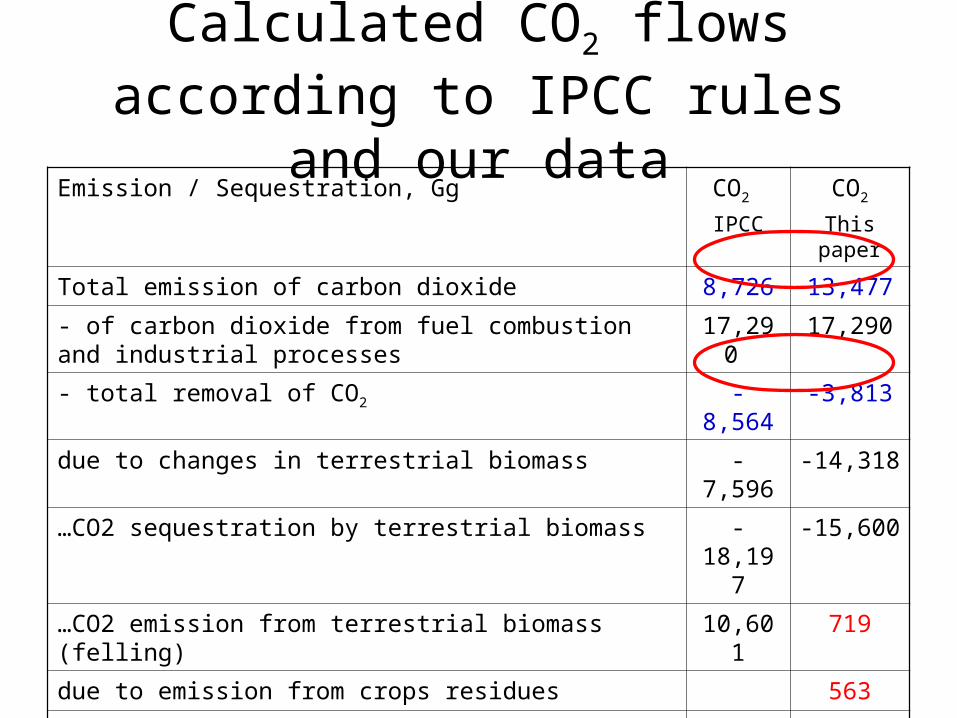
Calculated CO2 flows according to IPCC rules and our data
Emission / Sequestration, Gg CO2
IPCC
CO2
This paper
Total emission of carbon dioxide 8,726 13,477
- of carbon dioxide from fuel combustion and industrial processes
17,290 17,290
- total removal of CO2 -8,564 -3,813
due to changes in terrestrial biomass -7,596 -14,318
…CO2 sequestration by terrestrial biomass -18,197 -15,600
…CO2 emission from terrestrial biomass (felling) 10,601 719
due to emission from crops residues 563
due to CO2 emission and removals from wetlands -396 10,505
due to CO2 emissions and removals from soil -571 ?
A proposal: start CO2 trade also inside the countries and include beside CO2 emission
also CO2 sequestration
This will give a new perspective to the agriculture
Both, forest and arable land could sequester more than 2 tons of carbon
per ha per year

Carbon accounting and economicsForest land
1500
1700
1900
2100
2300
1973
1978
1983
1988
1991
1992
1993
1994
1995
1996
1997
1999
2000
2001
2002
2003
1000
ha
Arable land
400
600
800
1000
1200
1980
1990
1992
1994
1996
1998
2000
2002
1000
ha
The change of forest and arable lands in Estonia during the last 30 years
What decisions were behind of these land use changes (annual increase of CO2
sequestration by about 5.4 Gg): economical or (and) ecological?
If carbon has monetary value, every decision about land use change
should be taken balancing economical (ecological services,
including carbon sequestration) and ecological (biodiversity)
accounts
Carbon Flows Accounting and Economical Mechanisms should
function simultaneously • for the control and optimization of the
processes leading to local and global ‘enhancement (of) GHG sinks and reservoirs’ and
• use of renewable resources (biomass, wastes etc.)


