Energy Policies of IEA Countries 2011Review Please note that this PDF is subject to specific restrictions that limit its use and distribution. The terms and conditions are available online at www.iea.org/about/copyright.asp Greece
Transcript
Energy Policies of IEA Countries
2011 Review
Please note that this PDF is subject to specific restrictions that limit its
use and distribution. The terms and conditions are available online at
www.iea.org/about/copyright.asp
Greece
GreeceEnergy Policies of IEA Countries
-:HSTCQE=U^Y\YV:(61 2011 03 1P1)
978-92-64-09474-1 €75
Energy policy in Greece could make a significant contribution to the country’s economic recovery. Increasing competition and reducing
the role of the state in the energy sector should add efficiency and dynamism to the Greek economy. This, in turn, should help generate
self-sustained employment and prosperity for the country.
Reforming the electricity and gas markets is an economic and political imperative. In particular, regulatory authorities must be given the necessary power and independence to reduce the market power of dominant firms.
Commendably, Greece adopted a law to this end in August 2011. The envisaged reforms are fundamentally sound and can help
the economy grow. The government’s key focus should now be on implementing this law in full without delay.
Greece has a large potential for wind and solar energy and is rightly determined to fulfill this potential. The renewable energy sector also
provides opportunities for new industrial development, in particular if linked with R&D activities. To facilitate renewable energy projects, the government
recently improved investment conditions significantly by increasing feed-in tariffs, shortening and simplifying the licensing procedures and introducing
stronger incentives for local acceptance.
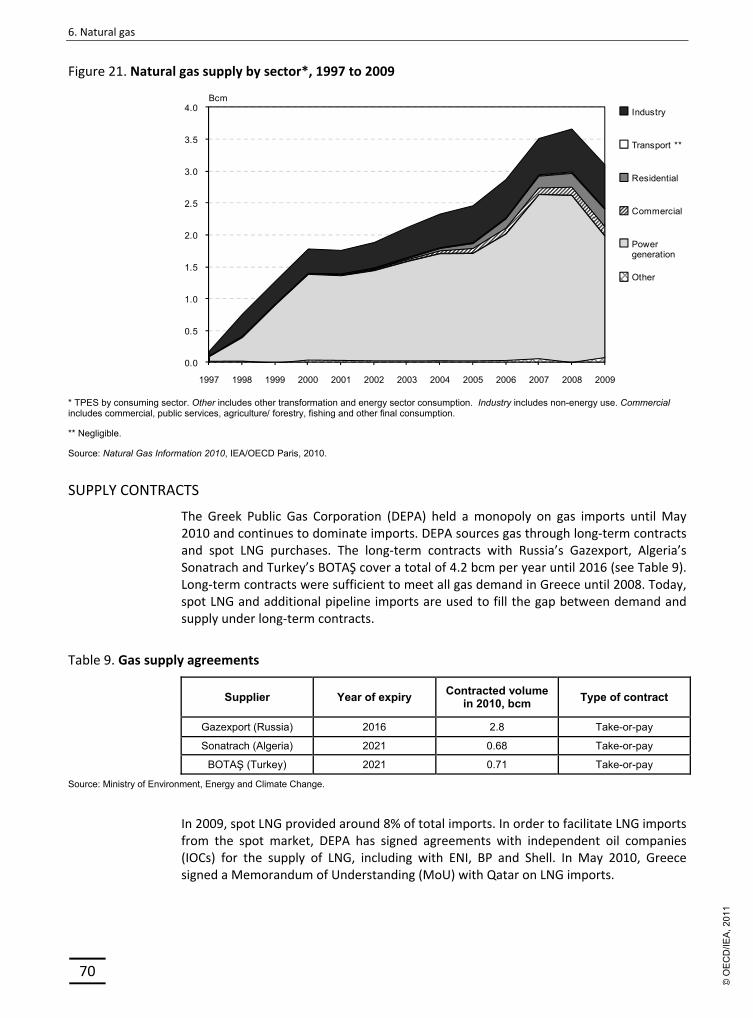
Greece’s oil and gas sources are already well diversified. Gas use is projected to increase, as the country moves to decarbonise its coal-dominated power
sector. Experience from IEA member countries has shown that enhancing energy efficiency can help improve energy security in a cost-effective way.
This, in turn, can help mitigate climate change and deliver economic benefits.
Energy Policies of IEA Countries
2011 Review
Greece
INTERNATIONAL ENERGY AGENCY
The International Energy Agency (IEA), an autonomous agency, was established in November 1974. Its primary mandate was – and is – two-fold: to promote energy security amongst its member
countries through collective response to physical disruptions in oil supply, and provide authoritative research and analysis on ways to ensure reliable, affordable and clean energy for its 28 member countries and beyond. The IEA carries out a comprehensive programme of energy co-operation among its member countries, each of which is obliged to hold oil stocks equivalent to 90 days of its net imports. The Agency’s aims include the following objectives:
n Secure member countries’ access to reliable and ample supplies of all forms of energy; in particular, through maintaining effective emergency response capabilities in case of oil supply disruptions.
n Promote sustainable energy policies that spur economic growth and environmental protection in a global context – particularly in terms of reducing greenhouse-gas emissions that contribute to climate change.
n Improve transparency of international markets through collection and analysis of energy data.
n Support global collaboration on energy technology to secure future energy supplies and mitigate their environmental impact, including through improved energy
efficiency and development and deployment of low-carbon technologies.
n Find solutions to global energy challenges through engagement and dialogue with non-member countries, industry, international
organisations and other stakeholders. IEA member countries:
Australia Austria
Belgium Canada
Czech RepublicDenmark
FinlandFrance
GermanyGreece
HungaryIreland
ItalyJapan
Korea (Republic of)LuxembourgNetherlandsNew Zealand NorwayPolandPortugalSlovak RepublicSpainSwedenSwitzerlandTurkeyUnited Kingdom
United States
The European Commission also participates in
the work of the IEA.
Please note that this publication is subject to specific restrictions that limit its use and distribution.
The terms and conditions are available online at www.iea.org/about/copyright.asp
Overview .................................................................................................................................... 27 CO2 emissions from fuel combustion ......................................................................................... 28 Institutions ................................................................................................................................. 31 Policies and measures ................................................................................................................ 31 Critique ....................................................................................................................................... 34 Recommendations ..................................................................................................................... 35
4. ENERGY EFFICIENCY ............................................................................................................................... 37
Final consumption of energy ..................................................................................................... 37 Institutional framework ............................................................................................................. 39 Policies and measures ................................................................................................................ 40 Critique ....................................................................................................................................... 48 Recommendations ..................................................................................................................... 52
PART II SECTOR ANALYSIS .....................................................................................................53
Market structure ........................................................................................................................ 60 Prices and taxes ......................................................................................................................... 61 Security of supply ....................................................................................................................... 63 Critique ....................................................................................................................................... 66 Recommendations ..................................................................................................................... 67
6. NATURAL GAS ........................................................................................................................................ 69
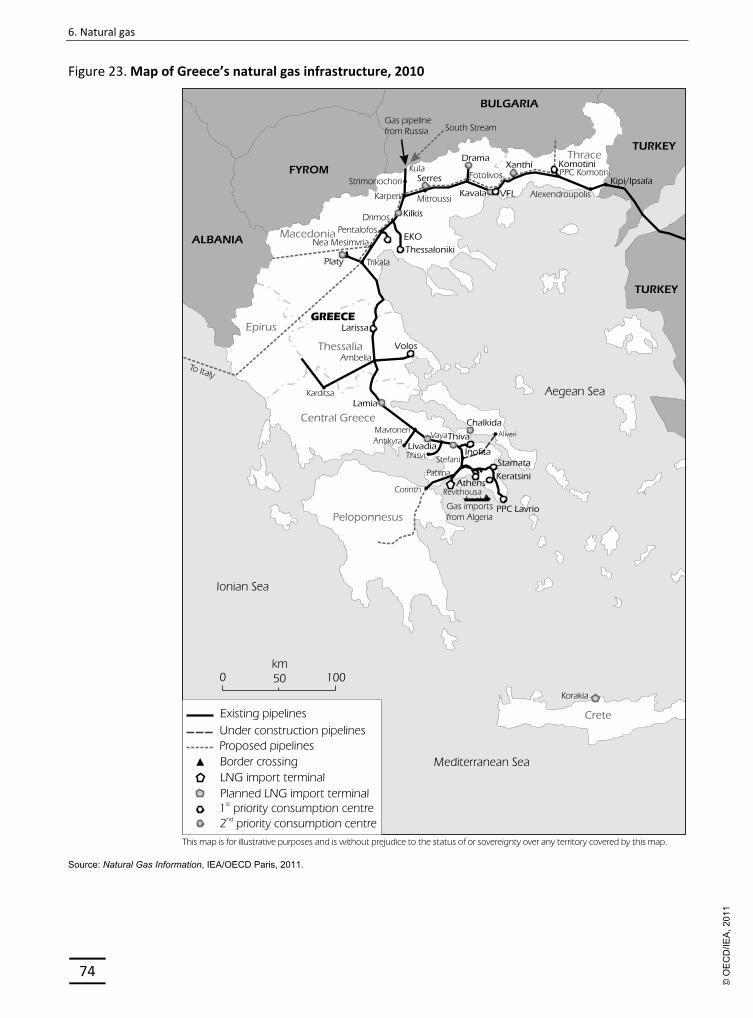
Supply and demand ................................................................................................................... 69 Market reform ........................................................................................................................... 71 Industry structure ...................................................................................................................... 72 Infrastructure ............................................................................................................................. 73 Prices and tariffs ........................................................................................................................ 77 Security of supply ....................................................................................................................... 78 Critique ....................................................................................................................................... 79 Recommendations ..................................................................................................................... 81
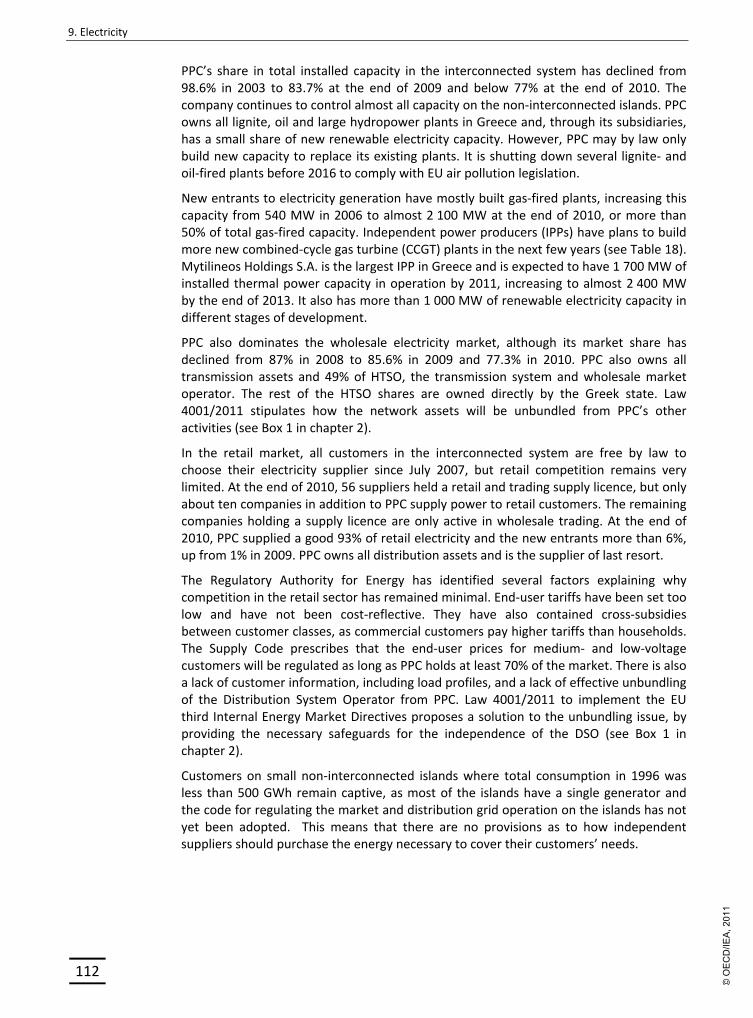
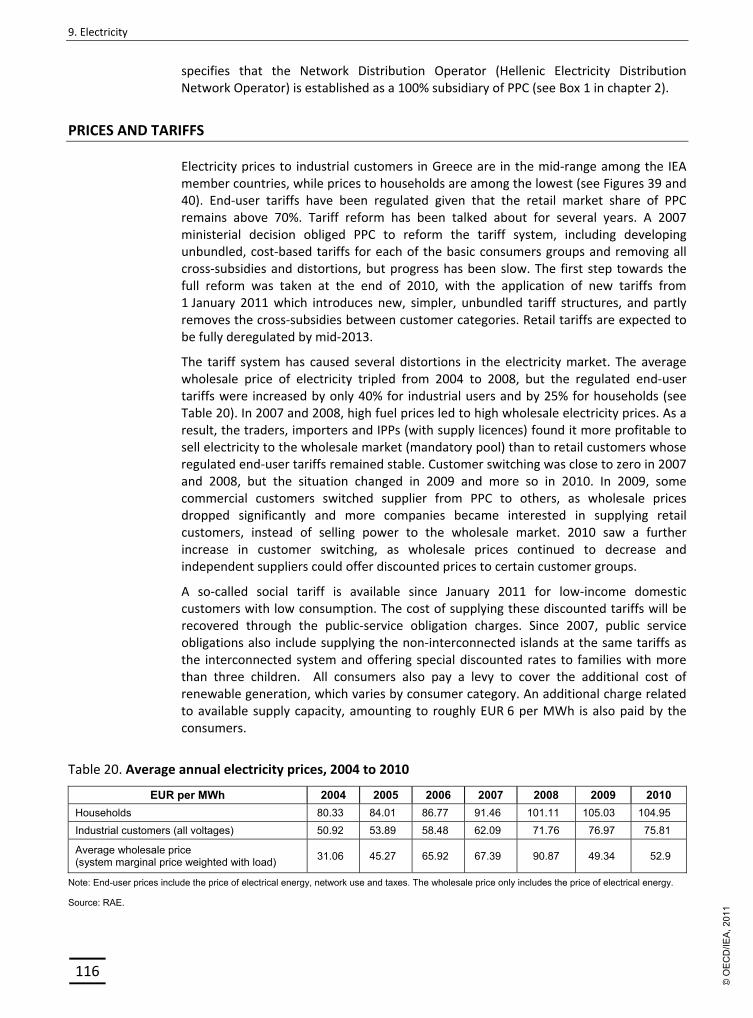
Supply and demand .................................................................................................................105 Regulatory framework and market design ..............................................................................109 Industry structure ....................................................................................................................111 Transmission and distribution ..................................................................................................114 Prices and tariffs ......................................................................................................................116 Critique .....................................................................................................................................118 Recommendations ...................................................................................................................121
PART III ENERGY TECHNOLOGY ........................................................................................... 123
10. ENERGY RESEARCH, DEVELOPMENT AND DEMONSTRATION ..........................................................125
Institutions ...............................................................................................................................127 Funding ....................................................................................................................................128 Public‐private partnerships ......................................................................................................129 International collaboration and selected projects ...................................................................130 Critique .....................................................................................................................................131 Recommendations ...................................................................................................................132
PART IV ANNEXES ............................................................................................................... 133
ANNEX A: Organisation of the review .....................................................................................................135 ANNEX B: Energy balances and key statistical data ...............................................................................139 ANNEX C: International Energy Agency “Shared Goals” .........................................................................145 ANNEX D: Glossary and list of abbreviations ..........................................................................................147
List of figures, tables and boxes
FIGURES
1. Map of Greece ....................................................................................................................... 16 2. Total primary energy supply, 1973 to 2010 ........................................................................... 18 3. Energy production by source, 1973 to 2010 .......................................................................... 19 4. Breakdown of total primary energy supply in IEA member countries, 2010......................... 19 5. Total final consumption by source, 1973 to 2009 ................................................................. 20 6. Energy‐related CO2 emissions per TPES in OECD member countries, 2009 .......................... 29 7. CO2 emissions by sector, 1973 to 2009 .................................................................................. 30 8. CO2 emissions by fuel, 1973 to 2009 ...................................................................................... 30 9. Total final consumption by sector, 1973 to 2009 .................................................................. 37 10. Total final consumption by sector and by source, 1973 to 2009 ......................................... 38 11. Energy intensity in Greece and other selected IEA member countries, 1973 to 2010 ........ 39 12. Oil consumption by product, 1996 to 2010 ......................................................................... 56 13. Oil consumption by sector, 1973 to 2009 ............................................................................ 57 14. Map of Greece’s oil infrastructure, 2010 ............................................................................. 59 15. Breakdown of retail oil sales by company, 2009 ................................................................. 61 16. IEA unleaded gasoline prices and taxes, second quarter 2011............................................ 61 17. IEA automotive diesel prices and taxes, second quarter 2011 ............................................ 62 18. IEA light fuel oil prices and taxes for households, second quarter 2011 ............................. 62 19. Average gasoline and diesel prices and taxes in Greece, 1999 to 2010 .............................. 63 20. Greece’s oil stocks and compliance with the IEA 90‐day obligation, March 2001 to March 2011 ..................................................................................................................... 65 21. Natural gas supply by sector, 1997 to 2009 ......................................................................... 70 22. DEPA group structure ........................................................................................................... 73 23. Map of Greece’s natural gas infrastructure, 2010 ............................................................... 74 24. Natural gas prices in IEA member countries, 2010 .............................................................. 77 25. Coal supply by sector, 1973 to 2009 .................................................................................... 84 26. Location of existing and proposed coal‐fired power plants, 2010 ...................................... 85
27. Renewable energy as a percentage of total primary energy supply, 1973 to 2010 ............ 90 28. Renewable energy as a percentage of total primary energy supply in IEA member countries, 2010 .................................................................................................................... 90 29. Electricity generation from renewable energy as a percentage of all generation in IEA member countries, 2010 ..................................................................................................... 91 30. Wind speed map of Greece.................................................................................................. 99 31. Electricity imports and exports, 1998 to 2009 ...................................................................106 32. Electricity generation by source, 1973 to 2010 .................................................................106 33. Electricity consumption by sector, 1973 to 2009 ..............................................................107 34. Monthly peak electricity demand, 2006 to 2009 ...............................................................108 35. Net electricity generating capacity, 1975 to 2009 .............................................................109 36. Design of the wholesale electricity market ........................................................................111 37. Structure of the Greek electricity market, 2010 ................................................................113 38. Greek transmission network, 2010 ....................................................................................114 39. Electricity prices in Greece and in other selected IEA member countries, 2000 to 2010 .117 40. Electricity prices in IEA member countries, 2010 ..............................................................118 41. Government spending on energy RD&D, 2005 to 2011 ....................................................129
TABLES
1. Privatisation of state‐controlled energy companies .............................................................. 24 2. Greenhouse gas emissions in Greece, 1990 to 2009 ............................................................. 28 3. Reductions in GHG emissions from implemented and adopted policies and measures ....... 32 4. Reductions in GHG emissions from planned policies and measures ..................................... 32 5. Allocation of allowances in the National Allocation Plan 2008–2012 by sector ................... 33 6. Modal split of passenger land transport, 2008 ...................................................................... 43 7. Oil refineries in Greece, 2010 ................................................................................................ 58 8. Legal basis for oil security measures in Greece ..................................................................... 64 9. Gas supply agreements .......................................................................................................... 70 10. Lignite production in Greece, 1980 to 2010 ........................................................................ 84 11. Coal‐fired power plants in Greece, 2010 ............................................................................. 86 12. Main projections for 2010‐2020 in the National Renewable Energy Action Plan by scenario ........................................................................................................................... 93 13. Electricity from renewable sources, 2005 to 2020 .............................................................. 95 14. Feed‐in tariffs valid since June 2010 .................................................................................... 96 15. Feed‐in tariffs for photovoltaics from 2009 to 2020 ........................................................... 97 16. Installed electricity generating capacity in the interconnected system, 31 December 2009 .............................................................................................................108 17. Combined installed electricity generating capacity in the interconnected and autonomous systems, 31 December 2009 ........................................................................109 18. Licensed new investments in thermal power plant units, 2009 ........................................113 19. Net transfer capacities between Greece and its neighbours, winter 2010‐2011 ..............115 20. Average annual electricity prices, 2004 to 2010 ................................................................116
1. Law 4001/2011 to implement the third Electricity and Natural Gas Market Directives ……..22 2. IEA 25 energy efficiency recommendations …………………………………….…….………………………….50 3. Final energy consumption: differences between IEA and EU methodologies …………………….94 4. Key recommendations of the IEA Wind Energy Roadmap ………………………………..…………..…102
Energy policy in Greece has the potential to make a significant contribution to the country’s economic recovery. Increasing competition and reducing the role of the State in the energy sector should add efficiency and dynamism to the Greek economy. This, in turn, should generate self‐sustained employment and prosperity for the country.
Among the key pieces of legislation that the EU member states have adopted in recent years are the third Internal Energy Market Directives which oblige the member states to further liberalise their electricity and natural gas markets. The 2020 renewable energy target, the Emissions Trading System (EU‐ETS) and the EU air quality standards in turn are pushing Greece to decarbonise its lignite‐dominated electricity sector.
The IEA urged Greece to reform its energy sector already in the 2006 Energy Policy Review. The completion of these reforms is now even more necessary than at the time. Reform in the electricity, natural gas and coal sectors is also a condition for the crucial financial assistance from the eurozone countries and the International Monetary Fund. These conditions go only to some extent beyond what is already required under the adopted EU directives and the decisions by the European Commission, mainly in the area of privatisation and unbundling of the System Operators in both gas and electricity from the verticai integrated companies. Accordingly, Greece has decided to partly privatise state‐controlled energy companies, including the dominant Public Power Corporation (PPC) and Public Gas Corporation (DEPA).
It is important to note that, regardless of the economic situation in Greece, these reforms are fundamentally sound energy and economic policy and contribute to the country’s long‐term development. It is therefore very welcome that the Greek Parliament has in August 2011 adopted a law to this end. The new law (4001/2011) transposes into national legislation the third Internal Energy Market directives. Among others, it stipulates the unbundling of the system operators and enhances the role of the independent regulator regarding security of supply, licensing, monitoring of the market and consumer protection. Overall, the new law improves the legislative framework for the monitoring, control and regulation of electricity and gas sectors. Now that the law has been adopted, the IEA urges Greece to implement it in full without delay.
ELECTRICITY MARKET REFORM
Further reform in electricity market structures and regulations is needed if Greece wishes to reach its ambitious energy goals, including those on renewable energy. Although competition is finally emerging, PPC dominated more than 75% of the wholesale market and more than 90% of the retail market in 2010. The company also remains the owner of transmission and distribution assets and has a 49% stake in HTSO,
the operator of the transmission system and wholesale market. Meeting the obligations under the third EU Electricity Market Directive will improve this situation. In particular, the Regulatory Authority for Energy (RAE) has lacked full independence and sufficient powers to execute effectively. Another area where reform is urgently needed is moving to cost‐reflective end‐user tariffs.
A strong and independent regulator is needed to mitigate PPC’s dominance, ensure non‐discriminatory treatment for independent power producers (IPPs) and provide regulatory certainty for investors in a competitive energy market. Investments and competition are needed for ensuring the financial efficiency of the electricity sector. Investments by IPPs in both renewable and flexible conventional generation will be necessary in the transformation to a low‐carbon, green electricity market. Competition can also drive prices down and help mitigate the costs of necessary network investments and renewable energy supports.
The regulator should also be tasked with stronger supervision of the wholesale market. This is particularly important in the Greek context of a mandatory pool with a highly concentrated supply situation and regulated end‐user tariffs that do not necessarily reflect all supplier costs. As the sole owner of lignite plants and large hydro plants which generate cheap electricity, PPC has significant capacity that can be put first in the merit order and therefore has the potential to affect wholesale prices. At the same time, the company is obliged to sell electricity to end‐users at regulated tariffs that often do not reflect costs. Greece should move to fully cost‐reflective retail tariffs and eliminate cross‐subsidies.
To limit PPC’s dominance in the electricity market, the government should consider divesting a reasonable percentage of PPC’s power generating capacity. It could also move the network assets of PPC into separate companies and later privatise them. This would be better for electricity market development than simply reducing government ownership in PPC.
NATURAL GAS MARKET REFORM
Natural gas is emerging as the fuel of choice for power generation, both to replace lignite and to support the expected large increases in variable generation from renewable sources. As the electricity sector, the natural gas sector has traditionally been state‐controlled, but after a slow start, market reform is now gaining pace. Since April 2010, independent suppliers and large customers willing to be self‐supplied may import gas to the country. The reforms are yet to make their full mark on the gas sector, but it is encouraging that more than a dozen new players had entered the Greek gas market by the end of May 2011. The IEA congratulates the government for this reform as a necessary step in effective market liberalisation. Ensuring access to the network and the liquefied natural gas (LNG) terminal is crucial for effective competition to emerge.
Although the State remains in control of most of the gas supply through DEPA and the gas transmission infrastructure through DESFA, the TSO, new entrants can be expected to gradually reduce this dominance and bring multiple benefits to the economy and the citizens. Therefore, the government should review the role of DEPA as the majority‐owner of current and future distribution companies (EPAs), as it is unclear what net benefit DEPA’s dominance brings to the customers. Again, there is scope to reduce DEPA´s role in the market by taking some of the same measures as in the electricity sector.
Greece imports practically all the oil and gas it needs, and security of supply is one of the key objectives of the Greek energy policy. In the case of natural gas, the supply sources are already diversified, as Russian gas is imported through the Greek‐Bulgarian entry point, while the Greek‐Turkish entry point allows Greece to import gas from the Middle East and the Caspian region. Greece also receives LNG, mostly from Algeria on long‐term contracts as well as additional volumes from the spot market. During the January 2009 Russia‐Ukraine gas supply crisis, the gas system showed better resilience than in other countries in the region, but experience has shown that in a gas crisis, the two border entry points to Greece may become simultaneously unavailable.
Entry capacity to the Greek gas system seems sufficient to accommodate the projected growth in demand to 2020, but the growing peak demand may pose challenges. Greece’s efforts to further diversify import routes and sources, while expanding LNG import capacities, are therefore to be commended.
Turning to oil security, Greece deserves credit for diversifying its sources of crude oil and oil products and for taking measures to increase its indigenous oil production. Greece has also been compliant with the IEA 90‐day stockholding obligation since the end of 2004.
The draft Joint Ministerial Decision on the National Emergency Plan outlines the response measures and their implementing procedures which would become the basis for Greece’s emergency response mechanisms. This Joint Ministerial Decision has long had the status of a draft and would need to be improved on several key points before being enacted, so that Greece can immediately and efficiently participate in an IEA collective action.
The IEA urges the government to revise the draft Joint Ministerial Decision and to prioritise the emergency response measures to be taken in a global crisis, notably by stating that use of stocks obligatorily held by the industry is a primary response measure. The draft should also stipulate that the release of industry stocks could be complemented by demand restraint measures, and that the government will ensure a direct and unrestricted flow of oil to the global market in the event of an IEA co‐ordinated action.
RENEWABLE ENERGY
In a remarkable change from the situation a few years ago, the government has adopted ambitious targets, policies and measures for increasing the use of renewable energy. The country aims to raise the share of renewable energy in gross total final consumption to 20% by 2020, which is 2% higher than its EU obligation and almost triple the 6.9% share in 2005. It has also set a specific target for renewable sources to provide 40% of electricity generation by the same year (the share in 2010 was 15%) and to provide 20% of primary energy for heating and cooling in 2020. The government deserves to be applauded for setting these targets and adopting policies and measures to reach them.
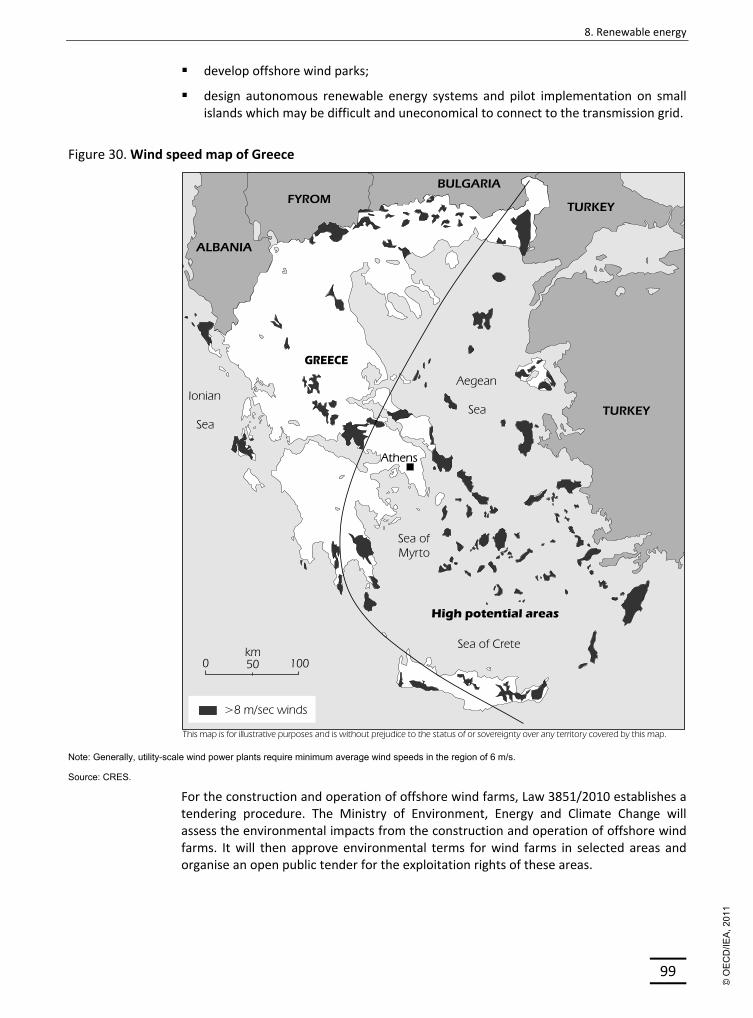
The government should now work to ensure that the ambitious 2020 targets are met. In the electricity sector, large investments in grids and generating capacity are needed. Greece has significant wind power potential and the government foresees wind power capacity to increase from around 1.3 gigawatts (GW) in 2010 to 7.5 GW in 2020, far more than other renewable energy technologies combined. Careful planning is required
to ensure a smooth integration of new renewable electricity capacity into the grid and to maintain the reliability of the electricity system as the share of variable generation increases. A key part of this development is to connect Greek islands with abundant wind and solar power potential to the mainland transmission network. It will also be essential to expand hydropower and/or natural gas capacity and build more interconnections to help balance variations in power generation from wind and solar resources. Power system flexibility should also be increased by storage and demand response, including advanced metering and time‐of‐use pricing of power. The government should also closely control the costs of the feed‐in tariff system, for example by reducing the tariffs over time or linking them more closely to the wholesale power price.
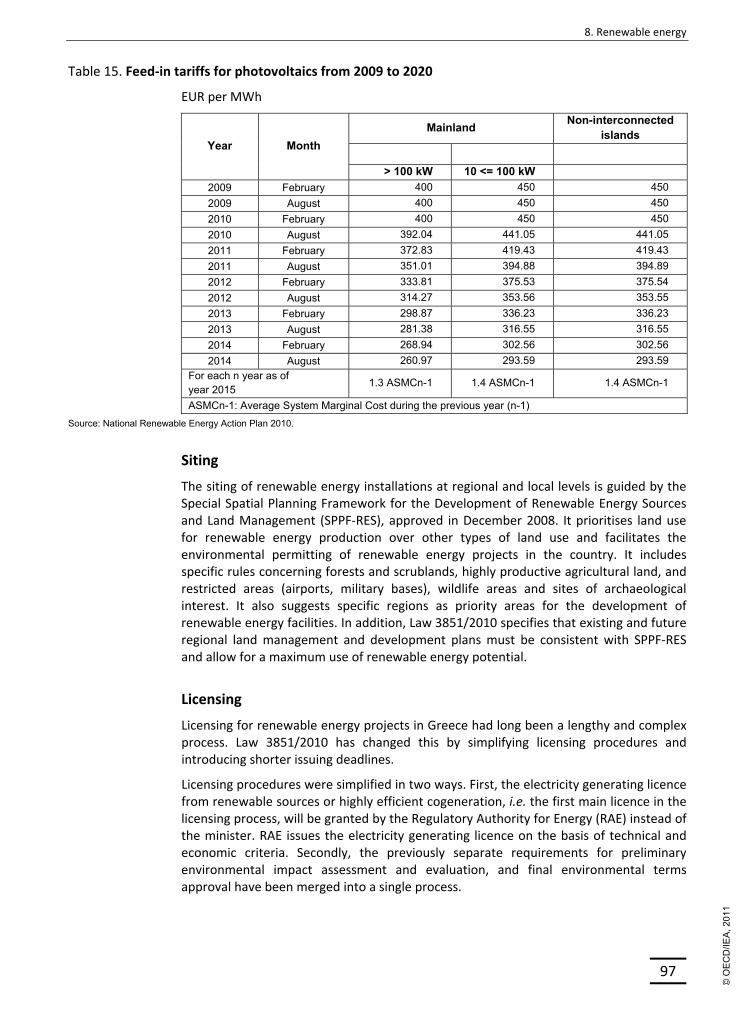
Complex licensing and siting procedures have caused long delays in renewable energy projects. It is therefore remarkable that Law 3851/2010 has shortened the licensing process by several years, and to just a few months in some cases. The 2008 Special Spatial Framework, in turn, has facilitated siting procedures for renewable energy projects. These are major improvements and the IEA congratulates the government. In another welcome development, Law 3851/2010 also increases the public acceptance of renewable energy projects by channelling the local communities more money from the generators – a simple and effective measure.
CLIMATE CHANGE MITIGATION
Greece is set to meet its Kyoto target, while the main contribution to reducing energy‐related CO2 emissions to meet its 2020 EU target will come from measures on renewable energy, fuel switching and energy efficiency. The government is encouraged to focus on cost‐effectiveness and to prioritise economic instruments when incorporating these measures into a coherent whole.
Because of its strong reliance on oil and lignite, primary energy supply in Greece is the most carbon‐intensive among the IEA member countries. The government is fully aware that this will have to change and is dedicated to greening the economy. Greece has a large potential for wind and solar energy and is rightly determined to increase its use. The renewable energy sector also holds promise for job creation, in particular if linked with research and development (R&D) activities.
Experience from IEA member countries shows that improving energy efficiency typically offers large cost‐effective potential for mitigating climate change, saving money and improving energy security. The IEA urges the government to look more into this potential and further strengthen the co‐ordination and evaluation of its various programmes and projects. Oil could be a focus area. In Greece, oil use is high by international comparison and oil is the most important fuel in all end‐use sectors. The government has rightly supported the gasification of the country, mandated renewable energy use for heating and promoted public transport, among other measures. At times of high oil prices and economic distress, intensified efforts to save oil and reduce its use would be a rational choice for government action.
Continue to implement the planned reforms in the energy sector to improve the country’s economic prospects; in particular, intensify electricity market reform and continue natural gas market reform to increase efficiency and ensure attractive framework conditions for future investments; consider further limiting market dominance of the Public Power Corporation and the Public Gas Corporation, including through privatisation.
Continue to promote long‐term gas security policies and complement, where appropriate, oil security policy to meet IEA best practice.
Continue to work towards the decarbonisation of the economy over the long term.
Intensify efforts to promote energy efficiency in order to save money, improve energy security and mitigate climate change.
Inland energy production: 9.2 Mtoe, 34% of total energy supply
COUNTRY OVERVIEW
Greece has an area of 132 000 km2 and borders on four countries: Albania, the former Yugoslav Republic of Macedonia (FYROM), Bulgaria and Turkey. The land area consists of the large peninsulas of the Peloponnese and Attica, the northern mainland, and over 2 000 islands covering more than one‐fifth of the territory. The country has extensive coastlines on the Aegean Sea, the eastern Mediterranean, and the Ionian Sea. It has 11.3 million inhabitants, of which around a third lives in the Athens area and more than a million in the Thessaloniki area. A large part of the mainland is mountainous and sparsely populated.
Services are by far the largest sector in the Greek economy. In 2010, they generated 78% of GDP, while industry contributed 18% and agriculture, forestry and fishing 4%. Services are dominated by tourism, shipping and the public sector. After several years of strong but debt‐driven growth, the international financial crisis triggered the Greek economy to contract by 2% in 2009. Government finances quickly deteriorated and the budget deficit reached unsustainable levels. In May 2010, the government adopted an austerity programme in order to receive financial assistance from the International Monetary Fund (IMF) and the eurozone countries. The programme includes cutting government spending, reducing the size of the public sector, decreasing tax evasion, reforming the health care and pension systems, and improving competitiveness through structural reforms to the labour and product markets, including the electricity, natural gas and coal sectors. GDP declined by 4.4% in 2010 and is set to decline further in 2011. Unemployment had reached 15.9% in February 2011.
Greece is a parliamentary democracy headed by a president. Executive powers are, however, vested in the government headed by a prime minister. Since October 2009, the country is governed by the Panhellenic Socialist Movement (PASOK). The next general
election is scheduled for 2013. Greece has been a member of the European Union since 1981.
SUPPLY AND DEMAND
SUPPLY
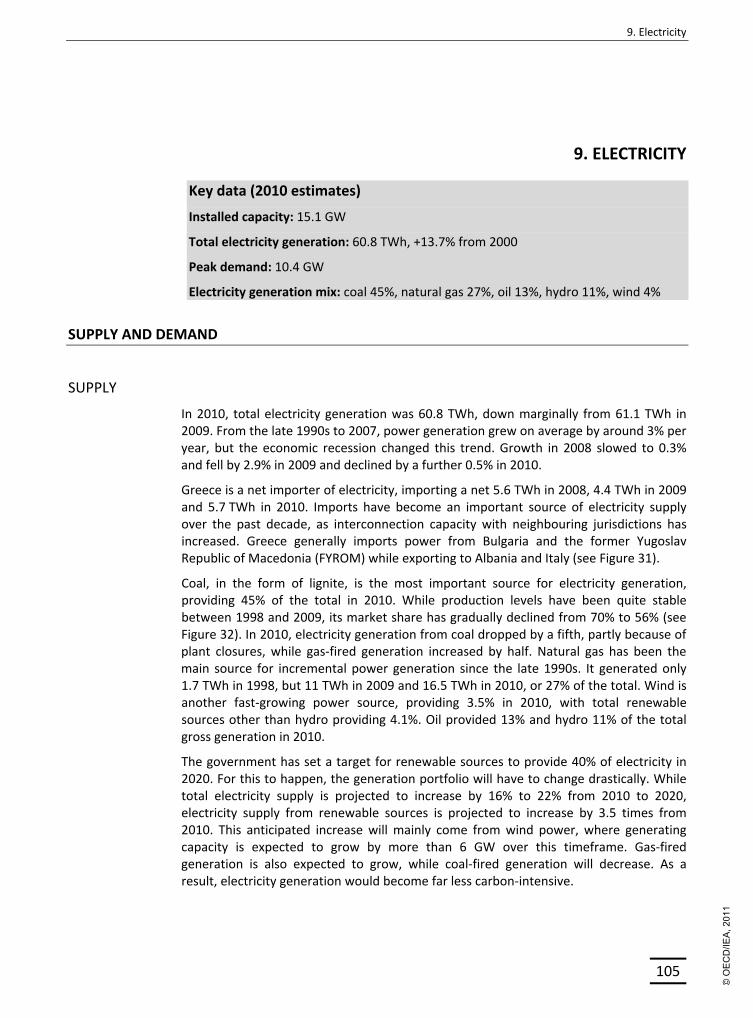
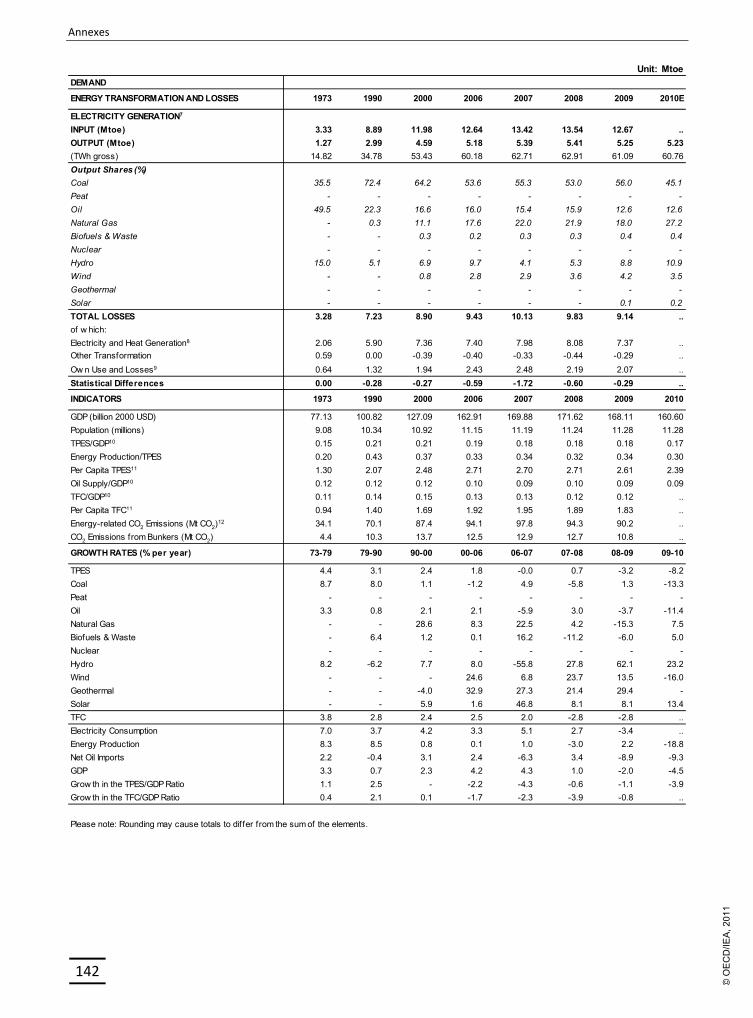
Total primary energy supply (TPES) was 27 million tonnes of oil equivalent (Mtoe) in 2010, down 8.2% from 2009 and 11.1% from 2008. Between 1990 and 2008, TPES grew with an annual average of 2%, while GDP increased by more than 3% per year (see Figure 2).
Figure 2. Total primary energy supply, 1973 to 2010*
** Other includes wind, solar, geothermal and ambient heat used in heat pumps.
Source: Energy Balances of OECD Countries, IEA/OECD Paris, 2011.
Domestic sources, primarily lignite but also renewable energy, covered a third of Greece’s energy needs, and the entire indigenous production. The remaining two‐thirds of TPES were oil and natural gas which are almost 100% imported.
Oil remains the most important energy source in Greece, although its share in TPES has gradually declined from 77% in 1973 to 52% in 2010. Over the years, oil has been substituted first by lignite and more recently by natural gas. Lignite is the second‐largest energy source, accounting for 27% of TPES in 2010. It is the most important source for electricity in Greece. Natural gas provided 12% of TPES in 2010. Over the past two decades, lignite supply has fluctuated between 8 and 9 Mtoe, but dropped to 7.3 Mtoe in 2010. In contrast, natural gas has been the fastest growing energy source in recent years. In total, fossil fuels accounted for 91% of TPES in 2010, one of the highest shares among the IEA member countries (see Figure 4).
In comparison, renewable energy supply is relatively low. The main renewable energy sources are biofuels and waste, providing 1 Mtoe or 4% of TPES in 2010, followed by hydropower with 0.6 Mtoe or 2% of TPES. Solar and wind energy each accounted for around 0.2 Mtoe, less than 1% of TPES in 2010.
Figure 3. Energy production by source, 1973 to 2010*
Total final consumption (TFC) was 20.6 Mtoe in 2009. Like TPES, it grew fast from 1990 to 2007, on average by 2.5% per year. Then, as a result of the economic situation, it decreased by 2.8% in 2008 and 2009 (see Figure 5).
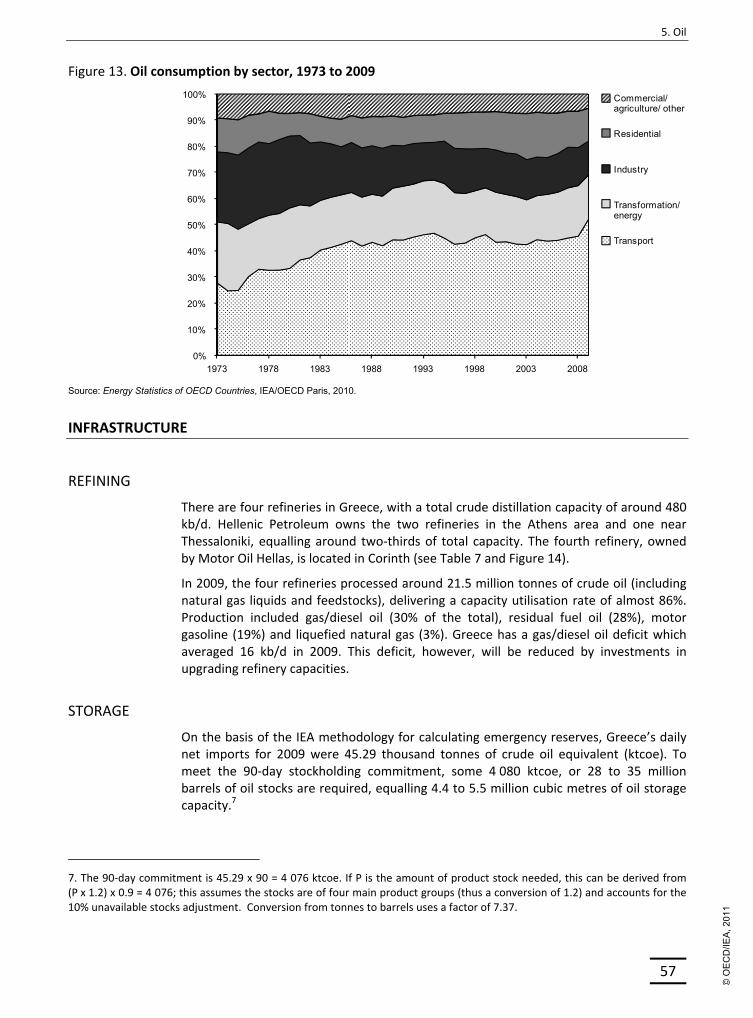
Oil has by far the highest share in final energy consumption in Greece; 65% in 2009. This share has remained relatively steady over time. In addition to the transport sector, oil is also the dominant fuel in industry and the buildings sector. Among the IEA member countries, Greece has the highest share of oil in TFC, and only Ireland is in a similar situation where oil dominates all consumption sectors. Among the OECD countries, only Mexico has a higher share of oil in TFC.
Electricity, as the second‐largest energy source, provided 23% of TFC in 2009. Its share has gradually increased from 17% in 1990 and is now slightly above the IEA average of 21.7%. The service sector consumed 41% of all electricity, the residential sector 33% and industry 26%. Beyond oil and electricity, the other energy sources covered 12% of TFC. Natural gas and coal are mostly used in industry and renewable energy in households, mainly for heating water.
Figure 5. Total final consumption by source, 1973 to 2009
* Other includes solar, geothermal and heat (negligible).
Source: Energy Balances of OECD Countries, IEA/OECD Paris, 2010.
INSTITUTIONS
Ministry of Environment, Energy and Climate Change (MEECC)
The ministry was formed in autumn 2009 by merging several functions of the former Ministries for Development and the Environment. MEECC is the central institution in climate and energy policy making in Greece. Within the Ministry, the General Directorate for Energy is responsible for energy policy and the publication of energy statistics. It is also responsible for the development of renewable energy and energy efficiency policy and oversees the Centre for Renewable Energy Sources (CRES). It is
responsible for the transposition of energy‐related EU directives into Greek legislation. The ministry co‐operates with the Regulatory Authority for Energy (RAE) in accordance with Greek and EU legislation, and is responsible for the exercise of majority shareholder functions of the Public Power Corporation (PPC), the Hellenic Transmission System Operator (HTSO), the Public Gas Corporation (DEPA) and the Gas Transmission System Operator (DESFA).
Ministry of Infrastructure, Transport and Networks
The Ministry of Infrastructure, Transport and Networks is in charge of transport policy planning and it co‐ordinates closely with the Ministry of Environment, Energy and Climate Change).
Ministry for Finance
The Ministry for Finance is responsible for taxation and for the exercise of the majority shareholder function in Hellenic Petroleum.
Regulatory Authority for Energy (RAE)
RAE was set up in 2000 as the independent regulator for all energy markets (electricity, gas and oil). It used to have primarily advisory powers, but also some direct powers over prices in natural gas retail. RAE’s chairman and two vice‐presidents are appointed by the Ministerial Council, following the consent of the Greek Parliament. With the transposition of the EU third internal energy market directives in August 2011, RAE has gained more independence and powers, and it is now responsible for licensing, secondary legislation and market control and supervision.
Hellenic Competition Commission (HCC)
The HCC is an independent body responsible for the proper functioning of competition in all markets in Greece. It can commence inquiries into market power or market abuse ex ufficio and it acts as an advisory body to the government. HCC is overseen by the Ministry for Finance.
Centre for Renewable Energy Sources (CRES)
CRES is the national centre for renewable energy sources, rational use of energy and energy saving, and it co‐ordinates national policies in these areas. It also produces energy systems analysis and is active in EU‐funded projects. CRES is supervised by the Ministry for Environment, Energy and Climate Change.
Public Power Corporation (PPC) S.A.
PPC is the majority state‐owned electricity producer, distributor and supplier in Greece. It supplied more than 75% of wholesale and more than 90% of retail electricity in 2010. The company also remains the owner of transmission and distribution assets and has a 49% stake in HTSO, the operator of the transmission system and wholesale market. Law 4001/2011 foresees a transfer of HTSO’s system operation and planning responsibilities to a PPC subsidiary, which will then become the TSO. HTSO will remain the operator wholesale market.
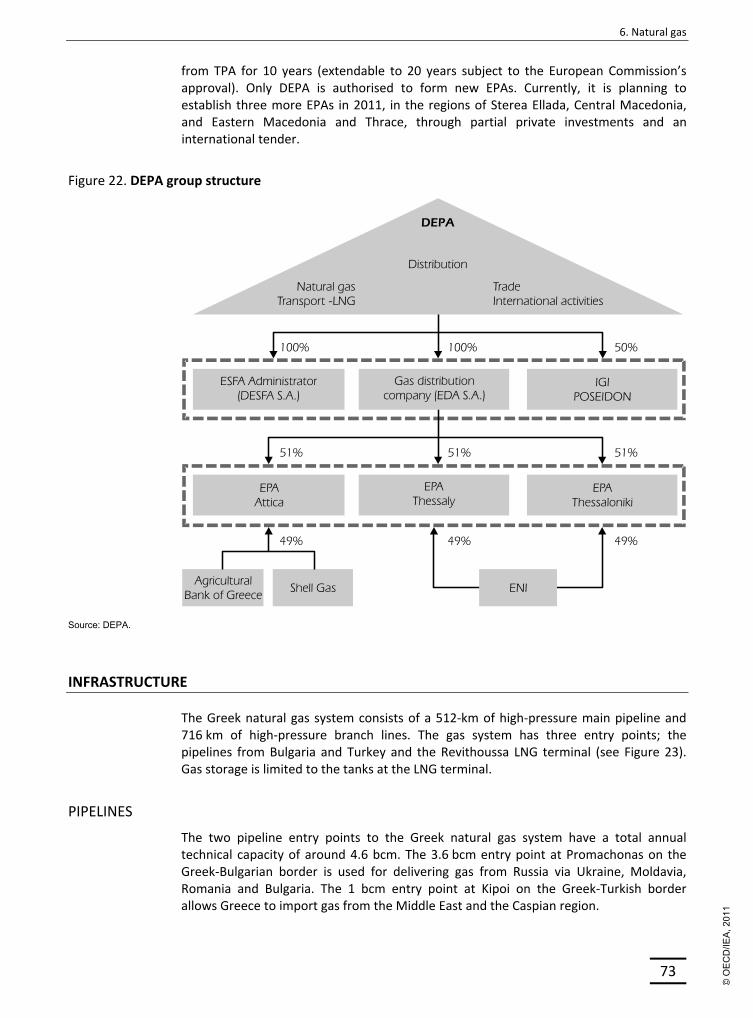
Public Gas Corporation (DEPA) S.A.
DEPA is the main natural gas supplier in Greece. It is 65% owned by the Greek State, while Hellenic Petroleum owns the remaining 35%. DEPA owns the Hellenic Gas Transmission System Operator (DESFA), the owner and operator of the high‐pressure
transmission network of natural gas and the Revithoussa LNG terminal. DEPA also owns 51% of the regional gas distribution companies (EPAs) through its 100% subsidiary EDA, and 50% of the Interconnector Greece–Italy (IGI Poseidon). Law 4001/2011 foresees that DESFA will be unbundled from DEPA.
KEY POLICIES
MARKET REFORM
Greece is stepping up efforts to liberalise its historically state‐controlled electricity and natural gas markets, taking also into consideration the recent obligations under the EU third Internal Energy Market Directives.
In the electricity market, new entrants are gaining ground in the wholesale market, although PPC still supplied more than 75% of the volume in 2010. It also supplied more than 90% of the retail market in 2010. Competition in the retail market has been very limited, because of regulating end‐user prices at levels that do not always cover generating costs. Since the beginning of 2011, PPC’s retail tariffs have been restructured towards eliminating cross‐subsidisation between different categories of clients. Retail tariffs are expected to be fully deregulated by mid‐2013.
In the gas market, independent suppliers and large customers willing to be self‐supplied may, since April 2010, import gas to the country. Although the State remains in control of almost all gas supply and the gas transmission infrastructure through DEPA and its subsidiaries, the new entrants can be expected to gradually reduce the dominance of DEPA and bring multiple benefits to the economy and the citizens.
The new energy law 4001/2011 (Official Gazette FEK 179/ Α’ / 22 August 2011) strengthens the power of the regulatory authority, provides for consumer protection, and allows for unbundling electricity and gas transmission (see Box 1). The government is also committed to reducing its ownership in PPC and DEPA to clearly below 50%.
Box 1. Law 4001/2011 to implement the third EU Electricity and Natural Gas Market Directives
Law 4001/2011, adopted on 22 August 2011, transposes into national law the EU Directives 2009/72/EC and 2009/73/EC. It introduces significant reforms to the electricity and natural gas market structure and aims to establish a stable and transparent legislative and regulatory framework for monitoring these markets and for protecting consumers. The law consists of the following four chapters:
Chapter on RAE
The role of the independent regulator (RAE) is strengthened by granting it a distinct legal personality and financial autonomy. Members of the Board will be chosen by the Parliamentary Committee on Institutions and Transparency.
RAE has new responsibilities regarding security of supply, licensing, network development programme, network usage tariffs, monitoring of the market, consumer protection and issuing secondary legislation (codes and regulations).
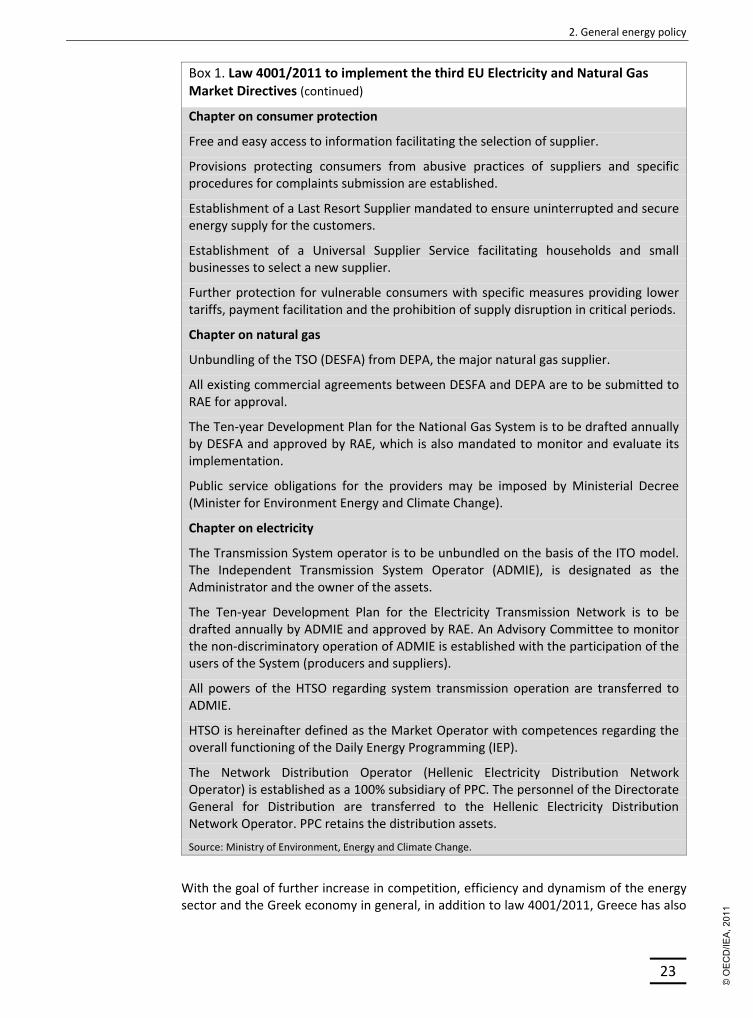
Box 1. Law 4001/2011 to implement the third EU Electricity and Natural Gas Market Directives (continued)
Chapter on consumer protection
Free and easy access to information facilitating the selection of supplier.
Provisions protecting consumers from abusive practices of suppliers and specific procedures for complaints submission are established.
Establishment of a Last Resort Supplier mandated to ensure uninterrupted and secure energy supply for the customers.
Establishment of a Universal Supplier Service facilitating households and small businesses to select a new supplier.
Further protection for vulnerable consumers with specific measures providing lower tariffs, payment facilitation and the prohibition of supply disruption in critical periods.
Chapter on natural gas
Unbundling of the TSO (DESFA) from DEPA, the major natural gas supplier.
All existing commercial agreements between DESFA and DEPA are to be submitted to RAE for approval.
The Ten‐year Development Plan for the National Gas System is to be drafted annually by DESFA and approved by RAE, which is also mandated to monitor and evaluate its implementation.
Public service obligations for the providers may be imposed by Ministerial Decree (Minister for Environment Energy and Climate Change).
Chapter on electricity
The Transmission System operator is to be unbundled on the basis of the ITO model. The Independent Transmission System Operator (ADMIE), is designated as the Administrator and the owner of the assets.
The Ten‐year Development Plan for the Electricity Transmission Network is to be drafted annually by ADMIE and approved by RAE. An Advisory Committee to monitor the non‐discriminatory operation of ADMIE is established with the participation of the users of the System (producers and suppliers).
All powers of the HTSO regarding system transmission operation are transferred to ADMIE.
HTSO is hereinafter defined as the Market Operator with competences regarding the overall functioning of the Daily Energy Programming (IEP).
The Network Distribution Operator (Hellenic Electricity Distribution Network Operator) is established as a 100% subsidiary of PPC. The personnel of the Directorate General for Distribution are transferred to the Hellenic Electricity Distribution Network Operator. PPC retains the distribution assets.
Source: Ministry of Environment, Energy and Climate Change.
With the goal of further increase in competition, efficiency and dynamism of the energy sector and the Greek economy in general, in addition to law 4001/2011, Greece has also
already laid down a programme for privatising state‐controlled energy companies, as part of the Midterm Fiscal Plan (see Table 1).
Table 1. Privatisation of state‐controlled energy companies
Company Current State
share, %
State shares to be sold, % of all
company shares Public Gas Corporation (DEPA) 65 55 National Natural Gas System Operator (DESFA) 65 31 Public Power Corporation (PPC) 51 17 Subsea gas field of Notia Kavala (for gas storage) 100 100
Source: Law 3985/2011 (Official Gazette A’ 151/1 July, 2011).
SECURITY OF SUPPLY
Greece imports practically all the oil and gas it needs, while it has ample reserves of lignite and a large potential for renewable energy. It has diversified its crude oil import sources, reducing its dependence on OPEC countries by gradually increasing imports from Russia and OECD members. The country is in compliance with the IEA 90‐day stockholding obligation since 2004,
The key elements of Greece’s policy on natural gas security are the diversification of supply sources and the development of the natural gas transmission system. In addition, new gas‐fired plants are required to hold at least five days of dual fuel reserves (i.e. either diesel stored at the plant site, or LNG at the Revithoussa terminal). In a supply disruption, DESFA, the tansmission system operator, would resort to the following three key measures:
interruption of gas supply to large users, on the basis of a priority list;
fuel switching at power stations;
use of gas reserves at the LNG terminal.
Peak demand of electricity is met by increasing imports and offering financial incentives for large users to reduce demand. Total capacity of cross‐border connections amounts to around 15% of peak demand. Plans exist to increase cross‐border capacity with Bulgaria and Italy. The foreseen increase in variable renewable power generation to 2020 will increase the need for system flexibility to ensure security of supply.
CLIMATE CHANGE MITIGATION
Greece is a Party to the United Nations Framework Convention on Climate Change (UNFCCC) and to the Kyoto Protocol. The related EU Burden‐Sharing Agreement (2002/358/EC) limits its greenhouse gas (GHG) emissions to an average of 25% above their base year1 level from 2008 to 2012. GHG emissions peaked in 2007, and because of the economic recession and efficiency improvements, Greece is set to meet this target.
As part of the effort‐sharing of the EU GHG target of ‐20% from 1990 to 2020, Greece will have to reduce emissions by 4% from their 2005 level in the sectors outside the EU
1. 1990 for carbon dioxide CO2, methane CH4 and nitrous oxide N2O; and 1995 for F‐gases (hydrofluorocarbons, perfluorocarbons and sulphur hexafluoride).
Emissions Trading System (ETS). The ETS sector has a single EU‐wide target of ‐21% from 2005 to 2020.
The main contribution to reducing energy‐related CO2 emissions to meet the 2020 target will come from measures on renewable energy, energy efficiency and fuel switching from lignite and oil to natural gas and renewable energy sources. The EU‐ETS and EU air pollution legislation are driving a decarbonisation of the country’s power supply. In addition, Greece aims to raise the share of renewable energy in gross total final consumption of energy to 20% by 2020, which is 2% higher than its EU obligation and almost triple the 6.9% share in 2005. It has also set a specific target for renewable sources to provide 40% of electricity generation by the same year (the share in 2010 was 15%) and to provide 20% of primary energy for heating and cooling in 2020.
CRITIQUE
Since the last in‐depth review in 2006, Greece has improved its energy policy in several areas. New energy infrastructure is providing alternative sources of natural gas and ensuring long‐term energy supply. The natural gas system was reinforced and expanded, and its penetration in domestic, industrial and tertiary sectors promoted. Investments in renewable energy have been substantially increased. Greece has commendably diversified its sourcing of crude oil and oil products and taken measures to boost its indigenous oil production. The IEA also applauds Greece’s priority to enhance regional energy co‐operation through the construction of new, and the upgrading of existing, energy interconnectors with neighbouring countries. Greece has been compliant with the IEA 90‐day stockholding obligation since the end of 2004.
Given the current economic situation in Greece, much has to change before the country can return to sustained growth. Reforms are needed also in the energy sector to improve economic efficiency. Greece has made some progress since 2006 in opening energy markets, but much more remains to be done. Further market liberalisation can be expected to bring benefits to the consumers, and the government should try to reap these benefits of market reforms for the consumers
Reducing concentration and increasing effective competition in the electricity and natural gas markets is a particular challenge. Market power of PPC and DEPA is still strong, the level of independence of the transmission system operators is low, and the Regulatory Authority for Energy (RAE) and the Hellenic Competition Commission (HCC) have had rather limited powers and independence.
In August 2011, the Greek Parliament adopted the new energy law which transposes the EU third Energy Market Directives. It has also pledged to partly privatise PPC and DEPA. The law should be implemented as a matter of urgency. In particular, the dominance of the incumbent electricity and gas companies should be mitigated, while RAE and HCC should be given more decision‐ and rule‐making power and appropriate resources.
In recent years, energy and climate policies have become more prominent on the political agenda. Greece decided to rearrange the structure of the ministries working on energy and environment policy, having in mind the necessary consistency of energy and environment policies and being committed to the three Es of good energy policy: Energy security, Environmental sustainability, and Economic efficiency. The IEA congratulates the government for forming a new Ministry for Environment, Energy and Climate Change, in particular because a horizontal approach is needed to respond to the
European Union targets for 2020 on greenhouse gas (GHG) mitigation, renewable energy and energy efficiency.
While Greece looks set to comply with its Kyoto Protocol target for 2008‐2012, the global need to decarbonise our economies justifies a more strategic long‐term approach. The government sees greening the economy as a way to promote job creation, especially in the renewable energy sector. The country has introduced ambitious targets to further increase the share of renewable energy and adopted a major law (3851/2010) and a National Renewable Energy Action Plan to provide for measures needed to meet the 2020 targets. The government has also formed a National Energy Efficiency Action Plan and has begun to implement programmes in support of the targets outlined in this plan. All in all, the IEA recommends the government to develop coherent energy and climate strategies to 2020 and beyond which cover all sectors (e.g. electricity, buildings and transport) and place a particularly strong emphasis on the demand side. The government should continue to consider different scenarios that assess the cost‐effectiveness and the environmental sustainability of envisaged policies when developing these strategies.
For investors and market participants in all energy sectors, it is essential, not only in Greece, to have political and administrative decisions (e.g. licences, spatial planning, regulatory framework) implemented as quickly and effectively as possible. Conditions for investing in renewable energy have been improved by Law 3851/2010. As regards other existing regulatory frameworks, there may still be room for improvements, be it in design (stable, simple, complete) or implementation of regulatory frameworks. The IEA encourages the government to intensify efforts to take decisions and implement policy quickly and effectively.
As many other countries, Greece is facing local resistance and administrative barriers to new energy infrastructures, including renewable energies like wind energy. The government is therefore still encouraged to be more active in communicating its energy policy, policy goals and constraints to the broader public.
To facilitate a longer‐term view on energy and environmental policy, all stakeholders – including government, other authorities, industry, research, non‐governmental oganisations and the general public – need the ability to judge in a consistent and easily understandable way the risks and opportunities of different energy supply options (such as fossil and renewable energy).
RECOMMENDATIONS
The government of Greece should:
Continue to implement the planned market reforms, in particular, take measures to mitigate the dominance of the incumbent electricity and gas companies and strengthen the Regulatory Authority for Energy and the Competition Commission by giving them more decision and rule‐making power and appropriate resources.
Continue to develop coherent energy and climate strategies to 2020 and beyond which cover all sectors (e.g. electricity, buildings and transport) and place a particularly strong emphasis on the demand side.
Utilise different scenarios that assess the cost‐effectiveness and the environmental sustainability of envisaged policies when developing these strategies.
Total GHG emissions (excluding land‐use, land‐use change and forestry): 122.5 Mt CO2‐eq, +17.4% from 1990.
2008‐2012 target: +25% from base year
CO2 emissions from fuel combustion: 90.2 Mt (+1.4% on average per year since 1990)
Emissions by fuel: oil 54%, coal 39%, gas 7%
Emissions by sector: electricity and heat generation 49%, transport 27%, industry 12%, households 8%, other 4%
OVERVIEW
Greece is a Party to the United Nations Framework Convention on Climate Change (UNFCCC) and to the Kyoto Protocol. The related EU Burden‐Sharing Agreement (2002/358/EC) limits its greenhouse gas (GHG) emissions to an average of 25% above their base‐year2 level from 2008 to 2012.
As part of the effort‐sharing of the EU GHG target of ‐20% from 1990 to 2020, Greece will have to reduce emissions by 4% from their 2005 level in the sectors outside the EU Emissions Trading System (ETS). The ETS sector has a single EU‐wide target of ‐21% from 2005 to 2020.
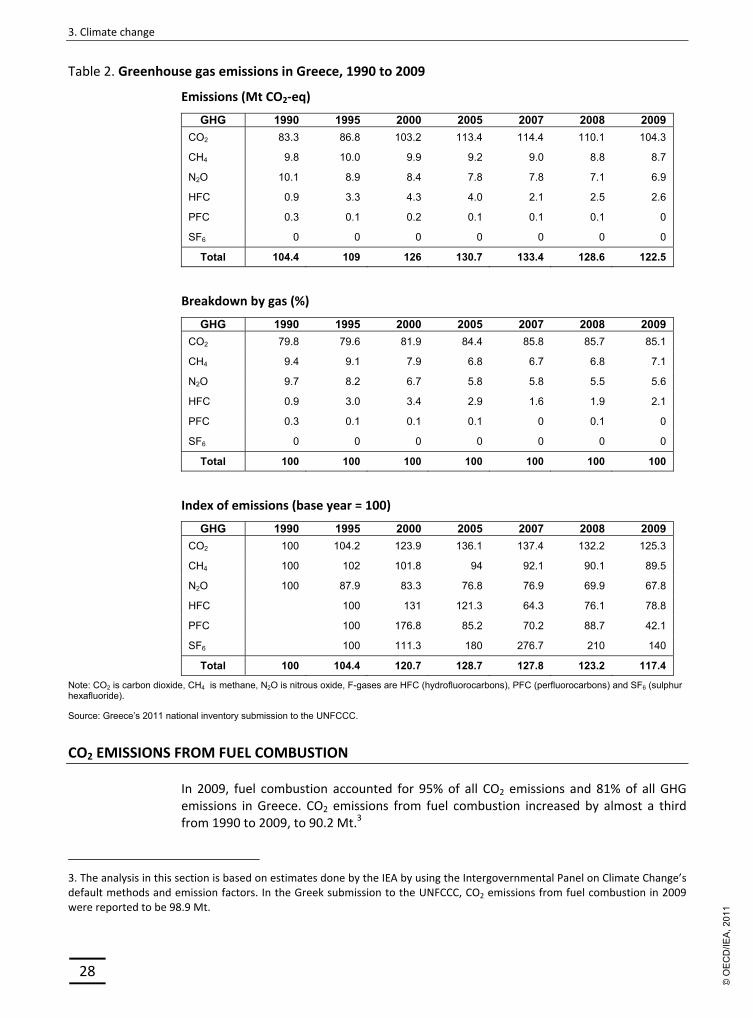
Greece’s total emissions of the six GHGs have increased since 1990. According to the Greek national inventory submission to the UNFCCC, total GHG emissions in 2009 amounted to 122.5 million tonnes of CO2‐equivalent (Mt CO2‐eq), which is 17.4% more than in 1990 and 15.1% more than the base‐year emissions of 106.5 Mt CO2‐eq. This increase is dominated by a steep increase in emissions of CO2, while the emissions of the other major gases have decreased compared to 1990. However, CO2 emissions peaked in 2007 and have since been decreasing, partly owing to improvements in energy efficiency and increases in the use of renewable energy and natural gas. In 2009, CO2 emissions decreased further mainly because of economic recession. In 2009, CO2 accounted for 85.1% of GHGs, CH4 for 7.1%, N2O for 5.6% and the F‐gases (HFCs, PFCs and SF6) for 2.2% (see Table 2).
2. 1990 for carbon dioxide CO2, methane CH4 and nitrous oxide N2O; 1995 for F‐gases (hydrofluorocarbons, perfluorocarbons and sulphur hexafluoride SF6).
Table 2. Greenhouse gas emissions in Greece, 1990 to 2009
Emissions (Mt CO2‐eq)
GHG 1990 1995 2000 2005 2007 2008 2009
CO2 83.3 86.8 103.2 113.4 114.4 110.1 104.3
CH4 9.8 10.0 9.9 9.2 9.0 8.8 8.7
N2O 10.1 8.9 8.4 7.8 7.8 7.1 6.9
HFC 0.9 3.3 4.3 4.0 2.1 2.5 2.6
PFC 0.3 0.1 0.2 0.1 0.1 0.1 0
SF6 0 0 0 0 0 0 0
Total 104.4 109 126 130.7 133.4 128.6 122.5
Breakdown by gas (%)
GHG 1990 1995 2000 2005 2007 2008 2009
CO2 79.8 79.6 81.9 84.4 85.8 85.7 85.1
CH4 9.4 9.1 7.9 6.8 6.7 6.8 7.1
N2O 9.7 8.2 6.7 5.8 5.8 5.5 5.6
HFC 0.9 3.0 3.4 2.9 1.6 1.9 2.1
PFC 0.3 0.1 0.1 0.1 0 0.1 0
SF6 0 0 0 0 0 0 0
Total 100 100 100 100 100 100 100
Index of emissions (base year = 100)
GHG 1990 1995 2000 2005 2007 2008 2009
CO2 100 104.2 123.9 136.1 137.4 132.2 125.3
CH4 100 102 101.8 94 92.1 90.1 89.5
N2O 100 87.9 83.3 76.8 76.9 69.9 67.8
HFC 100 131 121.3 64.3 76.1 78.8
PFC 100 176.8 85.2 70.2 88.7 42.1
SF6 100 111.3 180 276.7 210 140
Total 100 104.4 120.7 128.7 127.8 123.2 117.4
Note: CO2 is carbon dioxide, CH4 is methane, N2O is nitrous oxide, F-gases are HFC (hydrofluorocarbons), PFC (perfluorocarbons) and SF6 (sulphur hexafluoride).
Source: Greece’s 2011 national inventory submission to the UNFCCC.
CO2 EMISSIONS FROM FUEL COMBUSTION
In 2009, fuel combustion accounted for 95% of all CO2 emissions and 81% of all GHG emissions in Greece. CO2 emissions from fuel combustion increased by almost a third from 1990 to 2009, to 90.2 Mt.3
3. The analysis in this section is based on estimates done by the IEA by using the Intergovernmental Panel on Climate Change’s default methods and emission factors. In the Greek submission to the UNFCCC, CO2 emissions from fuel combustion in 2009 were reported to be 98.9 Mt.
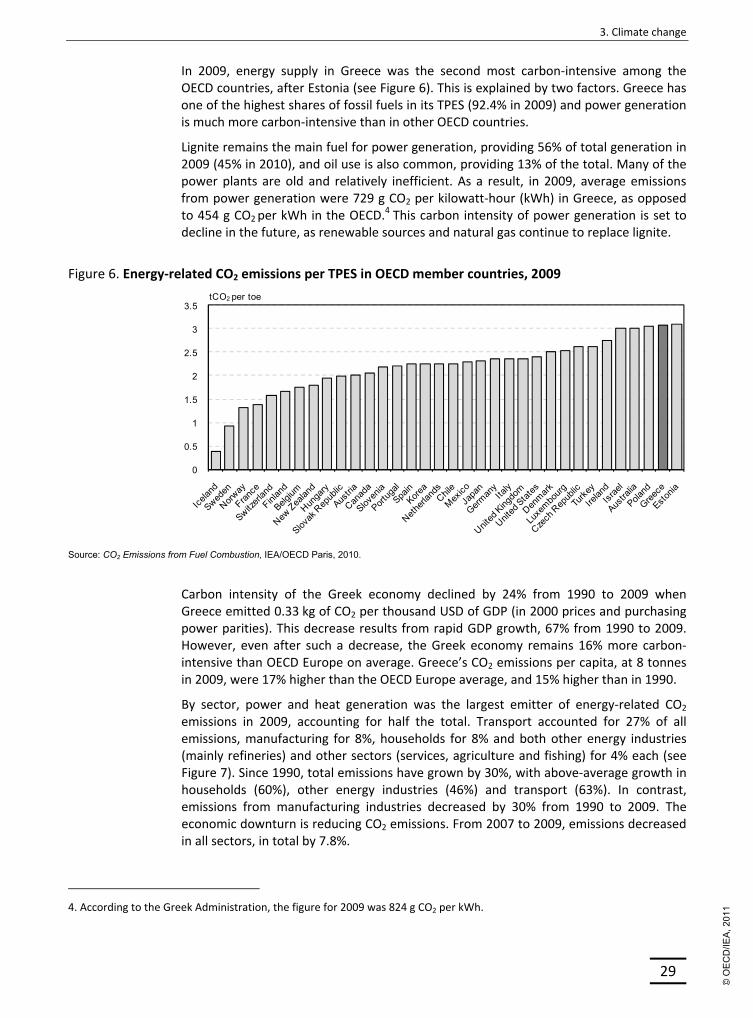
In 2009, energy supply in Greece was the second most carbon‐intensive among the OECD countries, after Estonia (see Figure 6). This is explained by two factors. Greece has one of the highest shares of fossil fuels in its TPES (92.4% in 2009) and power generation is much more carbon‐intensive than in other OECD countries.
Lignite remains the main fuel for power generation, providing 56% of total generation in 2009 (45% in 2010), and oil use is also common, providing 13% of the total. Many of the power plants are old and relatively inefficient. As a result, in 2009, average emissions from power generation were 729 g CO2 per kilowatt‐hour (kWh) in Greece, as opposed to 454 g CO2 per kWh in the OECD.4 This carbon intensity of power generation is set to decline in the future, as renewable sources and natural gas continue to replace lignite.
Figure 6. Energy‐related CO2 emissions per TPES in OECD member countries, 2009
0
0.5
1
1.5
2
2.5
3
3.5tCO2 per toe
Source: CO2 Emissions from Fuel Combustion, IEA/OECD Paris, 2010.
Carbon intensity of the Greek economy declined by 24% from 1990 to 2009 when Greece emitted 0.33 kg of CO2 per thousand USD of GDP (in 2000 prices and purchasing power parities). This decrease results from rapid GDP growth, 67% from 1990 to 2009. However, even after such a decrease, the Greek economy remains 16% more carbon‐intensive than OECD Europe on average. Greece’s CO2 emissions per capita, at 8 tonnes in 2009, were 17% higher than the OECD Europe average, and 15% higher than in 1990.
By sector, power and heat generation was the largest emitter of energy‐related CO2 emissions in 2009, accounting for half the total. Transport accounted for 27% of all emissions, manufacturing for 8%, households for 8% and both other energy industries (mainly refineries) and other sectors (services, agriculture and fishing) for 4% each (see Figure 7). Since 1990, total emissions have grown by 30%, with above‐average growth in households (60%), other energy industries (46%) and transport (63%). In contrast, emissions from manufacturing industries decreased by 30% from 1990 to 2009. The economic downturn is reducing CO2 emissions. From 2007 to 2009, emissions decreased in all sectors, in total by 7.8%.
4. According to the Greek Administration, the figure for 2009 was 824 g CO2 per kWh.
** Includes industrial waste and non-renewable municipal waste (negligible).
Source: CO2 Emissions from Fuel Combustion, IEA/OECD Paris, 2010.
On a fuel basis, oil remains the dominant source of CO2 (see Figure 8). In 2009, it accounted for 54% of emissions, a relatively stable share since 1990. Emissions from coal
use (39% of the total) remain clearly higher than those from natural gas use (7%). Since the late 1990s, natural gas has steadily become more common as a fuel for power generation. Partly because of EU‐ETS, emissions from natural gas use have increased in recent years, while emissions from coal use have remained fairly stable. Data on fuel use for electricity generation do, however, point to a steep decline in CO2 emissions since 2008 owing to the recession and the penetration of renewable energy sources (see Chapter 9 on electricity).
INSTITUTIONS
The Ministry of Environment, Energy and Climate change (MEECC) is responsible for the co‐ordination of all other competent ministries and other public and/or private entities for:
implementing the provisions of the Kyoto Protocol;
formulating and monitoring the National Programme for achieving national targets set under the Kyoto Protocol.
MEECC is also responsible for the implementation of the EU‐ETS in Greece. In practice, this work is done by the Emissions Trading Office within the ministry’s Directorate‐General for the Environment. This office is also the designated National Authority for the Clean Development Mechanism (CDM) and the designated focal point for Joint Implementation (JI) projects. The National Registry is operated by the National Centre for Environment and Sustainable Development, an institute supervised by MEECC. The co‐ordination of all competent authorities is assigned to a seven‐member inter‐ministerial committee.
POLICIES AND MEASURES
OVERVIEW
The basis of Greece’s climate policy is the second National Climate Change Programme from 2002 and its subsequent revisions, the National Renewable Energy Action Plan (NREAP) and the National Energy Efficiency Action Plan (NEEAP) National policies and measures are closely linked to the European common and co‐ordinated policies and measures, including the Emissions Trading System, as well as the financing mechanisms and fiscal measures supporting the implementation of projects.
The impact of current and future climate policies and measures is quantified in the 5th National Communication of Greece to the UNFCCC, published in January 2010. The communication contains two emissions scenarios: the “with measures” scenario includes adopted and implemented emissions reduction policies and measures. The “with additional measures” scenario assumes the implementation of current and planned policies. The latter scenario was updated in March 20115 to take into account revised policies and measures related to the compliance with the EU 20‐20‐20 targets to be reached by 2020.
5. Report under Article 3(2) of the Decision 280/2004/EC related to national policies and measures and GHG emission projections. Ministry of Environment, Energy and Climate Change, 2011. http://cdr.eionet.europa.eu/gr/eu/ghgmm/envtx8f8w
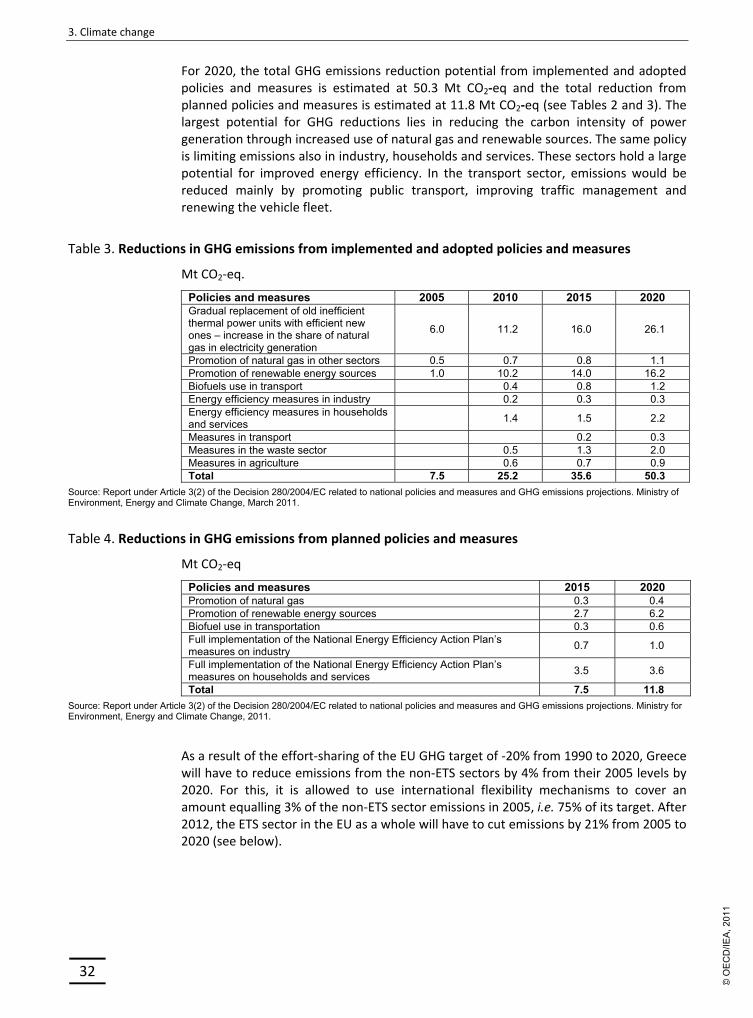
For 2020, the total GHG emissions reduction potential from implemented and adopted policies and measures is estimated at 50.3 Mt CO2‐eq and the total reduction from planned policies and measures is estimated at 11.8 Mt CO2‐eq (see Tables 2 and 3). The largest potential for GHG reductions lies in reducing the carbon intensity of power generation through increased use of natural gas and renewable sources. The same policy is limiting emissions also in industry, households and services. These sectors hold a large potential for improved energy efficiency. In the transport sector, emissions would be reduced mainly by promoting public transport, improving traffic management and renewing the vehicle fleet.
Table 3. Reductions in GHG emissions from implemented and adopted policies and measures
Mt CO2‐eq.
Policies and measures 2005 2010 2015 2020Gradual replacement of old inefficient thermal power units with efficient new ones – increase in the share of natural gas in electricity generation
6.0 11.2 16.0 26.1
Promotion of natural gas in other sectors 0.5 0.7 0.8 1.1 Promotion of renewable energy sources 1.0 10.2 14.0 16.2 Biofuels use in transport 0.4 0.8 1.2 Energy efficiency measures in industry 0.2 0.3 0.3 Energy efficiency measures in households and services
1.4 1.5 2.2
Measures in transport 0.2 0.3 Measures in the waste sector 0.5 1.3 2.0 Measures in agriculture 0.6 0.7 0.9 Total 7.5 25.2 35.6 50.3
Source: Report under Article 3(2) of the Decision 280/2004/EC related to national policies and measures and GHG emissions projections. Ministry of Environment, Energy and Climate Change, March 2011.
Table 4. Reductions in GHG emissions from planned policies and measures
Mt CO2‐eq
Policies and measures 2015 2020Promotion of natural gas 0.3 0.4 Promotion of renewable energy sources 2.7 6.2 Biofuel use in transportation 0.3 0.6 Full implementation of the National Energy Efficiency Action Plan’s measures on industry
0.7 1.0
Full implementation of the National Energy Efficiency Action Plan’s measures on households and services
3.5 3.6
Total 7.5 11.8
Source: Report under Article 3(2) of the Decision 280/2004/EC related to national policies and measures and GHG emissions projections. Ministry for Environment, Energy and Climate Change, 2011.
As a result of the effort‐sharing of the EU GHG target of ‐20% from 1990 to 2020, Greece will have to reduce emissions from the non‐ETS sectors by 4% from their 2005 levels by 2020. For this, it is allowed to use international flexibility mechanisms to cover an amount equalling 3% of the non‐ETS sector emissions in 2005, i.e. 75% of its target. After 2012, the ETS sector in the EU as a whole will have to cut emissions by 21% from 2005 to 2020 (see below).
The EU‐ETS limits the amount of CO2 emissions from installations in nine energy‐intensive industries: combustion installations, hydrocarbon refineries, coke ovens, metal ore roasting or sintering installations, production of pig iron and steel, production of cement clinker, manufacture of glass, manufacture of ceramic products and production of pulp and paper. Each installation is allocated emission allowances and must surrender allowances to cover its total CO2 emissions. If its emissions are higher than expected, it shall purchase more allowances on the allowance market to cover the shortfall between allocation and actual emissions. If, in turn, it needs fewer allowances than it holds, it can sell them. Allocation in the first two phases of the EU‐ETS (2005‐2012) is based on a National Allocation Plan that is prepared by the national government and approved by the EU Commission. Allocation criteria are laid out in Annex III to the EU Emissions Trading Directive (2003/87/EC).
The EU‐ETS was launched in 2005 and its first commitment period ran until the end of 2007. For 2008‐2012, the second commitment period, Greece may allocate a total of 315.4 Mt of CO2 allowances to the 140 incumbents and 26.1 Mt for new entrants. At 68.4 Mt CO2‐eq, total annual allocation in 2008‐2012 is 8% smaller than in the first commitment period and 19.8% less than the ETS‐sector emissions in 2005. Power generation received 71% of allowances to incumbents, and cement industry 17% (see Table 5). All allowances are allocated free and installations may use JI and CDM credits to cover up to 9% of their emissions obligation.
As from 2013, new rules for EU‐ETS will apply, on the basis of Directive 2009/29/EC. For example, all allowances for the power sector will have to be auctioned with temporary exemptions for some new EU member states, whereas process industries may receive part or, if subject to carbon leakage, all of their allowances for free at the level of the benchmark of industry best practice. Flexible mechanisms may be used to cover up to 50% of the required reduction between the 2005 verified emissions and the average cap over 2008‐2020. The scope of the EU‐ETS will also be broadened to cover several new sectors, including aviation and the production of aluminium and chemicals. ETS will also cover the emissions of perfluorocarbons and nitrous oxide in certain industries.
Table 5. Allocation of allowances in the National Allocation Plan 2008–2012 by sector
Categories of activities Allowances allocated (t CO2)Power generation 222 520 789 Other combustion 2 012 220 Refineries 19 892 720 Metal ore roasting and sintering 4 048 345 Iron and steel 2 675 820 Cement 53 863 840 Lime 4 633 535 Glass 285 585 Ceramics 4 570 885 Paper 936 900 Total 315 440 639 Reserve for new entrants 26 107 071
Source: Ministry of Environment, Energy and Climate Change.
Efforts to limit the GHG emission from the sectors outside the EU‐ETS focus on fuel switching, renewable energy and energy efficiency. They are listed in more detail in Chapters 4 and 8 on energy efficiency and renewable energy, respectively.
Households and services
Adopted, implemented and planned actions include increasing the use of natural gas and renewable energy sources, but also improving the thermal behaviour of residential buildings and promoting energy‐efficient appliances and heating equipment. These actions are supported significantly by the incorporation in the Greek legislation of Directive 2002/91/EC (through Law 3661/2008, Joint Ministerial Decision, D6/B/5825/20.04.2010 and Presidential Decrees 72/2010 and 100/2010) which proposes actions for energy conservation in the residential and service sectors, such as using a common methodology for the estimation of the energy efficiency of buildings, development of a system for the certification of new and existing buildings, inspection of boilers, mandatory replacement of all low energy efficiency lights in the public and wider public sector, financial incentives and subsidies for the replacement of low energy‐class household devices with new energy‐efficient ones. The 2010 Energy Performance of Buildings Regulation, in line with Directive 2009/28/EC, specifies energy inspections, as well as energy and environmental certification of buildings, and thus helps to limit CO2 emissions.
Transport
The substantial increase of GHG emissions from road transport is directly linked to the increase of vehicles and transportation activity. The renewal of the passenger car fleet and the implied improvement of energy efficiency limit the increase of GHG emissions. However, the positive results from the improved performance of vehicles are reduced by the high level of passenger car use. The government expects that the implemented, adopted and planned measures to improve public transport will moderate this high level of passenger car use.
International measures
According to the second National Climate Change Programme adopted in 2002 and the latest projections, Greece will comply with its Kyoto Protocol target for the first commitment period by existing implemented and adopted policies and measures, and by the implementation of the EU‐ETS without the additional use of JI/CDM credits.
JI and CDM credits are, however, expected to be used in the EU‐ETS sector. According to the National Allocation Plan 2008‐2012, installations may use credits from these two mechanisms in an amount equalling up to 9% of their allocated allowances.
CRITIQUE
Under the EU Burden‐Sharing Agreement related to the Kyoto Protocol, Greece must limit its average annual GHG emissions in 2008‐2012 to 25% above the base year level. Largely because of strong economic growth, the emissions increased substantially until
2007. However, Greece looks set to reach its Kyoto target with existing policies and measures, in part because the economic downturn has led to further decreases in emissions. The IEA acknowledges Greece’s success in abiding by its Kyoto target and encourages the government to continue to monitor compliance towards the Kyoto target.
Beyond 2012, Greece’s GHG target for 2020 is ‐4% from the 2005 level for the non‐ETS sector, while the ETS sector has a ‐21% target from 2005 to 2020. As required under EU legislation, Greece has adopted and is implementing national action plans on renewable energy and energy efficiency to meet its GHG 2020 goal. The Ministry of Environment, Energy and Climate Change is ideally positioned to increase momentum for more effective co‐operation and co‐ordination in implementing these plans.
The main contribution to reducing energy‐related CO2 emissions is likely to come from measures on renewable energy, fuel switching and energy efficiency. The government should focus on cost‐effectiveness and prioritise economic instruments when incorporating these measures into a coherent whole. Building on the momentum for green growth under the current government and capitalising on the many planned policies and measures on renewable energy and energy efficiency, the government could consider aiming at more ambitious GHG reductions than obliged by the EU, as this would more easily help Greece meet the more ambitious targets that will be required beyond 2020.
RECOMMENDATIONS
The government of Greece should:
Implement the action plans on energy efficiency and renewable energy to reach the 2020 targets.
Consider more ambitious targets for limiting energy‐related GHG emissions in the non‐ETS sector.
Continue to monitor development towards the 2012 targets.
Energy use per capita: 2.4 toe (OECD average: 4.4), ‐3.5% from 2000
Energy intensity: 0.11 toe per 1 000 USD (OECD average: 0.16), ‐21.1% from 2000
Total final consumption: transport sector 41%, residential 24%, industry 21%, services and agriculture 15% (OECD average: transport 33%, industry 31%, residential 20%, other 16%)
FINAL CONSUMPTION OF ENERGY
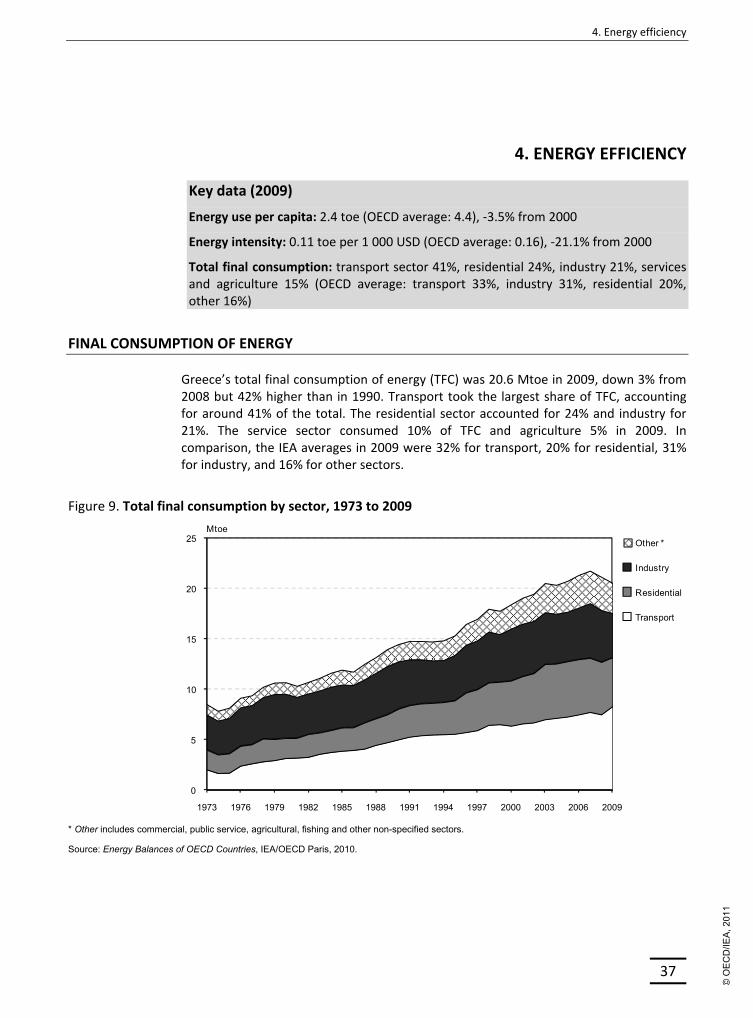
Greece’s total final consumption of energy (TFC) was 20.6 Mtoe in 2009, down 3% from 2008 but 42% higher than in 1990. Transport took the largest share of TFC, accounting for around 41% of the total. The residential sector accounted for 24% and industry for 21%. The service sector consumed 10% of TFC and agriculture 5% in 2009. In comparison, the IEA averages in 2009 were 32% for transport, 20% for residential, 31% for industry, and 16% for other sectors.
Figure 9. Total final consumption by sector, 1973 to 2009
Since 1990, TFC in Greece has increased in all sectors (see Figures 9 and 10), driven by strong economic growth to 2008. Reflecting the economic downturn, however, TFC fell from 2008 to 2009. The sectoral breakdown of TFC has changed in a manner typical to developed economies. Industry has seen its share decline from one‐third to less than a quarter, while the residential and service sectors have increased their share of the total. The share of transport in TFC has remained stable from 1990 to 2008.
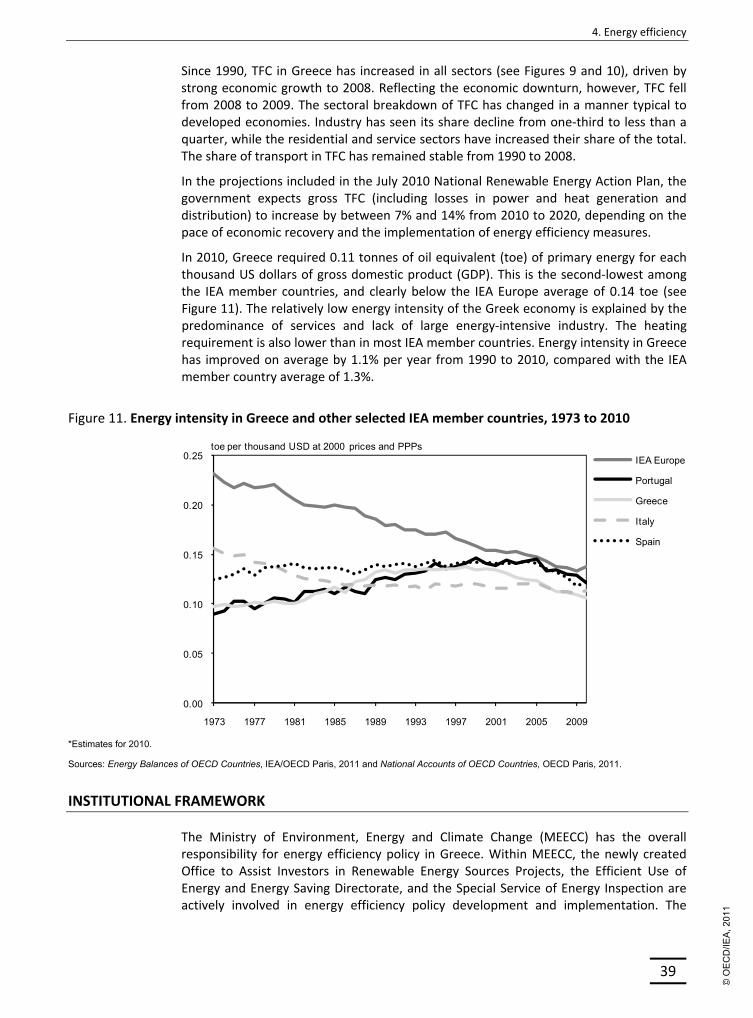
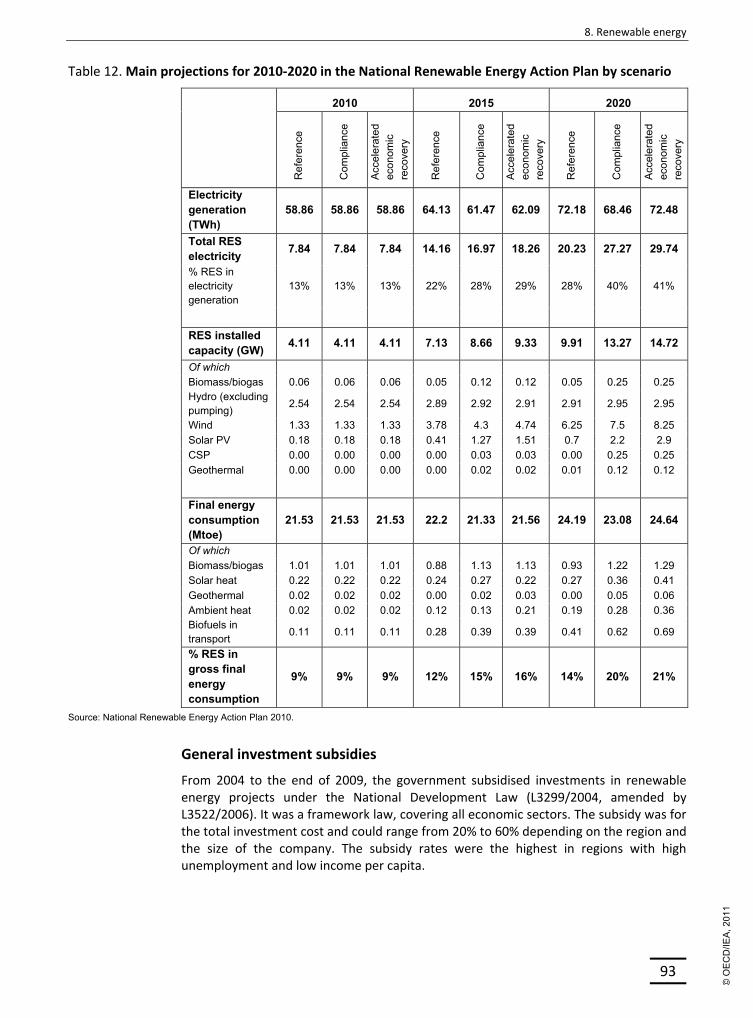
In the projections included in the July 2010 National Renewable Energy Action Plan, the government expects gross TFC (including losses in power and heat generation and distribution) to increase by between 7% and 14% from 2010 to 2020, depending on the pace of economic recovery and the implementation of energy efficiency measures.
In 2010, Greece required 0.11 tonnes of oil equivalent (toe) of primary energy for each thousand US dollars of gross domestic product (GDP). This is the second‐lowest among the IEA member countries, and clearly below the IEA Europe average of 0.14 toe (see Figure 11). The relatively low energy intensity of the Greek economy is explained by the predominance of services and lack of large energy‐intensive industry. The heating requirement is also lower than in most IEA member countries. Energy intensity in Greece has improved on average by 1.1% per year from 1990 to 2010, compared with the IEA member country average of 1.3%.
Figure 11. Energy intensity in Greece and other selected IEA member countries, 1973 to 2010
0.00
0.05
0.10
0.15
0.20
0.25
1973 1977 1981 1985 1989 1993 1997 2001 2005 2009
IEA Europe
Portugal
Greece
Italy
Spain
toe per thousand USD at 2000 prices and PPPs
*Estimates for 2010.
Sources: Energy Balances of OECD Countries, IEA/OECD Paris, 2011 and National Accounts of OECD Countries, OECD Paris, 2011.
INSTITUTIONAL FRAMEWORK
The Ministry of Environment, Energy and Climate Change (MEECC) has the overall responsibility for energy efficiency policy in Greece. Within MEECC, the newly created Office to Assist Investors in Renewable Energy Sources Projects, the Efficient Use of Energy and Energy Saving Directorate, and the Special Service of Energy Inspection are actively involved in energy efficiency policy development and implementation. The
Centre for Renewable Energy Sources and Saving (CRES), under the supervision of MEECC, promotes renewable energy and energy efficiency at the national level, facilitates national energy planning, assists in the formulation of energy policies and is involved in the development of R&D activities. It is also developing a national information system for monitoring and evaluating energy efficiency measures. The Ministry for Infrastructures, Transport and Networks and the Ministry of Economy also have strong energy efficiency mandates
POLICIES AND MEASURES
NATIONAL ENERGY EFFICIENCY ACTION PLAN
Greece’s energy efficiency policy is laid out in the National Energy Efficiency Action Plan (NEEAP), published in June 2008. The NEEAP, an obligation under the EU Directive on Energy End‐use Efficiency and Energy Services (2006/32/EC), sets out measures to reduce final energy consumption by 9% from the annual average of 2001‐2005 to 2016. According to the NEEAP, the transport sector holds the greatest saving potential, at 36% of the total required savings. The service and residential sectors come next, with potential savings of 30% and 29% respectively. The following is a list of measures by sector outlined in Greece’s NEEAP.
Transport measures
Reshaping the public transport system;
Transport infrastructure projects;
Development of urban mobility plans;
Promotion of economical, safe and eco‐driving;
Incentives for the replacement of old medium and heavy‐duty vehicles (over 3.5 tonnes and over 10 years old);
Incentives to replace old private vehicles and to promote the use of energy‐efficient vehicles;
Eco‐labelling (energy labels for cars);
Compulsory quotas of vehicles with greater energy efficiency in the fleets of the public services and of public bodies;
Linking vehicle taxation to energy efficiency and CO2 emissions.
Tertiary measures
Private sector
Compulsory installation of central solar thermal systems in tertiary sector buildings of over 1 000 m2;
Promotion of voluntary agreements for energy upgrading interventions in service‐sector buildings.
Compulsory installation of central solar thermal systems to meet water‐heating requirements;
Compulsory procurement procedures with respect to public buildings (green procurement – energy‐efficient and renewable energy technologies);
Integrated energy planning by municipalities;
Compulsory replacement of all lighting units with low energy efficiency in the public sector.
Household sector
Energy upgrading of residential building shells;
Financial aid for the upgrading of heating system boilers/burner units in existing buildings;
Compulsory installation of central solar thermal systems in new residential buildings and financial incentives for further penetration of small‐scale solar thermal systems in residential buildings;
Energy upgrading of social housing buildings.
Industry
Incentives relating to the obligatory implementation of energy management systems (EMS) in industry;
Creation of energy and environment management centres in business parks;
Programme of voluntary agreements in industry;
Energy services for energy savings.
Horizontal measures
Formation of a unit to collect energy data and forecasts;
Targeted education campaigns, provision of information and rewarding of “good practices”;
Programmes to provide financial support for investment in energy‐saving technologies and research.
Cross‐sectoral measures
Energy performance of buildings;
Further promotion of the integration of natural gas and liquefied petroleum gas (LPG);
Energy labelling of appliances and minimum energy efficiency requirements;
Implementation of an energy management system (EMS) in the service and public sectors;
Energy upgrading of existing buildings through third‐party financing (TPF) arrangements, energy performance contracting (EPC) and public‐ and private‐sector joint ventures (PPJV);
Installation of electronic and intelligent metering of electricity and natural gas consumption;
Promotion of cogeneration of heat and power (CHP) and district heating systems.
According to Greece’s NEEAP, the successful implementation of these energy efficiency improvement measures across all sectors could reduce TFC by at least 18.6 TWh (1.6 Mtoe) in 2016 from the annual average of 2001‐2005.
EUROPEAN UNION REQUIREMENTS
Many of the measures outlined in Greece’s NEEAP are required in compliance with EU legislation. The following EU regulations and directives guide much of Greece’s energy efficiency policy:
The Directive on Energy End‐use Efficiency and Energy Services (2006/32/EC) seeks to encourage energy efficiency through the development of a market for energy services and the delivery of energy efficiency programmes and measures to end‐users. This directive stipulates how energy actors, institutions and markets function. As mentioned above, the directive requires member states to create strategies, action plans and indicative targets. It also sets the framework for measures such as financing, metering, billing, promotion of energy services, and obligations for the public sector. In addition, it requires member states to place energy efficiency obligations on energy distributors or retailers.
The Energy Performance of Buildings Directive (EPBD, 2002/91/EC) sets requirements for energy efficiency in building codes, including minimum energy performance standards and energy certificates. A recast of the EPBD (2010/31/EU) was adopted in May 2010 to strengthen the energy performance requirements and to clarify and streamline some provisions.
Requirements for energy labelling of household appliances are based on several directives adopted over the past 15 years which also include compulsory minimum energy efficiency requirements (2009/125/EC). These requirements have expanded in Greece and in other EU member states, and will continue to expand to new product groups. A recast of the Labelling Directive (2010/30/EU), adopted in May 2010, will gradually extend labelling from household appliances to energy‐related products in general. The recast Directive Establishing a Framework for Setting Ecodesign Requirements for Energy‐related Products (Ecodesign, 2009/125/EC) aims to improve energy efficiency throughout a product’s life cycle. It applies to products that use energy and to products that have an impact on energy use, such as building components.
Several recent EU transport policy developments aim to reduce CO2 emissions from new passenger cars. In May 2009, the EU adopted Regulation EC/443/2009 to reduce CO2 emissions from new passenger cars to reach a fleet average of 130 g CO2 per km by 2015. From 2020 on, this limit will be 95 g CO2 per km. The regulation will be complemented by measures to further cut emissions by 10 g CO2 per km.
Complementary measures include efficiency improvements for car components with the highest impact on fuel consumption, and a gradual reduction in the carbon content of road fuels.
Another EU transport development is related to tyre labelling requirements. Regulation EC/1222/2009 of November 2009 seeks to harmonise information on the energy performance of tyres, wet braking and external rolling noise. It will apply to EU member states, including Greece, as from November 2012.
The EU‐ETS has a strong influence on energy efficiency in heavy industry and the heat and power sector. In addition to the 9% reduction target by 2016 outlined in its NEEAP, Greece and other EU27 countries have agreed to lower energy use by 20% by 2020 from the baseline.
As explored in more detail in Chapter 8 on renewable energy, Greece will also have to meet a binding EU target for the share of renewable energy in gross total final energy consumption by 2020. Law L3851/2010 sets a national target for renewable energy sources (RES) in Greece’s gross TFC at 20%, almost triple the level in 2005. Energy efficiency improvements will thus be very important to increasing the share of renewable energy in terms of final energy consumption.
Since the last IEA in‐depth review in 2006, Greece has enacted new legislation aiming to enhance energy efficiency. The following sections will outline the main energy efficiency legislation by sector.
TRANSPORT
Private cars are the dominant form of passenger travel in Greece (see Table 6). Traffic volume by passenger cars almost tripled from 1990 to 2008, the EU Commission estimates. Bus use is estimated to have increased by a quarter, and tram and metro use to have doubled during that period. In contrast, railway use for passenger transport decreased by 16% from 1990 to 2008, mostly in the wake of the economic downturn from 2007 on.
Greece now has 3.2 million more registered passenger cars than in 1990. Car density has increased from 170 in 1990 to 446 per 1 000 residents in 2008, slightly less than the EU15 average of 501. Over the same period, the Greek road network has expanded, but the country’s motorway density remains at a rather low 8 km per 1 000 km2 of area, versus an average of 15 km in the EU15. The length of the country’s railways has grown by 3% since 1990. Only 10% of the 2 552‐km railway network is electrified, versus 55% in the EU15, but work on electrifying more lines is being carried out.
Table 6. Modal split of passenger land transport, 2008
Car Bus Train Tram and metroShare, % 79.7 17.6 1.3 1.3
Source: EU Energy and Transport in Figures – Statistical Pocketbook 2010.
Freight is mostly transported by road, and the number of goods vehicles has increased from 766 000 in 1990 to 1 290 000 in 2008. International haulage accounted for 16% of all haulage by heavy‐duty vehicles registered in Greece in 2008. Freight volumes are closely linked to developments in the overall economy and are currently declining.
Since the last in‐depth review, the Greek government has put in place several instruments to support hybrid, electric and hydrogen privately owned passenger cars. For example:
Law 3855/2010 on measures to improve energy efficiency in end‐use, energy services and other provisions, provides the definition of technical specifications for energy‐efficient vehicles, the share of clean vehicles, the replacement of old vehicles, public procurement based on fuel economy labelling, and training on eco‐driving for public sector employees.
Law 3831/2010 requires passenger cars to be placed into one of four classes (A, B, C and D) according to engine size and technology. Class A corresponds to new technologies in EURO4, 5 and higher. Owners pay annual circulation taxes according to vehicle class. Privately owned hybrid, electric, and hydrogen passenger cars in classes A and B with cylinder capacity lower than 1 929 are exempt from annual circulation taxes. For A and B class hybrid, electric or hydrogen vehicles with a cylinder capacity higher than 1 929, the relevant circulation taxes are cut in half. Article 121(5) of Law 2960/2001 continues to exempt hybrid and other low‐emission vehicles from the registration tax.
Joint Ministerial Decision B'1720/19.08.2009 excludes all hybrid vehicles from the traffic restrictions imposed in the city of Athens.
Public transport
The Greek government has made significant investments in public transport infrastructure since the last in‐depth review. The Athens metro network has expanded with extensions to line 3 and several new stations. In Thessaloniki, a new metro line is under construction. A suburban railway in the Greater Athens has started operating. Suburban railway operates in the Thessaloniki‐Larissa route, and another is being planned for the Xanthi‐Alexandroupolis route.
Eco‐driving
Along with eight other European Union member states Greece participated in the ECODRIVEN project which received support from the European Commission through the Intelligent Energy Europe programme. The overall goal of ECODRIVEN was to help drivers optimise their driving behaviour for safety and energy efficiency. Participating countries could tailor the specific activities of the campaign. In Greece, the ECODRIVEN project involved pilot programmes on eco‐driving training as well as a two‐stage promotion campaign. As a result of the programmes, the Ministry of Transport announced in 2008 that, from January 2009, eco‐driving will be part of the training and test procedure to obtain a driver’s licence.
Eco‐driving training is now being offered through CRES’ involvement in EU‐funded pilot projects such as INTERACTION, TRAINER and FLEAT. Through these pilot projects, drivers of heavy‐duty vehicles, trains and large fleets such as electric buses are receiving eco‐driving training.
A law to transpose Directive 2009/33/EC on the promotion of clean and energy‐efficient road transport vehicles has been drafted. It requires contracting authorities, contracting entities as well as certain operators to take into account lifetime energy and environmental impacts, when purchasing road transport vehicles.
There are several recent laws to promote energy efficiency in the buildings, appliances and lighting sectors.
Law 3661/2008 on measures for the reduction of energy consumption in buildings transposes the EPBD Directive 2002/91/EC. Law 3661/2008 outlines minimum requirements for energy efficiency in new and existing buildings and defines the methodology for the calculation of energy consumption in buildings. Energy performance certificates are required in all new buildings, for all renovated buildings over 1 000 m2 and for all existing buildings when sold or rented. The law also requires that passive solar systems, as well as heating/cooling/electricity production systems that utilise RES and CHP, must be considered in the heating/cooling specification study submitted in the licensing procedure of buildings.
The law is implemented through secondary legislation, namely the Joint Ministerial Decision D6/B/5825/20.04.2010 (Official Gazette B’ 407), “Endorsement of Energy Performance Buildings Regulation”, issued in April 2010, regulates the issues of energy certificates for public and private buildings, the minimum energy efficiency requirements for new buildings and for existing buildings exceeding 1 000 m2 undergoing major renovation, as well as the regular inspection of boilers and air‐conditioning systems. More specifically it determines:
the calculation methodology of the energy performance of buildings in order to evaluate the energy consumption of buildings for heat, ventilation and air‐conditioning (HVAC), lighting for the tertiary sector and hot water (HW);
the minimum energy performance requirements and the classification of buildings according to their energy performance;
specifications for bioclimatic architectural design, the thermal properties of the structural elements in the building envelope and the installation of electro/mechanical systems;
the content of buildings energy performance study;
the format and content of the energy performance of buildings certificates;
the energy audit procedure and the procedure of regular inspection for boilers, heating and air‐conditioning systems.
Article 10 of the Law 3851/2010 (Official Gazette A’ 85) extends the scope of the Law 3661/2008 and imposes:
minimum energy efficiency requirements for existing buildings exceeding 50 m2
undergoing a major renovation;
the submission to the town planning authorities of a technical study on environmental and financial feasibility of installing at least one alternative system for energy supply for all new buildings;
60% coverage in hot water needs, by equipping all new buildings with a solar energy water‐heating system after 1 January 2011.
Article 6 of the Law 3818/2010 (Official Gazette A’ 17), issued in February 2010, provides for the establishment of the Special Service of Energy Inspectorate, with the scope to control and follow up the procedure of issuing energy performance
certificates, the work of the energy auditors of buildings, boilers and air‐conditioning systems and to establish the energy auditors registry.
The Presidential Decree 72/2010 (Official Gazette A’ 132), issued in August 2010, provides the constitution, the administrative and organisational structure and the recruitment procedure of the Special Service of Energy Inspectorate established by Law 3818/2010.
The Presidential Decree 100/2010 (Official Gazette A’ 177) “Energy Auditors Register”, issued in October 2010, provides the conditions and the requirements for the registration and certification of energy auditors.
The “Energy Efficiency at Home” programme provides subsidies for low‐income families to improve the insulation of their homes, place thermal insulation into window recess and door‐frames, replace inefficient burner/boiler systems and install solar energy water‐heaters. Eligible houses must have been built before 1990, cost less than EUR2 100 per m2 and have an energy efficiency certificate, The programme is co‐funded by the 4th Community Support Framework 2007‐2013 and started in February 2011. The total budget is EUR 396 million.
The programme “Building the Future” 2011‐2020 aims at reducing the total building energy consumption and increasing the level of environmental protection by using financial instruments and market mechanisms, such as Energy Performance Contracts, Industrial and Commercial Voluntary Agreements, Energy Service Companies (ESCOs) and White Certificates.
The programme Green Tourism provides subsidies for energy efficiency and environmental protection and awareness for investments in buildings in the tourist sector (hotels, accommodation units and complexes). The subsidies range from EUR 15 000 to EUR 400 000 and may cover up to 40%‐45% of the total investment. The programme is co‐funded by the 4th Community Support Framework, 2007‐2013.
A call for proposals to the Centre for Renewable Energy Sources under the EU Operational Programme “Environment and Sustainable Development” for “actions and measures in energy efficiency and rational use of energy” runs from 10 January 2011 to 31 December 2011.
MEASURES IN THE PUBLIC SECTOR
Energy efficiency in the public sector has been promoted by a number of Joint Ministerial Decisions (JMD). JMD OG 1122/Β/2008 includes measures to improve energy efficiency and energy saving in the public sector. Other JMDs (14826/B/2008) relate to reactive power in electrical installations; obligation to connect to the natural gas networks; replacement of all inefficient incandescence and fluorescence lamps with fluorescent lamps (class A or B); and the preventive maintenance of air‐conditioning installations at least once per year. The JMDs also regulate minimum efficiency performance standards (MEPS) in public procurement and the designation of energy officers in all public buildings.
Law 3855/2010 on measures to improve energy efficiency in end‐use, energy services and other provisions, transposes Directive 2006/32/EC into national law. Article 8 of this law concerns energy efficiency measures in the public sector and outlines specific measures to improve the energy efficiency performance and energy
savings in public buildings. Article 16 outlines the energy performance contracting framework for the establishment of a market for energy service companies (ESCOs) through Energy Performance Contracts.
Article 10(4) of Law 3851/2010 on accelerating the development of renewable energy sources to deal with climate change and other regulations in topics under the authority of MEEC stipulates that after 31 December 2014, all new buildings that accommodate public‐sector services must cover their primary energy consumption through energy supplied from RES, CHP, district heating and heat pumps. Moreover, all new building construction or major renovation require a full energy analysis study that includes energy conservation and cost‐benefit analysis of the use of RES cogeneration, district heating, and heat pump systems.
The national programme “Exoikonomo” (“Save Energy”) helps municipalities with more than 10 000 inhabitants develop plans to reduce GHG emissions. It also provides subsidies for energy efficiency measures in municipal buildings and transport. The total budget is EUR 100 million, funded 70% from public finances. The total number of eligible municipal proposals is 191 with a budget of around EUR 162 million. The programme is implemented through the EU Operational Programme “Competiveness and Entrepreneurship” and supported from the 4th Community Support Framework (NSRF) 2007‐2013.
APPLIANCES
Mandatory energy labelling of household appliances is based on EU directives that cover lamps, ovens, refrigerators, freezers, washing machines, tumble‐dryers and dishwashers. Appliances are classified from A to G, where class A is for the most energy‐efficient appliances. In 2004, two new classes were introduced: compared to class A, electricity use in class A+ is 25% lower and in class A++ 40% lower. The mandatory labelling requirement will be expanded to cover commercial and industrial appliances and also energy‐related appliances, following the adoption of the recast of the 1992 Labelling Directive in May 2010. These new requirements will become effective gradually. A recast of the Energy Labelling Directive (2010/30/EU) was adopted by the European Parliament and the Council in May 2010. The directive establishes a framework for the harmonisation of national measures on end‐use information, particularly by means of labelling and standard product information, on the consumption of energy and, where relevant, of other essential resources during use. The new directive should be adopted by the end of June 2011.
Greece adopted in May 2010 the Presidential Decree 32/2010 to implement measures for energy‐using products to be placed on the market and/or put into service. This decree, along with the amendment of the Presidential Decrees 335/1993 and 178/1998 and the Joint Ministerial Decision D6/B/17682/2001, transposes into national law the requirements set under the Ecodesign Directive (2005/32/EC).
Greece has also prepared a draft Presidential Decree “Establishing a framework for the setting of eco‐design requirements for energy–related products” in order to transpose Directive 2009/125/EC into national law and to amend the Presidential Decree 32/2010. The draft decree would extend the scope of application of Presidential Decree 32/2010 to include all energy‐related products. It introduces the
issue of implementing measures for all energy‐related products to be placed on the market and/or put into service.
In the coming years, minimum energy performance standards will be introduced in Greece and other EU member states for several groups of appliances, but also for other products that have an impact on energy use. These standards will be set by EU regulations based on the recast Ecodesign Directive (2009/125/EC).
From June 2009 to August 2009, the Greek government ran the “Changing air‐conditioners” programme. Under this programme, a 35% purchase price subsidy (up to EUR 500) was provided for the replacement of old energy‐intensive domestic air‐conditioners. Around 140 000 air‐conditioners were replaced with new ones with inverters and class A to A++ ratings. All replaced air‐conditioners were recycled. The European Regional Development Fund (ERDF) provided partial funding for this EUR 45 million project.
INDUSTRY
The EU Emissions Trading System, started in 2005, is the primary mechanism to improve energy efficiency in the industrial sector. The Operational Programme for Competitiveness (OPC) and the Law 3299/04 on “Private Incentives for Economic Development and Regional Convergence” provide subsidies to industrial and service sector enterprises for energy efficiency and renewable energy investments.
The new investment law on “Private Investments Support for Economic Development, Entrepreneurship and Regional Convergence” provides subsidies and tax allowances for energy efficiency investments. As of May 2011, the law was still to be enacted.
CRITIQUE
Policy framework
Greece has made progress in implementing the IEA's recommendations for energy efficiency set out in the 2006 in‐depth review. One notable example is the development of its National Energy Efficiency Action Plan (NEEAP), published in June 2008. The IEA encourages the government's efforts to improve data collection and analysis and urges increased co‐ordination and implementation of measures in support of the NEEAP.
Several measures to help meet the energy savings goals outlined in the NEEAP are under way. For example, from June to August 2009, Greece conducted the Replace Air‐conditioning Appliances Programme. The IEA encourages quick implementation of planned programmes such as Energy Efficiency at Home and Saving Energy. A third party should evaluate these and other programmes at their completion.
Several ministries carry mandate to implement and design energy efficiency policy. It is essential to co‐ordinate policy planning, research and implementation across these bodies, including MEECC, CRES, the Ministry for infrastructures, Transport and Networks and the Ministry of Economy, for Greece to achieve the energy savings goals outlined in its NEEAP.
The government’s efforts to put in place a legal framework for energy efficiency are guided by requirements outlined by EU legislation. The country adopted in 2010 a Presidential Decree that transposed into national law the Ecodesign Directive (2005/32/EC). Greece has also adopted Law 3855/2010, transposing the Energy Services Directive (2006/32/EC). This law outlines specific energy performance measures for public‐sector buildings and sets the framework for establishing a Greek ESCO market through Energy Performance Contracts. The IEA encourages this work to provide institutional and financial frameworks to improve energy end‐use efficiency and develop and promote a market for energy services.
Energy efficiency in the public sector has been promoted by a number of Joint Ministerial Decisions. Timely implementation and enforcement of these decisions will be critical to Greece improving its energy efficiency.
Greece has set up a Special Service of Energy Inspection that will monitor and control the implementation of energy efficiency measures in buildings and will manage the energy auditors registry and buildings’ auditing and inspection archives. The IEA reiterates the importance of enforcement and encourages adequate resourcing and mandate for bodies performing this function.
Buildings
Greece's Law 3661/2008 transposes the EPBD Directive (2002/91/EC). To provide the enabling mechanisms to implement this law, the government has passed the Energy Performance of Buildings decision and has adopted a Presidential Decree concerning energy auditors. The IEA congratulates the government for this legislation. The IEA also encourages the government to work on the new provisions outlined in the recast EPBD Directive 2010/31/EU.
Greece should continue to prioritise the implementation of energy savings measures in the buildings sector according to cost‐effectiveness and potential energy savings. Once enabling legislation is in place, the government should consider supporting technologies such as heat pumps that can provide great savings in this sector.
Transport
In its 2008 National Energy Efficiency Action Plan, Greece identified transport as the sector holding the greatest energy saving potential. The IEA has made four recommendations regarding energy efficiency in this sector. As of March 2009, Greece was planning to implement three of these recommendations. As of May 20106, they were being implemented in Greece and in other EU member states thanks to new EU directives and regulations for tyres, fuel efficiency standards and eco‐driving.
Road transport demand has grown strongly. The IEA commends the progress Greece has made since the 2006 in‐depth review to manage traffic and improve and promote the public transport network. This work should be continued and intensified. As in most IEA countries, transport relies on imported oil used in inefficient internal combustion engines. Changing this is easier said than done, but would undoubtedly help save energy, avoid congestion, improve air quality and increase oil security.
6. See IEA (2010), Transport Energy Efficiency, Implementation of IEA Recommendations since 2009 and next steps, www.iea.org/papers/2010/transport_energy_efficiency.pdf
In the industry sector, Greece should consider providing assistance in the development of energy management (EM) capabilities through the development and maintenance of EM tools, training, certification and quality assurance. It should also consider encouraging major industrial energy users to adopt comprehensive EM procedures and practices. Regarding motors, in line with international best practice, Greece could adopt mandatory minimum energy performance standards for electric motors, while abiding by the rules of the EU internal market.
The National Development Law 3299/2004 (amended by Law 3522/2006) includes economic policies to stimulate energy efficiency in industry not covered by the EU‐ETS. The IEA encourages the government to continue to provide financial incentives for the development of energy‐efficient industry, especially policies and measures to promote energy efficiency in small and medium‐sized enterprises (SMEs).
Cross‐sectoral
The government has carried out awareness campaigns to promote demand‐side management. It should also encourage the operation of energy service companies that offer demand‐side management services to residential, commercial and industrial consumers. Considering that electricity tariffs will likely increase in the following years, there is a need to increase energy savings across all demand‐side sectors.
Finally, Greece should continue its efforts to fully implement the IEA recommendations for improving energy efficiency (see Box 2).
Box 2. IEA 25 energy efficiency recommendations
To support governments with their implementation of energy efficiency, the IEA recommended the adoption of specific energy efficiency policy measures to the G8 summits in 2006, 2007 and 2008. The consolidated set of recommendations to these summits covers 25 fields of action across seven priority areas: cross‐sectoral activity, buildings, appliances, lighting, transport, industry and power utilities. The fields of action are outlined below.
1. The IEA recommends action on energy efficiency across sectors. In particular, the IEA calls for action on:
Measures for increasing investment in energy efficiency;
National energy efficiency strategies and goals;
Compliance, monitoring, enforcement and evaluation of energy efficiency measures;
Energy efficiency indicators;
Monitoring and reporting progress with the IEA energy efficiency recommendations themselves.
2. Buildings account for about 40% of energy used in most countries. To save a significant portion of this energy, the IEA recommends action on:
Box 2. IEA 25 energy efficiency recommendations (continued)
Passive energy houses and zero‐energy buildings;
Policy packages to promote energy efficiency in existing buildings;
Building certification schemes;
Energy efficiency improvements in glazed areas.
3. Appliances and equipment represent one of the fastest growing energy loads in most countries. The IEA recommends action on:
Mandatory energy performance requirements or labels;
Low‐power modes, including stand‐by power, for electronic and networked equipment;
Televisions and set‐top boxes;
Energy performance test standards and measurement protocols.
4. Saving energy by adopting efficient lighting technology is very cost‐effective. The IEA recommends action on:
Best‐practice lighting and the phase‐out of incandescent bulbs;
Ensuring least‐cost lighting in non‐residential buildings and the phase‐out of inefficient fuel‐based lighting.
5. About 60% of world oil is consumed in the transport sector. To achieve significant savings in this sector, the IEA recommends action on:
Fuel‐efficient tyres;
Mandatory fuel efficiency standards for light‐duty vehicles;
Fuel economy of heavy‐duty vehicles;
Eco‐driving.
6. In order to improve energy efficiency in industry, action is needed on:
Collection of high‐quality energy efficiency data for industry;
Energy performance of electric motors;
Assistance in developing energy management capability;
Policy packages to promote energy efficiency in small and medium‐sized enterprises.
7. Energy utilities can play an important role in promoting energy efficiency. Action is needed to promote:
Utility end‐use energy efficiency schemes.
Implementation of IEA energy efficiency recommendations can lead to huge cost‐effective energy and CO2 savings. The IEA estimates that, if implemented globally without delay, the proposed actions could save around 8.2 Gt CO2 per year by 2030. This is equivalent to twice the European Union’s current yearly emissions. Taken together, these measures set out an ambitious road‐map for improving energy efficiency on a global scale.
Strengthen the co‐ordination of policy planning, implementation, monitoring and verification across ministries and agencies in support of Greece's National Energy Efficiency Action Plan.
Continue to develop and apply energy efficiency legislation that creates enabling mechanisms with a focus on policy implementation.
Continue to improve the collection of high‐quality data on energy efficiency.
Accelerate programme implementation, especially in the buildings sector, prioritising policies with high energy savings potential and cost‐effectiveness.
Encourage energy service companies to offer energy management services to residential, commercial and industrial consumers.
Continue to encourage the use of public transport and low‐emission vehicles through market‐based mechanisms.
Oil products: refinery output 462 kb/d, net exports: 66 kb/d
Share of oil: 52% of TPES and 13% of electricity generation
Inland consumption: 15.8 Mt or 410 kb/d in 2009 (transport 52%, residential 14%, industry 13%, transformation sector 12%, other 9%)
Consumption per capita: 1.2 t (OECD average: 1.7 t)
SUPPLY AND DEMAND
SUPPLY
Oil remains the dominant energy source in Greece. In 2010, at 14 Mtoe, it accounted for 52% of the country’s total primary energy supply (TPES). The share of oil in TPES has been relatively stable, ranging from 52% to 58% for the past two decades, and remains substantially higher than the IEA average (36% in 2010). In absolute terms, oil supply has grown very slowly for the past few years. It declined by 4% in 2009 and 11% in 2010, mainly reflecting the general conditions of the country’s economy.
Greece imports practically all the oil it needs. Oil imports in 2010 were 546 thousand barrels per day (kb/d), consisting of 411 kb/d crude oil, 22 kb/d ,natural gas liquids (NGLs) and feedstock, and 131 kb/d refined products. OPEC countries such as Iran, Libya and Saudi Arabia, and the former Soviet Union (FSU) have been major import sources of crude oil. Greece reduced its crude oil import dependence on OPEC countries from 71% in 2004 to 49% in 2010, with Saudi Arabia’s share dropping from 31% in 2004 to 12% in 2010. In contrast, the country increased its reliance on the FSU for crude oil from 29% in 2004 to 47% in 2010. By country, Russia was the largest supply source of crude oil in 2010 (38% of the total), followed by Libya (15%), Iran (14%), Saudi Arabia (12%), Kazakhstan (10%) and Iraq (9%).
In 2010, roughly 40% of the refined product imports came from OECD countries, mainly from OECD Europe, while some 22% was supplied from Russia. Greece exported 17 kb/d of crude oil in 2010, exclusively to the former Yugoslav Republic of Macedonia (FYROM). Greece increased its oil product exports by 57% from 102 kb/d in 2004 to 144 kb/d in 2009. It is a net exporter of gasoline.
Greece has some small reserves of crude oil, but indigenous oil production remains very low, 2.3 kb/d in 2010. Oil is produced from the Prinos offshore oilfield in the Kavala Gulf
in the northern Aegean Sea. The government expects oil production to increase to 4 kb/d, if new investment is made for exploration of a detected potential oilfield.
DEMAND
Greece’s oil demand increased from 399 kb/d in 2000 to 450 kb/d in 2007, or 1.7% per year. However, since peaking in 2007, oil demand decreased to 434 kb/d in 2008 and to 374 kb/d in 2010 (see Figure 12).
Figure 12. Oil consumption by product, 1996 to 2010
0
50
100
150
200
250
300
350
400
450
500
1996 1998 2000 2002 2004 2006 2008 2010
Other
Residual fuels
Other gasoil
Diesel
Jet and kerosene
Motor gas
Naphtha
LPG and ethane
Thousand barrels per day
Source: Energy Statistics of OECD Countries, IEA/OECD Paris, 2011.
The transport sector consumed 46% of Greece’s total oil demand in 2008. This share has remained fairly stable over the last decade and increased to 52% in 2009 (see Figure 13). Power generation consumed 17%, households and industry each accounted for around 13% of the total, while the remaining 10% was consumed by the service and agriculture sectors. The government is granting households subsidies to switch from oil heating to gas boilers and renewable energy technologies. The subsidies on electricity generation from renewable sources will, in turn, help reduce oil use for power generation. In 2009, oil accounted for around 13% of electricity generation in Greece (see Chapter 9 on electricity).
In terms of oil demand by product, demand for motor gasoline increased by 24% from 2000 to 2009 and decreased by 6% in 2010. Demand for diesel decreased by 32% from 2000 to 2010. To limit air pollution, the government has prohibited many years ago the use of diesel vehicles in Athens and Thessaloniki, the country’s two largest cities. However, vocational vehicles are excluded from this regulation.
Figure 13. Oil consumption by sector, 1973 to 2009
0%
10%
20%
30%
40%
50%
60%
70%
80%
90%
100%
1973 1978 1983 1988 1993 1998 2003 2008
Commercial/ agriculture/ other
Residential
Industry
Transformation/ energy
Transport
Source: Energy Statistics of OECD Countries, IEA/OECD Paris, 2010.
INFRASTRUCTURE
REFINING
There are four refineries in Greece, with a total crude distillation capacity of around 480 kb/d. Hellenic Petroleum owns the two refineries in the Athens area and one near Thessaloniki, equalling around two‐thirds of total capacity. The fourth refinery, owned by Motor Oil Hellas, is located in Corinth (see Table 7 and Figure 14).
In 2009, the four refineries processed around 21.5 million tonnes of crude oil (including natural gas liquids and feedstocks), delivering a capacity utilisation rate of almost 86%. Production included gas/diesel oil (30% of the total), residual fuel oil (28%), motor gasoline (19%) and liquefied natural gas (3%). Greece has a gas/diesel oil deficit which averaged 16 kb/d in 2009. This deficit, however, will be reduced by investments in upgrading refinery capacities.
STORAGE
On the basis of the IEA methodology for calculating emergency reserves, Greece’s daily net imports for 2009 were 45.29 thousand tonnes of crude oil equivalent (ktcoe). To meet the 90‐day stockholding commitment, some 4 080 ktcoe, or 28 to 35 million barrels of oil stocks are required, equalling 4.4 to 5.5 million cubic metres of oil storage capacity.7
7. The 90‐day commitment is 45.29 x 90 = 4 076 ktcoe. If P is the amount of product stock needed, this can be derived from (P x 1.2) x 0.9 = 4 076; this assumes the stocks are of four main product groups (thus a conversion of 1.2) and accounts for the 10% unavailable stocks adjustment. Conversion from tonnes to barrels uses a factor of 7.37.
At the end of 2009, Greece possessed a total storage capacity of 59.7 million barrels (9.5 million cubic metres) used for industrial operations and mandatory industry stocks. Crude oil storage accounted for some 30% of the country’s total storage capacity, roughly two‐thirds of which was owned by Hellenic Petroleum at the end of 2009. The remaining portions were held by Motor Oil (21.8%), PPS (6.6%), BP Hellas (1.6%), Mamid Oil (1.6%), Shell Hellas (1.2%) and other small operators.
Further improvement of energy efficiency and operational flexibility
De-bottlenecking distillation capacity and adding a 15 kb/d continuous catalytic reformer
Full conversion upgrade by adding a 40 kb/d hydrocracker and a 20 kb/d flexi-coker
Construction of a new 60 kb/d crude distillation unit
Year established 1958 1966 1972 1972
MTBE: methyl tertiary butyl ether.
Source: Ministry of Environment, Energy and Climate Change.
PIPELINES AND OTHER TRANSPORTATION
There are two oil pipelines in Greece. The first, a 220‐km, 16‐inch crude pipeline with a capacity of 50 kb/d (2.5 Mt per year), links the Thessaloniki port with the Octa refinery in the former Yugoslav Republic of Macedonia and is owned and operated by Hellenic Petroleum. The second, a 53‐km, 10‐inch JET A‐1 pipeline with a capacity of 42 kb/d, connects the Aspropyrgos refinery with Athens International Airport at Spata and is owned 50% by Hellenic Petroleum, 16% by Motor Oil Hellas, 17% by Athens Airport and 17% by Olympic Airlines. There are also pipelines connecting the Aspropyrgos refinery to nearby storage facilities owned by wholesale companies as well as to some military installations.
The construction of the 300‐km Burgas‐Alexandroupolis pipeline (BAP) was scheduled to start in 2011, but following the change of government in Bulgaria in mid‐2009, the project has now been delayed. Bulgaria is conducting an international environmental impact assessment of the project and, following that, will decide whether to support the project or not. To minimise the environmental impact, both the offshore and onshore sections of BAP are designed to be placed underground.
Running from the Bulgarian Black Sea port of Burgas to the Greek Aegean port of Alexandroupolis, the 0.7‐1 mb/d pipeline would be an alternative export route for Russian and Caspian oil by bypassing the Bosphorus Straits. The total tank farm capacity at Alexandroupolis is estimated to be around 7.5 million barrels. Under the intergovernmental agreement between Greece, Bulgaria and Russia, a project company, Trans‐Balkan Pipeline B.V., was established in February 2008. A Russian consortium holds 51% of its shares, a Bulgarian company 24.5%, a Greek consortium 23.5% and the government of Greece 1%.
Nearly all inland transportation of crude oil and refined products is by road and ship. The exceptions are jet fuels to the Athens airport, to some wholesale storage facilities and military installations, which are supplied by pipeline, and deliveries by rail to power plants and to the train company. Tank trucks have, however, been subject to a licence, and most of them are publicly owned. Restrictions in tank truck licensing and government‐controlled transportation fees have barred oil companies from managing their businesses as efficiently as possible. In November 2009, the Council of State deemed these restrictions illegal. The situation will be remedied by Law 3897/2010 whose Article 15 provides for a Joint Ministerial Decision to introduce framework conditions for private tank truck licensing.
PORTS
There are ten oil terminals in Greece. Seven of them are located in the Attica area (Athens) and three in the Salonica area. Six oil terminals (Aspropyrgos, Elefsis, Thessaloniki, Aghioi Theodori, Pachi [Megara) and Agia Trias) can receive imported crude oils. Four of them are located near the refineries.
To minimise the environmental impact, the Burgas‐Alexandroupolis crude oil pipeline project envisages that loading operations at the marine terminal in Alexandroupolis will be conducted using modern single‐point mooring installations.
MARKET STRUCTURE
Two companies operate in the Greek refining industry: Hellenic Petroleum has three refineries, at Aspropyrgos, Elefsis and Thessaloniki, while Motor Oil Hellas has one, at Korinthos. Hellenic Petroleum controls 72% of the wholesale market and Motor Oil Hellas controls the rest. The Greek government owns 35.5% of Hellenic Petroleum, but no shares in Motor Oil Hellas.
In 2009, there were 20 fuel trade companies operating in the retail market, the largest of which were EKO (a subsidiary of Hellenic Petroleum), Shell, BP, Avin Oil (100% subsidiary of Motor Oil) and Jet Oil (see Figure 15). Of the 8 200 gas stations in Greece, roughly 1 200 are owned by EKO, 1 200 by BP, 700 by Shell, 560 by Avin Oil, 580 by Jet Oil and 3 960 by other companies.
Greece has seen consolidation in the retail oil sector. In June 2009, Hellenic Petroleum announced the agreement to acquire BP’s Ground Fuels business in Greece. The deal includes BP’s nationwide network of branded service stations, storage facilities of 170 000 m3 (1.1 million barrels), as well as the commercial and industrial supply business. In September 2009, Motor Oil Hellas announced the agreement to acquire the majority of Shell’s activities in Greece, including 700 gas stations and storage depots of
137 000 m3 (0.9 mb). With these two acquisitions, Hellenic Petroleum’s retail sales represent some 28% of the market, while Motor Oil’s captures around 21%. The parliament adopted in December 2010 Law 3897/2010 which removes several restrictions on establishing petrol stations.
Figure 15. Breakdown of retail oil sales by company, 2009
EKO15%
Shell14%
BP13%
Jetoil9%
Aegean9%
Avin8%
Others32%
Source: Hellenic Petroleum.
PRICES AND TAXES
Compared with other IEA countries, gasoline and diesel prices in Greece are rather high, while heating oil is cheaper than the IEA average (see Figures 16 to 18). As part of the economic austerity programme, the government is increasing oil product taxation (see Figure 19).
Figure 16. IEA unleaded gasoline prices and taxes, second quarter 2011
50.8
%
58.
7%
59.3
%
54.8
%
54.
8%
58.
3%
56.7
%
55.7
%
59.
4%
56.4
%
53.
3%
51.6
%
53.2
%
52.
3%
48.
4%
54.
4%
48.
3%
48.2
%
51.1
%
47.
6%
39.9
%
35.4
%
30.0
%
12.6
%
0
0.5
1
1.5
2
2.5
3
USD/litre
Tax component
Note: data not available for Germany, Italy, Japan and Norway.
Source: Energy Prices and Taxes, IEA/OECD Paris, 2011.
Figure 17. IEA automotive diesel prices and taxes, second quarter 2011
41.2
%
57.8
%
50.8
%
47.9
%
46.5
%
48.2
%
46.8
%
48.4
%
47.8
%
47.2
%
45.0
%
45.2
%
43.7
%
47.8
%
49.0
%
49.1
%
42.5
%
44.5
%
40.5
%
38.
4%
34.1
%
13.3
%
13.1
%
0
0.5
1
1.5
2
2.5
3
USD/litre
Tax component
Note: data not available for Canada, Germany, Italy, Japan and Norway.
Source: Energy Prices and Taxes, IEA/OECD Paris, 2011.
Figure 18. IEA light fuel oil prices and taxes for households, second quarter 2011
49.3
%
44.
6%
40.7
%
35.
0%
33.7
%
20.6
%
28.3
%
25.1
%
27.4
%
22.
8%
16.7
%
25.2
%
21.2
%
9.9%
19.6
%
17
.3%
20.8
%
4.7%
12.1
%
0
500
1000
1500
2000
2500USD/ 1000 litres
Tax component
Note: data not available for Australia, Germany, Hungary, Italy, Japan, the Netherlands, New Zealand, Norway and the Slovak Republic.
Source: Energy Prices and Taxes, IEA/OECD Paris, 2011.
The government increased excise taxes on diesel and gasoline three times from February to May 2010. The excise tax on diesel rose from EUR 0.302 to EUR 0.412 per litre, and the excise tax on gasoline from EUR 0.41 to EUR 0.67 per litre. The excise tax on diesel remains markedly lower than on gasoline, as the government has intended to promote the use of the more energy‐efficient fuel. Excise taxes are the same for commercial and non‐commercial users. In addition to excise taxes, all oil products for non‐commercial users are also levied a value‐added tax (VAT). In March 2010, the government raised it from 19% to 21%, followed by a further increase to 23% in July 2010.
Figure 19. Average gasoline and diesel prices and taxes in Greece, 1999 to 2010
0
0.2
0.4
0.6
0.8
1
1.2
1.4
1.6EUR/litre
Excise tax (diesel)
Total tax (diesel)
Total price (diesel)
Excise tax (gasoline)
Total tax (gasoline)
Total price (gasoline)
Source: IEA Energy Prices & Taxes, IEA/OECD Paris, 2011.
SECURITY OF SUPPLY
STOCKHOLDING REGIME
Greece meets its stockholding obligation to the IEA and the EU by placing a stockholding obligation on industry. Under Law 3054/2002, importers of crude oil or oil products destined for the domestic market, as well as large end‐users (such as power plants) are required to hold oil stocks with a volume equalling 90 days of their net imports in the previous year. As of December 2010, two refiners (Hellenic Petroleum and Motor Oil), three traders (BP, Shell, Jet Oil) and one utility (the Greek Public Power Corporation, PPC) were obliged to hold oil stocks.
Law 3054/2002 allows companies to include towards their domestic stockholding obligation the volume of oil transported by marine vessels within the Greek sovereignty space, on condition that the consignee is either the obliged stockholder or a third party that owns storage tanks certified for compulsory stocks. However, the Greek legislation stipulates that the aforementioned quantities of emergency oil reserves may vary following a decision by the Minister of Environment, Energy and Climate Change in light of the country’s international obligations. The government will review the Law 3054/2002 in the coming two years in order to transpose into national law the EU Directive 2009/119/EC concerning the minimum stocks of crude oil and/or petroleum products.
Compulsory stocks held by industry must be maintained in storage facilities certified as emergency reserves storage tanks. This, however, does not mean that operational and/or commercial stocks must be kept separately. In practice, compulsory stocks in Greece are commingled with operational and/or commercial stocks.
Under the Greek stockholding regime, an entity required to hold emergency oil reserves may agree to a contract with a third party which owns certified storage facilities for the safe keeping of the total or a part of their statutory emergency oil reserves, after
authorisation by the Ministry of Environment, Energy and Climate Change. Such a contract should be at least for one year and dedicated exclusively to the keeping of the emergency oil reserves. Part of the storage facilities owned by Motor Oil is used for maintaining stocks for third parties under such agreements.
Table 8. Legal basis for oil security measures in Greece
Legislation PowersLaw N° 3054/2002 on the organisation of the mineral oils market and other provisions
Emergency response organisations
The law provides the Minister for the Environment, Energy and Climate Change with the statutory power to deal with emergency measures for crises in the supply of liquid fuel.
Stockholding obligation
The law obliges oil companies to hold stocks of three categories of products, crude oil or feedstock, corresponding to 90 days of their net imports in the domestic market during the previous calendar year.
Implementation of stockdraw and other emergency response measures
The law provides the Minister for the Environment, Energy and Climate Change with the statutory power to control and draw down the emergency reserves maintained by oil companies.
Sources: Oil Supply Security: Emergency Response of IEA Countries 2007, IEA/OECD Paris, 2007; Ministry for the Environment, Energy and Climate Change.
The Ministerial Decision No. D1/12565/2007 authorises the Directorate of Petroleum Policy within the Ministry of Environment, Energy and Climate Change to undertake spot checks of safety stocks in certified tanks. Such physical inspections have never been conducted. Instead, the quantities maintained by entities have been cross‐checked through the customs’ and tax authorities’ official documents.
All compulsory stocks must be maintained within the national territory. Greece does not have any bilateral stockholding agreements with other IEA member countries on maintaining stocks abroad. On the other hand, Greece has a bilateral agreement with Cyprus for holding its stocks on the Greek territory.8 Furthermore, Greece has a strong preference to maintain physical stocks in its territory in order to ensure the security of supply. Therefore, there are no ticket agreements in Greece.
DAYS’ COVER
Greece has been compliant with its 90‐day obligation since the end of 2004. The country’s total stock levels were above 100 days of net imports for the most part of the period from the autumn of 2006 to the beginning of 2009, peaking at 116 days of net imports at the end of January 2011 (see Figure 20).
8. Footnote by Turkey
The information in this document with reference to “Cyprus” relates to the southern part of the Island. There is no single authority representing both Turkish and Greek Cypriot people on the Island. Turkey recognizes the Turkish Republic of Northern Cyprus (TRNC). Until a lasting and equitable solution is found within the context of United Nations, Turkey shall preserve its position concerning the “Cyprus” issue.
Footnote by all the European Union Member States of the OECD and the European Commission
The Republic of Cyprus is recognized by all members of the United Nations with the exception of Turkey. The information in this document relates to the area under the effective control of the Government of the Republic of Cyprus.
Greece held 33.9 million barrels (mb) of oil stocks at the end of March 2011, equalling 109 days of 2010 net imports. Around 41% of the stocks were held in the form of crude oil (including natural gas liquids and feedstocks), while the remaining 59% were refined products. Middle distillates accounted for 29% of total oil stocks, motor gasoline for 12% and residual fuel oil for 9%.
STOCK DRAWDOWN
Under Law 3054/2002, the Minister of Environment, Energy and Climate Change is authorised to decide on the release of compulsory industry stocks, based on the proposal by the Oil Crisis Management Committee. This committee forms the permanent core of the Greek National Emergency Sharing Organisation (NESO), which is supported by the Directorate of Petroleum Policy of the Ministry of Environment, Energy and Climate Change. The Oil Crisis Management Committee is chaired by the General Secretary of the Ministry of Environment, Energy and Climate Change, and is composed of 15 members, including the President of the Regulatory Authority for Energy (RAE), representatives of the Ministries of National Defence, Finance, Economy, and Transport, representatives from the three branches of the Armed Forces and representatives of refineries and retail trade companies. The Oil Crisis Management Committee is convened every three months in normal times.
In case of an IEA collective action, the Oil Crisis Management Committee will draft a decision on the emergency response measures as well as on the manner and type of stocks to be released, and will propose this decision to the Minister for final approval, within 48 hours from the moment of the Notice of Activation under the Initial Contingency Response Plan (ICRP).
The Draft Joint Ministerial Decision on the National Emergency Plan prescribes the following four different procedures for the release of emergency oil reserves during local supply disruptions:
temporary decrease of the obligation to maintain emergency oil stocks, by category of petroleum products;
obligatory decrease in the volume of the emergency oil stocks which are maintained by the parties responsible for holding them, by category of petroleum products;
release of a part of the emergency oil stocks through a bidding procedure to holders of Marketing Authorisations or Retail Trade Licences;
release of a part of the emergency oil stocks and distribution of such stocks on a priority basis to specific categories of consumers or to specific geographical areas of the country.
During the period of implementation of the emergency action plan, the Oil Crisis Management Committee regulates the distribution of emergency oil reserves and supervises compliance with the plan and emergency measures.
CRITIQUE
Oil remains the most important energy source in Greece, representing 54% of TPES and 65% of TFC in 2008. Since Greece only has limited indigenous oil resources, its efforts to maximise efficient production of those resources are commendable, as is the active pursuance of Greece’s import diversification policy for crude oil and oil products. After recent completion of a new drilling platform in Prinos, oil production is expected to double within the next three years. Furthermore, Greece has diversified its crude oil import sources, reducing its dependence on OPEC countries by gradually increasing imports from Russia and OECD countries.
Today, the refinery companies of Hellenic Petroleum and Motor Oil Hellas, are active in the Greek market, which has seen consolidation in the last decade. Market concentration has increased significantly, while total refinery capacity in Greece has increased by almost 6%. The most significant changes, however, have occurred in the retail market, as two international oil companies – BP and Shell – have abandoned the Fuel Marketing Business. BP divested 1 200 sites to Hellenic Petroleum in June 2009, whereas Shell announced in September 2009 the sale of its retail operations to Motor Oil Hellas, including around 700 retail stations. This constitutes the transfer of around 25% of the total sites in Greece into the hands of the two main refinery players. This may be seen as a physical hedge for organisations that were previously long in refining capacity.
The government and the competition authorities are to be commended for their efforts to eliminate obstacles to competition in the oil market, for example by enabling access to storage facilities for product traders, cutting down on bureaucracy, obliging refining companies to notify the cost of compulsory stock obligations and removing restrictions on establishing petrol stations. Greece should also speedily pass and implement legislation to remove restrictions on the ownership of tanker trucks where these result in barriers to entry for new retailers or restrict current operators. All this would render the wholesale market more efficient, increase competition and, ultimately, benefit consumers.
Greece has sufficient oil storage capacity to cover the IEA 90‐day obligation and has indeed been in compliance with its stockholding obligations since 2004. The transposition of Directive 2009/119/EC by the end of 2012 will further ensure Greece’s continuous compliance with the IEA stockholding obligation.
The IEA notes that the upgrading projects at refineries will enhance the country’s refining capacity, meet new product specifications and environmental standards, all of which will contribute to the elimination of the current diesel deficit and to meeting expected future demand in a more flexible way. The country’s ban on private diesel cars in the major metropolitan areas reduces air pollution and has further increased security of supply through a more balanced supply‐demand ratio for the main transport fuels, even if that was not the main intent of the legislation. For crude oil supplies, the planned Burgas‐Alexandroupolis pipeline would further enhance diversification of supply routes to Greece.
The draft Joint Ministerial Decision on the National Emergency Plan outlines the response measures and their implementing procedures which would become the basis for Greece’s emergency response mechanisms. This Joint Ministerial Decision has had the status of a draft since 2002 and would need to be improved on several key points before being enacted, so that Greece can immediately and efficiently participate in an IEA collective action.
The draft decision does not specify emergency response measures or the priority of such measures and their implementing procedures which the government would take during a global supply disruption. The draft also envisages restriction of oil product exports as one of the possible emergency response measures in a global crisis. This is clearly not in line with the IEA emergency response mechanisms and solidarity principles for collective drawdown of oil stocks in an emergency.
The IEA recommends that the government revises the draft Joint Ministerial Decision and prioritises emergency response measures to be taken in a global crisis, notably by stating that use of stocks obligatorily held by the industry is a primary response measure. The draft should also contain that the release of industry stocks could be complemented by demand restraint measures, and that the government will ensure direct and unrestricted flow of oil to the global market in the event of an IEA co‐ordinated action.
RECOMMENDATIONS
The government of Greece should:
Continue to monitor and fully liberalise the downstream oil market given some consolidation in the refining sector in the past and the very recent consolidation in the fuel marketing business sector.
Give enforcing powers to the Hellenic Competition Commission (HCC) regarding the oil market, considering HCC’s ample experience of the industry.
Enact the draft Joint Ministerial Decision on the National Emergency Plan after amending it, taking into account IEA proposals and other countries’ best practices.
Share of natural gas: 12% of TPES and 27% of electricity generation
Net imports: 3.8 bcm (from Russia 54%, Algeria 20%, Turkey 17%)
Inland consumption: 3.1 bcm in 2009 (power generation 64%, industry 22%, residential 9%, services and transport 5%)
SUPPLY AND DEMAND
SUPPLY
Natural gas accounted for 12% of TPES in Greece in 2010, up from 10% in 2009. Gas imports started in 1997 and today practically all gas is imported. In 2010, these imports amounted to around 3.8 billion cubic metres (bcm), or 10.5 million cubic metres per day (mcm/d), roughly three‐quarters of which were supplied by pipeline and the rest in the form of liquefied natural gas (LNG). Russia has been the main supplier throughout the years. However, its share in total imports declined from 85% in 2005 to 54% in 2010, while imports from Algeria and Turkey increased. In 2010, Algeria accounted for around 20% and Turkey for 17% of total imports. Domestic production of natural gas is negligible. The South Kavala gas field, located in the Kavala Gulf of the Aegean Sea, produced 9 mcm in 2009 (0.02 mcm/d).
DEMAND
Gas demand increased very fast from 2002 to 2008, on average by 10% per year. Reflecting the economic downturn, however, gas demand fell sharply by 15% from 2008 to 2009, reaching 3.1 bcm. Demand growth over the past decade was primarily driven by demand for electricity. In 2009, electricity generation consumed 64% of all gas, industry 22%, households 9% and services and transport 5% (see Figure 21). Daily gas demand averaged 9.7 mcm in 2009 and peaked at 16.25 mcm on 14 December. The daily peak demand in the summer of 2009 was 11.4 mcm.
DESFA, the gas transmission system operator, forecasts gas demand to reach 5.6 bcm (15.3 mcm/d) in 2015 and 6.6 bcm (18 mcm/d) in 2019. This near‐doubling of gas demand from 2009 to 2019 would be driven mainly by electricity generation which is expected to account for 68% of total demand in 2015 and for 61% in 2020.
* TPES by consuming sector. Other includes other transformation and energy sector consumption. Industry includes non-energy use. Commercial includes commercial, public services, agriculture/ forestry, fishing and other final consumption.
** Negligible.
Source: Natural Gas Information 2010, IEA/OECD Paris, 2010.
SUPPLY CONTRACTS
The Greek Public Gas Corporation (DEPA) held a monopoly on gas imports until May 2010 and continues to dominate imports. DEPA sources gas through long‐term contracts and spot LNG purchases. The long‐term contracts with Russia’s Gazexport, Algeria’s Sonatrach and Turkey’s BOTAŞ cover a total of 4.2 bcm per year until 2016 (see Table 9). Long‐term contracts were sufficient to meet all gas demand in Greece until 2008. Today, spot LNG and additional pipeline imports are used to fill the gap between demand and supply under long‐term contracts.
Table 9. Gas supply agreements
Supplier Year of expiry Contracted volume
in 2010, bcm Type of contract
Gazexport (Russia) 2016 2.8 Take-or-pay
Sonatrach (Algeria) 2021 0.68 Take-or-pay
BOTAŞ (Turkey) 2021 0.71 Take-or-pay
Source: Ministry of Environment, Energy and Climate Change.
In 2009, spot LNG provided around 8% of total imports. In order to facilitate LNG imports from the spot market, DEPA has signed agreements with independent oil companies (IOCs) for the supply of LNG, including with ENI, BP and Shell. In May 2010, Greece signed a Memorandum of Understanding (MoU) with Qatar on LNG imports.
Greece’s natural gas market has been guided by the 2005 Gas Market Law (3428/2005) and subsequent secondary legislation. The 2005 law transposes EU Directives 2003/55/EC and 2004/67/EC into Greek legislation. Among the key stipulations of the law are legal unbundling of the transmission system operator; a fully regulated regime for third‐party access (TPA) to gas infrastructure; and a regulatory governance system of the gas market.
To be fully effective, the implementation of the Gas Market Law requires secondary legislation. This process of introducing specific regulations has been lengthy and remains to be finalised. In April 2010, a breakthrough was when two key pieces of secondary legislation were adopted, namely the Network Operation Code and the Natural Gas Supply Licence Code.
The Network Operation Code establishes a new legal framework for TPA to the gas transmission system. The code will be revised periodically. The 2011 revisions will include procedures for network management in case of new projects. The Natural Gas Supply Licence Code, in turn, breaks the monopoly of the Public Gas Corporation (DEPA, see below under Industry Structure) as the sole importer of natural gas to Greece. Secondary legislation also includes the Standard Transportation and LNG System Contracts as well as the Measurement Regulation.
Although the gas market has been gradually opened to competition since 2005, in practice eligible customers, which represented around 70% of demand in 2009, have been free to choose their supplier only after the adoption of the April 2010 regulations which provide for supply licences, Households and other small customers using less than 9 mcm per year, however, are not yet eligible, but supplied by a local monopoly, or EPA (see under Industry Structure). They will become free to choose their supplier once the TPA derogations granted to the local distribution companies expire, around 2030.
The tariff regulation has already been submitted to the Regulatory Authority for Energy (RAE). It will replace the Ministerial Decision 4955/2006 regarding third‐party access. The supply code for eligible customers is also expected to be published in the near future. According to RAE, subsequent steps in market regulation will include defining rules and procedures for capacity allocation and congestion management.
Further changes to Greek gas market legislation are envisaged in law 4001/2011, adopted in August 2011, which transposes the EU Directive 2009/73/EC. These changes will, inter alia, strengthen the independence of the regulator and the unbundling of the TSO from other sectors of the market (see Box 1 in chapter 2).
THE REGULATOR
RAE is the regulator also for the natural gas market. The 2005 Gas Market Law assigns it responsibilities for tariff setting, balancing regime, access rules and security of supply. It monitors the management and allocation of interconnection capacity, the time taken by transmission and distribution system operators for connections of users and repairs to the network, the publication of all appropriate information by the TSO and the DSO, the
terms and tariffs for third‐party access, the unbundling of accounts, the level of transparency and competition in the energy market and the security of supply. RAE imposes financial sanctions, particularly fines, to the violators of the primary and secondary energy legislation. It also exercises dispute resolution and settlement.
THIRD‐PARTY ACCESS
Non‐discriminatory access to the Greek gas system (pipelines and LNG facilities) is based on the April 2010 Network Code, standard contracts and published regulated tariffs. Before the adoption of the Network Code, tariffs for TPA to the national natural gas system and connection charges had been set and published as a Ministerial Decree in 2006. A new tariff regulation to replace the 2006 Decree is expected to be adopted in 2011.
INDUSTRY STRUCTURE
The April 2010 reforms enabled new suppliers to enter the Greek natural gas market. As of June 2011, 15 companies were registered as users of the national natural gas system: two companies were registered as a natural gas suppliers (DEPA and M&M Gas which is owned by Motor Oil Hellas and the Mytilineos Group); nine companies were registered as eligible customers (including PPC and Aluminium S.A.); and four companies registered as third parties (Edison, E.ON Ruhrgas, Prometheus and Statoil). The first delivery of natural gas by suppliers other than DEPA took place in May 2010; they supplied 19% of natural gas to Greece since the reforms until the end of 2010.
In practice, the gas sector still remains dominated by DEPA and its subsidiaries (see Figure 22). DEPA is 65% owned by the Greek State and 35% by Hellenic Petroleum. As part of the privatisation programme adopted in June 2011, the State has pledged to reduce its ownership to a minimum of 10%.
DEPA was founded in 1988 with the mission to introduce natural gas to Greece, and it continues to import almost all gas. Its fully‐owned but legally unbundled subsidiary, the National Natural Gas Transmission System Operator (DESFA), owns the gas transportation infrastructure and is responsible for its operation, maintenance, management and development. DESFA was established in March 2007, following an obligation under Law 3428/2005. Concerning the unbundling requirements in the EU’s third Gas Market Directive (2009/73/EC), Greece has opted for the independent transmission system operator model. Consequently, DESFA may remain 100% owned by DEPA, but will be subject to heavy regulation and permanent monitoring to ensure non‐discriminatory system operation.
DEPA also owns the majority in the country’s distribution companies. Through its subsidiary EDA, DEPA holds 51% of the shares in the three local distribution companies (EPAs): Attica (Athens), Thessaloniki and Thessaly. The minority shareholder in EPA Thessaloniki and EPA Thessalia is ENI, while the minority shareholders of EPA Attiki are Royal Dutch/Shell (25% of shares) and the Agricultural Bank of Greece (24%). By law, DEPA may not sell its majority share in EPAs.
EPAs receive natural gas from DEPA and supply it to customers in their concession area. In line with EU Directive 2003/55/EC, EPAs have been granted a 30‐year derogation from third‐party access in their concession areas. Future distribution companies may derogate
from TPA for 10 years (extendable to 20 years subject to the European Commission’s approval). Only DEPA is authorised to form new EPAs. Currently, it is planning to establish three more EPAs in 2011, in the regions of Sterea Ellada, Central Macedonia, and Eastern Macedonia and Thrace, through partial private investments and an international tender.
Figure 22. DEPA group structure
ESFA Administrator
(DESFA S.A.)
Gas distribution
company (EDA S.A.)IGI
POSEIDON
EPA
Attica
EPA
ThessalyEPA
Thessaloniki
ENIShell GasAgricultural
Bank of Greece
100%100% 50%
51%51%51%
49% 49% 49%
DEPA
Distribution
Trade
International activities
Natural gas
Transport -LNG
Source: DEPA.
INFRASTRUCTURE
The Greek natural gas system consists of a 512‐km of high‐pressure main pipeline and 716 km of high‐pressure branch lines. The gas system has three entry points; the pipelines from Bulgaria and Turkey and the Revithoussa LNG terminal (see Figure 23). Gas storage is limited to the tanks at the LNG terminal.
PIPELINES
The two pipeline entry points to the Greek natural gas system have a total annual technical capacity of around 4.6 bcm. The 3.6 bcm entry point at Promachonas on the Greek‐Bulgarian border is used for delivering gas from Russia via Ukraine, Moldavia, Romania and Bulgaria. The 1 bcm entry point at Kipoi on the Greek‐Turkish border allows Greece to import gas from the Middle East and the Caspian region.
The Revithoussa LNG terminal has a technical capacity of 4.55 bcm, which brings Greece’s total technical import capacity to 9.15 bcm per year. Taking into consideration an assumed load factor for each entry point, the three entry points could manage a total of 6.4 bcm per year (annual demand in 2010 reached 3.8 bcm). Existing import infrastructure would therefore allow for much higher internal demand. The high‐pressure gas network will continue to be expanded. Recent expansions include a 26‐km line to a gas‐fired power plant in Thisvi and a 72‐km pipeline from Stefani to Aliveri. There is also a potential project to construct a 151‐km branch from Korinthos to the new gas‐fired plant of PPC in Megalopoli. Responding to a growing demand for transmission capacity, DESFA is creating a natural gas compression terminal at Nea Mesimvria, Thessaloniki. The first phase, scheduled to be operational in the first quarter of 2011, would see two 7.7‐MW compressor units installed. If needed, a third 7.7‐MW compressor would be installed later.
Greece is also involved in the following international gas pipeline projects:
Interconnector Turkey‐Greece‐Italy (ITGI)
The ITGI project is part of the Southern European Corridor and is designed to transfer natural gas from the Caspian region (Azeri gas from Shah Deniz II). The ITGI system is composed of three parts: the 296‐km Interconnector Turkey‐Greece (ITG), in operation since 2007, a 570‐km onshore pipeline from Komotini to Igoumenitsa on the north‐western coast, and a 212‐km offshore pipeline to Italy. DESFA will construct the onshore pipeline as part of the Greek natural gas system. The offshore pipeline will be built by IGI Poseidon, a joint venture of Italy’s Edison (50%) and DEPA (50%). The European Commission has granted the offshore interconnection a 25‐year exemption from TPA rules for 8 bcm per year. Edison and DEPA signed a Memorandum of Understanding on transit through Turkey with BOTAŞ in June 2010. The project is planned to start operation at the earliest in 2015.
Interconnector Greece‐Bulgaria (IGB)
The IGB will enable the Greek gas grid to link to the European market via subsequent Interconnector links between Bulgaria and Romania and beyond via the Romania‐Hungary Interconnector and towards western Balkans. The IGB is strongly connected with the Southern Corridor and the Interconnector Turkey‐Greece (ITG).
With a transportation capacity of 3 to5 bcm, the IGB pipeline will enable Bulgaria to diversify its supply routes by accessing sources from the Caspian area (e.g. Azerbaijan) through Greece. Bulgaria will also receive gas from the Revithoussa LNG terminal. The total investment is expected to amount to EUR 140 million, and IGB is eligible for EUR 45 million from the European Energy Programme for Recovery. The pipeline is expected to become operational in 2013.
A Memorandum of Understanding was signed in July 2009 between IGI Poseidon and the state‐owned Bulgarian Energy Holding (BEH) to promote the construction of a 160‐km gas pipeline from Komotini in Greece to Stara Zagora in Bulgaria. In March 2010, the companies formed an Asset Company which will build, own and operate the pipeline.
South Stream (Greek branch)
In April 2008, the Greek and Russian governments signed an intergovernmental agreement on the South Stream project on Greek territory. The project aims to transport natural gas from Russia across the Black Sea. In June 2010, Gazprom and DESFA agreed
to form a joint venture to design, finance, construct and maintain the gas pipeline in Greece. The capacity and the completion date of the Greek section of South Stream remain to be confirmed. As of January 2011, the final investment decision on South Stream remained to be taken. The EU and Russia are negotiating on a single regulatory regime for the pipeline.
Trans‐Adriatic Pipeline (TAP)
The 10‐bcm TAP project would use Greece as a transit country for bringing Caspian gas to Italy. The project companies, EGL from Switzerland, Statoil from Norway and E.ON Ruhrgas from Germany, have applied for a licence to build a transit pipeline from Nea Mesimvria to the Albanian border. The companies are not planning to sell any gas in Greece.
LNG FACILITIES
Greece has one LNG regasification terminal, on the island of Revithoussa. The terminal is owned by DESFA and has an annual maximum regasification capacity of 5.3 bcm. The terminal has a sustained maximum send‐out rate (SMSR) of 1 000 m3
LNG/h (14.4 mcm/d), and a peak SMSR (emergency rate) of 1 250 m3 LNG/h (18.5 mcm/d). The SMSR roughly equalled peak daily gas demand in 2009 and was some 50% higher than average gas demand. LNG imports in 2009 averaged 2.3 mcm/d, or 18% of the terminal capacity. DESFA has recently finalised a feasibility study for constructing a new LNG tank, enabling the SMSR to increase from the current 1 000 m3 LNG/h (14.4 mcm/d) to 1 400 m3 LNG/h (19.5 mcm/d) by 2014, in line with the projected increase in gas demand.
The government is encouraging the use of the Revithoussa terminal by charging only 5% of the cost of the LNG terminal in the tariff for its use. The other 95% of the costs are recouped through the transmission tariffs of the national natural gas system. This 5/95 ratio will be reconsidered in the new tariff regulation, expected to be adopted in 2011.
Regarding potential new LNG terminals, DESFA has been studying a project to construct an LNG terminal at Korakias on the island of Crete. The terminal would supply natural gas to power plants, as well as to households and commercial consumers. No decision on the project had been taken as of June 2011.
STORAGE
There is no underground gas storage in Greece. The country’s only storage facility is located at the Revithoussa LNG terminal. The terminal has two LNG tanks with a combined storage capacity of 130 000 m3 of LNG (80 mcm of natural gas), equalling eight days of average gas demand and five days of peak gas demand in 2009. Around 10 000 m3 of the storage is reserved for short‐term balancing and security of supply purposes. In autumn 2010, DESFA was granted a permission to construct a third LNG tank at Revithoussa, with a capacity of 95 000 m3 of LNG (57 mcm of natural gas). The third LNG tank should be completed in 2014 and would increase the total storage capacity to 135 mcm, equalling 14 days of average gas demand and nine days of peak demand in 2009.
The government has plans for underground storage in the exhausted Kavala offshore gas field. A January 2011 study commissioned for the Ministry of Environment, Energy and Climate Change confirms that it would be technically feasible to convert the Kavala field into a 1‐bcm storage facility. This capacity equals around 20 days of peak demand in 2009. The maximum drawdown capacity could reach 4 mcm per day for 90 days, equalling roughly 25% of peak daily demand and 40% of average demand in 2009. This underground installation would contribute to the security of supply at both national and regional levels after the completion of the reverse flow Interconnection Greece‐Bulgaria (IGB) pipeline. The government is considering an international tender for the construction of the storage facility.
PRICES AND TARIFFS
Compared with other OECD countries, natural gas prices for industry in Greece are in the mid‐range, while prices for households are among the highest (see Figure 24). There is no excise tax on natural gas, as the government policy has been to promote the use of the fuel. Household customers are also subject to a value‐added tax (VAT) the level of which was raised from 9% to 13% in January 2011.
End‐user tariffs on natural gas are applied to captive customers in the concession areas of the distribution companies (EPAs). End‐user tariffs to EPA customers are regulated under a revenue cap system with ex post control by RAE. The terms of the tariffs are laid out in the distribution licences, and EPAs submit their tariff policy to RAE’s approval annually. Consumers are informed in writing of changes in the tariffs.
All households are supplied by local monopoly distributors (EPAs) which are obliged to be supplied by DEPA for the volume stated in the DEPA contract. However, EPAs may purchase any amounts exceeding those stated in the DEPA contract from other suppliers.
Figure 24. Natural gas prices in IEA member countries, 2010
Industry
4.8% 6.
3% 2.6
%
8.3%
2.8% 0.0
%
19.4
%
9.8%
0.0
%
3.7%
1.8%
0.0% 13
.0%
4.6% 0.0%
3.5%
3.8
%
0.0% 11
.7%
16.7
%
0
200
400
600
800
1000
1200
1400
1600
1800
USD/Mcm
Tax component
Note: Tax information not available for Korea and the United States. Data not available for Australia, Austria, Denmark, Germany, Japan and Norway.
Figure 24. Natural gas prices in IEA member countries, 2010 (continued)
Households
4.8% 24
.2%
15.3
%
20.0
%
8.1% 16
.0%
4.8% 18
.0%
16.7
%
11.9
%
14.5
%
16.2
%
20.6
%
5.2%
26.4
%
41.6
%
13.1
%
14.7
%
9.4%
37.6
%
50.6
%
42.4
%
0
200
400
600
800
1000
1200
1400
1600
1800
USD/Mcm
Tax component
Note: Tax information not available for Korea and the United States. Data not available for Australia, Germany, Japan and Norway.
Source: Energy Prices and Taxes, IEA/OECD Paris, 2011.
SECURITY OF SUPPLY
The key elements of Greece’s policy on natural gas security are the diversification of supply sources and the development of the natural gas transmission system. The legal base for gas security measures is Law 3428/2005 on the liberalisation of the natural gas market. The law transposed into Greek legislation the EU Directive 2004/67/EC concerning measures to safeguard security of supply.
RAE, the regulator, is responsible for monitoring gas security and recommending how to improve it. DESFA is responsible for the operation, maintenance, development and utilisation of the national natural gas system. The Network Code approved in April 2010 names DESFA as the body to declare a gas emergency, and activate and terminate an Emergency Response Plan. Such a plan remains to be adopted.
In a supply disruption, DESFA would resort to the following three key measures:
interruption of gas supply to large users, on the basis of a priority list;
fuel switching at power stations;
use of gas reserves at the LNG terminal.
The interruption of gas supplies to customers would first affect power plants with fuel‐switching capacity. Secondly, large industrial users would see their supplies reduced. Last in line would be households and other small customers, such as small and medium‐sized enterprises. Small customers are also protected by the provisions of the supply licence granted to the three existing natural gas distribution companies (EPAs).
Greece has never had to resort to interrupting supplies to large gas users. During the Russia‐Ukraine gas dispute in January 2009, Greece acquired three spot LNG cargoes, while mild weather helped to keep gas demand in check.
New gas‐fired plants are required to hold at least five days of dual fuel reserves (i.e. either diesel stored at the plant site, or LNG at the Revithoussa terminal). Meeting this requirement is a condition for obtaining a power production licence. Greece has eight gas‐fired units, with a total capacity of 2 849 MW. Four of them, with a combined capacity of 1 594 MW, can be switched to use other fuels. The remaining capacity cannot be switched to run on other fuels, but can be substituted by electricity from hydropower and lignite‐fired plants.
Any costs incurred in fuel switching to power producers and large industrial consumers would be compensated by DESFA. These compensation costs may be included in the operating costs of DESFA and recovered through tariffs or a specific security of supply levy. The cost recovery method is subject to RAE’s approval. A security of supply levy is planned to be determined in 2011.
LNG stored at the Revithoussa terminal would also help in a gas supply emergency. The volumes, however, are rather small, but will be increased in the near term. The full capacity of the storage (80 mcm) equalled eight days of average gas demand and five days of peak demand in 2009. DESFA is planning to expand the storage in the coming years (see section above on Storage).
CRITIQUE
Natural gas was first introduced in Greece in 1997 and by 2010 had grown to represent 12% of primary energy supply. The government projects gas demand to almost double from the 2010 level to 2019, driven by demand from the power sector. Greece is to be commended for its strategy to expand gas use, as it enables the country to diversify energy sources and reduce the CO2 intensity of its economy.
The natural gas sector has traditionally been state‐controlled, but after a slow start, market reform is now gaining pace. The IEA congratulates Greece for adopting the Network Code and the Supply Licence Code in April 2010 as a necessary step in effective market reform. Independent suppliers and large customers willing to be self‐supplied will now be able to import gas to the country. The reform will continue with several regulations planned to be adopted in the near future. The regulatory framework will have to be carefully designed and monitored in order to allow for the development of a more competitive and liquid market. Ensuring access to the network and the LNG terminal are crucial for effective competition to emerge.
The reforms are yet to make their full mark on the gas sector, but it is encouraging that more than a dozen new players have entered the Greek gas market by the end of May 2011. Although the State remains in control of most of the gas supply and the gas transmission infrastructure through DEPA and its subsidiaries, the new entrants can be expected to gradually reduce the dominance of a quasi‐monopoly and bring multiple benefits to the economy and the citizens. The government should review the role of DEPA as the majority‐owner of current and future distribution companies (EPAs), as it is unclear what net benefit DEPA’s dominance brings to customers. If justified by the review, DEPA’s role should be reduced. Appropriate initiatives have been undertaken for the DEPA‐DESFA (TSO) unbundling.
Market reform is also essential for facilitating any private sector investment in the gas transmission infrastructure. Although entry capacity to the Greek gas system seems sufficient to accommodate the projected growth in demand to 2020, investments in the
national transmission network are in progress and enhancer the security of supply as well as the smooth gas market procurement.
Geographically, Greece is well suited to become a key transit country for gas to southern Europe and the Balkan region. Several projects are being carried out to this effect. The Interconnector Turkey‐Greece (ITG) was inaugurated in 2007 and work on the Greece‐Italy part of the ITGI is in progress. In another positive development, the Asset Company to build, own and operate the IGB (Interconnector Greece‐Bulgaria) project was established in March 2010. Besides, DESFA and Gazprom have signed a co‐operation agreement for the development of the Greek branch of South Stream. These projects, along with increasing the use of the Revithoussa LNG terminal, have the potential to significantly increase the flows of gas on the Greek territory. The IEA urges the government to monitor closely all projects to improve gas flows in Greece and, if necessary, stand ready to adapt the regulatory framework to facilitate their finalisation.
Security of supply is one of the key objectives of Greek energy policy. During the January 2009 crisis, the gas system showed better resilience than in other countries in the region. The supply sources are already diversified, as Russian gas is imported through the Greek‐Bulgarian entry point, while the Greek‐Turkish entry point allows Greece to import gas from the Middle East and the Caspian region. However, experience has shown that in a gas crisis, the two border entry points to Greece may become simultaneously unavailable. DEPA has been in talks with SOCAR of Azerbaijan over a direct supply of 0.7 bcm per year. At the moment, Azerbaijan sells gas to BOTAŞ of Turkey which in turn sells the gas to DEPA. Also a draft emergency plan examining several scenarios and defining load‐shedding priorities is currently under review by the regulator.
As peak demand is set to grow in the coming years, it may become increasingly challenging to meet demand under such circumstances. Greece’s efforts to further diversify import routes and sources, while expanding LNG import capacities, are therefore to be commended.
Gas storage is currently limited to the two tanks at the Revithoussa LNG terminal, with a capacity equalling five days of peak demand. More storage is needed in the gas system, especially in light of growing gas demand. Encouragingly, DESFA is planning to expand storage capacity, and doing this in a timely manner will be essential for ensuring the reliable functioning of the Greek gas system. The conversion of the offshore field of Kavala, when depleted, could also help increase storage capacity for the benefit of market opening and security of supply.
The IEA encourages the government to strengthen the country’s preparedness for gas emergencies by finalising and adopting the Gas Emergency Response Plan without delay. Considering the growing interconnection between oil and gas markets in Greece and the possibilities of a combined supply disruption of these fuels, the IEA recommends the government to develop a mid‐ to long‐term gas emergency response policy. Commendably, new gas‐fired power producers are obliged to hold at least five days of secondary fuel stocks in order to respond to a disruption in natural gas supplies. The IEA encourages the government to consider these stockholdings as separate from the oil stockholding used to meet the IEA 90‐day stockholding commitment, such that the use of these stocks in a gas crisis would not require going below the 90‐day level of minimum oil stocks.
Stimulate competition in the gas market, in particular by further developing a legal framework which ensures third‐party access to the network and the LNG terminal.
Consider reducing the dominance of the Public Gas Corporation (DEPA) in the gas market.
Continue to facilitate investments in the Greek network and the development of new interconnections and reverse flows in the region as a way to enhance security of supply and increase the liquidity of the market.
Continue to encourage the development of further storage capacity to add more flexibility to the gas system in case of a crisis.
Adopt the Gas Emergency Response Plan without delay and develop a mid‐ to long‐term gas emergency response policy.
Production: 56.5 Mt of lignite, ‐12.9% compared to 2009
Net imports: 0.6 Mt of hard coal (from Russia 65%, Colombia 12%, United States 8%)
Share of coal: 27% of TPES and 45% of electricity generation
Inland consumption: 7.3 Mtoe (power generation 98%, industry 2%)
SUPPLY AND DEMAND
In 2010, coal supply in Greece was 27% of TPES or 7.3 Mtoe; this is 1.1 Mtoe less than in 2009. Some 97% of all coal is domestically produced lignite. The imports came almost entirely from Russia. Close to 98% of all coal was used for electricity generation, while process industry, mainly cement production, accounted for the rest in 2009.
RESERVES AND PRODUCTION
Lignite is the only significant domestic fossil fuel in Greece, accounting for 78% of primary energy production in 2010. Greece is the second‐largest lignite producer in the European Union, and the sixth‐largest worldwide. To date, a total of 1.3 billion tonnes of lignite have already been mined, while economically recoverable reserves total around 3.2 billion tonnes. The lignite resource, including reserves, amounts to 6.43 billion tonnes according to the 2009 annual lignite report of Germany’s Federal Institute for Geosciences and Natural Resources. These deposits, lying mostly at 150 to 200 metres, are distributed throughout Greece.
The most important deposits are located in the north of the country, at Ptolemais‐Amynteon and Florina (West Macedonia), at Drama (East Macedonia and Thrace) and at Elassona (Thessaly), as well as in the south at Megalopolis (Peloponnese). There is also a large peat deposit at Philippi in the northern part of Greece (East Macedonia).
In recent years, a good 65 Mt of lignite has been produced annually (see Table 10) by moving a total of 360 mcm of rock and earth material at opencast mines (an overburden‐to‐lignite ratio of 4.7 m3/t). Lignite mining industry employs about 5 000 people, suggesting a productivity of 13 000 t per man‐year. Importantly, lignite production does not receive any subsidies.
Lignite is the cheapest and therefore also the main fuel for electricity generation in Greece. It is traditionally produced by the Public Power Corporation (PPC), the majority government‐owned electricity incumbent, for use at its lignite‐fired power plants. PPC’s privileged position as a mine owner has helped it to maintain its dominant position in the Greek electricity market.
Table 10. Lignite production in Greece, 1980 to 2010
Year 1980 1990 2000 2007 2008 2009 2010
Mt 23.2 51.9 63.89 66.31 65.72 64.89 56.52
Mt coal equivalent
4.22 10.17 11.75 11.98 11.61 11.74 10.2
Sources: Coal Information 2010, IEA/OECD Paris, 2010; country submission.
In March 2008, however, the EU Commission found that PPC’s right to privileged access to lignite violates EU competition rules (Articles 86 and 82 of the EU Treaty). To avoid sanctions, Greece proposed to tender new exploitation rights for lignite deposits at Drama, Elassona, Vevi and Vegora to entities other than PPC. Greece also accepted that lignite from these deposits may not be sold to PPC. In August 2009, the EU Commission approved the proposals and made them legally binding on Greece. It also required that the allocation rights be effectively granted to the successful bidders within one year from the August 2009 decision. As a result, competitors of PPC will potentially access about 40% of all exploitable Greek lignite deposits. In 2009, PPC produced around 96% of all lignite in Greece. The rest is produced by a few private companies in the Florina area. From 2005 to 2009, these companies increased lignite production by 55%, from 1.9 Mt to 2.9 Mt.
* TPES by consuming sector. Other includes other transformation and energy sector consumption. Industry includes non-energy use. Commercial includes commercial, public services, agriculture, forestry, fishing and other final consumption.
** Negligible.
Source: Energy Balances of OECD Countries, IEA/OECD Paris, 2010.
The current lignite consumption varies from 64 to 66 Mt. Practically all lignite is consumed at PPC’s lignite‐fired power plants (see Table 11 for a list of these plants). At current rates of consumption, total deposits would be enough to supply Greece for several decades, but in its scenarios to 2020 and 2030, the government expects a steep decline in lignite use, implying a steep decline in lignite mining, too. On the one hand, several lignite‐fired power plants will come to the end of their lifetime and will be closed. On the other hand, two broad changes in the EU‐wide regulatory framework add costs to lignite‐fired power generation: the EU‐ETS and the EU air quality standards.
Figure 26. Location of existing and proposed coal‐fired power plants, 2010
Aliveri
Megalopolis
Agios DimitriosKardia
Ptolemais
Meliti-Achlada, Florina
Amynteon-Filotas
Larymna
Agios Nikolaos
ALBANIA
FYROM
TURKEY
TURKEY
BULGARIA
0 50 100km
Athens
Ionian Sea
Proposed coal-fired power plants
Existing coal-fired power plants
Aegean Sea
This map is for illustrative purposes and is without prejudice to the status of or sovereignty over any territory covered by this map.
From 2013 on, in the third phase of the EU‐ETS, fossil fuel users in the power sector will have to purchase all the emission allowances they need – there will no longer be any free allocations. This will penalise lignite use, as lignite‐fired plants have the highest CO2 emissions per kWh generated. According to IEA data, lignite‐fired power plants in Greece emitted an average of 1 tonne of CO2 per MWh generated in 2009, whereas the gas‐fired plants emitted 350 kg of CO2 per MWh.
Thermal efficiency of lignite‐fired power plants has remained around 28% over the last years. PPC is planning to increase the efficiency of its lignite‐fired power plants by upgrading boilers, turbines, lignite grinding mills, cooling systems and other equipment. PPC estimates that investments in power generation (from lignite and other sources) would decrease CO2 intensity by one‐quarter between 2006 and 2015, from 1 200 to 900 kg per MWh. PPC is involved in several European projects and initiatives on carbon capture and storage (CCS) technology. CCS may provide lignite viability in a carbon‐constrained world in the long term.
Another factor affecting lignite is the need to meet new emission limit values for pollutant emissions under the EU Directive on Large Combustion Plants, effective since January 2008, which will result in the closure of many old units (see below under Pollution Control).
New coal‐fired plants have been proposed at Agios Nikolaos, Aliveri and Larymna; the locations of all these plants are shown in Figure 26. The new plants, all at coastal locations, would be fuelled with imported bituminous coal.
Table 11. Coal‐fired power plants in Greece, 2010
Plant name Location Owner Capacity, Units, MW
Fuel Notes MW (commissioned)
Agios Dimitrios
Kozani, West Macedonia
PPC 1 585 2 x 300 (1984/84)
lignite 2 x 310 (1985/86) 1 x 365 (1997)
Agios Nikolaos
Antikyra, Boeotia (Viotia), ENDESA
Hellas 1 x 600 (planned)
bituminous coal
Central Greece
Aliveri Euboea (Evia),
PPC 1 x 800 (planned) bituminous coal
Central Greece
Amynteon-Filotas
Florina, PPC 600 2 x 300 (1987/87) lignite
West Macedonia
Kardia Kozani,
PPC 1 240 2 x 300 (1975/75)
lignite West Macedonia 2 x 320 (1980/81)
Larymna Lokrida,
PPC 1 x 800 (planned) bituminous coal
Central Greece
Megalopolis Arcadia, Peloponnese
PPC 850 2 x 125 (1970/70)
lignite
Units I and II will be closed in 2011/2012.
2 x 300 (1975/91) FGD at units III (2009) and IV (2008/1999)
Meliti-Achlada
Florina, PPC 330
1 x 330 (2003) lignite FGD (2003)
West Macedonia 1 x 450 (planned)
Ptolemais Kozani, West Macedonia
PPC 620
1 x 70 (1959)
lignite The 70 MW unit was shut down in 2010 its capacity is included in the total, however.
2 x 125 (1962/65) 1 x 300 (1973) 1 x 450 (planned)
Total 5 225 FGD – flue gas desulphurisation; PPC – Public Power Corporation S. A.
Sources: IEA Clean Coal Centre CoalPower5 database, IEA analysis.
Operation of coal‐fired power plants depends crucially on pollution control regimes. In Greece, these are largely determined by the United Nations Economic Commission for Europe’s (UNECE) protocols and EU directives, notably the National Emission Ceilings Directive (2001/81/EC), the Large Combustion Plants Directive (LCPD, 2001/80/EC), the Integrated Pollution Prevention and Control Directive (IPPC, 2008/1/EC, a codified version of 96/61/EC) and the recently adopted Industrial Emissions Directive (IED, a revision and recast of various pollution control directives, including LCPD and IPPC).
Under the first directive, Greece must reduce its total sulphur dioxide (SO2) emissions to below 523 kilotonnes (kt) by 2010. According to a study commissioned by the European Commission, over the three‐year period from 2004 to 2006, Greece’s annual emissions of SO2 from large combustion plants (lignite‐, but also fuel oil‐fired) reached 536 kt in 2006, but have declined since then as flue gas desulphurisation has been installed at several power plants.
Under the LCPD, emissions to air of SO2, nitrogen oxides (NOx) and particles from installations with a thermal input capacity above 50 MW are regulated. New plants (licensed after 1 July 1987) had to comply with the directive’s emission limit values (ELVs) immediately, while existing plants were given until 1 January 2008 or can operate under a national plan to achieve equivalent pollution reductions. Plants which are operated 20 000 hours or less between 1 January 2008 and 31 December 2015 may opt out.
More specifically, to comply with the LCPD, Greece has adopted a National Emissions Reduction Plan. All existing lignite‐fired power plants are included in this plan. PPC has chosen to opt out two units at the Megalopolis plant and three units at the Ptolemais plant under the 20 000‐hour rule, totalling 10% of Greece’s lignite‐fired power plant capacity. These units are planned to be shut down in 2011‐2012. The remaining units have installed or will install pollution control equipment, or reduce their emissions by other means in line with the National Emissions Reduction Plan. In meeting the requirements of the LCPD, Greece will see a sharp fall in SO2 emissions from large combustion plants following a significant investment in flue‐gas desulphurisation (FGD) by 2015.
After 2015, the emission limit values will become stricter, as decreed in the recently adopted Industrial Emissions Directive. Transitional national plans for complying with the new limits will apply from 1 January 2016 to 30 June 2020, and fixed‐term derogations to 31 December 2023 for a maximum of 17 500 hours of activity.
CRITIQUE
Lignite is the dominant indigenous energy resource in Greece, accounting for 78% of primary energy production and 27% of primary energy supply in 2010. It is also the country’s main source of electricity, contributing more than half of total power supply in 2010. Lignite has provided Greece secure, affordable and reliable energy for a long time, but in the coming transition towards a low‐carbon economy, it will inevitably have to leave the centre stage to cleaner sources of energy.
Lignite consumption may be affected because of gradual decommissioning of the old lignite power stations. Those not meeting the requirements of the EC Large Combustion Plants Directive (2001/80/EC) will be closed before 2016. Others must meet the directive’s emission limit values or take equivalent measures to reduce pollution. More importantly, lignite is highly carbon‐intensive, and the EU‐ETS will penalise lignite‐fired generators after 2012, when they will have to purchase allowances to cover all their emissions. Developments in carbon capture and storage technology may provide lignite viability in a carbon‐constrained world in the long term, but the government expects coal‐fired generation to decrease by 5% per year to 2030.
Reducing the use of lignite would help Greece mitigate climate change and local air pollution, and meet its EU target for renewable energy. On the other hand, it would probably also lead to large increases in natural gas imports, which would be negative for the country’s energy security and balance of payments.
Reducing the use of lignite will also imply a reduced need for lignite mining, perhaps at a much faster rate than currently anticipated. The government should already consider options for alleviating the social impacts of such a development. It should address any possible social impacts directly and avoid measures that interfere with the functioning of the energy market. An early way to reduce the impact of mine closures would be to improve productivity at mines. This would mean gradually reducing the number of miners, so that fewer miners would have to be laid off in the future when mines are closing. Higher productivity would also help to extend the lifetime of the mines and maintain lignite as a viable domestic source of primary energy. Commendably, Greece is not subsidising lignite mining and the price of lignite is determined by the market.
The domestic lignite‐mining industry has been dominated by PPC, but this company is no longer allowed to open new mines. Independent miners are now producing some 4% of all lignite, up from less than 3% in 2005. Implementing the EU Commission’s August 2009 decision to tender new mines only to new operators, and reducing PPC’s control of lignite‐fired power generating capacity would improve competition in the Greek electricity market. The government should take the required measures without delay.
RECOMMENDATION
The government of Greece should:
Prepare for a situation where, after 2012, demand for lignite may rapidly decrease and measures for alleviating the resulting impacts would be needed; facilitate productivity improvements in mines and focus on direct social policy measures as a form of support to lignite mining.
Share of renewable energy: 7.5% in TPES and 15% in electricity generation (IEA averages: 7.7% and 17.7%), up from 5.4% and 8.1% in 2000
Biofuels and waste: 3.8% of TPES and 0.4% of total electricity generation
Hydro: 2.1% of TPES and 10.9% of total electricity generation
Other renewable energy: 1.5% in TPES and 3.7% of total electricity generation
SUPPLY AND DEMAND
In 2010, renewable energy sources provided 2 Mtoe or 7.5% of total primary energy supply (TPES) in Greece. Their share of TPES has been a stable 5% to 6% for the past two decades and only increased significantly in 2010 (see Figure 27). Renewable energy sources accounted for 21% of total energy production.
Biomass and waste provided most renewable energy in 2009, totalling 1 Mtoe. They comprised fuel wood (29% of renewable energy supply), vegetal waste (14%) and liquid biofuels (4%). At 6.6 TWh, hydropower generated 28% of total renewable supply. Over the last decade, its share in TPES averaged 1.3%, ranging from 0.6% to 2.1%, according to hydrological conditions.
Solar energy is used for directly heating water; its use for electricity generation is still negligible. This solar thermal energy supply was around 0.1 Mtoe per year from 1999 to 2005. In 2010, it reached 0.2 Mtoe, or 0.8% of TPES. This is the highest share for solar energy among IEA member countries, ahead of Spain with 0.6%, and Austria and Germany with 0.5% of TPES. Wind power supply has increased fast recently, equalling solar energy in 2009. Greece has the seventh‐highest share of wind power in TPES among the IEA member countries.
All in all, 40% of primary renewable energy in Greece is used in buildings for heat generation, and around the same share goes into electricity generation. The rest is consumed in industry and agriculture.
Despite the forefront position in terms of solar and wind energy, Greece has a comparatively low share of total renewable energy sources in TPES (see Figure 28). Electricity from renewable sources represented 15% of total electricity generation in 2010, while the IEA average was 17.7% (see Figure 29). The country has, however, large untapped renewable energy resources. Its plans to exploit them are laid out in the 2010 National Renewable Energy Action Plan (see below under Policies and Measures).
Figure 29. Electricity generation from renewable energy as a percentage of all generation in IEA member countries, 2010*
0
20
40
60
80
100%
Hydro Wind Geothermal Solar, other** Biofuels and waste
* Estimates.
** Other includes tide and wave.
Source: Energy Balances of OECD Countries, IEA/OECD Paris, 2011.
INSTITUTIONS
The Ministry of Environment, Energy and Climate Change (MEECC) is responsible for renewable energy policy in Greece. The ministry was formed in November 2009 by merging the Ministry for the Environment, Physical Planning and Public Works and the Ministry of Development.
The Regulatory Authority for Energy (RAE) has a key role in licensing projects for electricity generation from renewable sources. The Hellenic Transmission System Operator (HTSO) is in charge of planning electricity network development which is crucial to enable large capacity increases in renewable energy generation. The Public Power Corporation (PPC) is the system operator on the non‐interconnected islands with major potential for new renewable energy capacity. Municipal, prefectural and regional authorities are also involved in the licensing of renewable energy projects.
The Centre for Renewable Energy Sources and Saving (CRES) is the national body responsible for promoting renewable energy sources and the rational use of energy and energy saving. It is supervised by the Minister of Environment, Energy and Climate Change and has financial and administrative independence. CRES facilitates national energy planning, assists in the formulation of energy policy and fosters research and development related to renewable energy.
Renewable energy policy in Greece is guided by EU requirements. The non‐binding targets for 2010 for biofuels and electricity from renewable sources have been replaced by a binding target to increase the share of renewable energy in gross final energy consumption by 2020. Under Directive 2009/28/EC9, Greece must increase this share
from 6.9% in 2005 to 18% in 2020.10 The overall target for the EU is 20% by 2020. The directive also includes a separate target for renewable sources to provide 10% of final energy in the transport sector by 2020.
The directive was transposed into national legislation by Law 3851/2010 (Accelerating the development of renewable energy sources to deal with climate change and other regulations in topics under the authority of the Ministry of Environment, Energy and Climate Change) which came into force on 4 June 2010. The law sets a more ambitious target than the directive: 20% of gross final energy consumption, instead of 18% required by the directive. The law also sets a specific target for renewable sources to generate 40% of all electricity in 2020 and to provide 20% of primary energy for heating and cooling in 2020.
Law 3851/2010 also introduces several changes to previous legislation. It simplifies the licensing procedures, revises the feed‐in tariff system and tackles barriers to renewable energy projects at local level. It also establishes specific regulations for the use of renewable energy in buildings in accordance with the Energy Performance of Buildings Regulation (ΚΕΝΑΚ). These revisions are detailed below.
The government plans to reach the 2020 renewable energy targets through a combination of measures on energy efficiency and renewable energy. Policies and measures to this end are detailed in the July 2010 National Renewable Energy Action Plan (NREAP). The plan contains three scenarios with differing results for final energy consumption, renewable energy contribution and capacity. They are presented in Table 12. In all scenarios, electricity provides by far the largest increase in renewable energy use.
9. Directive 2009/28/EC of the European Parliament and of the Council of 23 April 2009 on the promotion of the use of energy from renewable sources and amending and subsequently repealing Directives 2001/77/EC and 2003/30/EC.
10. The IEA and EU use slightly different methodologies for calculating TFC. The differences are detailed in Box 3.
Ambient heat 0.02 0.02 0.02 0.12 0.13 0.21 0.19 0.28 0.36 Biofuels in transport
0.11 0.11 0.11 0.28 0.39 0.39 0.41 0.62 0.69
% RES in gross final energy consumption
9% 9% 9% 12% 15% 16% 14% 20% 21%
Source: National Renewable Energy Action Plan 2010.
General investment subsidies
From 2004 to the end of 2009, the government subsidised investments in renewable energy projects under the National Development Law (L3299/2004, amended by L3522/2006). It was a framework law, covering all economic sectors. The subsidy was for the total investment cost and could range from 20% to 60% depending on the region and the size of the company. The subsidy rates were the highest in regions with high unemployment and low income per capita.
Under Law 3522/2006, tax deductions were granted for small domestic renewable energy systems. The deduction amounted to 20% of the purchase cost and was capped at EUR 700 per system. The deductions were primarily used for the purchase of solar thermal systems, but they also covered solar photovoltaic (PV) systems, small wind turbines and cogeneration systems as well as thermal insulation of existing buildings and switching from oil to natural gas in central heating.
By the end of 2009, around EUR 500 million in investment subsidies had been granted under the 2004 law. On 1 January 2010, the law expired, however. A new Development and Investment Law 3908/2011 came into force on 1 February 2011 and provides support to RES investments (except for PV plants) through a combination of tax incentives and grants.
Renewable energy investments continue to receive subsidies from the Greek State and the EU under the Greek Operational Programme for Competitiveness (OPC), an EU vehicle for supporting low‐income regions. Under the OPC 2000‐2006, around EUR 190 million in subsidies were granted for renewable energy investments. Under the current OPC which runs until the end of 2013, no such subsidies are foreseen.
Box 3. Final energy consumption: differences between IEA and EU methodologies
Directive 2009/28/EC introduced a target for the EU as a whole to increase the share of renewable energy to 20% of gross final energy consumption by 2020. It also set specific binding targets for each EU member state. While the IEA annually publishes detailed energy statistics and energy balances for all EU countries, its methodology differs from the one in the directive. The IEA publications, including this study, report the countries’ net total final energy consumption (TFC). Therefore, the share of renewable energy in “gross final energy consumption” is not directly available in the IEA statistics.
In the directive, "gross final consumption of energy" is defined as energy commodities delivered for energy purposes to industry, transport, households, services, agriculture, forestry and fishing. In particular, the EU definition does, but the IEA definition does not include the consumption of electricity and heat by the energy sector for electricity and heat production, losses of electricity and heat in distribution and transmission, and consumption for international aviation. On the other hand, IEA TFC includes non‐energy use, but the directive TFC does not. More information about the IEA statistics can be found at www.iea.org/stats/index.asp.
ELECTRICITY
According to the NREAP, power generation from renewable sources should more than triple from 2010 to meet the 2020 target of 40% in all electricity generation. The NREAP’s compliance scenario projects the installation of almost 7.5 GW of wind power by 2020, together with 2.2 GW of PVs, 250 MW of concentrating solar power plants, 250 MW of bioenergy installations (biogas and solid biomass), 250 MW of small hydro plants and 120 MW of geothermal energy. It also projects 350 MW of new large hydro capacity and 880 MW of pumped storage plants, resulting in a 40% share for renewable energy in electricity production. To meet the target, the government has increased feed‐in tariffs and reduced the duration of licensing procedures. The transmission system
operator has also prepared a plan for developing the transmission network to accommodate a large increase in renewable energy supply. These actions are detailed below.
PPC, the dominant power generator, is planning to invest billions of euros in the coming years in renewable energy. The allocation of free emission allowances under the EU‐ETS will finish by the end of 2012, and increasing the share of renewable energy in its generation mix will help PPC reduce carbon emission costs. In a recent move, PPC has announced plans to construct a 200 MW solar PV park in Kozani, in western Macedonia, and an accompanying plant to produce solar panels.
Table 13. Electricity from renewable sources, 2005 to 2020
Source: National Renewable Energy Action Plan 2010.
Feed‐in tariffs
In addition to investment subsidies, the government has long used feed‐in tariffs to encourage investments in electricity generation from renewable sources. The current tariff system was introduced by Law 3851/2010 (see Table 14), revising the 2006 system and increasing feed‐in tariffs, in particular for wind and solar power where Greece has a large untapped potential. The tariffs are generally valid for 20 years. The tariff rate varies from EUR 88 per MWh for wind to EUR 285 per MWh for solar thermal with storage and EUR 550 per MWh for PVs in households and small companies. For comparison, the average wholesale electricity price in Greece for the years 2007‐2009 was EUR 69 per MWh. For generators that have not received any capital investment subsidies, the feed‐
in tariff rates will be increased by 15% for biomass and biogas, and 20% for all other technologies.
The government is planning to increase the feed‐in tariff for wind power generation in areas with low wind potential. This provision of Law 3851/2010 had not come into force by July 2011. The government is also planning to introduce compensation for generators in case the system operator decides to curtail generation, reaching up to 30% of the curtailment. However, owing to the actual level of renewable energy penetration, there has been no need to activate this provision.
Table 14. Feed‐in tariffs valid since June 2010
Electricity source and capacity Tariff level (EUR per MWh)
Mainland Non-interconnected
islands
a) Wind energy >50 kW 87.85 99.45
b) Wind energy <50 kW 250
c) Small hydropower <15 MWe 87.85
d) PVs in households or small enterprises <10 kW 550
e) Solar thermal energy 264.85
f) Solar thermal with storage system (at least 2h at nominal load)
Source: National Renewable Energy Action Plan 2010.
A separate feed‐in‐tariff (FIT) for small rooftop PV systems of up to 10 kWp was introduced in June 2009. It applies to residential users and small companies, though a residence has to cover part of its hot water needs by some other renewable source (e.g. solar thermal) to be eligible for the FIT. The FIT is set at EUR 0.55 per kWh. It is guaranteed for 25 years and is adjusted annually for inflation (25% of the previous year's consumer price index). From 2012, the feed‐in tariff will decrease by 5% per year, but the total spending on the support has not been capped. For larger PV installations, a separate feed‐in tariff is granted for 20 years, with an annual reduction (see Table 15).
Table 15. Feed‐in tariffs for photovoltaics from 2009 to 2020
EUR per MWh
Year Month
Mainland Non-interconnected
islands
> 100 kW 10 <= 100 kW
2009 February 400 450 450
2009 August 400 450 450
2010 February 400 450 450
2010 August 392.04 441.05 441.05
2011 February 372.83 419.43 419.43
2011 August 351.01 394.88 394.89
2012 February 333.81 375.53 375.54
2012 August 314.27 353.56 353.55
2013 February 298.87 336.23 336.23
2013 August 281.38 316.55 316.55
2014 February 268.94 302.56 302.56
2014 August 260.97 293.59 293.59
For each n year as of year 2015
1.3 ASMCn-1 1.4 ASMCn-1 1.4 ASMCn-1
ASMCn-1: Average System Marginal Cost during the previous year (n-1)
Source: National Renewable Energy Action Plan 2010.
Siting
The siting of renewable energy installations at regional and local levels is guided by the Special Spatial Planning Framework for the Development of Renewable Energy Sources and Land Management (SPPF‐RES), approved in December 2008. It prioritises land use for renewable energy production over other types of land use and facilitates the environmental permitting of renewable energy projects in the country. It includes specific rules concerning forests and scrublands, highly productive agricultural land, and restricted areas (airports, military bases), wildlife areas and sites of archaeological interest. It also suggests specific regions as priority areas for the development of renewable energy facilities. In addition, Law 3851/2010 specifies that existing and future regional land management and development plans must be consistent with SPPF‐RES and allow for a maximum use of renewable energy potential.
Licensing
Licensing for renewable energy projects in Greece had long been a lengthy and complex process. Law 3851/2010 has changed this by simplifying licensing procedures and introducing shorter issuing deadlines.
Licensing procedures were simplified in two ways. First, the electricity generating licence from renewable sources or highly efficient cogeneration, i.e. the first main licence in the licensing process, will be granted by the Regulatory Authority for Energy (RAE) instead of the minister. RAE issues the electricity generating licence on the basis of technical and economic criteria. Secondly, the previously separate requirements for preliminary environmental impact assessment and evaluation, and final environmental terms approval have been merged into a single process.
Issuing deadlines were shortened and are now as follows:
generating licence: three months;
environmental terms approval: four months for installations with a larger impact and two months for low‐ or zero‐impact installations;
terms and conditions for access to the grid: four months;
installation licence: 45 days.
Under the previous licensing system, the authorisation procedures took more than three and a half years on average for small hydropower plants and wind farms, and reached 6 to 7 years in individual cases. The average in the current system is around one year for PV installations of less than 2 MW of capacity and around two years for other renewable energy plants. For very large projects, Law 3851/2010 has introduced fast‐track licensing, whereby the whole licensing process will take only 4 to 6 months. Fast‐track licensing applies to projects that require an investment of at least EUR 200 million, or at least EUR 75 million if they create a minimum of 200 new jobs. The process is managed by the Invest in Greece Agency.
Grid integration
HTSO, the transmission system operator, estimates that the realisation of the current National Transmission Development Plan will enable the connection of about 8.5 GW of renewable energy capacity in the interconnected system. This is in line with the compliance scenario of the NREAP. However, the construction of new transmission projects faces considerable difficulties and consequent delays, mainly owing to strong public opposition. Law 3851/2010 addresses this challenge by redirecting part of the revenue from renewable energy generators to the local communities.
HTSO updates the National Transmission Development Plan (NTDP) every year; this plan describes all the planned transmission projects for a five‐year period. The NTDP is first approved by the Regulatory Authority for Energy (RAE) and finally by the Ministry of Environment, Energy and Climate Change (MEECC) through a ministerial decree. All planned system enhancements are undertaken by the system owner (PPC), following an opinion by the regulator RAE.
RAE is studying possibilities for the development of new pumped storage hydro plants in the interconnected system. Recently, it has received licence applications for around 1 400 ΜW of pumped storage hydro units.
As explained in Chapter 9, Greece’s electricity system comprises an interconnected mainland system and non‐interconnected islands. These islands hold a large potential for renewable energy, mainly wind and solar. In the coming years, they are planned to be interconnected to the mainland grid. This would enable the decommissioning of the oil‐fired power plants on the islands. It will also enable the country to
develop local renewable energy plants (high potential of wind as Figure 30 illustrates, solar and in some cases geothermal energy) and supply the excess electricity to the mainland via the new grid connections;
develop local hybrid renewable energy plants, where appropriate in view of the local resources and needs;
design autonomous renewable energy systems and pilot implementation on small islands which may be difficult and uneconomical to connect to the transmission grid.
Figure 30. Wind speed map of Greece
TURKEY
TURKEY
BULGARIA
FYROM
ALBANIA
Sea of
Myrto
Sea of Crete
Ionian
Sea
Aegean
Sea
GREECE
High potential areas
0 50 100km
>8 m/sec winds
Athens
This map is for illustrative purposes and is without prejudice to the status of or sovereignty over any territory covered by this map.
Note: Generally, utility-scale wind power plants require minimum average wind speeds in the region of 6 m/s.
Source: CRES.
For the construction and operation of offshore wind farms, Law 3851/2010 establishes a tendering procedure. The Ministry of Environment, Energy and Climate Change will assess the environmental impacts from the construction and operation of offshore wind farms. It will then approve environmental terms for wind farms in selected areas and organise an open public tender for the exploitation rights of these areas.
With the aim to optimise the interconnection of the islands and to effectively exploit their renewable energy potential, Law 3851/2010 requires the system operator to submit by the end of 2010 a separate Strategic Study in the scope of the System Development Study for the period to 2020. The first phase of the study has been published, following a public consultation period, while the second phase was in progress in May 2011.
HEAT
The government plans to increase the share of renewable energy in primary energy for heating and cooling to 20% by 2020 mainly through the continuous growth of solar thermal installations in the residential and service sector, the stabilisation of the biomass share in the residential sector, and gradually increasing the use of heat pumps.
The use of renewable energy for heating and cooling was supported by tax rebates and investment subsidies under the 2004 Development Law. However, these expired in the beginning of 2010. The new Development and Investment Law 3908/2011 continues the investment support (except for PV plants) through a combination of tax incentives and grants.
The legal framework is provided by Law 3734/2009 for the cogeneration of heat and electricity, and by Law 3851/2010 that obliges new or refurbished buildings to meet 60% of their hot water needs through solar thermal systems after 1 January 2011. Buildings are exempt when their hot water is provided through decentralised energy systems based on renewable sources, CHP, large‐scale district heating or efficient heat pumps.
Law 3851/2010 and the technical requirements set by the Energy Performance of Buildings Directive, which sets minimum requirements for the contribution of solar thermal systems for all new buildings, are expected to increase the use of solar thermal applications. The new building regulation is the main legislative tool for promoting renewable energy systems for heating and cooling in the service and residential sectors, as well as in industry and agriculture.
Renewable energy use for heat production is further encouraged by the condition that feed‐in tariffs for rooftop PV applications are only applicable to residences that cover a part of their hot water needs by some other renewable energy source (e.g. solar thermal).
TRANSPORT FUELS
In 2009, biodiesel accounted for around 1.2% of all transport fuels, while bioethanol was not used at all. Greece fell short of meeting the non‐binding 2010 EU target of a 5.75% share for biofuels in transport fuels. For 2020, Greece and other EU member states have a binding national target: 10% of energy used in transport must come from renewable sources. Greece plans to meet this target mainly with liquid biofuels, mostly with imported bioethanol.
Since December 2005, biodiesel is blended with diesel to provide at most 5% of the blend volume. In 2009, this mandatory biodiesel content was increased to 7%. The law allows for the distribution of higher blends, as long as they are approved by the State Chemical Council. The higher blends must also be clearly labelled at the fuel stations, for
which a permit is needed from the Ministry of Economy, Competitiveness and Shipping and the Ministry of Environment, Energy and Climate Change.
Currently, Greece produces more biodiesel than it consumes. Both imported feedstocks and domestic crops, mostly sunflower, are used for its production. The government sees biodiesel production as an opportunity to use local biomass potential and is facilitating the development of supply chains in order to ensure a significant contribution of the domestic agricultural production. Plans to ensure compliance with the sustainability criteria as set by Directive 2009/28/EC include the design of a sustainability certification system for biofuels.
Electric and hybrid vehicles will also help to meet the 2020 targets, but only modestly. According to the NREAP, they are projected to account for around 1% of renewable energy use in the transport sector in 2020. The government has in any case introduced several measures to promote these technologies. Under Law 3831/2010, private hybrid, electric and hydrogen passenger cars in Euro classes Α and Β with a cylinder capacity lower than 1 929 cc are exempt from annual circulation taxes. Vehicles with a higher cylinder capacity are exempt from half of the annual circulation tax. Hybrid and low‐emission vehicles are also exempt from the registration tax. Finally, hybrid vehicles are not subject to traffic restrictions in the city of Athens.
CRITIQUE
In a remarkable change from the situation a few years ago, the Greek government is dedicated to greening the economy and has adopted ambitious policies and measures for increasing the use of renewable energy. Law 3851/2010 sets favourable framework conditions for the deployment of renewable energy and the way forward is outlined in the 2010 National Renewable Energy Action Plan. The national target for the share of renewable energy in gross final consumption by 2020 goes beyond the EU requirement. Meeting the separate target for electricity generated from renewable energy sources will help the country decarbonise its power sector. The government deserves to be applauded for these new targets and policies.
The government should now work to ensure that the ambitious 2020 targets are met. In the electricity sector, large investments in grids and generating capacity are needed. Greece has abundant wind power potential and the government foresees wind power capacity to increase from around 1.3 GW in 2010 to 7.5 GW in 2020, far more than other renewable energy technologies combined.
Careful planning is required to ensure a smooth integration of new renewable electricity capacity into the grid and to maintain the reliability of the electricity system as the share of variable generation increases. A key part of this development is to connect Greek islands with abundant wind and solar power potential to the mainland transmission network. It will also be essential to expand hydropower and/or natural gas capacity and build more interconnections to help balance variations in wind power generation.
Several other IEA countries have seen very fast growth in wind power capacity, notably Spain and Germany. Greece would do well to turn to their experience for guidance. The IEA also urges Greece, and other IEA member countries, to consider the recommendations from the wind energy roadmap (see Box 4), as appropriate under the national circumstances.
Box 4. Key recommendations of the IEA Wind Energy Roadmap
Set long‐term targets, supported by predictable market‐based mechanisms to drive investment, while pursuing cost reductions; set mechanisms for appropriate carbon pricing.
Advance planning of new plants to attract investment, taking account of other power system needs and competing land/sea usage.
Appoint lead agencies to co‐ordinate advance planning of transmission infrastructure to harvest resource‐rich areas and interconnect power systems; set incentives to build transmission; assess power system flexibility.
Increase social acceptance by raising public awareness of the benefits of wind power (including CO2 emissions reductions, security of supply and economic growth), and of the accompanying need for additional transmission.
Exchange best practice with developing countries; target development finance at wind power deployment bottlenecks; further develop carbon finance options in developing regions.
Complex licensing and siting procedures have caused long delays in renewable energy projects. It is therefore remarkable that Law 3851/2010 has shortened the licensing process by several years, and to just a few months in some cases. The 2008 Special Spatial Framework, in turn, has facilitated siting procedures for renewable energy projects. These are major improvements and the IEA congratulates the government for this. In another welcome development, Law 3851/2010 also increases the public acceptance of renewable energy projects by channelling the local communities more money from the generators – a simple and effective measure.
Electricity generation from renewable sources is encouraged by feed‐in tariffs and investment support (except for PV plants) through a combination of tax incentives and grants. The current feed‐in tariff system is branded by technology and, for most technologies, is valid for 20 years. Swift licensing procedures and generous subsidies will no doubt help to deliver on ambitious renewable energy targets, but as subsidies always come at a cost, the government should closely monitor the cost‐effectiveness of the feed‐in system. A holistic approach to cost‐effectiveness is encouraged, because spending on both renewable energy and energy efficiency is a means of meeting both the EU 2020 targets and the primary energy policy goals of securing supplies, fostering economic growth and protecting the environment.
The government should also consider decreasing the feed‐in tariffs in a predictable and transparent way over time as technologies mature. Furthermore, it should explicitly consider limiting the total spending on feed‐in tariffs, or spending on individual technologies. It could do this either by limiting the absolute spending on individual technologies, or by limiting the share of individual technologies in total spending on feed‐in tariffs. This would help the government avoid possible feed‐in tariff budget overruns and subsequent abrupt reductions in feed‐in tariff levels, as experienced in several IEA countries, and in particular with solar PV. The government could also consider a system of gradually decreasing the premium on the wholesale price – the higher the wholesale price, the smaller the premium
needed. Such a premium system would provide some revenue guarantees to underpin investment, but also long‐term downward pressure on prices.
Wind and solar power are projected to grow the fastest within the Greek renewable energy sector, but the country has large untapped potential also for biomass, geothermal and solar thermal energy. Greece is therefore encouraged to develop a national policy for increasing the use of these forms of energy. Commendably, Law 3851/2010 (RES Law) and Law 3809/2011 (Investment Incentives Law) contain substantial incentives for increasing their use. In particular, regulations adopted in 2010 stipulate that 60% of the hot water supply in new and renovated buildings must come from solar energy, when other decentralised clean energy sources are not used.
The use of renewable energy for heating and cooling was supported by tax rebates and investment subsidies under the 2004 Development Law. However, these expired in the beginning of 2010 and left the sector pending the adoption of a new subsidy framework. The government should in general work to avoid uncertainty in subsidy policy. In particular, time lags between announcing new financial incentive schemes and actually implementing theme typically prompt consumers and producers to wait for the new support systems to become active. Such time lags should be minimised in order to facilitate a smooth development of the renewable energy market.
In the transport sector, Greece would benefit from a more detailed plan for meeting the 2020 renewable energy target, because the distance to the target is relatively long. On a general level, the country’s plans rely heavily on expanding the use of biofuels. It is essential to ensure that these are produced in a sustainable and cost‐effective manner and help reduce greenhouse gas emissions. As the government foresees imported bioethanol to become the prominent form of biofuels, it should ensure that the sustainability certification schemes are aligned with those adopted in other EU countries and internationally (e.g. Roundtable for Sustainable Biofuels). Using more electric vehicles would help reach the 2020 target – and improve energy security, because oil is imported but electricity is mostly generated from local resources.
RECOMMENDATIONS
The government of Greece should:
Ensure a timely adoption and implementation of the relevant plans for swiftly connecting Greek islands to the mainland transmission system.
Consider ways to control the costs of the feed‐in tariff system, for example by reducing the tariffs over time or linking them more closely to the wholesale power price.
Encourage further diversification of renewable energy beyond wind and solar power, and develop national policies on biomass, geothermal and solar thermal energy.
Clarify the policies and measures for meeting the 2020 target for renewable energy in the transport sector; align biofuels sustainability certification with other EU countries and internationally to facilitate trade.
In 2010, total electricity generation was 60.8 TWh, down marginally from 61.1 TWh in 2009. From the late 1990s to 2007, power generation grew on average by around 3% per year, but the economic recession changed this trend. Growth in 2008 slowed to 0.3% and fell by 2.9% in 2009 and declined by a further 0.5% in 2010.
Greece is a net importer of electricity, importing a net 5.6 TWh in 2008, 4.4 TWh in 2009 and 5.7 TWh in 2010. Imports have become an important source of electricity supply over the past decade, as interconnection capacity with neighbouring jurisdictions has increased. Greece generally imports power from Bulgaria and the former Yugoslav Republic of Macedonia (FYROM) while exporting to Albania and Italy (see Figure 31).
Coal, in the form of lignite, is the most important source for electricity generation, providing 45% of the total in 2010. While production levels have been quite stable between 1998 and 2009, its market share has gradually declined from 70% to 56% (see Figure 32). In 2010, electricity generation from coal dropped by a fifth, partly because of plant closures, while gas‐fired generation increased by half. Natural gas has been the main source for incremental power generation since the late 1990s. It generated only 1.7 TWh in 1998, but 11 TWh in 2009 and 16.5 TWh in 2010, or 27% of the total. Wind is another fast‐growing power source, providing 3.5% in 2010, with total renewable sources other than hydro providing 4.1%. Oil provided 13% and hydro 11% of the total gross generation in 2010.
The government has set a target for renewable sources to provide 40% of electricity in 2020. For this to happen, the generation portfolio will have to change drastically. While total electricity supply is projected to increase by 16% to 22% from 2010 to 2020, electricity supply from renewable sources is projected to increase by 3.5 times from 2010. This anticipated increase will mainly come from wind power, where generating capacity is expected to grow by more than 6 GW over this timeframe. Gas‐fired generation is also expected to grow, while coal‐fired generation will decrease. As a result, electricity generation would become far less carbon‐intensive.
Electricity consumption reached 56.7 TWh in 2008. This was roughly 40% more than a decade earlier, reflecting a growth rate of 3.7% per year from 1998. However, in 2009 as a result of the economic crisis, consumption declined by 3.4% (to 54.7 TWh). The government projects electricity demand to grow by 0.8% per year to 2020 and by 1.1% per year to 2030.
In 2009, households accounted for 33% of total electricity demand, while commercial services consumed 29.5% and industry 26% (see Figure 33). Agriculture accounted for 5.5% of the total and public services for 5%. Services have been the fastest‐growing sector over the past two decades.
Figure 33. Electricity consumption by sector, 1973 to 2009
** Other includes commercial, public service, agricultural, fishing and other non-specified sectors.
Source: Energy Balances of OECD Countries, IEA/OECD Paris, 2010.
GENERATING CAPACITY AND PEAK DEMAND
At the end of 2009, installed generating capacity reached 13 168 MW in the interconnected system (see Table 16). The lignite‐fired fleet topped the list with 5 250 MW (40% of the total), followed by hydropower with 3 017 MW (23%). While coal and hydro capacity has been stable, natural gas and wind power capacity have increased rapidly in the last decade (see Figure 35). Natural gas reached 2 880 MW (22%) and wind 917 MW (7%). Total capacity, including plants on the non‐interconnected islands, was 15 107 MW at the end of 2009.
Power plants on the non‐interconnected islands use mainly oil, which accounts for 90% of generation, but also renewable energy sources. Wind has a particularly large potential for capacity increases. It is becoming more important also for the entire Greek electricity
system, as interconnections between islands and the mainland system are being developed.
Electricity demand in Greece peaks usually in July or August, mainly owing to air‐conditioning loads (see Figure 34). According to HTSO, the transmission system operator, demand in the interconnected system peaked in July in 2007‐2010, reaching 10.4 GW in 2007 and 10.2 GW in 2008. Financial incentives were used to reduce the load during peak period by 500 MW in 2007 and 150 MW in 2008. In 2009, demand peaked at 9.8 GW. The drop was mainly because of the economic crisis, and together with expansions in combined‐cycle gas turbine (CCGT) capacity, it increased the capacity margin to improve security of electricity supply. In 2010, demand peaked at 9.9 GW.
Figure 34. Monthly peak electricity demand, 2006 to 2009
6 000
7 000
8 000
9 000
10 000
11 000
12 000
Jan Feb Mar Apr May Jun Jul Aug Sep Oct Nov Dec
MW2006
2007
2008
2009
Source: Ministry of Environment, Energy and Climate Change.
Table 16. Installed electricity generating capacity in the interconnected system, 31 December 2009
Energy source Installed capacity
MW %
Lignite 5 250 39.9
Oil 730 5.5
Natural gas 2 880* 21.9
CHP 104.7 0.8
Hydro 3 017 22.9
Renewable energy: 1 186 9.0
Wind 916.6 7.0
Small hydro 182.6 1.4 Biomass-biogas 40.8 0.3 Photovoltaics 46 0.3
TOTAL 13 168 100
*Two large CHP units (over 50 MW) totalling 116.1 MW are included.
Greece’s electricity market is shaped by the 2005 Electricity Market Law (3426/2005) which transposed the second EU Directive on the Internal Electricity Market (2003/54/EC) into Greek legislation. Following its adoption, Grid and Market Operation
Codes were established later in 2005. The implementation of the requirements of the law and the codes was completed in September 2010.
After fully implementing the second Electricity Market Directive, the government drafted a law to implement the EU’s third Internal Electricity and Natural Gas Market Directives (2009/72/EC and 2009/72/EC). The parliament adopted law 4001/2011 in August 2011. The law introduces several changes to, inter alia, the powers of the regulator and the ownership structure of the transmission system operator (see Box 1 in chapter 2).
The Regulatory Authority for Energy (RAE) is also the regulator for electricity. It was established in 1999 to the provisions of Directive 96/92/EC. By international comparison, however, the role of RAE has remained rather limited, as it mainly advises the Ministry of Environment, Energy and Climate Change. It makes proposals on rule‐making and provides opinions on licence issuances and tariff‐setting. Tariffs are set by the minister after RAE’s opinion. It also supervises the Hellenic Transmission System Operator (HTSO) and monitors security of supply. The task of monitoring market competition, including merger control, is shared between RAE and the Hellenic Competition Commission (HCC). HCC is overseen by the Ministry for Finance and acts as an advisory body. A stronger and more independent role for the regulator is mandated by the third EU Electricity Market Directive (2009/72/EC) and envisaged in law 4001/2011 that transposes the directives (see Box 1 in chapter 2).
MARKET DESIGN
The Greek electricity market includes two separate markets – a wholesale electricity market and a capacity assurance market. The market is open to generators and suppliers holding a supply licence and to self‐supplying customers. The HTSO operates the market under the Grid and Market Operation Codes.
The wholesale market has been in operation since mid‐2005. Its design is depicted in Figure 36. It is a mandatory pool with the following three elements:
day‐ahead scheduling and market clearing;
real‐time dispatch;
ex post imbalance settlement.
The day‐ahead market is obligatory for all generators and suppliers. The day‐ahead market clearing produces a system marginal price (SMP) for every hour of the following day, and this price is applied to all generators and suppliers, unless transmission constraints occur. In case of transmission constraints, the market is split into two price areas (northern and central/southern Greece). A marginal generating price is then established for each zone, and the SMP will be their weighted average. This system provides an incentive to locate generating capacity in the zone with a supply deficit.
Between the day‐ahead settlement and real‐time delivery, the real‐time dispatch operation takes place to ensure overall system reliability. Financially, this real‐time dispatch is mirrored by the ex post imbalance settlement, where HTSO calculates the marginal imbalance price on the basis of offers by the units dispatched for balancing and applied to deviation of schedule and dispatch. This marginal imbalance price is the penalty for generators failing to fulfil their offer.
Figure 36. Design of the wholesale electricity market
Producers
Importers
Hydro and renewables
Security constrained dayahead schedule
System Marginal Price(singlefor suppliers, may be zonalfor generators), primary andsecondary reserve prices
Day ahead
Energy and reserve offers,
techno-economic
declarations, non-
availability declarations
On the day After the day
Suppliers
Exporters
Pumpting units
Declarations of load and
exports (may be priced)
Payments
Charges
Real-time dispatch
Dispatch instructionsand adjustments of dayahead schedule
Energy and reservesschedule, satisfyingsystem andgenerating unitsconstraints
DA
Sse
ttlem
en
to
fa
cco
un
tsfo
re
ne
rgy
Dispatch instructionsand instructeddeviations
Imbalances settlement
Calculation of imbalancesbetween measured andscheduled production (notincluding instructeddeviations). Settlement atthe imbalances marginalprice. Additional paymentsfor instructed deviations.
Me
asu
rem
en
td
ata
Imbalance payments
and charges.
Payments for reserves
and ancillary services
provided
Imbalance
payments and
charges. Charges
for reserves and
ancillary services
provided.HTSO
Transmission system
constraints, reserves
needs, market split rules
P
Q
SMP
Source: RAE.
The capacity assurance mechanism ensures that suppliers of electricity can back up their supply with generating capacity. Generators issue annual capacity availability tickets (CATs) in one‐MW steps reflecting their generating capacity. Suppliers have to purchase these CATs to cover their supply obligations, plus a security margin. Additionally, HTSO can tender for new capacity through an ad hoc mechanism, when it perceives a capacity shortfall. However, as there are only a few market participants, HTSO has acted as a counter‐party for capacity contracts at regulated CAT prices. This transitional period is in force until September 2012.
INDUSTRY STRUCTURE
The electricity sector remains dominated by the state‐controlled Public Power Corporation (PPC) and its subsidiaries (see Figure 37), although legal reforms and new entrants in the electricity sector are weakening PPC’s position. PPC is listed on the Athens and London stock exchanges, but 51.12% of its shares are still owned by the Greek State. Presidential Decree 333/2000 prescribed 51% minimum ownership by the government and limited the voting rights of other shareholders to 5%. The European Commission considered this voting cap to violate EU rules on the free movement of capital and referred Greece to the EU Court of Justice in May 2010. By law 3851/2010, Greece finally abolished the voting cap. The fiscal austerity measures that the Greek parliament adopted in June 2011 include reducing the State’s shareholding in PPC from 51% to 34% in 2012, although the State may retain control of the company’s management.
PPC’s share in total installed capacity in the interconnected system has declined from 98.6% in 2003 to 83.7% at the end of 2009 and below 77% at the end of 2010. The company continues to control almost all capacity on the non‐interconnected islands. PPC owns all lignite, oil and large hydropower plants in Greece and, through its subsidiaries, has a small share of new renewable electricity capacity. However, PPC may by law only build new capacity to replace its existing plants. It is shutting down several lignite‐ and oil‐fired plants before 2016 to comply with EU air pollution legislation.
New entrants to electricity generation have mostly built gas‐fired plants, increasing this capacity from 540 MW in 2006 to almost 2 100 MW at the end of 2010, or more than 50% of total gas‐fired capacity. Independent power producers (IPPs) have plans to build more new combined‐cycle gas turbine (CCGT) plants in the next few years (see Table 18). Mytilineos Holdings S.A. is the largest IPP in Greece and is expected to have 1 700 MW of installed thermal power capacity in operation by 2011, increasing to almost 2 400 MW by the end of 2013. It also has more than 1 000 MW of renewable electricity capacity in different stages of development.
PPC also dominates the wholesale electricity market, although its market share has declined from 87% in 2008 to 85.6% in 2009 and 77.3% in 2010. PPC also owns all transmission assets and 49% of HTSO, the transmission system and wholesale market operator. The rest of the HTSO shares are owned directly by the Greek state. Law 4001/2011 stipulates how the network assets will be unbundled from PPC’s other activities (see Box 1 in chapter 2).
In the retail market, all customers in the interconnected system are free by law to choose their electricity supplier since July 2007, but retail competition remains very limited. At the end of 2010, 56 suppliers held a retail and trading supply licence, but only about ten companies in addition to PPC supply power to retail customers. The remaining companies holding a supply licence are only active in wholesale trading. At the end of 2010, PPC supplied a good 93% of retail electricity and the new entrants more than 6%, up from 1% in 2009. PPC owns all distribution assets and is the supplier of last resort.
The Regulatory Authority for Energy has identified several factors explaining why competition in the retail sector has remained minimal. End‐user tariffs have been set too low and have not been cost‐reflective. They have also contained cross‐subsidies between customer classes, as commercial customers pay higher tariffs than households. The Supply Code prescribes that the end‐user prices for medium‐ and low‐voltage customers will be regulated as long as PPC holds at least 70% of the market. There is also a lack of customer information, including load profiles, and a lack of effective unbundling of the Distribution System Operator from PPC. Law 4001/2011 to implement the EU third Internal Energy Market Directives proposes a solution to the unbundling issue, by providing the necessary safeguards for the independence of the DSO (see Box 1 in chapter 2).
Customers on small non‐interconnected islands where total consumption in 1996 was less than 500 GWh remain captive, as most of the islands have a single generator and the code for regulating the market and distribution grid operation on the islands has not yet been adopted. This means that there are no provisions as to how independent suppliers should purchase the energy necessary to cover their customers’ needs.
The Greek transmission system consists of around 16 000 km of high‐voltage lines (circuits), including 400 kV alternating current (AC) and direct current (DC), 150 kV and 66 kV lines and cables, plus 12 EHV substations (400/150 kV), 44 autotransformers 400/150 kV, around 200 HV substations (150/20 kV) and over 300 transformers 150/20 kV. The backbone of the transmission system are the 400 kV AC lines connecting the north of the country to the Athens and Thessaloniki areas. Most of the country’s electricity is generated in northern Greece, close to the major lignite mines.
Figure 38. Greek transmission network, 2010
ALBANIA
FYROM
BULGARIA
To Italy
Corinth
Megalopolis
Ladonas
Patras
Larissa
LourosPlastirasKremasta
GionaStratos
Ag. Stef.
Pallini
Lavrio
Kourou
Kastraki
Distomo
Polyfito
Agras Adessaios
FlorinaElbasan Thessaloniki
Sfikia
Ag. Dimitrios
AsomataMakrohori
Filippi N. Santa
TURKEY
Komotini
PlatanovrisiThisavros
Bitola
Skopje 4
Dubrovo
Blagoevgrad
Figes Agos
Ptolemaida
Amynteo
Aharnes
Thermal power plants
400 kV in operation
400 kV under const.
Hydro power plants
0 50 100km
This map is for illustrative purposes and is without prejudice to the status of or sovereignty over any territory covered by this map.
Main power lines
Source: HTSO.
The Greek transmission system is divided into an interconnected mainland system and non‐interconnected islands. Some of the islands close to the mainland, such as the Ionian Islands and certain Aegean islands are connected to the mainland system through submarine cables, while the non‐interconnected islands are served by autonomous
power plants. Total supply in the non‐interconnected islands was about 5.1 TWh in 2009, while total supply in the interconnected system was 52.8 TWh.
HTSO is responsible for system operation, maintenance and development of the transmission system, while PPC remains the owner of transmission and distribution assets. For the transmission system development, HTSO issues annually a five‐year plan covering demand, new generation to the system and interconnection needs. Following the opinion of RAE and PPC, the plan is finally approved by the Minister of Environment, Energy and Climate Change. Transmission system operations will be reorganised as part of implementing the third EU Electricity Market Directive (see Box 1 in chapter 2).
CROSS‐BORDER INTERCONNECTIONS
The Greek electricity system is interconnected with Bulgaria, the former Yugoslav Republic of Macedonia and Albania through four 400‐kV AC lines (see Table 19). There is also a 150‐kV AC line with Albania. The interconnection with Italy is through a 400‐kV DC submarine cable across the Ionian Sea. These interconnections are mostly used for importing power to Greece, with the exception of the one with Albania which is mainly used for exports. Total transfer capacity of interconnection lines reaches around 15% of current peak demand in Greece. In addition, a 400‐kV AC interconnection with Turkey became operational in September 2010, after synchronising the Turkish and the European Network of Transmission System Operators‐Electricity (ENTSO‐E) systems. The Greek‐Turkish interconnection became commercially operational in mid‐2011. A second 400‐kV AC line with Bulgaria and a second 400‐kV DC line with Italy are being planned.
Table 19. Net transfer capacities between Greece and its neighbours, winter 2010‐2011
Country To Greece, MW From Greece, MW
Albania 100 150
Bulgaria 550 500
FYROM 300 400
Italy 500 500
Total 1 450 1 550
Net transfer capacity = total transfer capacity ‐ transmission reliability margin.
Source: ENTSO‐E, available from www.entsoe.eu/resources/ntc‐values/ntc‐map/
DISTRIBUTION
The Greek distribution network consists of around 102 000 km of medium‐voltage lines and 115 000 km of low‐voltage lines. The distribution network is owned and operated by PPC. The 2005 Electricity Market Law stipulates the unbundling of the Distribution System Operation (DSO) from PPC and the merger of the Transmission and Distribution System Operator activities into one company (Hellenic Transmission and Distribution System Operator, HTDSO). Under the 2005 law, HTDSO was to inherit all HTSO’s responsibilities and also undertake the tasks of DSO by July 2007. The ownership of both the distribution and transmission networks was to remain with PPC. Law 4001/2011
specifies that the Network Distribution Operator (Hellenic Electricity Distribution Network Operator) is established as a 100% subsidiary of PPC (see Box 1 in chapter 2).
PRICES AND TARIFFS
Electricity prices to industrial customers in Greece are in the mid‐range among the IEA member countries, while prices to households are among the lowest (see Figures 39 and 40). End‐user tariffs have been regulated given that the retail market share of PPC remains above 70%. Tariff reform has been talked about for several years. A 2007 ministerial decision obliged PPC to reform the tariff system, including developing unbundled, cost‐based tariffs for each of the basic consumers groups and removing all cross‐subsidies and distortions, but progress has been slow. The first step towards the full reform was taken at the end of 2010, with the application of new tariffs from 1 January 2011 which introduces new, simpler, unbundled tariff structures, and partly removes the cross‐subsidies between customer categories. Retail tariffs are expected to be fully deregulated by mid‐2013.
The tariff system has caused several distortions in the electricity market. The average wholesale price of electricity tripled from 2004 to 2008, but the regulated end‐user tariffs were increased by only 40% for industrial users and by 25% for households (see Table 20). In 2007 and 2008, high fuel prices led to high wholesale electricity prices. As a result, the traders, importers and IPPs (with supply licences) found it more profitable to sell electricity to the wholesale market (mandatory pool) than to retail customers whose regulated end‐user tariffs remained stable. Customer switching was close to zero in 2007 and 2008, but the situation changed in 2009 and more so in 2010. In 2009, some commercial customers switched supplier from PPC to others, as wholesale prices dropped significantly and more companies became interested in supplying retail customers, instead of selling power to the wholesale market. 2010 saw a further increase in customer switching, as wholesale prices continued to decrease and independent suppliers could offer discounted prices to certain customer groups.
A so‐called social tariff is available since January 2011 for low‐income domestic customers with low consumption. The cost of supplying these discounted tariffs will be recovered through the public‐service obligation charges. Since 2007, public service obligations also include supplying the non‐interconnected islands at the same tariffs as the interconnected system and offering special discounted rates to families with more than three children. All consumers also pay a levy to cover the additional cost of renewable generation, which varies by consumer category. An additional charge related to available supply capacity, amounting to roughly EUR 6 per MWh is also paid by the consumers.
Table 20. Average annual electricity prices, 2004 to 2010
An excise tax on electricity is levied since May 2010 as one of the government responses to reduce the budget deficit. Industrial consumers pay EUR 2.5 per MWh and households EUR 5 per MWh. In addition to the excise tax, household customers pay also value added tax, which was increased from 9% to 13% in the beginning of 2011). The share of taxes in end‐user prices remains low by international comparison.
Figure 39. Electricity prices in Greece and in other selected IEA member countries, 2000 to 2010
Industry
0.0
0.1
0.2
0.3
0.4
2000 2002 2004 2006 2008 2010
USD/kWhItaly
Portugal
Greece
Spain
Households
0.0
0.1
0.2
0.3
0.4
2000 2002 2004 2006 2008 2010
USD/kWhItaly
Portugal
Spain
Greece
Source: Energy Prices and Taxes, IEA/OECD Paris, 2011.
Figure 40. Electricity prices in IEA member countries, 2010
Industry
8.9%
20.0
%
3.7
%
0.7
%
4.2
%
10.
5%
13.
6%
8.9
%
0.0
%
5.5
%
3.4
%
12.
9%
14.
7%
11.
1%
2.2
%
0.0
%
1.0
%
18.5
%
7.5
%
0.0%
22.8
%
0
0.1
0.2
0.3
0.4
0.5USD/kWh
Tax component
Note: Tax information not available for the United States. Data not available for Australia, Austria, Germany, Korea, New Zealand and Spain.
Households
7.9%
25.9
%
19.1
%
25.0
%
30.4
%
21.7
%
9.4%
11
.6%
21.
5%
17.
5%
4.8% 15.
9%
5.2
%
17.9
%
37.2
%
20.6
%
19.1
%
27.
2%
6.6
%
11.
9% 27.5
%
26.0
%
42.3
%
56.
0%
0
0.1
0.2
0.3
0.4
0.5USD/kWh
Tax component
Note: Tax information not available for Korea and the United States. Data not available for Australia and Spain.
Source: Energy Prices and Taxes, IEA/OECD Paris, 2011.
CRITIQUE
There have been a number of positive developments in the Greek electricity market since the 2006 in‐depth review. Greece has developed a strong vision to become a leading “green economy” and an international energy hub. The regulatory framework for developing an independent renewable energy sector has been strengthened and IPPs
have invested significantly in gas‐fired generating capacity. Interconnection capacity and opportunities for cross‐border trade have also been increased.
Further reform in electricity market structures and regulations is needed if Greece wishes to reach its ambitious energy goals. In particular, PPC still dominates both wholesale and retail markets although competition is finally emerging. The company also remains the owner of transmission and distribution assets and has a 49% stake in the operation of the transmission system and wholesale market. Law 4001/2011 which transposes the EU Internal Energy Market Directives and was adopted by the Parliament in August 2011 is a welcome instrument for reforming the market. The law should be fully enforced without delay. In particular, the regulator has lacked full independence and sufficient powers to execute effectively. Another area where reform is urgently needed is moving to cost‐reflective end‐user tariffs.
A strong and independent regulator is needed to mitigate PPC’s dominance, ensure non‐discriminatory treatment for IPPs and provide regulatory certainty for investors in a competitive energy market. Investments and competition are needed for ensuring the financial efficiency of the electricity sector. IPP investment in both renewable energy sources (RES) and flexible conventional generation will be necessary in the transformation to a low‐carbon, green electricity market. In general, because they need to gain market share, IPPs need to be more innovative and efficient than incumbents. Competition can also drive prices down and help mitigate the costs of necessary network investments and RES supports.
A strong and independent regulator is also required to enforce strict compliance with network unbundling conditions and non‐discriminatory rules for access to the network. PPC ownership of transmission and distribution assets gives rise to some concerns regarding both network connections and access, especially for smaller renewable energy developers which will be competing against PPC for RES deployment projects. Greece has opted for the independent transmission system operator (ITO) model for unbundling the transmission assets. This will improve the current situation, but an even better solution from the market perspective would be full ownership unbundling. As part of the privatisation programme, the government has opted to meet requirements for financial assistance from the eurozone countries and the International Monetary Fund. Greece should consider spinning off the network assets of PPC in separate companies and later privatising these companies. This would be better for electricity market development than simply reducing government ownership in PPC.
The regulator should oversee the operation of the wholesale market, including fully implementing market mechanisms, investigating and penalising any abuses (in conjunction with the Hellenic Competition Commission (HCC), where necessary) and further developing market rules. This is particularly important in the Greek context of a mandatory pool and regulated end‐user tariffs that do not necessarily reflect all supplier costs.
In a mandatory pool model with a highly concentrated supply situation, the potential for market abuse by the dominant player remains a concern. As the sole owner of lignite plants and large hydro plants, PPC has significant capacity that can be put first in the merit order and therefore has the potential to manipulate prices in the wholesale market. Potential distortion of both wholesale and retail markets reduces incentives for new entrants and may cause stagnation of generation plants investment and sound market development. In addition to tasking RAE with stronger supervision of the
wholesale market, the government should also consider divesting a reasonable percentage of PPC’s generating capacity.
Greece should move to reform the regulated retail tariff to better reflect wholesale market prices without delay. The electricity retail market became fully open in 2007 and there has been some progress in reforming retail tariffs, such as deregulation for larger customers (although a price cap remains) and the separate identification of public service obligation costs and network charges. However, below‐cost tariffs and cross‐subsidies are major impediments to competition in electricity supply, as has been witnessed over the past few years.
High electricity demand in 2007 and 2008 combined with poor water availability and high oil and gas prices drove up wholesale prices and caused significant revenue losses to PPC, which as the supplier of last resort was forced to sell electricity at prices below the wholesale price. In 2009, the tables turned as declining demand, combined with good water availability for hydro generation, drove down wholesale prices and caused significant revenue losses to independent gas‐fired generators.
RAE should be tasked with and fully empowered to put in place a programme with clear timelines and milestones to a transition to fully cost‐reflective retail tariffs and the elimination of cross‐subsidies. This transition should be completed urgently, or else PPC risks facing financial trouble as, from the beginning of 2013, it will have to start paying the full price of all CO2 allowances, which will inevitably increase its generating costs.
Expansion of interconnection capacity with the Balkan countries and the commissioning of the connection with Turkey are commendable progress towards regional market integration. With the full start of operation, interconnection capacity will provide more than 15% of current peak demand from the Greek system. Identifying more opportunities to expand interconnection could provide electricity security and market efficiency benefits. Auctioning the capacity under rules determined in co‐operation with Central‐South TSOs has brought new dynamism to the Greek wholesale market. The government should maintain efforts to expand interconnection capacity with neighbouring countries for regional market integration and encourage PPC’s crucial investments in interconnectors and domestic network.
Since the 2006 in‐depth review, many efforts to improve network reliability and supply‐demand conditions have been made. Upgrading domestic transmission networks and additions of new generation plants were important to secure electricity supply. Ongoing network projects, including reinforcement and strengthening of interconnection with islands will also contribute to facilitating wind power integration. Further network development should be encouraged to facilitate integration of more renewable electricity sources, including PV and wind.
In order to meet the 40% renewable electricity target by 2020, Greece will need considerable system flexibility, far in excess of what interconnections will be able to provide. The government should assess and take measures to meet the need for storage and more responsive demand, including advanced metering and time‐of‐use pricing of power to encourage demand response.
The five‐year horizon of current network planning is shorter than most network planning horizons and consideration should be given to extend it to a decade or longer. Complying with the European Network of Transmission System Operators‐Electricity requirements of a ten‐year network development plan and making even longer‐term
comprehensive planning would also facilitate the foreseen integration of significant renewable generation. New legislation to streamline licensing and spatial planning for network capacity additions should be considered in this context.
The Law on Renewable Energy Systems that was adopted in 2010 streamlines the licensing process and will thus help to maintain sufficient generating capacity margin. Lengthy licensing procedures have widely been recognised as a major obstacle to the deployment of wind power. Shortening the development period will help mitigate risk and encourage new investment for both wind power and other types of capacity additions. All this will also help Greece reach its ambitious target for renewable sources to supply 40% of all electricity by 2020.
RECOMMENDATIONS
The government of Greece should:
Support the swift implementation of recent legislation changes that reconstitute RAE as a strong independent regulatory authority with rigorous enforcement powers, which go beyond the minimum required in the third Internal Electricity Market Directive, and emphasise the enforcement of network unbundling conditions, ensuring non‐discriminatory network access and overseeing operations within the wholesale market.
Encourage divestiture of PPC assets to ensure a more competitive marketplace.
Task RAE with putting in place a programme, with clear timelines and milestones, to make a transition to fully cost‐reflective retail tariffs and the elimination of cross‐subsidies.
Maintain efforts to expand interconnection capacity with neighbouring countries for regional market integration and encourage PPC’s crucial investments in interconnectors and domestic network; consider these efforts within the context of enhancing system flexibility.
Continue to consider comprehensive and long‐term planning for network development with a horizon of ten or more years to ensure reliability and provide predictability to all market participants under fair conditions.
Consider new legislation to streamline licensing and spatial planning for network capacity additions.
10. Energy research, development and demonstration
125
10. ENERGY RESEARCH, DEVELOPMENT AND DEMONSTRATION
Key data (2010 estimates)
Government energy R&D spending: EUR 7.3 million (and 6.3 million in 2011), ‐53% from 2009, renewable energy projects receiving 33% of funding
Share in GDP: 0.03 per 1 000 units of GDP (IEA median: 0.32)
R&D per capita: USD 0.9 (IEA average: 16.6)
OVERVIEW
The General Secretariat for Research and Technology (GSRT), which belongs to the Ministry of Education, Lifelong Learning and Religious Affairs, is the main authority responsible for the development and implementation of R&D in Greece. Before autumn
2009, GSRT was part of the Ministry of Development.
National efforts on research, technology and innovation are based on the Strategic Plan prepared by GSRT under the National Strategic Development Plan 2007‐2013 (NSDP). The strategy includes 11 thematic priorities and energy is one of them. Energy R&D funding in Greece and the thematic priorities are analogous with those of the EU’s Seventh Framework Programme on Research, Technological Development and Demonstration (FP7) for 2007‐2013.
The thematic priority on energy includes the following objectives for publicly funded energy R&D in Greece:
Addressing climate change and ensuring – as a minimum – compliance with the Kyoto Protocol and EU 2020 goals;
Reducing dependence on crude oil in an environment‐friendly way by improving energy efficiency and developing innovative technologies for renewable energy sources and for managing the mineral resources;
Enhancing energy security by developing know‐how about interconnecting networks, especially the mainland electricity network with the networks on the islands, and for diversifying the primary energy mix, with an emphasis on domestic sources;
Saving energy in industrial and household use;
Promoting economic activity in the energy sector by developing an energy services industry and increasing the number of energy system facilities and energy conservation system facilities.
10. Energy research, development and demonstration
126
Under the thematic priority on energy, the following specific priorities are laid out:
Electricity production from renewable energy sources
A prerequisite for attaining the objective of increasing the share of RES‐based electricity production in Greece is to research, develop and demonstrate integrated electricity production technologies. The aim of the research is to increase the profitability of investments while maintaining environmental equilibrium by drawing on the country's energy potential.
Fuel production from renewable sources
The need to use alternative and renewable fuels instead of petroleum and its by‐products has accelerated developments in research, as environmental and economic reasons make the development of biofuels imperative. Emphasis is placed on improving the production processes of biofuels and on producing bioethanol and biodiesel.
Use of renewable sources for heating and cooling
Development of systems for energy conservation and rational use by exploiting innovative solar facilities and geothermal energy. Improving heat pumps and using absorption systems in households and in industrial and commercial buildings.
Hydrogen and fuel cells
Research in this area focuses on dealing with the shortcomings associated with the production, storage and safe use of hydrogen, and on seeking and making the most of alternative fuels.
Clean coal technologies
The key focus here is on developing new technologies that will enhance the performance of coal, lignite and natural gas, in terms of energy efficiency as well as in terms of contributing to the protection of the environment through lower gas emissions.
Smart energy networks
The research is focused on increasing the efficiency, flexibility, safety, reliability and quality of electricity and gas systems and networks, and of their interconnection with the European ones. Emphasis is placed on dealing with the problems associated with the integration of renewable energy sources in the electrical energy system.
Energy efficiency and conservation
The research in this field aims to develop systems and tools which shall contribute to the drastic reduction of energy needs in buildings.
10. Energy research, development and demonstration
127
Support of policies
Research in this area concerns the social, economic and institutional preparations for the uptake and diffusion of new energy technologies.
In view of the Fourth Programming Period of EU Structural Funds, GSRT has elaborated on the formation of the next national R&D policy through open consultation. Following the results of that consultation as well as the outcomes and experience derived from the programmes of the previous programming period, certain measures and programmes were proposed in collaboration with the National Council for Research and Technology (NCRT). As far as programmes funded under the Community Support Programme (CSF) are concerned, the evaluation of each concluded proposal and the programmes themselves is obligatory in the end.
INSTITUTIONS
The General Secretariat for Research and Technology (GSRT) supports the R&D activities of public research centres and universities and those of the private sector
through national programmes. It is also responsible for supervising 12 of the 18 public research centres in Greece. GSRT represents Greece in the European Union’s research‐related institutions and promotes bilateral and multilateral co‐operation. GSRT is also tasked with establishing new institutes and technology centres for research in areas of high priority for the Greek economy, and to support the dissemination of R&D information throughout the country and internationally. GSRT also manages regional R&D activities.
After the transition of GSRT to the Ministry of Education, Lifelong Learning and Religious Affairs, the main advisory body on R&D policy is the National Council of Research and Technology (NCRT), which comprises distinguished scientists from Greece and abroad. To support NCRT, seven sectoral research councils have been formed, one of which focuses specifically on energy and environment. NCRT updates R&D policy on a medium‐ to long‐term basis.
Greece has two main public research centres in the field of identifying specific energy R&D policy priorities and implementing energy R&D research activities: the Centre for Renewable Energy Sources (CRES) and the Centre for Research and Technology Hellas (CERTH)
The Centre for Renewable Energy Sources (CRES) is the Greek national centre for renewable energy sources, rational use of energy and energy saving. It is supervised by the Ministry of Environment, Energy and Climate Change. CRES is the national co‐ordination centre in its areas of activity by Law 2244/94 (Production of Electricity from Renewable Energy Sources) and Law 2702/99. In particular, CRES
is the official Greek government consultant on matters of renewable energy sources/rational use of energy/energy saving (RES/RUE/ES) national policy, strategy and planning;
carries out applied research and develops innovative technologies which are both technically/economically viable and environment‐friendly;
organises, supervises and carries out demonstration and pilot projects, to promote the above technologies;
10. Energy research, development and demonstration
128
implements commercial RES/RUE/ES applications in relevant energy projects of the private sector, the local authorities, professional associations, etc.;
provides technical services and advice, in the form of specialised know‐how and information, to third parties;
disseminates technologies in its areas of expertise and provides reliable information and support to interested organisations and investors;
organises and/or participates in technical and scientific seminars, educational programmes, specialised training courses, meetings, etc.
The Centre for Research and Technology Hellas (CERTH) includes two Institutes active in energy:
The Chemical Process Engineering Research Institute (CPERI) conducts R&D and innovation activities in the field of science related to energy conversion;
The Institute for Solid Fuels Technology and Applications (ISFTA) is the main Greek organisation for the promotion of research and technological development aiming at the improved and integrated exploitation of solid fuels and their by‐products.
At the regional level, the Regional General Secretariats have some freedom to shape priorities for R&D policy within the general national policy framework. They can use funding from the EU Structural Funds for project implementation.
FUNDING
Public funding of R&D in general and on energy in particular comes from two sources. The regular state budget covers the cost of permanent personnel and a percentage of operational costs, while the public investment funds provide funding on a project basis. The latest information available to the IEA on total government funding on energy R&D to all the institutions supervised by GSRT is presented in Figure 41.
The country’s 22 universities are the main research performers, accounting for around half of total spending on all R&D in Greece. Together, universities and public research centres are responsible for around 70% of total spending on all R&D (not only on energy), while the private sector share, around 30%, is one of the lowest among the IEA member countries.
A good fifth of total public funding is internationally sourced – more than twice the OECD average. Practically all of it comes from the European Union through the Community Support Framework (CSF). If the general university funds are excluded, then the funding from this EU source accounts for 42% of direct government funding for R&D (2008 data). On top of the EU funding from CSF, Greece also benefits from FP7 project funding, amounting to around EUR 7 million for the years 2007–2008. According to the government, in the current programming period 2007‐2013, 75% of the budget for the entire set of R&D measures will be financed by the EU Structural Funds.
10. Energy research, development and demonstration
129
Figure 41. Government spending on energy RD&D, 2005 to 2011*
0
2
4
6
8
10
12
14
16
18
2005 2006 2007 2008 2009 2010 2011
Million EUR
Nuclear **
Other power and storage techs.
Hydrogen and fuel cells
Fossil fuels
Energy efficiency
Other
Renewables
* Estimates for 2010 and 2011.
** Negligible.
Note: breakdown by sector is not available for 2007, 2008 and 2009.
Sources: OECD Economic Outlook, OECD Paris, 2011 and country submission.
In 2009 public energy RD&D funding totalled around EUR 16 million. As part of the government spending cuts, it dropped by more than half to EUR 7.3 million in 2010. The budget for 2011 is expected to be EUR 6.3 million. Since 2000, renewable energy has received the largest share of government funding, one‐third of the total in 2010 and 2011. The second‐largest sector is energy efficiency with 8% of the total in 2010 and 11% in 2011.
PUBLIC‐PRIVATE PARTNERSHIPS
Among the OECD countries, Greece has one of the lowest rates of private‐sector participation in R&D activities. This may be attributed to general characteristics of the Greek economy, namely the prevalence of small enterprises; traditional activity sectors; very low potential in sectors generating technological innovation; “turnkey” transfer of off‐the‐shelf mature technology rather than pursuing in‐house R&D activities in enterprises. To help increase private‐sector participation, the R&D strategy for 2007–2013 prepared by GSRT prioritises the following:
Support of actions (subsidisation and/or venture capital) that contribute to the conversion of knowledge to innovative products, processes and services; the creation of new innovative enterprises; the support of technology and know‐how transfer to enterprises (with emphasis on assisting SMEs in incorporating advanced science and technology (S&T) in their production processes and final products); and closing the gap between technological knowledge and the market.
10. Energy research, development and demonstration
130
Strengthening SMEs’ demand for research, technology and innovation services, and helping them gain access to organisations that offer corresponding services. In general, strengthening the demand for, and supply of, high value‐added, knowledge‐intensive services.
For the promotion of public‐private partnerships, GSRT has taken the following initiatives utilising funds of the Third Community Support Framework:
Introduction of the Technological Platform on Biofuels. The Technological Platform was established in the context of the Regional Innovation Pole of Thessaly. With the active participation and motivation of all the involved actors (public authorities, research institutions, enterprises, users), the platforms have the following tasks:
rational use of public and private investment funds in the field of biofuels under specific strategy and common vision shared by all involved actors;
formulation of the appropriate institutional and legal context for the production and distribution of biofuels in the Greek market;
stimulating public awareness on biofuels.
Introduction of the Technological Platform on Energy. The Technological Platform was established in the context of the Regional Pole of Innovation of Western Macedonia (RPIWM). It is a union of institutions from the private and public sectors that aims to create an environment of innovation and regional conscience in western Macedonia in the main axis of energy and the increase of competitiveness of the regional economy aiming to the development of environment‐friendly and economically feasible technologies for the exploitation of fossil fuels and renewable energy.
Promotion of research, development and innovation (RD&I) partnerships in areas of national priority. One of the areas concerned renewable sources of energy and energy saving. Fifteen projects were implemented, with a total budget of EUR 18 million.
INTERNATIONAL COLLABORATION AND SELECTED PROJECTS
Participating in IEA Implementing Agreements reduces costs, multiplies results and increases national R&D capabilities. Greece currently participates in six IEA Implementing Agreements: end use (demand‐side management, buildings/community systems), renewables (hydrogen, wind), fossil fuels (fluidised beds) and modelling.
Greece has a successful record of participation in the EU Framework Programmes for research, technological development and demonstration, especially in the field of energy. Under the EU FP6, GSRT participated in the ERANET programme called PV‐NET, a European network of programme co‐ordinators and managers in the field of photovoltaic solar energy research and technology development. The consortium comprised major stakeholders from 13 countries in the field of national and regional R&D programmes.
The following are examples of energy R&D projects in Greece:
A project to convert the island of Agios Efstratios in the Aegean Sea to using only renewable energy sources was launched in 2010. The island's 250 residents would
10. Energy research, development and demonstration
131
use only solar and wind power. Bicycles and electric cars would be the means of transport on the 43 square‐kilometre island. The EUR 10 million project is funded by GSRT.
The UpWind project aims to design very large wind turbines (10 to20 MW), both onshore and offshore. The project focuses on design tools for the complete range of turbine components. It addresses the aerodynamic, aero‐elastic, structural and material design of rotors. Critical analysis of drive train components will be carried out in the search for breakthrough solutions. UpWind is a five‐year European project funded under the EU's Sixth Framework Programme (FP6), It was concluded in the first quarter of 2011.
The ProTest (PROcedures for TESTing and measuring wind energy systems) aims to reduce early failures of mechanical components in wind turbines, namely the drive train, pitch system and yaw system. The specific project objective is to increase knowledge to specify and measure the loads at the points (interfaces) where the mechanical components are attached to the wind turbine. ProTest is a European project funded under the EU's Seventh Framework Programme (FP7). It was concluded in August 2010.
The NIMO project seeks to largely eliminate failures and minimise the need for maintenance of wind turbines by developing and implementing an integrated system for monitoring the condition of the turbines, in particular the critical structural components, rotating parts and braking mechanisms. NIMO is a European project funded under the EU FP7.
The Microgrids project aims to increase penetration of microgeneration in electricity networks through developing alternative microgenerator control strategies and alternative network designs, development of new tools for multi‐microgrids management operation and standardisation of technical and commercial protocols. The Microgrids is a European project funded under FP7.
CRITIQUE
The R&D strategy (Strategic Plan) prepared by GSRT presents specific priorities on energy R&D which are fairly broad in scope. With limited government resources, it is essential to further sharpen priorities to maximise the cost‐effectiveness of government energy R&D programmes and to focus on areas where Greece has a competitive advantage or specific needs. In light of Greece’s resource endowment, these areas could include wind power, RES‐integrated buildings, biomass and solar and geothermal power.
Since autumn 2009, after the reorganisation of the Greek government, the responsibility for energy R&D no longer lies with the ministry responsible for energy policy. The government should ensure consistency between general energy policy and energy R&D policy. Strong co‐ordination among the Ministry of Education, Lifelong Learning and Religious Affairs, the Ministry of Environment, Energy and Climate Change and the Ministry of Economy, Competitiveness and Shipping would also help promote effective funding and quick deployment of new energy technologies.
Public funding for energy R&D remains low and a large part of funding comes from EU sources. Given the limited public resources for energy R&D, the cost‐effectiveness of the R&D programme needs to be enhanced. For an effective cost‐benefit analysis – and the
10. Energy research, development and demonstration
132
ultimate optimisation – of R&D programmes, reliable data are needed on R&D activities and the level and allocation of funding. The government should improve R&D data collection and develop methods to review energy R&D policies and spending to ensure that they are in line with overall energy policies, and that projects are cost‐effective.
Greece has a successful record of participation in the EU Framework Programmes for technology RD&D. Broader international collaboration would help Greece acquire and adapt the best available technologies to suit the country’s circumstances and to increase national R&D capabilities. Stronger participation in the IEA Implementing Agreements would serve to reduce costs and multiply results, and serve to build capacities of researchers. In light of the 2007‐2013 Strategic Plan, participating in the implementing agreements Electricity Networks Analysis, Research and Development (ENARD) and Co‐operative Programme on Smart Grids (ISGAN) would be highly relevant, as would Advanced Motor Fuels (AMF), given its focus on biofuels.
Private‐sector participation in R&D has traditionally been low in Greece. The government considers this as one of the weakest points in the Greek innovation, research and technology system. The 2007‐2013 Strategic Plan prepared by the General Secretariat for Research and Technology aims at strengthening SMEs’ demand for research, technology and innovation. As much as possible, the government should consider R&D tax incentives or other stimulus measures to encourage investments and thereby capacity building in energy R&D. The Technological Platforms are a useful tool for this purpose. Nevertheless, further efforts will be necessary for increasing engagement with the private sector in the energy R&D area, with a view to sharing information, financing R&D activities and commercialising R&D outcomes. With the EU 2020 target for increasing the share of renewable energy in gross final consumption of energy, demand for new renewable energy and energy efficiency technology will increase. This provides an opportunity also to encourage stronger private‐sector involvement in energy R&D. The IEA welcomes the fact that CRES has developed a strategy and technology roadmaps for priority renewable technologies.
RECOMMENDATIONS
The government of Greece should:
Consider closely aligning the energy R&D priorities with Greece’s energy and climate change policy objectives and its natural resource endowments; improve co‐ordination among the different ministries and public research centres to this end.
Continue to improve data collection and enhance monitoring of progress related to energy R&D.
Strengthen public and private R&D capabilities through greater participation in international collaboration.
Encourage private‐sector R&D investment through stronger incentives, including fiscal ones.
The Shared Goals, which were adopted by the IEA Ministers at their 4 June 1993 meeting in Paris, provide the evaluation criteria for the in‐depth reviews conducted by the IEA. The Shared Goals are presented in Annex C.
REVIEW TEAM
The in‐depth review team visited Greece from 15 to 19 March 2010. The team met with government officials, energy suppliers, interest groups and various other organisations. This report was drafted on the basis of these meetings, the government’s initial response to the IEA energy policy questionnaire and several updates to it since the March 2010 review visit, and other information. The team is grateful for the co‐operation and assistance of the many people it met during the visit, the kind hospitality and willingness to discuss the challenges and opportunities that Greece is facing. The team wishes to express its sincere appreciation to the staff of the Ministry of Environment, Energy and Climate Change, in particular Mr. Stelios Alifantis, Ms. Georgia Gavridou, Ms. Eleni Gratsia, Ms. Aikaterini Karamixalakou and Mr. Charalampos Pippos, and the Greek Permanent Representation to the OECD, in particular Ms. Vasiliki Manavi, for their unfailing helpfulness and dedication throughout the review process. The team is also grateful to Mr. Kostas Mathioudakis, General Secretary, for his hospitality and personal engagement in briefing the team on energy policy issues.
Miika Tommila managed the review and drafted the report with the exception of the chapter on energy efficiency, which was drafted by Sara Bryan Pasquier and the chapter on electricity which was drafted by Akira Yabumoto. Georg Bussmann drafted statistics‐related sections for most chapters. Many other IEA colleagues have provided helpful comments, including Robert Arnot, Richard Baron, Milou Beerepoot, Ulrich Benterbusch, Anne‐Sophie Corbeau, Zuzana Dobrotkova, Anselm Eisentraut, Paolo Frankl, Shinji Fujino, Rebecca Gaghen, Nigel Jollands, Tom Kerr, Simon Mueller, Jungwook Park, Carrie Pottinger, Brian Ricketts, María Sicilia, Akihiro Tonai and Aad van Bohemen.
Georg Bussmann and Bertrand Sadin prepared the figures. Karen Treanton and Alex Blackburn provided support on statistics. Muriel Custodio, Jane Barbière and Claire Bertrand managed the production process. Viviane Consoli provided editorial assistance. Marilyn Ferris helped in the final stages of preparation.
ORGANISATIONS VISITED
Association of Photovoltaic Companies
Centre for Renewable Energy Sources (CRES)
EPA Attiki
Electricity Consumers Association
Federation of Greek Industries
General Secretariat for Research and Technology
Hellenic Federation for Oil Products Trade Companies
Greek Association of Renewable Energy Sources – Electricity Producers
Footnotes to energy balances and key statistical data
1. Biofuels and waste comprises solid biofuels, liquid biofuels, biogases and industrial waste. Data are often based on partial surveys and may not be comparable between countries.
2. In addition to coal, oil, natural gas and electricity, total net imports also include biofuels.
3. Excludes international marine bunkers and international aviation bunkers.
4. Total supply of electricity represents net trade. A negative number in the share of TPES indicates that exports are greater than imports.
5. Industry includes non‐energy use.
6. Other includes residential, commercial, public services, agriculture, forestry, fishing and other non‐specified.
7. Inputs to electricity generation include inputs to electricity and CHP plants. Output refers only to electricity generation.
8. Losses arising in the production of electricity and heat at main activity producer utilities and autoproducers. For non‐fossil‐fuel electricity generation, theoretical losses are shown based on plant efficiencies of approximately 100% for hydro, wind and photovoltaic.
9. Data on “losses” for forecast years often include large statistical differences covering differences between expected supply and demand and mostly do not reflect real expectations on transformation gains and losses.
10. Toe per thousand US dollars at 2000 prices and exchange rates.
11. Toe per person.
12. “Energy‐related CO2 emissions” have been estimated using the IPCC Tier I Sectoral Approach from the Revised 1996 IPCC Guidelines. In accordance with the IPCC methodology, emissions from international marine and aviation bunkers are not included in national totals. Projected emissions for oil and gas are derived by calculating the ratio of emissions to energy use for 2009 and applying this factor to forecast energy supply. Future coal emissions are based on product‐specific supply projections and are calculated using the IPCC/OECD emission factors and methodology.
ANNEX C: INTERNATIONAL ENERGY AGENCY “SHARED GOALS”
The member countries* of the International Energy Agency (IEA) seek to create conditions in which the energy sectors of their economies can make the fullest possible contribution to sustainable economic development and to the well‐being of their people and of the environment. In formulating energy policies, the establishment of free and open markets is a fundamental point of departure, though energy security and environmental protection need to be given particular emphasis by governments. IEA countries recognise the significance of increasing global interdependence in energy. They therefore seek to promote the effective operation of international energy markets and encourage dialogue with all participants. In order to secure their objectives, member countries therefore aim to create a policy framework consistent with the following goals:
1. Diversity, efficiency and flexibility within the energy sector are basic conditions for longer‐term energy security: the fuels used within and across sectors and the sources of those fuels should be as diverse as practicable. Non‐fossil fuels, particularly nuclear and hydro power, make a substantial contribution to the energy supply diversity of IEA countries as a group.
2. Energy systems should have the ability to respond promptly and flexibly to energy emergencies. In some cases this requires collective mechanisms and action: IEA countries co‐operate through the Agency in responding jointly to oil supply emergencies.
3. The environmentally sustainable provision and use of energy are central to the achievement of these shared goals. Decision‐makers should seek to minimise the adverse environmental impacts of energy activities, just as environmental decisions should take account of the energy consequences. Government interventions should respect the Polluter Pays Principle where practicable.
4. More environmentally acceptable energy sources need to be encouraged and developed. Clean and efficient use of fossil fuels is essential. The development of economic non‐fossil sources is also a priority. A number of IEA member countries wish to retain and improve the nuclear option for the future, at the highest available safety standards, because nuclear energy does not emit carbon dioxide. Renewable sources will also have an increasingly important contribution to make.
5. Improved energy efficiency can promote both environmental protection and energy security in a cost‐effective manner. There are significant opportunities for greater energy efficiency at all stages of the energy cycle from production to consumption. Strong efforts by governments and all energy users are needed to realise these opportunities.
6. Continued research, development and market deployment of new and improved energy technologies make a critical contribution to achieving the objectives outlined above. Energy technology policies should complement broader energy policies. International co‐operation in the development and dissemination of energy
technologies, including industry participation and co‐operation with non‐member countries, should be encouraged.
7. Undistorted energy prices enable markets to work efficiently. Energy prices should not be held artificially below the costs of supply to promote social or industrial goals. To the extent necessary and practicable, the environmental costs of energy production and use should be reflected in prices.
8. Free and open trade and a secure framework for investment contribute to efficient energy markets and energy security. Distortions to energy trade and investment should be avoided.
9. Co‐operation among all energy market participants helps to improve information and understanding, and encourages the development of efficient, environmentally acceptable and flexible energy systems and markets worldwide. These are needed to help promote the investment, trade and confidence necessary to achieve global energy security and environmental objectives.
(The “Shared Goals” were adopted by IEA Ministers at the meeting of 4 June 1993 Paris, France.)
*Australia, Austria, Belgium, Canada, the Czech Republic, Denmark, Finland, France, Germany, Greece, Hungary, Ireland, Italy, Japan, Korea, Luxembourg, the Netherlands, New Zealand, Norway, Poland, Portugal, the Slovak Republic, Spain, Sweden, Switzerland, Turkey, the United Kingdom, the United States.
In this report, abbreviations are substituted for a number of terms used within the International Energy Agency. While the terms generally have been written out on first mention and subsequently abbreviated, this glossary provides a quick and central reference for many of the abbreviations used.
bcm billion cubic metres
CCS carbon capture and storage
CDM clean development mechanisms (under the Kyoto Protocol)
CHP combined heat and power production
cm cubic metre
CRES Centre for Renewable Energy Sources
DEPA Public Gas Corporation
DESFA Gas Transmission System Operator
DSO Distribution System Operator
EPA gas distribution company
ESCO energy service company
ETS Emissions Trading System (European Union)
FYROM former Yugoslav Republic of Macedonia
GHG greenhouse gas
GSRT General Secretariat for Research and Technology
HCC Hellenic Competition Commission
HTSO Hellenic Transmission System Operator
HV high voltage
ICRP Initial Contingency Response Plan
IPP independent power producer
JI joint implementation (projects under the Kyoto Protocol)
OPEC Organization of the Pertroleum Exporting Countries
PPC Greek Public Power Corporation
PPP purchasing power parity: the rate of currency conversion that equalises the purchasing power of different currencies, i.e. estimates the differences in price levels between countries
PV photovoltaic
RAE Regulatory Authority for Energy
R&D research and development, especially in energy technology, may include the demonstration and dissemination phases as well
RES renewable energy sources
TFC total final consumption of energy
toe tonne of oil equivalent, defined as 107 kcal
TPA third‐party access
TPES total primary energy supply
TSO Transmission System Operator
TW terawatt, or one watt x 1012
UNECE United Nations Economic Commission for Europe
UNFCCC United Nations Framework Convention on Climate Change
VAT value‐added tax
IEA PUBLICATIONS, 9, RUE DE LA FÉDÉRATION, 75739 PARIS CEDEX 15PRINTED IN FRANCE BY SOREGRAPH, OCTOBER 2011