Energy related Delphi statements in comparison – Expert responses from earlier foresight surveys sorted by relevant problem fields Institute for Futures Studies and Technology Assessment Version 1.5 February 11 th 2004
Transcript
Energy related Delphi statements in comparison – Expert responses from earlier foresight surveys
sorted by relevant problem fields
Institute for Futures Studies and Technology Assessment
Version 1.5 February 11th 2004
EurEnDel – Energy related statements from previous Delphi surveys
You can find more information on the EurEnDel project in the internet at:
www.eurendel.net
2
About this document This document represents part of the results of the literature review carried out within the EurEnDel project. It was used as one input to develop the questionnaire of the European Energy Delphi – EurEnDel. To us the roadmap charts of future energy innovations became a good tool for our daily work. We hope that the information compiled in this document may be helpful for your work also. The EurEnDel team
Contents: Roadmap charts of energy innovations: Overal Energy Demand 3 Transport and Mobility 4 Grid Development 5 Renewables’ fate: Overall Contribution 6 Renewables’ fate: Wind and Wave 7 Renewables’ fate: Solar Thermal 8 Renewables’ fate: Photovoltaics 9 Renewables’ fate: Biomass and Waste 10 Carrier Fuels and Storage Technologies 11 Hydrocarbon bottleneck 12 Nuclear 14 List of Delphi statements sorted after problem fields 15 References 33
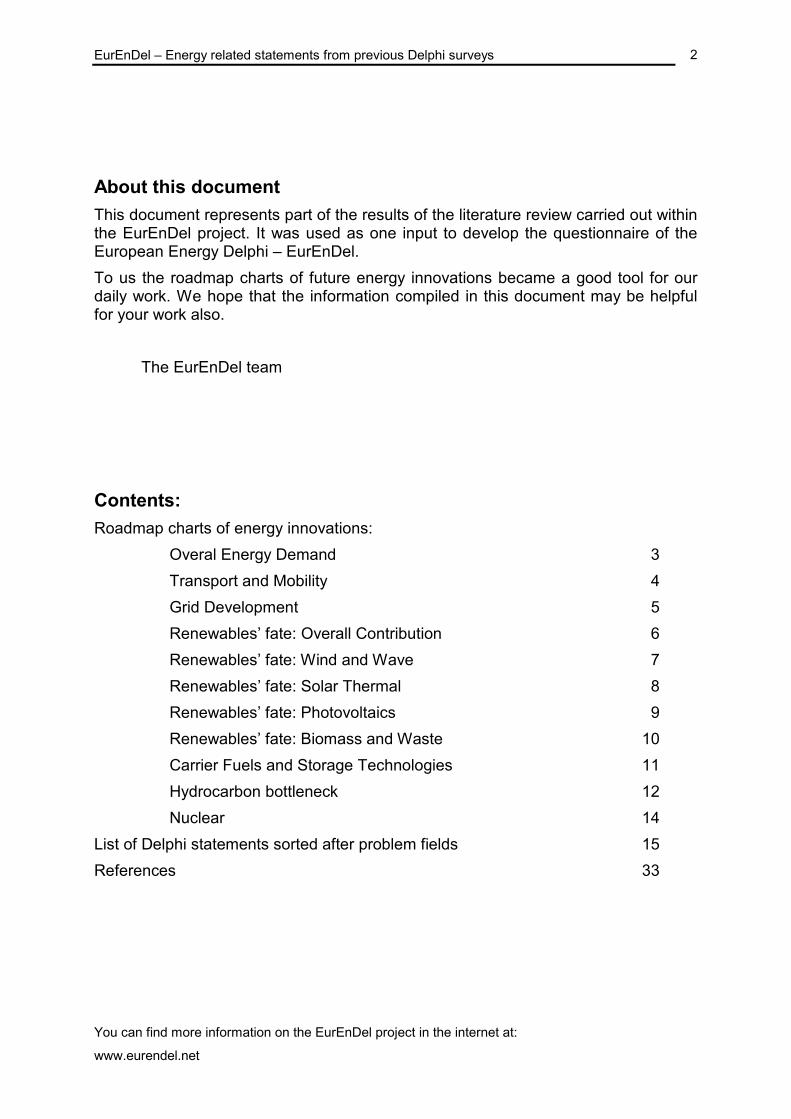
EurEnDel – European Energy DelphiExpert responses from earlier Delphi surveys sorted by relevant problem fields slide no. 1
2003 2010 2020 2050
Overall Energy Demand
Energy efficiency in buildings
Residential heating and cooling
Overall energy demand
Retrofitting of housing stock - passive solar(- 15 - 20% of heat
demand)
No cooling demand due to intelligent windows and facade systems (vs air-
conditioning) widely employed
30% improved cooling
Self-sufficient houses
Energy management techniques in home
Widespread low energy houses (-50%)
Appliances and energy saving technologies -residential sector and industry
Widespread saving technologies
2040
Combined heating and cooling
Smart & sustainable buildings and materials
Penetration rates:- Heat pump water heater: 8% to 21- Dedicated CFL Lighting Fixtures: 7% to 15%- Horizontal Axis Clothes Washer: 91% to 98%
Self-controlling lighting
50% efficiency gain in household appliances
+ 57% worldwide + 35% Europe, but - 66% per capita?
60% share of global energy con-sumption in developing countries. Overall increase 100 - 200 %
30% reduction of demand for industrial processes
Overall energy efficiency + 50%
2030
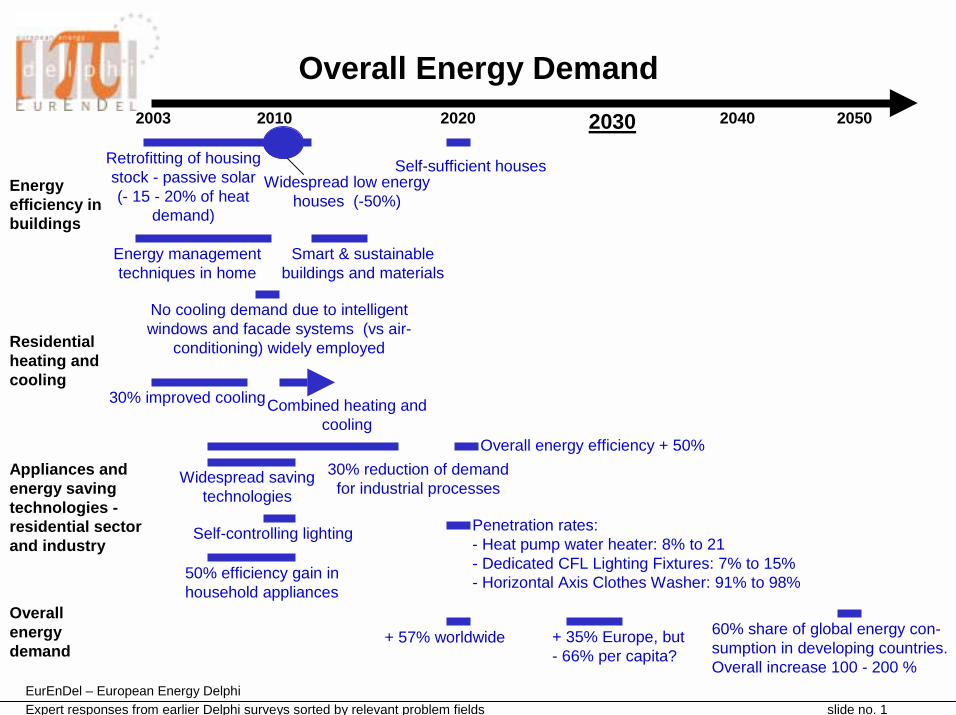
EurEnDel – European Energy DelphiExpert responses from earlier Delphi surveys sorted by relevant problem fields slide no. 2
2003 2010 2020 2030
Transport and Mobility
Infrastructure development
Advanced technologies
Freight transport
Passenger transport
Redesign and integration of transport and energy systems
20 - 30% efficiency gains in
vehicles
Large diffusion of in-vehicle traffic information systems
Decoupling from economic growth –
2 l car
Transport still a problem in the US
Intelligent systems on highways
20% alternative fuelsFrom hybrid vehicles to electric cars
Transition to hydrogen fuel, including aircraft
Maglev trains
Hypersonic planes
Overall efficiency
Light-weight materials in aircraft and trains
New propulsion systems and fuel processing
Substitution of 10 – 50% of private car use by public transport
New mass transport systemsin metropolitan areas
30% efficiency gains in freight transport
New logistics and combined transport
EurEnDel – European Energy DelphiExpert responses from earlier Delphi surveys sorted by relevant problem fields slide no. 3
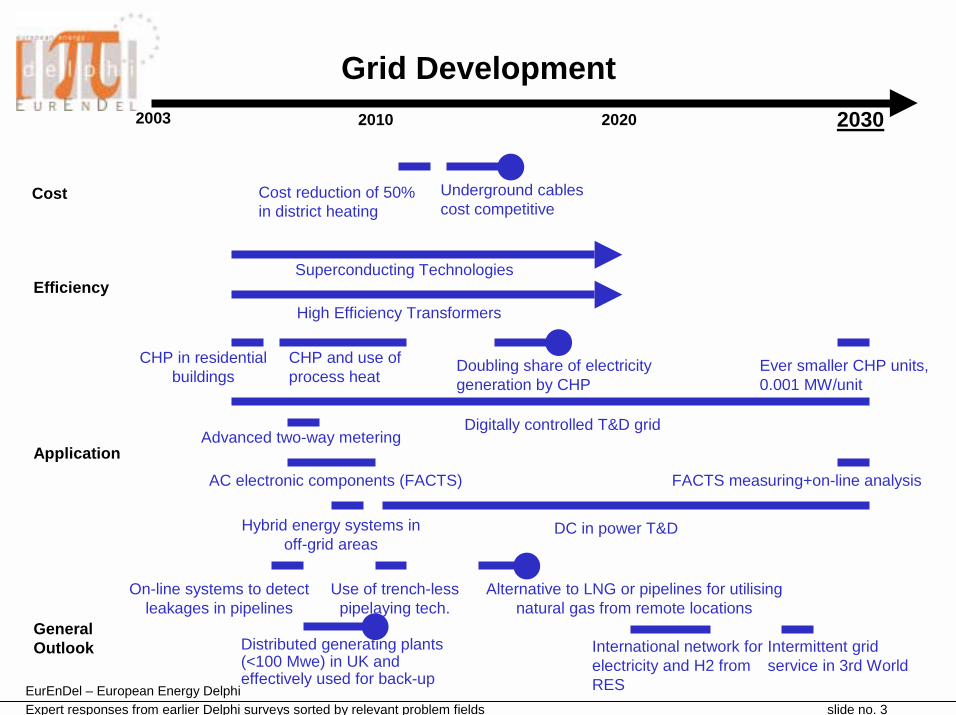
Distributed generating plants (<100 Mwe) in UK and effectively used for back-up
Advanced two-way metering
Superconducting Technologies
Hybrid energy systems in off-grid areas
High Efficiency Transformers
Intermittent grid service in 3rd World
International network for electricity and H2 from RES
CHP in residential buildings
CHP and use of process heat
Doubling share of electricity generation by CHP
Ever smaller CHP units, 0.001 MW/unit
On-line systems to detect leakages in pipelines
Use of trench-less pipelaying tech.
Alternative to LNG or pipelines for utilising natural gas from remote locations
2003 2010 2020 2030
EurEnDel – European Energy DelphiExpert responses from earlier Delphi surveys sorted by relevant problem fields slide no. 4
2003 2010 2020 2050
Renewables’ Fate: Overall Contribution
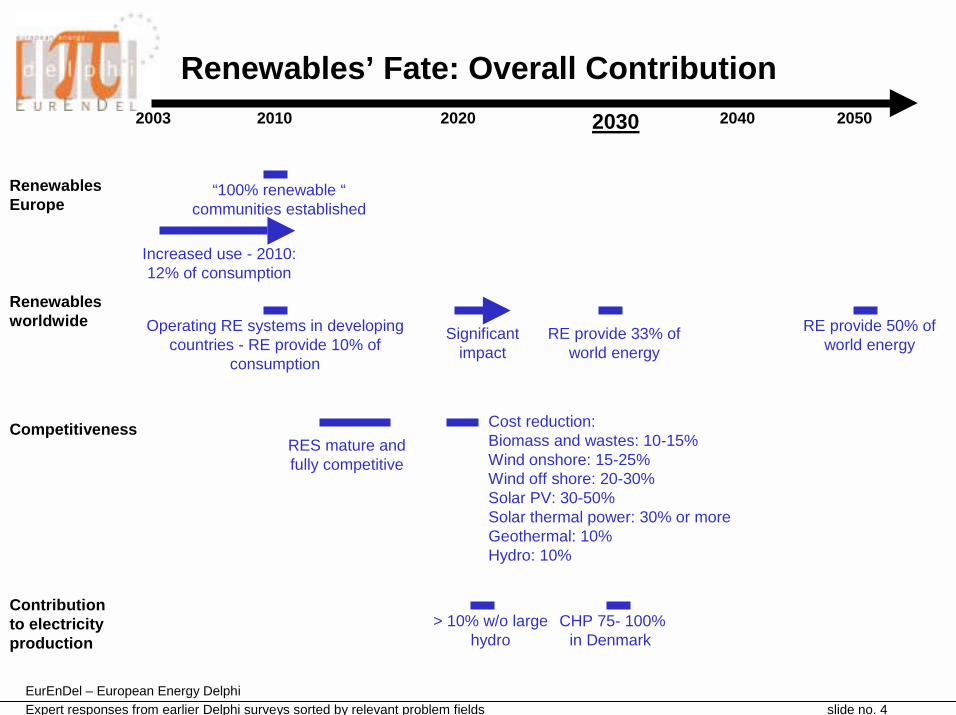
Renewables Europe
Renewables worldwide
Contribution to electricity production
“100% renewable “ communities established
RES mature and fully competitive
Cost reduction:Biomass and wastes: 10-15%Wind onshore: 15-25%Wind off shore: 20-30%Solar PV: 30-50% Solar thermal power: 30% or moreGeothermal: 10%Hydro: 10%
RE provide 33% of world energy
Operating RE systems in developing countries - RE provide 10% of
consumption
Increased use - 2010: 12% of consumption
Competitiveness
> 10% w/o large hydro
2030 2040
RE provide 50% of world energy
Significant impact
CHP 75- 100% in Denmark
EurEnDel – European Energy DelphiExpert responses from earlier Delphi surveys sorted by relevant problem fields slide no. 5
EurEnDel – European Energy DelphiExpert responses from earlier Delphi surveys sorted by relevant problem fields slide no. 10
Hydrocarbon Bottleneck (part I)
Raw materials
Exploration & Production
Oil will remain the basic raw material
Coal will be a competitive raw material during first half of the century
Techniques generated by 3D seismic surveys
to analyse and interpret (full wave)
Remote sensing
Exploitation of high pressure/ temp. oil/gas reservoirs
Unconventional natural gas covers >25% of the world gas demand
Consumption of biologically degradable fuels will increase
Projected imported dependence of EU and EU-30: 54% and 42%
Projected imported dependence of EU and EU-30: 62% and 51%
Projected imported dependence of EU and EU-30: 71% and 60%
Natural Gas grows from 23% to 28% of global primary energy consumption
Reduction in costs of oil/gas drilling by 50%
Exploitation of oil/gas in deep water and severe environments
Recovery and utilisation of coal-bed methane
Proportion of economically reco-verable oil by 50%
microbial-enhanced recovery techniques
Oil shale and tar sands
Advanced automation & robotics in coal mining
2003 2010 2020 2030
EurEnDel – European Energy DelphiExpert responses from earlier Delphi surveys sorted by relevant problem fields slide no. 11
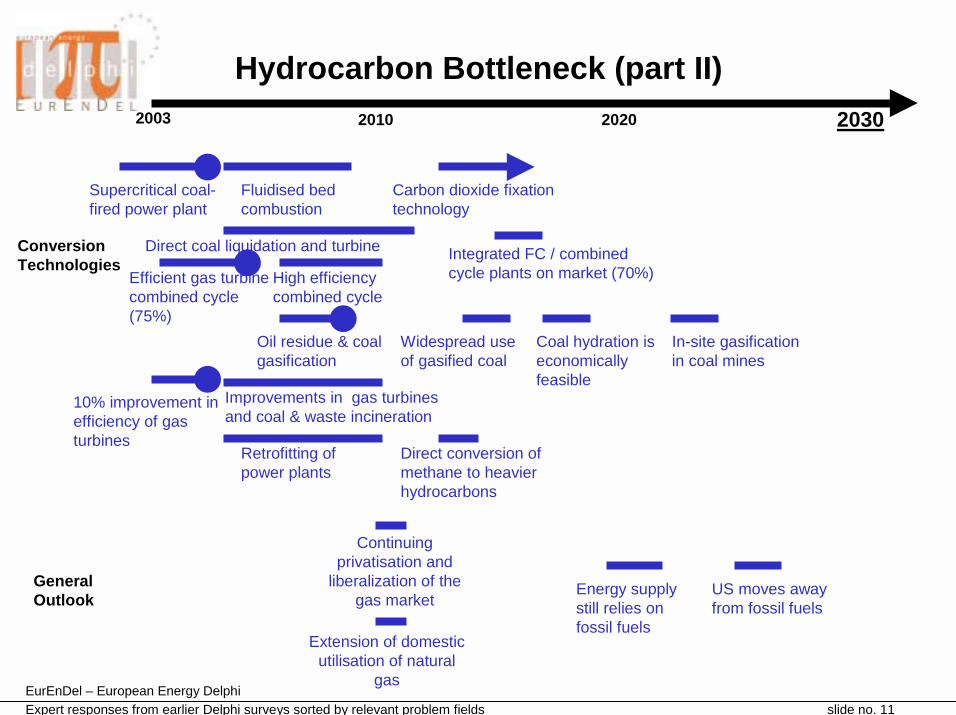
Hydrocarbon Bottleneck (part II)
Conversion Technologies
General Outlook Energy supply
still relies on fossil fuels
Continuing privatisation and
liberalization of the gas market
Supercritical coal-fired power plant
Efficient gas turbine combined cycle (75%)
10% improvement in efficiency of gas turbines
Fluidised bed combustion
Direct coal liquidation and turbine
Improvements in gas turbines and coal & waste incineration
Oil residue & coal gasification
Retrofitting of power plants
High efficiency combined cycle
Widespread use of gasified coal
Coal hydration is economically feasible
Integrated FC / combined cycle plants on market (70%)
Carbon dioxide fixation technology
Direct conversion of methane to heavier hydrocarbons
In-site gasification in coal mines
Extension of domestic utilisation of natural
gas
US moves away from fossil fuels
2003 2010 2020 2030
EurEnDel – European Energy DelphiExpert responses from earlier Delphi surveys sorted by relevant problem fields slide no. 12
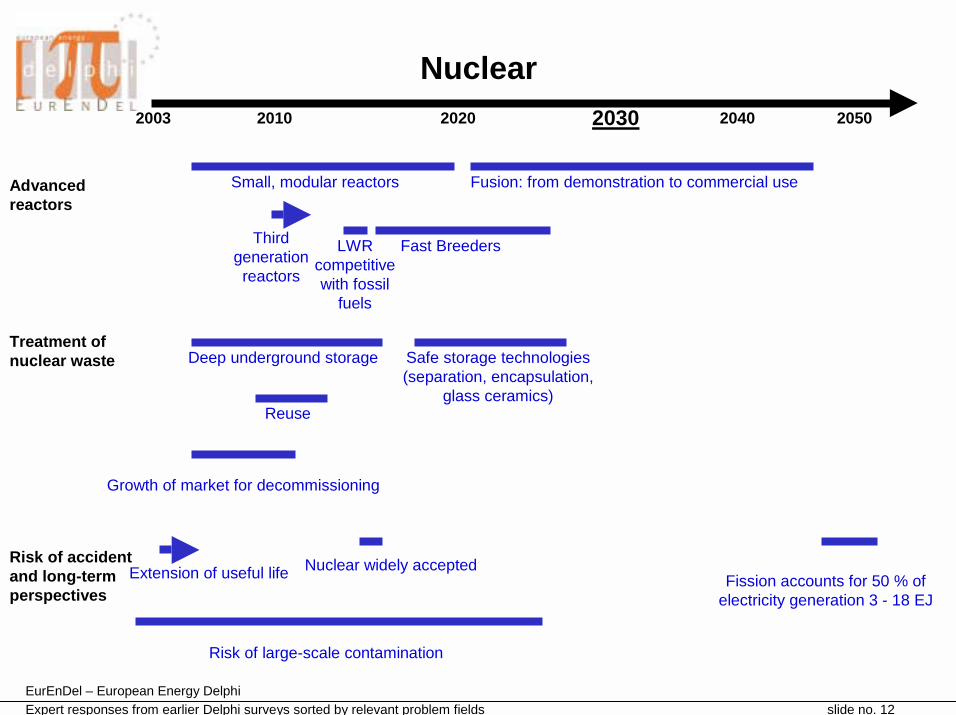
2003 2010 2020 2050
Nuclear
Advanced reactors
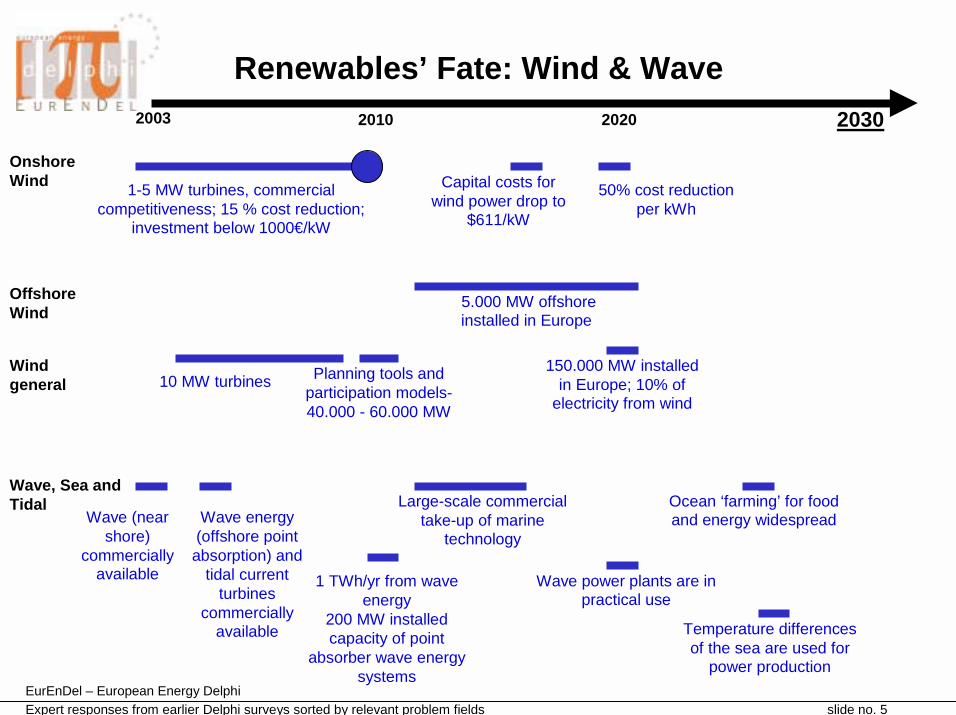
Treatment of nuclear waste
Third generation reactors
Growth of market for decommissioning
Fusion: from demonstration to commercial use
Fast BreedersLWR competitive with fossil
fuels
Risk of accident and long-term perspectives
2030 2040
Deep underground storage Safe storage technologies (separation, encapsulation,
glass ceramics)Reuse
Extension of useful life Nuclear widely acceptedFission accounts for 50 % of
electricity generation 3 - 18 EJ
Small, modular reactors
Risk of large-scale contamination
EurEnDel – Energy related statements from previous Delphi surveys
15
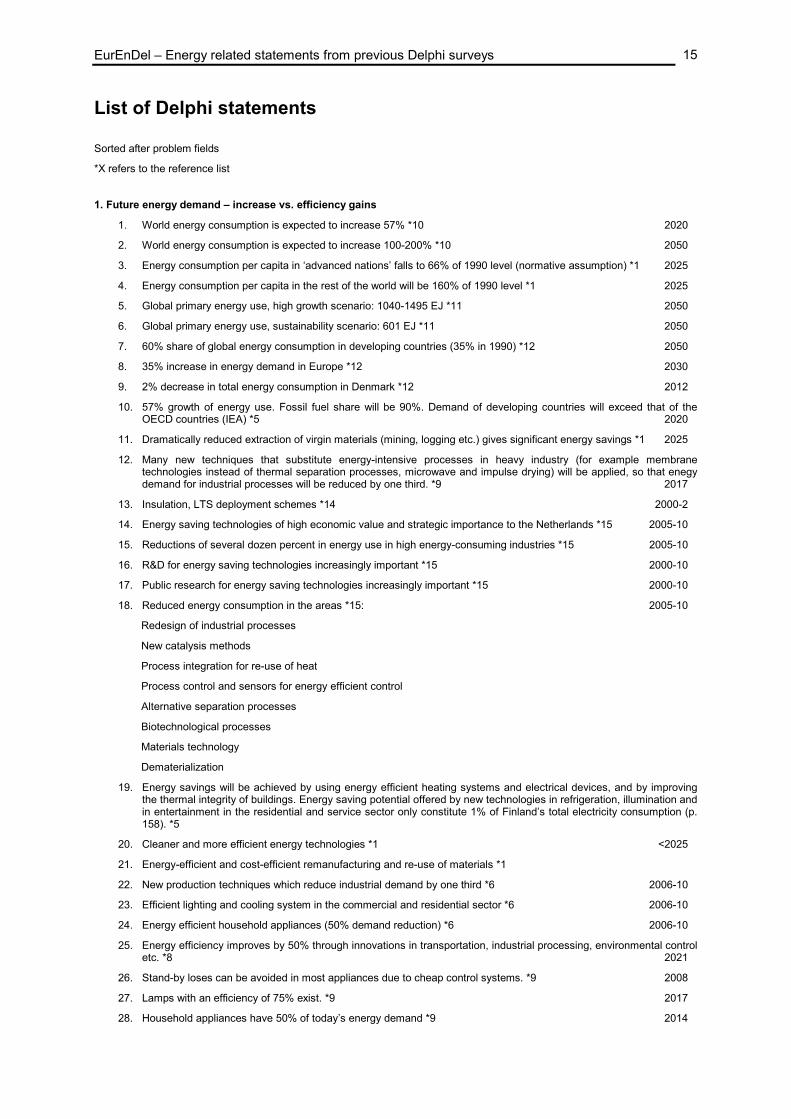
List of Delphi statements
Sorted after problem fields
*X refers to the reference list
1. Future energy demand – increase vs. efficiency gains
1. World energy consumption is expected to increase 57% *10 2020
2. World energy consumption is expected to increase 100-200% *10 2050
3. Energy consumption per capita in ‘advanced nations’ falls to 66% of 1990 level (normative assumption) *1 2025
4. Energy consumption per capita in the rest of the world will be 160% of 1990 level *1 2025
5. Global primary energy use, high growth scenario: 1040-1495 EJ *11 2050
6. Global primary energy use, sustainability scenario: 601 EJ *11 2050
7. 60% share of global energy consumption in developing countries (35% in 1990) *12 2050
8. 35% increase in energy demand in Europe *12 2030
9. 2% decrease in total energy consumption in Denmark *12 2012
10. 57% growth of energy use. Fossil fuel share will be 90%. Demand of developing countries will exceed that of the OECD countries (IEA) *5 2020
11. Dramatically reduced extraction of virgin materials (mining, logging etc.) gives significant energy savings *1 2025
12. Many new techniques that substitute energy-intensive processes in heavy industry (for example membrane technologies instead of thermal separation processes, microwave and impulse drying) will be applied, so that enegy demand for industrial processes will be reduced by one third. *9 2017
13. Insulation, LTS deployment schemes *14 2000-2
14. Energy saving technologies of high economic value and strategic importance to the Netherlands *15 2005-10
15. Reductions of several dozen percent in energy use in high energy-consuming industries *15 2005-10
16. R&D for energy saving technologies increasingly important *15 2000-10
17. Public research for energy saving technologies increasingly important *15 2000-10
18. Reduced energy consumption in the areas *15: 2005-10
Redesign of industrial processes
New catalysis methods
Process integration for re-use of heat
Process control and sensors for energy efficient control
Alternative separation processes
Biotechnological processes
Materials technology
Dematerialization
19. Energy savings will be achieved by using energy efficient heating systems and electrical devices, and by improving the thermal integrity of buildings. Energy saving potential offered by new technologies in refrigeration, illumination and in entertainment in the residential and service sector only constitute 1% of Finland’s total electricity consumption (p. 158). *5
20. Cleaner and more efficient energy technologies *1 <2025
21. Energy-efficient and cost-efficient remanufacturing and re-use of materials *1
22. New production techniques which reduce industrial demand by one third *6 2006-10
23. Efficient lighting and cooling system in the commercial and residential sector *6 2006-10
24. Energy efficient household appliances (50% demand reduction) *6 2006-10
25. Energy efficiency improves by 50% through innovations in transportation, industrial processing, environmental control etc. *8 2021
26. Stand-by loses can be avoided in most appliances due to cheap control systems. *9 2008
27. Lamps with an efficiency of 75% exist. *9 2017
28. Household appliances have 50% of today’s energy demand *9 2014
EurEnDel – Energy related statements from previous Delphi surveys
16
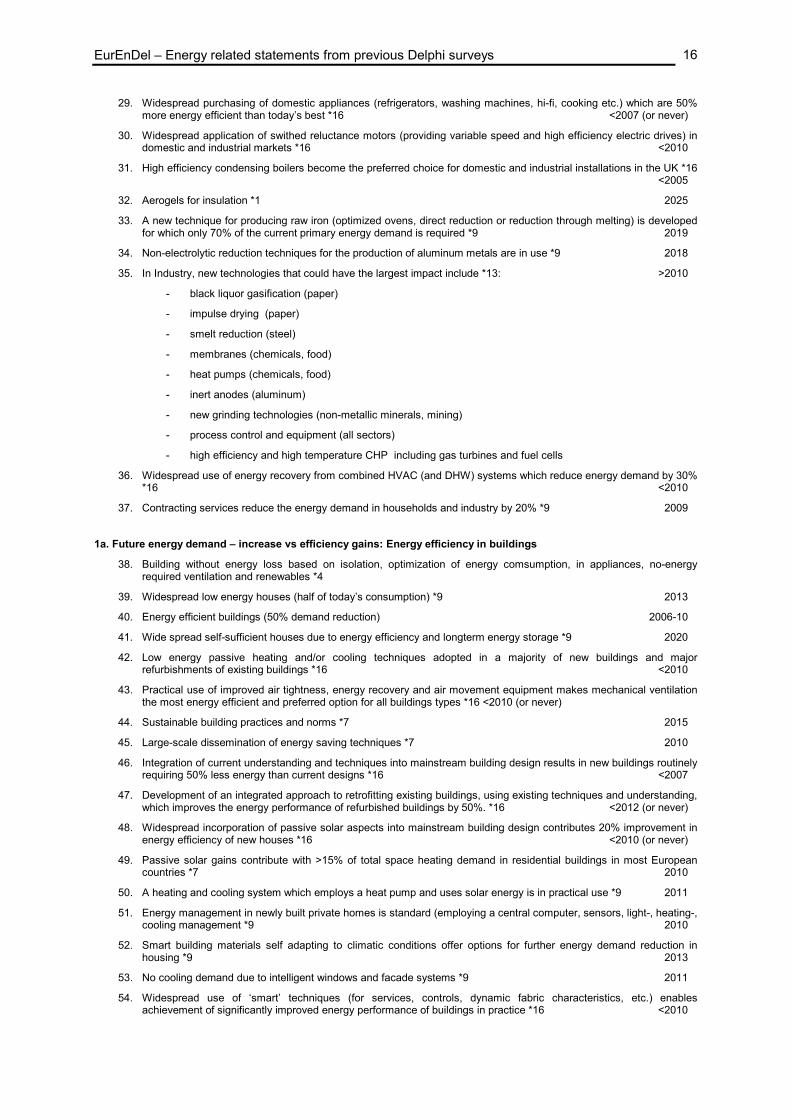
29. Widespread purchasing of domestic appliances (refrigerators, washing machines, hi-fi, cooking etc.) which are 50% more energy efficient than today’s best *16 <2007 (or never)
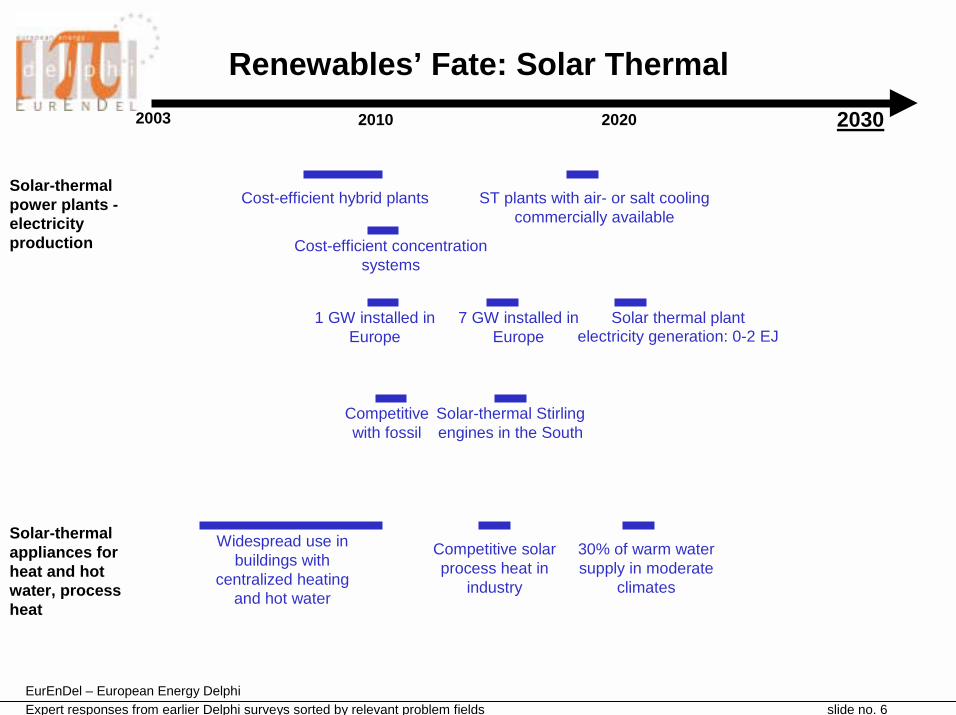
30. Widespread application of swithed reluctance motors (providing variable speed and high efficiency electric drives) in domestic and industrial markets *16 <2010
31. High efficiency condensing boilers become the preferred choice for domestic and industrial installations in the UK *16 <2005
32. Aerogels for insulation *1 2025
33. A new technique for producing raw iron (optimized ovens, direct reduction or reduction through melting) is developed for which only 70% of the current primary energy demand is required *9 2019
34. Non-electrolytic reduction techniques for the production of aluminum metals are in use *9 2018
35. In Industry, new technologies that could have the largest impact include *13: >2010
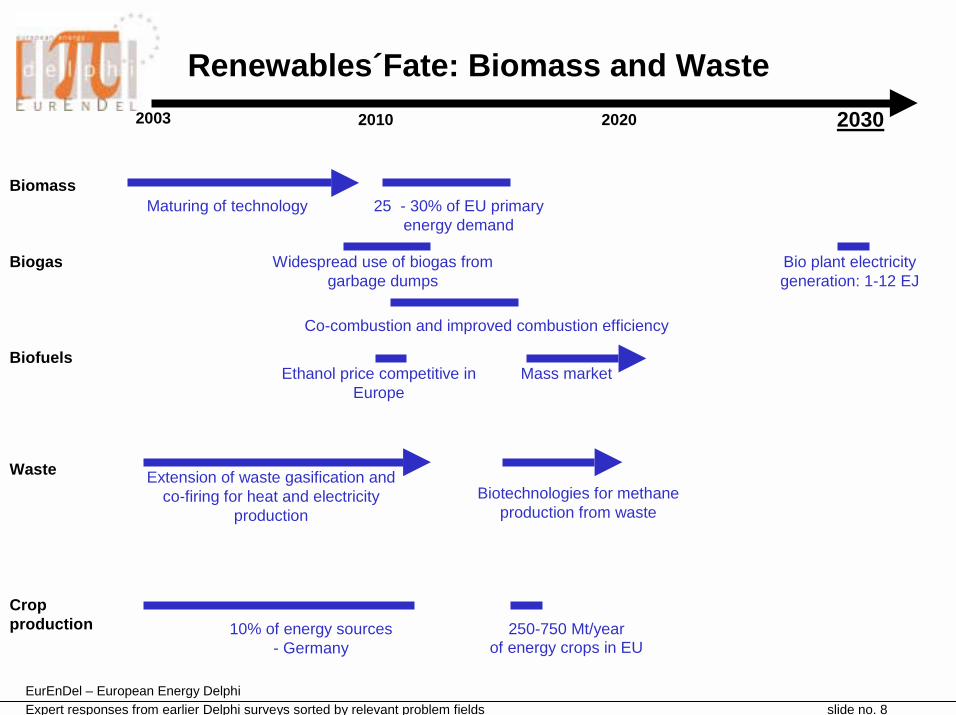
- black liquor gasification (paper)
- impulse drying (paper)
- smelt reduction (steel)
- membranes (chemicals, food)
- heat pumps (chemicals, food)
- inert anodes (aluminum)
- new grinding technologies (non-metallic minerals, mining)
- process control and equipment (all sectors)
- high efficiency and high temperature CHP including gas turbines and fuel cells
36. Widespread use of energy recovery from combined HVAC (and DHW) systems which reduce energy demand by 30% *16 <2010
37. Contracting services reduce the energy demand in households and industry by 20% *9 2009
1a. Future energy demand – increase vs efficiency gains: Energy efficiency in buildings
38. Building without energy loss based on isolation, optimization of energy comsumption, in appliances, no-energy required ventilation and renewables *4
39. Widespread low energy houses (half of today’s consumption) *9 2013
40. Energy efficient buildings (50% demand reduction) 2006-10
41. Wide spread self-sufficient houses due to energy efficiency and longterm energy storage *9 2020
42. Low energy passive heating and/or cooling techniques adopted in a majority of new buildings and major refurbishments of existing buildings *16 <2010
43. Practical use of improved air tightness, energy recovery and air movement equipment makes mechanical ventilation the most energy efficient and preferred option for all buildings types *16 <2010 (or never)
44. Sustainable building practices and norms *7 2015
45. Large-scale dissemination of energy saving techniques *7 2010
46. Integration of current understanding and techniques into mainstream building design results in new buildings routinely requiring 50% less energy than current designs *16 <2007
47. Development of an integrated approach to retrofitting existing buildings, using existing techniques and understanding, which improves the energy performance of refurbished buildings by 50%. *16 <2012 (or never)
48. Widespread incorporation of passive solar aspects into mainstream building design contributes 20% improvement in energy efficiency of new houses *16 <2010 (or never)
49. Passive solar gains contribute with >15% of total space heating demand in residential buildings in most European countries *7 2010
50. A heating and cooling system which employs a heat pump and uses solar energy is in practical use *9 2011
51. Energy management in newly built private homes is standard (employing a central computer, sensors, light-, heating-, cooling management *9 2010
52. Smart building materials self adapting to climatic conditions offer options for further energy demand reduction in housing *9 2013
53. No cooling demand due to intelligent windows and facade systems *9 2011
54. Widespread use of ‘smart’ techniques (for services, controls, dynamic fabric characteristics, etc.) enables achievement of significantly improved energy performance of buildings in practice *16 <2010
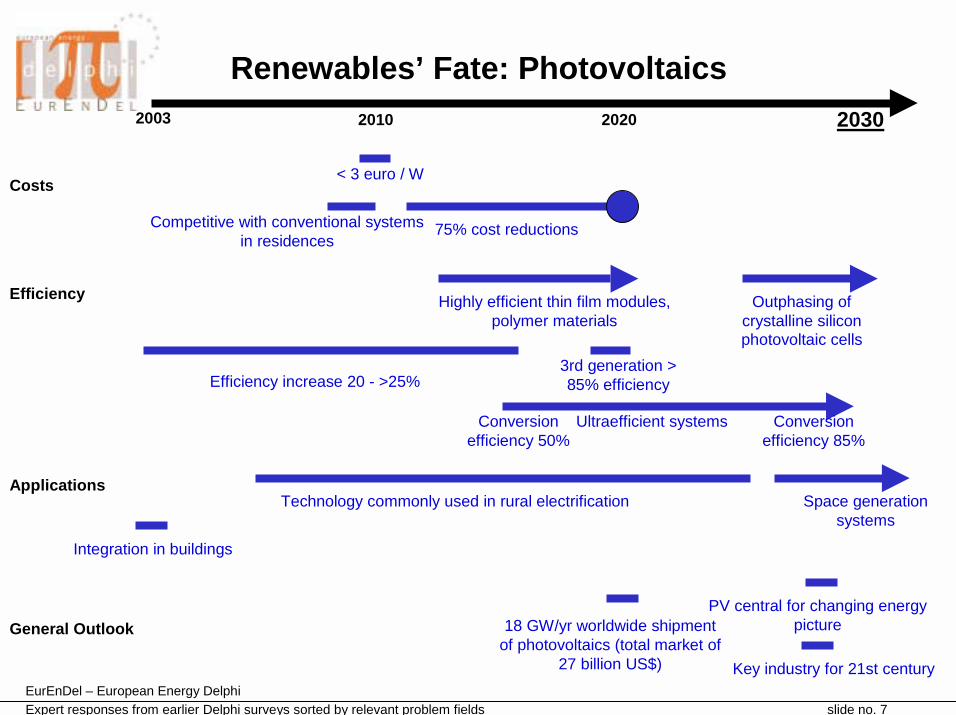
EurEnDel – Energy related statements from previous Delphi surveys
17
55. Public and private buidlings are equipped with decentralized data buses that take over the transfer of data to a functional unit, which in turn manages the complete energy demand of each building automatically, integrating all consumers. *9 2014
56. Widespread use of efficient self-controlling lighting systems in newly build houses *9 2010
57. Air conditioning widely employed *7 2010
58. 30% improvement in system efficiency of building cooling systems compared with today’s best practice *16 <2008
59. Widespread use of combined heating/cooling systems in new housing in UK *16 ? (or never)
60. Widespread use in commercial buildings of dehumidification systems that do not use refrigeration technology *16 <2012
61. Widespread use of storage of low-grade heat and/or ‘coolth’ in new buildings to exploit off-peak power *16<2012 (or never)
62. Low-energy windows have >90% market share in Europe *7 2010
63. Superwindows provide energy efficiency and automated building management *15
64. Sorption-chilling pumps (fuelled with natural gas, oil and biogas) are widely used *9 2013
65. In newly built housing areas (in moderate climates) local heat systems are the predominant concepts *9 2017
66. Penetration Rates for Selected Technologies in the Building Sector (% of equipment stock) *13: 2020
Residential:
Heat pump water heater: 8% to 21%
Dedicated CFL Lighting Fixtures: 7% to 15%
Horizontal Axis Clothes Washer: 91% to 98%
In commercial buildings:
Electronic Ballasts: 100%
67. Low-energy lighting becomes the preferred choice for domestic, commercial and industrial applications *16<2008 (or never)
68. Electricity demand doubled *7 2020
69. Wallboards and floors that change their crystalline structure for heat storage *2
70. Multifunctional facades and surfaces *7 2010
71. Building simulation tools widely employed *7 2010
72. Angle selective coatings, thermotropic/-chromic coating and glazing forms employed *7 2010
73. Widespread use of adsorption cooling employing solar or district heat *9 2012
2. Transport and mobility
2.a. Overall energy efficiency in transport and infrastructure development
74. Transport patterns will be redesigned in cities and urban areas e.g. to improve energy efficiency *1 2025
75. Ensuring increased transport safety *3
76. Change in mode of transport can contribute to greater energy efficiency (public transport, rail and remote working) (p. 189) *5 trend 2010
77. Thanks to the „dematerialisation“ of transport flows (for example by rationalising and combining the movement of goods, telecommunication services for classical household consumption goods) overall economic growth and transport growth can be decoupled. *9 2015
78. Transport and automobiles continue to be an energy problem in the US *1 2025
79. Development of the transport infrastructure in the context of the European infrastructure *3 2010
80. Integrated transport and energy systems: *4 2030
81. Infrastructure will be financed less by taxes and more by user fees and via capital markets (road tools etc.) *17
82. Smooth transfers and payment systems will make it easier to utilize the most convenient and optimal transport means. Travel centers will play a key role and serve as a node in intermodal transportation system (emission-free rental cars for everyday travel) *17 2020
83. 30% efficiency gain in the specific energy consumption of motorized vehicles *6 2006-10
84. Motor vehicle with fuel efficiencies 30% greater than today *14 2006-8
85. Widespread use of highly efficient low emission engines for transport (>20% improvements) *16 <2010
EurEnDel – Energy related statements from previous Delphi surveys
18
86. Practical use of diesel engines with commercially available fuel which meet current EU regulations for emissions from gasoline engines fitted with catalysts *16 <2010 (or never)
87. Elimination of particulate emissions from exhausts of 50% of all diesel engines on the road *16 <2010 (or never)
88. Cost competitive zero emission vehicles capture 10% of UK road vehicle market *16 ? (or never)
89. Large diffusion of in-vehicle traffic information systems *14 2007-9
90. 120 mile-per-gallon cars in widespread use *1 2025
91. 2 liter car in serial production *9 2014
92. Ceramic combustion engines allow 2 liter car with low emissions without catalytic converter *9 2014
2.b. Advanced transport technologies
93. Intelligent transportation systems are commonly (30%) used to reduce highway congestion *8 2016
94. Automated highways *8 2021
95. Transportation means driven by electrical, chemical or thermal energy interchange
96. High speed trains (Rail or Maglev) are available between most major cities in developed countries *8 2017
97. Maglev trains are mature 2032
98. 50% of the EU plane traffic is substituted by high speed trains (goods and people) *9 2018
99. Intelligent transport systems with information and control capabilities to a.o.t. increase (? improve?) fuel consumption *15
100. Hypersonic planes traveling at more than five times the speed of sound are used for the majority of transoceanic flights *8 2030
101. Hypersonic air carriers common *1 2025
102. Widespread use of extremely energy efficient Turboprop air planes with speeds comparable to Jets *9 2018
103. The emerging technologies that offer the potential to reduce significantly the energy use and GHG emissions include *13: 2020
Cellulosic Ethanol
Hybrid Electric Drivetrains
Lower Weight Structural Materials
Direct Injection Gasoline and Diesel Engines
Fuel Cells
Aircraft Technology
104. Lightweight composites in aircrafts and rail vehicles in ‘world 2’ countries *1 2025
105. Alternative engine designs for greater efficiency and reduced weight *15
106. Most ICE (Internal combustion engine) cars are hybrids (IC-HEV) *5 2010
107. Market share of > 5% for electric or hybrid vehicles *6 2006-10
108. Hybrid vehicles that combine electric and internal combustion engines are commercially available *8 2013
109. Battery powered electric cars are commonly (30%) available *8 2006
110. Widespread use of electric engines in cars (similar costs and output compared to today’s combustion engine) *92019
111. Hybrid electric vehicles reach mass market *14 2002-3
112. Hybrid electric vehicles compete with conventional vehicles *14 2010
113. Market share of > 2% for biofuels *6 2006-10
114. Gas, ethanol, and methanol cover 20% of the fuel consumption in transportation (app. 80% oil) *11 2020
115. 10% of energy consumed by road transport come from fuel generated by renewable resources *16 ?
116. Oil is still the primary fuel for transportation *11 2050
117. 20% of fossil fuels in transport sector replaced with alternative fuels (EU goal) *12 2020
118. Widespread use in the UK of alternative fuels for vehicles, e.g. methanol for cars or natural gas for light commercial vehicles *16 ? (or never)
119. Hydrogen replaces hydrocarbon in internal combustion engines *6 >2010
120. Hydrogen replaces fossil fuels in the transport sector *14 2011-14
121. Metal hydrogen storage systems allow for 10% of hydrogen fuelled cars *9 2019
EurEnDel – Energy related statements from previous Delphi surveys
19
122. Widespread use of gasoline engines fuelled with hydrogen *9 2023
123. First use of Hydrogen fuelled airplanes. Some airport have hydrogen infrastructure *9 2022
124. Widespread use of PEM fuel cell driven cars *4 2010
125. Fuel cell vehicles enter niche markets *14 2001-2
128. Auxiliary power units based on SOFC fuel cells in freight transportation and lorries *4
129. FC-Evs start dominate in new car sales (fuel cell – electric vehicle) *5 >2020
130. Direct hydrogen-fuelled FCV enters the market *5 2006
131. Fuel cell use and distribution system *6 2006-10
132. Fuel cells powered electric cars are commonly (30%) available *8 2012
133. Widespread use of fuel cell cars fuelled with methanol *9 2021
134. The cost of a hydrogen fuel cell system is reduced to $1,540 more than a comparable gasoline vehicle *13 2020
135. Cars powered by hydrogen fuel exceed 10% of total automobile production *14 2011-20
136. High energy capacitors for clean vehicles *15
137. Development of cost-effective refinery processes that meet future requirements for clean transportation *16 <2010
138. Non-IC propulsion systems e.g. in electric cars *15
139. For many applications in CHP and transportation diesel engines are fuelled with vegetable oil *9 2011
140. First commercial use of cost-effective fuel cells for electric vehicles using alcohol or hydrocarbon fuels *16? (or never)
141. In the production of fuels alcohol from algaes reach 10% of the worldwide production *9 2020
2.b. Passenger transport
142. In passenger transport, the expected mobility of labour force, the necessity of further preference of public transport at the expense of individual transport and the increase of demands on business and recreation trips will be of substantial importance *3
143. Increase in free time due to increased productivity and the ageing of the population can lead to growth in leisure trips, mostly undertaken with passenger car (p. 189) *5 2010
144. Private mobility demand reduces to 50% because public mobility services are comfortable and cheap *9 2020
145. Teleworking and videoconferences substitute a considerable part of traffic related to business. *9 2008
146. Public transport substitutes 10% of private car use *6 2011-15
147. Long-distance travel will increasingly rely on environmentally friendly transport means thank to improved logistics for ticket sales (air / train) , the use of combined tickets for public transport and / or rented cars, including advanced information management for switching transport modes (for example indicating the station and the time of departure for subways), for further travel to the final destination.*9 2013
148. Car-like capsules on guide rails or other personal rapid transit systems are installed in most metropolitan areas *8 2024
2.c. Freight transport
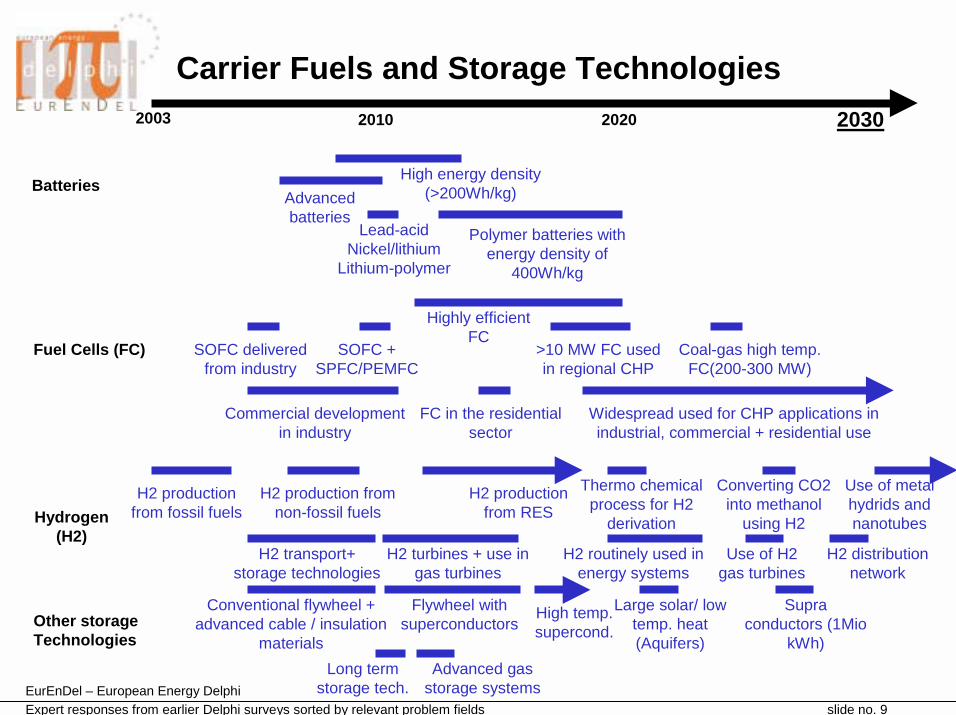
149. Increasing use of business-to-customer e-commerce could lead to an explosive increase in door-to-door deliveries with undue effect on transport movements and emissions, unless common carrier companies and network-based wireless data systems can be used to greatly enhance the efficiency of such parcel transport. (p. 189) *5 trend
150. Gain in transport capacity of railways due to new transport logistic (telematic guidance) *9 2010
151. Combined transport using „intellligent containers“ substitutes a large part of long-distance road transport *9 2015
152. 30% efficiency gain in freight transport 2006-10
3. Spatial movements
153. Clustered, self-contained communities in urban areas reduce the need for local transportation *8 2023
154. Diversity will characterize regions and cities. Major efforts to ensure that cities can attract events, conferences and tourists *17
4. Grid development
155. Intermittent grid service in third world countries *1 2025
EurEnDel – Energy related statements from previous Delphi surveys
20
156. A digitally controlled transmission and distribution grid in operation to move high-quality power precisely and reliably to where it is needed *5 2030
157. The combining of FACTS (flexible alternate current transmission system) wide-area measuring system and on-line analysis on a European level *5 2030
158. Use of direct current (DC) in power transmission and distribution will increase. DC can supply digital devices on the customer’s site directly and can connect DC systems (fuel cells) without converters. *5 2030
159. Decentralization of the electricity grid (distributed systems) *6
160. Advanced two-way metering systems (for supplies to and from the grid) *6 2006
161. Improved grid performance due to technologies based on AC electronic components (FACTS) *6 2006-10
162. Development of superconducting transmission cables for long distance transfer of low-cost power *5
163. Practical use of supra conducting cables in electricity grid *9 2021
164. Supra conductive current limiter allow for low short circuit currents *9 2013
165. Superconductors in power transmission, energy storage etc. *15
166. First commercial application of high temperature superconductors for power applications *16 2005->2015
167. Long distance DC power transmission (1000kV) *9 2010
168. Cost reduction of 50% in district heating due to new laying techniques and insulation *9 2012
169. Fast and decentralized power producers are effectively used for back-up power. *9 2009
170. Hybrid Energy systems (sun/wind/diesel) are the most important generaters in off-grid areas. *9 2009
171. An extensive data exchange system between electricity producers and consumers is use for efficient demand side management *9 2008
172. International distribution network for electricity and hydrogen produced from renewables – to be distributed into regions according to demand *9 2024
173. By use of an east west electricity grid peak loads in accordance with sunshine can be met – rise in use of renewables *9 2020
174. Wireless transmission in Earth’s Energy future: electricity would be converted to microwaves, beamed over long distances by satellite, and then converted back to electricity without damaging the environment *10
175. T&D Technology Development *13: >2020
High voltage direct current transmission
High temperature superconducting (HTS) cables and transformers
More efficient line transformers
Real-time control using automated controls
176. High-power solid state switches *15
177. Improved power electronics e.g. for integration of renewables in the system *15
178. Widespread use of remote condition monitoring and control of distribution grids *16 <2005
179. Underground power cables cost-competitive with overhead transmission *16 <2015 or never
180. Widespread use of high efficiency transformers (for grid application), with at least 25% reduction in losses *16 <2010
181. Construction of small (<100MWe), distributed generating plant provides the majority of additions to non-nuclear power station capacity in UK *16 <2010 (or never)
182. Cogeneration and use of process heat *6 2006-10
183. Cogeneration of heat and electricity in residential buildings *6 2005
184. Installed capacity of co-generation in UK industrial and commercial premises reaches 5 GWe *16 <2010
185. Doubling of the share of world-wide electricity generation produced by co-generation/combined heat-and-power *16 <2017
186. Widespread use of domestic (circa 2kWe) combined heat and power package *16 ? (or never)
187. Highly integrated multi-supply systems which use various materials and energy input and combine various technologies to produce different combinations of products: power, heat & cool, desalinated or otherwise purified water, and chemical products such as bio-oils and gases *5
188. Superconductors central for the changing energy picture *1 2025
189. Superconductive coils for powerstorage into use *1 2005-7
190. Penetration Rates for Selected Technologies in the Building Sector (% of equipment stock) *13: 2020
In commercial buildings: High Efficiency Transformers: 41% to 74%
EurEnDel – Energy related statements from previous Delphi surveys
21
191. First commercial use of alternative to LNG or pipelines for utilising natural gas from remote locations *16 <2015
192. Widespread use of low-cost materials for hydro-carbon pipelines and equipment that do not require replacement as a result of corrosion through a 30 year opera-tional life *16 <2010
193. Practical use of intelligent, on-line inspection systems to detect all leakages and failure-producing defects in pipelines *16 <2007
194. Practical use of trench-less pipelaying technology which enables hundreds of metres of flexible pipe up to 600mm diameter to be laid from the launch point *16 <2009
195. Development of improved technology for liquefaction of natural gas reduces cost of liquefaction by 25% *16 <2009
196. Bifurcated trend in power production: 1) bigger and efficient plants 2) smaller, simplified plants for distributed generation *5
197. Electricity is generated in ever smaller CHP units, o.001 MW/power/unit *5 2030
5a. Renewables’ fate, in general
198. The share of energy produced from renewable sources in the CR, particularly biomass, small water power stations, geothermal and sun energy, will increase *3 2010
199. 305 TWh/yr total electricity by RE technologies (1990: 191 TWh/yr) *7 2010
200. 12% contribution from renewables to EU gross, inland consumption (EU target) *7 2010
201. RE technologies fully economically competitive *7 2015
202. Renewables play a significant role in the energy systems *7 2020-30
203. Applied schemes for RE systems integration into existing electric power supply in Europe *7 2010
204. 100% RE systems communities/regions established *7 2010
205. Operating RE systems in developing countries *7 2010
206. RE provides >50% of world energy (shell scenarios) *7 2050
207. RE provides 33% of world energy *7 2030
208. Decrease in world energy consumption from fossil fuels and nuclear sources *7 2050
209. A significant portion (10%) of energy usage is derived from alternative energy sources, such as geothermal, hydro-electric, solar/photovoltaic *8 2010
210. Renewable energy will mature *8 2017
211. Share of power produced from renewables (without hydro) exceeds 10% *9 2020
212. Significant impact of renewables on the global energy mix, especially driven by environmental concerns *12 >2020
213. Effective power and heat supply systems in Denmark in which 75-100% of the electricity is based on RE resources *12 2030
214. Practical use of systems with combined solar/fossil power generation (>100MW) in areas with sufficient solar intensity *9 2016
215. 1200 GWh/yr surplus electricity production in Denmark (due to a.o. RE and CHP systems) *12 2020
216. 280 GWh/yr surplus electricity production in Denmark (due to a.o. RE and CHP systems) *12 2010
217. Cost reductions for energy technologies (p. 100) *5: 2020
Biomass and wastes: 10-15%
Wind onshore: 15-25%
Wind off shore: 20-30%
Solar PV: 30-50%
Solar thermal power: 30% or more
Geothermal: 10%
Hydro: 10%
5b. Renewables’ fate: Biomass, biogas and waste
218. Genetically engineered biomass that produces more ethanol *2
219. Energy crops combined with biomass use for cogeneration (heat & electricity) *6 2004-8
220. Wide-spread use of biogas from garbage dumps *6 2009-13
221. 135 Mtoe/year biomass in EU (three-times increase) *7 2010
EurEnDel – Energy related statements from previous Delphi surveys
22
222. 225 Mtoe/year biomass in EU corresponding to 25-30% of current primary energy *7 2015
223. 75 Mtoe/year bioheat in EU (doubling) *7 2010
224. 250-750 Mt/year of energy crops in EU *7 2015
225. 75-150 Mt/year of short rotation forestry in EU *7 2015
226. 30% increase in biomass energy resources from wood wastes and municipal solid wastes in EU *7 2015
227. Co-combustion with other materials with >30% of the caloric value from biomaterials *7 2010
228. >30% improvement in combustion efficiency *7 2015
229. Biomass gasification widely employed in power plants *7 2015
230. Pyrolysis oil as transportation fuel *7 2020
231. Biodiesel (esterification) employed widely at mass markets *7 2015
232. Competitive bioethanol prices in Europe *7 2010
233. Biological materials, such as crops, trees, and other forms of organic matter, are used as significant (10%) energy sources *8 2011
234. 10% of Germany’s energy demand is met by biomass *9 2012
235. High efficient energy conversion from biomass (eg. gasification) are widely used. *9 2013
236. Bio plant electricity generation: 1-12 EJ *11 2020
237. Bio plant electricity generation: 1-18 EJ (primarily gasification technology) *11 2050
238. Commercial contribution from bioethanol *12 2004
239. Biomass cofiring: Use can be increased relatively easily to 2-4% of coal generation *13 <2020
240. Biomass used as common technology *14 2004-9
241. Organic energy sources (biomass) exploited through economical technologies *15
242. First practical use of commercially competitive energy crops for electricity generation *16 <2006
243. Treatment and reuse of wastes to obtain energy such as methane at low cost using biotechnology *14 >2014
244. Widespread recovery of energy from waste materials in UK *16 <2006
246. The planning of new industrial parks comprises the use of waste heat for other processes *9 2012
247. Utilization of low grade industrial waste heat becomes normal commercial practice in UK *16 ? or never
248. Combination of biomass and waste gasifiers with gas in gas-fired combined cycle power plants *5 <2012
5c. Renewables’ fate: Photovoltaics
249. Photovoltaics central for the changing energy picture *1 2025
250. Photovoltaics panels increasingly used in rural areas of ‘world 2’ and third world *1 2025
251. Solar cells provide 4% of US power *1 2025
252. Multi-junction photovoltaic cells that use a very wide range of the electromagnetic spectrum. This will result in higher conversion efficiencies *2
253. Polymeric based solar cells as opposed to solid-state semiconductors. Will improve conversion effiencies to electricity by over 50%. *2 2020-30
254. Optical films that concentrate solar energy *2
255. Space based power can be beamed via microwaves to receiver parts on earth where microwaves could be converted back into electricity. *2 2030-50
256. Low cost and highly efficient photovoltaics with long life time. One million 4kW systems on rooftops equal to one 4GW nuclear plant *2
359. Hot dry rock power generation technology *14 >2020
5k. Renewables’ fate: Solar chemistry
360. Solar fuels that can replace oil and natural gas products *7 2030
361. Substitution of artificial light in photochemical and photocatalytical processes with solar light *7 2010-30
362. Solar detoxification and sterilization of water *7 2020
363. Solar high temperature processes applied in recycling of metals and for vitrification of filter dusts *7 2020
6. Carrier fuels and storage technologies
6.a. Batteries
364. Advanced batteries *15 2005-10
365. Batteries double the current specific energy (?)*14 2004-6
366. Lead-acid batteries, nichel-cadmium/lithium batteries, lithium-polymer batteries that are light and have long life time and low cost are available *2 2010
367. Battery use of electricity storage *6 2006-10
368. Batteries with a high energy density (> 200 Wh/kg) are widely used *9 2012
369. Rechargeable Polymerbatteries with an energy density of 400Wh/l are in practical use *9 2015
370. High density (200 Wh/kg) secondary batteries *14 2008-11
371. Rechargeable polymer batteries with a volume-specific capacity of double current ones *14 2012-20
372. Rechargeable polymer batteries 400 W h/litre *14 2010-12
373. Widespread use of high density (4 times that of lead-acid) battery competitive with lead-acid technology *16 <2014
6.b. Fuel Cells
374. Micro distributed power systems in a distributed generation systems (based on SOFC and PEM fuel cells) *42015-20
375. Use of fuel cells for heat and electricity production in industry *6 2006-10
376. Use of fuel cells for heat and electricity production in the residential sector *6 2015
377. Fuel cells a predominant form of electrochemical energy generation *1 2025
378. Reversible fuel cells to create the fuel cell fuel with electrical input *2 2010-20
379. Fuels cells converting fuels to electricity are commonly used (30%) *8 2019
380. Fuel cells (solid electrolytic) >10 MW are used in regional CHP and power generation plants *9 2017-20
381. Power plants on the basis of coal-gas fuelled high temperature fuel cells (200 – 300 MW) are in use *9 2023
382. PEM fuel cells are widely used for CHP applications in houses *9 2020
383. Widespread use of decentral high temperature fuel cells for CHP applications in industrial and commercial use *92019
EurEnDel – Energy related statements from previous Delphi surveys
388. SOFC (Solid Oxide) delivered from industry *12 2005
389. Commercial contribution from SOFC (ceramic) and SPFC/PEMFC (polymer) fuel cells *12 2010
390. Outphasing of alkaline, phosphoric acid, and molten carbonate fuel cells *12 2010-18
391. Fuel cells an integrated part of the hydrogen energy system *12
392. Fuel cells as highly efficient environmentally safe and portable power sources *14 2012-20
393. Commercial development of fuel cells *15 2005-10
6.c. Hydrogen
394. An extensive distribution network to supply decentralized costumers with hydrogen is established *9 2027
395. Hydrogen transport and storage technologies *6 2006-10
396. Hydrogen production from renewables *6 2011-15
397. 10% H2 produced from renewables *14 >2020
398. The biological production of hydrogen by use of solar energy and biological organisms (or parts) works on industrial scale. *9 2023
399. Hydrogen use in gas turbines *6 2010-15
400. Hydrogen turbines *6 2010-15
401. Hydrogen becomes routinely used in energy systems *8 2020
402. Hydrogen (gained by electrolysis in solar or wind parks) is used as energy storage and fuel for electricity production *9 2022
403. Practical use of a thermochemical process for hydrogen derivation *9 2020
404. Use of metal hybrids to increase energy density of hydrogen storgare *5 long term
405. Carbon nanotubes to draw hydrogen into the storage, increasing the filling efficiency *5 long term
406. Practical use of hydrogen fuelled gas turbines for public power generation *9 2023
407. Commercial contribution from hydrogen carrier technology *12 2017
408. Significant improvement in H2 technology, main production from fossil fuels *14 2003-5
409. H2 production from non-fossil fuels *14 2008-9
410. Thermochemical descomposition processes for hydrogen production *14 2006-10
411. Practical use of methane and methanol derived from coal and biomass by use of hydrogen gain by electrolysis (non fossil) *9 2020
6.d. Other storage technologies
412. Conventional flywheel energy storage *6 2006-10
413. Flywheel energy storage combined with superconductors *6 2011-15
414. First practical use of other large-scale energy storage (e.g. flywheels, compressed air) competitive with pumped storage technology *16 ? (or never)
415. Superconducting storage devices *6 2011-15
416. Superconducting, magnetic energy storage with high efficiency, high capacity energy storage systems to compensate for large daily swings in power requirement and to stabilize transmission systems against disturbances *2
417. Practical use of energy storage systems employing supra conductors with a capacity similar to pumped storage hydro plants (1Mio kWh) *9 2026
418. High temperature superconductors *6 >2015
419. Advanced cable and insulation materials *6 2006-10
420. Improved natural gas storages *15
421. First practical use of advanced gas storage systems able to hold 4 times as much as current systems *16 <2011
422. Integrated transport and energy systems: *4 2030
EurEnDel – Energy related statements from previous Delphi surveys
27
423. Electricity surplus to be produce hydrogen or charge batteries
424. Gradual development towards this integration, highly dependent on both policy push for environmental regulation as well as on technology push for improvements in fuel cells, storage etc.
425. Hydrogen economy: the ideal production technology would be electrolysis of water, but its costs are 3-4 times higher than the current steam reforming.
426. Storage in inorganic crystal structures such as carbon nano-tubes (long run) *5
427. Long term storage technologies employed *7 2010
7. Hydrocarbon bottleneck
7.a. Raw materials
428. Crude oil will remain the basic petrochemical raw material. *3 2010
429. Consumption of biologically degradable fuels will increase *3 2010
430. Coal will be an important competitive power and non-power-producing source in the CR during the whole first half of the 21st century *3 2010
431. Europe will become more dependent on gas imports from Russia, NIC, North Africa and Near East *5
432. Unconventional natural gas (hydrates, gas from coal mines) cover >25% of the worlds natural gas demand *9 2025
433. Reserves-to-production ration, high growth scenario: 37-330 years *11 2100
434. Reserves-to-production ration, middle scenario: 28-55 years *11 2100
435. Reserves-to-production ration, sustainability scenario: 10 years *11 2100
436. Security of supply: projected imported dependence of EU and EU-30: 54% and 42% (Green book 2000) *4 2010
437. Security of supply: projected imported dependence of EU and EU-30: 62% and 51% (Green book 2000) *4 2020
438. Security of supply: projected imported dependence of EU and EU-30: 71% and 60% (Green book 2000) *4 2030
439. Today natural gas accounts for 23% of global primary energy consumption. It is expected to raise from current 2.4Tm3/a to 4.5 Tm3/a or 28% of primary energy mix (IEA reference scenario) *5 2020
7.b. Exploration & Production
440. Remote sensing of hydrocarbons becomes a standard commercial technique in exploration *16 <2006
441. Development of advanced techniques to analyse and interpret (full wave) generated by 3D seismic surveys *16<2004
442. Reduction in costs of oil/gas drilling by 50% *16 <2006
443. Widespread exploitation of high pressure, high temperature oil/gas reservoirs *16 <2006
444. Widespread exploitation of oil/gas reservoirs in deep water and severe environments *16 <2009
445. Increase the proportion of economically recoverable oil by 50% in existing reservoirs by appropriate modelling and physical/chemical treatment *16 <2010
446. Commercial use of microbial-enhanced recovery techniques to improve the yield from oil reservoirs *16 <2014
447. Commercial use of multiphase well-stream transport over distances in excess of 200km and in water depth up to 3,000 m. *16 <2010
448. Reduction in capital costs of offshore platforms by 50% compared with best practice today *16 <2010
449. Widespread exploitation of oil shale and tar sands *16 >2015
450. Advanced automation and robotics become a standard part of long-wall coal mining equipment *16 <2005
451. Reduction of 25% in the cost of removal of sulphur from run-of-mine coal *16 <2010
452. Widespread commercial recovery and utilisation of coal-bed methane *16 <2008
453. Environmentally benign recovery of petroleum resources and deep sea oil & gas production technologies *15
7.c. Conversion technologies
454. Appropriate methods of exploitation of coal methane and development of new technologies of its use (fuel cells, co-generation, fuel of motor vehicles, chemical use) will be developed *3 2010
455. New generation of CFB (circulating fluidised bed boiler) plants with supercritical steam cycle combines high fuel flexibility and high efficiency *5
456. Higher power-to-heat ratio is expected by integrating a high temperature fuel cell with an IGCC plant (Integrated gasification combined cycle) – for wood gasification about 60% and for natural gas-fired fuel cell boosted plants about 70% *5 2030
EurEnDel – Energy related statements from previous Delphi surveys
28
458. Liquefied coal technology *6 >2015
459. IGCC (coal gasification) *6 >2015
460. Fluidized bed combustion *6 2005-9
461. Combined Cycle (gas) *6 <2005
462. In-site gasification of coal mines *9 2022
463. Widespread use of power plants using gasified coal *9 2014
464. coal hydration is economical feasable *9 2017
465. High efficient combined cycle power plant (entry temperature >1500°C) are widely used *9 2009
466. Integrated high temperature fuel cells / combined cycle power plants with efficiencies of 70% are on the market *9 2015
467. Supercritical coal-fired power plant developments *14 2000-5
468. Efficient gas turbine combined cycle (75%) *14 2003-6
469. Direct coal liquidation *14 2005-9
470. Large-scale combined cycle power generation using high-efficient gas turbines (>1500C) *14 2007-10
471. Direct coal-fired turbine (advanced thermodynamic cycle) *14 2008-11
472. Carbon dioxide fixation technology *14 >2013
473. 50% of orders for new coal generating plant in OECD require gasification or other clean coal technology *16 <2009
474. First practical use of gasification of oil refinery residue for power generation which is cost-competitive with upgrading residue to liquid products. *16 <2008
475. Development of direct (non-syngas) conversion of methane to heavier hydrocarbons *16 <2013
476. First commercial use of large, efficient gas-fired combined cycle power generator *16 <2005
478. Development of improved open-cycle gas turbines providing 10% improvement in efficiency *16 <2005
479. First commercial use of large, efficient gas-fired combined cycle power generator *16 <2005
480. Retrofitting of power plants (prolonging their useful life) *6 2005-9
481. Improvements in treatment of coal and waste incineration *15 2005-10
7.d. General Outlook
482. US moves away from fossil fuels *1 <2025
483. A number of changes may be expected in the utilization of natural gas, both institutional (continuing privatisation and liberalisation of the market) and factual, particularly the extension of domestic resources *3 2010
484. Die Frage, ob abiogenes (sich im Erdinnern selbst bildendes) Erdgas gewonnen werden kann, ist weitgehend geklärt. *9 2021
485. Energy supply still rely on fossil fuels *11
8. Nuclear Power
8.a. Advanced reactors
486. Advanced light-water reactor incorporating new passive safety systems *5
487. High-temperature gas-cooled reactors (HTRs or HTGRs) promise competitive unit size of 100-300 MW as web as high efficiency. HTR can be used to produce high-quality steam or hydrogen for the process and chemical industries. *5
488. Fusion nuclear power is used commercially for electricity production *8 2046
489. Small and medium sized nuclear power plants are used to supply heat and power to cities *9 2020
490. A fast breeder reactor is in practical use *9 2026
491. A fusion reactor is developed. Waste problems are solved *9 2028
492. Fusion (with magnetic plasma) is used for power (and hydrogen) generation *9 2028
493. Generation IV reactors (commercial contribution) *12 2030
499. Light-water nuclear reactors produce electricity at costs competitive with other base-load generation *16>2015 or never
500. First commercial use of Fast Reactor *16 >2015 or never
501. First commercial use of small (<300MWe) modular nuclear reactor incorporating passive safety design *16 2005-20
8.b. Treatment of nuclear waste
502. Nuclear waste a principal risk issue *1 <2025
503. Glass ceramics preferred medium for storing of radioactive wastes *1 2025
504. A highly developed techique for the reuse of nuclear waste, which also permits the separation of highly contaminated waste by groups according to decontamination periods, is possible . *9 2022
505. The safe and secure encapsulation of Plutonium 239 is operational worldwide. *9 2019
506. Practical application of treatment procedures (for example transmutation) for higly contaminated, solid nuclear waste. *9 2020
507. Nuclear waste can safely and permanently be stored due to special insulation techniques and video or satellite-based control systems *9 2016
508. Closed nuclear plants can be safely and economically decommissioned *9 2011
509. Reuse of nuclear waste *14 2009-13
510. Deep underground repositories become the universal method of disposal of all intermediate and high level nuclear wastes *16 2005-15
511. Commercial use of nuclear fuel reprocessing which is cost-competitive with direct disposal of spent fuel and its associated waste and meets all applicable safety requirements *16 ?
512. Ten-fold increase in that fraction of the world market for nuclear decommissioning services in which UK companies can compete *16 <2010
8.c. Risk of nuclear accident and long-term perspectives
513. Widespread contamination (worse than Chernobyl) by a nuclear device will occur *1 <2025
514. Synergy of coal and nuclear defines the long-term development trajectory of Czech power engineering. *3 2010
515. Fission nuclear power is used for 50% of electricity generation *8 2046
516. Due to climate concerns and improve security nuclear power is widely accepted in Europe *9 2015
519. Improved efficiency and life extension of current plants possible at low cost. New small plants may better meet market needs *13 <2020
520. Widespread use of improved techniques for remote condition monitoring, inspection, maintenance and repair significantly extent the operating life of nuclear generating plant and associated fuel cycle facilities *16 <2004
9. Power play in the energy market (balance exterior)
521. 70% of EU energy imported *12 2030
522. Widespread use of technology which allows users to arbitrage automatically between fuels and suppliers based on pre-set preferences for fuel price, type, availability and emission characteristics *16 <2010 (or never)
523. Widespread use of network management systems, models and databases allowing dynamic electricity and gas system control in a de-regulated market *16 <2008
524. Use of local generators to supply electricity to 20% of villages in developing countries which are currently without electricity *16 <2010
10. Energy price and taxes
525. Rise in absolute costs of energy *1 2025
526. Powerpool with high price elasticity will push for advanced steering and regulation technology (intelligent consumption) that automatically regulates consumption (from washing machines, water heater etc) when prices are
EurEnDel – Energy related statements from previous Delphi surveys
30
low. Also the powerpool will push for development of storage technologies (hydrogen storage, batteries, pfase change), in particular in distributed generation systems. Three preconditions are crucial for the implementation of powerpool:
527. Changed taxation and tariff system
528. Advanced ICT systems
529. Flexible consumption options offered by electricity producers *4
530. Green taxes 2015
531. Prices for gas and electricity varying over time are standard *9 2009
532. Energy prices evolution (1997 –2020) in the US (in 1997$) *13: 2020
Motor gasoline: +0,4% to +39,6%
Other petroleum: +3,1% to +13,6%
Natural Gas: -17,6% to -4,2%
Coal: -27,3% to +73,4%
Electricity: -23,4% to -11,5%
533. High price elasticity in prices to regulate this complex and highly distributed system
11. Future social relations
534. Supranational government will become effective (though not completely) with regard to environment and other issues *1 2025
535. Structural shifts to information economy (major reason for reduced energy use in US) *1 2025
536. Material changes lead to permanent energy savings in ‘world 1’ societies (US, EC, etc.) *1 2025
537. Flexible and varied markets for housing and commercial space will take over from standardized and uniform ones *17
538. Energy and eco-balances are use by companies for product and engineering decisions *9 2009
12. The future of work
539. Education of a workforce of 1.7 million in the wind energy area *7
13. Demographic trends
14. Technological progress
14a. Efficiency gains in power and heat production
540. Active coatings (eg. on buildings and cars) for power generation, heat storage and lighting *9 2021
541. Kraft- bzw. stromerzeugende Maschinen auf der Basis von Rankine- oder Jouleprozessen ermöglichen die wirtschaftliche Nutzung von industrieller Abwärme einschließlich Niedertemperaturwärme. *9 2015
542. Efficiency gains in power plants due the new catalytic processes (low pressure, low temperature processes) *62010-15
543. Practical use by electricity utilities of ultra-super-critical steam turbines *16 <2010 or never
544. Wärmetransformatoren zur Anhebung des Temperaturniveaus in Abwärmeströmen werden in der Prozeßtechnik und der Fernwärmeversorgung in breitem Umfang eingesetzt. *9 2014
545. Cheap oxygen separation allow for widespread application of burning processes with >800°C *9 2019
546. Piezoelectric materials in wind and hydro power generation. Stands for 1.7% of US electricity *1 2025
547. Piezoelectric materials in wind and hydro power generation. Stands for 12% of US electricity *1 2035
548. Development of improved catalyst technology enables 30% of existing high temperature/high pressure chemical processes to be replaced by low temperature/pressure alternatives *16 <2014
549. Widespread achievement of at least 20% improvement in energy efficiency and reduction in emissions of industrial process plant through use of improved design methods (e.g. process integration, intensification *16 <2008
550. Widespread use of improvements in monitoring techniques (and appropriate refurbishment) extends the life of non-nuclear energy plant by 10 years *16
551. First practical use of Humid Air Turbine, or other advanced cycle, in large-scale operation *16 <2010
552. Power supply: high energy, low mass supplies and pulse supplies *15
EurEnDel – Energy related statements from previous Delphi surveys
31
553. Expert systems for power plant <2005
14b. Information technology
554. Information technology *17:
Unlimited computer power and storage and transmission capacity
Intelligent products
Digital assistants
555. Optoelectronic switching prevailing in IT *1 2025
556. All-photonic switching prevailing in IT *1 2025
14c. Biotechnology
557. Biotechnology *17:
Plant or microorganisms as a factory:
Production of hydrogen
Surface coating
Biosensors
14d. Materials technology
558. Materials technology *17:
Nanotechnology
Artificial photosynthesis by means of advanced material síntesis
Bioimplants made by semiconductor surfaces, custom-made at molecular level using micro-and nanotechnology
Intelligent materials
559. Coating/structural materials for storage and transmission of hydrogen *1 2025
560. Superconducting films, wires etc. *1 2025
561. Superconductive materials in magnets in turbines and motors *1 2025
562. Superconducting materials are commonly used (>30%) for transmitting electricity in electronic devices, such as energy, medical and communications applications *8 2025
563. Commercial contribution from MgB2/metal superconductive technology *12 2005
564. Commercial contribution from coated conductor superconductive technology *12 2010
565. Out-phasing of BSCCO/Ag super-conductors *12 2015-28
566. Phase change materials that change state at 22C. *2
14e. Other applications and processes
567. Extensive monitoring, assessment, and analysis of resources and environment through sensor networks *1 2025
568. Practical use of a process with which water is dissociated through solar rays *9 2018-20
569. Widespread use of speed control in electric engines *9 2006
570. Advanced heat transfer fluids; non-corrosive, non-freezing, high heat capacity, low viscosity *2
571. Specific seismic sensors are developed for the detection and exploration of new, deep oil and gas fields, as well as other resources *9 2014
572. First practical use of ‘Intelligent’ meters incorporating 2-way communication and control of appliances to purchase electricity at times and rates chosen by the customer *16 <2005
15. Environmental restraints and objectives
573. ‘Totally managed’ (though not fully understood) environment and resources *1 2025
574. Sustainability and environmentalism a basic value and organization concept of global society *1 2025
575. Energy is no longer among the primary environmental concerns due to significant improvements in energy matters *1 2025
EurEnDel – Energy related statements from previous Delphi surveys
32
576. Global warming and nuclear matters are among the top three environmental concerns *1 2025
577. Consumption of fuels and pressure on the state administration to improve conditions for air and water protection will increase *3
578. Electricity production with reduced NO2 emissions *6 2005-9
579. 2/3 of the world’s CO2 emissions from non-OECD countries *7 2050
580. Green manufacturing by most manufacturers *8 2016
581. Improvements in fossil fuel energy efficiency and greater use of alternative energy sources reduce greenhouse gas emissions by one-half from current volumes *8 2028
582. Industrial ecology is used by the majority of manufacturing facilities *8 2038
583. Ecosystem design *8 2039
584. Atmospheric CO2 concentration, high growth scenario: 560-950 ppmv *11 2100
585. Atmospheric CO2 concentration, sustainability scenario: 445 ppmv *11 2100
586. Greenhouse gas reduction of 8% in EU, relative to 1990 *12 2012
587. Greenhouse gas reduction of 21% in Denmark, relative to 1990 *12 2012
588. Comprehensive recycling systems (provide energy) *15
589. Elucidation of the relationship between man-made Carbon Dioxide and global warming to an accuracy of +/- 20% *16 ? (or never)
590. Widespread use of low NOx burners and combustion systems for all fuels *16 <2008
15a. CO2 separation and sequestration
591. CO2 capture and storage technologies in coal-fired plants *6 2010-15
592. CO2 Emissions are reduced to one half by CO2 immobilisation *9 2021
593. Fuel cells can be combined with other cycles. With carbon separation could achieve carbon and criteria air pollutant emissions near zero *13 <2020
594. CO2 from fossil power plants will be stored in natural gas and oil fields (sequestration) enhancing at the same time the recovery of those fields *9 2015
595. Future strategies for carbon sequestration include injecting carbon dioxide into the earth or into the sea, separating the gases from the air and storing them by planting trees, and using chemistry to produce new products from these gases, such as methanol to fuel hybrid cars, and as an energy source for fuel cell cars *10
596. First commercial application of techniques for disposal/storage of CO2 (other than by growing plants) *16>2010 or never
597. Practical use of a process which converts CO2 emissions from big power plants into liquid fuel (methanol) by use of hydrogen *9 2024
598. Technologies for CO2 fixation in power plants are in practical use *9 2021
599. Production of algae and other aquatic biomass is a potential concept for arid and sunny areas, where the growth of surface vegetation is limited due to precipitation. Algae systems might be connected to the sequestration of CO2 from gases from a power plant. The long term goal could be algae that produces hydrogen for fuel cells *5 long term
EurEnDel – Energy related statements from previous Delphi surveys
33
References
1. Coates, J.F.; Mahaffie, J.B.; Hines, A. (1997): 2025: Scenarios of US and Global Society Reshaped by Science and Technology, Oakhill Press
2. Natural Resources Canada Energy Technology Futures: Results from the Renewable Energy Focus Group, February 18, 1999.http://www.nrcan.gc.ca/es/etf
3. Ministry of Education, Youth and sports of the CR: Proposal of the National Research Programme 2002. Technology foresight in the Czech Republic, 2002.
4. Ingeniørforeningen I Danmark (IDA) Danish Association of Engineers: Energy technology foresight. Visions for the future energy systems (only in Danish). Copenhagen, 2002. www.ida.dk
5. VTT Energy: Energy visions 2030 for Finland. Helsingki: Edita Prima Ltd. 2002 6. OPTI Observatorio de Prospectiva Tecnológica Industrial, “Energía. Tendencia tecnológicas a medio y largo plazo”, OPTI /
Ministerio de Ciencia y Tecnología, 2002 7. EUREC 2002: The Future for Renewable Energy 2. Prospects and Directions, Brussels: EUREC Agency (European
Renewable Energy Centres Agency) 8. George Washington University 2002: The GW forecast, http://gwforecast.gwu.edu/index.asp 9. Fraunhofer-Institut für Systemtechnik und Innovationsforschung “DELPHI’ 98. Studie zur globalen Entwicklund von
Wissenschaft und Technik. Zusammenfassung der Ergebnisse. Methoden- und Datenband”, 1998 10. Washington DC, November 19, 2002 (ENS) – Environment News Series 2002. http://ens-news.com/ens/nov2002/2002-11-
19-02.asp 11. Nakicenovic, Nebojsa & K. Riahi 2002: An Assessment of Technological Change Across Selected Energy Scenarios,
International Institute for Applied Systems Analysis, Laxenburg, Austria (also published by the World Energy Council 2001) 12. Larsen, Hans & Leif Sønderberg Petersen (eds.) 2002: Risø Energy Report 1. New and emerging technologies – options
for the future, Risø National Laboratory, Denmark 13. Scenarios for a Clean Energy Future, Oak Ridge National Lab. et.al. 2000, Springfield VA, USA,
www.nrel.gov/applications.html 14. Cahill, Eamon / Scapolo, Fabiana and others, “The Futures Project. Technology Map”. Series no 11, European
Commission, Directorate General JRC Joint Research Center, 1999 15. Ministry of Economic Affairs, The Netherlands (1998): Technology Radar. Vol. 1-5, Ministry of Economic Affairs/RAND
Europe 16. Loveridge, D., Georghiou, L. & Nedeva. M. (1995): United Kingdom Technology Foresight Programme, Delphi Survey,
PREST, University of Manchester, 543 pp. 17. Leif Magnusson et al. (eds.): Swedish Technology foresight. A Synthesis Report from the Swedish Technology foresight
Project. The foresighted society. Västerås: Stenby Offset, 2000. ISBN 91 7082-668-4


![Welcome [s22.q4cdn.com] · Forward-looking statements This presentation, as well as other statements made by Delphi Automotive PLC (the “Company”), contain forward-looking statements](https://static.documents.pub/doc/80x56/5e0a8f48f582600daf0975b1/welcome-s22q4cdncom-forward-looking-statements-this-presentation-as-well-as.jpg)