Energy sector analysis and modeling – From primary to final energy 3 Master Thesis in Energy Studies Report, Submitted May 21 st 2012 Energy sector analysis and modeling – From primary to final energy Bastien Praz Supervisor: Per Lundqvist, Local Supervisor: Léo Bénichou
Transcript
Energy sector analysis and modeling – From primary to final energy
3
Master Thesis in Energy Studies
Report, Submitted May 21st 2012
Energy sector analysis and modeling
–
From primary to final energy
Bastien Praz
Supervisor: Per Lundqvist, Local Supervisor: Léo Bénichou
Energy sector analysis and modeling – From primary to final energy
4
Energy sector analysis and modeling – From primary to final energy
5
Master of Science Thesis EGI 2012: EGI-2012-050MSC
Energy sector analysis and modeling –
From primary to final energy
Praz
Bastien
Approved
6/19/2012
Examiner
Per Lundqvist
Supervisor
Léo Benichou, Per Lundqvist
Commissioner
Contact person
Abstract limate change and energy supply limitation are growing concerns. Solving them requires
strong implication from our societies and more and more stakeholders and scientists are
therefore interested in energy scenarios publication. They indeed provide options to be
investigated in order to set the future strategies to tackle these issues.
It is within this context that The Shift Project has launched the Scenario project which main purposes
are to clarify this specific prospective field and develop a pedagogical energy scenario modeling tool.
The Master Thesis work presented in this report is the result of a six months internship in the
company within the Scenario project team, and more particularly within the energy scenario
modeling tool development team. Beside the energy demand and supply side of a scenario design
stands the energy sector. The work focused on this aspect, which corresponds to all the industry and
the energy flows standing in between primary energy resources and our final energy consumption. It
can therefore be considered as the global conversion process of the energy, which encompasses
conversion efficiencies, energy allocation and the different losses. This energy sector is of main
concern when one is dealing with energy scenarios since it can contain many possibilities to be
investigated in order to set up different variants. Getting a strong knowledge about the energy sector
is then crucial. Nevertheless, the global conversion process between primary and final energy still
remains a big black box for many of us and therefore prevents us to realize its role and the means
that can be applied to explore even further the possible energy scenarios possibilities.
To counteract this observation, this thesis work was dedicated to analyze the energy sector at world
scale by revealing its components and the main levers that could be used to shape the future energy
system. This analysis was conducted via the system approach and lead to the development of a
C
Energy sector analysis and modeling – From primary to final energy
6
methodology to model the energy sector and develop a module in which cursors enable an end-user
to generate a wide range of scenarios and explore different resources allocation options etc. This
module is part of TSP’s energy scenario modeling tool together with a demand and a supply side
modules. This work is intended to provide a clear vision of the energy sector and the key parameters
that might be of main importance to initiate variants study for energy scenarios prospects, such as
power efficiencies, energy mix or distribution losses.
Energy sector analysis and modeling – From primary to final energy
7
Executive Summary ecision making is certainly one of the hardest exercises that are up to today’s stakeholders
to solve. To help matching this expectation, many managing tools have been developed to
provide assistance on this particular task. Multi criteria analysis or cost benefit analysis have
this main feature to present a given methodology leading to comparisons and eventually decisions
that doesn’t look obvious to take at first sight. This concern is every day at stake in our modern
society. Politicians, companies, investors, and even all human beings have to make choice every day
in order to meet their targets or address their problems.
When it comes to the global energy consideration, concerns are the same. Governments, industries,
investments funds and citizen have at their own level to choose or promote which energy they want,
at what price, within which system, with what particular consequences and so on. What is the
priority? CO2 emissions? Non-reliance with respect to fossil fuel resources? Energy efficiency?
Domestic industry promotion? Criteria are numerous and all are more or less considered when it
comes to such a major topic that energy is. Then, making a decision is even more difficult with so
many parameters to deal with. As common decision making tools would be too limited to handle this
kind of general issue, the energy scenarios have become one of the most relevant implements to
provide studies and analyses of what could be the future of the energy supply, consumption, uses,
etc. Their importance and the way they influence decision makers must be discerned as a great lever
that tend to be more and more powerful. In France for instance, the recent release of a breakthrough
scenario designed by NégaWatt Association has raised many consciences in the politic and economic
world. This scenario describes a possible pathway to phase out all nuclear power plants by 2033
while relying on more and more renewables through new technologies perspectives, production
efficiencies’ increase and efficiency/sobriety on the demand side. The result is a picture of the energy
in France in 2050 mostly provided by renewables with a backup made of 10% of fossil fuels for the
primary energy sources (négaWatt, 2011). This kind of long term studies suggests many ideas and
specific policies to be applied in order to achieve a given energy transition. Far from being the
solution, such scenario offers ideas and tracks while influencing minds on both sides of the society,
people and stakeholders.
Therefore, the role played by energy scenarios and the organizations that publish them is more and
more crucial. What could be the consequences of badly designed scenarios? How far can we trust
them? How can we distinguish them between realistic ones, superficial ones or imaginary ones?
There is an increasing demand for trustable and fully informed scenarios to avoid such worries.
Nevertheless, the way energy scenarios are currently built does not often reveal the main hypothesis
and the data considered, and this lack of transparency prevents them from being legitimated and
completely trusted. That observation could remain a limitation to the key utilization that could be
made of the energy scenarios, and this would be a real pity. To avoid such detrimental occurrence,
energy scenarios must tend towards transparency in both methodology and hypothesis used. The
recent example of the nuclear issue illustrates that beyond the paradigm, the future of nuclear
power must be studied with no passion but reason, since what is at stake is far more crucial than
simple opinions and feelings. To do so, the basic requirements mentioned above must be completed.
D
Energy sector analysis and modeling – From primary to final energy
8
Then, all the cards lay on the table as the guarantors of the reliance one can accord to the studies
published, preventing any bad policies and their resulting consequences.
This transparency issue is precisely what The Shift Project wants to achieve. After having worked on
a grid analysis for energy scenarios in order to reveal their underlying assumptions and costs, the
organization has been developing an energy scenario modeling tool with this special transparency
feature in mind. The tool named Rogeaulito has this pedagogical feature to clearly display the
hypothesis made for the scenarios and to represent them in physical terms. In addition to this, one
other specificity is that the design of a given scenario is actually made with the uncorrelated setting
of the demand on one side, reflecting social and economic desires, and the supply on the other side,
mainly constrained by physical limits such as fossil fuel reserves and land use for instance. Rogeaulito
compares them together to highlight the possible primary energy gap that could be missing to meet
the demand. This gap is called Missing Energy Supply, and as every difference, it can be negative and
therefore reflects a primary energy surplus. However, to be able to compare a demand expressed in
final energy (electricity, heat, etc.) with a primary supply (oil, coal, biomass, etc.), Rogeaulito is
provided with an energy sector model that makes the link between the desired final energy demand
and the possible primary energy supply. This energy sector converts back the final energy demand
into the equivalent one in primary terms. Therefore, this energy sector implies all the transformation
units and the energy flows standing in between the primary energy resources and our final energy
consumption. It’s the power plants, the pipelines, the electricity grid, the refineries, and the
allocation of all the primary products to the generation of a useful energy that is necessary to
enlighten us, run our machines, fuel our vehicles and so on.
Thus, the energy sector plays a key role in Rogeaulito, and must also match the transparency
specification that characterizes the tool. Showing up the different cursors and the main levers that
rule this wide system would offer a pedagogical feature to the energy scenario designing process
while enabling to study relevant solutions to reach some specific targets. What happens for the
climate if we phase out all nuclear power plants worldwide? What would be the consequences of the
development of carbon capture and storage (CCS) devices on the primary energy consumption?
What if we allocate gas to liquid fuel production? What is the consequence of unconventional oil
extraction on the refinery’s efficiency and therefore the global chain’s efficiency? All that kind of
questions constitutes today’s concerns about the energy system, and a well-built energy sector
model is really valuable to investigate on such topics standing between demand and supply. The
Master Thesis presented in this report will explain the work performed to analyze and model the
energy sector so as to use it in Rogeaulito.
After having introduced The Shift Project and presented a bit more what an energy scenario is, the
report will reveal the importance and the interest to understand the energy sector and investigate
solutions within it. Then, it will explain the main issues to address and the methodology adopted to
do so. As modeling a system is not easy, the first step will be the study of the energy sector as it is
actually to finally represent it as a system through the system approach. This work enables to
identify the different flows and components to carefully consider before developing a simplified
model. Then, trustable historical data are required to put figures on the different elements identified
in the system approach. IEA database is the information sources that solve the data availability issue
by providing complete statistics on the world energy system. The development of a computerized
Energy sector analysis and modeling – From primary to final energy
9
model is finally possible, led by the system description achieved previously and the data treatment
performed on the IEA database. The modeling work performed is explained in details and highlights
the way that the key data of the energy sector system have been found for the past years. The
corresponding section explains how the energy sector complexity has been modeled under a
simplified interface. A Sankey diagram is presented as the main output of this part and shows a
simplified representation of the energy sector, with the energy flows and the main components. This
work ends with the development of the conversion module of Rogeaulito. This module gathers the
energy sector model developed previously with an end-user interface dedicated to match a user-
friendliness specification. Some graphs resulting from a scenario designed with Rogeaulito are finally
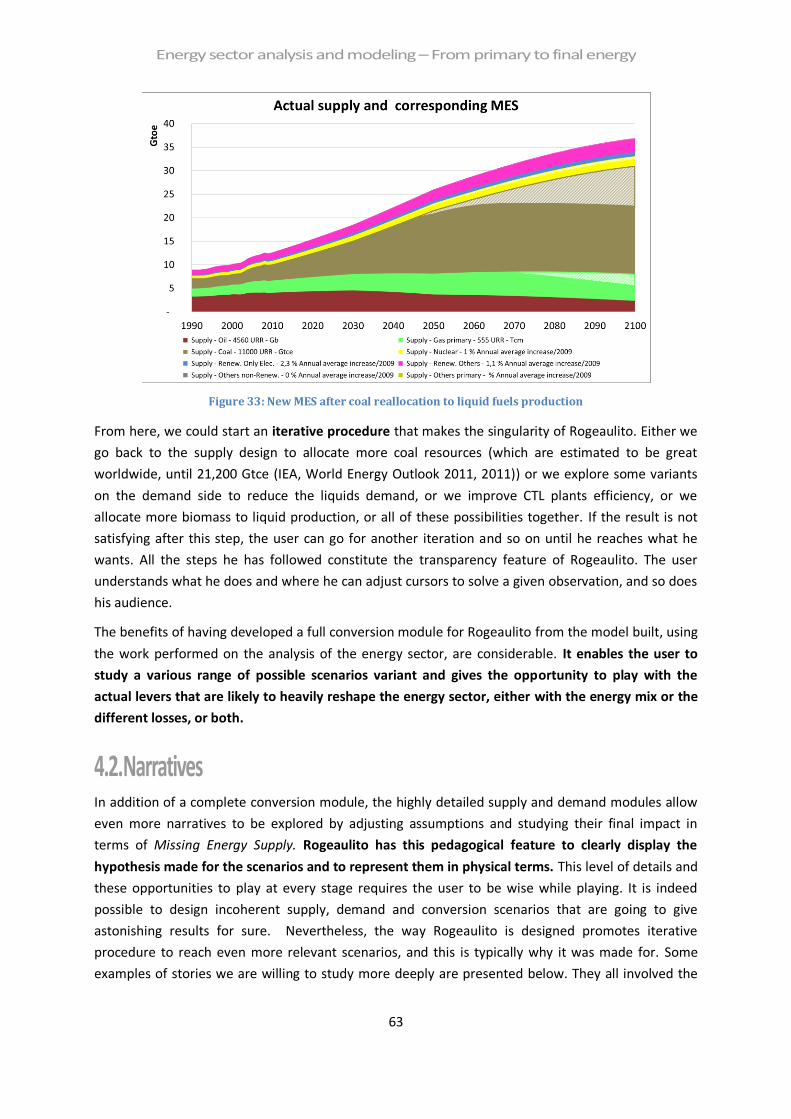
presented and point out the related Missing Energy Supply. They indicate that, for instance, an
allocation of some of the coal resources to liquid fuel production could solve the missing oil supply
issue that is likely to occur in the upcoming years. This example illustrates the added value of the
global work performed on the energy sector, from analysis to modeling, and via data treatment.
Energy sector analysis and modeling – From primary to final energy
10
Energy sector analysis and modeling – From primary to final energy
11
Acknowledgement
I would like to thank The Shift Project’s team for this wonderful time spent with them, in a pleasant
and professional atmosphere which has been an endless motivation driver. Cédric and Léo, with their
invaluable support and confidence, have contributed a lot to the success of this Master Thesis.
Pauline has taken care so well of my case during the first days that I owe her many special thanks. I
was very glad to meet the two new permanent members, Malika and Anne-Caroline, with whom I
loved to share and discuss every day, either about philosophical or technical issue. I have a special
thought to all the trainees that were already in position before I arrived, Zeynep, Olga, Gaëlle, Marie-
Pierre, Margaux, Julien and Adrien, because they were dynamic colleagues and faithful friends. I
spent really good moments with all of them. A grateful thanks to the Rogeaulito Team, Damaris and
Joseph, leading by Léo, for this great work we have done together, and all these nice discussions we
have had. A great thanks to Jean-Marc Jancovici, President of The Shift Project. Jean-Marc was really
positive with his comments and has provided us with many relevant ideas for Rogeaulito’s evolution.
A warm greeting to Carbone 4, our neighbor company, whose collaborators were really willing to
share with us.
Finally, I would like to thank The Shift Project for having hosted me during 10 months and offered me
this so interesting position, in which I was able to fulfill my potential and develop my knowledge.
Besides, I thank KTH and all the professors and assistants I met during these almost two years of
study within energy topics. I am honored to be very soon a graduate from this prestigious university.
I would like to precise that I really appreciated my year spent in Stockholm. Sweden is a pleasant
country in which the lifestyle is definitively unique. I particularly thank Professor Per Lundqvist for
having been my supervisor and for his constructive feedback about the presentation I performed.
To put an end to these greetings, I sincerely thank my family and my friends. They know how much I
owe them.
Energy sector analysis and modeling – From primary to final energy
12
Energy sector analysis and modeling – From primary to final energy
13
Table of contents Abstract ..............................................................................................................................................5
Table of contents .............................................................................................................................. 13
List of tables ..................................................................................................................................... 15
List of figures .................................................................................................................................... 15
List of acronyms ................................................................................................................................ 17
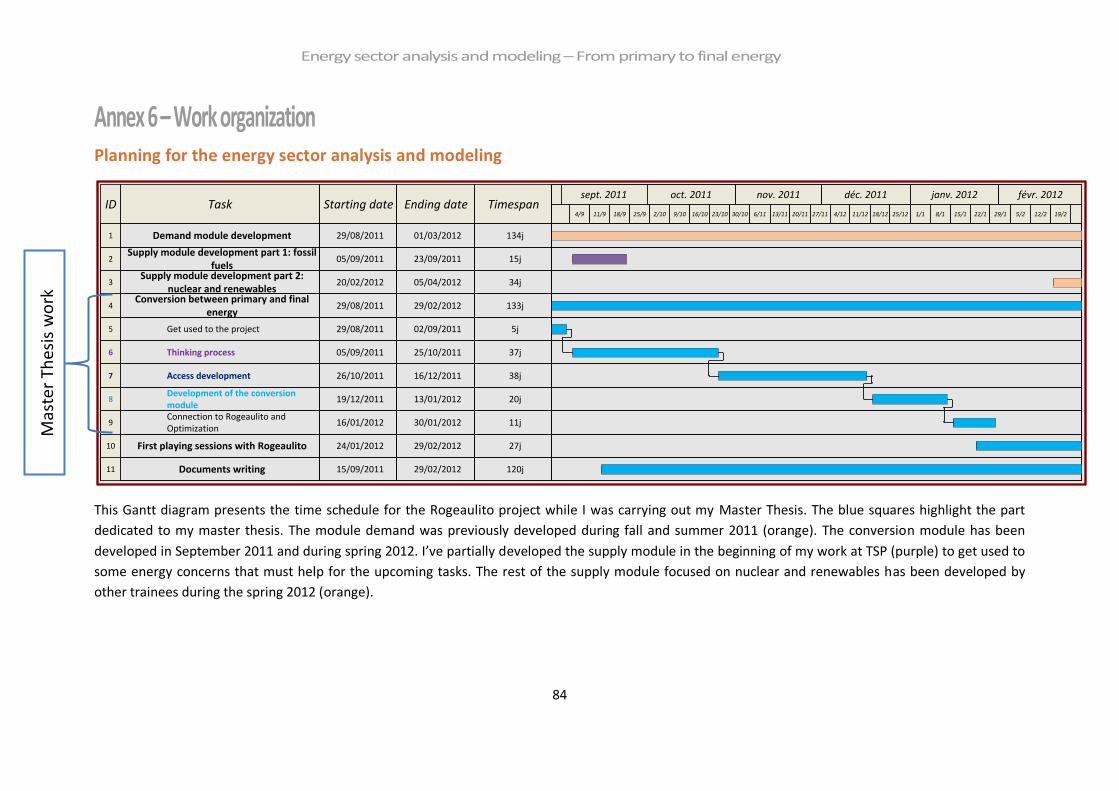
Figure 43: Induced demand calculated from the demand and the conversion settings ...................... 82
Figure 44: Running the conversion module ....................................................................................... 83
Energy sector analysis and modeling – From primary to final energy
17
List of acronyms CAPEX: Capital Expenditure
CHP: Combined Heat and Power
CTL: Coal-to-liquid
EIA: Energy Information Administration
Gb: Giga Barrel (109 barrels)
Gboe: Giga Barrel oil equivalent
GHGs: Green House Gases
Gtce: Giga ton coal equivalent
GTL: Gas-to-liquid
Gtoe: Giga ton oil equivalent
IEA: International Energy Agency
Ktoe: kilo ton oil equivalent
MES: Missing Energy Supply (or energy gap) embodies the gap between a given induced desired
demand and a possible supply. By convention, the Missing Energy Supply is positive when the
induced demand exceeds the supply and equal to 0 when there is no energy shortage (refers to YtF).
Mtoe: Mega ton oil equivalent
TSP: The Shift Project
YtF: Yet-to-Find or energy gap (refers to MES)
Energy sector analysis and modeling – From primary to final energy
18
Energy sector analysis and modeling – From primary to final energy
19
Foreword
The company: The Shift Project (TSP) The Shift Project is a think tank which focuses on the transition to a carbon-free economy to address
energy reliance and climate change issues.
TSP was founded on the belief that, in a democracy, no great ambition can be realized if the entire
economy militates against it. So to make any change desirable for the community as a whole, it is
essential to convince a proportion of influential economic actors that the desired change will be in
their interest over the medium term. The Shift Project thus seeks to guide decision-making in the
private and public sectors by bringing forward proposals built on scientific fact. It grounds its work on
documented observations and reports prepared on the basis of the very latest scientific knowledge
in conjunction with experts in the field. Many topics are addressed - from economical to technical
ones while always including societal component. TSP’s projects enable the organization to present
relevant analysis and to play a major role in debates about the shift to an economy free of
dependency on fossil fuel. The status of The Shift Project is similar to that of a NGO (it’s a non-profit
organization), and it operates with full transparency, making its work accessible to all. Six major
French companies provide financial support to The Shift Project (adapted from (The Shift Project,
2012)).
The Scenario Project The Scenario project has been initiated one and a half year ago on behalf of Léo Benichou,
supervised by TSP’s director, Cédric Ringenbach. The origin of this project is the will to analyze the
energy availability for countries taking into account the physical limits existing. This important
project relies on three main works that are conducted simultaneously. The first part of the project is
called Analysis Grid and deals with the reviewing of many energy scenarios published by
international organization in order to reveal the underlying assumptions and the costs implied by a
given scenario. The second part is focused on the creation and the supply of a web portal, tsp-data-
portal.org, dedicated to the collection of numerous energy data and statistics displayed under
interactive graphs. Data published on the portal come from the world’s famous energy institution
such as EIA or IEA, and have required a significant work to be published in a pedagogical way. Finally,
the last part of the project is intended to provide a computerized tool to build up energy scenarios by
2100. The name for this sub project is Rogeaulito and has been the subject of my Master Thesis in
TSP.
Energy sector analysis and modeling – From primary to final energy
20
Energy sector analysis and modeling – From primary to final energy
21
1. Introduction and notions
1.1. Energy – the fuel of our society Fall 2011 – The euro crisis is still locking the European Union future, making countries coping with
one of the major issue of their time: Greece and debts questions. This complicated situation and so
called “low growth” period is not profitable to the development of CO2 emission reduction
technologies or alternative energies, even though the crisis tends to decrease our consumption and
therefore our GHGs releases. In France, many subsidies to renewable energy companies have been
cut off to start saving state’s money, while Germany merely decided to shut down some of its nuclear
plants during last summer and the rest of them by 2022. Both of these consequences lead to the
threat of electricity shortage during winter, in case of great low temperatures.
Meanwhile, fossil fuels are also a matter of concern. Peak oil is close to occur and shale gas future in
Europe seems compromised for the time being. European reliance on fossil fuels is therefore a weak
point, and each year the energy bill is more expensive. As our modern economies’ prosperity is
strongly correlated to the fossil fuels availability (Jancovici, Is the price of oil driving the economy?,
2011), specialist are more and more septic about the possibility to come back to a long period of
growth if European governments keep acting for a carbon society.
The energy issue is more than ever a critical and challenging point. European Union, and more
generally the entire world have to handle it in a proper way to avoid any predicted disastrous
scenario to occur. And these terrible scenarios are one of the motivations to set up energy scenario,
and more particularly transition scenarios. Going on with prospective analyses for the future is
indeed a way to carefully consider what could be the risks, and what could be done to counteract
them as efficiently as possible.
Setting up energy scenarios has always been a critical task, because of the numerous hypothesis and
parametric representation to be considered carefully, and that can be interrelated most of the time.
Thus, the system approach is a method which can help. Using this, The Shift Project has wanted to
develop its own modeling tool to build up energy scenarios by 2100. The main goal of this work is to
generate scenarios consistent with sets of hypothesis in a transparent manner, on demand, supply
and energy transformation sides. As they are modeled independently and not dynamically coupled,
the resulting scenarios are presented with their « virtual » Energy yet to be found, gap between
desired demand and actual possible supply constrained by physical limits. Rogeaulito, the name of
this tool born from this vision, has been developed for more than one year now and has for main
purpose to provide a transparent energy scenario thinking process. The section 1.4 presents it in
details.
1.2. What is an energy scenario? When we talk about scenario, we talk about telling a story. So here is the point: an energy scenario is
no more and no less than a story about the future of an energy system. A story told to present a
Energy sector analysis and modeling – From primary to final energy
22
future imagined and modeled, matching the specific assumptions or preferences set. The scenario is
dedicated to give a snapshot of what could be the situation year after year. The scenario is often
designed with respect to one or several ideas or convictions that the teller had in mind. According to
the authors, they try to integrate as much as possible the evolution of the different variables, such as
technical changes for instance, that might occur in the scenario’s upcoming years. Concerning
energy, scenarios often deal with the future production or consumption, the possible evolution in
terms of efficiency or energy mix. In a wide consideration, besides to the technology issue, energy
scenario can be based on different concerns such as economical ones, with the question of the
investments, the market and the prices, and social aspirations. The later can lead to preferences
related to many parameters such as ecological ones, but also promote cheapest energy generation
mix according. Therefore, macro and micro economies can remain strong background of any scenario
built.
Energy scenario can be published by any organization, association, NGO or institution. It considers a
specific geographical region or a specific sector. The scenario might be strongly influenced by its
authors and their own visions. That is why a scenario cannot be considered alone in itself but with
the opinion and assumptions hidden behind it.
The time range of an energy scenario is one critical point. How long can we consider without telling
unlikely things to occur because the future is too far and uncertain? As a scenario is merely a story,
we could say we do not care about telling wrong things for the furthest years since it is obviously a
fictive vision aimed at providing ideas and levers for changes. Nevertheless some existing scenarios
are really committed to be close to the reality, acting as clairvoyant. Is it relevant? Nothing is less
certain. Nevertheless, the further is the scenario, the harder is the prospective work. This is why we
mainly see scenarios going up to 2030 or 2050.
Designing a scenario can be done through different methods, and each scenarios maker has his own
methodology and assumptions. Some scenarios are bottom-up made, whereas others can be strike
out sized. The final purpose is to be able to discuss something whether it is the coherence and
sustainability of a policy or the consequences of a current trend.
Table 1 presents the different types of approach by which a scenario can be designed. It is interesting
to notice that according to the vision he wants to show, the author will not consider the modeling
task from the same point of view.
Energy sector analysis and modeling – From primary to final energy
23
Type of Scenario Characteristics
Tendency Scenarios The past and current trends are modeled and
extended
Exploratory Scenario
We set some specific features and assumptions
(“causes”) and we look at the possible
consequences according to a model
Normative Scenarios (Backcasting) A desirable objective is set and then a pathway
allowing to achieve it is described
Table 1: Three main types of scenarios
Figure 1 gives an idea of how different scenarios can be on a same topic according to the entity
which has designed it and the conclusion they want to highlight.
Figure 1: Several oil production scenarios (tsp-data-portal.org, 2012)
1.3. What is a modeling tool? There is always a modeling tool behind a scenario that can be more or less complicated or
elaborated. It gathers the mathematics models, the set of assumptions, the initial data and the
framework of the designing task to perform the calculation providing the scenarios with the data. A
nice picture would be the one of the sewer, the fabrics, the sewing machine, and the dress. The
sewer is thinking with what he has at his disposal about how to design the dress he wants. He
therefore selects the fabrics and sews them using the more appropriate sewing threads and buttons,
with the help of his sewing machine. The resulting dress must match what he had in mind or some
Energy sector analysis and modeling – From primary to final energy
24
modifications can be made. We have here with the fabrics, buttons, sewing threads and sewing
machine the metaphor of the modeling tool standing in between the user and the scenario.
To go to more concrete considerations, a modeling tool can be presented with Figure 2, which
illustrates the Rogeaulito case. The model gathers all the information needed to calculate the
outputs. Here, the main ones are energy graphs representing the demand, the supply and the
Missing Energy Supply. To get them, historical data had to be provided first, for each one of the
parameters existing inside the model. Then, the user extends these parameters with the use of
cursors according to what he has in mind and following a given logic. He can also base his work on
scientific publications or other interesting papers. For instance, he can decide to investigate an
electric vehicles scenario. Then, he will have to adjust the cursors related to electric cars, electricity
primary mix and electricity production to develop a coherent global scenario.
Figure 2: Running a model - Rogeaulito case
1.4. Rogeaulito – TSP’s energy scenario modeling tool The origin of Rogeaulito comes from two mere observations. The first one is that the majority of
forecast scenarios begin by modeling demand (often on the basis of socio-economic considerations
or aspirations, resulting in uninterrupted economic growth), and matching it with the necessary level
of supply, plus price adjustments where necessary. The reasoning adopted whether implicitly or
explicitly– is that when prices rise, it is possible to access more resources and therefore to serve
more consumers. The second is that we have recently begun to see the superimposition of different
approaches based on the view that energy supply will be increasingly constrained by physical limits
(on resources, technological performance, etc.), thereby imposing an upper limit on supply, to which
demand will have to adapt.
In order to reconcile these two apparently contradictory viewpoints, TSP has decided to build a
software package called Rogeaulito , which allows to simulate supply and demand on the basis of
Energy sector analysis and modeling – From primary to final energy
25
distinct methods, and compare the outcomes to draw conclusions that neither of the two
approaches described above can provide individually.
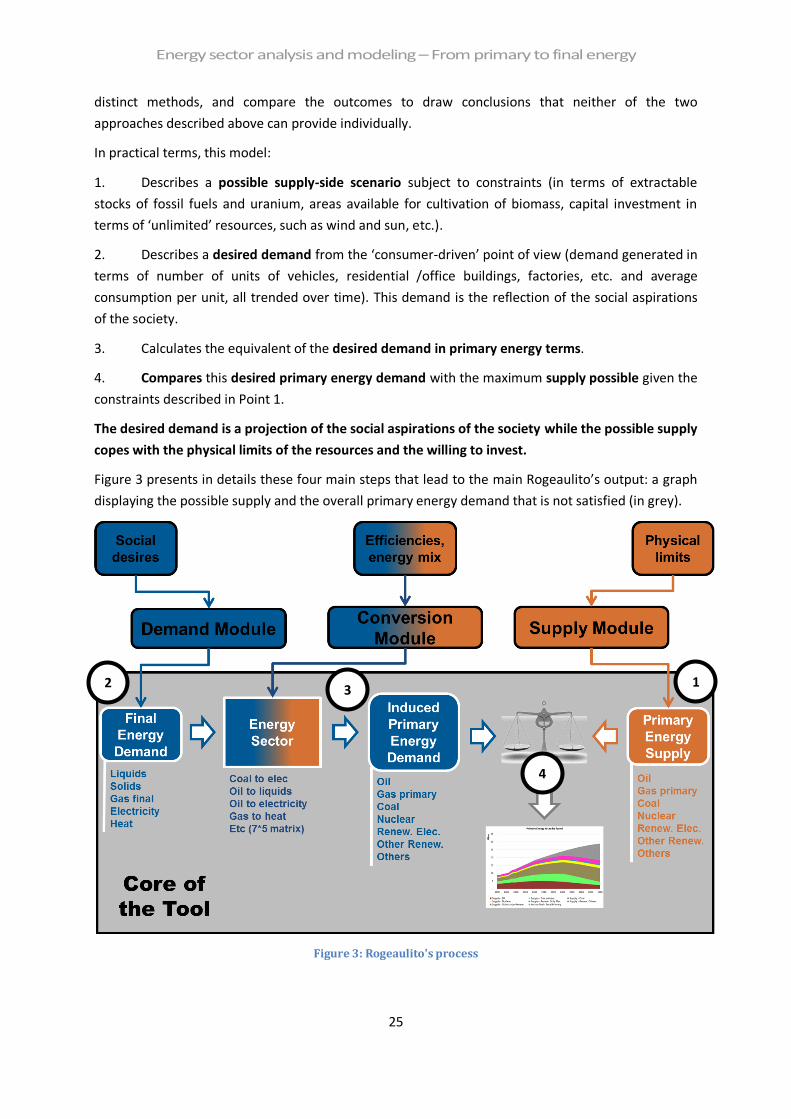
In practical terms, this model:
1. Describes a possible supply-side scenario subject to constraints (in terms of extractable
stocks of fossil fuels and uranium, areas available for cultivation of biomass, capital investment in
terms of ‘unlimited’ resources, such as wind and sun, etc.).
2. Describes a desired demand from the ‘consumer-driven’ point of view (demand generated in
terms of number of units of vehicles, residential /office buildings, factories, etc. and average
consumption per unit, all trended over time). This demand is the reflection of the social aspirations
of the society.
3. Calculates the equivalent of the desired demand in primary energy terms.
4. Compares this desired primary energy demand with the maximum supply possible given the
constraints described in Point 1.
The desired demand is a projection of the social aspirations of the society while the possible supply
copes with the physical limits of the resources and the willing to invest.
Figure 3 presents in details these four main steps that lead to the main Rogeaulito’s output: a graph
displaying the possible supply and the overall primary energy demand that is not satisfied (in grey).
Figure 3: Rogeaulito's process
1 3 2
4
Energy sector analysis and modeling – From primary to final energy
26
This working method highlights any Missing Energy Supply (MES) in which the trend in energy supply
falls short of meeting projected demand. This then forms the basis for calculating iterations to
provide a quantitative evaluation of the initiatives required to ensure that demand does not exceed
constrained supply, which is the precondition for further crisis-free development of the society in
which we all live. It then becomes possible to describe and quantify the long-term policies that will
enable demand to be limited to within the maximum possible supply. Figure 4 and Figure 5 are the
graphs obtained from a scenario variant performed with Rogeaulito. The global Missing Energy
Supply is presented in grey on Figure 4, above all the possible supply for each type of primary energy.
Figure 5 provides a more detailed analysis with the Missing Energy Supply by primary energy (in light)
directly displayed above the corresponding primary energy supply (in dark).
Figure 4: Missing Energy Supply graph
Figure 5: Missing Energy Supply by primary energy (light fillings)
MES
Supply
Energy sector analysis and modeling – From primary to final energy
27
Unlike classical economic models, this approach also provides an understanding of how quantities
may be regulated in systems other than that of the free market (shortages, rationing, stringent
regulation, etc.), which cannot be achieved by models based on demand/price elasticity.
Compared with sector-based approaches (limited to transport, housing or industry, for example), this
method offers the advantage of taking account of transfers between sectors of consumption and the
potential trade-offs between sectors against a background of global optimization.
Some extra modules have been developed to explore the outcomes of the scenarios produced such
as CAPEX and GHGs emissions.
This part has been adapted from (The Shift Project, 2012). More information about the overall
development and running process of Rogeaulito are gathered in the annex of this master thesis
report.
1.5. Motivations for the thesis: the key role of the energy sector What we are going to call energy sector is the mental representation of all the production and
transformation units, all the energy flows, all the allocation and all the losses standing in between
our primary resources of energy and our final energy consumption. This term of energy sector that is
going to be used during the whole report is of main importance when it comes to study the process
between the natural resources we get for free and the necessary energy we need to achieve our
social desires within society, trough transformation and production operations.
Considering the energy scenario modeling task, energy sector represents a high potential area of
investigation. Aspects such as conversion efficiencies, energy mix, auto consumption of the energy
extraction unit (that somehow integrates the Energy Return on Energy Invested concept (EROI)) or
distribution losses are to be studied as sensitive levers between primary and final energy. Thus,
besides demand and supply sides, the conversion sector embodies a third critical part lying in the
middle of the chain. While demand study may focus on efficiency measures, sobriety and societal
considerations, and supply side can evaluate resources potential and technological improvements,
the energy sector offers a set of parameters both technological and managerial that have to match
with both sides, demand and supply.
Let’s consider the energy mix for example, or the allocation of the primary energy to the final uses
which is more accurate. The reallocation of a big share of natural gas used as heater mean in cities,
to electricity generation, can actually induce huge consequences in energy availability. Figure 6
specifies it with a short comparison of the global home heating efficiencies of these two possibilities.
The first case is gas heating from a boiler whereas the second one is electric heating, with electricity
provided by a gas fired power plant. As natural gas involves few losses between its extraction and its
utilization, the first case global heating efficiency is close to 1, whereas the second case has to cope
with the electrical efficiency of the gas to electric process and leads to an efficiency more than a half
lower, around 0.37. We are here close to the concept of exergy which consists in taking into account
the quality of the energy in order to optimize its utilization.
Energy sector analysis and modeling – From primary to final energy
Another example, a bit more complex, is provided by a group of Chinese searchers which has
investigated the coal case in China related to transportation (Xunmina, Yan, & Xilianga, 2010). The
question was to compare GHG emissions from a life cycle point of view for two possible future
ways to fuel cars: the use of coal-to-liquid (CTL) fuel or the development of electric vehicles
powered by coal-to-electricity. The sensitive impact of carbon-capture and storage (CCS) both in CTL
production and electricity generation is also studied. As presented by Figure 7, a systemic approach
has been conducted to carefully consider the relevant aspects required for a proper comparison.
Figure 7: System boundaries of the coal for transportation study, from (Xunmina, Yan, & Xilianga, 2010)
Energy sector analysis and modeling – From primary to final energy
29
The conclusions they reached is that electric vehicles (EVs) development has more GHG emissions
reduction potential than CTL option. Moreover, EVs coupled with CCS deployment can reduce the
GHGs emissions by 60 to 70 % compared to the current level of petroleum-based gasoline car.
Beyond demand and supply considerations, these examples illustrate the strong impact that the
way the energy sector is built can have. It highlights the fact than many sensitive studies can be
performed just by adjusting the levers that constitutes the global energy sector. Thus, the
understanding of this sector, the overview of the way it works and the visualization of the actors and
the energy flows can give incredible potential investigations of the primary/final energy relation
which leads even further looking at the possible scenarios that are likely to be designed.
In Rogeaulito, the energy sector is what makes the link between the desired demand and the
possible supply. It is indeed dedicated at converting the desired final energy demand into an
equivalent primary energy demand so as to compare it with the supply within the same referential,
i.e. the primary energy base. As Rogeaulito claims to be a pedagogical tool with full transparent
hypothesis, using iterative process to identify the levers of action to address the Missing Energy
Supply issue by involving many levels of settings, it requires energy sector settings. These settings can
be of many types. We can quickly mention the two main ones: the energy allocation and the
transformation units’ efficiencies. The first one enables many investigations and possibilities that
must somehow match the technological feasibilities. As presented above, the use of whether gas or
electricity for heating purposes or the transformation of coal to provide vehicles’ fuel are good
examples of what can be studied, but gas-to-liquid solution or biomass utilization are other high
potential topics. Efficiencies of the transformation units are more focused on technological
improvements or the consequences of some evolutions. Carbon capture and storage (CCS) devices
are known to make the fuel consumption increase to provide the same amount of energy output. It
means that the introduction of such a technology will eventually lead to a decrease in the conversion
efficiencies. On the other hand, CHP plants are efficient solution to improve the global use of primary
energy resources and their expansion could positively affect the heat and power overall efficiency.
With the same idea, heat pumps can represent interesting solution making the use of electricity
pretty efficient (for a COP above 3). Nevertheless, to be able to explore variations with such complex
settings, we need to analyze the energy sector with all its complexity and then model it under a
simplified interface that could optimize the end-user’s work. This is to what my work was dedicated
to.
Energy sector analysis and modeling – From primary to final energy
30
Energy sector analysis and modeling – From primary to final energy
31
2. Energy sector analysis and modeling –
Initialization
2.1 Master Thesis issue As stated in the previous part, understanding what lies in the energy sector enables many studies to
be investigated to reach different goals, whether optimization of the exergy efficiency or
prioritization for the allocation of the primary energy. Whatever the goal, the possibilities while
designing scenarios with this are so wide that it requires a certain level of expertise to adjust the
parameters relevantly. This is why prior to any modeling work, a clear and complete analysis of the
subject has to be done in order to identify the main levers and the major entities that constitute the
whole energy sector.
What are the main components of the energy sector?
How can we model such a complex system?
What can we learn from the modeling process to improve our understanding of the energy sector’s
operation and levers?
These questions required a proper methodology to be set in order to face the problematic with the
right angle to get the expected answers. They can be gathered in one big concern that would be:
Understanding and controlling the energy sector evolution – The way to investigate
solutions for our energy use?
Within this main question, the data availability issue is raised and needs to be addressed in between
the analysis and the modeling process. Data will indeed provide us with the corresponding historical
figures of what is involved in the energy sector. For instance, simplify the complexity of the energy
sector through the modeling task required to be aware of what weights or not. Which transformation
units gather the greatest energy flows? What are the conversion efficiencies? Where do the losses
stand, of what types are they, and which one of them really matter?
Energy sector analysis and modeling – From primary to final energy
32
2.2 System approach Address the Master Thesis issue introduced above requires a specific approach coping with the
complexity of the subject studied. Then, it seems relevant to analyze the energy sector as a system
and therefore apply a system approach to carefully identify what we face to. Charles West
Churchman was one of the first to precisely describe the concept of system and the way to define it
as a whole of sub-systems interacting with each other to achieve a set of goals ( (Churchman, 1984
(revised)). He precisely introduced the different components and notions that characterized
completely a given system. Some years after, Kotas defined a system differently, focusing on
thermodynamic laws and technical aspects related to energy flows, transformation and efficiencies
(Kotas, 1995).
From their work, we are going to consider the following elements in our ongoing system description:
- The boundaries. They give what has to be considered in the system and what has to be left
out.
- The actors, or sub-systems, that are as many systems acting within the above one. Among
these sub-systems, we may identify the system manager that may shape the overall system
via his means (here is Churman’s vision a bit expanded to a leveled organization of different
systems).*
- The resources, embodying all the means that the system has at its disposal to achieve its
goal. The resources are inside the system.
- The environment, which is to what the system have some impacts or influence, and can have
its objectives linked.
- The goal that all the system components help to be achieved. The sub-systems can have their
own goal, but be put all together plus considering the interactions of the sub-systems, the
whole must result in the completion of the system’s goal.
*This part may ask for a clarification. Churchman defines two distinctive entities: the system and its
environment, to which the system cannot change anything. What we describe here is a global system
made of sub-systems that can interact one with each other, either through a tree ascendance or at
the same level. Interactions can be bi-directional, and a subsystem can thereby be the environment
of another subsystem. Besides, the environment entity that we define afterwards is considered to be
the environment of the global system, i.e. all the sub-systems organized together.
2.3 Method and objectives The methodology of the work can be defined to answer our problematic with the help of the system
approach described before. A step by step approach, going from analysis to experimentation passing
through the modeling seems to be the suitable way to handle the subject. The first steps are to be
dedicated to the energy sector system description. The level of details and understanding will step by
step increase before focusing on the computerizing of the model set. Make the process
Energy sector analysis and modeling – From primary to final energy
33
computerized will be necessary to deal with one of the expectation which is the integration of the
energy sector model within Rogeaulito.
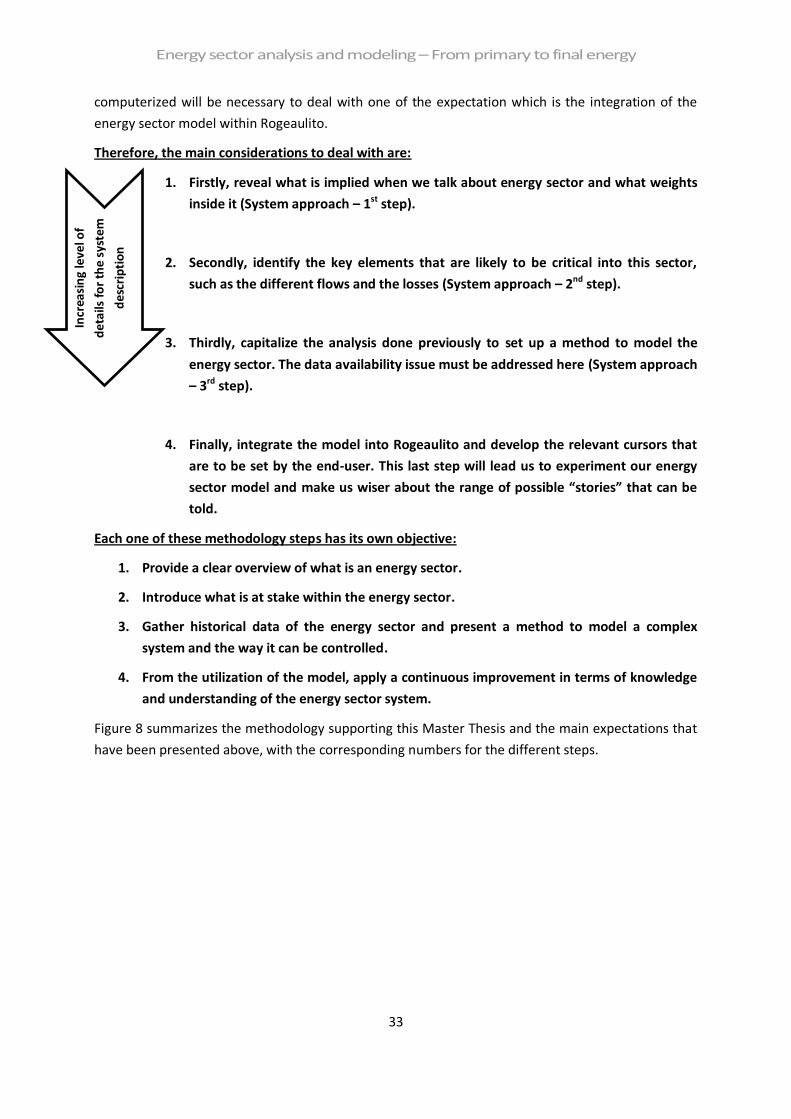
Therefore, the main considerations to deal with are:
1. Firstly, reveal what is implied when we talk about energy sector and what weights
inside it (System approach – 1st step).
2. Secondly, identify the key elements that are likely to be critical into this sector,
such as the different flows and the losses (System approach – 2nd step).
3. Thirdly, capitalize the analysis done previously to set up a method to model the
energy sector. The data availability issue must be addressed here (System approach
– 3rd step).
4. Finally, integrate the model into Rogeaulito and develop the relevant cursors that
are to be set by the end-user. This last step will lead us to experiment our energy
sector model and make us wiser about the range of possible “stories” that can be
told.
Each one of these methodology steps has its own objective:
1. Provide a clear overview of what is an energy sector.
2. Introduce what is at stake within the energy sector.
3. Gather historical data of the energy sector and present a method to model a complex
system and the way it can be controlled.
4. From the utilization of the model, apply a continuous improvement in terms of knowledge
and understanding of the energy sector system.
Figure 8 summarizes the methodology supporting this Master Thesis and the main expectations that
have been presented above, with the corresponding numbers for the different steps.
Incr
easi
ng
leve
l of
de
tails
fo
r th
e s
yste
m
de
scri
pti
on
Energy sector analysis and modeling – From primary to final energy
34
Figure 8: Method and objectives of the energy sector analysis and modeling
The reader can notice that the system approach will be used for more than half of the work.
Energy sector analysis and modeling – From primary to final energy
35
3. Energy sector analysis and modeling –
Application
3.1 Preliminary notions 3.1.1. Primary VS Final Energy
When it comes to energy considerations, this is of main importance to understand the differences
between primary energy, final energy, and useful energy. According to EDF R&D department and
(Benichou, 2011), the following definition can be provided:
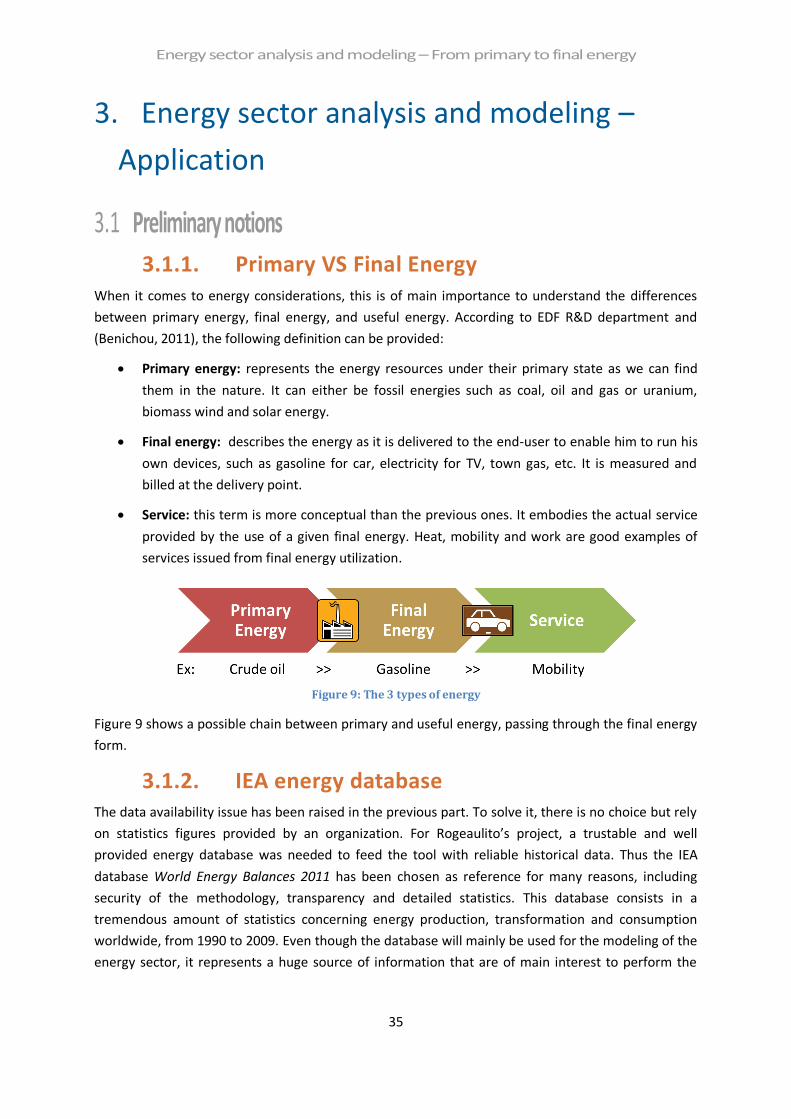
Primary energy: represents the energy resources under their primary state as we can find
them in the nature. It can either be fossil energies such as coal, oil and gas or uranium,
biomass wind and solar energy.
Final energy: describes the energy as it is delivered to the end-user to enable him to run his
own devices, such as gasoline for car, electricity for TV, town gas, etc. It is measured and
billed at the delivery point.
Service: this term is more conceptual than the previous ones. It embodies the actual service
provided by the use of a given final energy. Heat, mobility and work are good examples of
services issued from final energy utilization.
Figure 9: The 3 types of energy
Figure 9 shows a possible chain between primary and useful energy, passing through the final energy
form.
3.1.2. IEA energy database The data availability issue has been raised in the previous part. To solve it, there is no choice but rely
on statistics figures provided by an organization. For Rogeaulito’s project, a trustable and well
provided energy database was needed to feed the tool with reliable historical data. Thus the IEA
database World Energy Balances 2011 has been chosen as reference for many reasons, including
security of the methodology, transparency and detailed statistics. This database consists in a
tremendous amount of statistics concerning energy production, transformation and consumption
worldwide, from 1990 to 2009. Even though the database will mainly be used for the modeling of the
energy sector, it represents a huge source of information that are of main interest to perform the
Energy sector analysis and modeling – From primary to final energy
36
analysis of the energy sector. Figure 10 provides a picture of this database and presents the main
features.
Figure 10: IEA database screenshot
Within the IEA database, we select the corresponding lines to get either the final energy demand
values (consumption) for the demand module or the primary energy supply (production) for the
supply module. Concerning the conversion module, what we need is the lines of the database dealing
with the energy sector, i.e. the sector standing between primary and final energies. This sector is
what we want to analyze and it is characterized by:
The transformation units (called flows by IEA) such as power plants, CHP plants, refineries,
petrochemical plants, etc.
The primary and final energies involved in the transformation processes such as crude oil,
coal, biomass, electricity or heat.
In addition to these transformation lines, we also need to treat the share of primary energy non-
transformed and providing directly final energy e.g. natural gas. Furthermore it is important to know
that for IEA, electricity coming from wind, solar, hydro and some other renewables is considered as
“primary sources of electricity”. It implicitly means that the efficiency of these particular sectors is
equal to 1 since it does not consider any transformation (primary renewable electricity final
electricity).
The 2011 IEA database provides data from 1960 to 2009. For Rogeaulito, we focus on the time range
1990 – 2009.
Year
Country
Flows = energy production/transformation
/consumption entities
Products = energy
Energy sector analysis and modeling – From primary to final energy
37
3.1.3. Conventions and Nomenclature Some specific terms and conventions are applied all along the project and therefore in the master
thesis report. Most of them come from the IEA expression. This section presents some of them to set
a common basement before going on.
Product is used to identify any type of energy under a given form. Thus, lignite, natural gas or
electricity for instance can be suggested with this term.
Flow is a tricky term used by IEA to name all the units through which some energy can pass. Power
plants, refineries, extraction units and residential buildings are good examples of what can insinuated
with Flow.
Primary Distribution is a shortcut to express the way the primary energy is allocated to the final one.
Where is my coal going to? For what gas is it used? It can be seen as the final energy mix of the
primary energy.
Final Distribution is the complementary of the Primary Distribution since it consists in the primary
origin of the final energy, i.e. the primary energy mix of the energy we used at the end of the energy
sector (from what is my electricity produced?).
All the work performed on the raw IEA database is made using the IEA codes for the different
Products and Flows. As the number of energy products is pretty big, and as we want to present our
results in the bases Bp and Bf (see next section), we are going to make a projection of the data at the
end of the process we have developed. This projection is made according to the products and their
corresponding energy carrier in their corresponding bases in order to aggregate all the data into the
primary and final bases which constitute our energy referential.
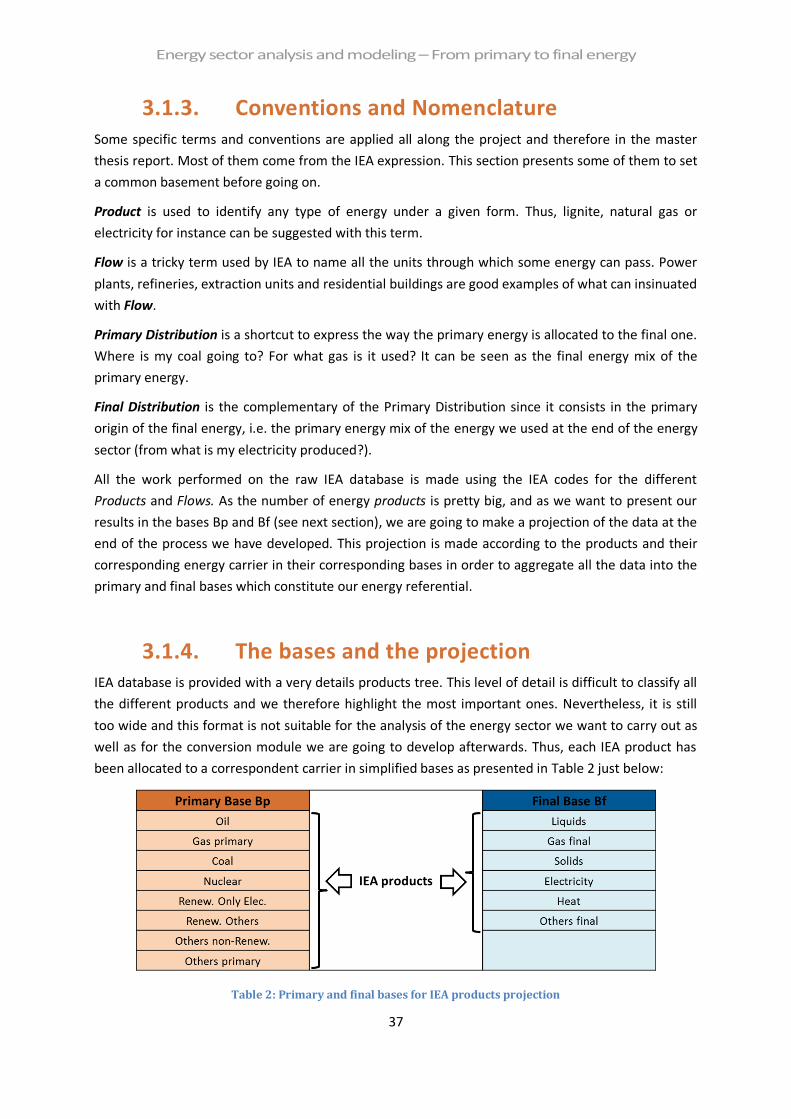
3.1.4. The bases and the projection IEA database is provided with a very details products tree. This level of detail is difficult to classify all
the different products and we therefore highlight the most important ones. Nevertheless, it is still
too wide and this format is not suitable for the analysis of the energy sector we want to carry out as
well as for the conversion module we are going to develop afterwards. Thus, each IEA product has
been allocated to a correspondent carrier in simplified bases as presented in Table 2 just below:
Table 2: Primary and final bases for IEA products projection
Energy sector analysis and modeling – From primary to final energy
38
In the following parts, when we talk about projection, it means the action of aggregating and
crunching the IEA data into the two energy bases presented above, Bp and Bf.
3.2 Step 1 – Description of the energy sector system The definition of the system according to the way we want to present it has been presented in the
System Approach section. We are here going to apply this method and identify the different
elements introduced with the different existing interactions.
Nevertheless, before moving forward, we need to set what the main goal of the energy sector is.
Considering the starting and the ending points of the global energy chain, we can say that the
primary energy resources have been turned into more convenient forms of energy, the final ones, to
fulfill the main expectations of our societies that are sustainable development and prosperity.
Thus, the energy sector’s goal can be defined as the task to transform and allocate energy from
natural resources to our society matching the specifications set.
3.2.1 The energy sector actors (sub-systems) Within the energy sectors, actors are not so many and not so different in their substance, since they
all comply with the same goal: transforming the primary energy and providing the resulting final
energy to the society. In the IEA database, when we look at the different flows, we can identify the
following ones:
- Extraction flows, consisting in all the primary energy extraction units and the first
transformation units. They are the first units in the overall energy sector chain.
- Transformation flows, consisting in transformation unit for the energy.
- Energy transportation flows, such as pipelines or electricity lines.
To these operating flows, we can add the politicians, economic world and other stake holders that
embody other type of actors. These are mainly dedicated to shape the energy sector by allocating
the resources (investments, technologies, primary resources) and setting the energy mix of a given
country for instance. Oil and gas companies, energy companies, research centers, bank and
investment funds as well as politicians are part of this. In France for example, the government
decision associated to the research sector and the energy company have promoted the nuclear
power into the country’s energy mix, leading to a current 75% nuclear share in the electricity
generation (IEA, Electricity/Heat in France in 2009, 2009). According to these different
considerations, this group of stakeholders can be considered as the energy sector system manager
according to the definition of Churchman.
Focusing on each one of these actors, we can associate to them corresponding features such as the
different fallouts they involve:
- Energy losses that can be either conversion losses or distribution losses.
- Auto consumption which corresponds to the amount of energy produced by a unit that is
going to be consumed by this unit to meet the necessary energy needed to run it.
Energy sector analysis and modeling – From primary to final energy
39
- The energy mix, which consists in the pathways followed by energy to go from primary
resources to the final energy consumption.
3.2.2 The resources of the energy sector The main resources we can associate to the energy sectors are:
- The primary energy resources that represent basically all natural sources that can be
harnessed. Two kind of these resources are used for classification, renewable sources or non-
renewable sources. Non-renewable sources are made of ‘stock energy’ (coal, oil …) whereas
renewable sources are mostly composed of ‘flow energy’ (solar beam, wind …) and biomass,
which is a ‘cycle energy resources’ since it can be regenerated at human scale.
- The technologies available are another major resource for the energy sector since it enable
the extraction, the conversion and the transportation of energy and can lead to significant
gain in terms of efficiency and pollution releases.
- Funds and investments are always required when we consider CAPEX intensive sector such
as the energy one. The willing to invest money in the energy sector is strongly linked with the
new technologies penetration gathering performance and green features. The allocation of
the investments play the greatest role since it represents the absolute mean to shape the
energy sector. Whether we decide to focus on shale gas extraction or on nuclear power
generation, or even on smart grids development, the consequences for the resources
availability, the climate and the final energy price are not going to be the same. This resource
is even more strongly linked to the politicians, economic world and other stakeholders than
the technologies one.
Of course many other resources could be gathered in this part such as human resource. However,
they do not constitute critical resources that could effectively shape the energy sector. According to
this criterion, we only retain the resources listed above.
3.2.3 The environment The environment of the energy sector is what is influenced by the later without the ability to be
controlled. Using the two questions Can I do something about it? and Does it matter relative to my
objectives based on (Churchman, 1984 (revised)), we can identify two main elements that are part of
the energy sector’s environment.
The first one is the society. The energy sector is indeed designed, prior to anything else, to provide
energy to our society to ensure its development and its prosperity. It has a clear involvement in the
final goal of the energy sector, but the later cannot make any use of it.
The second one is merely the nature including the entire phenomenon it hosts. Climate, biodiversity,
life resources such as water and biomass, and so on are all part of the nature. The energy sector does
not make use of it but can have strong impacts on it, often bad ones. The main interactions with this
entity are the GHGs emissions that affect the climate, the pollution, the energy losses, the land use …
Nature can be part of the energy sector’s objectives related to climate change issue and sustainable
development concerns.
Energy sector analysis and modeling – From primary to final energy
40
Other types of environments are secondary and we do not consider them in our system study since
they don’t seem to be strongly correlated to the goal and the consequences of the energy sector.
3.2.4 Summary – First system description From these helpful considerations, we are able to describe the energy sector system that is actually a
sub-system of the global energy system. Figure 11 details the interactions within the system in a
simplified diagram.
Figure 11: The system approach of the energy sector
The human development resources represented with investments and technologies are used in the
energy sector via the politicians and economic world (and other stakeholders) sub-system to develop
the energy sector. The primary resources are the starting point of the energy conversion process.
The energy flows pass through the extraction units, the transformation units and the transportation
to be allocated under its final form to the society, according to the energy mix set by the politicians
and the economic world (and other stakeholders). The main interactions with the environment are
the release of GHGs and the energy losses. All this energy sector system standing in between natural
resources and our society is dedicated at providing final energy after transformation and allocation. A
short summary of this stands just below.
Boundaries: All what treats energy flows and stands in between natural resources and the
society
Energy sector analysis and modeling – From primary to final energy
41
Sub-systems: energy industry (extraction units (extract/harness natural resources),
transformation units (convert the energy), transportation (transport the
energy), politicians - economic world & other stakeholders (support
investments, technological development and set the energy mix)
Resources: primary resources, natural flows (wind, solar energy …), investments and
technology
Environment: the nature, the society (considering the consumers, the final users)
Goal: transform and allocate energy from natural resources to our society
3.3 Step 2 – Identification of the main levers Now that we are able to precisely visualize what the energy sector is, we need to identify what are its
key components and factors that have a significant role and could influence strongly the “shape” of
this energy interface. To do so, raising questions can be a good method to have a first idea of the
levers and start studying them further.
What is the primary energy mix of the final energy?
As stated in the Conventions and Nomenclature section, the primary energy mix can be seen as the
final distribution, i.e. the primary origin of each one of the final energy considered. Thus, the
question to be raised would rather be what is the pathway followed by primary resources to be
transformed and provided as final energy? This revealed the allocation issue of the primary
resources. We have explained in the first part of this Master Thesis the key role that energy
allocation can played seen from different points of view, either emissions or resource availability or
overall conversion efficiency. The energy mix is then definitely considered as a key factor of the
energy sector.
Where do the losses stand in the overall process?
Decision making for the energy sector can be so multi criteria that we need to focus on some specific
parts to make a final choice. We have seen that the energy mix can be a topic of choice. The other
one is somehow linked to it, but looks more related to the technologies and the units involved in the
sector: the parallel energy flows, also called losses and auto consumption. The quantity of energy
involved in these flows can be significant and therefore could be optimized with adjustments. They
are presented just below and Figure 12 introduces them:
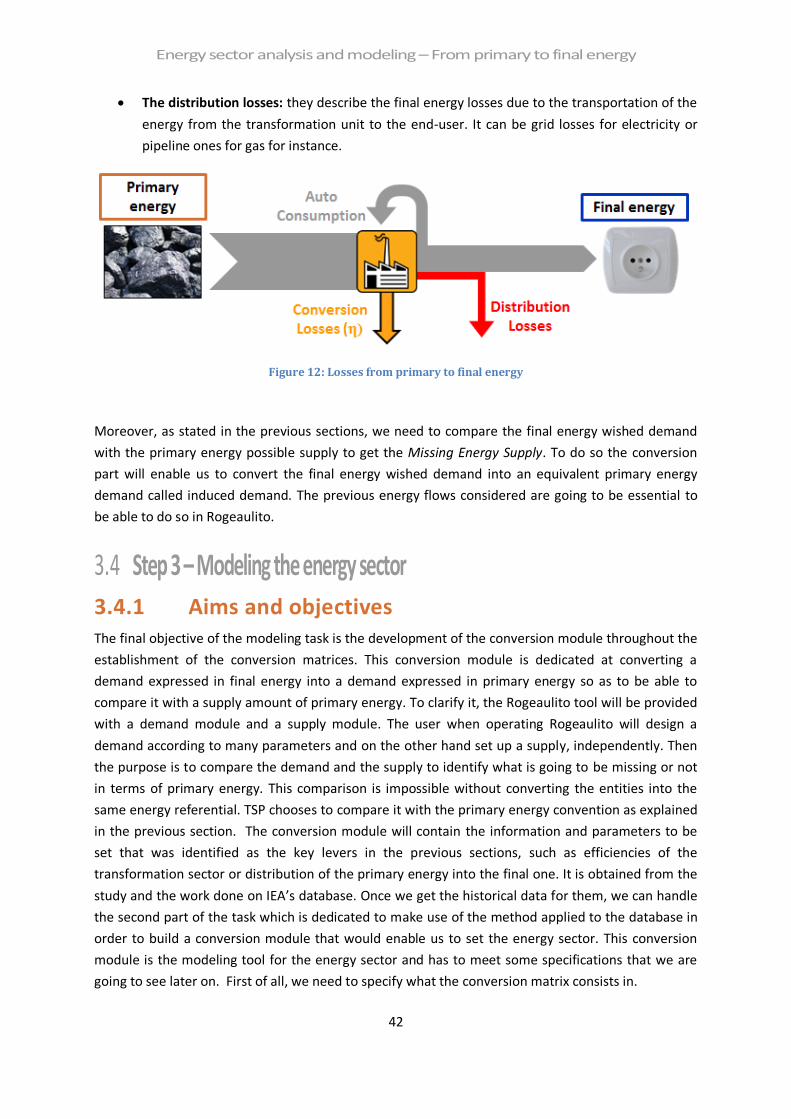
The conversion losses: they represent the efficiency of a transformation unit (power plant,
refinery, etc.).
The auto consumption: this is the share of the total energy produced which is directly used
by the transformation unit to meet its own energy needs.
Energy sector analysis and modeling – From primary to final energy
42
The distribution losses: they describe the final energy losses due to the transportation of the
energy from the transformation unit to the end-user. It can be grid losses for electricity or
pipeline ones for gas for instance.
Figure 12: Losses from primary to final energy
Moreover, as stated in the previous sections, we need to compare the final energy wished demand
with the primary energy possible supply to get the Missing Energy Supply. To do so the conversion
part will enable us to convert the final energy wished demand into an equivalent primary energy
demand called induced demand. The previous energy flows considered are going to be essential to
be able to do so in Rogeaulito.
3.4 Step 3 – Modeling the energy sector 3.4.1 Aims and objectives The final objective of the modeling task is the development of the conversion module throughout the
establishment of the conversion matrices. This conversion module is dedicated at converting a
demand expressed in final energy into a demand expressed in primary energy so as to be able to
compare it with a supply amount of primary energy. To clarify it, the Rogeaulito tool will be provided
with a demand module and a supply module. The user when operating Rogeaulito will design a
demand according to many parameters and on the other hand set up a supply, independently. Then
the purpose is to compare the demand and the supply to identify what is going to be missing or not
in terms of primary energy. This comparison is impossible without converting the entities into the
same energy referential. TSP chooses to compare it with the primary energy convention as explained
in the previous section. The conversion module will contain the information and parameters to be
set that was identified as the key levers in the previous sections, such as efficiencies of the
transformation sector or distribution of the primary energy into the final one. It is obtained from the
study and the work done on IEA’s database. Once we get the historical data for them, we can handle
the second part of the task which is dedicated to make use of the method applied to the database in
order to build a conversion module that would enable us to set the energy sector. This conversion
module is the modeling tool for the energy sector and has to meet some specifications that we are
going to see later on. First of all, we need to specify what the conversion matrix consists in.
Energy sector analysis and modeling – From primary to final energy
43
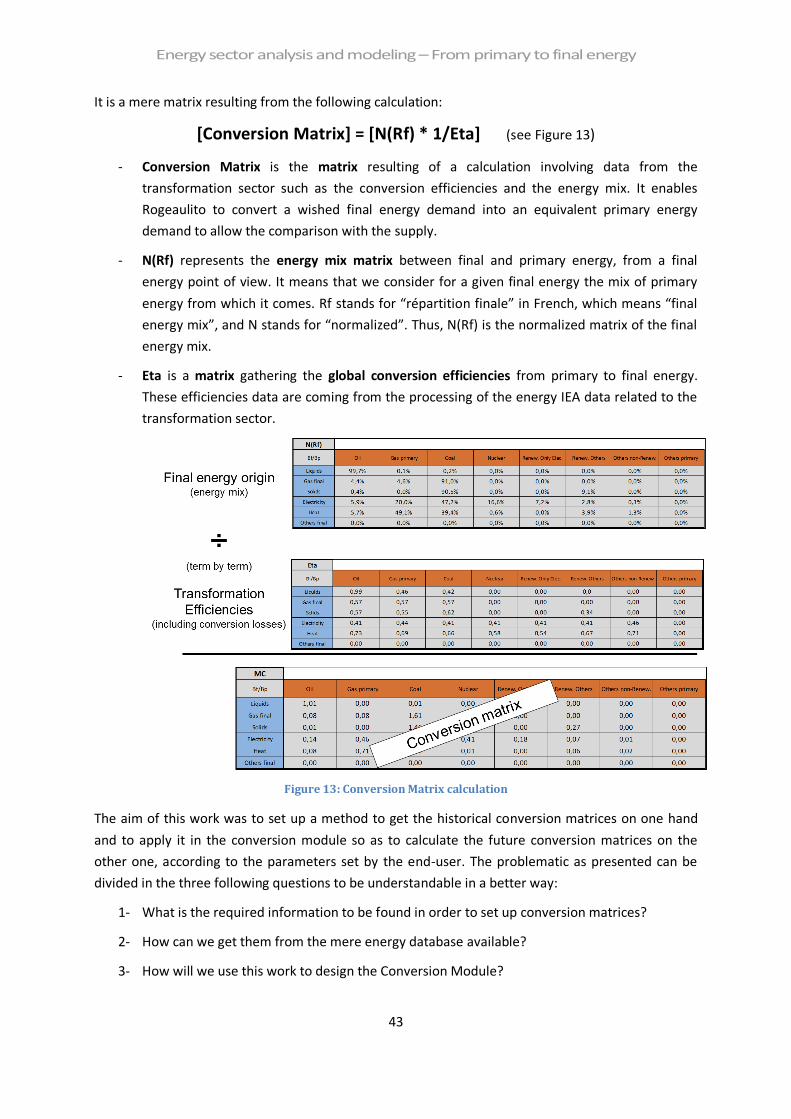
It is a mere matrix resulting from the following calculation:
[Conversion Matrix] = [N(Rf) * 1/Eta] (see Figure 13)
- Conversion Matrix is the matrix resulting of a calculation involving data from the
transformation sector such as the conversion efficiencies and the energy mix. It enables
Rogeaulito to convert a wished final energy demand into an equivalent primary energy
demand to allow the comparison with the supply.
- N(Rf) represents the energy mix matrix between final and primary energy, from a final
energy point of view. It means that we consider for a given final energy the mix of primary
energy from which it comes. Rf stands for “répartition finale” in French, which means “final
energy mix”, and N stands for “normalized”. Thus, N(Rf) is the normalized matrix of the final
energy mix.
- Eta is a matrix gathering the global conversion efficiencies from primary to final energy.
These efficiencies data are coming from the processing of the energy IEA data related to the
transformation sector.
Figure 13: Conversion Matrix calculation
The aim of this work was to set up a method to get the historical conversion matrices on one hand
and to apply it in the conversion module so as to calculate the future conversion matrices on the
other one, according to the parameters set by the end-user. The problematic as presented can be
divided in the three following questions to be understandable in a better way:
1- What is the required information to be found in order to set up conversion matrices?
2- How can we get them from the mere energy database available?
3- How will we use this work to design the Conversion Module?
Energy sector analysis and modeling – From primary to final energy
44
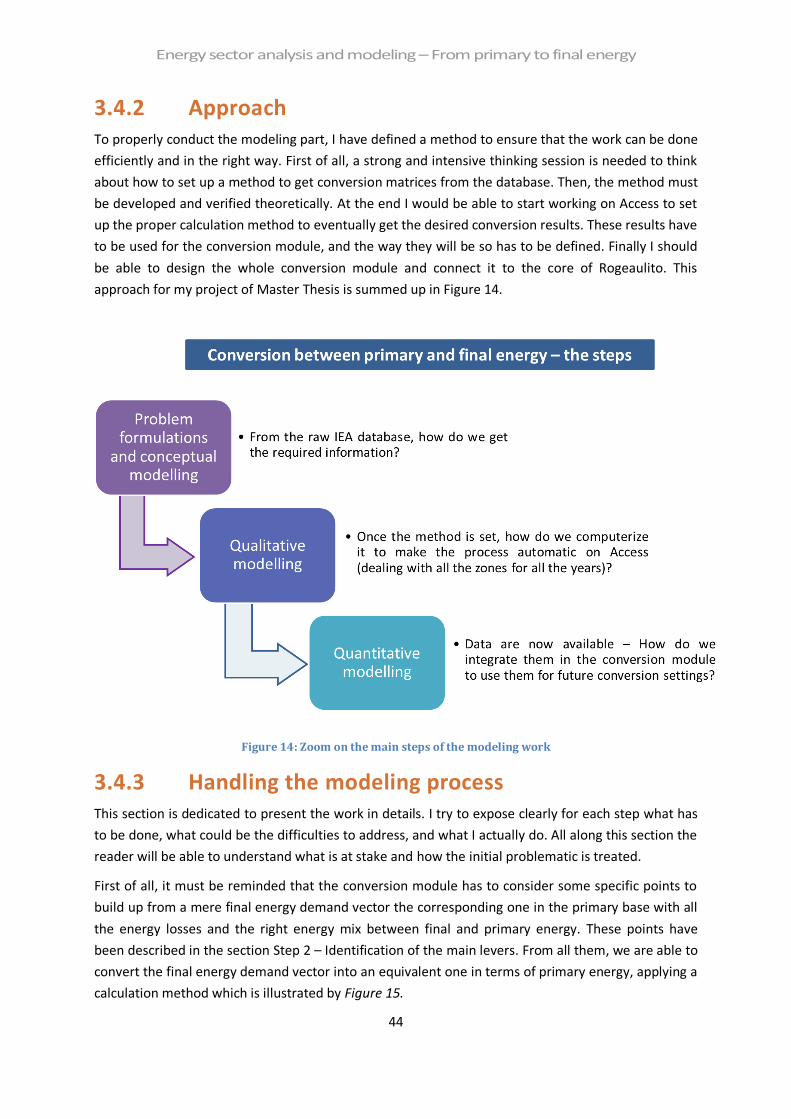
3.4.2 Approach To properly conduct the modeling part, I have defined a method to ensure that the work can be done
efficiently and in the right way. First of all, a strong and intensive thinking session is needed to think
about how to set up a method to get conversion matrices from the database. Then, the method must
be developed and verified theoretically. At the end I would be able to start working on Access to set
up the proper calculation method to eventually get the desired conversion results. These results have
to be used for the conversion module, and the way they will be so has to be defined. Finally I should
be able to design the whole conversion module and connect it to the core of Rogeaulito. This
approach for my project of Master Thesis is summed up in Figure 14.
Figure 14: Zoom on the main steps of the modeling work
3.4.3 Handling the modeling process This section is dedicated to present the work in details. I try to expose clearly for each step what has
to be done, what could be the difficulties to address, and what I actually do. All along this section the
reader will be able to understand what is at stake and how the initial problematic is treated.
First of all, it must be reminded that the conversion module has to consider some specific points to
build up from a mere final energy demand vector the corresponding one in the primary base with all
the energy losses and the right energy mix between final and primary energy. These points have
been described in the section Step 2 – Identification of the main levers. From all them, we are able to
convert the final energy demand vector into an equivalent one in terms of primary energy, applying a
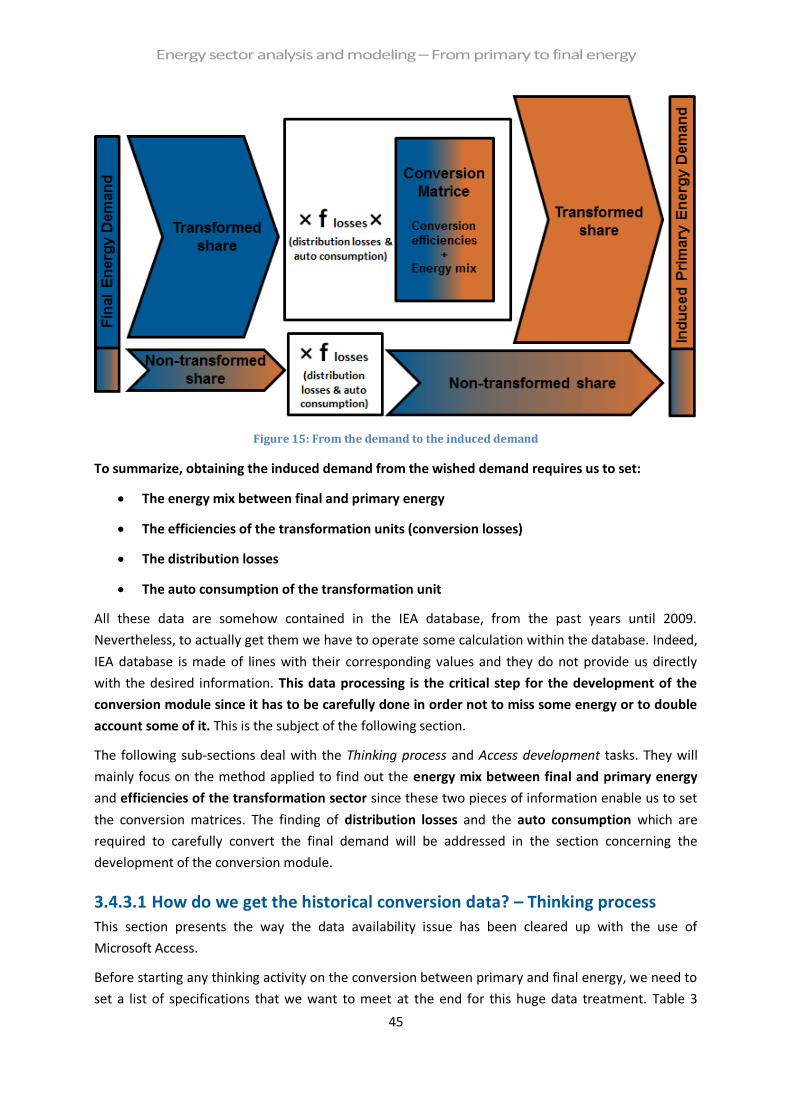
calculation method which is illustrated by Figure 15.
Energy sector analysis and modeling – From primary to final energy
45
Figure 15: From the demand to the induced demand
To summarize, obtaining the induced demand from the wished demand requires us to set:
The energy mix between final and primary energy
The efficiencies of the transformation units (conversion losses)
The distribution losses
The auto consumption of the transformation unit
All these data are somehow contained in the IEA database, from the past years until 2009.
Nevertheless, to actually get them we have to operate some calculation within the database. Indeed,
IEA database is made of lines with their corresponding values and they do not provide us directly
with the desired information. This data processing is the critical step for the development of the
conversion module since it has to be carefully done in order not to miss some energy or to double
account some of it. This is the subject of the following section.
The following sub-sections deal with the Thinking process and Access development tasks. They will
mainly focus on the method applied to find out the energy mix between final and primary energy
and efficiencies of the transformation sector since these two pieces of information enable us to set
the conversion matrices. The finding of distribution losses and the auto consumption which are
required to carefully convert the final demand will be addressed in the section concerning the
development of the conversion module.
3.4.3.1 How do we get the historical conversion data? – Thinking process
This section presents the way the data availability issue has been cleared up with the use of
Microsoft Access.
Before starting any thinking activity on the conversion between primary and final energy, we need to
set a list of specifications that we want to meet at the end for this huge data treatment. Table 3
Energy sector analysis and modeling – From primary to final energy
46
presents them and their purpose. One of the most important one is the ability of computerizing the
process we will set up to quickly generate the date we require.
Specifications Purpose
Set a method than can be computerized Handling the tremendous data of the IEA
database
Get the data for the whole time range
considered: 1990-2009
Get historical data to provide useful information
on the conversion sector
Table 3: Specifications table of the data treatment method we develop
Step 1 – The IEA Database
To properly address the problematic to which we are confronted, it is of great importance to
understand how the IEA database is built and what it contains. As we have said before, IEA database
is filled in with lines. For a given zone and year, a line is made of a flow, a product and an energetic
value (in Mtoe). To be able to identify easier the interactions between flows and products, we have
sorted out the lines in a matrix for a given year and a given zone as presented in Figure 16. A minus
value means that the product is consumed by the flow whereas a positive value means that the
product is actually produced by a flow. Each line of the matrix is isoenergetic, meaning that the
energy conservation is verified.
Figure 16: Example of IEA database sorted out in a matrix (in Mtoe)
Then it is interesting to imagine what this matrix actually represents. Figure 17 provides a visual
representation with the energy flows gathered in the previous matrix. We can notice that these flows
going from primary energy to the final one constitute energy pathways involving several energy
products passing through different flows. It implicitly means that each one of these pathways is
characterized by a given primary energy, an overall efficiency (which includes each specific efficiency)
and a given final energy.
Energy sector analysis and modeling – From primary to final energy
47
Figure 17: Energy pathways between primary and final
For instance, we can describe the following pathway from Figure 16 and Figure 17, presented in
Table 4:
Primary Energy
(Product 1) Flow 1
Intermediate
Product
(Product 2)
Flow 2 Final Energy
(Product 3)
Crude Oil Refinery Heavy Oil CHP plant Electricity
Table 4: Example of an energy pathway
On the Figure 18 we can draw this given pathway to clearly identify the values involved. Black arrows
correspond to energy flows while red ones highlight the losses. It is then possible to complete the
previous table with Table 5 gathering the efficiencies and the energy amounts.
Energy sector analysis and modeling – From primary to final energy
48
Figure 18: An energy pathway drawn in the matrix
This pathway presented as an example is a good scheme to keep in mind in order to understand the
whole process we are going to design to get the conversion data we have listed in the previous
section. It indeed highlights the specific points we are going to deal with such as pathways and
efficiencies.
Type of the
entity
Primary Energy
(Product 1) Flow 1
Intermediate
Product
(Product 2)
Flow 2 Final Energy
(Product 3)
What? Crude Oil Refinery Heavy Oil CHP plant Electricity
Specific value 8 Mtoe η = 94 % 7.5 Mtoe η = 47 % 3.5 Mtoe
Table 5: Specific values of a given energy pathway
Step 2 – Finding all the pathways
Now that we are used to the IEA database, we have to identify all the pathways existing within the
transformation sector lines to build up a global table such as presented with the Table 5. To
accomplish this critical task, we have to notice first that the global transformation sector, which can
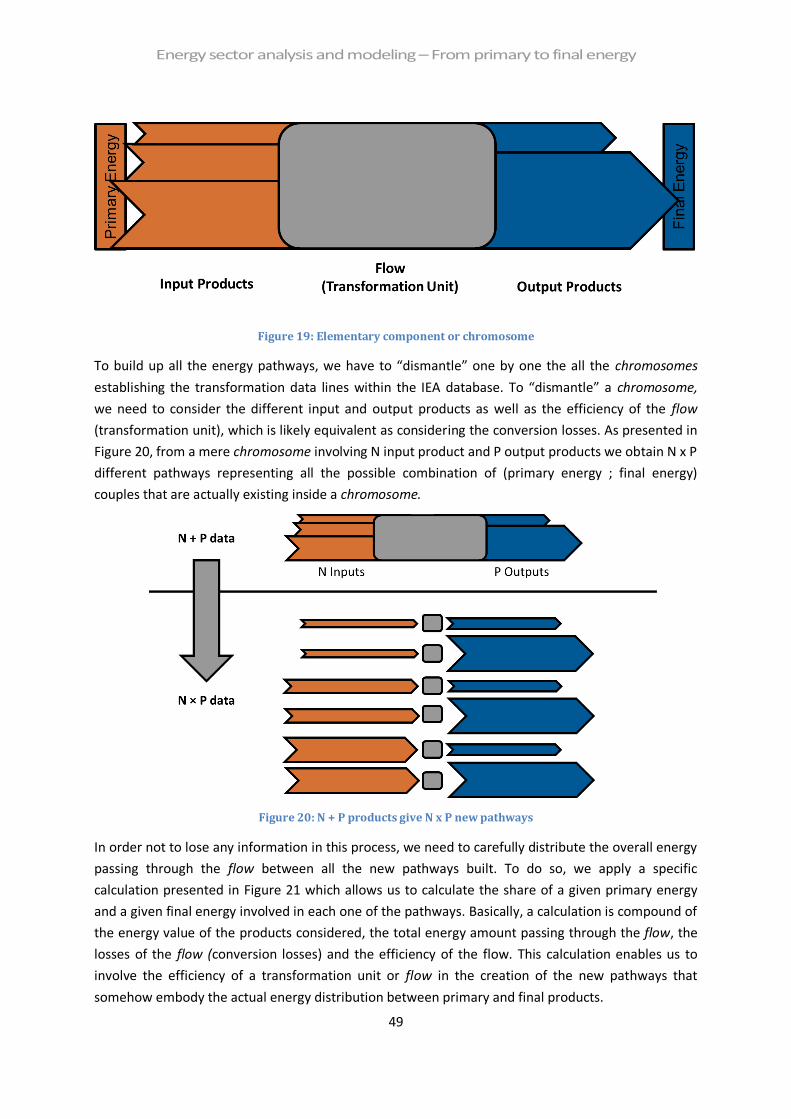
be illustrated by Figure 17 for instance, is made of elementary components that we are going to call
chromosome. Figure 19 presents a typical chromosome which is actually compound of primary
energy products going in a flow (transformation unit) which produces final energy products as
output. Sometimes the input or output of a given chromosome can be intermediate energy products
such as heavy oil which comes from crude oil and can be burnt to generate electricity (it is in
between primary and final energy, so intermediate).
Energy sector analysis and modeling – From primary to final energy
49
Figure 19: Elementary component or chromosome
To build up all the energy pathways, we have to “dismantle” one by one the all the chromosomes
establishing the transformation data lines within the IEA database. To “dismantle” a chromosome,
we need to consider the different input and output products as well as the efficiency of the flow
(transformation unit), which is likely equivalent as considering the conversion losses. As presented in
Figure 20, from a mere chromosome involving N input product and P output products we obtain N x P
different pathways representing all the possible combination of (primary energy ; final energy)
couples that are actually existing inside a chromosome.
Figure 20: N + P products give N x P new pathways
In order not to lose any information in this process, we need to carefully distribute the overall energy
passing through the flow between all the new pathways built. To do so, we apply a specific
calculation presented in Figure 21 which allows us to calculate the share of a given primary energy
and a given final energy involved in each one of the pathways. Basically, a calculation is compound of
the energy value of the products considered, the total energy amount passing through the flow, the
losses of the flow (conversion losses) and the efficiency of the flow. This calculation enables us to
involve the efficiency of a transformation unit or flow in the creation of the new pathways that
somehow embody the actual energy distribution between primary and final products.
Energy sector analysis and modeling – From primary to final energy
50
Figure 21: Calculation made to dismantle a chromosome (in Mtoe)
As it is easier to look at tables and diagrams to fully understand the process described before, Table 6
gathers the results of the dismantling of the chromosome presented in Figure 21, giving the value of
the primary and final shares of energy and the products involved in the pathways. These shares of
primary and final energy are called primary and final distribution, as stated before.
Table 6: Energy involved in the pathways resulting of the dismantling of the chromosome
The reader can notice that the efficiency of the flow treated inside this chromosome, Briquettes
Factory, is equal to 94% (Energy Output divided by Energy Input). This efficiency is applied in the
calculation of all the pathways and stands in the value calculated. The “efficiency information” is
therefore saved and constitutes a constant parameter of each new pathway. With this “dismantling”
process, we have passed from a “black box” version of the energy pathways between primary and
final energies to a transparent one giving us the corresponding amount of each type of energy going
through a given pathway. Thus, thanks to this process, we are now able to get for each flow
(transformation unit) the primary/final energy distribution as well as the efficiency of the flow
Energy sector analysis and modeling – From primary to final energy
51
considered. Doing that for all the flows present in the transformation sector, we are able to find
out all the energy pathways from primary to final energies with the corresponding efficiencies
applied through them.
Nevertheless, we have to consider that the chromosomes which are for each one of them
characterized by a given flow, must be treated according to where this flow stand in the overall
transformation sector. For instance, extracted oil is refined in a refinery first before going to a power
plant then. The idea to do so is to understand in which order the flows are sorted out inside the
transformation sectors. Therefore, we did this short work by studying the processes to finally come
to a map of the transformation sector. This map is coherent with what we can imagine at first about
the transformation sector, i.e. refineries, coal and gas factories stand upstream, with petrochemical
industries afterwards whereas power plants stand downstream, at the end of the transformation
sector.
It is now possible to build up all the ascendance between primary and final energy. Step by step, we
dismantle each chromosome to substitute it by new pathways that are going to be involved in the
dismantling of the next chromosomes (especially if the right side of the pathway is occupied by an
intermediate product.
This process must be computerized on Access to deal with all the data we have. This task is
presented in the following section.
3.4.3.2 Access development: computerizing the process
The purpose of computerizing the method described before is to deal with the tremendous amount
of transformation sector data from our IEA database. Indeed, our work done before is theoretically
feasible but would actually be so much time intensive that it does not worth it to do it by hand.
Moreover, the database is updated each year and one main feature of the Access computerizing
would be to run the whole process each year to get the last year data from the transformation
sector. Finally, the utilization of a database software such as Access to manage our valuable data
provides us safety and reliability.
The purpose of this section is not to explain deeply what is the code developed but more to clarify
the methodology used and the main data obtained eventually. The reader can find in the annexes
some views of the Access files processing the data. When it comes to talk about figures or examples,
it often deals with the world version of Rogeaulito, meaning that the data considered are the world’s
ones.
Here are the steps of the process listed chronologically, with the corresponding table for
illustration:
- 1st part: Finding the pathways – Table 7
- 2nd part: Projection on the bases Bp and Bf – Table 8
- 3rd part: Calculation of the efficiencies of the projected pathways – Figure 24
- 4th part: Calculation of the Conversion Matrix – Figure 25
Energy sector analysis and modeling – From primary to final energy
52
1st part – Finding the pathways
As explained in the previous section we need all the energy pathways between primary and final
energy to reveal the actual energy flows throughout the transformation sector. The dismantling of all
the chromosomes making the global transformation sector is the method applied. We used to call it
the “dominos method” since it consists in joining elementary pathways resulting of the dismantling
of a chromosome to build up the global pathways. Figure 22 shows that a global pathway can be
represented as a set of dominos putting next to the other.
Figure 22: A global pathway dominos’ chain
A single domino is the picture of an elementary pathway, i.e. a pathway resulting of the dismantling
of a given chromosome. Then, joining the elementary pathways when they match (same output for
the left pathway than the input for the right pathway), we create new pathways that are going to
lead us step by step to the final energy side. This process is figuratively presented by Figure 23 which
illustrates the principle of this “dominos method”.
Figure 23: Dominos method to get a global pathway
Let’s focus on the example we have seen before in Table 5:
Primary Energy - Crude Oil >> Refinery >> Heavy Oil >> Power Plant >> Electricity - Final Energy
Energy sector analysis and modeling – From primary to final energy
53
This constitutes a global pathway coming from the dismantling of two chromosomes, the first one
around refinery, and the second one around power plant. From the whole process run on Access, we
finally get about 13 000 global pathways for 2009 and the world’s data for instance. Most of these
pathways are not relevant since they actually represent residual energy flows which appeared to
balance the overall process. Thus, we filter these insignificant pathways to keep the meaningful ones.
Therefore, we finally get less than 500 hundred global pathways for 2009. These pathways are sorted
out in a table such as Table 7 which gives an idea of what we can find in it:
- The primary energy
- The final energy
- The path, i.e. the list of the flows (transformation unit) crossed by the pathway
- The primary distribution, i.e. the amount of the primary energy considered going to the final
energy considered (destination side)
- The final distribution, i.e. the amount of the final energy considered coming from the
primary energy considered (origin side).
Primary Energy Final Energy Path
Primary
Distribution
(in Mtoe)
Final
Distribution
(in Mtoe)
Crude Oil Electricity Refinery >>
Power plant 8.0 3.5
Lignite Briquettes Briquettes
factory 3.80 3.57
…
Table 7: Example of a table gathering global pathways (from Access)
2nd part – Projection of the pathways
We have to project IEA products on the bases Bp and Bf that we have set, according to the
correspondence specified page 37 in the section The bases and the projection. For example, Table 7
becomes Table 8 where the products are substituted by their corresponding one in the projection
bases.
Energy sector analysis and modeling – From primary to final energy
54
Primary Energy
in Bp
Final Energy in
Bf Path
Primary
Distribution
(in Mtoe)
Final
Distribution
(in Mtoe)
Oil Electricity Refinery >>
Power plant 8.0 3.5
Coal Solids Briquettes
factory 3.80 3.57
…
Table 8: Global pathways after projection of the products on Bp and Bf
Once we have projected all the global pathways, we can sum the ones involving the same primary
and final energies. This aggregation is necessary to pass from 500 hundred pathways to 7 x 5 = 35
pathways that actually constitute the size of the conversion matrix we are going to calculate. Putting
the value projected in matrices for the primary distribution and the final distribution gives us the [Rf]
and [Rp] matrices that the reader can observe in Figure 24.
3rd part – Calculation of [Eta]
We are now able to calculate the global efficiency of all the projected and aggregated pathways,
performing a division term by term of the final distribution matrix and the primary distribution
matrix. It eventually gives us the [Eta] matrix. This calculation is presented in Figure 24.
Figure 24: Calculation of the [Eta] matrix
As you can notice, the efficiencies obtained are realistic. Nevertheless, some of them can look a bit
strange to you, such as Nuclear for instance. Nuclear power plant efficiency is known to have an
efficiency of about 33%. In our [Eta] matrix, we have 41%. This is mainly due to the fact that IEA does
Rf Bf\Bp Oil Gas primary Coal Nuclear Renew. only Elec. Renew. Others Others non-Renew.
Energy sector analysis and modeling – From primary to final energy
56
a ratio of the total final energy consumption. Then, we can set factors taking into account both of
these losses by which we multiply the final demand vector set in the demand module to enlarge
correctly. Figure 26 illustrates the factors found for the world in 2009. The share of losses is directly
readable, with for example 10% of auto consumption and 10% of losses for the electricity, at world
scale.
Figure 26: Auto consumption and distribution losses, as shares of the final energy consumption
Referring to what we wanted to establish at the beginning of this section 3.4.3, we have meet our
needs since we have obtained:
The conversion matrices, involving the conversion efficiencies and the primary/final energy
mix
The losses factor integrating the auto consumption of the transformation units and the
distribution losses for each type of final energy.
All the historical data are now established, and we are going to make use of them to develop the
conversion module in which the end-user has to set these data for the future years.
3.4.4 Summary and perspectives From our system approach analysis completed with a computerized process of the IEA database, we
have isolated and obtained the historical data characterizing the energy sector worldwide. The work
that has been done enable us to address several issues and to provide us with the sufficient
knowledge for the future task of designing energy scenarios. Among many, this study helps with:
- The global understanding of the energy sector and the awareness of what matters. This work
is very precious to give perspectives on energy scenarios work since it has revealed levers of
action within the energy sector to find out possible variant of energy stories. Literature can
complete this knowledge and provides ideas for working on the conversion part of
Rogeaulito.
- The design of the conversion module of Rogeaulito and the feeding with historical data.
Figure 27 is one of the main results that can be obtained from this Master Thesis. From the raw IEA
database, the setting up of the pathways, i.e. energy mix, the calculation of all the different flows
such as losses and the projection of these different data on the bases used as referential, we are able
to represent a simplified vision of the world energy sector. This figure gives interesting information
and can represent a relevant tool to identify what can be done within the energy sector according to
the primary resources available and the desired energy demand.
Bf Liquids Gas final Solids Electricity Heat Others final
Auto Consumption 6,18% 18,61% 5,18% 10,10% 12,67% 0,00%
Distribution Losses 0,13% 1,39% 0,10% 10,07% 7,86% 0,00%
Total (factor) 1,06 1,20 1,05 1,20 1,21 1,00
Energy sector analysis and modeling – From primary to final energy
57
Figure 27: Sankey diagram of the world energy sector
Energy sector analysis and modeling – From primary to final energy
58
To conclude on this graph, we will retain three main pieces of information it provides:
- Electricity demand is high but implies in the same time the greatest losses in the energy
sector. These losses are by far due to the conversion processes, and these ones could be
harnessed within CHP plants to produce heat. The lever on the distribution losses remains
small.
- Mobility needs (liquids fuel) is currently highly dependent on oil. The close occurrence of
peak oil and the will of developing countries to have access to car might result in a strong
transportation crisis soon if no action are undertaken to diversify the mobility sources of
energy or the global transportation system. Electric vehicles, carpooling or even car sharing
are possible solutions that can be investigated to decrease this oil reliance.
- Increase investments in the renewable electricity generation sector and the biomass
transformation would supply much more low emissions energy and decrease the fossil fuel
penetration in our current energy system. Methanization process that would directly inject
natural gas within the city network and wood heating in isolated area are interesting
possibilities that deserve some attention.
3.5 Step 4 – Integration in Rogeaulito and first outcomes As mentioned previously in this report, we want to capitalize on the work done about the energy
sector to provide Rogeaulito with a conversion module gathering historical data from the energy
sector and enabling the user to set the future ones he wishes for his scenario.
3.5.1 Designing the Conversion Module This section is dedicated to present the way the conversion module has been developed. We will
specify the objectives to reach for the conversion modules in terms of settings, running process and
user friendly feature.
3.5.1.1 Conversion module specifications
How to design a user friendly interface, integrating the work we have made and coping with the
limitations we can meet? This is the main question raised when we started to think about it.
Eventually, the purpose of the conversion module is to provide Rogeaulito with the conversion
matrices and the losses factors for all the future years considered, from 2010 to 2100. To do so, it has
been decided to set them for the years 2030, 2050 and 2100 in the conversion module and to
interpolate the missing data in between these milestone years. This approach avoids the end-user to
spend too much time thinking on the year-after-year evolution whereas it does not have so much
influence on the final data set.
Figure 28 gathers the specifications which have to be fulfilled in order to make the conversion
module able to calculate the conversion matrices and the losses factors.
Energy sector analysis and modeling – From primary to final energy
59
Figure 28: Conversion module specifications - What is to be set?
The Rogeaulito development is performed on Microsoft Excel so we use an Excel file to develop the
conversion module.
Considering ergonomic issue, each one of the settings previously introduced has to be a tab. Then,
we are going to have four tabs in the module plus a tab performing the calculation of the conversion
matrices, plus a tab gathering the data to be exported to Rogeaulito core.
The setting of the efficiencies is one of the main features. The end-user can set them one by one for
all the milestone years, i.e. 2030, 2050 and 2100. Then, the non-transformed shares of primary
energy have to be assigned. They indeed correspond to the amount of primary energy which is
directly used as final energy, such as natural gas. They don’t involve any transformation process; this
is why their corresponding conversion efficiencies can be set to 1. Thus this is of main importance to
consider how much primary energy is not transformed as its efficiency of 1 has a huge influence on
the overall efficiencies calculated in [Eta]. Both efficiencies set and share of non-transformed primary
energy are exported afterwards to Access and are used in the new pathways calculation, introduced
in Figure 21, to get the new [Eta] matrices. These matrices are exported back to the Excel file. This
export/import process to access will be explained later on. The end-user set the energy mix, i.e. the
primary origin of the final energy, for all the milestone years. This set the [N(Rf)] matrices. Coupling
[N(Rf)] with the calculated [Eta], we get the conversion matrices. The user finally set the auto
consumption and distribution losses shares which are exported with the conversion matrices, for the
three milestone years, to Rogeaulito core.
3.5.1.2 Conversion module presentation
In Figure 29 is presented a short overview of the way the current version of the conversion module
works. For more details, we would recommend the reader to have a look at the Figure 43: Induced
demand calculated from the demand and the conversion settings
Energy sector analysis and modeling – From primary to final energy
60
Annex 5 – Spotlights on the conversion module of this report.
Figure 29: The conversion module – Running process
3.5.2 Review and critics Two main critics have been identified throughout this work. First of all, the reliance on IEA database,
that can be considered more as a constrain even though it provides safety and reliability, forces TSP
to carefully observe and analyze the convention and the choices made by the agency. Secondly, the
main conversion module specification that required enabling the setting of the transformation unit
efficiencies commits us to run Access each time we change them. Improve this step is one of the
future needs identified.
Energy sector analysis and modeling – From primary to final energy
61
4. Conclusion
4.1. Benefit for Rogeaulito Running Rogeaulito consists in connecting the three modules to Rogeaulito to import the demand
vector, the supply vector, and the conversion data that makes the comparison between the demand
and the supply possible. The first output coming from this project is presented in Figure 30, and is
one of the first Missing Energy Supply graph realized by the team. The MES by primary energy is
displayed in clear color whereas the actual supply is shown in dark color. We can notice that a
significant gap in terms of energy supply occurs around 2050 and this gap is mainly due to the oil
shortage first, and then is completing by some missing gas supply by the end of the century.
Figure 30: Missing Energy Supply graph
The main supply hypothesis used for this presented graphs are written in the legend and comes from
an adaptation of IEA data (IEA, World Energy Outlook 2011, 2011).
As supply and demand are not correlated, it might happen that in some case, the supply overpasses
the demand. Looking at the graph presented in Figure 31, we can notice that for this given supply
scenario, coal production is far more important than the actual demand. On the other hand, we have
seen that a clear lake of oil was likely to occur in the middle of the century.
Energy sector analysis and modeling – From primary to final energy
62
Figure 31: Extra primary energy supply
What can be done? Here comes the conversion module provided with the model of the energy
sector. What we can easily change thanks to the model is to allocate this extra coal supplied to
liquid fuel production in order to reduce significantly the oil missing supply. To do so, the energy
mix of liquids final energy is increase at the coal level as displayed in Figure 32, slightly passing from
0% in 2009, to 50% in 2050 and finally 80% in 2100.
Figure 32: Switching liquid fuels mix from oil to coal via CTL
This exploratory scenario is actually feasible thanks to the CTL technology and the extra coal
production coming from our supply scenario. The new MES graph resulting from this variation is
presented in Figure 33. We managed to solve oil issue since no oil is missing anymore. Nevertheless,
we have generated a new type of missing energy supply for coal. This coal MES is mainly due to:
- The weak current efficiency of CTL plants, 0.42 (IEA, 2011) compared to almost 1 for oil
refineries. It means that for 10 Gtoe of primary oil substituted, we need about 24 Gtoe of
primary coal.
- The tremendous amount of liquid fuels missing, due to the high demand for transportation
(in the demand scenario considered here).
Energy sector analysis and modeling – From primary to final energy
63
Figure 33: New MES after coal reallocation to liquid fuels production
From here, we could start an iterative procedure that makes the singularity of Rogeaulito. Either we
go back to the supply design to allocate more coal resources (which are estimated to be great
worldwide, until 21,200 Gtce (IEA, World Energy Outlook 2011, 2011)) or we explore some variants
on the demand side to reduce the liquids demand, or we improve CTL plants efficiency, or we
allocate more biomass to liquid production, or all of these possibilities together. If the result is not
satisfying after this step, the user can go for another iteration and so on until he reaches what he
wants. All the steps he has followed constitute the transparency feature of Rogeaulito. The user
understands what he does and where he can adjust cursors to solve a given observation, and so does
his audience.
The benefits of having developed a full conversion module for Rogeaulito from the model built, using
the work performed on the analysis of the energy sector, are considerable. It enables the user to
study a various range of possible scenarios variant and gives the opportunity to play with the
actual levers that are likely to heavily reshape the energy sector, either with the energy mix or the
different losses, or both.
4.2. Narratives In addition of a complete conversion module, the highly detailed supply and demand modules allow
even more narratives to be explored by adjusting assumptions and studying their final impact in
terms of Missing Energy Supply. Rogeaulito has this pedagogical feature to clearly display the
hypothesis made for the scenarios and to represent them in physical terms. This level of details and
these opportunities to play at every stage requires the user to be wise while playing. It is indeed
possible to design incoherent supply, demand and conversion scenarios that are going to give
astonishing results for sure. Nevertheless, the way Rogeaulito is designed promotes iterative
procedure to reach even more relevant scenarios, and this is typically why it was made for. Some
examples of stories we are willing to study more deeply are presented below. They all involved the
Energy sector analysis and modeling – From primary to final energy
64
conversion module and reveal why the analysis work performed on the energy sector is so valuable
for the energy scenarios work.
What if … oil depletion leads to a choice to make between diesel for vehicles and jet fuels for
aviation?
According to the interesting article published by (Nygren, Aleklett, & Höök, 2009), Aviation fuel and
future oil production scenarios, TSP plans to adapt this study in Rogeaulito and creates some variant
scenarios on the topic. As the refined oil fraction corresponding to diesel and kerosene is the same,
the upcoming limits in oil production will lead to a tradeoff to make for the allocation of this share.
Depending on what is driving the choice, i.e. purchase power, political requisition and so on, the
decision is not going to be the same and will result in different outcomes in terms of GHGs emissions
and vehicles development.
What if … we allocate coal and gas to the production of liquid fuels to offset the oil shortage?
CTL & GTL processes are currently known to represent possible future alternatives to fuel the
transportation sector. Non-conventional resources which are now evaluated to be as great as
conventional ones (IEA, World Energy Outlook 2011, 2011), 400 tcm, could lead to such occurrence.
The same can be said for coal whose reserves are still high. Even though these solutions come in
force, the CO2 issue could then get worse.
What if … we develop massively Carbon Capture and Storage technologies?
The high amount of coal still available worldwide raises the Climate Change issue. Within a scenario
of coal-to-electricity or/and coal-to-liquid, the need to use CCS would more than ever be the priority.
The way Rogeaulito is built enables to investigate such a question in terms of the impact of CCS on
power plant efficiencies, CO2 emissions and CAPEX. For instance, according to François Giger (EDF,
2011), CCS deployment could decrease by 10 points the efficiency of a power plant, with an evolution
to 5 points in the best possible future. On the CAPEX, the extra cost involved is about 50 to 100 % of
the cost without CCS. These kind of assumptions can be used in Rogeaulito to study the evolution of
the Missing Energy Supply while keeping an eye on the emissions and the investments required.
4.3. Future perspectives Alongside the development of Rogeaulito, some extra modules have been added, such as a GHGs
emission module to calculate the emissions of a scenario, or a CAPEX module to gather the
investment related to the hypothesis set in the demand, supply and conversion sides.
Rogeaulito now exists under its beta world version and is subject to a continuous improvement. It
just asks for experts, specialists and interested persons to work on and provides interesting study
based on scientific expertise and needs some peer reviews to be legitimated. To do so, some
Rogeaulito workshops have already be planned to share its specific features and make people wiser
about energy scenario thinking, while gathering information and interesting feedbacks to improve it.
Many energy specialists and corporate executives have been invited to join. We really hope that the
work performed both on analysis and modeling sides will benefit to Rogeaulito and lead him to a
sufficient recognition. It has indeed been designed for many purposes such as investigate some
Energy sector analysis and modeling – From primary to final energy
65
energy policies, going through breakthrough scenarios or helping in decision making processes. It is
therefore anything but a coincidence that we are used to defining him as the tool dedicated to
apply transparent energy scenario thinking.
Energy sector analysis and modeling – From primary to final energy
66
Energy sector analysis and modeling – From primary to final energy
67
Bibliography Benichou, L. (2011). Future Energy Supply, Simulations with Limited Resources. Stockholm: KTH.
Churchman, C. W. (1984 (revised)). The systems approach. Dell Pub Co.
EDF. (2011). Débat BIP/ENERPRESSE - Captage et Stockage du CO2, le point sur la démarche
Française.
Hajjar, J. (2012). Energy system modeling, supply/demand comparison and reduction of greenhouse
gases emissions scenarios. Stockholm: KTH.
IEA. (2009). Electricity/Heat in France in 2009. Retrieved 2012, from IEA.org:
1 134j01/03/201229/08/2011Demand module development
2 15j23/09/201105/09/2011Supply module development part 1: fossil
fuels
4 133j29/02/201229/08/2011Conversion between primary and final
energy
5 5j02/09/201129/08/2011Get used to the project
6 37j25/10/201105/09/2011Thinking process
7 38j16/12/201126/10/2011Access development
8 20j13/01/201219/12/2011Development of the conversion module
11j30/01/201216/01/2012Connection to Rogeaulito and Optimization
11 120j29/02/201215/09/2011Documents writing
10
9
27j29/02/201224/01/2012First playing sessions with Rogeaulito
3 34j05/04/201220/02/2012Supply module development part 2:
nuclear and renewables
This Gantt diagram presents the time schedule for the Rogeaulito project while I was carrying out my Master Thesis. The blue squares highlight the part
dedicated to my master thesis. The module demand was previously developed during fall and summer 2011 (orange). The conversion module has been
developed in September 2011 and during spring 2012. I’ve partially developed the supply module in the beginning of my work at TSP (purple) to get used to
some energy concerns that must help for the upcoming tasks. The rest of the supply module focused on nuclear and renewables has been developed by