57
ENERGY STATISTICS OF OECD COUNTRIES: BEYOND 2020 DOCUMENTATION (2011 edition) - 1 INTERNATIONAL ENERGY AGENCY ENERGY STATISTICS OF OECD COUNTRIES DOCUMENTATION FOR BEYOND 2020 FILES
| Date post: | 08-May-2018 |
| Category: |
Documents |
| Upload: | nguyennguyet |
| View: | 214 times |
| Download: | 0 times |

ENERGY STATISTICS OF OECD COUNTRIES: BEYOND 2020 DOCUMENTATION (2011 edition) - 1
INTERNATIONAL ENERGY AGENCY
ENERGY STATISTICS OF OECD COUNTRIES
DOCUMENTATION FOR BEYOND 2020 FILES


ENERGY STATISTICS OF OECD COUNTRIES: BEYOND 2020 DOCUMENTATION (2011 edition) - 3
INTERNATIONAL ENERGY AGENCY
TABLE OF CONTENTS
1. Changes from last edition ........................................................................................... 5
2. Flow definitions ........................................................................................................... 7
3. Product definitions .................................................................................................... 19
4. Geographical coverage ............................................................................................. 31
5. Country notes ............................................................................................................ 35
6. Abbreviations ............................................................................................................ 57

ENERGY STATISTICS OF OECD COUNTRIES: BEYOND 2020 DOCUMENTATION (2011 edition) - 5
INTERNATIONAL ENERGY AGENCY
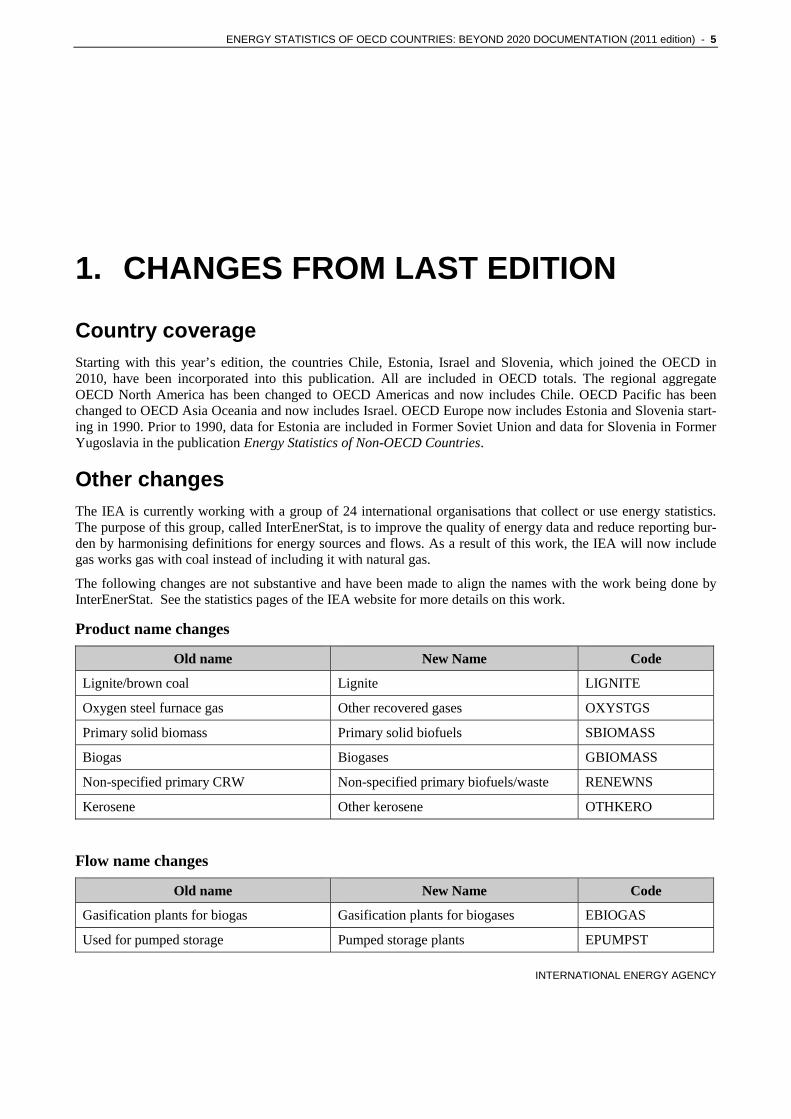
1. CHANGES FROM LAST EDITION
Country coverage Starting with this year’s edition, the countries Chile, Estonia, Israel and Slovenia, which joined the OECD in 2010, have been incorporated into this publication. All are included in OECD totals. The regional aggregate OECD North America has been changed to OECD Americas and now includes Chile. OECD Pacific has been changed to OECD Asia Oceania and now includes Israel. OECD Europe now includes Estonia and Slovenia start-ing in 1990. Prior to 1990, data for Estonia are included in Former Soviet Union and data for Slovenia in Former Yugoslavia in the publication Energy Statistics of Non-OECD Countries.
Other changes The IEA is currently working with a group of 24 international organisations that collect or use energy statistics. The purpose of this group, called InterEnerStat, is to improve the quality of energy data and reduce reporting bur-den by harmonising definitions for energy sources and flows. As a result of this work, the IEA will now include gas works gas with coal instead of including it with natural gas.
The following changes are not substantive and have been made to align the names with the work being done by InterEnerStat. See the statistics pages of the IEA website for more details on this work.
Product name changes
Old name New Name Code
Lignite/brown coal Lignite LIGNITE
Oxygen steel furnace gas Other recovered gases OXYSTGS
Primary solid biomass Primary solid biofuels SBIOMASS
Biogas Biogases GBIOMASS
Non-specified primary CRW Non-specified primary biofuels/waste RENEWNS
Kerosene Other kerosene OTHKERO
Flow name changes
Old name New Name Code
Gasification plants for biogas Gasification plants for biogases EBIOGAS
Used for pumped storage Pumped storage plants EPUMPST


ENERGY STATISTICS OF OECD COUNTRIES: BEYOND 2020 DOCUMENTATION (2011 edition) - 7
INTERNATIONAL ENERGY AGENCY
2. FLOW DEFINITIONS
Supply Flow Short name Definition
Production INDPROD Refers to the quantities of fuels extracted or produced, calculated after any operation for removal of inert matter or impurities (e.g. sulphur from natural gas). For “other hydrocarbons” (shown with crude oil), production should include synthetic crude oil (including mineral oil extracted from bituminous minerals such as oil shale and tar sands, etc.). Production of secondary oil products represents the gross refin-ery output. Secondary coal products (including coal gases) represent the output from coke ovens, gas works, blast furnaces and other trans-formation processes.
From other sources – coal
OSCOAL Refers to both primary energy that has not been accounted for under production and secondary energy that has been accounted for in the production of another fuel. For example, under primary coal: recov-ered slurries, middlings, recuperated coal dust and other low-grade coal products that cannot be classified according to type of coal from which they are obtained; under gas works Natural Gas: natural gas, refinery gas, and LPG, that are treated or mixed in gas works (i.e. gas works gas produced from sources other than coal).
From other sources - natural gas
OSNATGAS Refers to both primary energy that has not been accounted for under production and secondary energy that has been accounted for in the production of another fuel.
From other sources - oil products
OSOIL Refers to both primary energy that has not been accounted for under production and secondary energy that has been accounted for in the production of another fuel. For example, under additives: benzol, al-cohol and methanol produced from natural gas; under refinery feedstocks: backflows from the petrochemical industry used as refin-ery feedstocks; under “other hydrocarbons” (included with crude oil): liquids obtained from coal liquefaction and GTL plants.
From other sources - renewables
OSRENEW Refers to both primary energy that has not been accounted for under production and secondary energy that has been accounted for in the production of another fuel.

8 - ENERGY STATISTICS OF OECD COUNTRIES: BEYOND 2020 DOCUMENTATION (2011 edition)
INTERNATIONAL ENERGY AGENCY
Supply Flow Short name Definition
From other sources - non-specified
OSNONSPEC Refers to both primary energy that has not been accounted for under production and secondary energy that has been accounted for in the production of another fuel. This flow is used if the source is not known.
Imports IMPORTS Comprises amounts having crossed the national territorial boundaries of the country whether or not customs clearance has taken place. For coal: Imports comprise the amount of fuels obtained from other countries, whether or not there is an economic or customs union be-tween the relevant countries. Coal in transit should not be included.
For oil and Natural Gas: Quantities of crude oil and oil products im-ported under processing agreements (i.e. refining on account) are included. Quantities of oil in transit are excluded. Crude oil, NGL and natural gas are reported as coming from the country of origin; refinery feedstocks and oil products are reported as coming from the country of last consignment.
For electricity: Amounts are considered as imported when they have crossed the national territorial boundaries of the country. If electricity is “wheeled” or transited through a country, the amount is shown as both an import and an export.
Exports EXPORTS Comprises amounts having crossed the national territorial boundaries of the country whether or not customs clearance has taken place. For coal: Exports comprise the amount of fuels supplied to other countries, whether or not there is an economic or customs union be-tween the relevant countries. Coal in transit should not be included.
For oil and Natural Gas: Quantities of crude oil and oil products ex-ported under processing agreements (i.e. refining on account) are included. Re-exports of oil imported for processing within bonded ar-eas are shown as an export of product from the processing country to the final destination.
For electricity: Amounts are considered as exported when they have crossed the national territorial boundaries of the country. If electricity is “wheeled” or transited through a country, the amount is shown as both an import and an export.
International marine bunkers
MARBUNK Covers those quantities delivered to ships of all flags that are engaged in international navigation. The international navigation may take place at sea, on inland lakes and waterways, and in coastal waters. Consumption by ships engaged in domestic navigation is excluded. The domestic/international split is determined on the basis of port of departure and port of arrival, and not by the flag or nationality of the ship. Consumption by fishing vessels and by military forces is also excluded. See definitions of transport, fishing, and other non-specified.

ENERGY STATISTICS OF OECD COUNTRIES: BEYOND 2020 DOCUMENTATION (2011 edition) - 9
INTERNATIONAL ENERGY AGENCY
Supply Flow Short name Definition
International aviation bunkers
AVBUNK Includes deliveries of aviation fuels to aircraft for international avia-tion. Fuels used by airlines for their road vehicles are excluded. The domestic/international split should be determined on the basis of de-parture and landing locations and not by the nationality of the airline. For many countries this incorrectly excludes fuel used by domesti-cally owned carriers for their international departures.
Stock changes STOCKCHA Reflects the difference between opening stock levels on the first day of the year and closing levels on the last day of the year of stocks on national territory held by producers, importers, energy transformation industries and large consumers. Oil and gas stock changes in pipelines are not taken into account. With the exception of large users men-tioned above, changes in final users' stocks are not taken into account. A stock build is shown as a negative number, and a stock draw as a positive number.
Domestic supply DOMSUP Defined as production + from other sources + imports - exports - international marine bunkers - international aviation bunkers ± stock changes.
Transfers TRANSFER Comprises interproduct transfers, products transferred and recycled products.
Interproduct transfers results from reclassification of products either because their specification has changed or because they are blended into another product, e.g. kerosene may be reclassified as gasoil after blending with the latter in order to meet its winter diesel specification. The net balance of interproduct transfers is zero.
Products transferred is intended for oil products imported for further processing in refineries. For example, fuel oil imported for upgrading in a refinery is transferred to the feedstocks category.
Recycled products are finished products which pass a second time through the marketing network, after having been once delivered to final consumers (e.g. used lubricants which are reprocessed).
Statistical differences
STATDIFF Defined as deliveries to final consumption + use for transformation processes and consumption by energy industry own use + losses - domestic supply - transfers. Statistical differences arise because the data for the individual components of supply are often derived from different data sources by the national administration. Furthermore, the inclusion of changes in some large consumers' stocks in the supply part of the balance introduces distortions which also contribute to the statistical differences.
10 - ENERGY STATISTICS OF OECD COUNTRIES: BEYOND 2020 DOCUMENTATION (2011 edition)
INTERNATIONAL ENERGY AGENCY
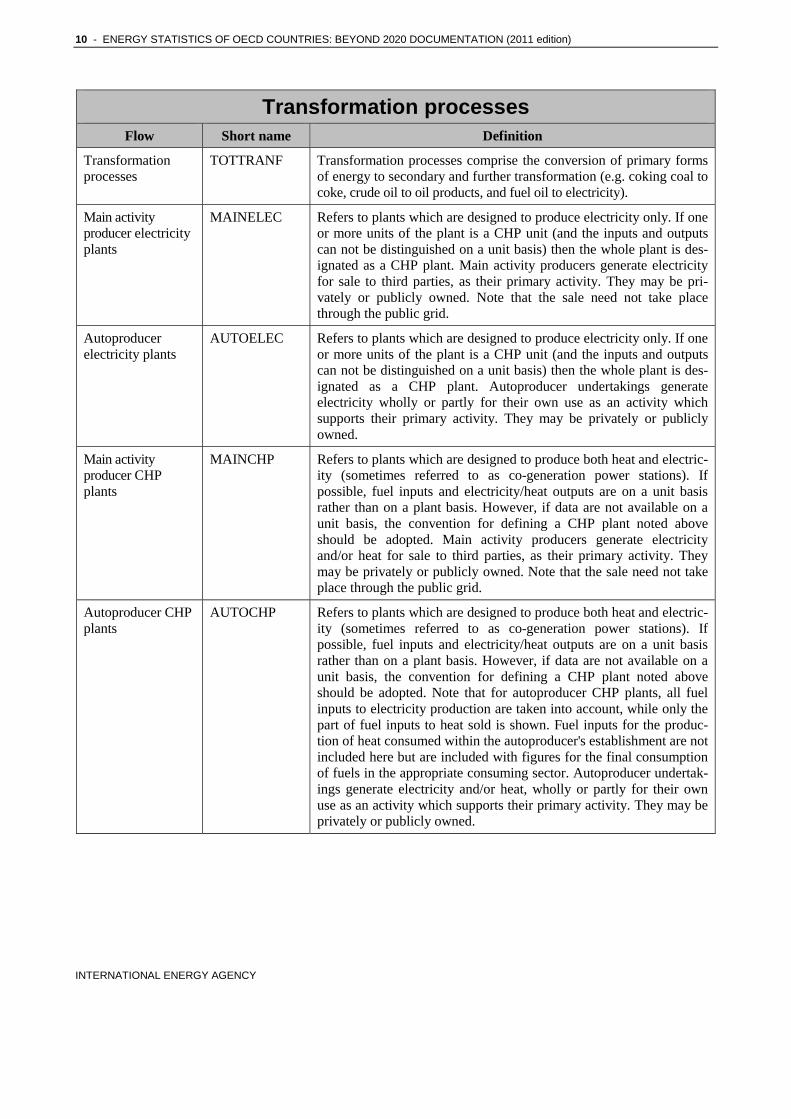
Transformation processes Flow Short name Definition
Transformation processes
TOTTRANF Transformation processes comprise the conversion of primary forms of energy to secondary and further transformation (e.g. coking coal to coke, crude oil to oil products, and fuel oil to electricity).
Main activity producer electricity plants
MAINELEC Refers to plants which are designed to produce electricity only. If one or more units of the plant is a CHP unit (and the inputs and outputs can not be distinguished on a unit basis) then the whole plant is des-ignated as a CHP plant. Main activity producers generate electricity for sale to third parties, as their primary activity. They may be pri-vately or publicly owned. Note that the sale need not take place through the public grid.
Autoproducer electricity plants
AUTOELEC Refers to plants which are designed to produce electricity only. If one or more units of the plant is a CHP unit (and the inputs and outputs can not be distinguished on a unit basis) then the whole plant is des-ignated as a CHP plant. Autoproducer undertakings generate electricity wholly or partly for their own use as an activity which supports their primary activity. They may be privately or publicly owned.
Main activity producer CHP plants
MAINCHP Refers to plants which are designed to produce both heat and electric-ity (sometimes referred to as co-generation power stations). If possible, fuel inputs and electricity/heat outputs are on a unit basis rather than on a plant basis. However, if data are not available on a unit basis, the convention for defining a CHP plant noted above should be adopted. Main activity producers generate electricity and/or heat for sale to third parties, as their primary activity. They may be privately or publicly owned. Note that the sale need not take place through the public grid.
Autoproducer CHP plants
AUTOCHP Refers to plants which are designed to produce both heat and electric-ity (sometimes referred to as co-generation power stations). If possible, fuel inputs and electricity/heat outputs are on a unit basis rather than on a plant basis. However, if data are not available on a unit basis, the convention for defining a CHP plant noted above should be adopted. Note that for autoproducer CHP plants, all fuel inputs to electricity production are taken into account, while only the part of fuel inputs to heat sold is shown. Fuel inputs for the produc-tion of heat consumed within the autoproducer's establishment are not included here but are included with figures for the final consumption of fuels in the appropriate consuming sector. Autoproducer undertak-ings generate electricity and/or heat, wholly or partly for their own use as an activity which supports their primary activity. They may be privately or publicly owned.
ENERGY STATISTICS OF OECD COUNTRIES: BEYOND 2020 DOCUMENTATION (2011 edition) - 11
INTERNATIONAL ENERGY AGENCY
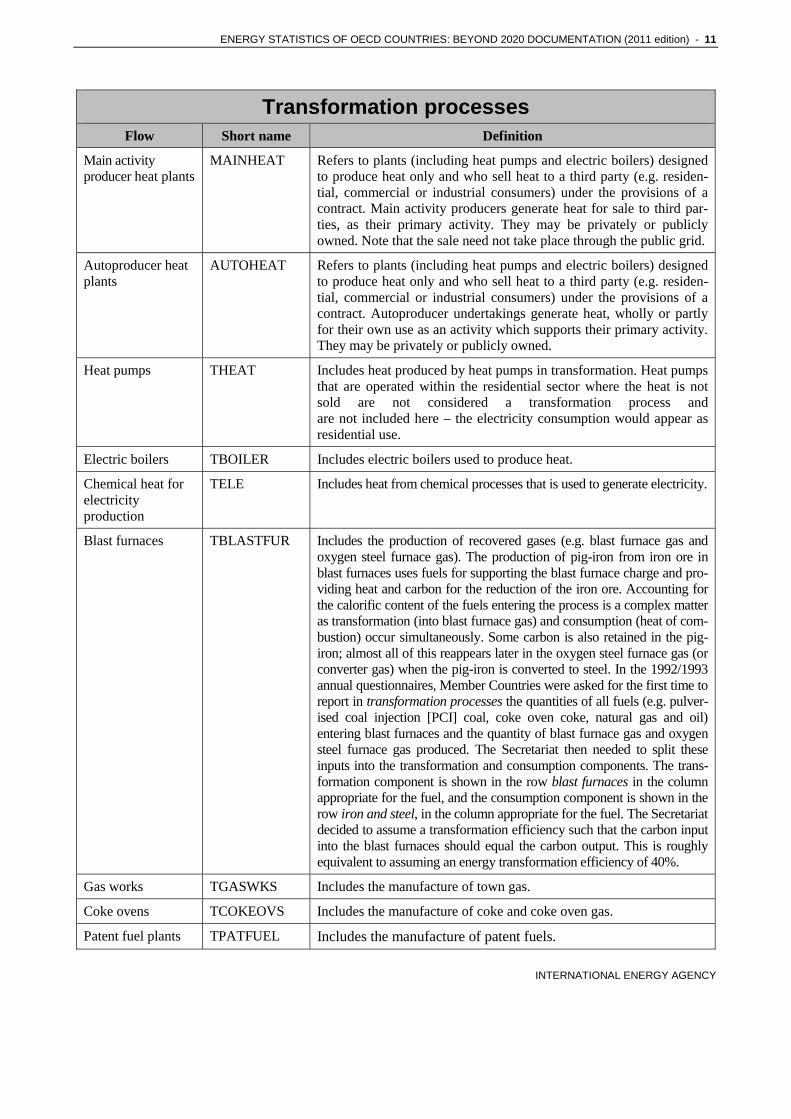
Transformation processes Flow Short name Definition
Main activity producer heat plants
MAINHEAT Refers to plants (including heat pumps and electric boilers) designed to produce heat only and who sell heat to a third party (e.g. residen-tial, commercial or industrial consumers) under the provisions of a contract. Main activity producers generate heat for sale to third par-ties, as their primary activity. They may be privately or publicly owned. Note that the sale need not take place through the public grid.
Autoproducer heat plants
AUTOHEAT Refers to plants (including heat pumps and electric boilers) designed to produce heat only and who sell heat to a third party (e.g. residen-tial, commercial or industrial consumers) under the provisions of a contract. Autoproducer undertakings generate heat, wholly or partly for their own use as an activity which supports their primary activity. They may be privately or publicly owned.
Heat pumps THEAT Includes heat produced by heat pumps in transformation. Heat pumps that are operated within the residential sector where the heat is not sold are not considered a transformation process and are not included here – the electricity consumption would appear as residential use.
Electric boilers TBOILER Includes electric boilers used to produce heat.
Chemical heat for electricity production
TELE Includes heat from chemical processes that is used to generate electricity.
Blast furnaces TBLASTFUR Includes the production of recovered gases (e.g. blast furnace gas and oxygen steel furnace gas). The production of pig-iron from iron ore in blast furnaces uses fuels for supporting the blast furnace charge and pro-viding heat and carbon for the reduction of the iron ore. Accounting for the calorific content of the fuels entering the process is a complex matter as transformation (into blast furnace gas) and consumption (heat of com-bustion) occur simultaneously. Some carbon is also retained in the pig-iron; almost all of this reappears later in the oxygen steel furnace gas (or converter gas) when the pig-iron is converted to steel. In the 1992/1993 annual questionnaires, Member Countries were asked for the first time to report in transformation processes the quantities of all fuels (e.g. pulver-ised coal injection [PCI] coal, coke oven coke, natural gas and oil) entering blast furnaces and the quantity of blast furnace gas and oxygen steel furnace gas produced. The Secretariat then needed to split these inputs into the transformation and consumption components. The trans-formation component is shown in the row blast furnaces in the column appropriate for the fuel, and the consumption component is shown in the row iron and steel, in the column appropriate for the fuel. The Secretariat decided to assume a transformation efficiency such that the carbon input into the blast furnaces should equal the carbon output. This is roughly equivalent to assuming an energy transformation efficiency of 40%.
Gas works TGASWKS Includes the manufacture of town gas.
Coke ovens TCOKEOVS Includes the manufacture of coke and coke oven gas.
Patent fuel plants TPATFUEL Includes the manufacture of patent fuels.

12 - ENERGY STATISTICS OF OECD COUNTRIES: BEYOND 2020 DOCUMENTATION (2011 edition)
INTERNATIONAL ENERGY AGENCY
Transformation processes Flow Short name Definition
BKB plants TBKB Includes the manufacture of BKB.
Oil refineries TREFINER Includes the manufacture of finished oil products.
Petrochemical plants
TPETCHEM Covers backflows returned from the petrochemical industry. Note that backflows from oil products that are used for non-energy pur-poses (i.e. white spirit and lubricants) are not included here, but in non-energy use.
Coal liquefaction plants
TCOALLIQ Includes coal, oil and tar sands used to produce synthetic oil.
Gas-to-liquids (GTL) plants
TGTL Includes natural gas used as feedstock for the conversion to liquids, e.g. the quantities of fuel entering the methanol production process for transformation into methanol.
For blended natural gas
TBLENDGAS Includes other gases that are blended with natural gas.
Charcoal production plants
TCHARCOAL Includes the transformation of solid biofuels into charcoal.
Non-specified (transformation)
TNONSPEC Includes other non-specified transformation.
ENERGY STATISTICS OF OECD COUNTRIES: BEYOND 2020 DOCUMENTATION (2011 edition) - 13
INTERNATIONAL ENERGY AGENCY
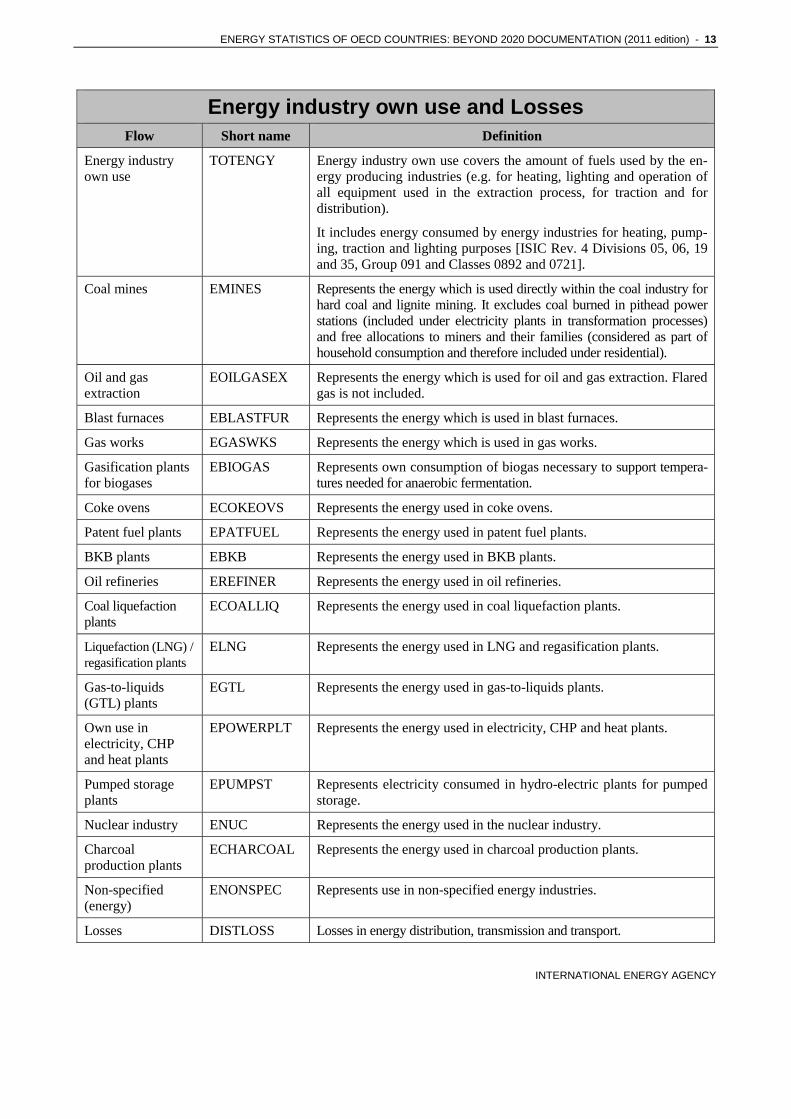
Energy industry own use and Losses Flow Short name Definition
Energy industry own use
TOTENGY Energy industry own use covers the amount of fuels used by the en-ergy producing industries (e.g. for heating, lighting and operation of all equipment used in the extraction process, for traction and for distribution).
It includes energy consumed by energy industries for heating, pump-ing, traction and lighting purposes [ISIC Rev. 4 Divisions 05, 06, 19 and 35, Group 091 and Classes 0892 and 0721].
Coal mines EMINES Represents the energy which is used directly within the coal industry for hard coal and lignite mining. It excludes coal burned in pithead power stations (included under electricity plants in transformation processes) and free allocations to miners and their families (considered as part of household consumption and therefore included under residential).
Oil and gas extraction
EOILGASEX Represents the energy which is used for oil and gas extraction. Flared gas is not included.
Blast furnaces EBLASTFUR Represents the energy which is used in blast furnaces.
Gas works EGASWKS Represents the energy which is used in gas works.
Gasification plants for biogases
EBIOGAS Represents own consumption of biogas necessary to support tempera-tures needed for anaerobic fermentation.
Coke ovens ECOKEOVS Represents the energy used in coke ovens.
Patent fuel plants EPATFUEL Represents the energy used in patent fuel plants.
BKB plants EBKB Represents the energy used in BKB plants.
Oil refineries EREFINER Represents the energy used in oil refineries.
Coal liquefaction plants
ECOALLIQ Represents the energy used in coal liquefaction plants.
Liquefaction (LNG) / regasification plants
ELNG Represents the energy used in LNG and regasification plants.
Gas-to-liquids (GTL) plants
EGTL Represents the energy used in gas-to-liquids plants.
Own use in electricity, CHP and heat plants
EPOWERPLT Represents the energy used in electricity, CHP and heat plants.
Pumped storage plants
EPUMPST Represents electricity consumed in hydro-electric plants for pumped storage.
Nuclear industry ENUC Represents the energy used in the nuclear industry.
Charcoal production plants
ECHARCOAL Represents the energy used in charcoal production plants.
Non-specified (energy)
ENONSPEC Represents use in non-specified energy industries.
Losses DISTLOSS Losses in energy distribution, transmission and transport.

14 - ENERGY STATISTICS OF OECD COUNTRIES: BEYOND 2020 DOCUMENTATION (2011 edition)
INTERNATIONAL ENERGY AGENCY
Final consumption Flow Short name Definition
Final consumption FINCONS Equal to the sum of the consumption in the end-use sectors. Energy used for transformation processes and for own use of the energy producing industries is excluded. Final consumption reflects for the most part deliveries to consumers (see note on stock changes).
Backflows from the petrochemical industry are not included in final consumption (see from other sources under supply and petrochemical plants in transformation processes).
Starting with the 2009 edition, international aviation bunkers is no longer included in final consumption at the country level.
Industry TOTIND Industry consumption is specified as follows: (energy used for transport by industry is not included here but is reported under transport):
Iron and steel IRONSTL [ISIC Rev. 4 Group 241 and Class 2431]
Chemical and petrochemical CHEMICAL [ISIC Rev. 4 Divisions 20 and 21] Excluding petrochemical feedstocks.
Non-ferrous metals NONFERR [ISIC Rev. 4 Group 242 and Class 2432] Basic industries.
Non-metallic minerals NONMET [ISIC Rev. 4 Division 23] Such as glass, ceramic, cement, etc.
Transport equipment TRANSEQ [ISIC Rev. 4 Divisions 29 and 30]
Machinery MACHINE [ISIC Rev. 4 Divisions 25 to 28] Fabricated metal products, machinery and equipment other than transport equipment.
Mining and quarrying MINING [ISIC Rev. 4 Divisions 07 and 08 and Group 099] Mining (ex-cluding fuels) and quarrying.
Food and tobacco FOODPRO [ISIC Rev. 4 Divisions 10 to 12]
Paper, pulp and print PAPERPRO [ISIC Rev. 4 Divisions 17 and 18]
Wood and wood products WOODPRO [ISIC Rev. 4 Division 16] Wood and wood products other than pulp and paper.
Construction CONSTRUC [ISIC Rev. 4 Division 41 to 43]
Textile and leather TEXTILES [ISIC Rev. 4 Divisions 13 to 15]
Non-specified (industry) INONSPEC [ISIC Rev. 4 Divisions 22, 31 and 32] Any manufacturing in-dustry not included above. Note: Most countries have difficulties supplying an industrial breakdown for all fuels. In these cases, the non-specified industry row has been used. Re-gional aggregates of industrial consumption should therefore be used with caution.
ENERGY STATISTICS OF OECD COUNTRIES: BEYOND 2020 DOCUMENTATION (2011 edition) - 15
INTERNATIONAL ENERGY AGENCY
Final consumption Flow Short name Definition
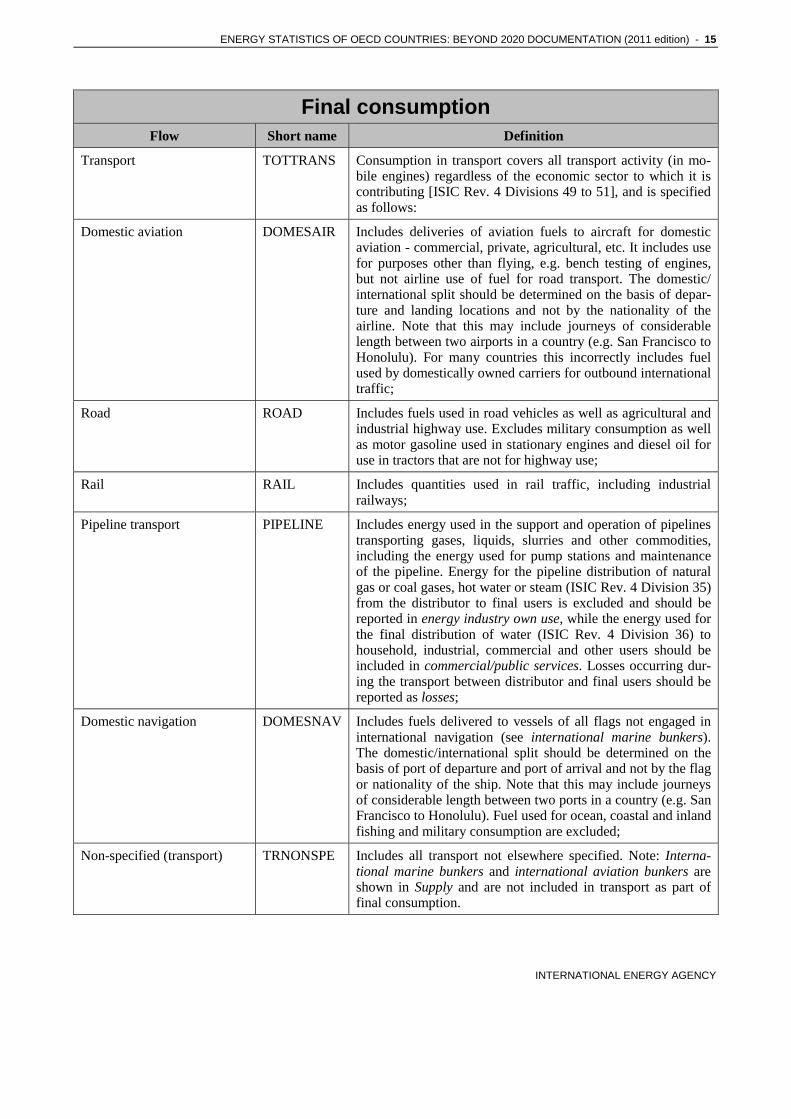
Transport TOTTRANS Consumption in transport covers all transport activity (in mo-bile engines) regardless of the economic sector to which it is contributing [ISIC Rev. 4 Divisions 49 to 51], and is specified as follows:
Domestic aviation DOMESAIR Includes deliveries of aviation fuels to aircraft for domestic aviation - commercial, private, agricultural, etc. It includes use for purposes other than flying, e.g. bench testing of engines, but not airline use of fuel for road transport. The domestic/international split should be determined on the basis of depar-ture and landing locations and not by the nationality of the airline. Note that this may include journeys of considerable length between two airports in a country (e.g. San Francisco to Honolulu). For many countries this incorrectly includes fuel used by domestically owned carriers for outbound international traffic;
Road ROAD Includes fuels used in road vehicles as well as agricultural and industrial highway use. Excludes military consumption as well as motor gasoline used in stationary engines and diesel oil for use in tractors that are not for highway use;
Rail RAIL Includes quantities used in rail traffic, including industrial railways;
Pipeline transport PIPELINE Includes energy used in the support and operation of pipelines transporting gases, liquids, slurries and other commodities, including the energy used for pump stations and maintenance of the pipeline. Energy for the pipeline distribution of natural gas or coal gases, hot water or steam (ISIC Rev. 4 Division 35) from the distributor to final users is excluded and should be reported in energy industry own use, while the energy used for the final distribution of water (ISIC Rev. 4 Division 36) to household, industrial, commercial and other users should be included in commercial/public services. Losses occurring dur-ing the transport between distributor and final users should be reported as losses;
Domestic navigation DOMESNAV Includes fuels delivered to vessels of all flags not engaged in international navigation (see international marine bunkers). The domestic/international split should be determined on the basis of port of departure and port of arrival and not by the flag or nationality of the ship. Note that this may include journeys of considerable length between two ports in a country (e.g. San Francisco to Honolulu). Fuel used for ocean, coastal and inland fishing and military consumption are excluded;
Non-specified (transport) TRNONSPE Includes all transport not elsewhere specified. Note: Interna-tional marine bunkers and international aviation bunkers are shown in Supply and are not included in transport as part of final consumption.
16 - ENERGY STATISTICS OF OECD COUNTRIES: BEYOND 2020 DOCUMENTATION (2011 edition)
INTERNATIONAL ENERGY AGENCY
Final consumption Flow Short name Definition
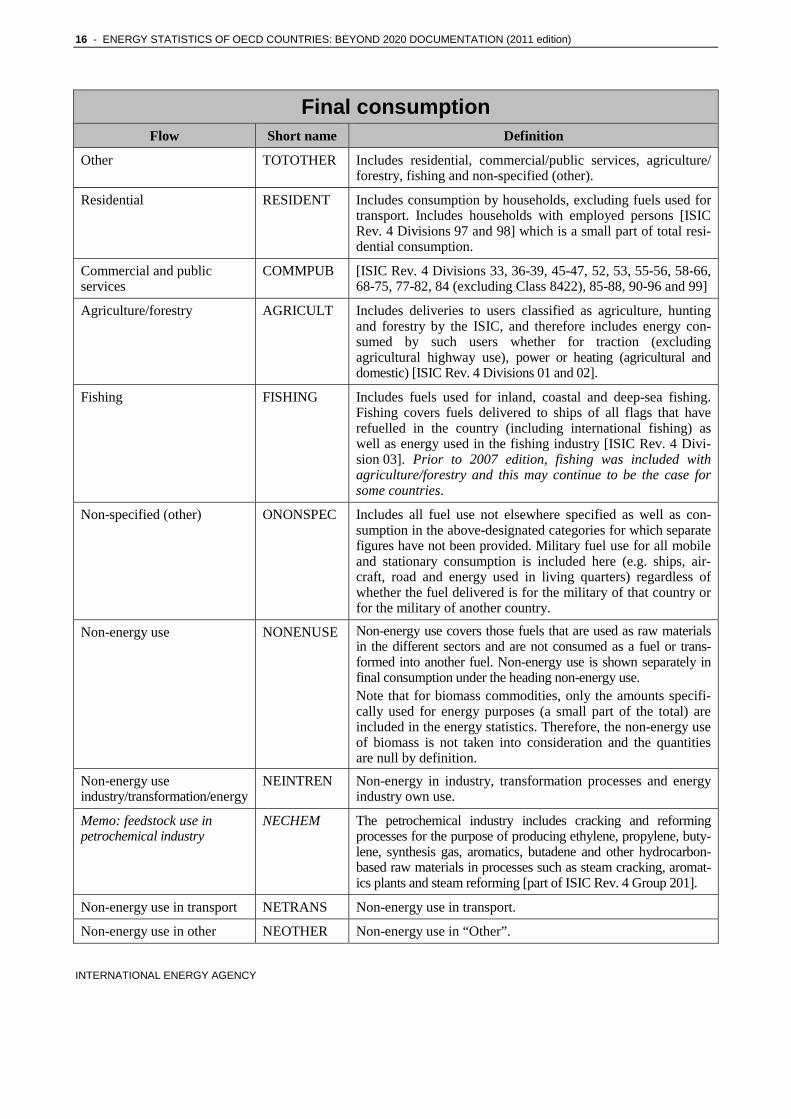
Other TOTOTHER Includes residential, commercial/public services, agriculture/forestry, fishing and non-specified (other).
Residential RESIDENT Includes consumption by households, excluding fuels used for transport. Includes households with employed persons [ISIC Rev. 4 Divisions 97 and 98] which is a small part of total resi-dential consumption.
Commercial and public services
COMMPUB [ISIC Rev. 4 Divisions 33, 36-39, 45-47, 52, 53, 55-56, 58-66, 68-75, 77-82, 84 (excluding Class 8422), 85-88, 90-96 and 99]
Agriculture/forestry AGRICULT Includes deliveries to users classified as agriculture, hunting and forestry by the ISIC, and therefore includes energy con-sumed by such users whether for traction (excluding agricultural highway use), power or heating (agricultural and domestic) [ISIC Rev. 4 Divisions 01 and 02].
Fishing FISHING Includes fuels used for inland, coastal and deep-sea fishing. Fishing covers fuels delivered to ships of all flags that have refuelled in the country (including international fishing) as well as energy used in the fishing industry [ISIC Rev. 4 Divi-sion 03]. Prior to 2007 edition, fishing was included with agriculture/forestry and this may continue to be the case for some countries.
Non-specified (other) ONONSPEC Includes all fuel use not elsewhere specified as well as con-sumption in the above-designated categories for which separate figures have not been provided. Military fuel use for all mobile and stationary consumption is included here (e.g. ships, air-craft, road and energy used in living quarters) regardless of whether the fuel delivered is for the military of that country or for the military of another country.
Non-energy use NONENUSE Non-energy use covers those fuels that are used as raw materials in the different sectors and are not consumed as a fuel or trans-formed into another fuel. Non-energy use is shown separately in final consumption under the heading non-energy use. Note that for biomass commodities, only the amounts specifi-cally used for energy purposes (a small part of the total) are included in the energy statistics. Therefore, the non-energy use of biomass is not taken into consideration and the quantities are null by definition.
Non-energy use industry/transformation/energy
NEINTREN Non-energy in industry, transformation processes and energy industry own use.
Memo: feedstock use in petrochemical industry
NECHEM The petrochemical industry includes cracking and reforming processes for the purpose of producing ethylene, propylene, buty-lene, synthesis gas, aromatics, butadene and other hydrocarbon-based raw materials in processes such as steam cracking, aromat-ics plants and steam reforming [part of ISIC Rev. 4 Group 201].
Non-energy use in transport NETRANS Non-energy use in transport.
Non-energy use in other NEOTHER Non-energy use in “Other”.
ENERGY STATISTICS OF OECD COUNTRIES: BEYOND 2020 DOCUMENTATION (2011 edition) - 17
INTERNATIONAL ENERGY AGENCY
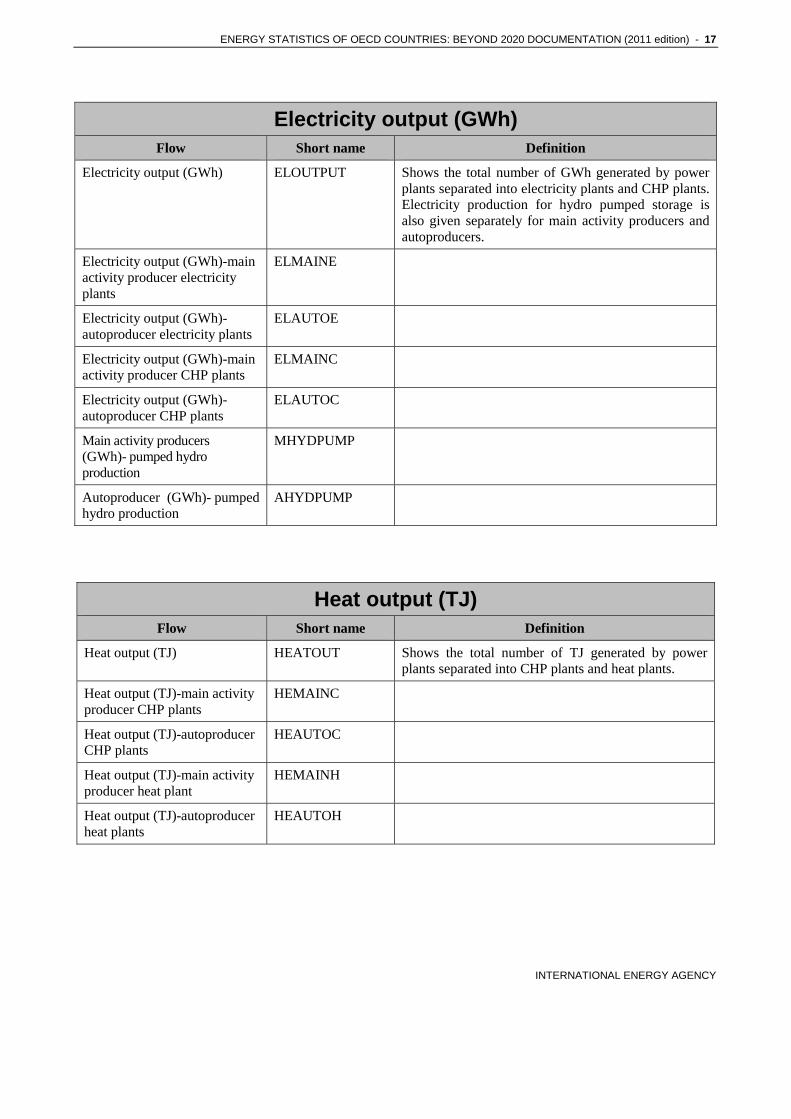
Electricity output (GWh) Flow Short name Definition
Electricity output (GWh) ELOUTPUT Shows the total number of GWh generated by power plants separated into electricity plants and CHP plants. Electricity production for hydro pumped storage is also given separately for main activity producers and autoproducers.
Electricity output (GWh)-main activity producer electricity plants
ELMAINE
Electricity output (GWh)-autoproducer electricity plants
ELAUTOE
Electricity output (GWh)-main activity producer CHP plants
ELMAINC
Electricity output (GWh)-autoproducer CHP plants
ELAUTOC
Main activity producers (GWh)- pumped hydro production
MHYDPUMP
Autoproducer (GWh)- pumped hydro production
AHYDPUMP
Heat output (TJ) Flow Short name Definition
Heat output (TJ) HEATOUT Shows the total number of TJ generated by power plants separated into CHP plants and heat plants.
Heat output (TJ)-main activity producer CHP plants
HEMAINC
Heat output (TJ)-autoproducer CHP plants
HEAUTOC
Heat output (TJ)-main activity producer heat plant
HEMAINH
Heat output (TJ)-autoproducer heat plants
HEAUTOH

18 - ENERGY STATISTICS OF OECD COUNTRIES: BEYOND 2020 DOCUMENTATION (2011 edition)
INTERNATIONAL ENERGY AGENCY
Net calorific values Expressed both in tonne of oil equivalent / tonne and in kilojoules / kilogramme
Flow Short name Definition
Average net calorific value NAVERAGE
NCV of production NINDPROD
NCV of imports NIMPORTS
NCV of exports NEXPORTS
NCV of coke ovens NCOKEOVS
NCV of blast furnaces NBLAST
NCV in main activity producer electricity plants
NMAIN
NCV in autoproducer electricity plants
NAUTOELEC
NCV in main activity CHP plants
NMAINCHP
NCV in autoproducer CHP plants
NAUTOCHP
NCV in main activity heat plants
NMAINHEAT
NCV in autoproducer heat plants
NAUTOHEAT
NCV in industry NIND
NCV for other uses NOTHER

ENERGY STATISTICS OF OECD COUNTRIES: BEYOND 2020 DOCUMENTATION (2011 edition) - 19
INTERNATIONAL ENERGY AGENCY
3. PRODUCT DEFINITIONS
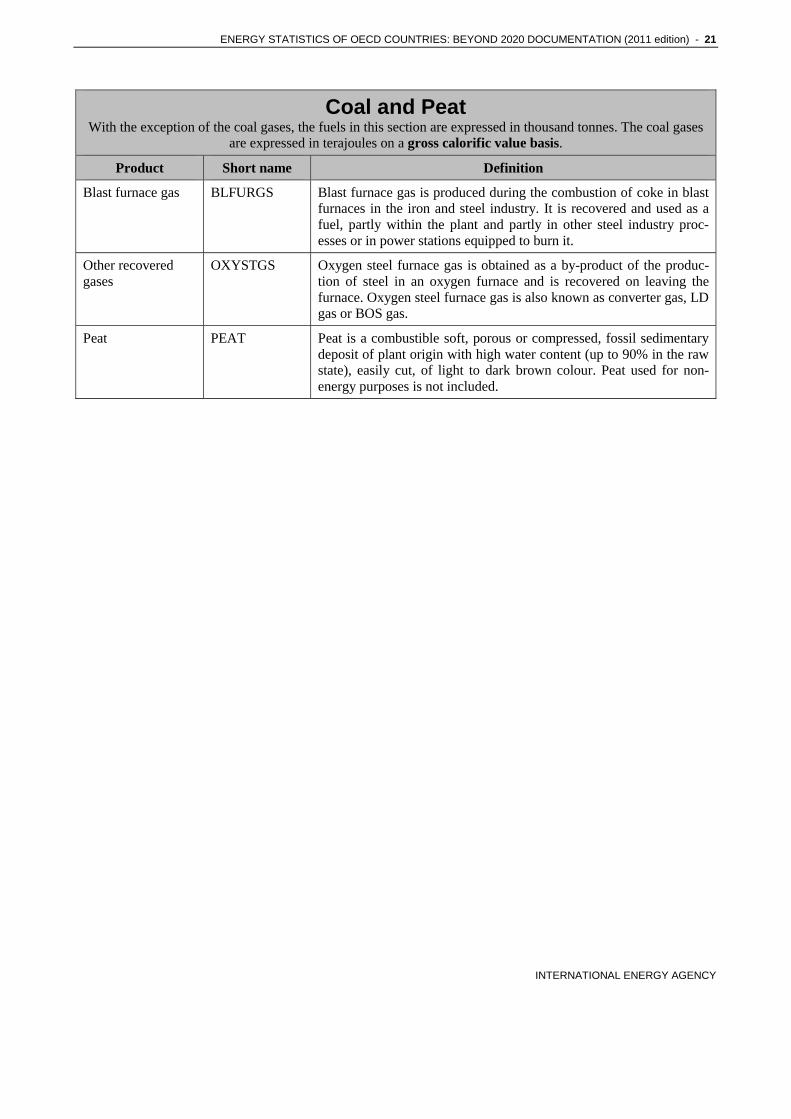
Coal and Peat With the exception of the coal gases, the fuels in this section are expressed in thousand tonnes. The coal gases
are expressed in terajoules on a gross calorific value basis. Product Short name Definition
Hard coal (if no detail)
HARDCOAL This item is only used if the detailed breakdown is not available. It includes anthracite, coking coal, other bituminous coal and (depend-ing on the country) also may include sub-bituminous coal.
Brown coal (if no detail)
BROWN This item is only used if the detailed breakdown is not available. It includes lignite and (depending on the country) also may include sub-bituminous coal.
Anthracite ANTCOAL Anthracite is a high rank coal used for industrial and residential applica-tions. It is generally less than 10% volatile matter and a high carbon content (about 90% fixed carbon). Its gross calorific value is greater than 23 865 kJ/kg (5 700 kcal/kg) on an ash-free but moist basis.
Coking coal COKCOAL Coking coal refers to coal with a quality that allows the production of a coke suitable to support a blast furnace charge. Its gross calorific value is greater than 23 865 kJ/kg (5 700 kcal/kg) on an ash-free but moist basis.
Other bituminous coal
BITCOAL Other bituminous coal is used for steam raising and space heating purposes and includes all bituminous coal that is not included under coking coal. It is usually more than 10% volatile matter and a rela-tively high carbon content (less than 90% fixed carbon). Its gross calorific value is greater than 23 865 kJ/kg (5 700 kcal/kg) on an ash-free but moist basis.
Sub-bituminous coal
SUBCOAL Non-agglomerating coals with a gross calorific value between 17 435 kJ/kg (4 165 kcal/kg) and 23 865 kJ/kg (5 700 kcal/kg) containing more than 31% volatile matter on a dry mineral matter free basis.
Lignite LIGNITE Lignite is a non-agglomerating coal with a gross calorific value of less than 17 435 kJ/kg (4 165 kcal/kg), and greater than 31% volatile matter on a dry mineral matter free basis.
Oil shale and tar sands produced and combusted directly are in-cluded in this category. Oil shale and tar sands used as inputs for other transformation processes are also included here (this includes the portion consumed in the transformation process). Shale oil and other products derived from liquefaction are included in from other sources under crude oil (other hydrocarbons).

20 - ENERGY STATISTICS OF OECD COUNTRIES: BEYOND 2020 DOCUMENTATION (2011 edition)
INTERNATIONAL ENERGY AGENCY
Coal and Peat With the exception of the coal gases, the fuels in this section are expressed in thousand tonnes. The coal gases
are expressed in terajoules on a gross calorific value basis. Product Short name Definition
Patent fuel PATFUEL Patent fuel is a composition fuel manufactured from hard coal fines with the addition of a binding agent. The amount of patent fuel pro-duced is, therefore, slightly higher than the actual amount of coal consumed in the transformation process. Consumption of patent fuels during the patent fuel manufacturing process is included under other energy industry own use.
Coke oven coke OVENCOKE Coke oven coke is the solid product obtained from the carbonisation of coal, principally coking coal, at high temperature. It is low in moisture content and volatile matter. Coke oven coke is used mainly in the iron and steel industry, acting as energy source and chemical agent. Also included are semi-coke (a solid product obtained from the carbonisation of coal at a low temperature), lignite coke (a semi-coke made from lignite), coke breeze and foundry coke. The heading other energy industry own use includes the consumption at the coking plants themselves. Consumption in the iron and steel industry does not include coke converted into blast furnace gas. To obtain the total consumption of coke oven coke in the iron and steel industry, the quantities converted into blast furnace gas have to be added (these are included in blast furnaces).
Gas coke GASCOKE Gas coke is a by-product of hard coal used for the production of town gas in gas works. Gas coke is used for heating purposes. Other energy industry own use includes the consumption of gas coke at gas works.
Coal tar COALTAR Coal tar is a result of the destructive distillation of bituminous coal. Coal tar is the liquid by-product of the distillation of coal to make coke in the coke oven process. Coal tar can be further distilled into different organic products (e.g. benzene, toluene, naphthalene), which normally would be reported as a feedstock to the petrochemical industry.
BKB/peat briquettes
BKB BKB are composition fuels manufactured from lignite, produced by briquetting under high pressure. These figures include peat bri-quettes, dried lignite fines and dust. The heading other energy industry own use includes consumption by briquetting plants.
Gas works gas GASWKSGS Gas works gas covers all types of gas produced in public utility or private plants, whose main purpose is the manufacture, transport and distribution of gas. It includes gas produced by carbonisation (includ-ing gas produced by coke ovens and transferred to gas works), by total gasification (with or without enrichment with oil products) and by reforming and simple mixing of gases and/or air.
Coke oven gas COKEOVGS Coke oven gas is obtained as a by-product of the manufacture of coke oven coke for the production of iron and steel.
ENERGY STATISTICS OF OECD COUNTRIES: BEYOND 2020 DOCUMENTATION (2011 edition) - 21
INTERNATIONAL ENERGY AGENCY
Coal and Peat With the exception of the coal gases, the fuels in this section are expressed in thousand tonnes. The coal gases
are expressed in terajoules on a gross calorific value basis. Product Short name Definition
Blast furnace gas BLFURGS Blast furnace gas is produced during the combustion of coke in blast furnaces in the iron and steel industry. It is recovered and used as a fuel, partly within the plant and partly in other steel industry proc-esses or in power stations equipped to burn it.
Other recovered gases
OXYSTGS Oxygen steel furnace gas is obtained as a by-product of the produc-tion of steel in an oxygen furnace and is recovered on leaving the furnace. Oxygen steel furnace gas is also known as converter gas, LD gas or BOS gas.
Peat PEAT Peat is a combustible soft, porous or compressed, fossil sedimentary deposit of plant origin with high water content (up to 90% in the raw state), easily cut, of light to dark brown colour. Peat used for non-energy purposes is not included.
22 - ENERGY STATISTICS OF OECD COUNTRIES: BEYOND 2020 DOCUMENTATION (2011 edition)
INTERNATIONAL ENERGY AGENCY
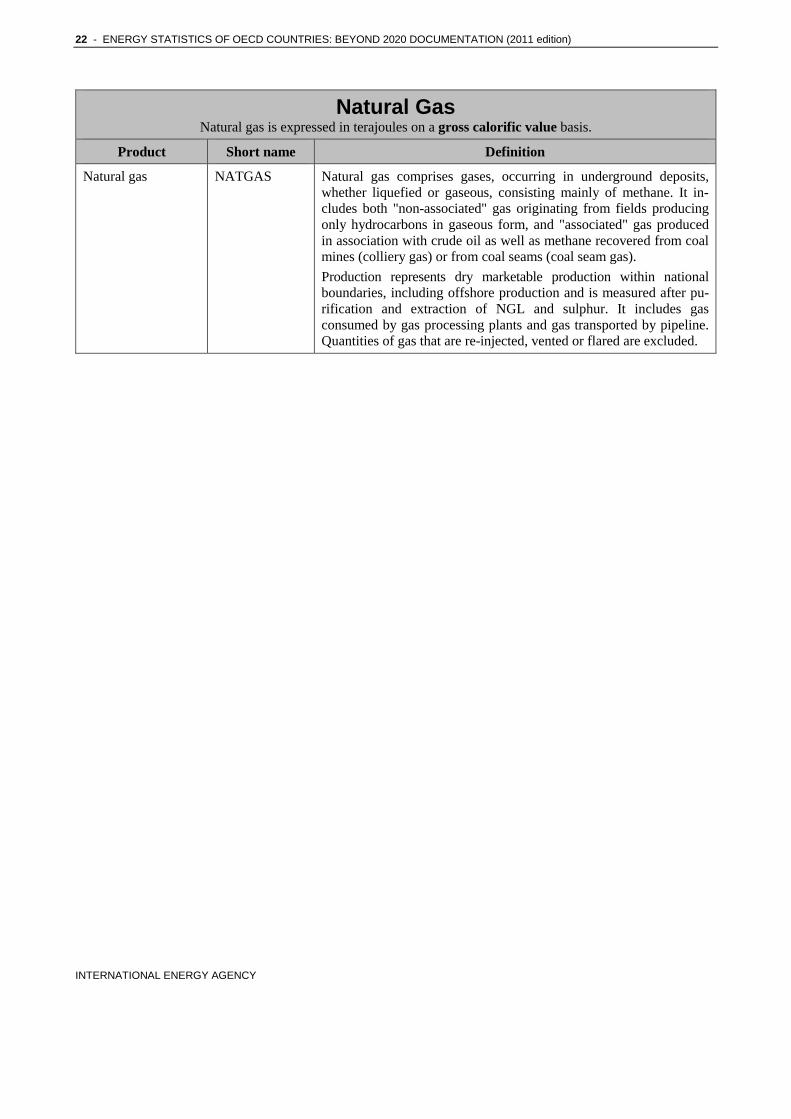
Natural Gas Natural gas is expressed in terajoules on a gross calorific value basis.
Product Short name Definition
Natural gas NATGAS Natural gas comprises gases, occurring in underground deposits, whether liquefied or gaseous, consisting mainly of methane. It in-cludes both "non-associated" gas originating from fields producing only hydrocarbons in gaseous form, and "associated" gas produced in association with crude oil as well as methane recovered from coal mines (colliery gas) or from coal seams (coal seam gas).
Production represents dry marketable production within national boundaries, including offshore production and is measured after pu-rification and extraction of NGL and sulphur. It includes gas consumed by gas processing plants and gas transported by pipeline. Quantities of gas that are re-injected, vented or flared are excluded.

ENERGY STATISTICS OF OECD COUNTRIES: BEYOND 2020 DOCUMENTATION (2011 edition) - 23
INTERNATIONAL ENERGY AGENCY
Crude, NGL, refinery feedstocks The fuels in this section are expressed in thousand tonnes.
Product Short name Definition
Crude/NGL/feedstocks (if no detail)
CRNGFEED This item is only used if the detailed breakdown is not available. It includes crude oil, natural gas liquids, refinery feedstocks, addi-tives/blending components and other hydrocarbons.
Crude oil CRUDEOIL Crude oil is a mineral oil consisting of a mixture of hydrocarbons of natural origin and associated impurities, such as sulphur. It exists in the liquid phase under normal surface temperatures and pressure and its physical characteristics (density, viscosity, etc.) are highly variable. It includes field or lease condensates (separator liquids) which are recovered from associated and non-associated gas where it is commingled with the commercial crude oil stream.
Natural gas liquids NGL NGLs are the liquid or liquefied hydrocarbons produced in the manufacture, purification and stabilisation of natural gas. These are those portions of natural gas which are recovered as liquids in sepa-rators, field facilities, or gas processing plants. NGLs include but are not limited to ethane, propane, butane, pentane, natural gasoline and condensate.
Refinery feedstocks REFFEEDS A refinery feedstock is a processed oil destined for further process-ing (e.g. straight run fuel oil or vacuum gas oil) other than blending in the refining industry. It is transformed into one or more components and/or finished products. This definition covers those finished products imported for refinery intake and those re-turned from the petrochemical industry to the refining industry.
Additives/blending components
ADDITIVE Additives are non-hydrocarbon substances added to or blended with a product to modify its properties, for example, to improve its com-bustion characteristics. Alcohols and ethers (MTBE, methyl tertiary-butyl ether) and chemical alloys such as tetraethyl lead are included here. The biofuel fractions of biogasoline, biodiesel and ethanol are not included here, but under liquid biofuels. This differs from the presentation of additives in the Oil Information publication.
Other hydrocarbons NONCRUDE Other hydrocarbons, including emulsified oils (e.g. orimulsion), synthetic crude oil, mineral oils extracted from bituminous minerals such as oil shale, bituminous sand, etc. and liquids from coal lique-faction, are included here.

24 - ENERGY STATISTICS OF OECD COUNTRIES: BEYOND 2020 DOCUMENTATION (2011 edition)
INTERNATIONAL ENERGY AGENCY
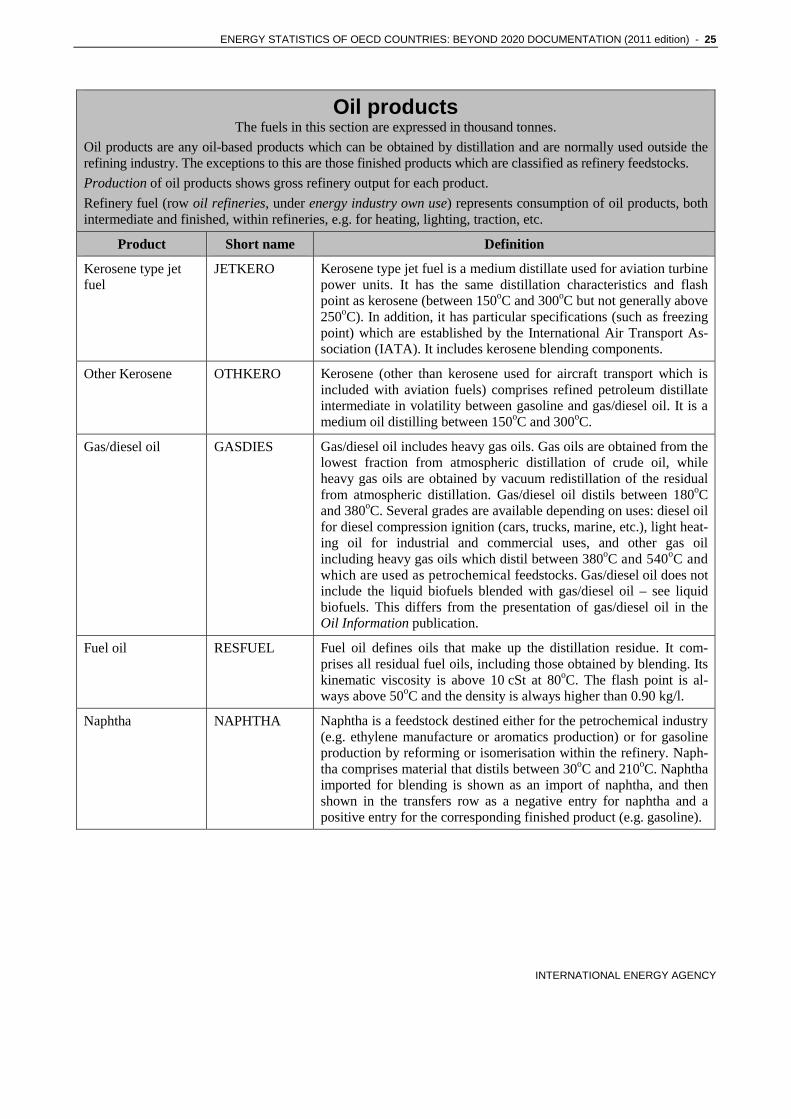
Oil products The fuels in this section are expressed in thousand tonnes.
Oil products are any oil-based products which can be obtained by distillation and are normally used outside the refining industry. The exceptions to this are those finished products which are classified as refinery feedstocks.
Production of oil products shows gross refinery output for each product.
Refinery fuel (row oil refineries, under energy industry own use) represents consumption of oil products, both intermediate and finished, within refineries, e.g. for heating, lighting, traction, etc.
Product Short name Definition
Refinery gas REFINGAS Refinery gas is defined as non-condensable gas obtained during dis-tillation of crude oil or treatment of oil products (e.g. cracking) in refineries. It consists mainly of hydrogen, methane, ethane and ole-fins. It also includes gases which are returned from the petrochemical industry. Refinery gas production refers to gross pro-duction. Own consumption is shown separately under oil refineries in energy industry own use.
Ethane ETHANE Ethane is a naturally gaseous straight-chain hydrocarbon (C2H6). It is a colourless paraffinic gas which is extracted from natural gas and refinery gas streams.
Liquefied petroleum gases (LPG)
LPG Liquefied petroleum gases are the light hydrocarbon fraction of the paraffin series, derived from refinery processes, crude oil stabilisa-tion plants and natural gas processing plants, comprising propane (C3H8) and butane (C4H10) or a combination of the two. They could also include propylene, butylene, isobutene and isobutylene. LPG are normally liquefied under pressure for transportation and storage.
Motor gasoline MOTORGAS Motor gasoline is light hydrocarbon oil for use in internal combus-tion engines such as motor vehicles, excluding aircraft. Motor gasoline is distilled between 35oC and 215oC and is used as a fuel for land based spark ignition engines. Motor gasoline may include addi-tives, oxygenates and octane enhancers, including lead compounds such as TEL (tetraethyl lead) and TML (tetramethyl lead). Motor gasoline does not include the liquid biofuel or ethanol blended with gasoline - see liquid biofuels. This differs from the presentation of motor gasoline in the Oil Information publication.
Aviation gasoline AVGAS Aviation gasoline is motor spirit prepared especially for aviation piston engines, with an octane number suited to the engine, a freez-ing point of -60oC, and a distillation range usually within the limits of 30oC and 180oC.
Gasoline type jet fuel
JETGAS Gasoline type jet fuel includes all light hydrocarbon oils for use in aviation turbine power units, which distil between 100oC and 250oC. This fuel is obtained by blending kerosenes and gasoline or naphthas in such a way that the aromatic content does not exceed 25% in vol-ume, and the vapour pressure is between 13.7 kPa and 20.6 kPa. Additives can be included to improve fuel stability and combustibility.
ENERGY STATISTICS OF OECD COUNTRIES: BEYOND 2020 DOCUMENTATION (2011 edition) - 25
INTERNATIONAL ENERGY AGENCY
Oil products The fuels in this section are expressed in thousand tonnes.
Oil products are any oil-based products which can be obtained by distillation and are normally used outside the refining industry. The exceptions to this are those finished products which are classified as refinery feedstocks.
Production of oil products shows gross refinery output for each product.
Refinery fuel (row oil refineries, under energy industry own use) represents consumption of oil products, both intermediate and finished, within refineries, e.g. for heating, lighting, traction, etc.
Product Short name Definition
Kerosene type jet fuel
JETKERO Kerosene type jet fuel is a medium distillate used for aviation turbine power units. It has the same distillation characteristics and flash point as kerosene (between 150oC and 300oC but not generally above 250oC). In addition, it has particular specifications (such as freezing point) which are established by the International Air Transport As-sociation (IATA). It includes kerosene blending components.
Other Kerosene OTHKERO Kerosene (other than kerosene used for aircraft transport which is included with aviation fuels) comprises refined petroleum distillate intermediate in volatility between gasoline and gas/diesel oil. It is a medium oil distilling between 150oC and 300oC.
Gas/diesel oil GASDIES Gas/diesel oil includes heavy gas oils. Gas oils are obtained from the lowest fraction from atmospheric distillation of crude oil, while heavy gas oils are obtained by vacuum redistillation of the residual from atmospheric distillation. Gas/diesel oil distils between 180oC and 380oC. Several grades are available depending on uses: diesel oil for diesel compression ignition (cars, trucks, marine, etc.), light heat-ing oil for industrial and commercial uses, and other gas oil including heavy gas oils which distil between 380oC and 540oC and which are used as petrochemical feedstocks. Gas/diesel oil does not include the liquid biofuels blended with gas/diesel oil – see liquid biofuels. This differs from the presentation of gas/diesel oil in the Oil Information publication.
Fuel oil RESFUEL Fuel oil defines oils that make up the distillation residue. It com-prises all residual fuel oils, including those obtained by blending. Its kinematic viscosity is above 10 cSt at 80oC. The flash point is al-ways above 50oC and the density is always higher than 0.90 kg/l.
Naphtha NAPHTHA Naphtha is a feedstock destined either for the petrochemical industry (e.g. ethylene manufacture or aromatics production) or for gasoline production by reforming or isomerisation within the refinery. Naph-tha comprises material that distils between 30oC and 210oC. Naphtha imported for blending is shown as an import of naphtha, and then shown in the transfers row as a negative entry for naphtha and a positive entry for the corresponding finished product (e.g. gasoline).
26 - ENERGY STATISTICS OF OECD COUNTRIES: BEYOND 2020 DOCUMENTATION (2011 edition)
INTERNATIONAL ENERGY AGENCY
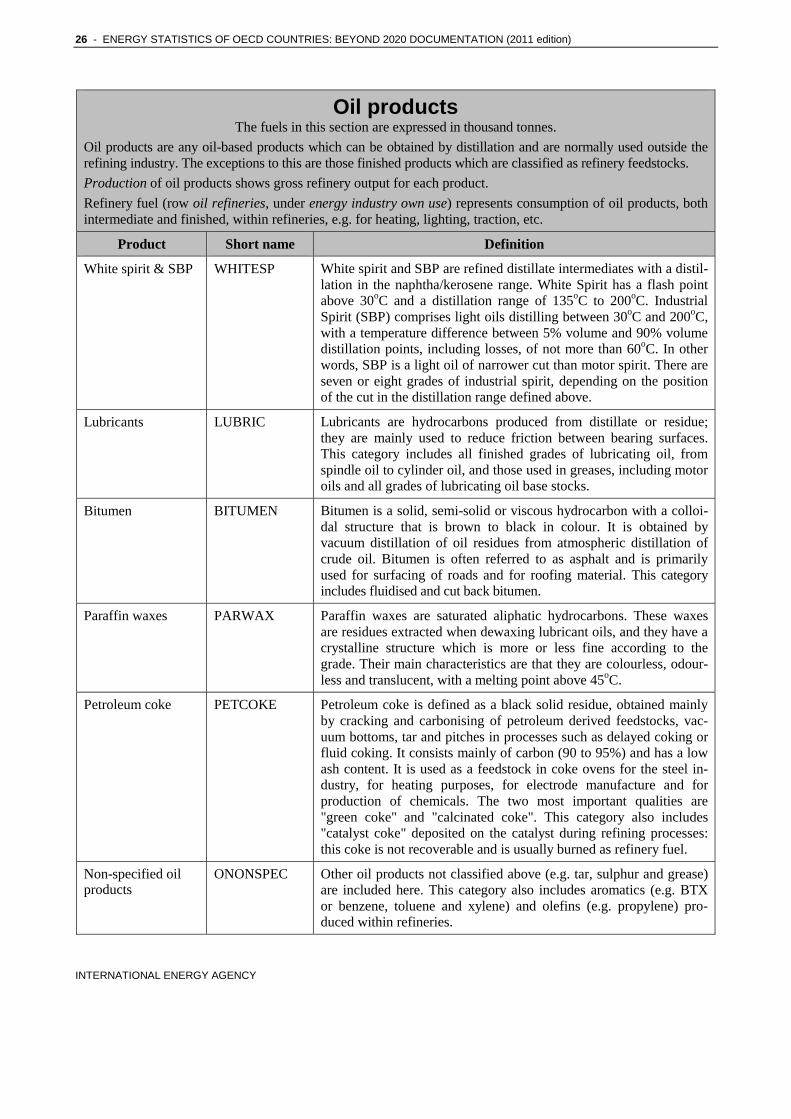
Oil products The fuels in this section are expressed in thousand tonnes.
Oil products are any oil-based products which can be obtained by distillation and are normally used outside the refining industry. The exceptions to this are those finished products which are classified as refinery feedstocks.
Production of oil products shows gross refinery output for each product.
Refinery fuel (row oil refineries, under energy industry own use) represents consumption of oil products, both intermediate and finished, within refineries, e.g. for heating, lighting, traction, etc.
Product Short name Definition
White spirit & SBP WHITESP White spirit and SBP are refined distillate intermediates with a distil-lation in the naphtha/kerosene range. White Spirit has a flash point above 30oC and a distillation range of 135oC to 200oC. Industrial Spirit (SBP) comprises light oils distilling between 30oC and 200oC, with a temperature difference between 5% volume and 90% volume distillation points, including losses, of not more than 60oC. In other words, SBP is a light oil of narrower cut than motor spirit. There are seven or eight grades of industrial spirit, depending on the position of the cut in the distillation range defined above.
Lubricants LUBRIC Lubricants are hydrocarbons produced from distillate or residue; they are mainly used to reduce friction between bearing surfaces. This category includes all finished grades of lubricating oil, from spindle oil to cylinder oil, and those used in greases, including motor oils and all grades of lubricating oil base stocks.
Bitumen BITUMEN Bitumen is a solid, semi-solid or viscous hydrocarbon with a colloi-dal structure that is brown to black in colour. It is obtained by vacuum distillation of oil residues from atmospheric distillation of crude oil. Bitumen is often referred to as asphalt and is primarily used for surfacing of roads and for roofing material. This category includes fluidised and cut back bitumen.
Paraffin waxes PARWAX Paraffin waxes are saturated aliphatic hydrocarbons. These waxes are residues extracted when dewaxing lubricant oils, and they have a crystalline structure which is more or less fine according to the grade. Their main characteristics are that they are colourless, odour-less and translucent, with a melting point above 45oC.
Petroleum coke PETCOKE Petroleum coke is defined as a black solid residue, obtained mainly by cracking and carbonising of petroleum derived feedstocks, vac-uum bottoms, tar and pitches in processes such as delayed coking or fluid coking. It consists mainly of carbon (90 to 95%) and has a low ash content. It is used as a feedstock in coke ovens for the steel in-dustry, for heating purposes, for electrode manufacture and for production of chemicals. The two most important qualities are "green coke" and "calcinated coke". This category also includes "catalyst coke" deposited on the catalyst during refining processes: this coke is not recoverable and is usually burned as refinery fuel.
Non-specified oil products
ONONSPEC Other oil products not classified above (e.g. tar, sulphur and grease) are included here. This category also includes aromatics (e.g. BTX or benzene, toluene and xylene) and olefins (e.g. propylene) pro-duced within refineries.
ENERGY STATISTICS OF OECD COUNTRIES: BEYOND 2020 DOCUMENTATION (2011 edition) - 27
INTERNATIONAL ENERGY AGENCY
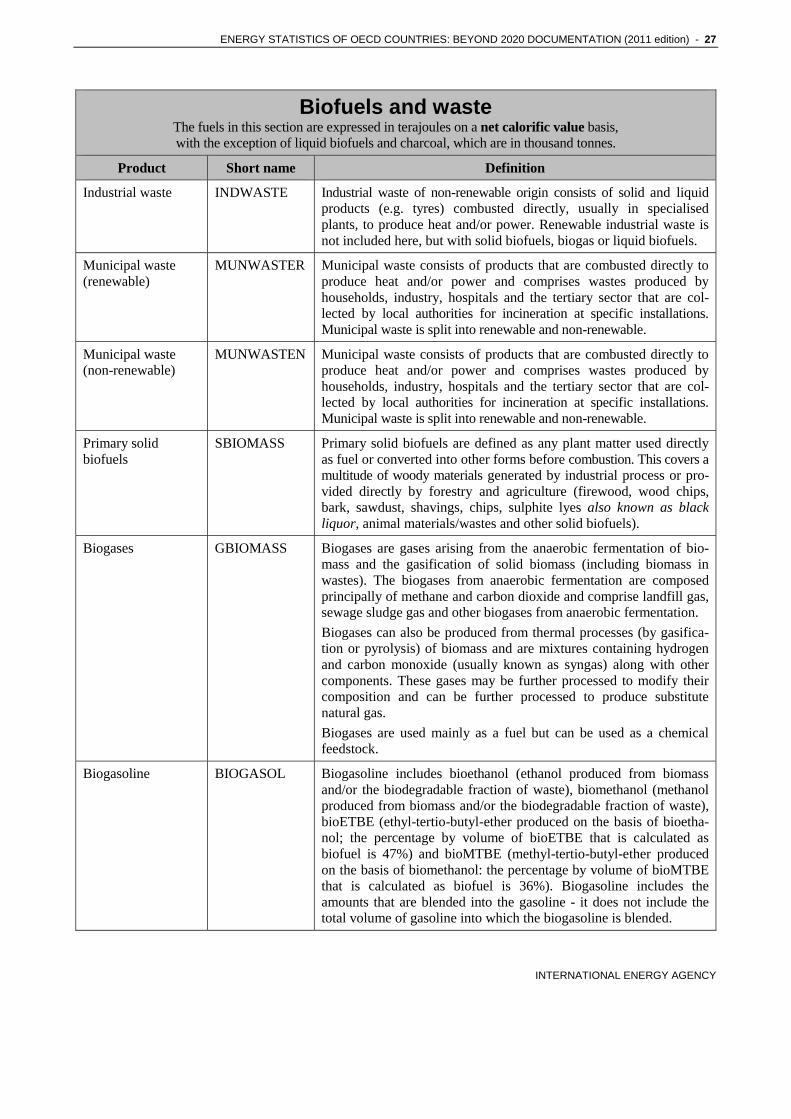
Biofuels and waste The fuels in this section are expressed in terajoules on a net calorific value basis, with the exception of liquid biofuels and charcoal, which are in thousand tonnes.
Product Short name Definition
Industrial waste INDWASTE Industrial waste of non-renewable origin consists of solid and liquid products (e.g. tyres) combusted directly, usually in specialised plants, to produce heat and/or power. Renewable industrial waste is not included here, but with solid biofuels, biogas or liquid biofuels.
Municipal waste (renewable)
MUNWASTER Municipal waste consists of products that are combusted directly to produce heat and/or power and comprises wastes produced by households, industry, hospitals and the tertiary sector that are col-lected by local authorities for incineration at specific installations. Municipal waste is split into renewable and non-renewable.
Municipal waste (non-renewable)
MUNWASTEN Municipal waste consists of products that are combusted directly to produce heat and/or power and comprises wastes produced by households, industry, hospitals and the tertiary sector that are col-lected by local authorities for incineration at specific installations. Municipal waste is split into renewable and non-renewable.
Primary solid biofuels
SBIOMASS Primary solid biofuels are defined as any plant matter used directly as fuel or converted into other forms before combustion. This covers a multitude of woody materials generated by industrial process or pro-vided directly by forestry and agriculture (firewood, wood chips, bark, sawdust, shavings, chips, sulphite lyes also known as black liquor, animal materials/wastes and other solid biofuels).
Biogases GBIOMASS Biogases are gases arising from the anaerobic fermentation of bio-mass and the gasification of solid biomass (including biomass in wastes). The biogases from anaerobic fermentation are composed principally of methane and carbon dioxide and comprise landfill gas, sewage sludge gas and other biogases from anaerobic fermentation.
Biogases can also be produced from thermal processes (by gasifica-tion or pyrolysis) of biomass and are mixtures containing hydrogen and carbon monoxide (usually known as syngas) along with other components. These gases may be further processed to modify their composition and can be further processed to produce substitute natural gas.
Biogases are used mainly as a fuel but can be used as a chemical feedstock.
Biogasoline BIOGASOL Biogasoline includes bioethanol (ethanol produced from biomass and/or the biodegradable fraction of waste), biomethanol (methanol produced from biomass and/or the biodegradable fraction of waste), bioETBE (ethyl-tertio-butyl-ether produced on the basis of bioetha-nol; the percentage by volume of bioETBE that is calculated as biofuel is 47%) and bioMTBE (methyl-tertio-butyl-ether produced on the basis of biomethanol: the percentage by volume of bioMTBE that is calculated as biofuel is 36%). Biogasoline includes the amounts that are blended into the gasoline - it does not include the total volume of gasoline into which the biogasoline is blended.

28 - ENERGY STATISTICS OF OECD COUNTRIES: BEYOND 2020 DOCUMENTATION (2011 edition)
INTERNATIONAL ENERGY AGENCY
Biofuels and waste The fuels in this section are expressed in terajoules on a net calorific value basis, with the exception of liquid biofuels and charcoal, which are in thousand tonnes.
Biodiesels BIODIESEL Biodiesels includes biodiesel (a methyl-ester produced from vegeta-ble or animal oil, of diesel quality), biodimethylether (dimethylether produced from biomass), Fischer Tropsh (Fischer Tropsh produced from biomass), cold pressed bio-oil (oil produced from oil seed through mechanical processing only) and all other liquid biofuels which are added to, blended with or used straight as transport diesel. Biodiesels includes the amounts that are blended into the diesel - it does not include the total volume of diesel into which the biodiesel is blended.
Other liquid biofuels OBIOLIQ Other liquid biofuels includes liquid biofuels not reported in either biogasoline or biodiesels.
Non-specified primary biofuels/waste
RENEWNS This item is used when the detailed breakdown for primary combus-tible renewables and wastes is not available.
Charcoal CHARCOAL Charcoal produced from solid biofuels.

ENERGY STATISTICS OF OECD COUNTRIES: BEYOND 2020 DOCUMENTATION (2011 edition) - 29
INTERNATIONAL ENERGY AGENCY
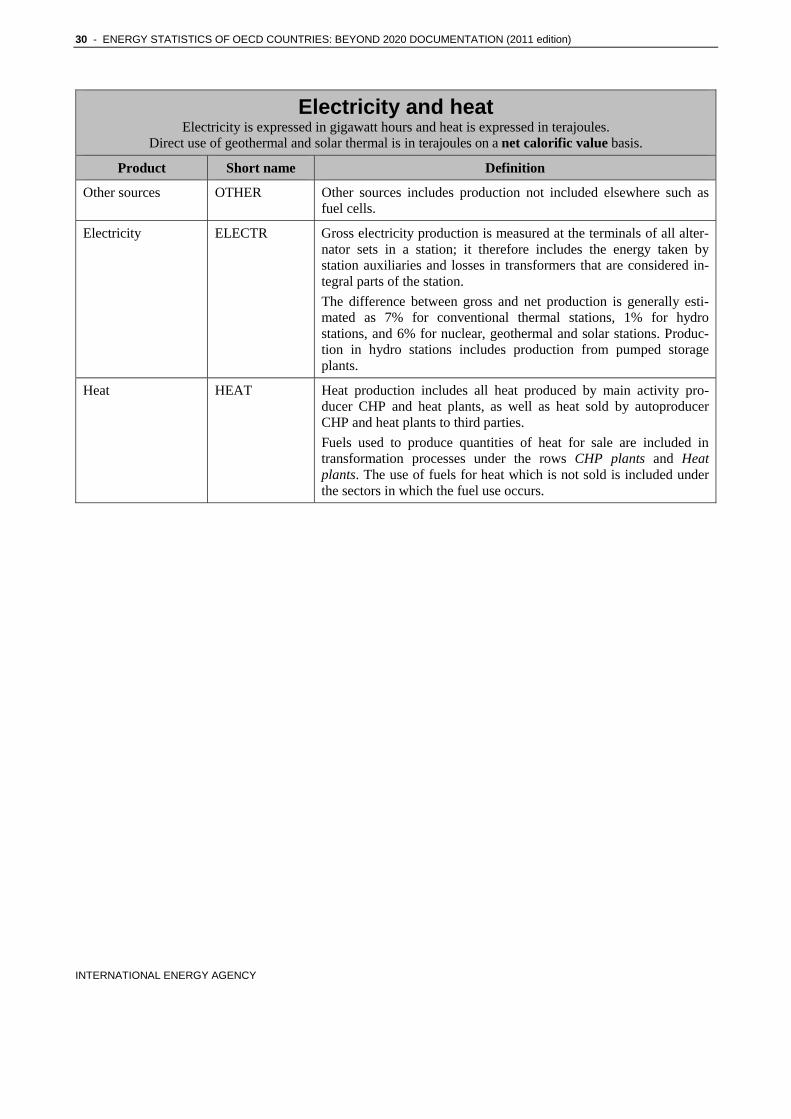
Electricity and heat Electricity is expressed in gigawatt hours and heat is expressed in terajoules.
Direct use of geothermal and solar thermal is in terajoules on a net calorific value basis. Product Short name Definition
Elec/heat output from non-specified manufactured gases
MANGAS This item is only used if the detailed breakdown is not available. It includes coke oven gas, blast furnace gas and oxygen steel furnace gas. Gas works gas is not included here.
Heat output from non-specified com-bustible fuels
HEATNS This item is only used if the detailed breakdown is not available.
Nuclear NUCLEAR Energy released by nuclear fission or nuclear fusion.
Hydro HYDRO Hydro energy represents the potential and kinetic energy of water converted into electricity in hydroelectric plants.
Geothermal GEOTHERM Geothermal energy is the energy available as heat emitted from within the earth’s crust, usually in the form of hot water or steam. It is exploited at suitable sites:
• for electricity generation using dry stream or high enthalpy brine after flashing
• directly as heat for district heating, agriculture, etc.
Solar photovoltaics SOLARPV Electricity from photovoltaic cells.
Solar thermal SOLARTH Solar energy is the solar radiation exploited for hot water production and electricity generation, by:
• flat plate collectors, mainly of the thermosyphon type, for domes-tic hot water or for the seasonal heating of swimming pools
• solar thermal-electric plants
Passive solar energy for the direct heating, cooling and lighting of dwellings or other buildings is not included.
Tide, wave and ocean
TIDE Tide, wave and ocean represents the mechanical energy derived from tidal movement, wave motion or ocean current and exploited for electricity generation.
Wind WIND Wind energy represents the kinetic energy of wind exploited for electricity generation in wind turbines.
Heat pumps HEATPUMP Heat pumps should include the inputs and outputs to heat pumps corresponding to the amount of heat that is sold to third parties.
Electric boilers BOILER Electric boilers should include the inputs and outputs to electric boil-ers corresponding to the amount of heat that is sold to third parties.
Heat from chemical sources
CHEMHEAT Heat from chemical sources corresponds to heat originating from processes without input energy, such as a chemical reaction (e.g. the treatment of zinc oxide ore with hydrochloric acid). Note that waste heat originating from energy driven processes is not considered as a primary energy source and is included with the heat produced from the corresponding fuel.
30 - ENERGY STATISTICS OF OECD COUNTRIES: BEYOND 2020 DOCUMENTATION (2011 edition)
INTERNATIONAL ENERGY AGENCY
Electricity and heat Electricity is expressed in gigawatt hours and heat is expressed in terajoules.
Direct use of geothermal and solar thermal is in terajoules on a net calorific value basis. Product Short name Definition
Other sources OTHER Other sources includes production not included elsewhere such as fuel cells.
Electricity ELECTR Gross electricity production is measured at the terminals of all alter-nator sets in a station; it therefore includes the energy taken by station auxiliaries and losses in transformers that are considered in-tegral parts of the station.
The difference between gross and net production is generally esti-mated as 7% for conventional thermal stations, 1% for hydro stations, and 6% for nuclear, geothermal and solar stations. Produc-tion in hydro stations includes production from pumped storage plants.
Heat HEAT Heat production includes all heat produced by main activity pro-ducer CHP and heat plants, as well as heat sold by autoproducer CHP and heat plants to third parties.
Fuels used to produce quantities of heat for sale are included in transformation processes under the rows CHP plants and Heat plants. The use of fuels for heat which is not sold is included under the sectors in which the fuel use occurs.

ENERGY STATISTICS OF OECD COUNTRIES: BEYOND 2020 DOCUMENTATION (2011 edition) - 31
INTERNATIONAL ENERGY AGENCY
4. GEOGRAPHICAL COVERAGE
Countries and regions Country/Region Short name Definition
Australia AUSTRALI Excludes the overseas territories.
Austria AUSTRIA
Belgium BELGIUM
Canada CANADA
Chile CHILE
Czech Republic CZECH
Denmark DENMARK Excludes Greenland and the Danish Faroes, except prior to 1990, where data on oil for Greenland were included with the Danish sta-tistics. The Administration is planning to revise the series back to 1974 to exclude these amounts.
Estonia ESTONIA
Finland FINLAND
France FRANCE Includes Monaco, and excludes the following overseas departments and territories: Guadeloupe, Guyana, Martinique, New Caledonia, French Polynesia, Reunion, and St.-Pierre and Miquelon.
Germany GERMANY Includes the new federal states of Germany from 1970 onwards.
Greece GREECE
Hungary HUNGARY
Iceland ICELAND
Ireland IRELAND
Israel ISRAEL The statistical data for Israel are supplied by and under the responsi-bility of the relevant Israeli authorities. The use of such data by the OECD is without prejudice to the status of the Golan Heights, East Jerusalem and Israeli settlements in the West Bank under the terms of international law.
Italy ITALY Includes San Marino and the Vatican.
Japan JAPAN Includes Okinawa.

32 - ENERGY STATISTICS OF OECD COUNTRIES: BEYOND 2020 DOCUMENTATION (2011 edition)
INTERNATIONAL ENERGY AGENCY
Countries and regions Country/Region Short name Definition
Korea KOREA
Luxembourg LUXEMBOU
Mexico MEXICO
Netherlands NETHLAND Excludes Suriname and the Netherlands Antilles.
New Zealand NZ
Norway NORWAY
Poland POLAND
Portugal PORTUGAL Includes the Azores and Madeira.
Slovak Republic SLOVAKIA
Slovenia SLOVENIA
Spain SPAIN Includes the Canary Islands.
Sweden SWEDEN
Switzerland SWITLAND Includes Liechtenstein for the oil data. Data for other fuels do not include Liechtenstein.
Turkey TURKEY
United Kingdom UK Shipments of coal and oil to the Channel Islands and the Isle of Man from the United Kingdom are not classed as exports. Supplies of coal and oil to these islands are, therefore, included as part of UK supply. Exports of natural gas to the Isle of Man are included with the exports to Ireland.
United States USA Includes the 50 states and the District of Columbia. Oil statistics as well as coal trade statistics also include Puerto Rico, Guam, the U.S. Virgin Islands, American Samoa, Johnston Atoll, Midway Islands, Wake Island and the Northern Mariana Islands.
OECD Total OECDTOT Includes Australia, Austria, Belgium, Canada, Chile, the Czech Republic, Denmark, Estonia, Finland, France, Germany, Greece, Hungary, Iceland, Ireland, Israel, Italy, Japan, Korea, Luxembourg, Mexico, the Netherlands, New Zealand, Norway, Poland, Portugal, the Slovak Republic, Slovenia, Spain, Sweden, Switzerland, Turkey, the United Kingdom and the United States.
Estonia and Slovenia are included starting in 1990. Prior to 1990, data for Estonia are included in Former Soviet Union and data for Slovenia in Former Yugoslavia in the publication Energy Statistics of Non-OECD Countries.
OECD Americas OECDAM Includes Canada, Chile, Mexico and the United States.
OECD Asia Oceania OECDAO Includes Australia, Israel, Japan, Korea and New Zealand.

ENERGY STATISTICS OF OECD COUNTRIES: BEYOND 2020 DOCUMENTATION (2011 edition) - 33
INTERNATIONAL ENERGY AGENCY
Countries and regions Country/Region Short name Definition
OECD Europe OECDEUR Includes Austria, Belgium, the Czech Republic, Denmark, Estonia, Finland, France, Germany, Greece, Hungary, Iceland, Ireland, Italy, Luxembourg, the Netherlands, Norway, Poland, Portugal, the Slovak Republic, Slovenia, Spain, Sweden, Switzerland, Turkey and the United Kingdom.
Estonia and Slovenia are included starting in 1990. Prior to 1990, data for Estonia are included in Former Soviet Union and data for Slovenia in Former Yugoslavia in the publication Energy Statistics of Non-OECD Countries.
IEA IEATOT Includes Australia, Austria, Belgium, Canada, the Czech Republic, Denmark, Finland, France, Germany, Greece, Hungary, Ireland, Italy, Japan, Korea, Luxembourg, the Netherlands, New Zealand, Norway, Poland, Portugal, the Slovak Republic, Spain, Sweden, Switzerland, Turkey, the United Kingdom and the United States.


ENERGY STATISTICS OF OECD COUNTRIES: BEYOND 2020 DOCUMENTATION (2011 edition) - 35
INTERNATIONAL ENERGY AGENCY
5. COUNTRY NOTES
General Notes
In general, more detailed notes are available for data starting in 1990.
Prior to 1974, most fuel inputs and electricity and heat outputs for autoproducers are included in main activ-ity producers. The figures for the quantities of fuels used for the generation of electricity and heat and the corresponding outputs in CHP and heat plants should be used with caution. Despite estimates introduced by the Secretariat, inputs and outputs are not always con-sistent. Please refer to notes below under Electricity and Heat.
Data for anthracite, coking coal, other bituminous coal, sub-bituminous coal and lignite are available separately from 1978. Prior to 1978, only data for hard coal and lignite/sub-bituminous coal are available.
In 1996, the IEA Secretariat extensively revised data on coal and coke use in blast furnaces, and in the iron and steel industry (for those countries with blast fur-naces), based on data provided to the OECD Steel Committee and other sources. The quantities of fuels transformed into blast furnace gas have been esti-mated by the IEA Secretariat based on its blast furnace model.
Moreover, in 1996 and 1997, the IEA Secretariat extensively revised data on biofuels and waste (i.e. solid biofuels, biogases, liquid biofuels, industrial waste and municipal waste) based on data from Euro-stat (for the EU-15 Member countries) and on other national sources for other OECD Member countries. As consumption data for biofuels and waste from Eurostat are generally available from 1989, there may be breaks in series between 1988 and 1989 for some EU Member countries. Generally data on biofuels and waste are reported in non-specified prior to 1989 for EU Member countries.
Australia
All data refer to the fiscal year (e.g. July 2008 to June 2009 for 2009). For the 2002 data, the Australian Administration started to use a new survey methodol-ogy which caused shifts in the structure of industry consumption. The Australian Administration is plan-ning to revise the historical series.
Coal: Data on blast furnace gas for electricity produc-tion by autoproducers begins in 1986. Consumption in wood and wood products is included in paper, pulp and print from 2001 onwards. The drop in BKB pro-duction in 2004 was due to a fire in the main production plant. Only anthracite for export is re-ported separately; the remainder that is consumed domestically is included with coking coal and other bituminous coal.
Biofuels and Waste: For biofuels and waste, a differ-ent industry consumption breakdown is available from 1996 and leads to breaks in series. Biogas production at sewage treatment works is unavailable.
Oil: Negative refinery losses are caused by differ-ences in treatment of transfers between refineries. Imports of fuel oil have been estimated by the Austra-lian Administration. Prior to 1992, part of the NGL production is included in crude oil. The drop in the production of crude oil in 1999 is due to a gas explo-sion at the Longford plant. There is a break in the series for crude oil and NGL between 2001 and 2002.
Natural Gas: Prior to 1991, natural gas data include ethane. Data for 1999 and 2000 are estimated by the Australian Administration.
Electricity and Heat: Inputs and outputs from auto-producer CHP plants are not available prior to 1986. The production of electricity from wind is available from 1994. Electricity production from solar PV starts

36 - ENERGY STATISTICS OF OECD COUNTRIES: BEYOND 2020 DOCUMENTATION (2011 edition)
INTERNATIONAL ENERGY AGENCY
in 1992 and from solar thermal in 2003. Efficiencies used to calculate the solar thermal inputs to transfor-mation were chosen by the Australian Administration to be consistent with their national statistics. Prior to 1995, electricity production from biogases is included in natural gas. Heat data are not available from 1992 onwards. In 2002, the Australian Administration started to use a new survey methodology and reclassified the types of plants between main activity producers and autoproducers.
Prior to 2007, electricity consumption in mining and quarrying includes consumption in liquefaction/regasification plants. From 1990 to 2007, electricity consumption in wood and wood products is included together with paper, pulp and printing.
Austria
Historical revisions by the Austrian Administration have resulted in some breaks in series between 1989 and 1990.
Coal: In the 2011 edition, the Austrian Administration has revised the consumption data for coke oven coke from 1999 and lignite from 2001. Other bituminous coal includes hard coal briquettes. "Trockenkohle" is included with BKB because of its high calorific value. Since 1996, gas works gas is reported with natural gas because it is distributed in the same network. The amount of gas works gas is negligible and it is mostly consumed by households. The last lignite mine closed in the second quarter of 2004 and lignite use for power generation ceased in 2006.
Biofuels and Waste: Data for 1986 to 1989 for solid biofuels, industrial waste, biogases and liquid biofuels are IEA Secretariat estimates based on information published by OSTAT in Energieversongung Österreichs Endgültige Energiebilanz. Due to a change in the survey methodology, the heat produced in small plants (capacity inferior to 1 MW) is not re-ported starting in 2002. Prior to 2002, data for biogases only include plants of 1 MW or larger.
Oil: Prior to 1990, a portion of naphtha is included with other oil products.
Natural Gas: The break in the time series for auto-producer electricity and CHP plants between 1995 and 1996 is due to the availability of more detailed data from 1996 onwards. Differences due to measurement are included with losses prior to 2000. There are in-consistencies in the time series for commercial/public
services as this sub-sector is the residual of the con-sumption data. In the 2011 edition, many consumption sub-sectors have been revised back to 1999 as a result of a new methodology.
Electricity and Heat: Starting in 1990, small amounts of electricity used in heat pumps have been included in residential. There are breaks in series between 1995 and 1996 and between 1998 and 1999 due to new methods of survey. Heat from chemical processes used for electricity production is available from 2004. Electricity plants data may include some CHP plants operating in electricity only mode.
Inputs of other oil products to autoproducer CHP plants were reclassified as refinery gas and natural gas in 2009. Revisions to the historical time series are planned by the Austrian Administration. Electricity consumption in oil refineries includes consumption in gas works prior to 1991. Also prior to 1991, electricity consumption in the iron and steel industry includes consumption in coke ovens and blast furnaces. Con-sumption in commercial/public services includes electricity used in the field of electricity supply, dis-trict heating and water supply prior to 1990. Starting in 1990, consumption of electric energy in the field of electricity supply, district heating and water supply are included in other energy industry own use. Elec-tricity consumption in non-specified transport represents tramways, electric buses, ski lifts and cable cars. For heat, own use is included in losses.
Belgium
Coal: Sub-bituminous coal data refer to recovered coal products. Production of other bituminous coal ceased on 31 August 1992. Production from other sources re-fers to recuperation of coal from coal dumps. The use of coke oven gas in chemical and petrochemical ceased in 1996. The decrease of bituminous coal and coke oven coke in the iron and steel industry in 2002 is due to the closure of several plants.
Biofuels and Waste: In 2003, combustion of munici-pal waste for electricity and heat generation purposes increased significantly. However, because a large por-tion of the heat produced is not used (sold), plant efficiencies dropped significantly between 2002 and 2003. Data for biodiesels are available starting in 2007. Data for biogasoline are available starting in 2008.

ENERGY STATISTICS OF OECD COUNTRIES: BEYOND 2020 DOCUMENTATION (2011 edition) - 37
INTERNATIONAL ENERGY AGENCY
Oil: The decrease of fuel oil in industry consumption since 1993 is due to the introduction of an excise tax as well as increased use of natural gas. In 2002, patent fuel plants used fuel oil to increase the calorific value of patent fuel.
Natural Gas: The large decrease in non-specified in-dustry in 2003 is due to improvements in data collection. New legislation for data collection has led to breaks in series for industry and energy industry own use between 2004 and 2005, and between 2007 and 2008. In the 2011 edition, gas trade in Belgium includes imported LNG which is regasified and sub-sequently exported to other countries.
Electricity and Heat: For 1998 and 1999, electricity production at CHP plants with annual heat output be-low 0.5 TJ is reported with electricity only plants. In 2000, most autoproducer electricity plants using com-bustible fuels were reclassified as autoproducer CHP plants; the heat production from these plants was used for internal industrial processes and not sold to third parties until 2005. Heat from chemical processes used for electricity production is available from 2005.
Breaks in series exist between 1991 and 1992 for heat consumption in chemical and non-specified industry. Breaks in series may exist between 2007 and 2008 due to revisions of NACE classifications. There is no heat consumption starting in 2007 in the iron and steel indus-try because the installation concerned became an autoproducer in July 2006 and the heat is no longer sold.
Canada
Revisions received by the Canadian Administration and incorporated into the 2002 edition have resulted in breaks in series between 1989 and 1990.
Coal: Due to a Canadian confidentiality law, it is not possible for the Canadian Administration to submit disaggregated series for all of the coal types. Between 2002 and 2006, the IEA Secretariat has estimated some of the missing series. The data for 2007 onwards are given directly as reported. The Canadian Admini-stration is planning to further refine its reporting.
Biofuels and Waste: The IEA Secretariat has esti-mated the data for industrial waste from 1990 to 2007, biogasoline (ethanol) from 1998 to 2004, municipal waste from 1990 to 2004, and landfill gas from 1997 to 2006 based on information supplied by Natural Resources Canada. The IEA Secretariat estimated landfill gas production and consumption for 2007 from information supplied by Environment Canada,
Waste Management. Trade of solid biofuels may be included in production or consumption. The Canadian Administration is working on separating out the data and reporting the trade explicitly. For the 2011 edition, the Canadian Administration revised solid biofuels from 1990, amongst others to include wood pellets.
Oil: From 1988 onwards, data for several industrial sub-sectors are no longer available. Transfers for naphtha and other oil products include purchases of feedstock and other additives from non-reporting companies. The reporting of LPG supply data changed starting in 1989. Production data, as well as products transferred, will therefore show changes in series between 1988 and 1989. Prior to 1990, LPG includes ethane and condensates (pentanes plus). Eth-ane is mainly used as a petrochemical feedstock. Prior to 1990, hydrogen used for the upgrading of synthetic crude oil production was included in natural gas sup-ply; from 1990, a different methodology was adopted by the Canadian Administration and these amounts are now shown in other hydrocarbons (part of crude oil). Canada imported orimulsion from Venezuela from 1994 to 2000.
Natural Gas: Starting in 1992, consumption of natu-ral gas in main activity producer CHP plants includes use in three new facilities in the province of Ontario. The data reported in non-specified transformation represent quantities of natural gas used for the upgrad-ing of refined oil products. In 2000, the increase in main activity producer electricity data is due to new generation plants in Alberta and Ontario, while the increase in autoproducer electricity is due to the addi-tion of independent power production.
Electricity and Heat: Heat production includes heat produced by nuclear power stations for distribution to other consumers. The breakdown of electricity and heat generation between natural gas and oil products in main activity producer CHP plants has been esti-mated by the Canadian Administration starting in 1990. This may cause breaks in the time series be-tween 1989 and 1990. In the 2010 edition, the Canadian Administration revised the heat consump-tion data, causing statistical differences; revisions to production are pending.
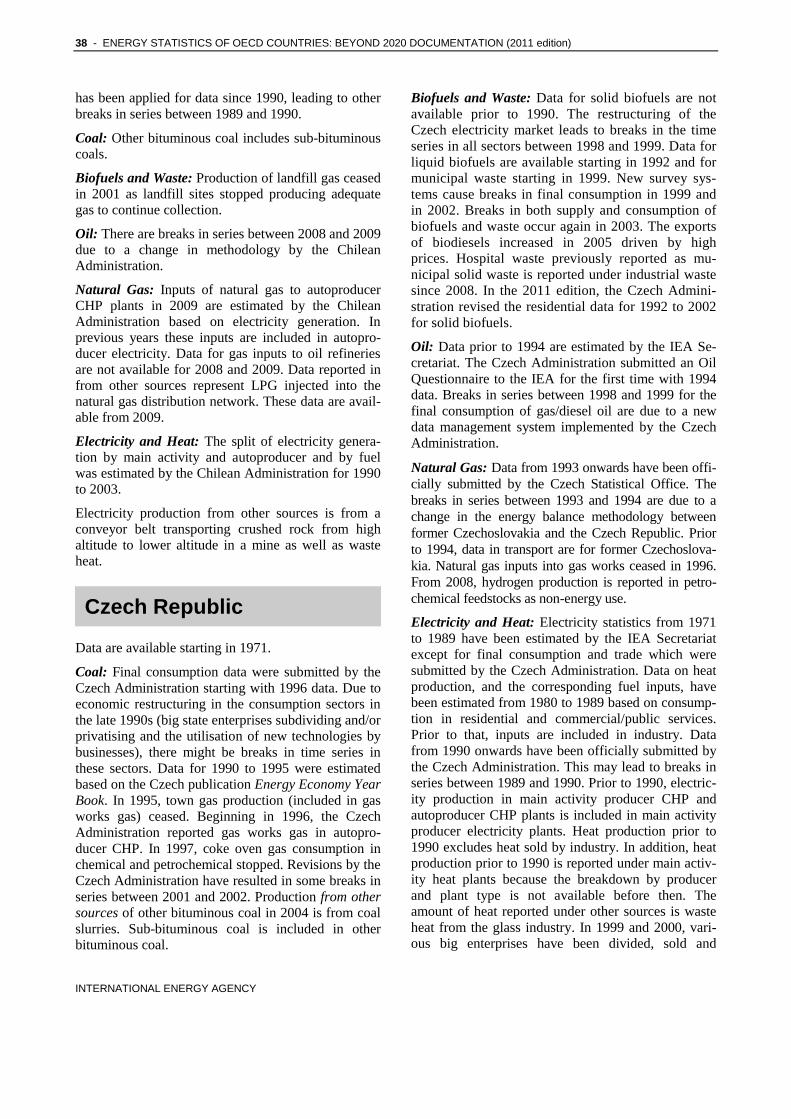
Chile
Data are available starting in 1971.
From 1990, consumption in paper and pulp includes forestry and consumption in agriculture is included in non-specified industry. In general, a new methodology
38 - ENERGY STATISTICS OF OECD COUNTRIES: BEYOND 2020 DOCUMENTATION (2011 edition)
INTERNATIONAL ENERGY AGENCY
has been applied for data since 1990, leading to other breaks in series between 1989 and 1990.
Coal: Other bituminous coal includes sub-bituminous coals.
Biofuels and Waste: Production of landfill gas ceased in 2001 as landfill sites stopped producing adequate gas to continue collection.
Oil: There are breaks in series between 2008 and 2009 due to a change in methodology by the Chilean Administration.
Natural Gas: Inputs of natural gas to autoproducer CHP plants in 2009 are estimated by the Chilean Administration based on electricity generation. In previous years these inputs are included in autopro-ducer electricity. Data for gas inputs to oil refineries are not available for 2008 and 2009. Data reported in from other sources represent LPG injected into the natural gas distribution network. These data are avail-able from 2009.
Electricity and Heat: The split of electricity genera-tion by main activity and autoproducer and by fuel was estimated by the Chilean Administration for 1990 to 2003.
Electricity production from other sources is from a conveyor belt transporting crushed rock from high altitude to lower altitude in a mine as well as waste heat.
Czech Republic
Data are available starting in 1971.
Coal: Final consumption data were submitted by the Czech Administration starting with 1996 data. Due to economic restructuring in the consumption sectors in the late 1990s (big state enterprises subdividing and/or privatising and the utilisation of new technologies by businesses), there might be breaks in time series in these sectors. Data for 1990 to 1995 were estimated based on the Czech publication Energy Economy Year Book. In 1995, town gas production (included in gas works gas) ceased. Beginning in 1996, the Czech Administration reported gas works gas in autopro-ducer CHP. In 1997, coke oven gas consumption in chemical and petrochemical stopped. Revisions by the Czech Administration have resulted in some breaks in series between 2001 and 2002. Production from other sources of other bituminous coal in 2004 is from coal slurries. Sub-bituminous coal is included in other bituminous coal.
Biofuels and Waste: Data for solid biofuels are not available prior to 1990. The restructuring of the Czech electricity market leads to breaks in the time series in all sectors between 1998 and 1999. Data for liquid biofuels are available starting in 1992 and for municipal waste starting in 1999. New survey sys-tems cause breaks in final consumption in 1999 and in 2002. Breaks in both supply and consumption of biofuels and waste occur again in 2003. The exports of biodiesels increased in 2005 driven by high prices. Hospital waste previously reported as mu-nicipal solid waste is reported under industrial waste since 2008. In the 2011 edition, the Czech Admini-stration revised the residential data for 1992 to 2002 for solid biofuels.
Oil: Data prior to 1994 are estimated by the IEA Se-cretariat. The Czech Administration submitted an Oil Questionnaire to the IEA for the first time with 1994 data. Breaks in series between 1998 and 1999 for the final consumption of gas/diesel oil are due to a new data management system implemented by the Czech Administration.
Natural Gas: Data from 1993 onwards have been offi-cially submitted by the Czech Statistical Office. The breaks in series between 1993 and 1994 are due to a change in the energy balance methodology between former Czechoslovakia and the Czech Republic. Prior to 1994, data in transport are for former Czechoslova-kia. Natural gas inputs into gas works ceased in 1996. From 2008, hydrogen production is reported in petro-chemical feedstocks as non-energy use.
Electricity and Heat: Electricity statistics from 1971 to 1989 have been estimated by the IEA Secretariat except for final consumption and trade which were submitted by the Czech Administration. Data on heat production, and the corresponding fuel inputs, have been estimated from 1980 to 1989 based on consump-tion in residential and commercial/public services. Prior to that, inputs are included in industry. Data from 1990 onwards have been officially submitted by the Czech Administration. This may lead to breaks in series between 1989 and 1990. Prior to 1990, electric-ity production in main activity producer CHP and autoproducer CHP plants is included in main activity producer electricity plants. Heat production prior to 1990 excludes heat sold by industry. In addition, heat production prior to 1990 is reported under main activ-ity heat plants because the breakdown by producer and plant type is not available before then. The amount of heat reported under other sources is waste heat from the glass industry. In 1999 and 2000, vari-ous big enterprises have been divided, sold and

ENERGY STATISTICS OF OECD COUNTRIES: BEYOND 2020 DOCUMENTATION (2011 edition) - 39
INTERNATIONAL ENERGY AGENCY
merged. This causes breaks in the time series of all types of plants. The new reporting methodology used by the Czech Administration for biofuels and wastes causes some breaks in time series between 2002 and 2003.
Denmark
In the 2004 edition, major revisions were made by the Danish Administration for the 1990 to 2001 data, which may cause breaks in time series between 1989 and 1990.
Biofuels and Waste: Fish oil used in main activity producer heat plants is included with solid biofuels. The number of heating companies burning wood chips that are equipped with boilers with flue-gas condensa-tion is increasing. This implies a very high efficiency of heat plants.
Oil: As of 1987, separate data for paraffin waxes are no longer available. Information on waste oil recy-cling and final consumption begins in 1989 and is reported in other oil products. Prior to 1990, Greenland and the Danish Faroes are included in the oil data. Also prior to 1990, gas/diesel oil consump-tion and fuel oil consumption for fishing are included in domestic navigation, while after this date they are reported in agriculture. Consumption data are based on a detailed survey sent to companies in Denmark every other year. For non-survey years, the consump-tion figures are estimated by the Danish Energy Agency. Due to better survey methods, inputs to elec-tricity and heat generation have been reclassified, causing a break in series between 1993 and 1994. The marked increase in inputs of fuel oil to CHP produc-tion in 1994 is due to increased electricity exports to Norway. Industry sector detail for 1994 and 1995 is based on a new survey. Orimulsion imports (used for electricity generation) began in 1995 and ceased in 2003. The oil inputs used in industrial sub-sectors for producing surplus heat, which is delivered to district heating networks, are allocated to these industrial sub-sectors.
Electricity and Heat: From 1984 onwards, small amounts of heat have been imported from Germany. Heat produced for sale by heat pumps starts in 1994. Prior to 1994 the electricity and heat production are estimated based on fuel inputs. The amount of heat reported under other sources is heat recovered from industrial processes and sold for district heating.
Electricity consumption in other energy industry own use includes consumption in district heating plants and use for the distribution of electricity.
In the 2011 edition, the Danish Administration revised heat production data, resulting in statistical differ-ences. Revisions to consumption are pending.
Estonia
Data for Estonia are available starting in 1990. Prior to that, they are included in Former Soviet Union in Energy Statistics of Non-OECD Countries.
Biofuels and Waste: Data for biogases include land-fill gas starting in 2005.
Oil: For the years 1990 to 2007, oil data are based on direct communication with Statistics Estonia and UN ECE.
Natural Gas: In 2009, Estonia’s main producer of fertilisers ceased activity, resulting in a sharp decrease in the non-energy use of natural gas.
Electricity and Heat: Data reported under lignite are for oil shale. From 1990 to 1999, some of the electric-ity and heat production are reported under other oil products while the inputs are reported under the indi-vidual fuels. Revisions to classify the electricity and heat production by oil product are pending. Inputs of residual fuel oil and gas works gas to the transforma-tion sector include shale oil.
Finland
A new survey system and a reclassification of the data lead to breaks in the time series between 1999 and 2000 for most products and sectors. The new survey system is more detailed and has better product coverage, especially in electricity, CHP and heat production, as well as in industry.
Coal: The first coking plant started operation in 1987, hence imports of coking coal and production of coke oven coke and coke oven gas started in that year. Coal tars used for non-energy purposes are not reported in production or consumption. The increase of other bi-tuminous coal inputs into main activity producer electricity plants from 1993 to 1994 was due to coal replacing imported electricity and hydro power. Pro-duction of gas works gas ceased in April 1994.
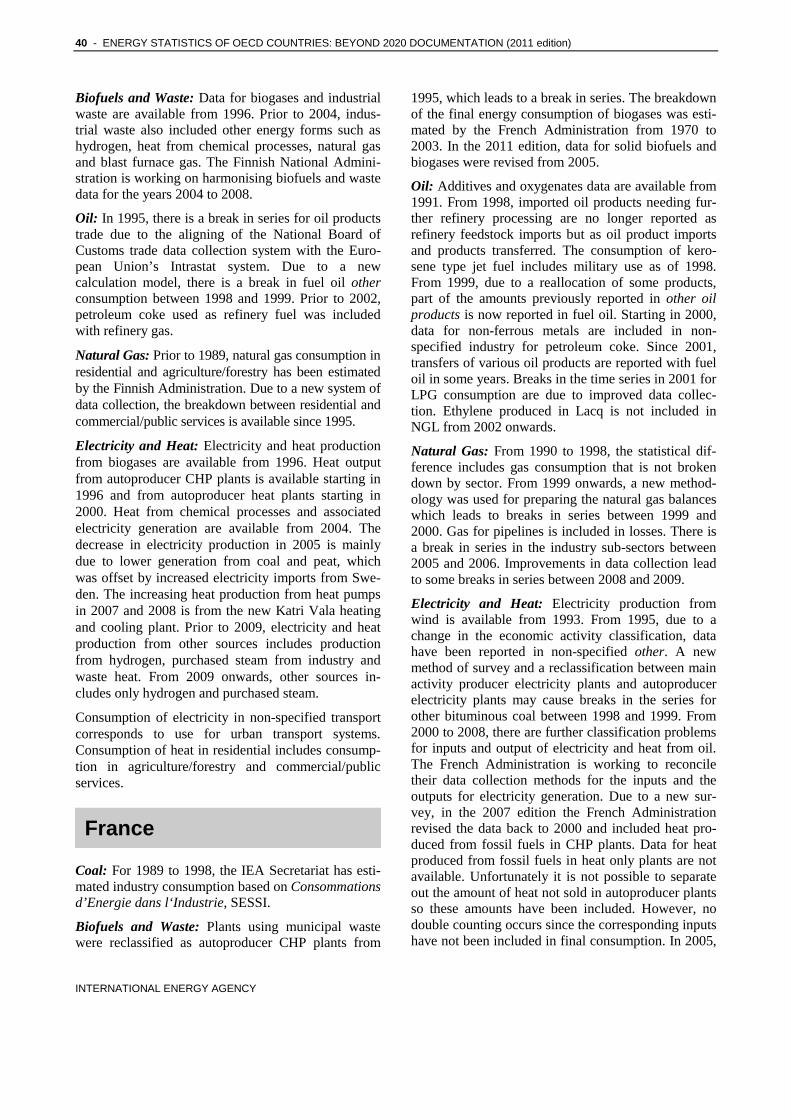
40 - ENERGY STATISTICS OF OECD COUNTRIES: BEYOND 2020 DOCUMENTATION (2011 edition)
INTERNATIONAL ENERGY AGENCY
Biofuels and Waste: Data for biogases and industrial waste are available from 1996. Prior to 2004, indus-trial waste also included other energy forms such as hydrogen, heat from chemical processes, natural gas and blast furnace gas. The Finnish National Admini-stration is working on harmonising biofuels and waste data for the years 2004 to 2008.
Oil: In 1995, there is a break in series for oil products trade due to the aligning of the National Board of Customs trade data collection system with the Euro-pean Union’s Intrastat system. Due to a new calculation model, there is a break in fuel oil other consumption between 1998 and 1999. Prior to 2002, petroleum coke used as refinery fuel was included with refinery gas.
Natural Gas: Prior to 1989, natural gas consumption in residential and agriculture/forestry has been estimated by the Finnish Administration. Due to a new system of data collection, the breakdown between residential and commercial/public services is available since 1995.
Electricity and Heat: Electricity and heat production from biogases are available from 1996. Heat output from autoproducer CHP plants is available starting in 1996 and from autoproducer heat plants starting in 2000. Heat from chemical processes and associated electricity generation are available from 2004. The decrease in electricity production in 2005 is mainly due to lower generation from coal and peat, which was offset by increased electricity imports from Swe-den. The increasing heat production from heat pumps in 2007 and 2008 is from the new Katri Vala heating and cooling plant. Prior to 2009, electricity and heat production from other sources includes production from hydrogen, purchased steam from industry and waste heat. From 2009 onwards, other sources in-cludes only hydrogen and purchased steam.
Consumption of electricity in non-specified transport corresponds to use for urban transport systems. Consumption of heat in residential includes consump-tion in agriculture/forestry and commercial/public services.
France
Coal: For 1989 to 1998, the IEA Secretariat has esti-mated industry consumption based on Consommations d’Energie dans l‘Industrie, SESSI.
Biofuels and Waste: Plants using municipal waste were reclassified as autoproducer CHP plants from
1995, which leads to a break in series. The breakdown of the final energy consumption of biogases was esti-mated by the French Administration from 1970 to 2003. In the 2011 edition, data for solid biofuels and biogases were revised from 2005.
Oil: Additives and oxygenates data are available from 1991. From 1998, imported oil products needing fur-ther refinery processing are no longer reported as refinery feedstock imports but as oil product imports and products transferred. The consumption of kero-sene type jet fuel includes military use as of 1998. From 1999, due to a reallocation of some products, part of the amounts previously reported in other oil products is now reported in fuel oil. Starting in 2000, data for non-ferrous metals are included in non-specified industry for petroleum coke. Since 2001, transfers of various oil products are reported with fuel oil in some years. Breaks in the time series in 2001 for LPG consumption are due to improved data collec-tion. Ethylene produced in Lacq is not included in NGL from 2002 onwards.
Natural Gas: From 1990 to 1998, the statistical dif-ference includes gas consumption that is not broken down by sector. From 1999 onwards, a new method-ology was used for preparing the natural gas balances which leads to breaks in series between 1999 and 2000. Gas for pipelines is included in losses. There is a break in series in the industry sub-sectors between 2005 and 2006. Improvements in data collection lead to some breaks in series between 2008 and 2009.
Electricity and Heat: Electricity production from wind is available from 1993. From 1995, due to a change in the economic activity classification, data have been reported in non-specified other. A new method of survey and a reclassification between main activity producer electricity plants and autoproducer electricity plants may cause breaks in the series for other bituminous coal between 1998 and 1999. From 2000 to 2008, there are further classification problems for inputs and output of electricity and heat from oil. The French Administration is working to reconcile their data collection methods for the inputs and the outputs for electricity generation. Due to a new sur-vey, in the 2007 edition the French Administration revised the data back to 2000 and included heat pro-duced from fossil fuels in CHP plants. Data for heat produced from fossil fuels in heat only plants are not available. Unfortunately it is not possible to separate out the amount of heat not sold in autoproducer plants so these amounts have been included. However, no double counting occurs since the corresponding inputs have not been included in final consumption. In 2005,
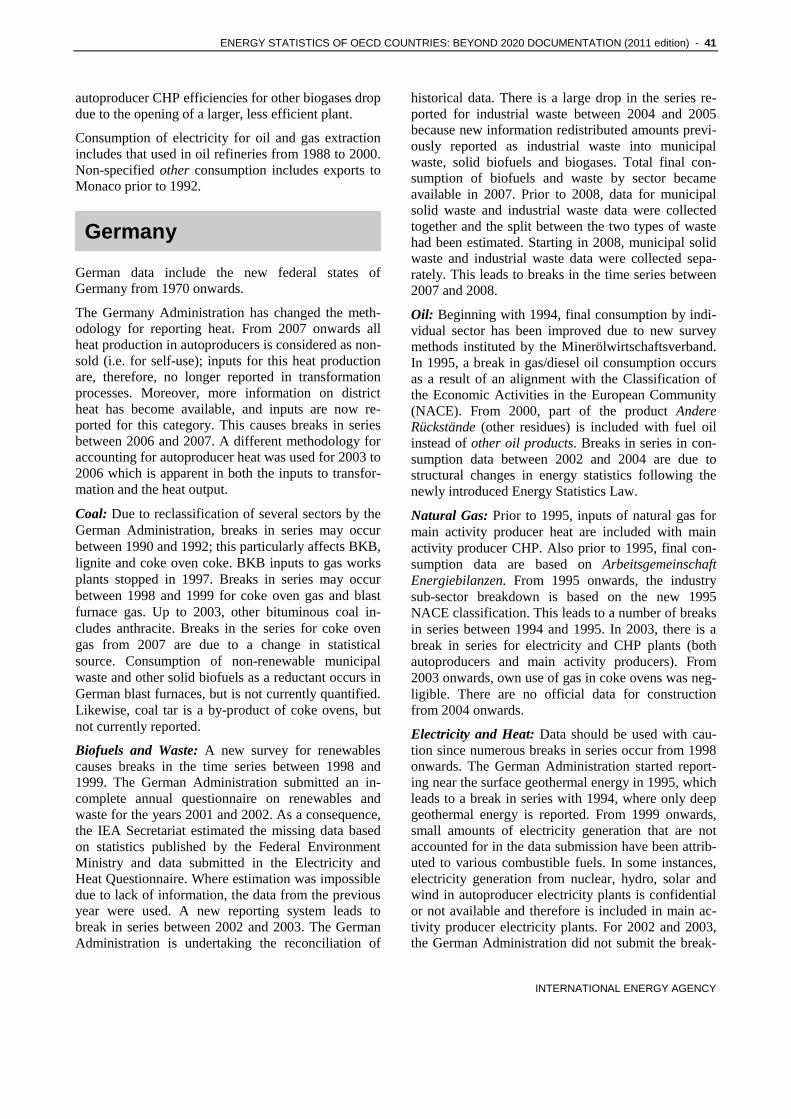
ENERGY STATISTICS OF OECD COUNTRIES: BEYOND 2020 DOCUMENTATION (2011 edition) - 41
INTERNATIONAL ENERGY AGENCY
autoproducer CHP efficiencies for other biogases drop due to the opening of a larger, less efficient plant.
Consumption of electricity for oil and gas extraction includes that used in oil refineries from 1988 to 2000. Non-specified other consumption includes exports to Monaco prior to 1992.
Germany
German data include the new federal states of Germany from 1970 onwards.
The Germany Administration has changed the meth-odology for reporting heat. From 2007 onwards all heat production in autoproducers is considered as non-sold (i.e. for self-use); inputs for this heat production are, therefore, no longer reported in transformation processes. Moreover, more information on district heat has become available, and inputs are now re-ported for this category. This causes breaks in series between 2006 and 2007. A different methodology for accounting for autoproducer heat was used for 2003 to 2006 which is apparent in both the inputs to transfor-mation and the heat output.
Coal: Due to reclassification of several sectors by the German Administration, breaks in series may occur between 1990 and 1992; this particularly affects BKB, lignite and coke oven coke. BKB inputs to gas works plants stopped in 1997. Breaks in series may occur between 1998 and 1999 for coke oven gas and blast furnace gas. Up to 2003, other bituminous coal in-cludes anthracite. Breaks in the series for coke oven gas from 2007 are due to a change in statistical source. Consumption of non-renewable municipal waste and other solid biofuels as a reductant occurs in German blast furnaces, but is not currently quantified. Likewise, coal tar is a by-product of coke ovens, but not currently reported.
Biofuels and Waste: A new survey for renewables causes breaks in the time series between 1998 and 1999. The German Administration submitted an in-complete annual questionnaire on renewables and waste for the years 2001 and 2002. As a consequence, the IEA Secretariat estimated the missing data based on statistics published by the Federal Environment Ministry and data submitted in the Electricity and Heat Questionnaire. Where estimation was impossible due to lack of information, the data from the previous year were used. A new reporting system leads to break in series between 2002 and 2003. The German Administration is undertaking the reconciliation of
historical data. There is a large drop in the series re-ported for industrial waste between 2004 and 2005 because new information redistributed amounts previ-ously reported as industrial waste into municipal waste, solid biofuels and biogases. Total final con-sumption of biofuels and waste by sector became available in 2007. Prior to 2008, data for municipal solid waste and industrial waste data were collected together and the split between the two types of waste had been estimated. Starting in 2008, municipal solid waste and industrial waste data were collected sepa-rately. This leads to breaks in the time series between 2007 and 2008.
Oil: Beginning with 1994, final consumption by indi-vidual sector has been improved due to new survey methods instituted by the Minerölwirtschaftsverband. In 1995, a break in gas/diesel oil consumption occurs as a result of an alignment with the Classification of the Economic Activities in the European Community (NACE). From 2000, part of the product Andere Rückstände (other residues) is included with fuel oil instead of other oil products. Breaks in series in con-sumption data between 2002 and 2004 are due to structural changes in energy statistics following the newly introduced Energy Statistics Law.
Natural Gas: Prior to 1995, inputs of natural gas for main activity producer heat are included with main activity producer CHP. Also prior to 1995, final con-sumption data are based on Arbeitsgemeinschaft Energiebilanzen. From 1995 onwards, the industry sub-sector breakdown is based on the new 1995 NACE classification. This leads to a number of breaks in series between 1994 and 1995. In 2003, there is a break in series for electricity and CHP plants (both autoproducers and main activity producers). From 2003 onwards, own use of gas in coke ovens was neg-ligible. There are no official data for construction from 2004 onwards.
Electricity and Heat: Data should be used with cau-tion since numerous breaks in series occur from 1998 onwards. The German Administration started report-ing near the surface geothermal energy in 1995, which leads to a break in series with 1994, where only deep geothermal energy is reported. From 1999 onwards, small amounts of electricity generation that are not accounted for in the data submission have been attrib-uted to various combustible fuels. In some instances, electricity generation from nuclear, hydro, solar and wind in autoproducer electricity plants is confidential or not available and therefore is included in main ac-tivity producer electricity plants. For 2002 and 2003, the German Administration did not submit the break-
42 - ENERGY STATISTICS OF OECD COUNTRIES: BEYOND 2020 DOCUMENTATION (2011 edition)
INTERNATIONAL ENERGY AGENCY
down of electricity and heat production from combus-tible fuels. The data were estimated as follows: renewables and waste were taken from the Renew-ables and Waste Questionnaire and the other combustible fuels were estimated pro rata based on 2001 estimates. Electricity production in electricity plants includes production from CHP plants prior to 2003. Due to the implementation of the Energy Statis-tics Act, collection concerning heat produced in heat plants and district heating plants became more effi-cient and more complete. This leads to breaks in series between 2002 and 2003 and between 2003 and 2004. Prior to 1993, all heat production from BKB/peat briquettes is included in main activity producer CHP plants. Detailed data by fuel are not available for total heat production. The non-allocated part is re-ported as heat production from non-specified combustible fuels. In 2007, many main activity CHP plants that burn biofuels and waste were reclassified as electricity only which result in breaks in the time series between 2006 and 2007. Electricity production from other sources is available starting in 2009. This refers to the production of electricity from turbines which are located at pressure drops in fluid transport and from purchased waste heat.
The German Federal Statistics Office reclassified some industrial branches which may cause a break in series in industry sub-sectors between 1994 and 1995. Revisions from the German Administration to the electricity consumption data may cause breaks in the time series between 1999 and 2000. The breakdown of heat consumption is not available from 2003 to 2006. The data for that period were estimated as fol-lows: the transformation processes and losses were estimated based on previous years, the heat produced by autoproducers was included in non-specified in-dustry, and the remaining consumption included in non-specified other.
Greece
Coal: Production of gas works gas ceased in 1997. Lignite is used in main activity producer CHP plants since 1997. Production of BKB/peat briquettes ceased in 2009.
Biofuels and Waste: Solid biofuel consumption in commercial/public services is included in residential. Data for biogases are available from 1990 and data for industrial waste from 1992. New information on solid biofuels is available from 1996 and leads to breaks between 1995 and 1996. Inputs of solid biofuels to
charcoal production are estimated by the IEA Secretariat assuming an efficiency of 40%.
Oil: Data on feedstocks for cracking in refineries are available from 1986. Crude oil production stopped on 30 November 1998 and started again in December 1999.
Natural Gas: Natural gas produced in Greece has a higher than average gross calorific value due to a high content of C2/C4 hydrocarbons. In 1997, a new pipe-line between Russia and Greece became operational. In 1998, consumption in residential is included with commercial/public services. Production of natural gas stopped on 30 November 1998 and started again in December 1999.
Electricity and Heat: A break in series exists between 1991 and 1992 for electricity consumption in trans-port. Data on biofuels and waste are available from 1992. Production or consumption of distributed heat (heat sold) that is produced from lignite is available from 1997.
Direct use of geothermal heat in residential is avail-able starting in 2004.
Hungary
Data are available starting in 1965.
Coal: Due to sale of an autoproducer power plant, breaks in series occur for coke oven gas and blast fur-nace gas between 1997 and 1998. From 1990, the production of sub-bituminous coal has been included with lignite due to the low quality of the coal. The use of this domestic coal in main activity producer elec-tricity and CHP plants has also been reclassified to lignite.
Biofuels and Waste: Data for biogases are available from 2000.
Oil: The Hungarian Administration submitted ques-tionnaires to the IEA Secretariat for the first time with 1993 data. Prior to 1993, white spirit is included in motor gasoline. Data for additives and aviation gaso-line are available starting from 1998.
Natural Gas: Due to a new methodology, some breaks in series exist between 1996 and 1997. From 1997, two autoproducer heat plants have been reclas-sified to main activity producer heat plants. Prior to 2004, iron and steel consumption includes transforma-tion of natural gas in blast furnaces.

ENERGY STATISTICS OF OECD COUNTRIES: BEYOND 2020 DOCUMENTATION (2011 edition) - 43
INTERNATIONAL ENERGY AGENCY
Electricity and Heat: The revision of heat production data to conform to IEA reporting methodologies may result in a mismatch of fuel inputs with electricity and heat outputs by plant type, which could cause high efficiencies. Electricity and heat production from solid biofuels in autoproducer CHP plants is available from 1995. Geothermal heat production from main activity producer heat plants is also available from 1995. The Hungarian Administration reclassified some of their plants for 1996 and 2000 which may lead to breaks in the time series. Prior to 2000, electricity output from sub-bituminous coal is included with lignite.
Direct use of geothermal heat is available from 1990. Direct use of solar thermal heat is available from 2001.
Iceland
Coal: Final consumption increased in 2000 due to a new iron and steel plant coming on-line. Coal data for 2008 and 2009 are estimated by the IEA Secretariat.
Biofuels and Waste: The use of municipal waste to produce heat is available from 1993.
Oil: Oil supply and consumption data for 2008 and 2009 are estimated by the IEA Secretariat.
Electricity and Heat: Electricity production from geo-thermal sources in main activity producer CHP plants is available from 1992. Heat production from munici-pal waste is available from 1993. In 1998, 60 MW of generating capacity was installed in the geothermal CHP plant at Nesjavellir. Since the plant was inoper-able for four months, production of geothermal heat decreased compared to 1997. The extra electricity capacity caused electricity production from geother-mal to almost double over the same period. In 2002, the increase of heat produced by geothermal was due to the installation of a third unit at the Nesjavellir CHP power plant. The increase in hydro and geother-mal electricity production from 2007 is due to the expansion of the aluminium industry.
Energy industry own use of electricity refers mainly to the use of electricity by the geothermal industry to pump geothermal water from underground sources. The consumption of electricity reported in non-specified other corresponds to a NATO base at Keflavik airport which closed in 2005. The increase of electric-ity consumption in construction from 2004 to 2007 is due to the drilling of tunnels for the Kárahnjúkar power plant. Starting in 2007, the Icelandic
Administration decided not to estimate the allocation of geothermal consumption amongst the sub-sectors of industry as they had done from 1999 to 2006 and instead reported all industry consumption under non-specified industry. Prior to 2008, all heat for space heating was reported in residential. From 2008 a por-tion is estimated to be consumed in commercial and public services.
Ireland
Coal: The production of gas works gas ceased in 1987 due to fuel switching to natural gas. Other bituminous coal inputs to main activity producer electricity plants increased from 1986 due to three new generating units at Moneypoint coming on-line. A reclassification causes a break in the series for peat consumption in the energy industry own use in BKB plants from 1989 to 1990. Patent fuel data from 2007 are confidential.
Biofuels and Waste: Data for solid biofuels and bio-gases are available from 1990. Data for municipal waste are available from 2009. In 2009, production and trade of biogasoline and biodiesels cannot be dis-tinguished due to confidentiality issues.
Oil: Consumption in commercial/public services in-cludes quantities used by state-owned agricultural companies. Consumption data collected for 1993 are based on a detailed survey. Data for historical years back to 1990 were revised by the National Admini-stration based on the results of this survey. Owing to these revisions, breaks in series exist between 1989 and 1990 in the detailed consumption data for LPG, kerosene, gas/diesel oil and fuel oil. There is a break in series between 2006 and 2007 for white spirit, lu-bricants, bitumen and paraffin waxes due to a new methodology being applied to sectoral demand by Sustainable Energy Ireland (SEI). There is a break in series between 2008 and 2009 for LPG, kerosene type jet fuel, gas/diesel oil and petroleum coke due to a new methodology being applied to sectoral demand by Sustainable Energy Ireland.
Natural Gas: The large increase in imports since 1996 is due to the depletion of the Kinsale gas field and the availability of a new pipeline system to the United Kingdom. The decrease in natural gas con-sumption in the iron and steel industry from 2001 onwards is due to the shutdown of Ireland’s main steel plant. Feedstock use in the petrochemical industry stopped in 2003, due to the shutdown of a fertiliser plant.

44 - ENERGY STATISTICS OF OECD COUNTRIES: BEYOND 2020 DOCUMENTATION (2011 edition)
INTERNATIONAL ENERGY AGENCY
Electricity and Heat: Electricity production from wind begins in 1992.
Direct use of solar thermal heat is available from 1990.
The decrease of electricity consumption in the iron and steel industry from 2001 onwards is due to the fact that the main steel plant in Ireland ceased produc-tion. In accordance with ISIC definitions, electricity used for urban transport has been included in non-specified transport. The increase in 2004 is due to the new light rail transit system in Dublin.
Israel
Data are available starting in 1971.
Coal: Data for oil shale are included with lignite.
Biofuels and Waste: For 2009, other liquid biofuel and municipal waste inputs to transformation are es-timated by the IEA Secretariat.
Oil: From 2007 to 2009, oil data are estimated by the IEA Secretariat based on information from the Ministry of National Infrastructures.
Natural Gas: Imports of natural gas began in 2008.
Electricity and Heat: Electricity production from wind begins in 2001. Data on the breakdown of hydroelectric plants are available from 2008. For 2009, solar photo-voltaic electricity generation is estimated.
Italy
In the 2011 edition, industry and transformation data were revised for 2004 to 2007 according to the same methodology as used in 2008 and 2009. This leads to breaks in series between 2003 and 2004.
Coal: From 1986 onwards, figures from lignite are given using the same methodology as in the Bilancio Energetico Nazionale. In 1991, all industrial activities were reclassified on the basis of ISTAT/NACE 91. This has implied some transfers of activities which may result in some anomalies between 1991 and ear-lier years. Due to a change in the survey system, breaks in series may occur between 1997 and 1998 for final consumption. Prior to 2009, sub-bituminous coal used in main activity electricity plants was included with other bituminous coal.
Biofuels and Waste: Data for biofuels and waste were reclassified in 2008, which result in several breaks in
the time series for transformation. Data collection for wood and other solid biofuels consumption by sector was improved in 2008.
Oil: Inputs to electricity and heat generation have been estimated by the IEA Secretariat for the years 1984 to 1997 based on submissions of the Electricity and Heat Questionnaire. All other data for the years 1992 to 1997 and the detailed consumption break-down for other years have been estimated by the IEA Secretariat based on Bilancio Energetico Nazionale. Due to new surveys, breaks appear in the consumption series between 1998 and 1999. For gas/diesel oil, non-specified use is included in commercial/public ser-vices. In the 2010 edition, the split between international marine bunkers and domestic navigation was revised from 1996 for fuel oil and from 1999 for gas/diesel due to a new survey, causing a break in series in these years. For LPG, a new disaggregation between residential and commercial/public services has been applied starting in 2005. From 2009 on-wards, transfers of lubricants could not be disaggregated from refinery output data, which results in increased production of non-specified oil products.
Natural Gas: The production of gas works gas from natural gas ceased in 1996. Prior to 2008, inputs of natural gas for useful heat production in industry are reported in final consumption. Except for liquefaction plants, data in the energy sector are estimated and include statistical differences and other non-specified consumption.
Electricity and Heat: Prior to 2004 electricity produc-tion from orimulsion is confidential and is included with fuel oil. From 2000 onwards, the Italian Admini-stration defines electricity and heat production from autoproducers as generation from producers that con-sume more than 70% of their own electricity production. However, for the 2000 to 2002 period, all electricity production from autoproducers is reported with main activity producers. With the introduction of a new survey in 2008, amounts of naphtha and other kerosene that were previously included in other oil products have been reported separately in autopro-ducer CHP plants. The production of electricity reported in the category other fuel sources refers to electricity produced from turbines which are located at pressure drops in fluid transport. Heat production is reported starting in 2004 and includes self-generation in industry.
Other energy industry own use includes electricity consumption for blast furnaces. From 2000 it also
ENERGY STATISTICS OF OECD COUNTRIES: BEYOND 2020 DOCUMENTATION (2011 edition) - 45
INTERNATIONAL ENERGY AGENCY
includes consumption for the distribution of gas and prior to 1989 consumption for uranium extraction. The breakdown of heat consumption by sector has been estimated by the Italian Administration.
The methodology of data collection for photovoltaic electricity production changed in 2009 and the distinc-tion between main activity and autoproducer plants could not be determined, causing a break in the time series. The Italian Administration plans to revise the photovoltaic electricity time series for the next cycle.
Japan
Between 2004 and 2007, the IEA received a series of revisions from the Japanese Administration. The first set of revisions received in 2004 increased the 1990 supply by 5% for coal, 2% for natural gas and 0.7% for oil compared to the previous data. This led to an increase of 2.5% in 1990 CO2 emissions calculated using the Reference Approach while the Sectoral Ap-proach remained fairly constant. For the 2006 edition, the IEA received revisions to the coal and oil data which had a significant impact on both the energy data and the CO2 emissions. The most significant re-visions occurred for coke oven coke, naphtha, blast furnace gas and petroleum coke. These revisions af-fected consumption rather than supply in the years concerned. As a result, the Sectoral Approach CO2 emissions increased for all the years, however at dif-ferent rates. For example, the Sectoral Approach CO2 emissions for 1990 were 4.6% higher than those cal-culated for the 2005 edition while the 2003 emissions were 1.1% higher than those of the previous edition. Due to the impact these successive revisions have had on the final energy balance as well as on CO2 emis-sions, the IEA was in close contact with the Japanese Administration to better understand the reasons be-hind these changes. These changes were mainly due to the Government of Japan's efforts to improve the input-output balances in the production of oil products and coal products in response to inquiries from the UNFCCC Secretariat. To cope with this issue, the Japanese Administration established a working group in March 2004. The working group completed its work in April 2006. Many of its conclusions were incorporated in the 2006 edition but some further re-visions to the time series (especially in industry and other) were submitted for the 2007 edition.
Starting in 1990, data are reported on a fiscal year basis (e.g. April 2009 to March 2010 for 2009).
Coal: The inputs of coke oven coke to blast furnaces as well as the final consumption of coke oven coke in iron and steel have been estimated by the IEA Secre-tariat starting in 1990. From 1998, inputs of coke oven gas, blast furnace gas and oxygen steel furnace gas into autoproducer electricity plants include the amount used to produce electricity with TRT technol-ogy (Top pressure Recovery Turbines) which was previously included in industry. Statistical differences in hard coal since 2004 are primarily due to a stock build by final consumers.
Biofuels and Waste: Inputs of solid biofuels to char-coal production are estimated by the IEA Secretariat assuming an efficiency of 40%. Stock changes in in-dustrial waste represent stocked tires on the consumer side reserved for energy production.
Oil: Orimulsion imports for electricity generation be-gin in 1991.
Electricity and Heat: Data for the entire time series refer to fiscal year. Electricity and heat produced in CHP plants are not included in the data series. Data on heat produced for sale by autoproducer heat plants are not available. Heat production from geo-thermal and solar thermal sources in Japan is not reported by the Japanese Administration. Production of electricity from wind began in 1993. Production of electricity from solar photovoltaic and wind in autoproducer plants is understated as it covers only plants with capacity higher than 1 000 kW. The IEA Secretariat estimated the photovoltaic (PV) electric-ity generation from autoproducers starting in 1992 based on an average capacity factor of 12% and ca-pacity data for autoproducers. Autoproducer PV capacity is derived from data from the Japanese Ad-ministration as well as the IEA Photovoltaic Power Systems Programme (IEA-PVPS) report, “Trends in Photovoltaic Applications” published in 2010. The capacity factor was based on the report “National survey report of PV Power Applications in Japan 2009”, published in 2010 by IEA-PVPS. The corre-sponding electricity consumption has been included with non-specified other consumption. Prior to 1998, the electricity produced using TRT technology (Top pressure Recovery Turbines) was included with elec-tricity generated from solid biofuels. Starting in 1998, it is included with electricity generated from coal gases. Electricity consumption in urban trans-port systems is included with rail.
46 - ENERGY STATISTICS OF OECD COUNTRIES: BEYOND 2020 DOCUMENTATION (2011 edition)
INTERNATIONAL ENERGY AGENCY
Korea
Data are available starting in 1971. Data for 2002 on-wards have been reported on a different basis, causing breaks in series between 2001 and 2002, especially for inputs and outputs to electricity generation and con-sumption in the iron and steel industry. The Korean Administration is planning to revise the historical se-ries as time and resources permit.
Coal: Data for coal and coal products from 1971 to 2001 are based on information provided by the Ko-rean Administration, as well as information from the Yearbook of Energy Statistics 2002, the Yearbook of Coal Statistics 2001 (both from the Ministry of Com-merce, Industry and Energy), and Statistics of Electric Power in Korea 2001 (from the Korea Electric Power Corporation). Data on sub-bituminous coal were esti-mated by the IEA Secretariat based on statistics of the exporting countries. Consumption of imported coke oven coke starting in 2002 is reported under non-specified industry. Consumption of manufactured gases in the iron and steel industry starting in 2002 includes the consumption in blast furnaces, oxygen steel furnaces and other iron and steel processing plants. Blast furnace gas used for energy purposes in blast furnaces prior to 2007 are reported in the iron and steel industry. Coal tar production prior to 2007 is not available at this time.
Biofuels and Waste: In 2007, some main activity heat plants and autoproducers in the commercial/public services sector were reclassified as main activity CHP plants which cause a break in the time series between 2006 and 2007 for biogases.
Oil: Except for naphtha, inputs of oil products to autoproducer electricity and autoproducer CHP are included with final consumption.
Natural Gas: Prior to 2007, consumption of natural gas in machinery was included with transport equip-ment. There are breaks in series in industry sub-sectors in 2008 due to a new classification. Energy industry own use in liquefaction plants includes losses and measuring errors.
Electricity and Heat: Electricity statistics from 1971 to 1993 have been estimated by the IEA Secretariat based on the Korean National Statistics. Data from 1994 have been submitted by the Korean Administra-tion. This leads to breaks in series between 1993 and 1994. Before 1994, electricity production from main activity producer CHP plants is included with main
activity producer electricity only plants. Heat data are available starting in 1993. For 1993 to 1999, the breakdown of heat output by type of fuel has been estimated by the IEA Secretariat. In 2000, the Korean Administration started to report heat statistics for some heat plants which were not reported before. Electricity and heat production by autoproducers us-ing natural gas and liquid fuels are available from 2000. Electricity production using heat from chemical processes in copper and zinc plants is available from 2005. The corresponding heat inputs are estimated. Heat from chemical processes that is sold is available from 2008. Electricity generation reported under other sources is from fuel cells. Prior to 2009, autoproducer heat production includes amounts of unsold heat.
Prior to 2007, production and consumption of electricity and heat in oil refineries and LNG liquefaction/regasification plants are included in industry sector. Prior to 2008, sales of electricity by Korea’s main electricity distributor, KEPCO, to the non-ferrous metals sector are included in iron and steel consumption.
Direct use of geothermal heat is available from 2002. Geothermal direct use is overstated as it refers to heat production by geothermal heat pumps, which include inputs of electricity and/or gas in the transformation process.
Luxembourg
Coal: Steel production from blast furnaces ceased at the end of 1997. For the 2011 edition, the Luxem-bourgian Administration revised the time series from 2000 for most coal and coal products. Time series for brown coal briquettes consumption were revised from 1990.
Biofuels and Waste: Data on solid biofuels are avail-able from 1992. For the 2011 edition, the Luxembourgian Administration revised the time series for municipal waste from 1990, biogases from 1998 and solid biofuels from 1999.
Oil: For the 2011 edition, data for gas/diesel oil were revised from 1999.
Natural Gas: Prior to 2000, residential consumption includes consumption in commercial/public services and agriculture/forestry. The large increase of gas consumption in transformation from 2002 onwards is due to a new 350-MW combined cycle power plant. In the 2011 edition, data from 2000 to 2008 were
ENERGY STATISTICS OF OECD COUNTRIES: BEYOND 2020 DOCUMENTATION (2011 edition) - 47
INTERNATIONAL ENERGY AGENCY
revised according to a new methodology, leading to a more detailed breakdown in final consumption sub-sectors. From 2000, consumption in the non-ferrous metals sub-sector is included in iron and steel for rea-sons of confidentiality.
Electricity and Heat: Most of the hydro production shown for Luxembourg is from the Vianden pumped storage plant and is exported directly to Germany. Electricity from natural gas for autoproducer CHP plants are available starting in 1995 and for main ac-tivity CHP plants starting in 1996. The iron and steel industry stopped production of electricity at the end of 1997. Electricity and heat production from biogases are available from 1999. Data for solar thermal are available starting in 2001 and for solar PV starting in 2003. The increase in electricity production in 2002 is due to a new natural gas combined cycle power plant. In the 2011 edition, heat production from natural gas in autoproducer CHP plants was removed because it was discovered the heat was not sold. The breakdown of electricity consumption in industry is not available from 1990 to 1999. Heat consumption from 2000 to 2009 was estimated by the IEA Secretariat.
Mexico
Data are available starting in 1971 and are partly esti-mated based on the publication Balance Nacional - Energía. The Mexican Administration submitted data directly by questionnaire for the first time with 1992 data. As a result, some breaks in series may occur be-tween 1991 and 1992. In the 2011 edition, the Mexican Administration revised selected historical data.
Coal: The time series for blast furnace gas and inputs of coke oven coke to blast furnaces start in 1991.
Biofuels and Waste: Data on biogases are available from 1997. Data for solid biofuels used in autopro-ducer electricity plants from 1991 to 2005 have been estimated by the Mexican Administration.
Oil: Prior to 1987, the split of LPG consumption be-tween residential and commercial/public services has been estimated by the IEA Secretariat. Inputs of oil for autoproducer electricity and heat generation have been included in industry. Consumption of lubricants, bitumen and paraffin waxes are available from 1990 and petroleum coke from 1993. Because of a change in the processing of the data, breaks in series occur between 1998 and 1999.
Natural Gas: Natural gas reported in the IEA publica-tions may be different from what is reported in the Mexican energy publications, as IEA includes only dry gas and excludes natural gas liquids. Losses and pipeline transport have been included in oil and gas extraction. Beginning with 1993, data have been sub-mitted by the “Secretaria de Energia”.
Electricity and Heat: Electricity production from wind and solar photovoltaic is available from 1990. Electricity production from biofuels and waste is available from 1998. New autoproducer electricity plants fuelled with coal gases were put on-line in 1999. Prior to 1996, gas/diesel oil inputs to autopro-ducer electricity plants is comprised only of diesel.
Direct use of solar thermal heat is available from 1990.
Some electricity consumption in energy industry own use is included in the industry sub-sector where it was generated (e.g. the chemical industry, as well as in non-specified industry).
Netherlands
In the national statistical system of the Netherlands, use of fuel in manufacturing industries for CHP production is considered to be consumption in transformation. However, in IEA statistics, this own use for heat pro-duction (autoproduced heat) is reported under the relevant industry sub-sector, based on estimates pro-vided by the Central Bureau of Statistics.
Coal: Paper, pulp and print includes furniture.
Biofuels and Waste: In 2006, for municipal waste some plants changed ownership and were reclassified from electricity only to CHP plants as they started heat projects.
Oil: Refinery gas includes chemical gas and is in-cluded in chemical industry consumption. Refinery gas inputs to main activity producer CHP plants begin in 1995. Motor gasoline includes other light oils until 2007. Some breaks in series occur in 2007 when the Dutch Administration has started to report the petro-chemical industry according to IEA methodology. From 2008, naphtha includes aromatics, naphtha and other light oils.
Natural Gas: All heat plants were converted to CHP plants in 1990. Consumption in commercial/public services includes other non-specified consumption starting in 1988. In 2008, a new autoproducer CHP

48 - ENERGY STATISTICS OF OECD COUNTRIES: BEYOND 2020 DOCUMENTATION (2011 edition)
INTERNATIONAL ENERGY AGENCY
plant came on-stream, accounting for the large con-sumption increases in that year. In 2009, the increase in main activity electricity is due to the opening of a new plant in the second half of 2008. The decrease in autoproducer electricity is a result of companies changing their installations from electricity only plants to CHP.
Electricity and Heat: Electricity from other sources represents generation from the expansion of gases. Heat in non-specified transformation represents waste heat bought from other industries that is generated from combustible fuels. The corresponding electricity output is included with that of natural gas. Electricity production from solar photovoltaic is available from 1992. The decrease of electricity produced from nu-clear in 1997 is due to the closure for five months of one nuclear power plant. Heat produced from biofuels and waste is available from 1990. A new main activity producer CHP plant fuelled by refinery gas started up in 1999 and there was a fuel reclassification in 2000. In the 2007 edition, the Dutch Administration imple-mented a reporting methodology which causes some breaks between 2004 and 2005. Prior to 1990, all elec-tricity and heat produced from coal is included in CHP plants. For natural gas, all electricity production prior to 1998 and all heat production prior to 1995 is included in CHP plants. For biofuels and waste, all electricity and heat produced prior to 1995 is included in CHP plants.
Commercial/public services electricity consumption includes small users. Increasing electricity consump-tion in agriculture/forestry is due to expansion of greenhouse farming. The large increase in electricity trade in 1999 is due to the liberalisation of the Dutch electricity market. A new reporting methodology starting in 2005 causes breaks in the heat consumption series. Direct use of geothermal heat in agriculture/forestry starting in 2008 is due to a new project ex-tracting deep geothermal heat.
New Zealand
Where data refer to the fiscal year, April 2003 to March 2004 is shown as 2003. In the 2011 edition, the New Zealand Administration has revised some of the coal, natural gas, oil, renewable and electricity time series back to 1990.
Coal: Peat, although produced in New Zealand, is not used as a fuel. It is used for agricultural purposes only. In final consumption, some industry data are
reported in non-specified industry for confidentiality reasons. Construction is included with commercial/public services. Prior to 2009, mining and quarrying is included in agriculture. Sub-bituminous coal inputs into autoproducer CHP refers to coal that is merged with iron sands and limestone to form the inputs for the multi-hearth-furnaces, kilns and melters to pro-duce direct reduced iron (Glenbrook Steel Site), with off-gases and supplemental and natural gas driving the CHP plants. This method, while not the typical iron and steel process, produces similar by-products. The sub-bituminous coal inputs are reported under coke ovens and the resulting off-gases are reported as pro-duction of coke oven gas and blast furnace gas. Some transformation efficiencies will appear higher than normal due to non-reporting of certain inputs includ-ing some confidential data.
Biofuels and Waste: Data prior to 1993 are for the fiscal year.
Oil: For reasons of confidentiality, beginning in 1994, the New Zealand Administration no longer reports data on the production of methanol. Liquefaction of other hydrocarbons shown as crude oil represents syn-thetic gasoline production from natural gas. In February 1997, production of synthetic gasoline ceased. Light fuel oil is included in fuel oil until 1997. As of 1998, light fuel oil is included in gas/diesel oil.
Natural Gas: In February 1997, production of syn-thetic gasoline from natural gas ceased. In 1998, two new autoproducer CHP plants came on-stream, ac-counting for the very large consumption increases in that year. A steep decline in consumption in chemical industry in 2005 was caused by closure of the Mo-tunui methanol production plant. The Motunui plant was then reopened in late 2008 resulting in an in-crease in consumption in chemical industry in 2009.
Electricity and Heat: The classifications used by the Administration of New Zealand were changed in 1991. Prior to 1994, data refer to fiscal year. From 1994, data refer to calendar year. Electricity produc-tion by autoproducers for geothermal is available from 1990. The New Zealand Administration has updated efficiencies for electricity production from geothermal heat from 10% to 15% from 1990 onwards; this causes a break in the time series between 1989 and 1990. Heat from chemical processes used for electric-ity production is available from 1990 and corresponds to acid plants in the fertiliser industry where sulphur is the main input.

ENERGY STATISTICS OF OECD COUNTRIES: BEYOND 2020 DOCUMENTATION (2011 edition) - 49
INTERNATIONAL ENERGY AGENCY
Direct use of geothermal heat is available from 1990 and direct use of solar thermal heat from 2002.
Electricity consumption in paper, pulp and printing is included in wood and wood products prior to 1990. There are breaks in series between 1996 and 1997 for electricity consumption due to a new NZ Standard In-dustrial Classification (NZSIC).
Norway
Coal: Other bituminous coal includes lignite. The decrease of bituminous coal production in 2005 is due to a fire in one of the coal mines; this entailed a break in the production for a large part of the year.
Biofuels and Waste: Data for industrial waste and biogases are available from 1991. Distribution losses for biogases are included in commercial/public ser-vices prior to 2003. Only biodiesel imports are available starting in 2006. Prior to 2007, equal shares of renewable and non-renewable municipal waste were estimated because the actual split was not known.
Oil: The IEA Secretariat calculates the net calorific value for Norwegian crude oil based on the oil prod-uct outputs of the oil refineries. Since 1986, imports of refinery feedstocks are reported under the relevant oil product imports. Due to revisions from the Norwe-gian Administration, there are breaks in series in 1990, 1993 and 2003. Ethane is included with LPG prior to 1990. Prior to 2002, part of LPG exports was reported as NGL exports. Gas/diesel oil used in fish-ing is included in agriculture/forestry prior to 2000. Consumption of petroleum coke in industry has been reclassified from 2005. In the 2011 edition, the Nor-wegian Administration has reported data for additives and oxygenates for 2001 onwards.
Natural Gas: The large increase in the oil and gas extraction sector in 1992 results from the start up of new fields. Before 2000, in energy industry own use, the oil and gas extraction data included data normally included under total final consumption. Consumption for pipeline transport is included in oil and gas extrac-tion. Domestic navigation is included under non-specified transport. The steep increase in non-specified transport in 2007 is due to the wider use of gas-powered sea vessels. For Norway, supply of natu-ral gas is the residual of two very large and opposite terms, production and exports. As a result, large statis-tical differences in some years may lead to
discrepancies in the growth rates of supply and de-mand of natural gas.
Electricity and Heat: Heat production from heat pumps and electric boilers (including the electricity used for this production) is available from 1989. No data on electricity production from solar energy are submitted separately to the IEA by the Norwegian Administration. Electricity production from wind is available from 1992. Heat production from biogases is available from 1995. Breaks in series between 1996 and 1997 are due to a reclassification of main activity producers and of autoproducers. The electricity gener-ated from other sources represents electricity from waste heat. Heat produced by autoproducer heat plants from chemical processes and from other sources and used for electricity production was esti-mated by the IEA Secretariat for the period 1990 to 2006.
Consumption of electricity for pipeline transport is included in oil and gas extraction. The breakdown of heat consumption by industry sub-sector was ex-panded in 1992, reclassified in 1994 and collected by a new reporting system in 1997.
Poland
Coal: For the 2011 edition, the Polish Administration has revised the time series for blast furnace gas, coke oven gas and other bituminous coal from 2001 to 2007. Time series for coke oven coke were revised for the years 1990 to 2001.
Biofuels and Waste: Data for industrial waste include gaseous industrial waste. Data for biogases refer only to the gas from fermentation of biomass. Due to data availability, there is a large increase in solid biofuels between 1992 and 1993. Some changes in the data collection process lead to breaks between 1996 and 1997. Before 2000, industrial wastes were used inter-changeably with light fuel oil in some plants, which might result in breaks in the time series. Data on liq-uid biofuels are available starting in 2003. In 2008, a new questionnaire was administered which increased the coverage of renewable and waste data.
Oil: From 1997, a hydrocracking complex produces hydrogen from natural gas. These amounts are re-ported in from other sources of inputs of origin other than crude oil or NGL (included with crude oil in the publication). Petroleum coke data are available from 2003 onwards.

50 - ENERGY STATISTICS OF OECD COUNTRIES: BEYOND 2020 DOCUMENTATION (2011 edition)
INTERNATIONAL ENERGY AGENCY
Natural Gas: The inputs of natural gas in transforma-tion have been inferred by the Polish Administration and for some years may be out of line with historical data. Non-specified transformation represents natural gas used for hydrogen manufacture in catalytic re-forming processes. Natural gas used in pipeline transport is partly included in energy industry own use (gas works). Distribution losses may include some statistical differences.
Electricity and Heat: Heat production from autopro-ducer CHP plants includes the unsold heat for own use between 1988 and 1995. In order to alleviate this, the Polish Administration adopted new methods to estimate the production of heat sold in autoproducer heat plants (1993) and in autoproducer CHP plants (1995). This causes breaks between 1992 and 1993, and between 1994 and 1995 for heat production and fuel inputs in these plants and for heat consumption in industry sub-sectors. In 2008, a number of CHP plants were reclassified from autoproducer to main activity producer due to an industry re-organisation.
Direct use of geothermal heat is available from 2000 and direct use of solar thermal heat from 2002.
Heat consumption in energy industry own use includes process heat not sold before 1995.
Portugal
Coal: Since 1998, sub-bituminous coal is not used. As of 2002, gas works gas in the commercial/public ser-vices and residential sectors was replaced by natural gas. The production of pig iron ceased in the first quarter of 2001, leading to decreases in supply and consumption of coking coal, coke oven coke, coke oven gas and blast furnace gas in 2001.
Biofuels and Waste: Data are available from 1994 for biogases, from 1999 for municipal waste and from 2003 for industrial waste. Data for solid biofuels were revised by the National Administration from 1990 to 2001, which may result in breaks in series between 1989 and 1990.
Oil: Consumption of gas/diesel oil in industry and commercial/public services represents diesel use in mobile fleets. In the 2011 edition, the Portuguese Ad-ministration has revised the international/domestic breakdown for aviation and shipping from 2007.
Natural Gas: Portugal started to import natural gas in February 1997. The decrease in natural gas used for
gas works in 2001 is due to the closing of the Lisbon gas works plant in May 2001.
Electricity and Heat: To conform to IEA methodol-ogy, heat produced from biofuels and waste (mainly black liquor) and from coal gases in autoproducer CHP plants is not accounted for since it is not sold, while the electricity produced in these plants is in-cluded. New plants fuelled by solid biofuels and by municipal waste started in 1999. In 2007, some power plants that were previously reported as main activity CHP have been reclassified as autoproducer CHP. The power station that burns industrial waste started to work as a CHP plant in 2007, whereas previously it was only producing electricity.
Direct use of solar thermal heat is available from 1989 and direct use of geothermal heat from 1994.
Slovak Republic
Data are available starting in 1971. There are some breaks in series between 1992 and 1993. A new sur-vey system in 2001 leads to major breaks in series for most products.
Coal: Commercial/public services includes national statistical differences for other bituminous coal, lig-nite, patent fuel, coke oven coke and BKB.
Biofuels and Waste: Prior to 2001, the data reported as industrial waste include biogases and municipal waste.
Oil: Kerosene-type jet fuel includes small amounts of other kerosene from 2001 onwards. International avia-tion bunkers includes small quantities of kerosene type jet fuel used for domestic aviation. For gas/diesel oil, road data include rail use. Energy use of white spirit is not available.
Natural Gas: The break in series for oil and gas ex-traction in 2001 is due to application of the IEA’s definition starting in that year. Consumption in other transformation is mainly natural gas used for produc-tion of hydrogen and in hydrocracking for gasoline. From 2009, data for losses are no longer available. There are inconsistencies in the time series for commercial/public services as this sub-sector is the residual of the consumption data.
Electricity and Heat: Electricity and heat production from combustible fuels from 1990 to 2000 have been estimated based on the data on fuel used for electric-ity and heat plants reported in the annual fuel questionnaires.

ENERGY STATISTICS OF OECD COUNTRIES: BEYOND 2020 DOCUMENTATION (2011 edition) - 51
INTERNATIONAL ENERGY AGENCY
The low electricity consumption in oil refineries in 2003 and 2004 is due to a change in ownership and work carried out on a refinery.
Direct use of geothermal heat is available from 2001 and direct use of solar thermal heat from 2005.
Slovenia
Data for Slovenia are available starting in 1990. Prior to that, they are included in Energy Statistics of Non-OECD Countries in Former Yugoslavia. A new en-ergy data collection system was implemented in January 2001, causing some breaks in time series be-tween 1999 and 2000.
Biofuels and Waste: The Slovenian Administration plans to revise the total final consumption for solid biofuels with the results from a new household survey next cycle. Breaks in total final consumption for in-dustrial waste are a result of a sectoral reclassification.
Electricity and Heat: Surveys for data on heat con-sumption are available from 2003 onwards. Prior to 2003 the data were estimated by the Slovenian Administration.
Spain
Coal: Other bituminous coal use in the iron and steel industry ceased in 1991 and started again in 1996. Consumption of BKB also ended in 1991. Consump-tion of blast furnace gas in the chemical industry stopped in 1994 while chemical industry use of coke oven gas ceased between 1994 and 2000. Natural gas inputs into gas works gas stopped in 1999. Lignite mining was halted indefinitely in 2008.
Biofuels and Waste: A new reporting system leads to breaks in final consumption sectors between 1999 and 2000 and again between 2005 and 2006. In 2000 and 2006, many plants are reclassified from main activity producer to autoproducer or vice versa. Prior to 2006, inputs of biogases used to generate process heat were erroneously included as inputs to transformation when they should have been reported in the appropriate in-dustry in final consumption. In the 2010 edition, the National Energy Commission reclassified plants that consume biogases, leading to breaks in series between 2007 and 2008.
Oil: A change in the reporting system in mid-1996 has resulted in some breaks in series.
Natural Gas: The increase of natural gas used as feedstock starting in 1988 reflects a substitution of naphtha for the production of fertilisers. There is a break in series between 1993 and 1994 in autopro-ducer CHP consumption, since a new survey revealed a larger number of CHP autoproducers that had previ-ously been included in industry consumption. The large increase in main activity producer electricity consumption in 1997 is due to two main activity pro-ducer electricity plants running on natural gas in 1997. From 2001 onwards, the final consumption break-down is estimated by the National Administration. The consumption data for 2006 onwards have been estimated on a different basis, thus causing breaks in the energy industry own use and in final consumption.
Electricity and Heat: The large increase in electricity output from main activity producer electricity plants fuelled by natural gas in 1997 is due to the opening of a new plant. For 2004 and 2005, electricity production from gas/diesel oil is included with fuel oil. Electricity from solar thermal plants is available from 2007. A reclassification of plants from main activity to auto-producer in 2008 has lead to breaks in electricity and heat production between 2008 and 2009.
Direct use of solar thermal heat and geothermal heat is available from 1994.
Transmission and distribution losses are estimated by the Spanish Administration. Starting in 2006, a new method was used to estimate the losses from final consumption data resulting in a break in time series between 2005 and 2006.
Sweden
Coal: Other bituminous coal production is coal recov-ered during the quarrying of clay. Autoproducer inputs to waste heat production that is sold are re-ported in the respective final consumption sectors and not in transformation.
Biofuels and Waste: Data for biogases begin in 1992. Heat production from solid biofuels in autoproducer CHP includes waste heat and chemical heat. From 1990 to 2006, municipal waste was reported as 60% non-renewable and 40% renewable. In 2007, reanaly-sis of the waste revealed the content was 40% non-renewable and 60% renewable. This results in breaks in the time series between 2006 and 2007 for both renewable and non-renewable municipal waste.
Oil: Beginning in 1995, Sweden has changed its stan-dard classification of industry sub-sectors. Data are
52 - ENERGY STATISTICS OF OECD COUNTRIES: BEYOND 2020 DOCUMENTATION (2011 edition)
INTERNATIONAL ENERGY AGENCY
available from 2000 for additives and ethane, and from 2003 for refinery gas.
Natural Gas: Prior to 1993, road transport is included in commercial/public services. Total final consump-tion and its breakdown in 2008 was estimated by the IEA Secretariat based on other Statistics Sweden publications.
Electricity and Heat: In Sweden, heat produced in heat pumps is sold to third parties (as district heat) and is therefore included in transformation. Inputs to heat pumps include heat recovered from industry and from ambient sources (including sewage and sea-water). Ambient heat is shown as the indigenous production of heat. The electricity used to drive heat pumps is considered to be transformed and appears as output in transformation rather than as electricity used in energy industry own use. Fuel inputs to the heat that is recovered by the heat pump are reported in the appropriate industry sub-sector (i.e. chemical and pa-per, pulp and printing). Prior to 1992, electricity production from biogases is included with solid biofu-els. Information on heat for sale produced in heat pumps and electric boilers is available starting in 1992. Heat produced for sale by autoproducer CHP plants is reported starting in 1992. Heat production from liquid fuels in main activity producer CHP plants includes heat recovered from flue-gas condens-ing for 1997 and 1998.
Industry consumption of the heat produced by heat pumps has been estimated by the IEA Secretariat based on fuel inputs submitted by the Swedish Administration (2/3 in paper, pulp and printing and 1/3 in chemical). Consumption of electricity for distribution of district heat is included with other energy industry own use.
Switzerland
From 1999, data on consumption result from a new survey and are not comparable with data of previous years.
Coal: From 1985, industrial consumption of gas works gas is reported in non-specified industry to pre-vent the disclosure of commercially confidential data. Allocation of consumption data between certain coal types is estimated by the Swiss Administration, as are calorific values.
Biofuels and Waste: The autoproducer heat plant that produced heat for sale using municipal waste was closed in 2006. For the 2011 edition, the Swiss
Administration revised the time series for municipal waste and solid biofuels from 1990.
Oil: As of 1993, the Swiss Administration has re-ported figures for naphtha that are net of quantities used for blending into motor gasoline. For 1994, 1995, 1997, 1999, 2001 and 2002 this reporting has led to negative production numbers for naphtha. For these years, the IEA Secretariat has moved the data into transfers and reduced the production of motor gasoline by corresponding amounts. Petroleum coke production started in 2004 due to the installation of a cracking unit in a refinery.
Natural Gas: The breaks in series in 2007 and 2008 for CHP plants are due to the closing of a plant in 2007 and the opening of another plant in 2008.
Electricity and Heat: Heat production includes heat produced by nuclear power stations and distributed to other consumers. Solar electricity production by auto-producers is available from 1990. Electricity production from pumped storage by autoproducers is available from 1996.
Direct use of geothermal heat and solar thermal heat is available from 1990. Geothermal direct use is over-stated as it refers to heat production by geothermal heat pumps, which include inputs from electricity and/or gas in the transformation process. For the 2011 edition, the Swiss Administration revised the time series for geothermal and solar thermal from 1990.
Electricity consumption in the transport equipment industry is included with machinery. The breakdown of heat consumption by industry sub-sector is esti-mated by the IEA Secretariat from 2000 to 2009.
Turkey
Coal: Production of gas works gas declined in 1989 due to plant closures; the last plant closed in 1994. Use of gas coke and gas works gas ceased in 1994. Due to government regulations in industry and resi-dential, in particular, there has been a shift from the use of domestically produced coal to imported coal and natural gas. Privatisation of state owned coke ov-ens in recent years results in incomplete information on coke oven gas distribution. Data for 2008 are pro-vided from the results of an improved questionnaire. Significant changes occur in consumption patterns within the iron and steel industry, coal mining as well as across industry, residential and commercial/public

ENERGY STATISTICS OF OECD COUNTRIES: BEYOND 2020 DOCUMENTATION (2011 edition) - 53
INTERNATIONAL ENERGY AGENCY
services for other bituminous coal. Some coal used in cement kilns is reported under construction instead of non-metallic minerals in 2008 and 2009. Historical data may be revised in future issues.
Biofuels and Waste: The Turkish Administration only surveys renewables and waste used for power and heat intermittently. Due to this fact, some breaks may appear in the biofuels and waste series.
Natural Gas: Data for commercial/public services were included in residential prior to 2000. The de-crease in natural gas consumption in petrochemical feedstocks between 1999 and 2001 is related to the fertiliser industry. Classification improvements re-sulted in a break in series for non-energy use in the chemical industry in 2006. Storage capacity has been reviewed which resulted in a break in series for stock change in 2008. Starting with 2009 figures, consump-tion data are collected by Turkey’s Energy Market Regulatory Authority. This leads to breaks in series across all sectors.
Electricity and Heat: In 1995, the Turkish Admini-stration reclassified autoproducer plants by type and source to be consistent with IEA definitions. This causes breaks between 1994 and 1995 for electricity production in these plants. Electricity production from wind is available starting in 1998. In the 2006 edition, the Turkish Statistical Office started providing elec-tricity and heat output on the basis of a new survey that revised time series back to 2000. This causes breaks in the time series between 1999 and 2000. Not all of the input series have been revised.
Consumption in the machinery sector includes trans-port equipment. Prior to 1998, consumption in the wood and wood products includes that of the paper, pulp and printing industry.
United Kingdom
Coal: Consumption shown for the commercial/public services includes consumption of some of non-specified other. Prior to 1994, the consumption of substitute natural gas is included with natural gas while its production is included with gas works gas.
Biofuels and Waste: Final consumption of industrial waste in commercial/public services includes hospital waste, which should be shown under municipal waste. Prior to 2001, some of the industrial waste was re-ported with other oil products. In the 2011 edition, the net calorific value adjustment for municipal waste was
revised, leading to a break in series between 2004 and 2005.
Oil: Prior to 1995, the product breakdown for transfers is estimated by the UK Administration. Beginning with 1995, the UK Administration revised their product breakdown for transfers and petrochemical reporting methodology. Breaks in series for LPG occur between 2000 and 2001 due to a re-allocation of data. Fuel oil inputs to heat production are available starting in 2000. Beginning with 2009, the UK Administration revised their product consumption data based on a new report-ing methodology. Consumption data prior to 2009 are pending.
Natural Gas: From 1992 onwards, losses include me-tering differences and losses due to pipeline leakage. The consumption of natural gas in commercial is in-cluded with non-specified other while public services is shown separately. Natural gas consumption in-cludes substitute natural gas made at gas works and piped into the natural gas distribution system. Data in non-specified industry refer to sales by independent gas suppliers unallocated by category. The natural gas used to form synthetic coke oven gas is reported under non-specified transformation.
Electricity and Heat: The reorganisation and subse-quent privatisation of the electricity supply industry in 1990 has resulted in some breaks in series. Inputs and output from natural gas for main activity producer electricity production are included in autoproducer electricity for 1990 (for reasons of confidentiality). For the United Kingdom, it is necessary to combine figures for main activity producers and autoproducers in order to prevent the disclosure of information relat-ing to less than three electricity generating companies, since this information is considered confidential. For this reason data for main activity producer CHP plants have been included with autoproducer CHP plants from 1988. Prior to 1988, electricity output from CHP plants was included with main activity producer elec-tricity plants. Prior to 2003, all outputs of electricity and heat from oil products are reported in the other oil products category. From 2007 onwards, outputs of electricity and heat from petroleum coke are included in fuel oil. In 1996, the break in electricity production from nuclear is due to a reclassification of plants from autoproducer to main activity producer plants. Elec-tricity production from solar PV is available from 1999. Heat output is available starting in 1999.
Electricity consumption in coal mines includes con-sumption in patent fuel plants. Consumption in gas

54 - ENERGY STATISTICS OF OECD COUNTRIES: BEYOND 2020 DOCUMENTATION (2011 edition)
INTERNATIONAL ENERGY AGENCY
works includes electricity use in the transmission/distribution of public supply gas. Consumption in the non-metallic mineral products sector includes mining and quarrying. Starting in 1990, small amounts of electricity used in heat pumps have been included in residential. Electricity used for urban transport is in-cluded in non-specified transport. In the 2011 edition, the methodology for allocating electricity consump-tion by sector was revised which results in a break between 2004 and 2005 in the residential sector.
United States
Due to problems in reporting, there are numerous breaks in series for the US data, particularly in 1992, 1999, 2001 and 2002. Care should be taken when evaluating consumption by sector since inputs of fuel to autoproducers are included in final consumption for some years. No data are available for most energy products in the construction and mining and quarrying industries.
Coal: In 2002, the United States reported “synfuel” production as patent fuel for the first time. Prior to 2002, the consumption of this fuel was reported with other bituminous coal. Production ceased in 2007 for economic reasons. Since the Energy Information Ad-ministration (EIA) and the US Department of Commerce do not collect separate data on patent fuel exports by country, total exports of patent fuel are in-cluded in the exports of other bituminous coal. Coal tar as a by-product of coke ovens is not currently reported.
Biofuels and Waste: The EIA collects generation and consumption data from all plants 1 MW or more in capacity.
Oil: International marine bunkers of fuel oil show a large increase in 1990 due to a change in the data col-lection and reporting methodology of the US Administration. From 1992 onwards, the individual components of NGL and LPG have been converted using their respective gravities rather than an average gravity, resulting in a break in series. In 1993, the US Administration made several adjustments to its collec-tion system for oil statistics in order to accommodate the revisions to the Clean Air Act of 1990. As a result, data for oxygenates (i.e. fuel ethanol, MTBE, etc.) were collected in 1993 and reported in the additives category, or in the case of ethanol, in biogasoline. Be-ginning in 1994, motor gasoline consumption in commercial/public services is based on a new model from the US Department of Transportation. High
statistical differences for crude oil represent “unac-counted for crude oil”, the difference between the supply and disposition of crude oil. From 1995, LPG inputs to gas works are included in the industry sector. As a result of a new Manufacturing Energy Consump-tion Survey (MECS), there are breaks in series between 1999 and 2000 for the industry sector, and again between 2000 and 2001 as the MECS percent-ages were revised due to revisions in electric CHP. There were significant revisions to fuel oil and unfin-ished oils for 2001 data. Primarily, the changes are a result of importers misclassifying unfinished oils as fuel oil. From 2002 onwards, the IEA Secretariat has estimated the amounts of refinery gas used for auto-producer electricity production.
Natural Gas: The amounts of gas works gas that are blended with natural gas have been estimated from 1990 to 2002 on the basis of the output efficiency of the process. With the exception of petrochemical feed-stocks, other non-energy use of natural gas is included in industry prior to 2003. A detailed breakdown of industry consumption is not available for natural gas prior to 1995. From 1995 on, this breakdown is esti-mated by the EIA, using the MECS, which is conducted quadrennially. Consumption in agriculture, forestry and fisheries is included in non-specified industry.
Electricity and Heat: There are breaks in series con-cerning the total production of electricity and heat in the United States. Comprehensive data on electricity and heat production and consumption in main activity producer electricity, CHP and heat plants and auto-producer electricity and CHP plants are not available for all years. The selling of main activity producer plants to autoproducers may cause breaks in the series between 1998 and 2000. For the United States, prior to 2000, autoproducers include small and independent power producers, which under IEA definitions are considered main activity producers. In the 2003 edi-tion, the US Administration changed what it was reporting under autoproducers. This reclassification causes more breaks between 1999 and 2000. For the 2009 edition, the EIA changed their methodology for calculating heat production in CHP plants, and revised data back to 2006. This leads to breaks in series be-tween 2005 and 2006. Historical revisions are pending. Electricity generation reported under other sources is from purchased steam. For 2002, autopro-ducer electricity output for oil includes generation from refinery gases with a low average calorific value. Prior to 2002, this output was not accounted for. From 2007,
ENERGY STATISTICS OF OECD COUNTRIES: BEYOND 2020 DOCUMENTATION (2011 edition) - 55
INTERNATIONAL ENERGY AGENCY
the industrial waste category includes recovered heat from industrial processes. Accurate accounting of coke oven gas and refinery gas inputs is not always possible, which can lead to efficiencies over 100% in main activ-ity producer CHP plants. Prior to 2008, heat produced by heat pumps was incorrectly reported as geothermal use in residential and commercial/public services.
Data for electricity absorbed by pumping and electric-ity production from pumped storage plants became available starting in 1987. The consumption of heat sold in industry is available from 1991 and in energy industry own use from 1992. Prior to 1991, total con-sumption of heat sold referred to consumption in commercial/public services. No data are available for heat sold that is consumed in residential and agriculture/forestry.
Direct use of solar thermal heat in residential is avail-able from 1999. Prior to 1999, solar thermal electricity production includes generation from natural gas because some natural gas units are attached to solar thermal plants and their production cannot be separated. The IEA Secretariat estimated US photo-voltaic (PV) electricity generation from autoproducers starting in 1999 by multiplying the dispersed and dis-tributed PV capacity estimated by the EIA by an average capacity factor of 12%. The capacity factor was based on a report published in 2007 by the IEA Photovoltaic Power Systems Programme, Cost and Performance Trends in Grid-Connected Photovoltaic Systems and Case Studies. The corresponding con-sumption of electricity has been included under non-specified.


ENERGY STATISTICS OF OECD COUNTRIES: BEYOND 2020 DOCUMENTATION (2011 edition) - 57
INTERNATIONAL ENERGY AGENCY
6. ABBREVIATIONS Btu: British thermal unit GWh: gigawatt hour kcal: kilocalorie kg: kilogramme kJ: kilojoule kt: kilotonne Mt: million tonnes m3: cubic metre t: metric ton = tonne = 1000 kg TJ: terajoule toe: tonne of oil equivalent = 107 kcal CHP: combined heat and power GCV: gross calorific value HHV: higher heating value = GCV LHV: lower heating value = NCV NCV: net calorific value PPP: purchasing power parity IEA: International Energy Agency IPCC: Intergovernmental Panel on Climate Change ISIC: International Standard Industrial Classification OECD: Organisation for Economic Co-Operation and Development OLADE: Organización Latinoamericana de Energía UN: United Nations UNIPEDE: International Union of Producers and Distributors of Electrical Energy c confidential e estimated .. not available - nil x not applicable


