65
Energy Storage in Singapore July 24, 2015 Dr. H.B. Gooi Nanyang Technological University

Energy Storage in Singapore July 24, 2015 Dr. H.B. Gooi Nanyang Technological University

Sustainable, Economic and Secure Electricity Supply in Singapore
presented by H B Gooi Associate Professor School of Electrical & Electronic Engineering
24 July 2015

Oil, Gas and Electricity Industry of Singapore
2

Singapore Oil, Gas and Electricity Industry
3
Fuel Mix for Electricity Generation Others include diesel, Syngas and refuse incineration
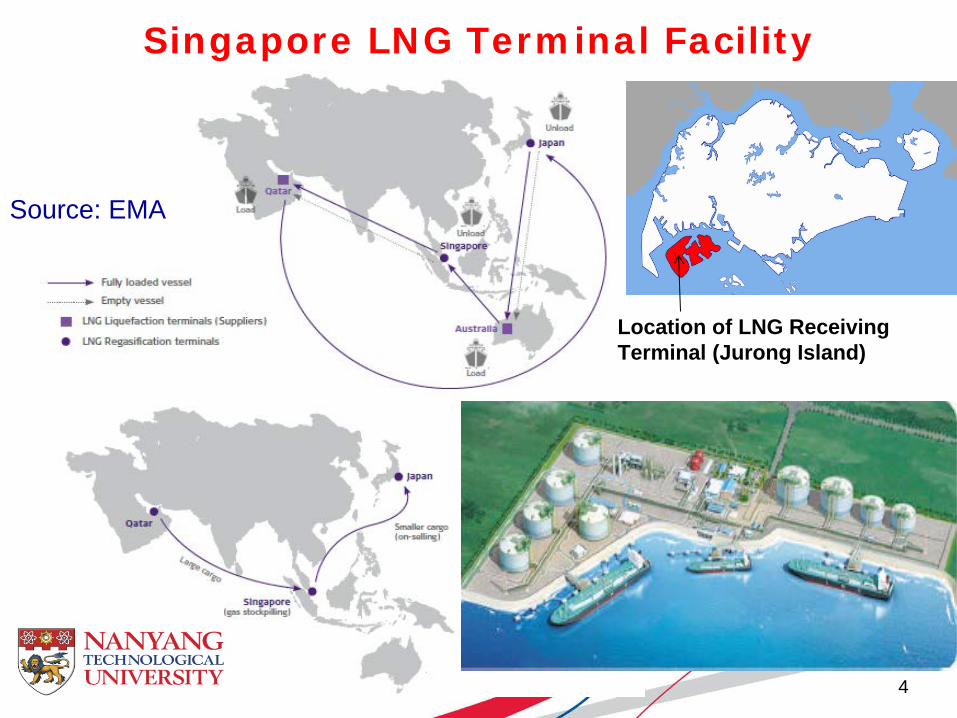
• Singapore is one of top three oil-refining centers and the third largest oil trading hub in the world.
• Natural gas is imported via long pipelines from from Peninsular Malaysia and Indonesia.
• To meet the growing demand for electricity and enhance its energy security, Singapore commenced commercial operation of the LNG terminal which has a throughput capacity of 6 Mtpa and room for expanding up to 15 Mtpa.
Source: EMA
4
Source: EMA
Location of LNG Receiving Terminal (Jurong Island)
Singapore LNG Terminal Facility

• Electricity consumption is linked to GDP. • Maximum demand has increased by almost 73% from
3,485 MW in 1995 to 6,041 MW in 2009. • Demand is expected to increase at an annual rate of 2.5
to 3.0% from 2010 onwards. Electricity demand in 2010 was 41,200 GWh. Peak demand in 2012 was around 6,639 MW.
Electricity Demand
5
Total Annual Electricity Demand Trends (Forecast is based on GDP and population projections)
Source: EMA

Distribution of Power Plants in Singapore • Singapore’s generation capacity has grown at an average annual rate of around 3 per cent from 2003-08.
• About 70% of Singapore’s generation capacity is located in the western part of Singapore.
• Land has been set aside for a new generation plant to be built in the northeast region.
• Singapore power grid is connected to TNB System via two submarine cables with transmission capacity of 250 MW each.
6 Source: EMA GMR
(PacificLight)

Projected Reserve Margin
7
• Singapore’s minimum reserve margin is set at 30% above the annual peak demand based on LOLP of 3 days/year.
• With indicative new generation plantings in the pipeline, the reserve margin is projected to be above 30% over the next ten years.
Projected Reserve Margin (as of June 2011)
Source: EMA

Singapore Electricity Industry Structure
SP: Singapore Power EMA: Energy Market Authority EMC: Energy Market Company
8
To understand how demand side management (DSM) can benefit Singapore, one needs to understand how the market clearing process works.
Source: EMA

• Currently the load demand in Singapore is very inelastic. • DSM can help to change its elasticity as customers have
the option of using their own generation or deferring the use of electricity.
National Electricity Market of Singapore
Market Clearing Price (MCP)
Inelastic demand
Staircase prices are electricity price offers submitted by Gencos.
The system demand shown by the vertical line is the half-hourly load forecast value obtained from Power System Operator (PSO) of EMA. 9
Source: EMA

• With the incorporation of DSM via microgrids and/or the associated energy management systems, the demand is no longer a vertical line.
• As can be seen from the left diagram, when demand is elastic, the electricity MCP is generally lower.
• By introducing more competition among Gencos (Government’s job), the electricity MCP is generally lower as can be seen from the right diagram.
• Vesting contracts, a form of price regulation, were introduced in 2004 to check market power.
Demand Elasticity and Competition
Quantity (MWh) QE
PE
Quantity (MWh)
PE
QE
Supply
Demand
Supply
Demand
10

11
Electricity Tariff in Singapore
For Q1 2015, Low Tension Tariff: 23.29 ¢/kWh. High Tension Small Tariff: Contracted and uncontracted capacity charges are 7.49 & 11.24 $/kW/Month; kWh peak, off-peak period and kVARh charges 21.05, 12.71 & 0.59 ¢.
Source: SP Services

Grid Performance
12 Source: EMA

Outage Response Team
13
• The entire distribution network in Singapore is divided into 5 zones, each managed by a crew that is on 24/7 standby.
• If a fault occurs, the standby crew of that particular zone is assigned to the site.
• This decentralized scheme means that the response team equipped with mobile generators can arrive on-site within 30 minutes.
• The team can provide temporary supply quickly while the network supply is being restored.
Source: SP PowerGrid

Distribution Control Center (DCC)
14
• Monitors network loadings, i.e. electricity consumption, and alarms of more than 9,000 substations.
• Performs 5,900 remote and 1,200 local switching to isolate parts of the network or electrical equipment in a month.
• Manages the Permit to Work (PTW) system by issuing 400 PTWs for work related to high-voltage circuits in a month.
• Tests 1,300 circuit breakers and 72 electricity network rings in a month.
Source: SP PowerGrid
Electricity Service Center (ESC)
15
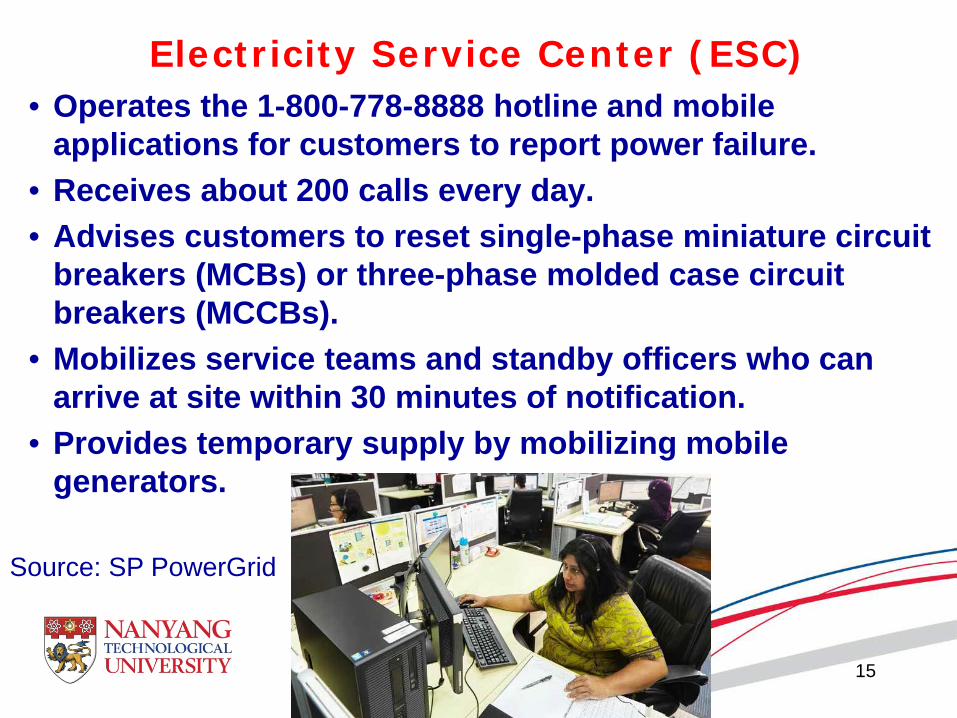
• Operates the 1-800-778-8888 hotline and mobile applications for customers to report power failure.
• Receives about 200 calls every day. • Advises customers to reset single-phase miniature circuit
breakers (MCBs) or three-phase molded case circuit breakers (MCCBs).
• Mobilizes service teams and standby officers who can arrive at site within 30 minutes of notification.
• Provides temporary supply by mobilizing mobile generators.
Source: SP PowerGrid
Singapore Power System Control Center
16
• Both DCC and ESC are housed in Ayer Rajah PSCC. • DCC and ESC work together to monitor and control the
operations of over 9,000 substations and 26,000 km of power cables.
• Manning the center 24/7 and maintaining electricity supply reliability for the entire nation is a team of 72 men and women working over three shifts.
• In the event of a LV electricity outage, customers call ESC where customer service officers will inform the operation team to dispatch maintenance crew to the site.
• Typically, an outage should be resolved in under 2 hours, a standard set by Energy Market Authority of Singapore.
Source: SP PowerGrid

Outage Management System (OMS)
17
• To enhance response time, an OMS was introduced on 29 December 2014.
• OMS streamlines the process by providing response teams with faster and more detailed information on outages.
• OMS is linked to customer account information in the Enterprise Business System (EBS). By doing so enables the user to know whether the supply had been cut due to an account-related issue or a technical issue.
• OMS is linked to a Gas & Electricity Mapping System that accurately identifies the exact location or affected circuitry on the network maps.
Source: SP PowerGrid

OMS - Contd
18
• Once the address of the fault location is received by OMS, the ESC operations officer will activate the ESC service vans and standby officers to the site.
• OMS assists the officers at the site to locate the fault and restore the supply quickly without the need to check each individual overground box in the area to identify the fault.
• OMS has a prediction engine that can help to trace a cluster of problems and find the suspected cause. It can let officers know if the fault is a new one or a chronic one.
• This helps officers to be more accurate in troubleshooting and it shortens supply restoration time.
• OMS cuts down the response time by about 20% and enhances the productivity of the staff.
Source: SP PowerGrid

Future Enhancements of OMS
19
• The outage response team will be equipped with tablets that can receive the address and information of faults wirelessly.
• OMS has the potential to further automate the advanced metering infrastructure (AMI) in collaboration with smart meters to create a smart grid communication network where meters can ‘talk’ to each other.
• These meters help to provide real-time information to better predict faults so that they can be attended to proactively and promptly.
Source: SP PowerGrid
Electricity Cable Tunnel Project
Source: EMA
• To meet the future increase in demand for power supply and to ensure the continued reliability and security of the network, Singapore Power is embarking on a $2 billion project to build cross-island transmission cable tunnels.
• Two tunnels, one running East-West (16.5 km) and another North-South (18.5 km) for a total of 35 km in length, will be built 60 m underground. The project commenced in 2013 and is scheduled for completion in 2018.
• The tunnels are designed to facilitate faster and more efficient maintenance and replacement of existing and future cables. The frequency of road-digging works for future cable replacement and repair will be minimized, resulting in less traffic congestion and disruption to the public.
20

Electricity Cable Tunnel Project (Contd)
21
Sewage, Current Power Grid & Natural Gas Pipes 1 to 3 metres deep
Underground Expressways 8-26 metres deep
U n d e r g r o u n d M R T 30 metres deep
Drainage System 40 metres deep
Electricity Transmission Main Artery 60 Metres deep
Source: SP PowerGrid

Clean and Renewable Energy
22

Clean Energy Initiatives in Singapore • Solar Energy
– Singapore is located in tropical sunbelt with an average solar yield of 1,150 kWh/kWp/year.
– Potential to tap on solar energy for power generation. – Energy from solar would be intermittent and highly variable due to
heavy cloud cover.
Solar PV System on a HDB Building 23
Source: EMA

Installed PV Capacity in Singapore
24
• As of 2012, a total capacity of 9,989 kWp of grid-connected solar PV systems has been installed in Singapore.
• The non-household sector constituted about 92.1% (or 9,199 kWp) of total capacity, with the remaining capacity contributed by household installations.
Source: EMA

Wind Energy
• Vestas has established its regional R&D Hub in Singapore. • Wind speeds in Singapore are generally low (avg < 1 m/s). • Wind speed increases with elevation. • A residential wind turbine’s cut-in speed is typically 3 m/s
though a newly developed small turbine requires 2.5 m/s. • For the turbine to reach its rated capacity, typically a wind
speed of approximately 12 m/s is needed.
Skystream 3.7 single-phase 2.4-kW wind turbine at EEE
25 Source: EMA

EMA’s Initiatives
26
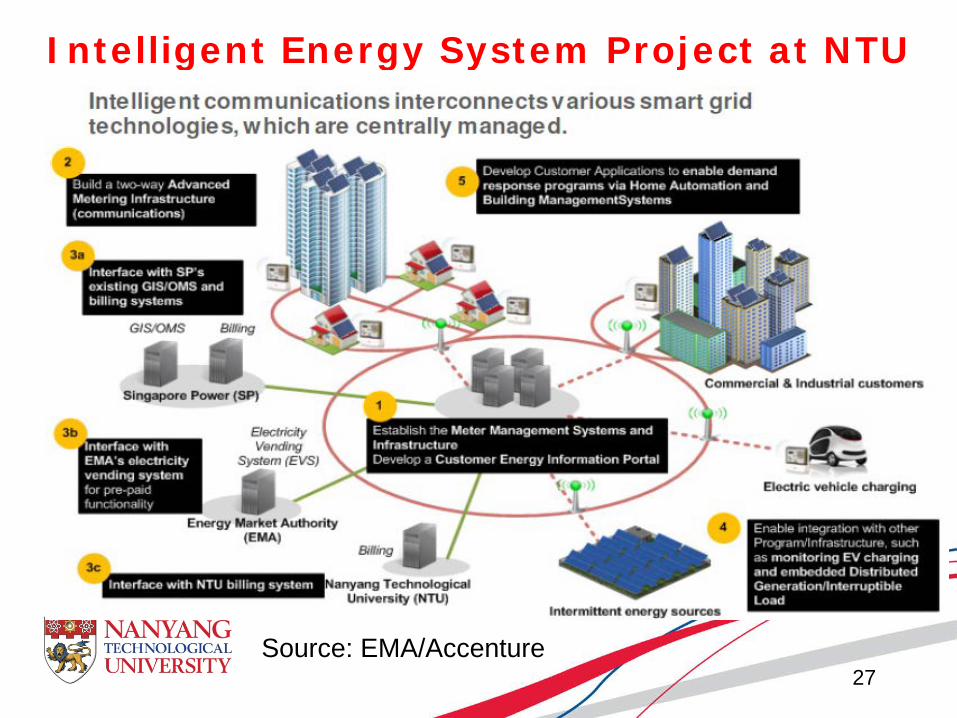
Intelligent Energy System Project at NTU
27 Source: EMA/Accenture

EMA’s Smart Meter Trials
Pre-paid scheme testing - Owner needs to top-up the credits in the meter when the balance becomes low.
Source: EMA
28
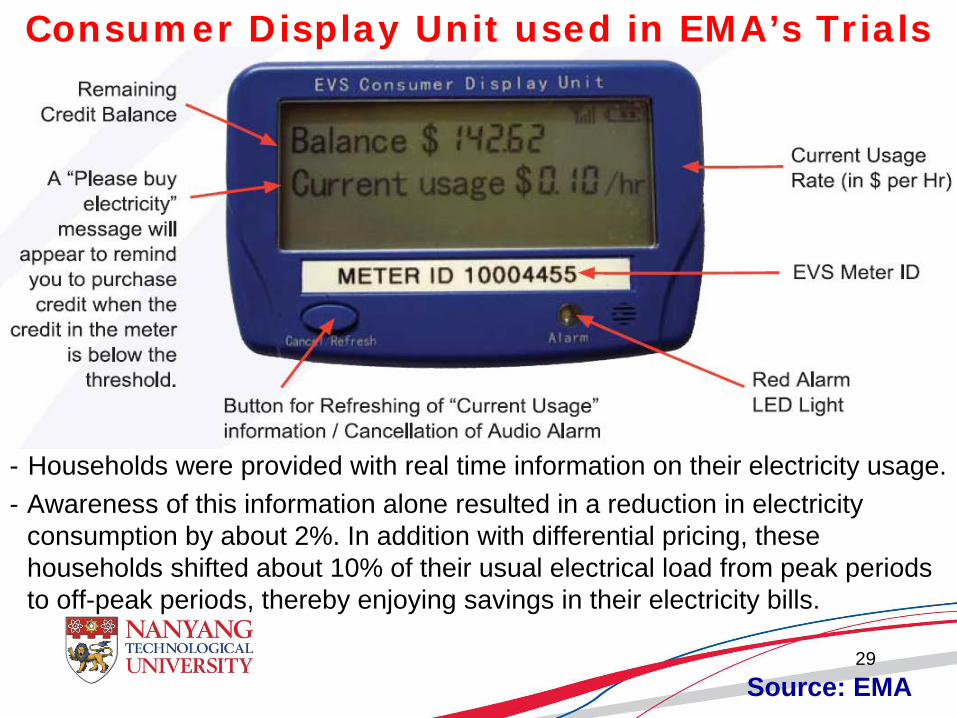
Consumer Display Unit used in EMA’s Trials
- Households were provided with real time information on their electricity usage. - Awareness of this information alone resulted in a reduction in electricity
consumption by about 2%. In addition with differential pricing, these households shifted about 10% of their usual electrical load from peak periods to off-peak periods, thereby enjoying savings in their electricity bills.
Source: EMA 29

Overall IES Solution
30 Source: EMA/Accenture

IHD, Home Automation
31 Source: EMA/Accenture

Consumer Energy Portal Project at NTU
32
• WHAT is a Consumer Energy Portal (CEP)?
It serves as a platform for utilities to provide web access to electricity consumers.
The energy services provided by utilities include: Energy usage monitoring - usage for each day of the
billing period. Energy cost monitoring - energy cost to date, projected
energy cost and historical cost. Energy saving tips - for educational purposes. Outage detection/notification. Distributed generation (DG) aggregation. Time of Use (ToU) pricing scheme implementation. Home Energy Management System - electrical appliances
can be controlled and monitored via CEP.

Consumer Energy Portal Project at NTU
33
• WHY NTU needs CEP?
To improve Electricity Billing System • Reduce cost due to electricity billing services. • Real-time electricity consumption will be collected remotely
and automatically through smart meters (SM). • Network Management System (NMS) is setup to manage
the smart meters and consumer’s data. To lower electricity bills
• Introduce Demand Response Management (DRM). ToU implementation and selection
• Energy plan selection to suit consumer’s lifestyle. Future smart grid implementation
• Consumers load profile analysis • Integration of alternative energy sources.

Consumer Energy Portal Project at NTU
34
Nanyang Meadows
Nanyang Terrace
Nanyang View
Network Management Server (NMS)
NTU Local Area Network (LAN) Last Mile Communications Internet
Staff Quarters
Communications Methods between CEP and Smart Meters
Consumers
Bi-directional

Consumer Energy Portal Project at NTU
35
GUI for Energy Plan Selection
Allow consumers to select their energy plans at certain periods.
Compute the energy costs incurred based on consumers’ past consumption and all available ToU Pricing schemes.
Recommend to consumers to subscribe to the plan of the lowest energy cost.
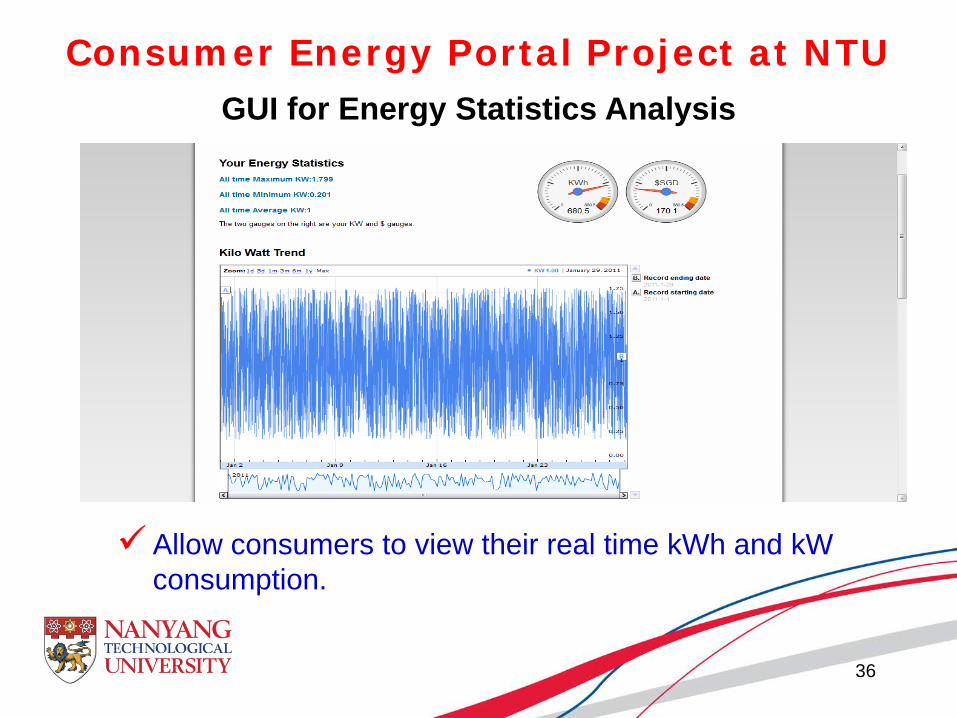
Consumer Energy Portal Project at NTU
36
Allow consumers to view their real time kWh and kW consumption.
GUI for Energy Statistics Analysis

Consumer Energy Portal Project at NTU
37
CEP-HEMS Integration
NMS @ NTU

Prepared by
T ZHANG and S X CHEN presented by
H B GOOI Associate Professor School of Electrical & Electronic Engineering 24 July 2015
Effective Studies of Storage Batteries for Frequency Regulation

2
1. Challenges
Electric power supply systems MUST be
Reliable: sufficient generation infrastructure must be available to meet the demand all the time.
Flexible: Generation should be able to vary very quickly based on the predicted and unpredicted fluctuations.
Intermittent generation have significant impacts on both Reliability and Flexibility.
Impacts of intermittent generation on Flexibility With high integration of intermittent PV generation. The required flexibility level in the system will increase. The available flexibility will decrease. The system inertia will decrease.

3
1. Challenges
Impacts of intermittent generation on Reliability
It is important to estimate the reliable capacity of all types of intermittent generation with respect to their maximum capacity as it represents the maximum generation that is available with very high probability during the peak hours.
For example, the reliable capacity of wind as a percentage of its maximum capacity in UK is 7-25%.
If a combination of different renewables can be deployed, the reliable capacity would be higher than summing the reliable capacity of individuals.
For a larger geographical location, the reliable capacity would be higher because the lows in one part can be compensated by highs in the other part.

4
2. Solutions
Imported electricity Connecting the national power system to other electricity networks potentially can
improve the reliability.
Geographic aggregation
Geographic aggregation has smoothing impacts on intermittent generation. It is of
vital importance to study space-time correlations between intermittent generations in a large geographical area.
5
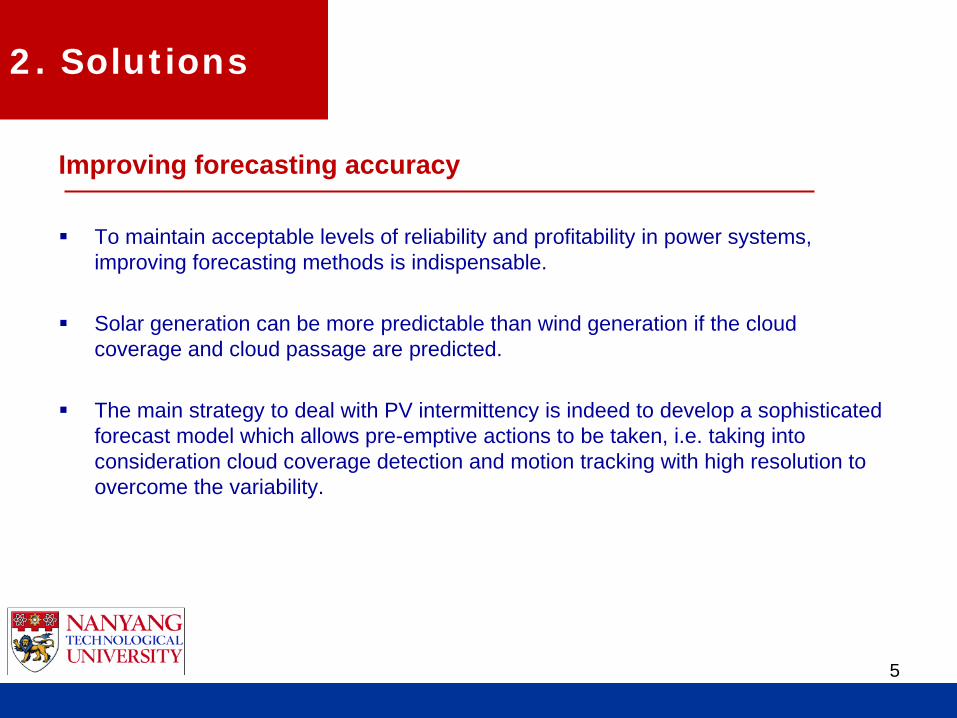
2. Solutions
Improving forecasting accuracy To maintain acceptable levels of reliability and profitability in power systems,
improving forecasting methods is indispensable.
Solar generation can be more predictable than wind generation if the cloud coverage and cloud passage are predicted.
The main strategy to deal with PV intermittency is indeed to develop a sophisticated forecast model which allows pre-emptive actions to be taken, i.e. taking into consideration cloud coverage detection and motion tracking with high resolution to overcome the variability.

6
2. Solutions
The most effective method for solar irradiance forecasts varies depending on the required spatial resolution and lead times.
Using ground-based sky imagers and cloud image processing techniques to predict future location of the cloud, cloud coverage and possible solar irradiance attenuation for the required lead time.
Several sensors should be installed to measure weather related variables. All the available data would be taken into consideration when predicting PV generation.
Improving forecasting accuracy >> Sky Imaging
Method Spatial Resolution Suitable forecast horizon
Numerical Weather Prediction 2-50 km 6 hours to 7 days
Satellite based imaging 1 km 1 to 6 hours
Ground sky imaging 10 to 100 meters 30 second to 1 hour
7
2. Solutions
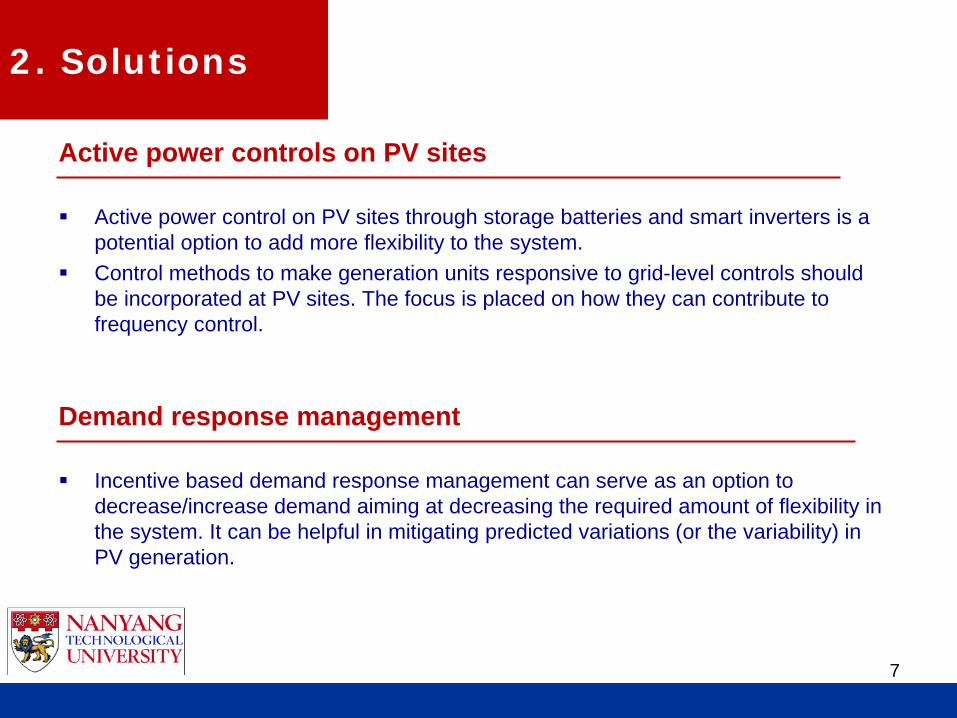
Active power controls on PV sites Active power control on PV sites through storage batteries and smart inverters is a
potential option to add more flexibility to the system. Control methods to make generation units responsive to grid-level controls should
be incorporated at PV sites. The focus is placed on how they can contribute to frequency control.
Demand response management Incentive based demand response management can serve as an option to
decrease/increase demand aiming at decreasing the required amount of flexibility in the system. It can be helpful in mitigating predicted variations (or the variability) in PV generation.

8
Virtual Power Plant (VPP)
3. Existing Works

9
If LiB (Li-ion battery) system 3 is unable to provide the needed power, e.g. low SOC, charge/discharge control signals can be redistributed to the other LiB systems.
3. Existing Works
A virtual power plant (VPP) is a cluster of decentralized generation installations, which are controlled from a central point or a control centre. These installations can be CHP micro-turbines, wind turbines, solar panel arrays, small hydro generators, storage batteries, etc. Through the VPP arrangement, these small decentralized generation installations achieve the characteristic of a big power plant.
Distributed Battery Systems in VPP

10
System Frequency Studies with VPP
Power System Frequency Dynamics Model
The frequency response is studied by summing up all the PV and battery systems installed in the distributed power system and injecting their total active power into the power system frequency dynamics model. The total load of the power system is 400MW and the load fluctuation is under 20MW which is 5% of the total load. The frequency deviation capacity of the thermal plant is 20MW (5% of peak load). The capacity of the battery system which participates in the frequency regulation is 0.6MW, about 3% of that of the thermal generation.
3. Existing Works

11
Storage Battery (SB) Frequency Regulation
3. Existing Works
Block-diagram of AGC system
Aggregated multiple BESS system LFC algorithm for aggregated BESS
Thermal power plant simulation model

12
SB Constraints
If SOC is greater than or equal to 0.95, SB cannot be charged anymore. If SOC is less than or equal to 0.05, SB cannot be discharged anymore.
1
( 1) ( )15
n
npdt
SOC n SOC nkWh
+
+ = − ∫
• Initial SOC: 0.5
3. Existing Works
13
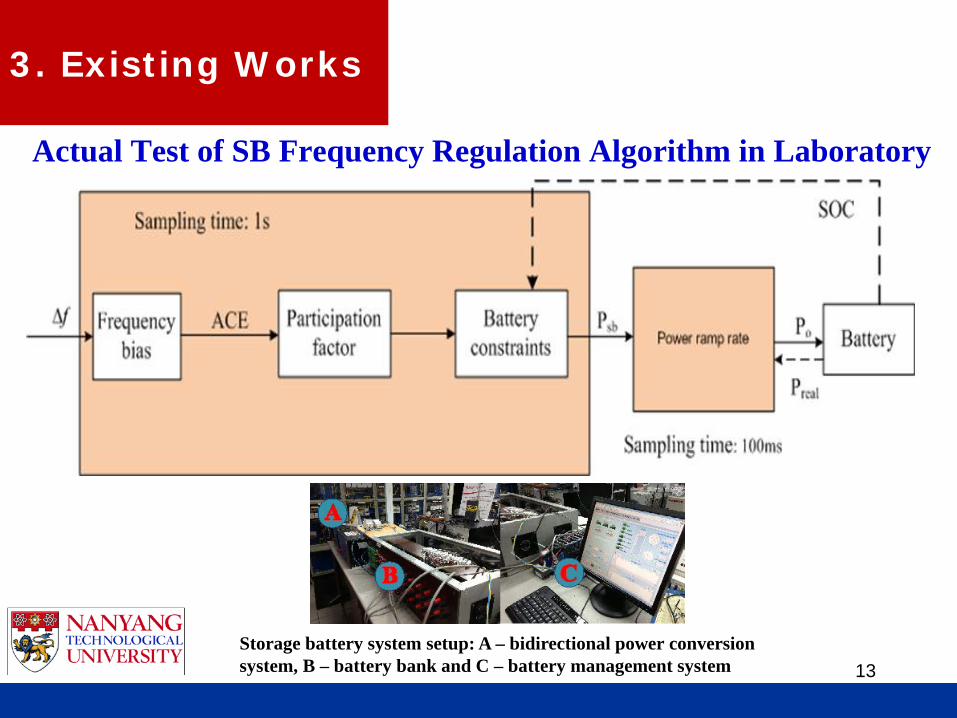
Actual Test of SB Frequency Regulation Algorithm in Laboratory
3. Existing Works
Storage battery system setup: A – bidirectional power conversion system, B – battery bank and C – battery management system

14
System Frequency Studies with VPP (Contd) The output of the PV and battery system can listen to the LFC command. This and the output regulation of the thermal power plant help to adjust the system frequency. The frequency change is always regulated to be less than 0.2 Hz.
Results of System Frequency Studies with VPP
4. Results

15
Control Performance Standard (CPS)
CPS scores with different BESS penetration rates
4. Results

16
System Frequency Studies with VPP (Contd)
Frequency distribution with different BESS penetration rates
4. Results
17
4. Results
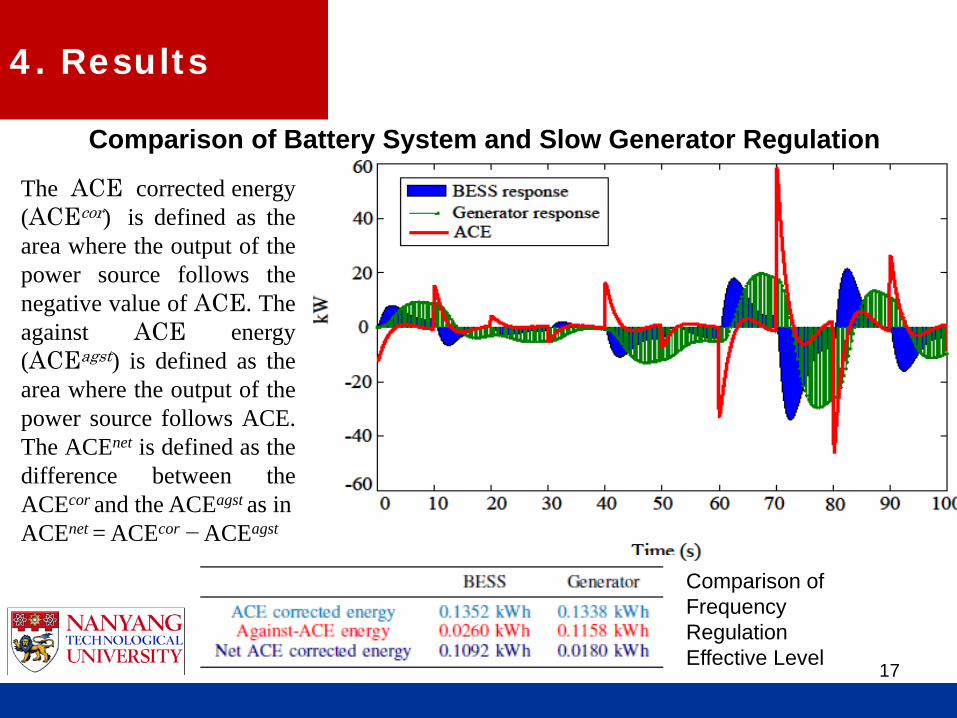
Comparison of Battery System and Slow Generator Regulation
Comparison of Frequency Regulation Effective Level
The ACE corrected energy (ACEcor) is defined as the area where the output of the power source follows the negative value of ACE. The against ACE energy (ACEagst) is defined as the area where the output of the power source follows ACE. The ACEnet is defined as the difference between the ACEcor and the ACEagst as in ACEnet = ACEcor − ACEagst

18
Effective Index (EI):
Effectiveness study results with different disturbance power
4. Results

19
Singapore Frequency Data for Nov 2012
Time period: 01 Nov 2012 – 20 Nov 2012 Sampling time: 1/25s (original data from PMU)
4. Results

20
Simulation Results
SOC of Storage Battery
4. Results

21
Simulation Results
SOC of Storage Battery over 2 to 3 days
4. Results

22
Simulation Results
Output of Storage Battery
4. Results

23 Output of Storage Battery
4. Results

24
Equivalent Discharge/Charge Cycles
Total discharged energy 502kWh 502/15 =33.5
Total charged energy 508kWh 508/15 =33.9
Percentage of Total Time Period
Total non-response time of SB 140863s or 1.63 days
140863/1728000=8.15%
Simulation Results
4. Results

25
Simulation Results Comparison
Equivalent Usage Life Cycles
Percentage of Total Non-Response Time Period
One week (17 Jan 2013 – 25 Jan 2013)
11.8
8.03%
20 days (Nov 2012)
33.7 8.15%
40 days (Nov 2012 – Dec 2012)
63.35
8.47%
4. Results

26
Thank You


