Page 1
EQ Building Performance Inc. | 20 Floral Parkway, Concord, Ontario, L4K 4R1 | 416-645-1186 | www.eqbuilding.com
Energy Strategy Report
320 McCowan Road
Blauson Assets Management Ltd. c/o Ling Kee Group
Toronto, ON
February 14, 2020
Revision: 0
Issued for: Re-Zoning
Page 2
Energy Strategy Report – 320 McCowan Road
EQ Building Performance Inc. Page i
EXECUTIVE SUMMARY
320 McCowan Road on behalf of Blauson Assets Management Ltd. c/o Ling Kee Group has retained EQ Building
Performance (EQ) to develop an Energy Strategy Report for the 320 McCowan Road project (the “Proposed
Development”). The Proposed Development consists of one 31-storey and one 27-storey residential tower,
both atop a 6-storey podium, and will contain residential suites, amenity space, storage spaces and parking
garage spaces in one underground parking floor. The development includes a total of 520 residential suites.
The development team will be targeting TGS version 3, Tier 1, though this report will explore high performance
design options which may be considered further and discussed as the design progresses.
The Proposed Development is subject to the energy requirements of the Ontario Building Code Supplementary
Standard SB-10 as well as the newly implemented Toronto Green Standard version 3. EQ has predicted the
energy use, thermal demand, and expected carbon impact of the project in compliance with these
requirements, outlined in Table i below. The development team is committed to creating a high performing
community in line with TGS version 3 Tier 1 performance requirements.
Toronto Green Standard version 2 formerly required performance levels over the building code, while version
3 uses an absolute target approach for the most predominant building archetypes – high-rise residential, low-
rise residential, retail, and office. As this project falls within these archetypes, the City of Toronto Zero Emissions
Building Framework has been used for energy analysis.
Energy, thermal demand, and carbon emissions are predicted for TGS v3 Tier 1 and TGS v3 Tier 2 levels of
performance. In addition, a ‘Towards Net Zero’ scenario is presented, predicting how the development would
need to perform to achieve near net zero levels of performance, in line with TGS v3 Tier 4.
Table i - Predicted Energy, Carbon, and Thermal Demand Performance Summary
TGS V3 Tier
1 TGS V3 Tier
2 Towards Net
Zero
Total Energy Use Intensity (ekWh/m2) – EUI 170.0 135.0 75.0
% Savings vs Tier 1 - 21% 56%
GHG intensity (kg CO2e/m2) – GHGI 20.0 15.0 5.0
% Savings vs Tier 1 - 25% 75%
Thermal Energy Demand Intensity (ekWh/m2) – TEDI 70.0 50.0 15.0
% Savings vs Tier 1 - 29% 79%
If the project were to pursue Tier 2 or higher performance, it would be eligible for up to $1,505,509 as a
development charge refund.
This report outlines design strategies to achieve each of the presented targets. Advanced measures such as
district energy systems and solar PV are recommended for further exploration, however further detailed
analysis is outside the scope of this report as it is not expected to be completed at this stage of development.
If advanced measures are pursued, they can be explored using the energy model developed for Site Plan
Approval. Design options are also presented to provide enhanced resilience for the Proposed Development and
should be evaluated further on a feasibility and cost basis.
Page 3
Energy Strategy Report – 320 McCowan Road
EQ Building Performance Inc. Page ii
The strategies outlined in this report will be evaluated by the design team throughout design development.
Using a combination of strategies from the energy strategy report, the Proposed Development will achieve
Toronto Green Standard v3 Tier 1 performance levels.
Page 4
Energy Strategy Report – 320 McCowan Road
EQ Building Performance Inc. Page iii
TABLE OF CONTENTS
Executive Summary ............................................................................................................................................... i
1 Introduction .................................................................................................................................................1
2 Purpose ........................................................................................................................................................1
3 Design Options .............................................................................................................................................2
3.1 Passive Design Measures ......................................................................................................................2
3.2 Active Design Measures .......................................................................................................................5
4 Energy Analysis .............................................................................................................................................7
4.1 Toronto Green Standard - Towards Net Zero Development ................................................................7
4.2 Energy Targets ......................................................................................................................................8
4.3 Predicted Energy Use ...........................................................................................................................9
5 Towards Net Zero Development ............................................................................................................... 12
5.1 Energy Conservation & Demand Reduction ...................................................................................... 12
5.2 Low Carbon Solutions ........................................................................................................................ 13
6 Advanced Energy Solutions ....................................................................................................................... 14
6.1 District Energy Systems ..................................................................................................................... 14
6.1.1 Types of District Energy Systems ............................................................................................... 14
6.1.2 District Energy Potential ............................................................................................................ 14
6.2 Renewable Strategies: Solar PV ......................................................................................................... 16
6.3 Additional Advanced Energy Solutions .............................................................................................. 18
7 Energy Resilience ....................................................................................................................................... 19
8 Embodied Energy ...................................................................................................................................... 21
9 Other Toronto Green Standard V3 Energy, Efficiency, GHG & Resilience Credits ..................................... 22
10 Conclusions/Recommendations ............................................................................................................ 23
Appendix A – Energy Conservation Measures Summary ................................................................................... 24
Appendix B – Detailed Expected Energy Performance ...................................................................................... 26
Appendix C – Resilience Checklist ..................................................................................................................... 28
Page 5
Energy Strategy Report – 320 McCowan Road
EQ Building Performance Inc. Page 1
1 INTRODUCTION
The Proposed Development consists of one 31-storey and one 27-storey residential tower, both atop a 6-storey
podium, and will contain residential suites, amenity space, storage spaces and parking garage spaces in one
underground parking floor. The development includes a total of 520 residential suites.
Currently, the project will at a minimum meet Toronto Green Standard version 3 Tier 1 requirements, however
this report will explore additional options for higher performance design, which may be considered further as
the design progresses
Figure 1. Proposed Project Site Plan
2 PURPOSE
The City of Toronto has developed a number of sustainability policies in order to address climate change, with
particular focus on net-zero development and energy resilience. For buildings greater than 20,000 sq.m. or
within a Community Energy Plan area approved by Council, the City of Toronto has recently introduced the
requirement for an Energy Strategy Report. The intent of the report is outlined in the Energy Strategy Terms of
Reference and encourages projects to:
- Take advantage of existing or planned energy infrastructure, passive design, and renewable energy
- Consider energy sharing for multi-building developments
- Consider increased resiliency such as strategic back-up power capacity
- Identify innovative solutions to reduce energy consumption
- Explore engaging private investment in energy sharing systems
In 2018, the City of Toronto also introduced the Downtown Secondary Plan, which requires a Complete
Community Assessment. While this project is not subject to the Downtown Secondary Plan, most of the
requirements are identical to the requirements of the Energy Strategy Terms of Reference, with a few notable
added discussion points:
Page 6
Energy Strategy Report – 320 McCowan Road
EQ Building Performance Inc. Page 2
- Work with thermal energy network owners and operators to reduce GHG emissions from existing
thermal energy networks
- Promote residential buildings retrofits, focusing on conservation and energy efficiency initiatives on
existing multi-unit residential buildings Downtown
- Encourage development applicants to salvage and reuse materials through the higher levels of the TGS
through the Energy Strategy Report
While some of these are outside the scope of the developer, or this project, they have been incorporated into
this report as applicable for the benefit of the design team.
While all of the strategies discussed are identified during re-zoning, they are developed during the Site Plan
Application process in combination with Toronto Green Standard (TGS) requirements to inform design.
The current version of TGS is Version 3, came into effect in May 2018 and requires further energy efficiency
than TGS v2. In Version 3, TGS consists of four performance tiers, Tiers 1 - 4. Tier 1 is mandatory for all
developments, while Tiers 2 - 4 are optional and currently incentivized by a partial development charge refund.
The various Tiers were established to demonstrate to the building industry the step changes that will be
required to drive toward zero emission buildings. The City of Toronto’s Zero Emissions Building Framework
describes the various tiers, where Tier 4 compliance is roughly aligned with a Net Zero Ready level of
performance.
At this stage, the Proposed Development is currently applying for rezoning. During SPA, the Proposed
Development will need to comply with TGS version 3, Tier 1 performance.
3 DESIGN OPTIONS
3.1 PASSIVE DESIGN MEASURES
At this point in design, the materiality of the building envelope is still under consideration. Given the
surrounding built area, precast or spandrel and a moderate-to-high window-to-wall ratio are anticipated in the
building. While it is too early in design for envelope interface details to be developed, the project team will
carefully consider these details as design progresses. Under current building code requirements, only limited
thermal bridging accounting is required to account for major structural elements such as spandrel back-pans,
steel studs, and balconies. Current requirements also allow up to 2% of the building envelope major thermal
bridges (such as balconies) to be excluded from effective thermal performance calculations. Under the new
TGS v3 modelling requirements, however, all thermal bridges will need to be accounted for. This introduces
new focus on architectural elements that may not have been considered in detail under current building code
or previous TGS v2 requirements, including:
- Opaque Wall and Glazing Interfaces
- Interior and Exterior Wall Interfaces
- Slab bypasses
- Balconies
- Parapet and terrace details
Page 7
Energy Strategy Report – 320 McCowan Road
EQ Building Performance Inc. Page 3
By fully accounting for all thermal bridges, a more accurate representation of thermal performance of the
envelope can be used in the model, reflecting more accurate energy use estimation. While each project will
have different performance values, EQ has completed these calculations on some similar projects using
spandrel panels. A typical spandrel assembly with insulation in both the back-pan and back-up wall may have a
nominal R-20 performance, which would currently be modelled as an effective R-9 with minimal thermal
bridging accounting. With full thermal bridges accounted for, this effective performance typically drops closer
to R-4; a significant decrease in performance. Considering these details early in design can significantly improve
the envelope performance and overall energy performance in a passive way. BC Hydro has developed the
Building Envelope Thermal Bridging Guideline1, which is a useful resource to evaluate interface details early in
design. This guide shows a number of different approaches to detail the building envelope in order to reduce
thermal bridging. While this additional thermal bridging accounting is only currently required under the
absolute targets required by TGS v3, these calculations are expected to become part of building code and other
high performance standards over time as they are more accurate to the real life performance of the envelope.
In terms of glazing for the project, a high performance product with a low solar heat gain coefficient will be
encouraged. This will provide daylight while reducing over-heating in shoulder seasons and cooling loads in the
summer. Moving to higher Toronto Green Standard Tiers and other energy standards become stricter, targeting
a 40% window-to-wall ratio will be needed in the future to improve the overall envelope performance. The
Proposed Design will aim to achieve a balance of daylighting and a high-energy performance for the building
envelope.
The orientation of the buildings has been defined by the nature of the site, limiting opportunities for
optimization. Throughout design, the design team will explore options for control of solar gains via external
overhangs and shading to limit overheating as appropriate for each building elevation. Electrochromic glazing
(glass that tints in response to solar intensity or sun position) can also serve this purpose, while maximizing
daylighting and view in the residential spaces. It is expected these measures will have a positive impact on the
building cooling and heating loads.
Full thermal bridging calculations not only better reflect the energy usage in a building, but also give a better
representation of the thermal comfort within a space. With a poor performing envelope, the first few feet of a
space adjacent to the exterior wall can be unusable due to thermal comfort issues. Improving the performance
of the wall can increase occupant comfort significantly and can allow for mechanical equipment to be
downsized. Additionally, as interior spaces are better able to maintain their temperature set-points, HVAC run
times and system cycling can be reduced leading to increased HVAC system life times. Passive design measures
can also effect the resilience of a building. Additional information on this is available in Section 7 – Energy
Resilience of this report.
As design progresses through Site Plan Approval and building code review, the design team will consider a
number of passive design measures. A description of measures for each analyzed Tier, as well as estimated cost
premiums provided by the City of Toronto Zero Emissions Building Framework (Appendix D) have been provided
1https://www.bchydro.com/content/dam/BCHydro/customer-portal/documents/power-smart/builders-developers/building-envelope-thermal-bridging-guide-1.1.pdf
Page 8
Energy Strategy Report – 320 McCowan Road
EQ Building Performance Inc. Page 4
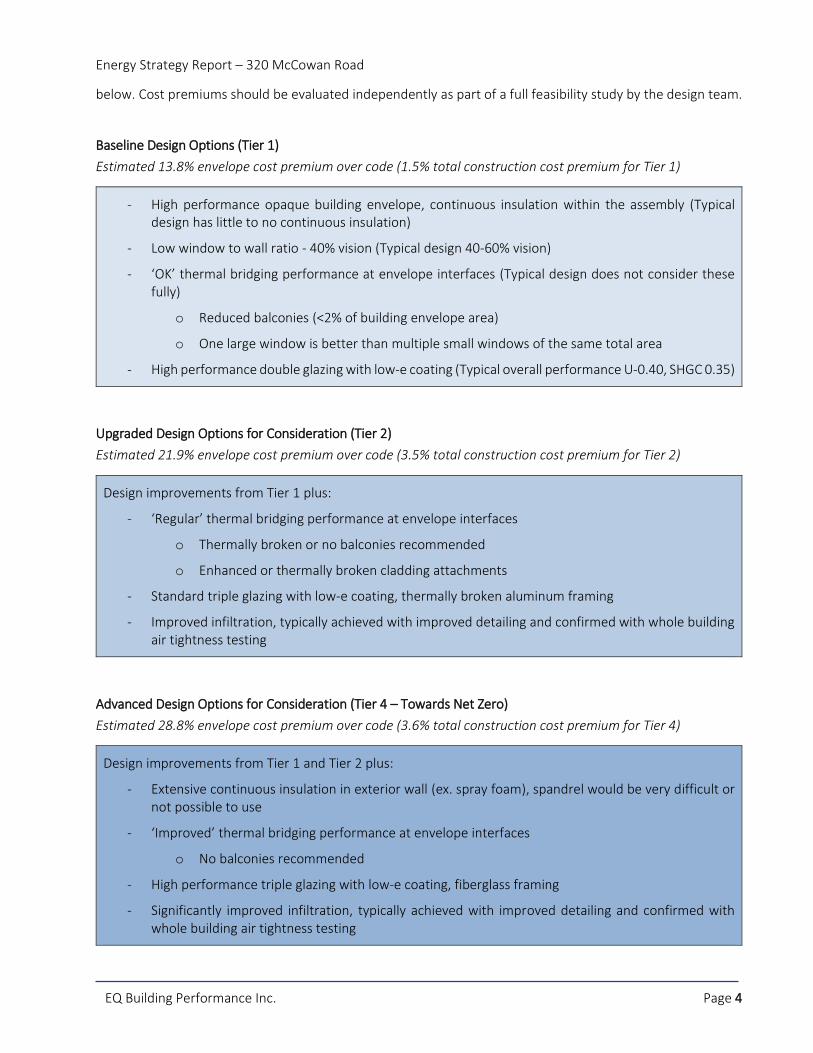
below. Cost premiums should be evaluated independently as part of a full feasibility study by the design team.
Baseline Design Options (Tier 1)
Estimated 13.8% envelope cost premium over code (1.5% total construction cost premium for Tier 1)
- High performance opaque building envelope, continuous insulation within the assembly (Typical design has little to no continuous insulation)
- Low window to wall ratio - 40% vision (Typical design 40-60% vision)
- ‘OK’ thermal bridging performance at envelope interfaces (Typical design does not consider these fully)
o Reduced balconies (<2% of building envelope area)
o One large window is better than multiple small windows of the same total area
- High performance double glazing with low-e coating (Typical overall performance U-0.40, SHGC 0.35)
Upgraded Design Options for Consideration (Tier 2)
Estimated 21.9% envelope cost premium over code (3.5% total construction cost premium for Tier 2)
Design improvements from Tier 1 plus:
- ‘Regular’ thermal bridging performance at envelope interfaces
o Thermally broken or no balconies recommended
o Enhanced or thermally broken cladding attachments
- Standard triple glazing with low-e coating, thermally broken aluminum framing
- Improved infiltration, typically achieved with improved detailing and confirmed with whole building air tightness testing
Advanced Design Options for Consideration (Tier 4 – Towards Net Zero)
Estimated 28.8% envelope cost premium over code (3.6% total construction cost premium for Tier 4)
Design improvements from Tier 1 and Tier 2 plus:
- Extensive continuous insulation in exterior wall (ex. spray foam), spandrel would be very difficult or not possible to use
- ‘Improved’ thermal bridging performance at envelope interfaces
o No balconies recommended
- High performance triple glazing with low-e coating, fiberglass framing
- Significantly improved infiltration, typically achieved with improved detailing and confirmed with whole building air tightness testing
Page 9
Energy Strategy Report – 320 McCowan Road
EQ Building Performance Inc. Page 5
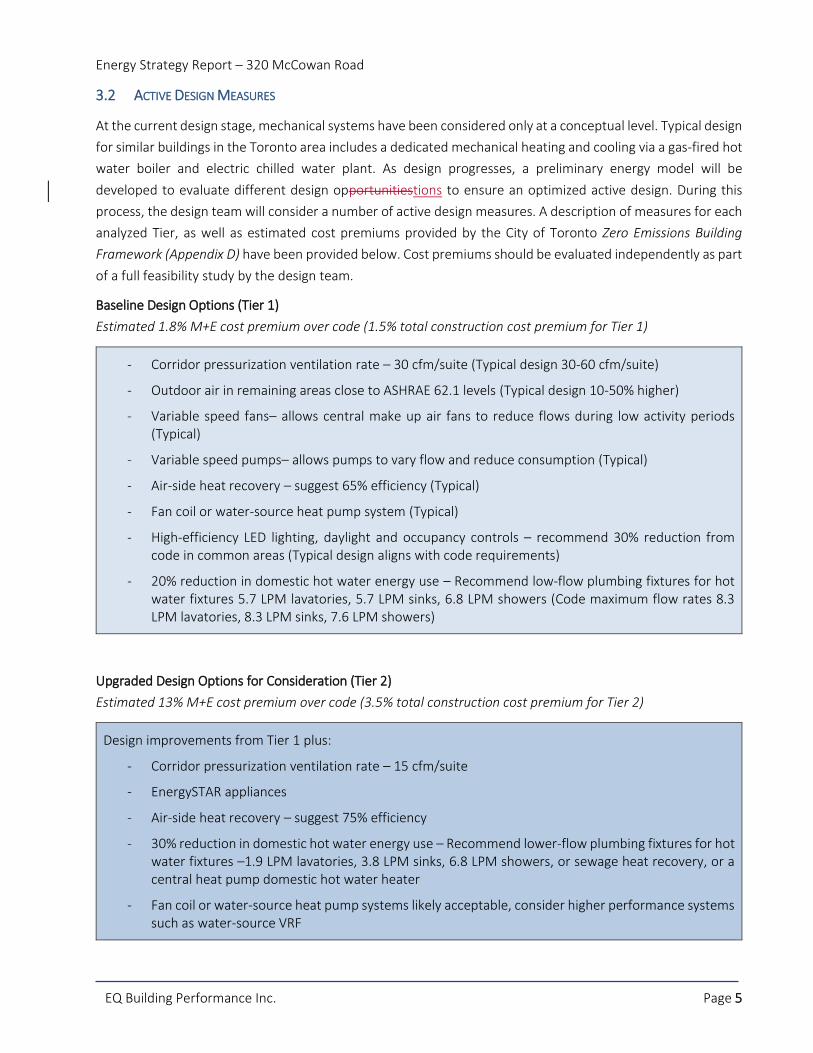
3.2 ACTIVE DESIGN MEASURES
At the current design stage, mechanical systems have been considered only at a conceptual level. Typical design
for similar buildings in the Toronto area includes a dedicated mechanical heating and cooling via a gas-fired hot
water boiler and electric chilled water plant. As design progresses, a preliminary energy model will be
developed to evaluate different design opportunitiestions to ensure an optimized active design. During this
process, the design team will consider a number of active design measures. A description of measures for each
analyzed Tier, as well as estimated cost premiums provided by the City of Toronto Zero Emissions Building
Framework (Appendix D) have been provided below. Cost premiums should be evaluated independently as part
of a full feasibility study by the design team.
Baseline Design Options (Tier 1)
Estimated 1.8% M+E cost premium over code (1.5% total construction cost premium for Tier 1)
- Corridor pressurization ventilation rate – 30 cfm/suite (Typical design 30-60 cfm/suite)
- Outdoor air in remaining areas close to ASHRAE 62.1 levels (Typical design 10-50% higher)
- Variable speed fans– allows central make up air fans to reduce flows during low activity periods (Typical)
- Variable speed pumps– allows pumps to vary flow and reduce consumption (Typical)
- Air-side heat recovery – suggest 65% efficiency (Typical)
- Fan coil or water-source heat pump system (Typical)
- High-efficiency LED lighting, daylight and occupancy controls – recommend 30% reduction from code in common areas (Typical design aligns with code requirements)
- 20% reduction in domestic hot water energy use – Recommend low-flow plumbing fixtures for hot water fixtures 5.7 LPM lavatories, 5.7 LPM sinks, 6.8 LPM showers (Code maximum flow rates 8.3 LPM lavatories, 8.3 LPM sinks, 7.6 LPM showers)
Upgraded Design Options for Consideration (Tier 2)
Estimated 13% M+E cost premium over code (3.5% total construction cost premium for Tier 2)
Design improvements from Tier 1 plus:
- Corridor pressurization ventilation rate – 15 cfm/suite
- EnergySTAR appliances
- Air-side heat recovery – suggest 75% efficiency
- 30% reduction in domestic hot water energy use – Recommend lower-flow plumbing fixtures for hot water fixtures –1.9 LPM lavatories, 3.8 LPM sinks, 6.8 LPM showers, or sewage heat recovery, or a central heat pump domestic hot water heater
- Fan coil or water-source heat pump systems likely acceptable, consider higher performance systems such as water-source VRF
Page 10
Energy Strategy Report – 320 McCowan Road
EQ Building Performance Inc. Page 6
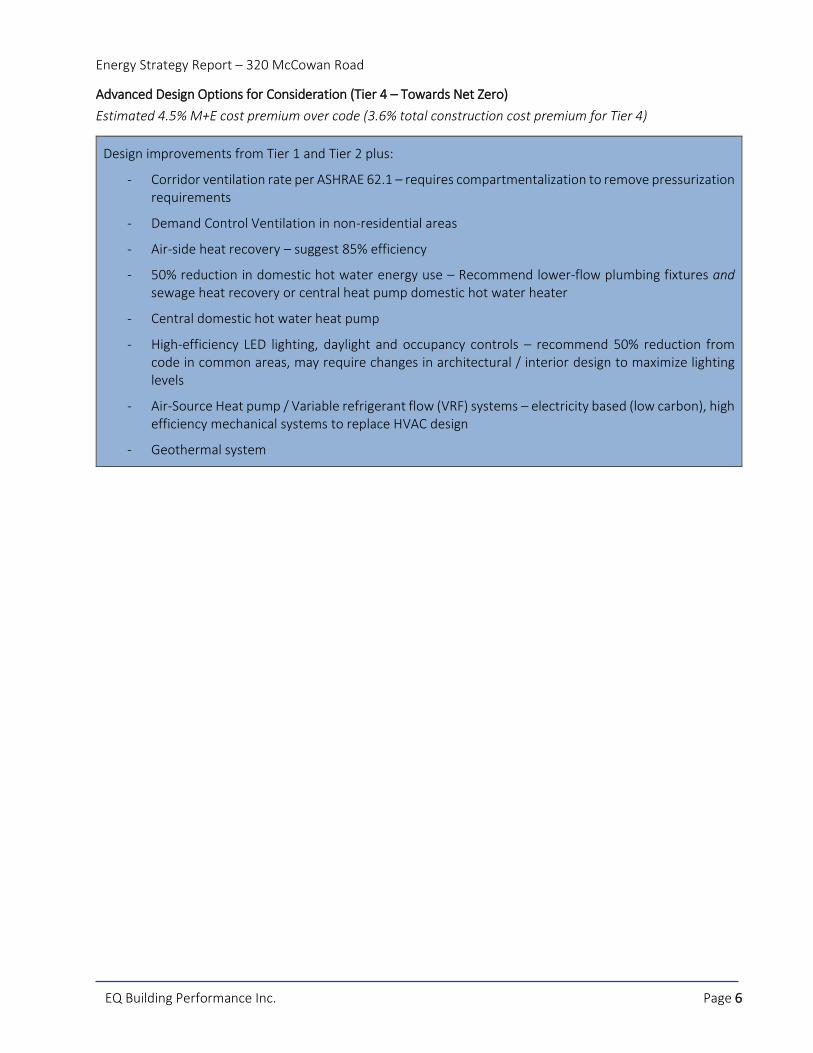
Advanced Design Options for Consideration (Tier 4 – Towards Net Zero)
Estimated 4.5% M+E cost premium over code (3.6% total construction cost premium for Tier 4)
Design improvements from Tier 1 and Tier 2 plus:
- Corridor ventilation rate per ASHRAE 62.1 – requires compartmentalization to remove pressurization requirements
- Demand Control Ventilation in non-residential areas
- Air-side heat recovery – suggest 85% efficiency
- 50% reduction in domestic hot water energy use – Recommend lower-flow plumbing fixtures and sewage heat recovery or central heat pump domestic hot water heater
- Central domestic hot water heat pump
- High-efficiency LED lighting, daylight and occupancy controls – recommend 50% reduction from code in common areas, may require changes in architectural / interior design to maximize lighting levels
- Air-Source Heat pump / Variable refrigerant flow (VRF) systems – electricity based (low carbon), high efficiency mechanical systems to replace HVAC design
- Geothermal system
Page 11
Energy Strategy Report – 320 McCowan Road
EQ Building Performance Inc. Page 7
4 ENERGY ANALYSIS
4.1 TORONTO GREEN STANDARD - TOWARDS NET ZERO DEVELOPMENT
Version 3 of the TGS came into effect on May 1, 2018. The energy requirements for Mid to High-Rise Residential
& All Non-Residential development are outlined in the recently published City of Toronto Zero Emissions
Building Framework2. In this document, future versions of the TGS will become more stringent over time in
terms of energy use, thermal demand, and carbon emissions. The goal of this framework is to require near zero
emissions levels for all new developments by 2030 by increasing performance levels every 4 years, starting with
version 3 of the TGS. In all cases, Tier 1 is mandatory for all new developments in the city, while Tier 2, 3 and 4
are optional increased performance levels incentivized with a development charge refund.
Current energy standards in Ontario use a ‘reference’ building approach for compliance, comparing the
proposed building as designed to a reference building designed with minimum code requirements. This allows
buildings to more easily trade off deficient performance in one area with superior performance in others (i.e. a
less effective building envelope with higher performance mechanical systems).
Version 3 of the TGS replaces this current approach by using three new absolute targets. The intent of moving
to absolute targets is to encourage all buildings to meet the same standards of performance regardless of
design. In contrast, actual performance may vary dramatically between buildings when using the reference
building approach. The Zero Emissions Building Framework proposed the following three targets:
1. Energy Use Intensity – EUI – ekWh/m2: Annual building energy use, divided by conditioned floor area.
2. Thermal Energy Demand Intensity – TEDI – kWh/m2: Annual heating load, divided by the conditioned
floor area. TEDI excludes the effects of mechanical efficiencies (e.g. condensing boilers) but does
include passive systems such as air heat recovery, solar gains, and internal gains.
2 http://www1.toronto.ca/City%20Of%20Toronto/City%20Planning/Developing%20Toronto/Files/pdf/TGS/Zero%20 Emissions%20Buildings%20Framework%20Report.pdf
Figure 1 - Zero Emissions Buildings Framework Path to Net Zero (City of Toronto, 2017)
Page 12
Energy Strategy Report – 320 McCowan Road
EQ Building Performance Inc. Page 8
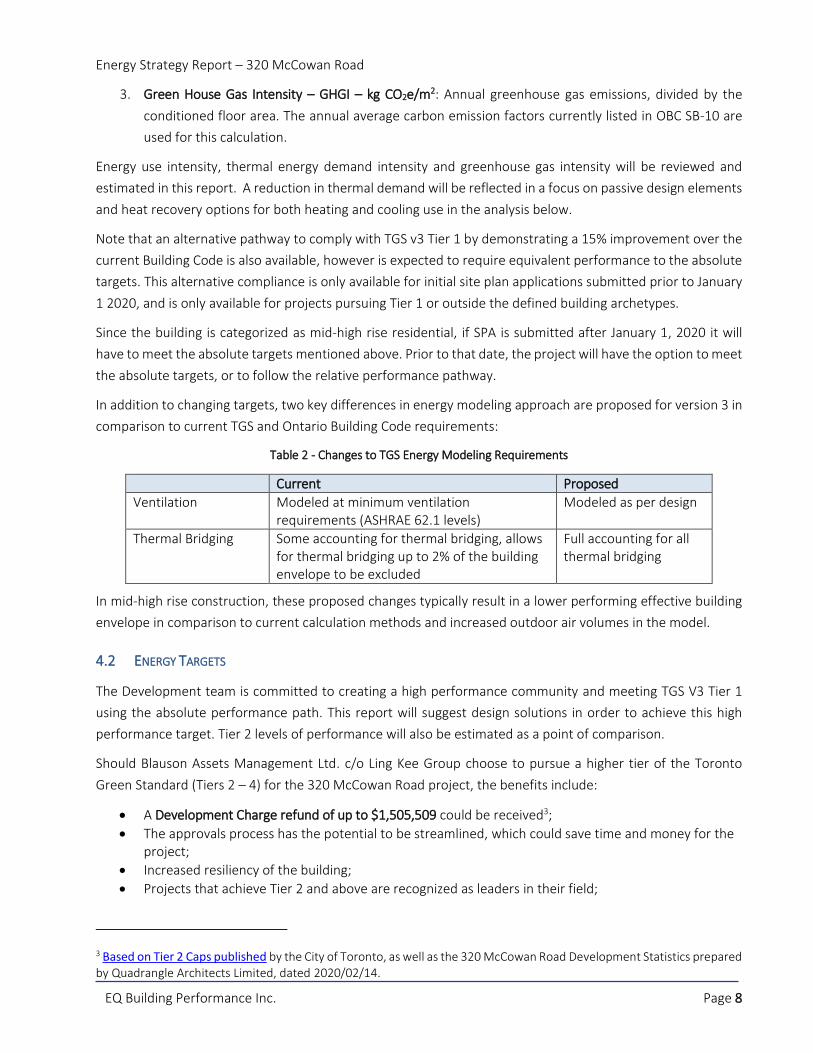
3. Green House Gas Intensity – GHGI – kg CO2e/m2: Annual greenhouse gas emissions, divided by the
conditioned floor area. The annual average carbon emission factors currently listed in OBC SB-10 are
used for this calculation.
Energy use intensity, thermal energy demand intensity and greenhouse gas intensity will be reviewed and
estimated in this report. A reduction in thermal demand will be reflected in a focus on passive design elements
and heat recovery options for both heating and cooling use in the analysis below.
Note that an alternative pathway to comply with TGS v3 Tier 1 by demonstrating a 15% improvement over the
current Building Code is also available, however is expected to require equivalent performance to the absolute
targets. This alternative compliance is only available for initial site plan applications submitted prior to January
1 2020, and is only available for projects pursuing Tier 1 or outside the defined building archetypes.
Since the building is categorized as mid-high rise residential, if SPA is submitted after January 1, 2020 it will
have to meet the absolute targets mentioned above. Prior to that date, the project will have the option to meet
the absolute targets, or to follow the relative performance pathway.
In addition to changing targets, two key differences in energy modeling approach are proposed for version 3 in
comparison to current TGS and Ontario Building Code requirements:
Table 2 - Changes to TGS Energy Modeling Requirements
Current Proposed
Ventilation Modeled at minimum ventilation requirements (ASHRAE 62.1 levels)
Modeled as per design
Thermal Bridging Some accounting for thermal bridging, allows for thermal bridging up to 2% of the building envelope to be excluded
Full accounting for all thermal bridging
In mid-high rise construction, these proposed changes typically result in a lower performing effective building
envelope in comparison to current calculation methods and increased outdoor air volumes in the model.
4.2 ENERGY TARGETS
The Development team is committed to creating a high performance community and meeting TGS V3 Tier 1
using the absolute performance path. This report will suggest design solutions in order to achieve this high
performance target. Tier 2 levels of performance will also be estimated as a point of comparison.
Should Blauson Assets Management Ltd. c/o Ling Kee Group choose to pursue a higher tier of the Toronto
Green Standard (Tiers 2 – 4) for the 320 McCowan Road project, the benefits include:
A Development Charge refund of up to $1,505,509 could be received3;
The approvals process has the potential to be streamlined, which could save time and money for the project;
Increased resiliency of the building;
Projects that achieve Tier 2 and above are recognized as leaders in their field;
3 Based on Tier 2 Caps published by the City of Toronto, as well as the 320 McCowan Road Development Statistics prepared by Quadrangle Architects Limited, dated 2020/02/14.
Page 13
Energy Strategy Report – 320 McCowan Road
EQ Building Performance Inc. Page 9
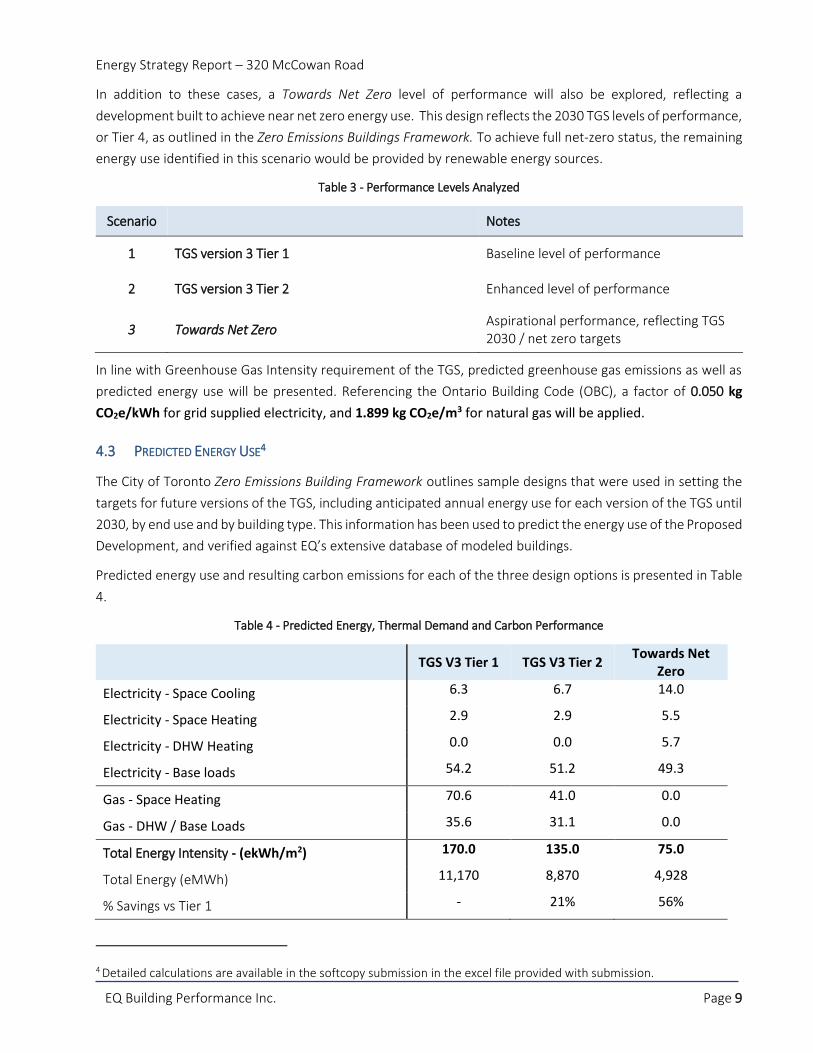
In addition to these cases, a Towards Net Zero level of performance will also be explored, reflecting a
development built to achieve near net zero energy use. This design reflects the 2030 TGS levels of performance,
or Tier 4, as outlined in the Zero Emissions Buildings Framework. To achieve full net-zero status, the remaining
energy use identified in this scenario would be provided by renewable energy sources.
Table 3 - Performance Levels Analyzed
Scenario Notes
1 TGS version 3 Tier 1 Baseline level of performance
2 TGS version 3 Tier 2 Enhanced level of performance
3 Towards Net Zero Aspirational performance, reflecting TGS 2030 / net zero targets
In line with Greenhouse Gas Intensity requirement of the TGS, predicted greenhouse gas emissions as well as
predicted energy use will be presented. Referencing the Ontario Building Code (OBC), a factor of 0.050 kg
CO2e/kWh for grid supplied electricity, and 1.899 kg CO2e/m3 for natural gas will be applied.
4.3 PREDICTED ENERGY USE4
The City of Toronto Zero Emissions Building Framework outlines sample designs that were used in setting the
targets for future versions of the TGS, including anticipated annual energy use for each version of the TGS until
2030, by end use and by building type. This information has been used to predict the energy use of the Proposed
Development, and verified against EQ’s extensive database of modeled buildings.
Predicted energy use and resulting carbon emissions for each of the three design options is presented in Table
4.
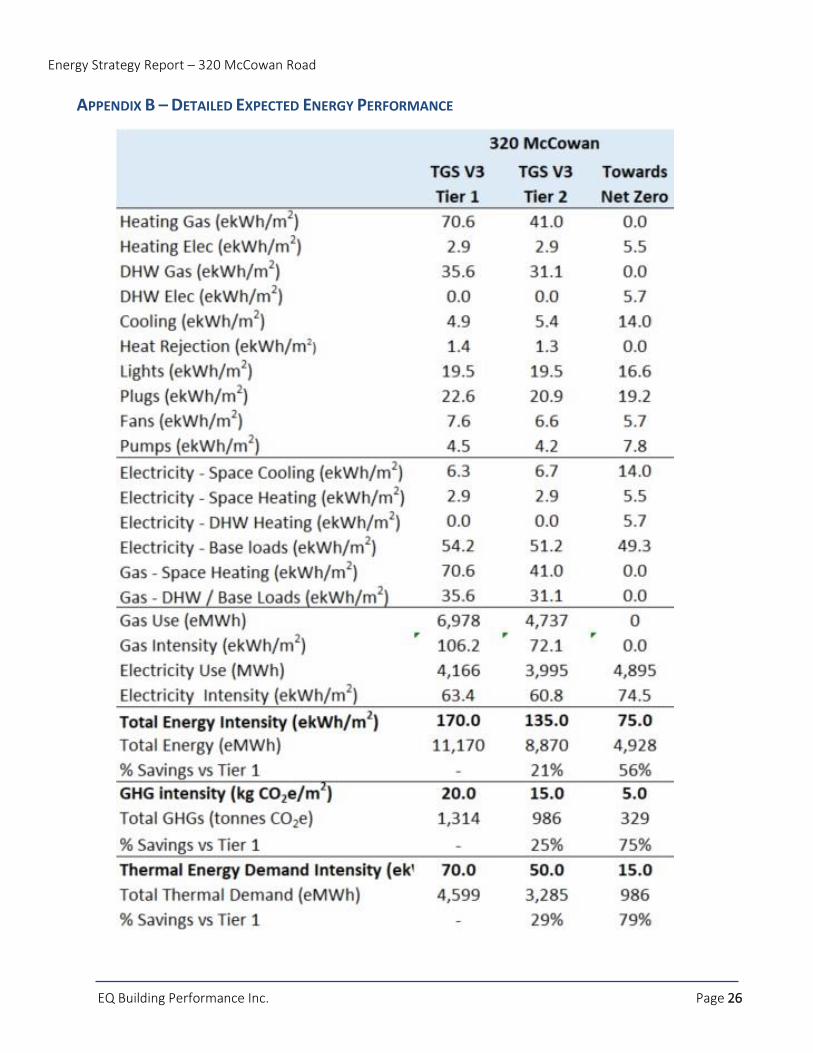
Table 4 - Predicted Energy, Thermal Demand and Carbon Performance
TGS V3 Tier 1 TGS V3 Tier 2
Towards Net Zero
Electricity - Space Cooling 6.3 6.7 14.0
Electricity - Space Heating 2.9 2.9 5.5
Electricity - DHW Heating 0.0 0.0 5.7
Electricity - Base loads 54.2 51.2 49.3
Gas - Space Heating 70.6 41.0 0.0
Gas - DHW / Base Loads 35.6 31.1 0.0
Total Energy Intensity - (ekWh/m2) 170.0 135.0 75.0
Total Energy (eMWh) 11,170 8,870 4,928
% Savings vs Tier 1 - 21% 56%
4 Detailed calculations are available in the softcopy submission in the excel file provided with submission.
Page 14
Energy Strategy Report – 320 McCowan Road
EQ Building Performance Inc. Page 10
TGS V3 Tier 1 TGS V3 Tier 2
Towards Net Zero
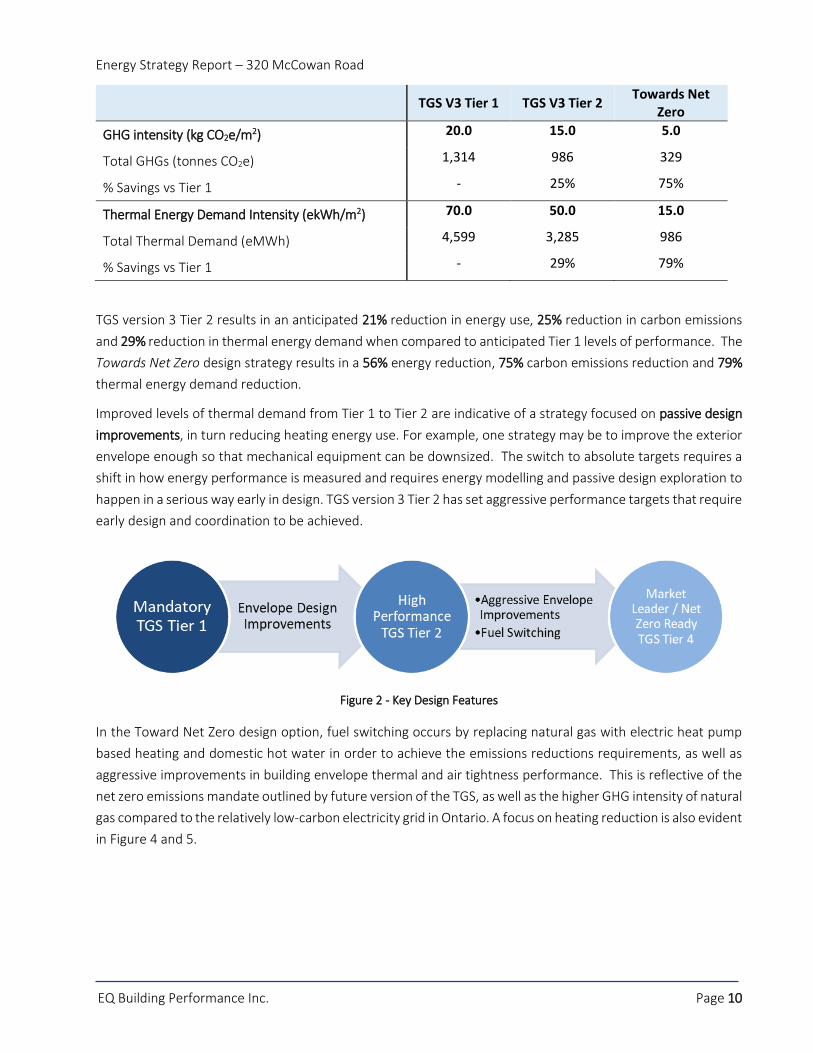
GHG intensity (kg CO2e/m2) 20.0 15.0 5.0
Total GHGs (tonnes CO2e) 1,314 986 329
% Savings vs Tier 1 - 25% 75%
Thermal Energy Demand Intensity (ekWh/m2) 70.0 50.0 15.0
Total Thermal Demand (eMWh) 4,599 3,285 986
% Savings vs Tier 1 - 29% 79%
TGS version 3 Tier 2 results in an anticipated 21% reduction in energy use, 25% reduction in carbon emissions
and 29% reduction in thermal energy demand when compared to anticipated Tier 1 levels of performance. The
Towards Net Zero design strategy results in a 56% energy reduction, 75% carbon emissions reduction and 79%
thermal energy demand reduction.
Improved levels of thermal demand from Tier 1 to Tier 2 are indicative of a strategy focused on passive design
improvements, in turn reducing heating energy use. For example, one strategy may be to improve the exterior
envelope enough so that mechanical equipment can be downsized. The switch to absolute targets requires a
shift in how energy performance is measured and requires energy modelling and passive design exploration to
happen in a serious way early in design. TGS version 3 Tier 2 has set aggressive performance targets that require
early design and coordination to be achieved.
In the Toward Net Zero design option, fuel switching occurs by replacing natural gas with electric heat pump
based heating and domestic hot water in order to achieve the emissions reductions requirements, as well as
aggressive improvements in building envelope thermal and air tightness performance. This is reflective of the
net zero emissions mandate outlined by future version of the TGS, as well as the higher GHG intensity of natural
gas compared to the relatively low-carbon electricity grid in Ontario. A focus on heating reduction is also evident
in Figure 4 and 5.
Figure 2 - Key Design Features
Page 15
Energy Strategy Report – 320 McCowan Road
EQ Building Performance Inc. Page 11
Figure 3 - Predicted Energy, Thermal Demand and Carbon Performance
Figure 4 - Predicted Energy Consumption by End-Use
Potential design strategies intended to achieve Tier 1, Tier 2, and a Towards Net Zero design have been
presented in Section 2 and Section 3, but are also jointly summarized in Appendix A. It should be noted that
designs presented reflect one of many possible design solutions that will be verified and optimized during the
energy modeling process.
170.0
135.0
75.070.0
50.0
15.0
20.0
15.0
5.0
0.0
5.0
10.0
15.0
20.0
25.0
0.0
20.0
40.0
60.0
80.0
100.0
120.0
140.0
160.0
180.0
TGS V3 Tier 1 TGS V3 Tier 2 Towards Net Zero
GH
GI (
CO
2e/m
2 /ye
ar)
EUI/
TED
I (ek
Wh
/m2 /
year
)TEUI (ekWh/m2)
TEDI (kWh/m2)
GHGI (kg CO2e/m2)
-
1,000
2,000
3,000
4,000
5,000
6,000
Heating Cooling Base Thermal / DHW Base Electrical
An
ual
En
ergy
Use
(eM
Wh
)
TGS V3 Tier 1
TGS V3 Tier 2
Towards Net Zero
Page 16
Energy Strategy Report – 320 McCowan Road
EQ Building Performance Inc. Page 12
5 TOWARDS NET ZERO DEVELOPMENT
The City of Toronto’s ambitious net-zero goal for buildings has been analyzed in this report as a third scenario,
with anticipated performance noted above. While this aggressive goal may not be achieved on this project, the
design team is encouraged to incorporate design and construction strategies in line with this goal, designed to
help reduce electrical demand and carbon emissions and conserve energy, compared to a more conventional
design.
5.1 ENERGY CONSERVATION & DEMAND REDUCTION
With the constant stream of development within the City of Toronto, the electricity grid is becoming
increasingly stressed. With electricity distribution infrastructure already constrained in the areas anticipating
the most growth, an estimated 22% increase in electricity demand due to projects currently in approvals will
be a major challenge. Furthermore, cooling demand for buildings will increase with rising temperatures, which
means that the 22% estimate is conservative. Broader electrification from sources such as electric cars will
further increase electrical demand. In some areas of the city, the electricity grid is expected to hit 90-95%
capacity in 20195. Ensuring that the design has reduced energy consumption and a reduced peak demand can
help to avoid capacity problems in the future.
With a better performing building envelope and reduced thermal bridging, the thermal demand and energy
consumption of the net zero building will be significantly reduced. This will not only passively reduce the
thermal loads within the building, but will also allow active mechanical systems to be downsized. In addition, a
better envelope leads to more comfortable spaces for occupants.
5 https://www.toronto.ca/wp-content/uploads/2018/04/9585-city-planning-tocore-energy-strategy.pdf
Figure 5 – Estimated Downtown Toronto Electricity Demand
Page 17
Energy Strategy Report – 320 McCowan Road
EQ Building Performance Inc. Page 13
By selecting an appropriate solar heat gain coefficient for each façade, daylighting can also be maximized to
reduce internal lighting loads while maintaining thermal comfort. Reduced lighting and cooling loads will
mitigate peak electrical demand within the building, specifically through the use of LED lighting and daylighting
/ occupancy sensors. The use of more advanced strategies like electrochromic glazing will reduce cooling loads,
maximize passive winter heat gain, and maximize daylight potential and views.
The resulting energy demands of the project will be met with high performance HVAC and lighting systems.
High HVAC plant and system efficiencies combined with heat recovery and variable speed drives will
significantly reduce electrical demand and consume energy only when required or called on. The remainder of
the energy use in a net-zero building is intended to be supplied by renewable energy sources. Some advanced
strategies to reduce grid demand and energy consumption include:
- Solar photovoltaics combined with battery storage
- Local energy generation
- Connecting to district energy systems, such as deep-lake water cooling
- Heat recovery from sewage infrastructure
- Large-scale geothermal systems
5.2 LOW CARBON SOLUTIONS
At this stage of design, low-carbon solutions are still under consideration. If a heat pump or VRF system is used,
the high efficiencies achieved with these systems in combination with their electric heat pump based heating
components will reduce the building’s carbon use by relying on the relatively clean Ontario electricity grid. This
would represent a fundamental shift in the primary heating energy source of the building and the resulting
carbon impact. Back-up boilers for these systems will be high performance condensing or near-condensing
technology, which will reduce carbon compared to traditional systems. Low-flow plumbing fixtures will also be
used to minimize the domestic hot water boiler load, further reducing carbon use.
Additional low-carbon solutions such as renewable energy and district energy (discussed in more detail in
section 6.1) have not yet been ruled out, and are undergoing further analysis.
Page 18
Energy Strategy Report – 320 McCowan Road
EQ Building Performance Inc. Page 14
6 ADVANCED ENERGY SOLUTIONS
6.1 DISTRICT ENERGY SYSTEMS
6.1.1 Types of District Energy Systems
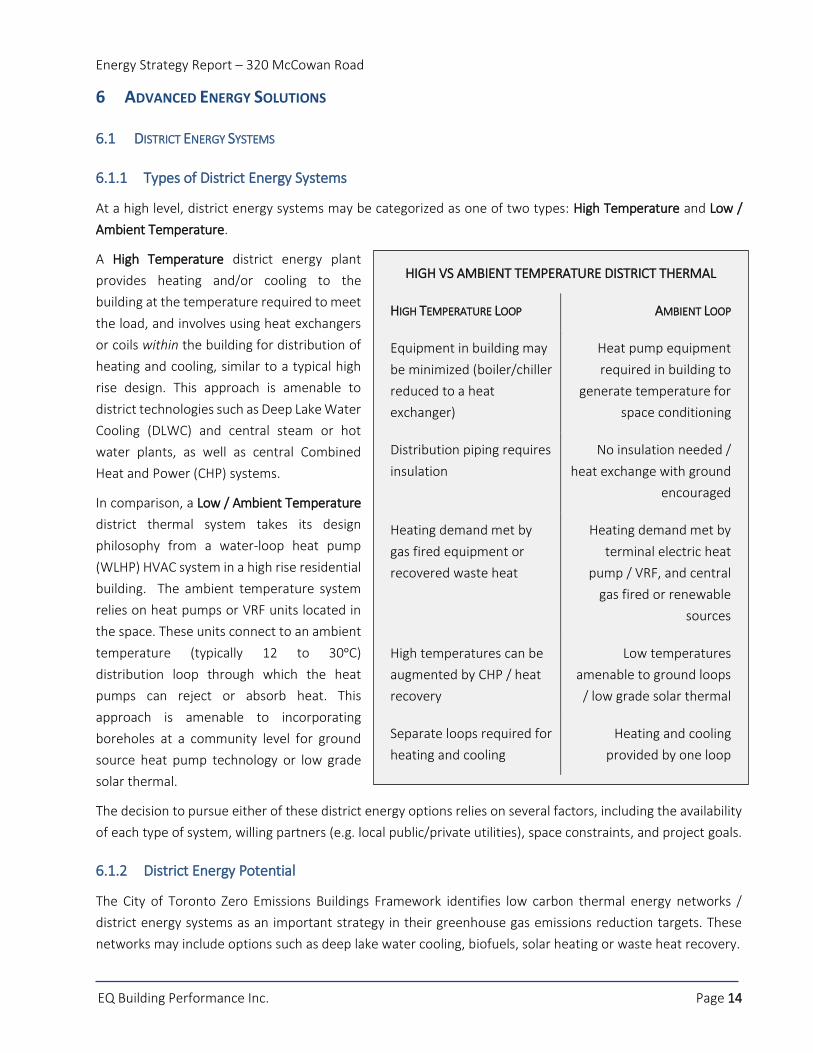
At a high level, district energy systems may be categorized as one of two types: High Temperature and Low /
Ambient Temperature.
A High Temperature district energy plant
provides heating and/or cooling to the
building at the temperature required to meet
the load, and involves using heat exchangers
or coils within the building for distribution of
heating and cooling, similar to a typical high
rise design. This approach is amenable to
district technologies such as Deep Lake Water
Cooling (DLWC) and central steam or hot
water plants, as well as central Combined
Heat and Power (CHP) systems.
In comparison, a Low / Ambient Temperature
district thermal system takes its design
philosophy from a water-loop heat pump
(WLHP) HVAC system in a high rise residential
building. The ambient temperature system
relies on heat pumps or VRF units located in
the space. These units connect to an ambient
temperature (typically 12 to 30ᵒC)
distribution loop through which the heat
pumps can reject or absorb heat. This
approach is amenable to incorporating
boreholes at a community level for ground
source heat pump technology or low grade
solar thermal.
The decision to pursue either of these district energy options relies on several factors, including the availability
of each type of system, willing partners (e.g. local public/private utilities), space constraints, and project goals.
6.1.2 District Energy Potential
The City of Toronto Zero Emissions Buildings Framework identifies low carbon thermal energy networks /
district energy systems as an important strategy in their greenhouse gas emissions reduction targets. These
networks may include options such as deep lake water cooling, biofuels, solar heating or waste heat recovery.
HIGH VS AMBIENT TEMPERATURE DISTRICT THERMAL
HIGH TEMPERATURE LOOP AMBIENT LOOP
Equipment in building may
be minimized (boiler/chiller
reduced to a heat
exchanger)
Heat pump equipment
required in building to
generate temperature for
space conditioning
Distribution piping requires
insulation
No insulation needed /
heat exchange with ground
encouraged
Heating demand met by
gas fired equipment or
recovered waste heat
Heating demand met by
terminal electric heat
pump / VRF, and central
gas fired or renewable
sources
High temperatures can be
augmented by CHP / heat
recovery
Low temperatures
amenable to ground loops
/ low grade solar thermal
Separate loops required for
heating and cooling
Heating and cooling
provided by one loop
Page 19
Energy Strategy Report – 320 McCowan Road
EQ Building Performance Inc. Page 15
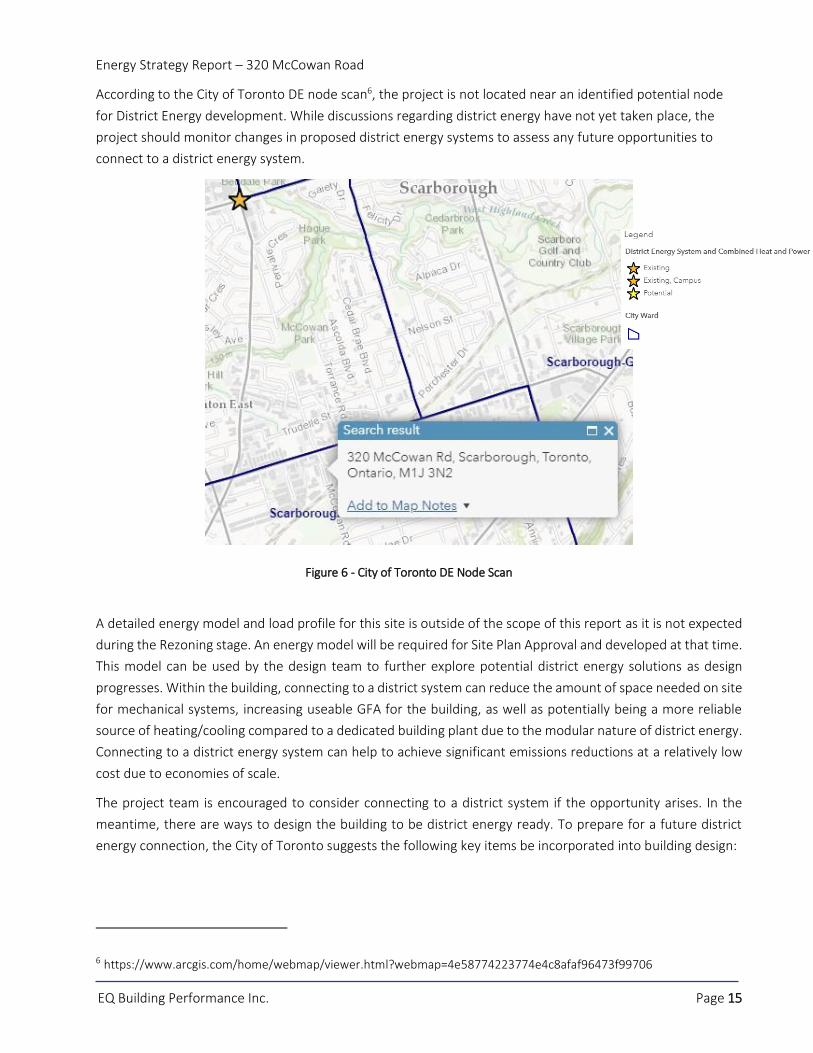
According to the City of Toronto DE node scan6, the project is not located near an identified potential node
for District Energy development. While discussions regarding district energy have not yet taken place, the
project should monitor changes in proposed district energy systems to assess any future opportunities to
connect to a district energy system.
A detailed energy model and load profile for this site is outside of the scope of this report as it is not expected
during the Rezoning stage. An energy model will be required for Site Plan Approval and developed at that time.
This model can be used by the design team to further explore potential district energy solutions as design
progresses. Within the building, connecting to a district system can reduce the amount of space needed on site
for mechanical systems, increasing useable GFA for the building, as well as potentially being a more reliable
source of heating/cooling compared to a dedicated building plant due to the modular nature of district energy.
Connecting to a district energy system can help to achieve significant emissions reductions at a relatively low
cost due to economies of scale.
The project team is encouraged to consider connecting to a district system if the opportunity arises. In the
meantime, there are ways to design the building to be district energy ready. To prepare for a future district
energy connection, the City of Toronto suggests the following key items be incorporated into building design:
6 https://www.arcgis.com/home/webmap/viewer.html?webmap=4e58774223774e4c8afaf96473f99706
Figure 6 - City of Toronto DE Node Scan
Page 20
Energy Strategy Report – 320 McCowan Road
EQ Building Performance Inc. Page 16
- Install heating and cooling plant equipment on the lower levels for easier integration into a future
district system, or provide for a future connection points into the building’s thermal piping at ground
level
- Provide adequate space at or below ground level for a future energy transfer station
- Provide an easement between the mechanical room and the property line to allow for thermal piping
- Provide two-way pipes placed in the building to carry thermal energy from the district energy
network to the section in the building where the future energy transfer station would be located
- Install a low temperature hydronic heating system (e.g. heat pump loop) that is compatible with a
district energy system in order to reduce the pipe sized and associated valves, fitting, etc.
- Include provisions for appropriate future thermal energy metering
6.2 RENEWABLE STRATEGIES: SOLAR PV
Solar PV is rapidly becoming an economically viable strategy for energy generation at the individual building
level, thanks to the price reductions in solar panels over the last several years. As such, it is an important design
consideration of low carbon and net zero buildings. Several developments of all types, including residential,
institutional, and commercial have already incorporated PV into their designs or retrofitted existing buildings
to take advantage of their long term economic benefits.
Effective solar PV installations require access to adequate sunlight as well as the space needed to house the
panels. This creates constraints for a high rise residential building, typified by a small roof area relative to total
conditioned area. While wall area may also house solar PV panels, it is unlikely this area would receive adequate
sunlight in an urban downtown setting.
While the Proposed Development is currently aiming to achieve Tier 1, if this project chooses to pursue Tier 2
there are some solar related requirements that must be met. The site would be required to accommodate
future connections to solar PV or solar thermal technologies for 1% of the total building energy (TGS Tier 2
Credit GHG 2.1). Solar ready features that should be incorporated into their design include:
- Designate a portion of the roof for future solar PV and/or solar thermal
- Provide adequate structural capacity in the roof
- Install conduit to the roof from the main electrical room to accommodate future systems
- Designate wall area in the electrical rooms or future system controls
- Where possible, place HVAC or other rooftop equipment to avoid shading of future systems
- Consult NREL’s Solar Ready Buildings Planning Guide7
Tier 2 also encourages the use of on-site renewable energy with credit GHG 2.2. Providing a minimum 5% of
total building energy load via renewable energy sources (or 20% through geo-exchange) can meet this optional
credit’s requirements.
7 http://www.nrel.gov/docs/fy10osti/46078.pdf
Page 21
Energy Strategy Report – 320 McCowan Road
EQ Building Performance Inc. Page 17
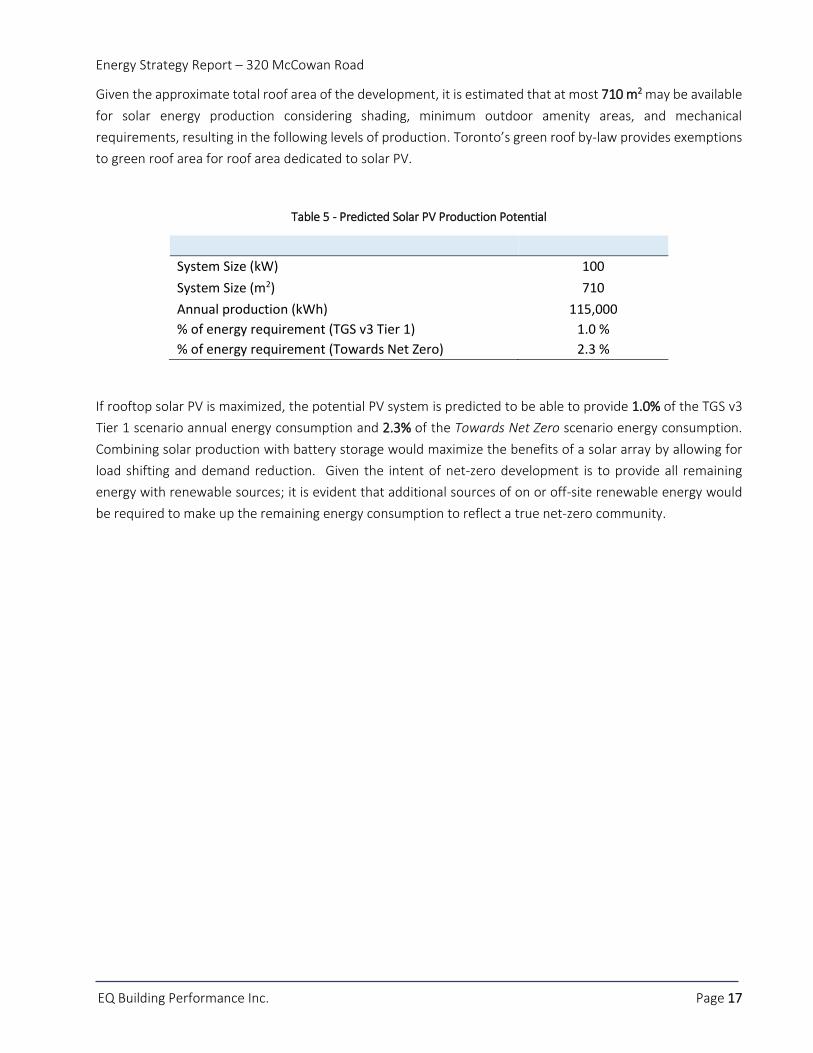
Given the approximate total roof area of the development, it is estimated that at most 710 m2 may be available
for solar energy production considering shading, minimum outdoor amenity areas, and mechanical
requirements, resulting in the following levels of production. Toronto’s green roof by-law provides exemptions
to green roof area for roof area dedicated to solar PV.
Table 5 - Predicted Solar PV Production Potential
System Size (kW) 100
System Size (m2) 710
Annual production (kWh) 115,000
% of energy requirement (TGS v3 Tier 1) 1.0 %
% of energy requirement (Towards Net Zero) 2.3 %
If rooftop solar PV is maximized, the potential PV system is predicted to be able to provide 1.0% of the TGS v3
Tier 1 scenario annual energy consumption and 2.3% of the Towards Net Zero scenario energy consumption.
Combining solar production with battery storage would maximize the benefits of a solar array by allowing for
load shifting and demand reduction. Given the intent of net-zero development is to provide all remaining
energy with renewable sources; it is evident that additional sources of on or off-site renewable energy would
be required to make up the remaining energy consumption to reflect a true net-zero community.
Page 22
Energy Strategy Report – 320 McCowan Road
EQ Building Performance Inc. Page 18
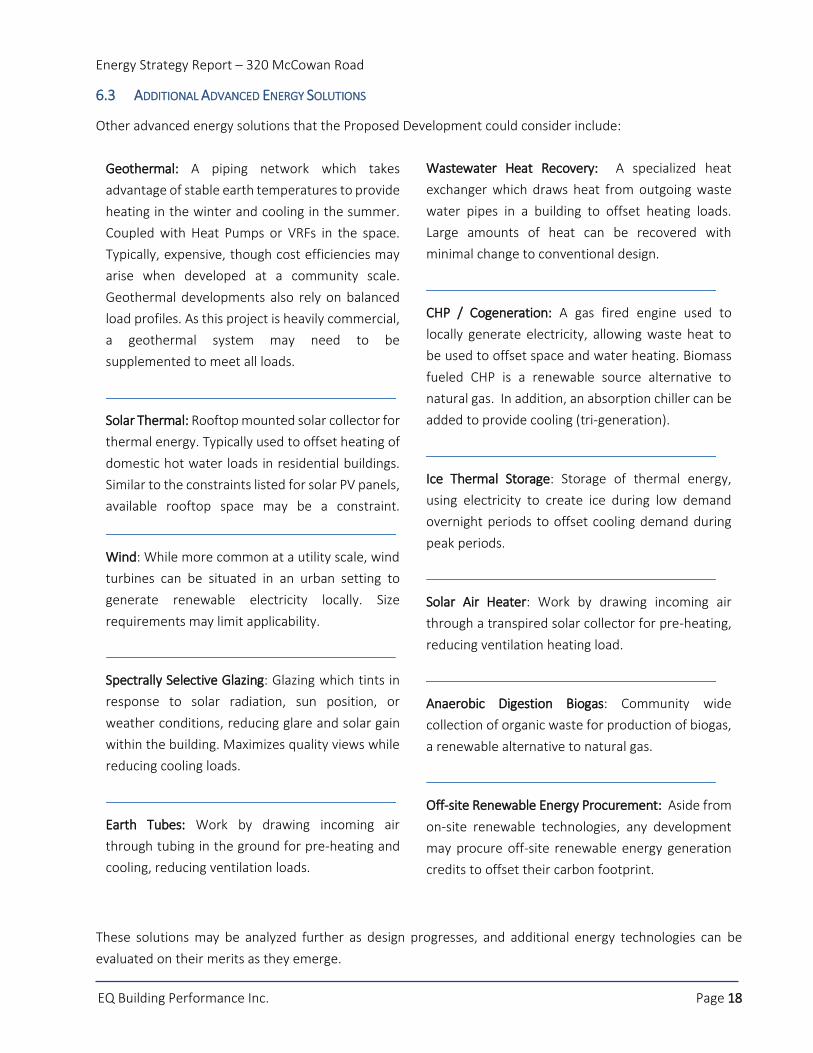
6.3 ADDITIONAL ADVANCED ENERGY SOLUTIONS
Other advanced energy solutions that the Proposed Development could consider include:
These solutions may be analyzed further as design progresses, and additional energy technologies can be
evaluated on their merits as they emerge.
Geothermal: A piping network which takes
advantage of stable earth temperatures to provide
heating in the winter and cooling in the summer.
Coupled with Heat Pumps or VRFs in the space.
Typically, expensive, though cost efficiencies may
arise when developed at a community scale.
Geothermal developments also rely on balanced
load profiles. As this project is heavily commercial,
a geothermal system may need to be
supplemented to meet all loads.
Solar Thermal: Rooftop mounted solar collector for
thermal energy. Typically used to offset heating of
domestic hot water loads in residential buildings.
Similar to the constraints listed for solar PV panels,
available rooftop space may be a constraint.
Wind: While more common at a utility scale, wind
turbines can be situated in an urban setting to
generate renewable electricity locally. Size
requirements may limit applicability.
Spectrally Selective Glazing: Glazing which tints in
response to solar radiation, sun position, or
weather conditions, reducing glare and solar gain
within the building. Maximizes quality views while
reducing cooling loads.
Earth Tubes: Work by drawing incoming air
through tubing in the ground for pre-heating and
cooling, reducing ventilation loads.
Wastewater Heat Recovery: A specialized heat
exchanger which draws heat from outgoing waste
water pipes in a building to offset heating loads.
Large amounts of heat can be recovered with
minimal change to conventional design.
CHP / Cogeneration: A gas fired engine used to
locally generate electricity, allowing waste heat to
be used to offset space and water heating. Biomass
fueled CHP is a renewable source alternative to
natural gas. In addition, an absorption chiller can be
added to provide cooling (tri-generation).
Ice Thermal Storage: Storage of thermal energy,
using electricity to create ice during low demand
overnight periods to offset cooling demand during
peak periods.
Solar Air Heater: Work by drawing incoming air
through a transpired solar collector for pre-heating,
reducing ventilation heating load.
Anaerobic Digestion Biogas: Community wide
collection of organic waste for production of biogas,
a renewable alternative to natural gas.
Off-site Renewable Energy Procurement: Aside from
on-site renewable technologies, any development
may procure off-site renewable energy generation
credits to offset their carbon footprint.
Page 23
Energy Strategy Report – 320 McCowan Road
EQ Building Performance Inc. Page 19
7 ENERGY RESILIENCE
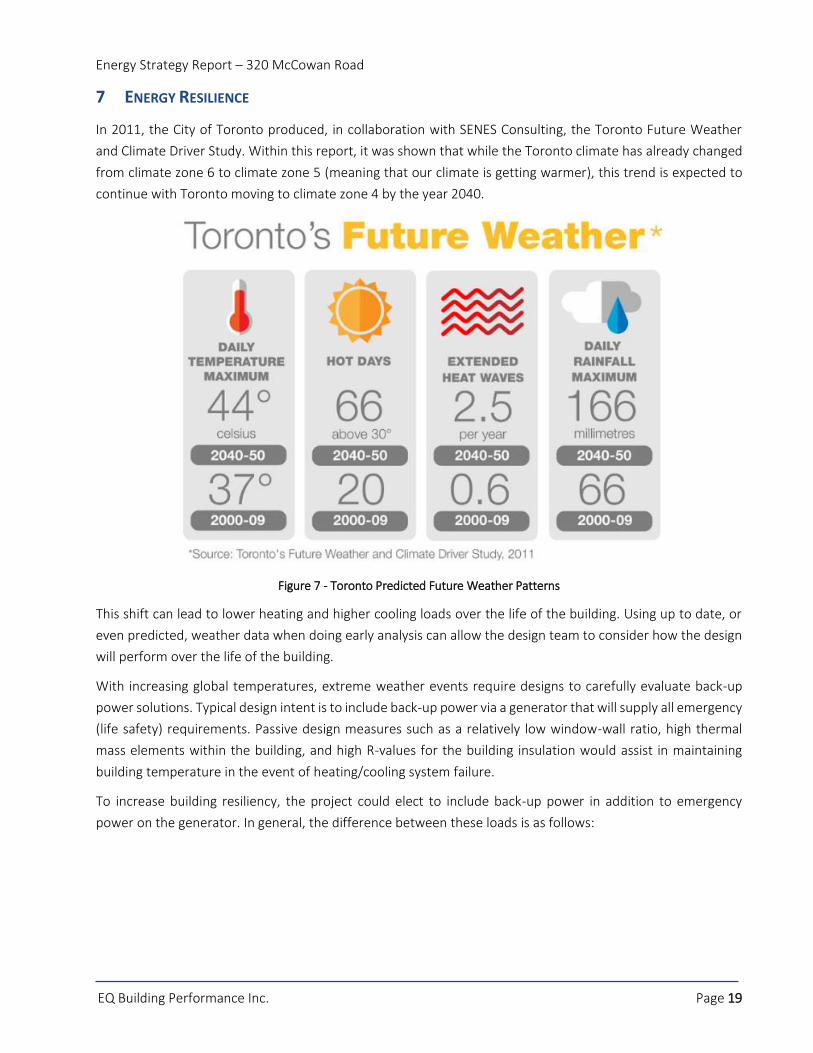
In 2011, the City of Toronto produced, in collaboration with SENES Consulting, the Toronto Future Weather
and Climate Driver Study. Within this report, it was shown that while the Toronto climate has already changed
from climate zone 6 to climate zone 5 (meaning that our climate is getting warmer), this trend is expected to
continue with Toronto moving to climate zone 4 by the year 2040.
Figure 7 - Toronto Predicted Future Weather Patterns
This shift can lead to lower heating and higher cooling loads over the life of the building. Using up to date, or
even predicted, weather data when doing early analysis can allow the design team to consider how the design
will perform over the life of the building.
With increasing global temperatures, extreme weather events require designs to carefully evaluate back-up
power solutions. Typical design intent is to include back-up power via a generator that will supply all emergency
(life safety) requirements. Passive design measures such as a relatively low window-wall ratio, high thermal
mass elements within the building, and high R-values for the building insulation would assist in maintaining
building temperature in the event of heating/cooling system failure.
To increase building resiliency, the project could elect to include back-up power in addition to emergency
power on the generator. In general, the difference between these loads is as follows:
Page 24
Energy Strategy Report – 320 McCowan Road
EQ Building Performance Inc. Page 20
Table 6 - Emergency vs. Back-up Power Requirements
Emergency Power Back-up Power
Purpose Minimum life safety requirements (firefighter and evacuation)
Non-life-safety requirements for occupant wellbeing
Duration 2 hours – building code requirement 72 hours – based on federal emergency preparedness guidelines
Loads Fire pumps, fire elevator, stair pressurization fans, alarm system
Water supply, minimal space heating, power to a common refuge area, domestic booster pumps, additional elevators
Including back-up power on the generator has the potential to increase costs in order to increase the size of
the generator, but this can be reduced through the use of a load management system with load selection
capability. When the system detects it is no longer in an emergency, it can divert generator resources to back-
up power allowing tenants to remain safe and comfortable in their homes during a power outage.
While increasing back-up power capabilities can improve resiliency, passive design is vital to ensuring that
occupants are able to stay in the building during a power outage. One typical criteria used in gauging building
resilience in buildings is measuring the interior temperature 72 hours and two weeks after a power failure. The
better a building is able to maintain its temperature without mechanical conditioning; the longer people will be
able to remain in place. The Zero Emissions Building Framework analyzed each Tiers performance against these
standards. The results are summarized in the Figure below:
Table 7 - Resilience of Various Performance Levels
Tier 72h Power Off Winter Temperature Low (°C)
2 Week Power Off Winter Temperature Low (°C)
OBC SB-10 9.9 0.9
TGS v3 Tier 1 13.5 5.8
TGS v3 Tier 2 14.6 7.6
TGS v3 Tier 4 (near net zero) 19.7 18.3
As the building envelope improves performance with increased performance Tiers (detailed suggestions in
Section 3.1), the building is better able to maintain internal temperature in a power outage situation. In the
case of the Tier 4 (neat net zero) scenario, the building is able to maintain an impressive 18.3 °C, even after two
weeks without power. While a two-week outage is likely an extreme, improved resilience will have a major
effect on vulnerable populations such as children and seniors.
Another strategy to improve resilience for residents is to provide an area of refuge within the building. The
designated space would need to provide minimum levels of heating, cooling, lighting, potable water, and power
during power outages for a minimum of 72 hours. This would allow residents to remain in the building during
a power outage and to keep warm or cool, store medicine, charge communication devices and share updates.
Page 25
Energy Strategy Report – 320 McCowan Road
EQ Building Performance Inc. Page 21
The development team is encouraged to review the Minimum Backup Power Guidelines for Multi-Unit
Residential Buildings8 for additional guidance.
Connection to a District Energy System also improves the resilience of the development. District energy
improves the reliability and availability of power supply by not depending on the centralized grid. This allows
the building to provide energy for both emergency and non-life safety requirements during times when the grid
is failing.
If the development chooses to pursue Tier 2 or higher, the development will be required to fill in a Resilience
Checklist9 (See Appendix C). While only required for higher performance Tiers, the design team is encouraged
to review the checklist even if only pursuing Tier 1. While there is no obligation to incorporate any specific
resiliency measures into the design, the checklist acts as a helpful tool to explore resiliency issues for the
project.
8 EMBODIED ENERGY
While the energy used to operate the building is typically discussed throughout design, the energy required to
extract, manufacture, and transport a building's materials, as well as the energy used during construction is
often forgotten. This is known as embodied energy, and can be a significant amount of energy depending on
the materials and methods used in construction. When a building is developed, the materials used (particularly
for structure) are discarded in the demolition process, which results in the loss of embodied energy. As an
example, typical concrete has approximately 1,984,668 MBTU/litre of embodied energy. Comparatively,
gasoline has approximately 431,728 MBTU/litre of embodied energy10. This is equivalent to 4600 L of gasoline
for every liter of concrete poured. Steel or wood both have less embodied energy than concrete and may be a
better choice of material depending on the application. In new buildings, as envelope details are improved and
more passive house designs are considered, the amount of construction material can increase which would
further increase the embodied energy of the building.
It is important to consider a new building's materials and how the embodied energy from the existing site can
be salvaged during the early stages of design. The Athena Sustainable Material Institute has produced a free
software tool that allows developers, and their consulting team to track the embodied energy associated with
their design11. Additionally, this tool can be used to improve knowledge of the embodied energy that already
exists on site, and help make informed decisions on how to reduce the loss of embodied energy for the project.
While outside the scope of this report, the project team is encouraged to use this software during design to
stay informed about the energy involved in building the proposed development. The project team is also
encouraged to reuse or recycle existing materials on site wherever it is deemed feasible.
8 https://www.toronto.ca/wp-content/uploads/2017/11/91ca-Minimum-Backup-Power-Guideline-for-MURBs-October-2016.pdf 9http://wx.toronto.ca/inter/clerks/fit.nsf/0/3d0af0e4d40adc8b852582e500625cd3/$File/Toronto%2BGreen%2BStandards%2BVersion%2B3.0%2BChecklist%2BResilience%2BPlanning%2BNew%2BConstruction.pdf 10 https://www.go-gba.org/embodied-energy/ 11 http://www.athenasmi.org/
Page 26
Energy Strategy Report – 320 McCowan Road
EQ Building Performance Inc. Page 22
9 OTHER TORONTO GREEN STANDARD V3 ENERGY, EFFICIENCY, GHG & RESILIENCE CREDITS
Under current program rules, projects that are pursuing the Toronto Green Standard Program Tier 2, 3, and 4
are eligible to receive a partial refund of development charges. The potential refund for this project, based on
stats dated January 15, 2020, is shown in Table 7 below.
Table 8 - City of Toronto Development Charge Refund TGS Tier 2, 3, and 4 Cap - Effective November 1 2019
Category Amount Project Count
Residential
Single detached and semi-detached $4,999 0
Apartment – two bedroom and larger $3,190 315
Apartment – one bedroom and bachelor $2,176 202
Multiple (all multiples) $4,054 0
Dwelling room $1,350 0
Non-Residential use (per square meter ground floor area) $36.88 1,034
Maximum Estimated Development Charge Refund $ 1,505,509
While this project is currently estimated to receive up to $1,505,509 as a development charge refund, this
estimate is subject to change and is dependent on project statistics as well as City of Toronto approvals. The
development charge refund caps have changed over time, and the project’s potential refund will be based on
the caps in place when fees are paid. In addition, when approving TGS v3, city council directed City Planning to
explore additional financial and non-financial incentives to encourage developers to meet Tier 212. To date, no
changes have been made to the incentive structure but this may change in the future.
If the project chooses to pursue Tier 2 or higher, this refund would help to offset the increased costs that may
be associated with design changes. The design team is encouraged to explore a full Tier 2 feasibility study to
explore this opportunity.
Additional TGS v3 energy related credits that this project may consider are listed below:
Mid to High Rise Residential and Non-Residential Development
GHG 4.1 – Energy Benchmarking & Reporting (Core Tier 2 Requirement)
The buildings must be registered on ENERGYSTAR® Portfolio Manager for energy benchmarking. Energy and
Water Reporting and Benchmarking (EWRB) requirements are currently coming into effect in Ontario which
will require similar requirements. This credit should pose no increased work on the development as a whole.
GHG 4.2 – Best Practice Commissioning (Core Tier 2 Requirement)
Projects will be required to commission the project using best practice commissioning. This is an existing Tier 2
requirement and many developers routinely include commissioning on their projects.
12 http://app.toronto.ca/tmmis/viewAgendaItemHistory.do?item=2017.PG23.9
Page 27
Energy Strategy Report – 320 McCowan Road
EQ Building Performance Inc. Page 23
GHG 4.3 – Air Tightness Testing (Core Tier 2 Requirement)
Whole building air tightness testing will be required for Tier 2 developments. This is currently only done in a
very limited capacity in the Toronto market, though it has been routinely done in other North American markets
with similar air tightness testing requirements (Seattle). There will be no performance level that must be
achieved, though credit can be taken in As-Constructed Energy Models if the building performs below the NECB
2015 default value of 0.25 l/s/m2 at 5 Pa.
GHG 4.4 – Submetering (Optional Tier 2 Requirement)
This credit requires all residential units to be equipped with thermal energy meters, and all non-residential
buildings to include a thermal meter for each tenant.
10 CONCLUSIONS/RECOMMENDATIONS
Through the use of a high performing envelope and high efficiency HVAC equipment, carbon, thermal demand,
and energy use minimum (TGS v3 Tier 1) performance targets will be achieved utilizing the absolute
performance path.
As design progresses, the design team will engage with the energy modelling process early during Site Plan
Approval to evaluate the design alternatives expressed in this report. The project team is encouraged to
explore the feasibility of higher tiers of energy and carbon performance, as well as draw on the Towards Net
Zero building design strategies to create a truly sustainable development.
Energy predictions in this report are preliminary in nature, and an energy model will be used to fully evaluate
the impacts of the recommendations in this report. The design alternatives discussed in this report are
recommendations only, and decision to incorporate them into the final design is up to the discretion of the
project team.
If the design team chooses to pursue advanced measures such as district energy system connections and solar
PV, further detailed analysis above the typical SPA modelling requirements will be needed. Design strategies
that would support both of these decisions have been included in this report.
Finally, design options are presented to provide enhanced resilience for the Proposed Development and
community, and should be evaluated further on a feasibility and cost basis.
Page 28
Energy Strategy Report – 320 McCowan Road
EQ Building Performance Inc. Page 24
APPENDIX A – ENERGY CONSERVATION MEASURES SUMMARY
Energy Conservation Measures Energy Impact Cost Impact TGS Tier?
BUILDING ENVELOPE – PASSIVE MEASURES
Opaque Wall –
Some continuous insulation, reduced balcony area, improved thermal bridges
HIGH LOW 1
Continuous insulation, reduced or no balcony area, improved thermal bridges
HIGH MID 2
Maximized continuous insulation (ex. spray foam), no balcony area, greatly improved thermal bridges
HIGH MID 4
Vision Wall
40% vision to wall ratio MID LOW 1,2,4
High performance double glazed assembly, thermally broken aluminum frame
MID LOW 1
Triple glazed assembly, thermally broken aluminum frame HIGH HIGH 2
High performance triple glazed assembly, thermally broken aluminum or fiberglass frame
HIGH HIGH 4
Infiltration – Code defaults assumed, no validation with testing
Improved air tightness – improved detailing MID LOW 1,2,4
Whole building air tightness testing – mandatory for Tier 2 and above, not currently widely done in Toronto
MID LOW 2,4
MECHANICAL + ELECTRICAL – ACTIVE MEASURES
Ventilation – 30-60 cfm/suite in corridors, 10-50% above ASHRAE 62.1 in all other areas
Corridor ventilation - 30 cfm/suite HIGH LOW 1
Corridor ventilation - 15 cfm/suite HIGH LOW 2
Corridor ventilation – ASHRAE 62.1 levels - requires compartmentalization to remove pressurization requirements
HIGH MID 4
ASHRAE 62.1 ventilation in other areas MID-HIGH LOW 1,2,4
Mechanical System – Fan coil or water-source heat pump, conventional mechanical plant
Water-source VRF HVAC system MID HIGH 2,4
Air-source heat pump / VRF HVAC system HIGH HIGH 4
65% Efficient air side heat recovery HIGH LOW 1
75% Efficient air side heat recovery HIGH LOW 2
85% Efficient air side heat recovery HIGH MID 4
Page 29
Energy Strategy Report – 320 McCowan Road
EQ Building Performance Inc. Page 25
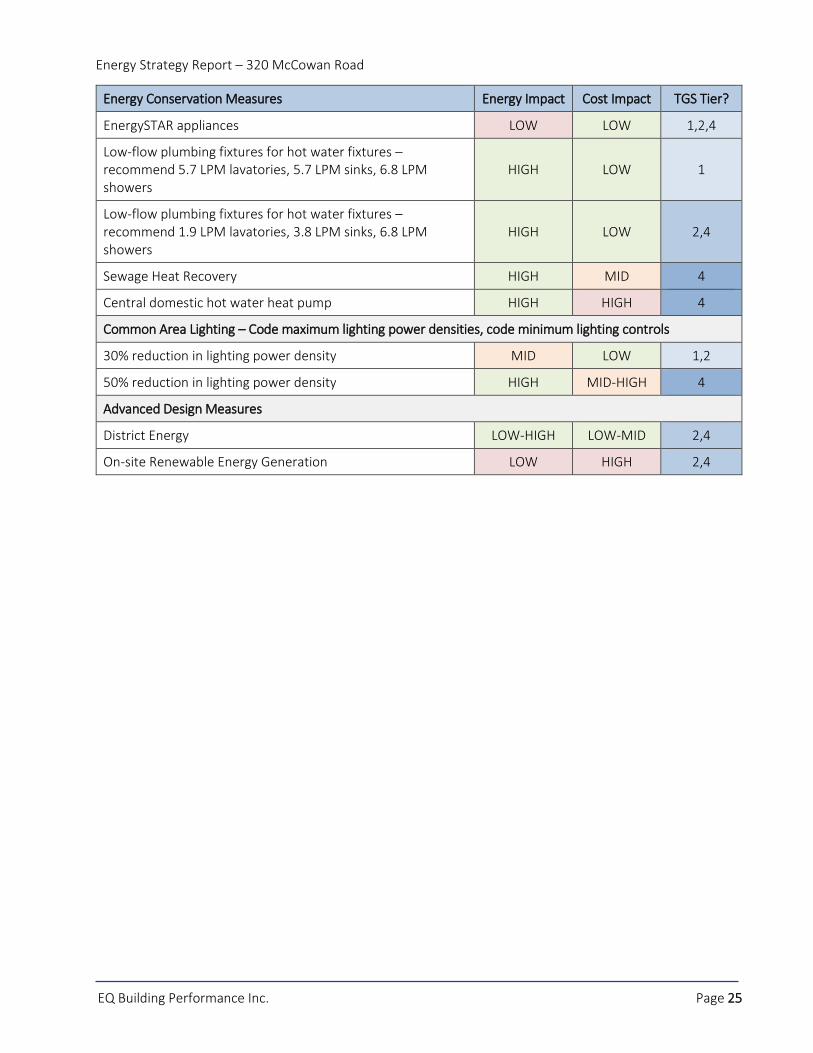
Energy Conservation Measures Energy Impact Cost Impact TGS Tier?
EnergySTAR appliances LOW LOW 1,2,4
Low-flow plumbing fixtures for hot water fixtures – recommend 5.7 LPM lavatories, 5.7 LPM sinks, 6.8 LPM showers
HIGH LOW 1
Low-flow plumbing fixtures for hot water fixtures – recommend 1.9 LPM lavatories, 3.8 LPM sinks, 6.8 LPM showers
HIGH LOW 2,4
Sewage Heat Recovery HIGH MID 4
Central domestic hot water heat pump HIGH HIGH 4
Common Area Lighting – Code maximum lighting power densities, code minimum lighting controls
30% reduction in lighting power density MID LOW 1,2
50% reduction in lighting power density HIGH MID-HIGH 4
Advanced Design Measures
District Energy LOW-HIGH LOW-MID 2,4
On-site Renewable Energy Generation LOW HIGH 2,4
Page 30
Energy Strategy Report – 320 McCowan Road
EQ Building Performance Inc. Page 26
APPENDIX B – DETAILED EXPECTED ENERGY PERFORMANCE
Page 31
Energy Strategy Report – 320 McCowan Road
EQ Building Performance Inc. Page 27
Page 32
Energy Strategy Report – 320 McCowan Road
EQ Building Performance Inc. Page 28
APPENDIX C – RESILIENCE CHECKLIST
Page 33
Energy Strategy Report – 320 McCowan Road
EQ Building Performance Inc. Page 29
Page 34
Energy Strategy Report – 320 McCowan Road
EQ Building Performance Inc. Page 30
Page 35
Energy Strategy Report – 320 McCowan Road
EQ Building Performance Inc. Page 31
Page 36
Energy Strategy Report – 320 McCowan Road
EQ Building Performance Inc. Page 32