Page 1
Energy Upgrade Screening Study
Prepared for:
The University of Maine Orono, ME
Prepared by:
R.G. Vanderweil Engineers, LLP 274 Summer Street Boston, MA 02210
Vanderweil Project No.: 28471.00
October 28, 2016
kdoiron
Text Box
Includes UM comments and analysis table. 2016-12-23
Page 2
ENERGY UPGRADE SCREENING STUDY
Job No. 28471.00 - October 28, 2016 Page | i
TABLE OF CONTENTS
1. INTRODUCTION .................................................................................................................................... 1
2. EXECUTIVE SUMMARY ........................................................................................................................ 1
3. LOAD ANALYSIS AND CONFIGURATION SELECTION .................................................................... 3
ELECTRICAL LOAD ............................................................................................................................... 3
STEAM LOAD ......................................................................................................................................... 7
GENERATION EQUIPMENT SELECTION ............................................................................................ 7
4. ENERGY UPGRADES ........................................................................................................................... 8
OPTION 1 - EXISTING CAMPUS/BASE CASE WITH ALTERNATIVES .............................................. 8
1A - Eliminate Summer Steam Load ........................................................................................... 9
1B - Solar Energy Farm ............................................................................................................... 9
1C - Combination Eliminate Summer Steam Load and Solar Farm.......................................... 10
OPTION 2 - COMBINED HEAT AND POWER (THERMAL LOAD FOLLOWING) .............................. 10
2A - CTG with Heat Recovery Steam Generator (Thermal Load Following) ............................ 11
2B - Eliminate Summer Steam Load ......................................................................................... 11
2C - Solar Energy Farm ............................................................................................................. 11
2D - Combination Eliminate Summer Steam Load and Solar Farm.......................................... 11
OPTION 3 - COMBINED HEAT AND POWER (ELECTRIC LOAD FOLLOWING) ............................. 12
3A - CTG with Heat Recovery Steam Generator (Electric Load Following) .............................. 12
3B - Eliminate Summer Steam Load ......................................................................................... 13
3C - Solar Energy Farm ............................................................................................................. 13
3D - Combination Eliminate Summer Steam Load and Solar Farm.......................................... 13
5. METHODOLOGY ................................................................................................................................. 14
6. CONCLUSIONS ................................................................................................................................... 16
RECOMMENDATIONS ........................................................................................................................ 17
APPENDICES
A. Energy Upgrade Results
B. Financial Summary Results
C. CES Data
D. Photovoltaic Consultant Data
Page 3
ENERGY UPGRADE SCREENING STUDY
Job No. 28471.00 - October 28, 2016 Page | 1
1. INTRODUCTION
R.G. Vanderweil Engineers, LLP Power Group (Vanderweil) was retained by the University of Maine (UMaine) to perform an Energy Upgrade Screening Study which addresses the feasibility of installing combined heat and power (CHP) and a third-party Photovoltaic (PV) solar energy generation farm. This study was performed in accordance with Vanderweil’s proposal dated February 24, 2016. This report summarizes the various investigations performed by Vanderweil and presents the results for the inclusion of CHP and PV generation.
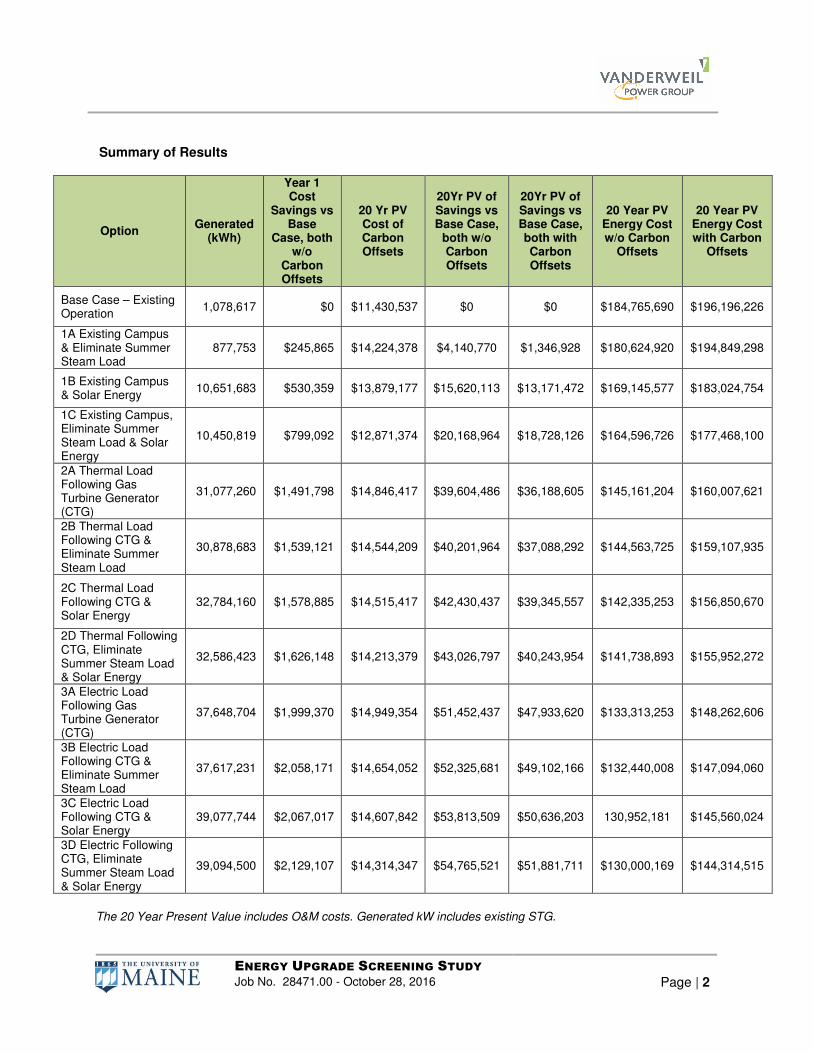
2. EXECUTIVE SUMMARY UMaine is exploring opportunities to implement energy solutions at the Orono, ME campus. The UMaine System’s objectives are “to ensure safe, reliable, efficient, economical, and environmentally responsible services to each campus”. The focus of this Energy Upgrade Screening Study is to review energy savings for alternatives that include Combined Heat and Power, Solar Energy Generation, and Elimination of Summer Steam Generation. This study reviews annual savings and costs associated with these alternatives to examine the merits of pursuing these energy opportunities further. This study updates a previous analysis performed by Vanderweil in 2010. Since 2010, UMaine installed a 60,000 lb/hr gas-fired steam boiler, Boiler #8, in the existing steam plant to replace Boiler #3 and #4. The new boiler increases the overall efficiency of the heating plant and reduces UMaine’s dependency on their #6 fuel oil fired boilers. Both the efficiency improvement and reduction in oil consumption result in significant cost savings. UMaine believes it can also expand energy and cost savings through Combined Heat and Power and Solar Energy. A CHP installation on the east side of campus would add resiliency to the steam system by back-feeding steam from the opposite side of campus. On loss of either the existing boiler plant or the CHP plant, steam can be distributed to campus with minimized interruption. The current steam distribution system is fed radially from the existing steam plant making the campus vulnerable to steam outages if a main steam pipeline were to fail. CHP would also increase campus energy efficiency through generation of electricity while making use of the waste heat as steam. A boiler would operate at minimum load in the existing heating plant as back-up and to generate electricity with the existing steam turbine generators (STG). Solar generation on the east side of campus would benefit UMaine by adding low cost renewable energy generation on campus. The solar site would be built and operated by a third-party developer who would maintain the solar farm and sell generated electricity to UMaine. The developer would retain the renewable energy credits (RECs). Vanderweil performed a load analysis using metered and logged data provided by UMaine to size CHP and potential solar energy farm. Competitive Energy Services (CES) provided utility cost and campus growth forecasts to predict energy use and costs over the next 20 years. The analysis results are presented in the table below. Detailed output is presented in Section 4 - Energy Upgrades and in the Appendix.
kdoiron
Text Box
SEE ADDITIONAL COMMENTS ON PAGE 17 RECOMMENDATIONS SECTION. ksd 2016-12-23
Page 4
ENERGY UPGRADE SCREENING STUDY
Job No. 28471.00 - October 28, 2016 Page | 2
Summary of Results
Option Generated
(kWh)
Year 1 Cost
Savings vs Base
Case, both w/o
Carbon Offsets
20 Yr PV Cost of Carbon Offsets
20Yr PV of Savings vs Base Case,
both w/o Carbon Offsets
20Yr PV of Savings vs Base Case, both with Carbon Offsets
20 Year PV Energy Cost w/o Carbon
Offsets
20 Year PV Energy Cost with Carbon
Offsets
Base Case – Existing Operation
1,078,617 $0 $11,430,537 $0 $0 $184,765,690 $196,196,226
1A Existing Campus & Eliminate Summer Steam Load
877,753 $245,865 $14,224,378 $4,140,770 $1,346,928 $180,624,920 $194,849,298
1B Existing Campus & Solar Energy
10,651,683 $530,359 $13,879,177 $15,620,113 $13,171,472 $169,145,577 $183,024,754
1C Existing Campus, Eliminate Summer Steam Load & Solar Energy
10,450,819 $799,092 $12,871,374 $20,168,964 $18,728,126 $164,596,726 $177,468,100
2A Thermal Load Following Gas Turbine Generator (CTG)
31,077,260 $1,491,798 $14,846,417 $39,604,486 $36,188,605 $145,161,204 $160,007,621
2B Thermal Load Following CTG & Eliminate Summer Steam Load
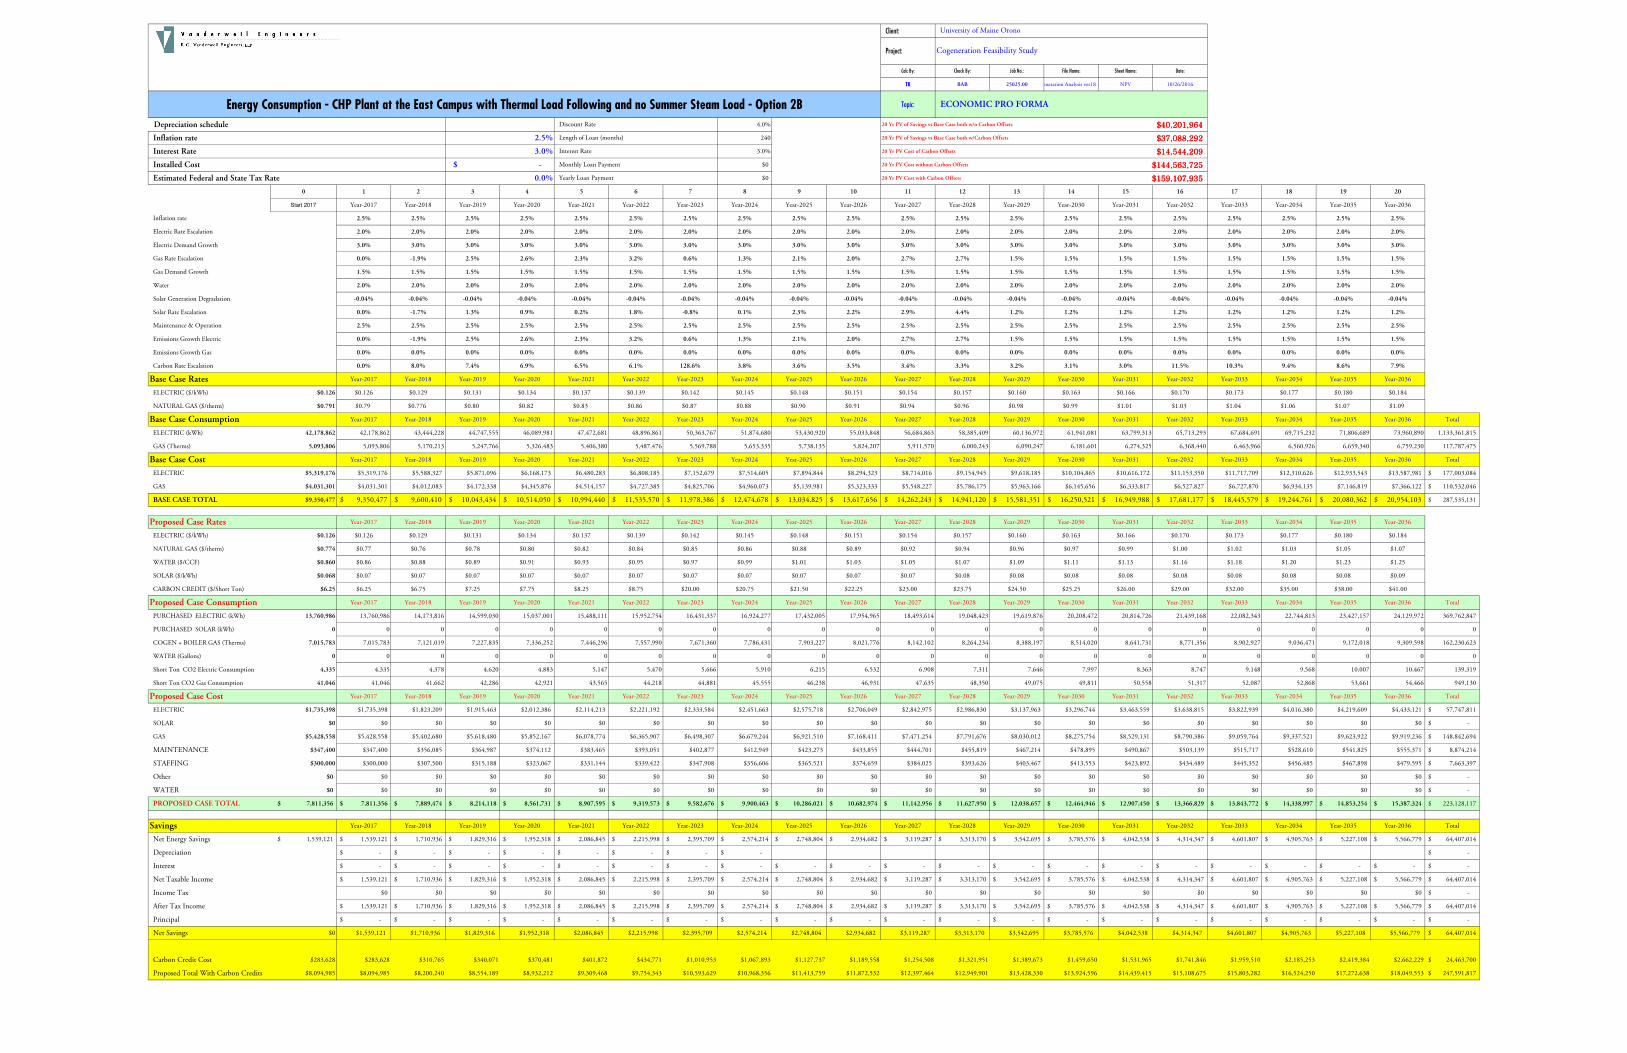
30,878,683 $1,539,121 $14,544,209 $40,201,964 $37,088,292 $144,563,725 $159,107,935
2C Thermal Load Following CTG & Solar Energy
32,784,160 $1,578,885 $14,515,417 $42,430,437 $39,345,557 $142,335,253 $156,850,670
2D Thermal Following CTG, Eliminate Summer Steam Load & Solar Energy
32,586,423 $1,626,148 $14,213,379 $43,026,797 $40,243,954 $141,738,893 $155,952,272
3A Electric Load Following Gas Turbine Generator (CTG)
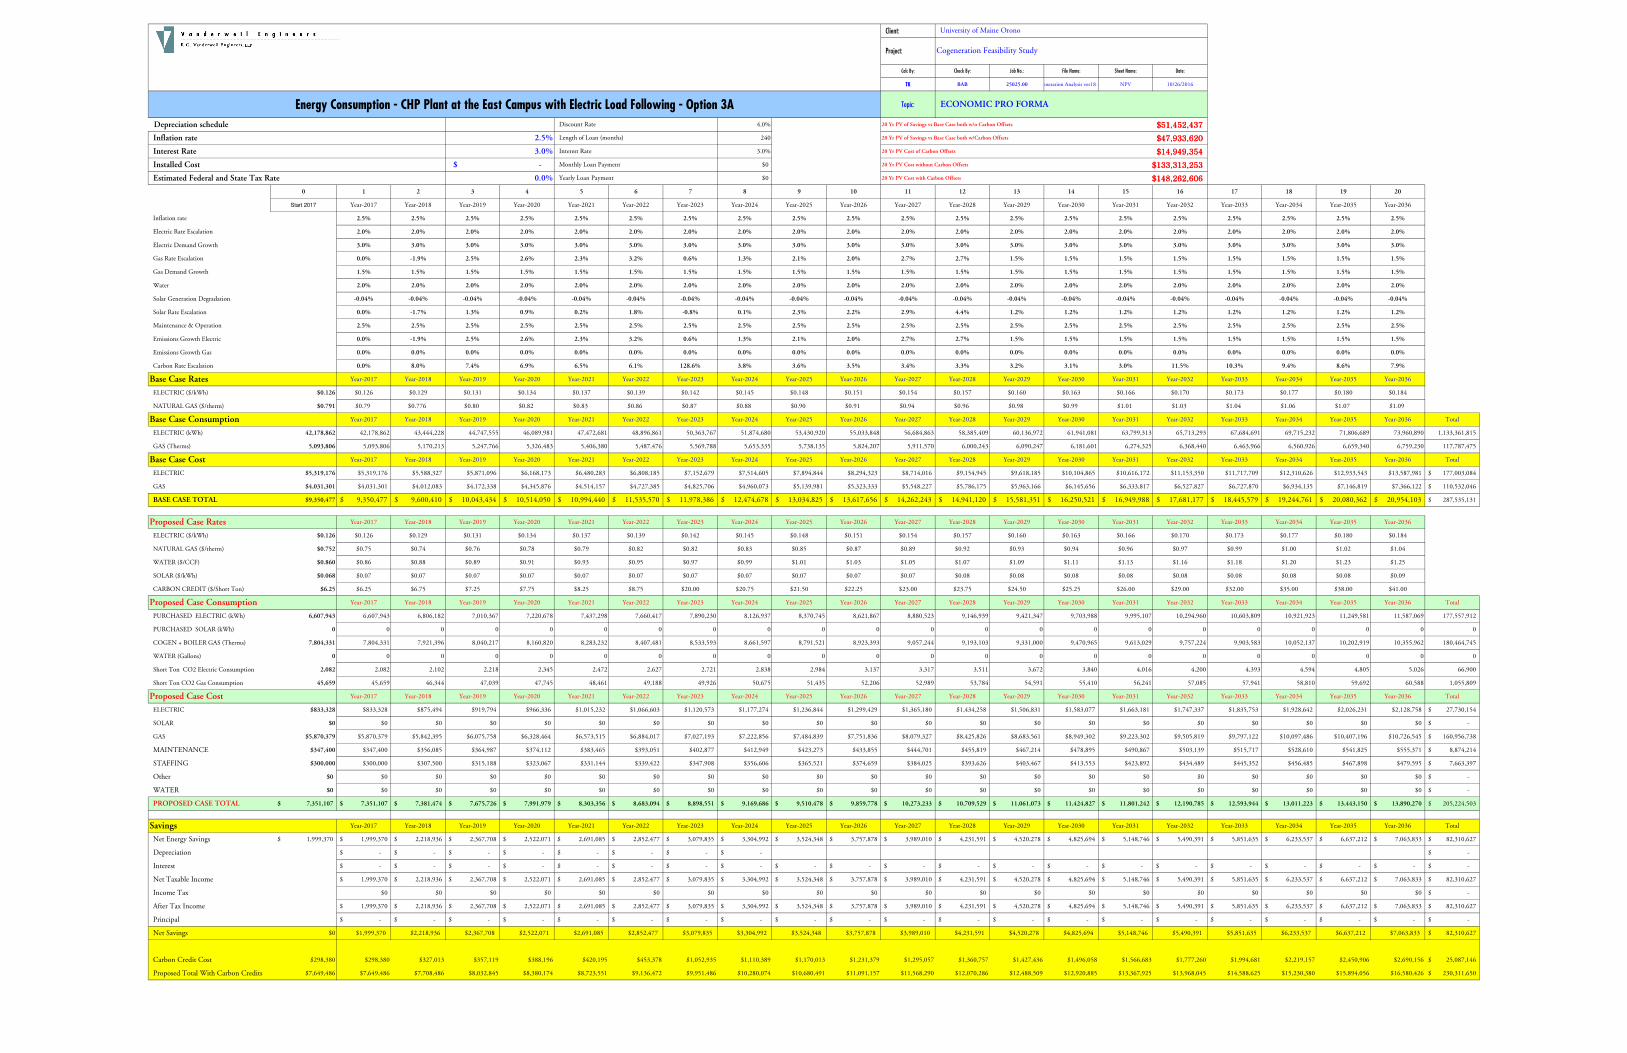
37,648,704 $1,999,370 $14,949,354 $51,452,437 $47,933,620 $133,313,253 $148,262,606
3B Electric Load Following CTG & Eliminate Summer Steam Load
37,617,231 $2,058,171 $14,654,052 $52,325,681 $49,102,166 $132,440,008 $147,094,060
3C Electric Load Following CTG & Solar Energy
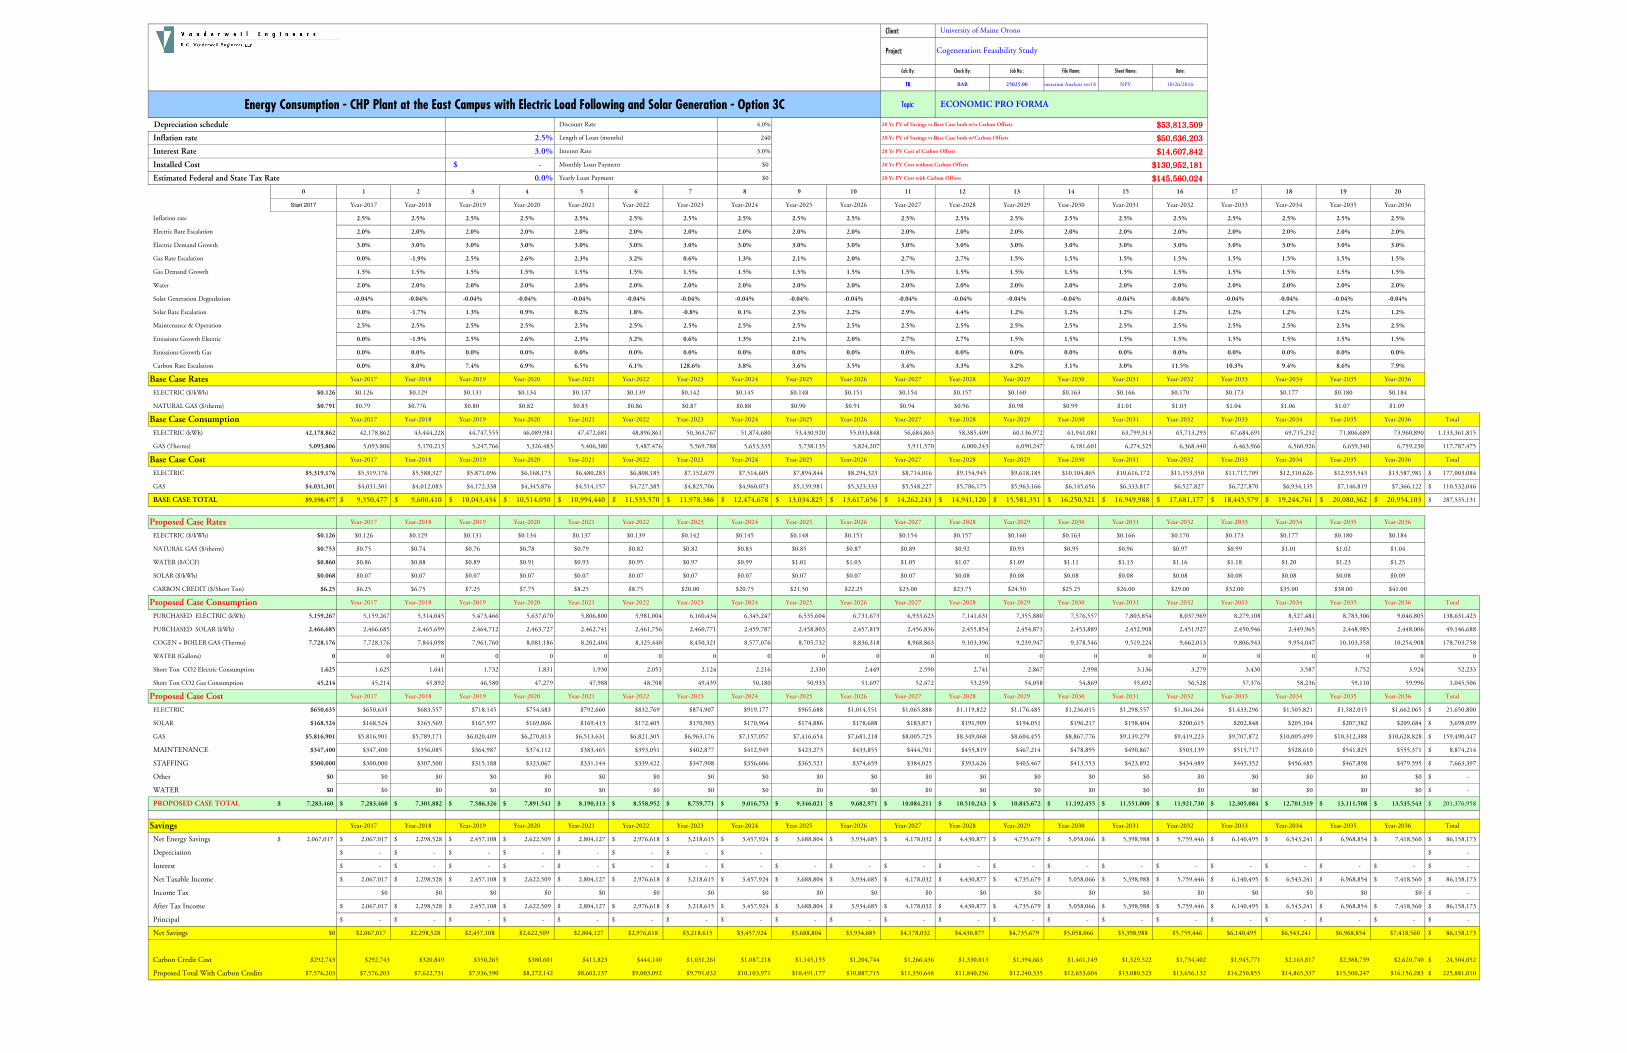
39,077,744 $2,067,017 $14,607,842 $53,813,509 $50,636,203 130,952,181 $145,560,024
3D Electric Following CTG, Eliminate Summer Steam Load & Solar Energy
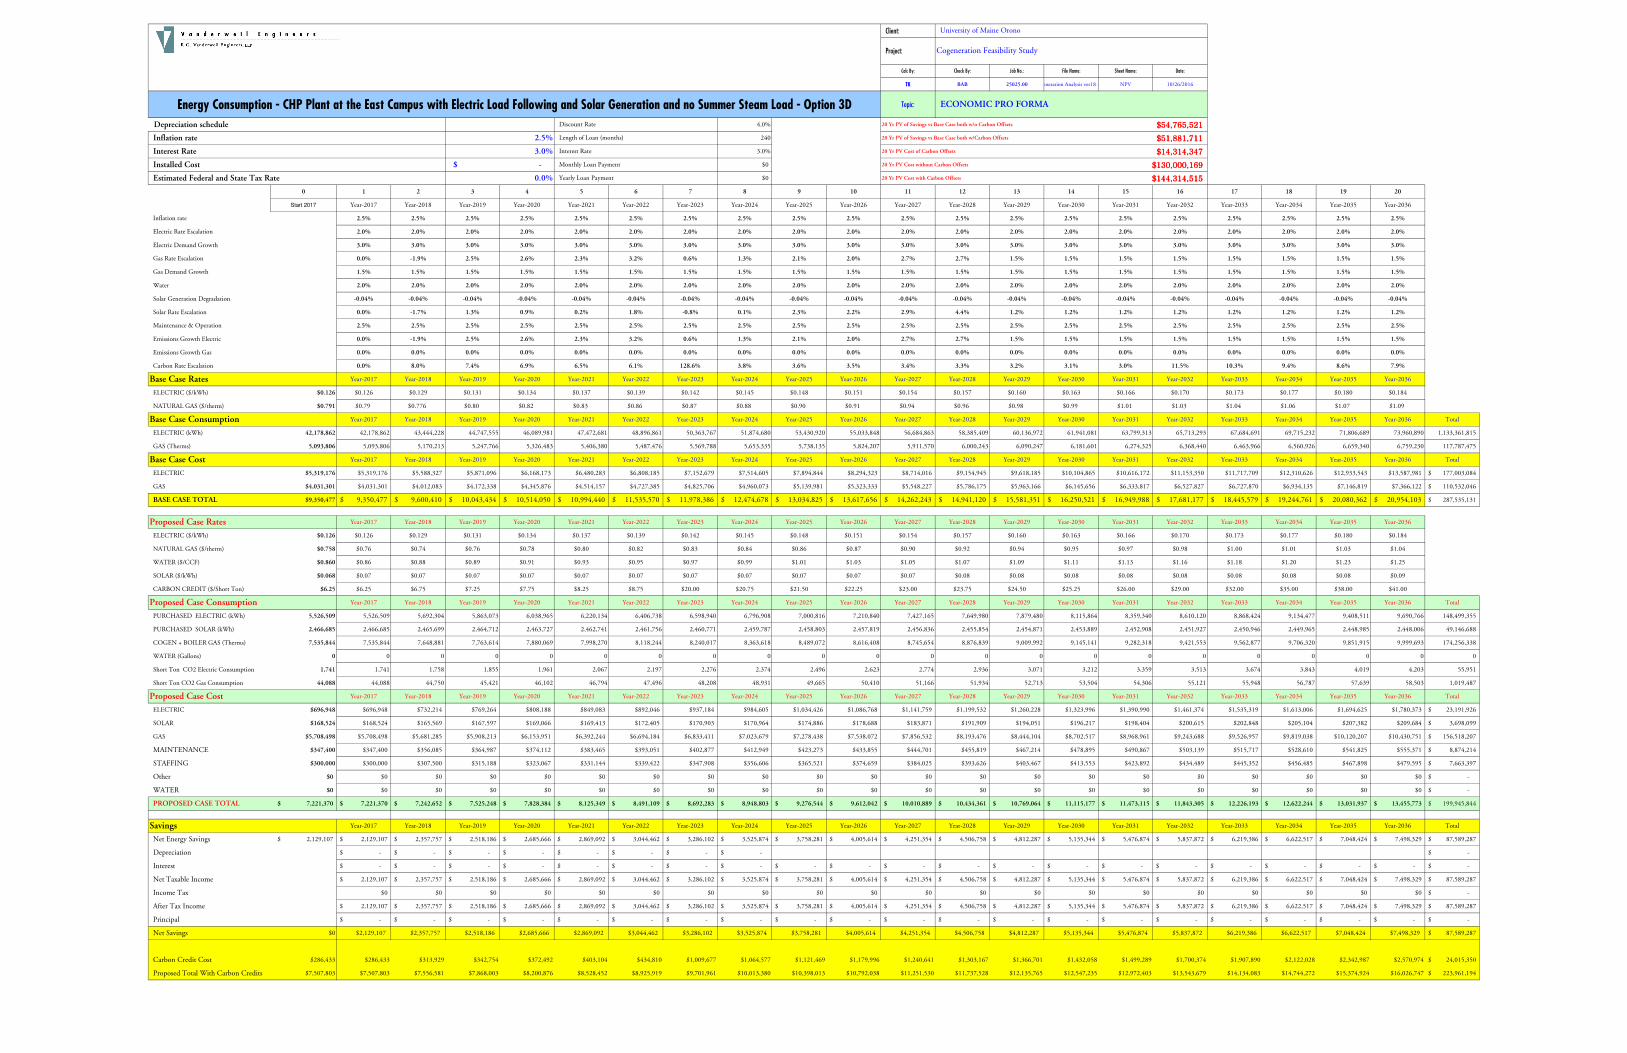
39,094,500 $2,129,107 $14,314,347 $54,765,521 $51,881,711 $130,000,169 $144,314,515
The 20 Year Present Value includes O&M costs. Generated kW includes existing STG.
kdoiron
Text Box
4.5MW, 2MW dc
kdoiron
Text Box
4.5MW, 2MW dc
kdoiron
Text Box
4.5MW, 2MW dc
kdoiron
Text Box
4.5MW, 2MW dc
Page 5
# Option
Electrical Generated(kWh/yr)
20Yr PV of Savings vs Base Case, both No Carbon Offsets
20Yr PV of Savings vs Base Case, both
with Carbon Offsets
20Yr PV of Energy Cost
No Carbon Offsets
20Yr PV of Energy Cost
with Carbon Offsets
20Yr PV of Carbon Offset
Cost
20Yr PV of Savings vs Base Case, both No Carbon Offsets
20Yr PV of Savings vs Base Case, both
with Carbon Offsets
20Yr PV of Energy Cost
No Carbon Offsets
20Yr PV of Energy Cost
with Carbon Offsets
20Yr PV of Carbon Offset
Cost
Base case with 3%/yr both
No Carbon Offsets
Base case with 3%/yr both
with Carbon Offsets
Base Case
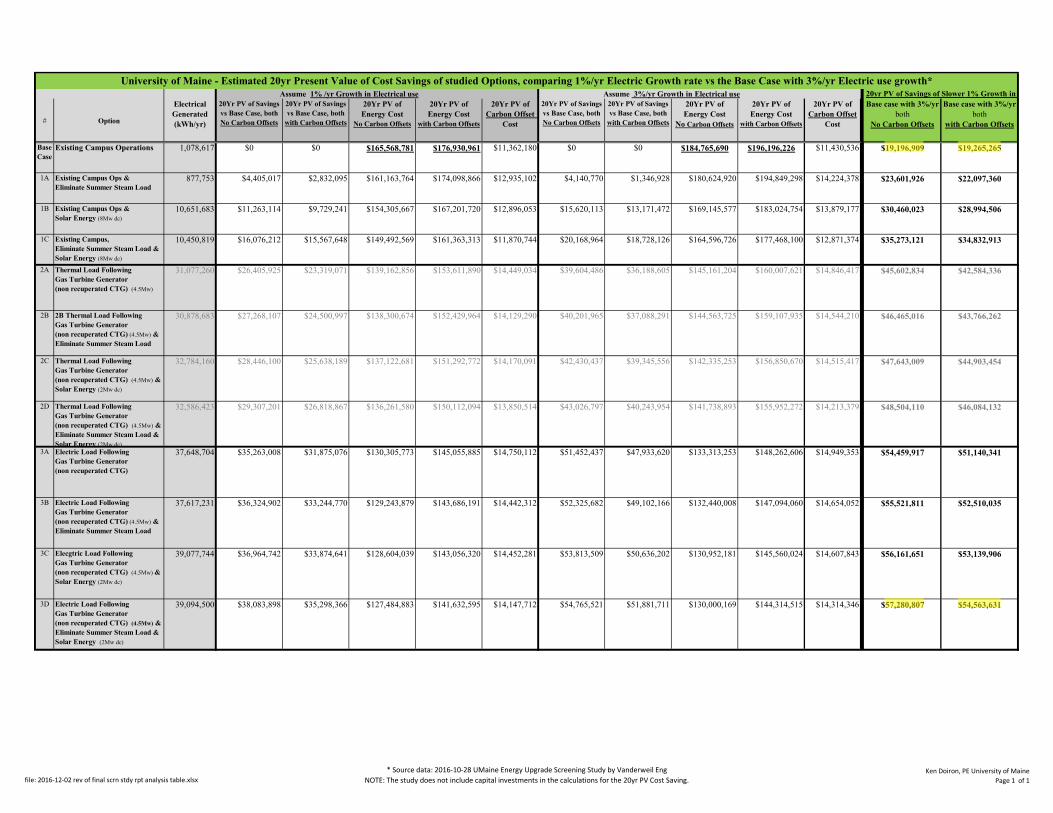
Existing Campus Operations 1,078,617 $0 $0 $165,568,781 $176,930,961 $11,362,180 $0 $0 $184,765,690 $196,196,226 $11,430,536 $19,196,909 $19,265,265
1A Existing Campus Ops & Eliminate Summer Steam Load
877,753 $4,405,017 $2,832,095 $161,163,764 $174,098,866 $12,935,102 $4,140,770 $1,346,928 $180,624,920 $194,849,298 $14,224,378 $23,601,926 $22,097,360
1B Existing Campus Ops & Solar Energy (8Mw dc)
10,651,683 $11,263,114 $9,729,241 $154,305,667 $167,201,720 $12,896,053 $15,620,113 $13,171,472 $169,145,577 $183,024,754 $13,879,177 $30,460,023 $28,994,506
1C Existing Campus, Eliminate Summer Steam Load &Solar Energy (8Mw dc)
10,450,819 $16,076,212 $15,567,648 $149,492,569 $161,363,313 $11,870,744 $20,168,964 $18,728,126 $164,596,726 $177,468,100 $12,871,374 $35,273,121 $34,832,913
2A Thermal Load FollowingGas Turbine Generator (non recuperated CTG) (4.5Mw)
31,077,260 $26,405,925 $23,319,071 $139,162,856 $153,611,890 $14,449,034 $39,604,486 $36,188,605 $145,161,204 $160,007,621 $14,846,417 $45,602,834 $42,584,336
2B 2B Thermal Load FollowingGas Turbine Generator (non recuperated CTG) (4.5Mw) & Eliminate Summer Steam Load
30,878,683 $27,268,107 $24,500,997 $138,300,674 $152,429,964 $14,129,290 $40,201,965 $37,088,291 $144,563,725 $159,107,935 $14,544,210 $46,465,016 $43,766,262
2C Thermal Load FollowingGas Turbine Generator (non recuperated CTG) (4.5Mw) & Solar Energy (2Mw dc)
32,784,160 $28,446,100 $25,638,189 $137,122,681 $151,292,772 $14,170,091 $42,430,437 $39,345,556 $142,335,253 $156,850,670 $14,515,417 $47,643,009 $44,903,454
2D Thermal Load FollowingGas Turbine Generator (non recuperated CTG) (4.5Mw) & Eliminate Summer Steam Load & Solar Energy (2Mw dc)
32,586,423 $29,307,201 $26,818,867 $136,261,580 $150,112,094 $13,850,514 $43,026,797 $40,243,954 $141,738,893 $155,952,272 $14,213,379 $48,504,110 $46,084,132
3A Electric Load FollowingGas Turbine Generator (non recuperated CTG)
37,648,704 $35,263,008 $31,875,076 $130,305,773 $145,055,885 $14,750,112 $51,452,437 $47,933,620 $133,313,253 $148,262,606 $14,949,353 $54,459,917 $51,140,341
3B Electric Load FollowingGas Turbine Generator (non recuperated CTG) (4.5Mw) & Eliminate Summer Steam Load
37,617,231 $36,324,902 $33,244,770 $129,243,879 $143,686,191 $14,442,312 $52,325,682 $49,102,166 $132,440,008 $147,094,060 $14,654,052 $55,521,811 $52,510,035
3C Elecgtric Load FollowingGas Turbine Generator (non recuperated CTG) (4.5Mw) & Solar Energy (2Mw dc)
39,077,744 $36,964,742 $33,874,641 $128,604,039 $143,056,320 $14,452,281 $53,813,509 $50,636,202 $130,952,181 $145,560,024 $14,607,843 $56,161,651 $53,139,906
3D Electric Load FollowingGas Turbine Generator (non recuperated CTG) (4.5Mw) & Eliminate Summer Steam Load & Solar Energy (2Mw dc)
39,094,500 $38,083,898 $35,298,366 $127,484,883 $141,632,595 $14,147,712 $54,765,521 $51,881,711 $130,000,169 $144,314,515 $14,314,346 $57,280,807 $54,563,631
20yr PV of Savings of Slower 1% Growth in Assume 1% /yr Growth in Electrical use Assume 3%/yr Growth in Electrical useUniversity of Maine - Estimated 20yr Present Value of Cost Savings of studied Options, comparing 1%/yr Electric Growth rate vs the Base Case with 3%/yr Electric use growth*
file: 2016‐12‐02 rev of final scrn stdy rpt analysis table.xlsx* Source data: 2016‐10‐28 UMaine Energy Upgrade Screening Study by Vanderweil Eng
NOTE: The study does not include capital investments in the calculations for the 20yr PV Cost Saving. Ken Doiron, PE University of Maine
Page 1 of 1
Page 6
ENERGY UPGRADE SCREENING STUDY
Job No. 28471.00 - October 28, 2016 Page | 3
Option 1 consists of three (3) alternatives without CHP. Solar energy generation provides more cost savings than eliminating summer steam load. Solar cost savings assume that the solar farm is built, owned and operated by a solar energy developer. It is assumed that energy is not exported to the utility. It is possible to export electricity and it may result in additional cost savings, however, interconnection issues with the utility would have to be addressed in more detail. Option 2 consists of four (4) alternatives for a CHP plant operating thermal load following. The facility would be located on the east side of campus adjacent to the east substation located off Rangeley Road behind the Facilities Management building. The new plant would be electrically connected to the east substation and mechanically connected to the steam and condensate distribution system through a new steam loop from the Hilltop to the DP Corbett area. The analysis results in significant savings when compared to the campus without CHP, but less savings than a CHP plant operating electrical load following (Option 3). Alternatives B, C, and D combine CHP with solar generation and elimination of summer steam load. These alternatives show minimal additional savings due to CHP interaction with other alternatives included. Option 3 consists of four (4) alternatives for a CHP plant operating electrical load following. The CHP facility would be the same as Option 2 with operational differences. Like Option 2, the analysis results in significant savings when compared to the campus without CHP. Alternatives B, C and D combine CHP with solar generation and elimination of summer steam load. These alternatives show minimal additional savings due to CHP interaction with other alternatives included. Twenty (20) year present value costs show a similar trend with and without carbon credits.
3. LOAD ANALYSIS AND CONFIGURATION SELECTION Data provided by UMaine was used to form the basis of the analysis. This data was used to produce electrical and thermal load profiles which were used to determine annual purchased electricity and natural gas consumption. A summary of the campus’s loads are shown graphically below. ELECTRICAL LOAD
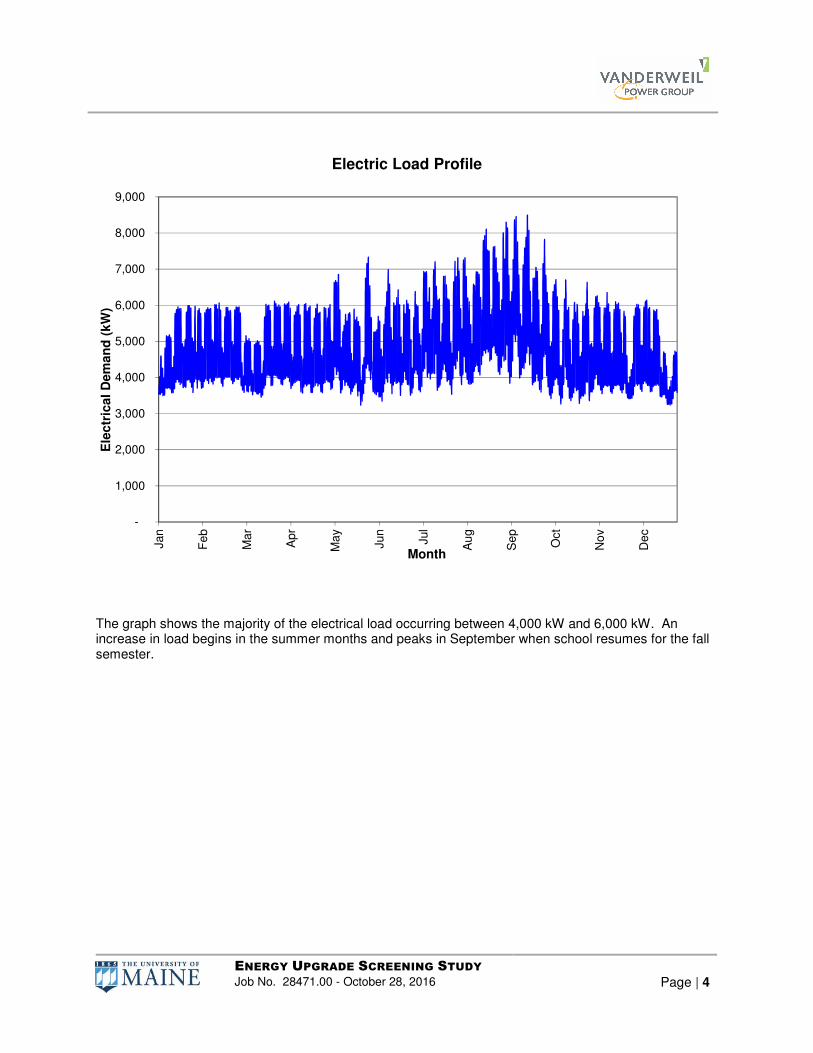
Vanderweil reviewed metered data provided by UMaine. The data was polled in 15 minute increments over the course of an entire year. The peak electrical load is approximately 8,500 kW. The load profile is shown in the graph below.
kdoiron
Text Box
SEE ADDITIONAL COMMENTS ON PAGE 17 RECOMMENDATIONS SECTION. ksd 2016-12-23
Page 7
ENERGY UPGRADE SCREENING STUDY
Job No. 28471.00 - October 28, 2016 Page | 4
The graph shows the majority of the electrical load occurring between 4,000 kW and 6,000 kW. An increase in load begins in the summer months and peaks in September when school resumes for the fall semester.
-
1,000
2,000
3,000
4,000
5,000
6,000
7,000
8,000
9,000
Jan
Fe
b
Ma
r
Ap
r
Ma
y
Jun
Jul
Au
g
Se
p
Oct
No
v
De
c
Ele
ctr
ical D
em
an
d (
kW
)
Month
Electric Load Profile
Page 8
ENERGY UPGRADE SCREENING STUDY
Job No. 28471.00 - October 28, 2016 Page | 5
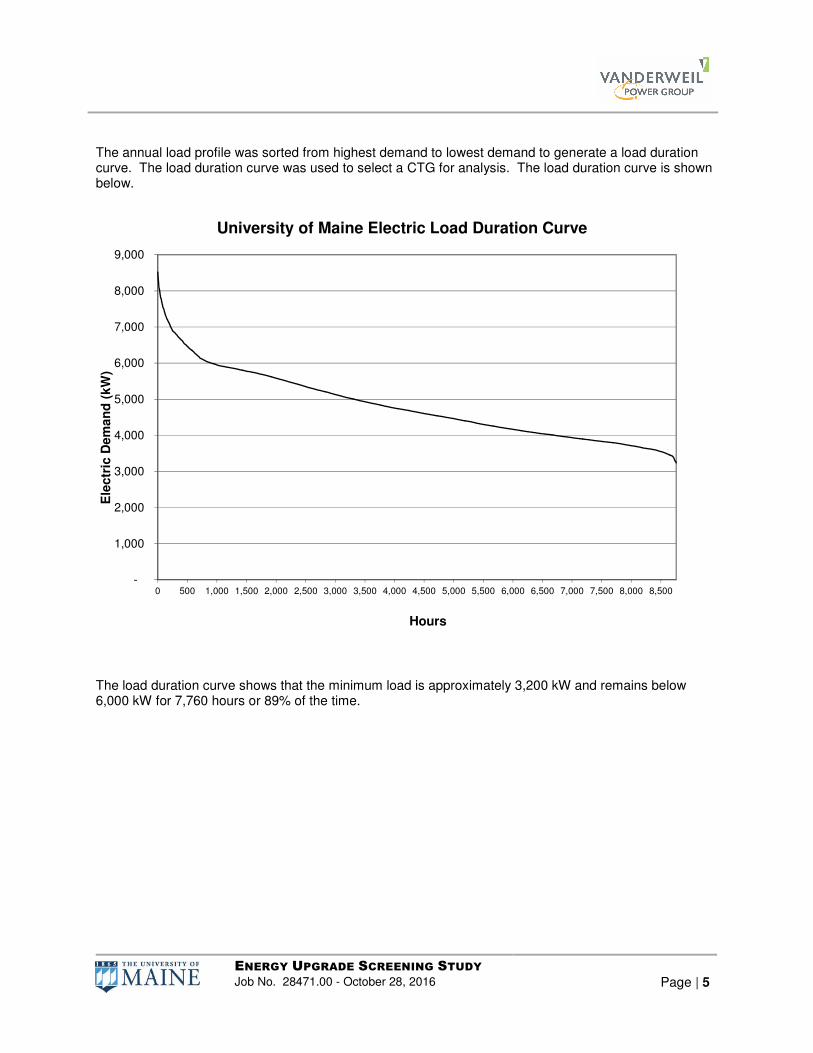
The annual load profile was sorted from highest demand to lowest demand to generate a load duration curve. The load duration curve was used to select a CTG for analysis. The load duration curve is shown below.
The load duration curve shows that the minimum load is approximately 3,200 kW and remains below 6,000 kW for 7,760 hours or 89% of the time.
-
1,000
2,000
3,000
4,000
5,000
6,000
7,000
8,000
9,000
0 500 1,000 1,500 2,000 2,500 3,000 3,500 4,000 4,500 5,000 5,500 6,000 6,500 7,000 7,500 8,000 8,500
Ele
ctr
ic D
em
an
d (
kW
)
Hours
University of Maine Electric Load Duration Curve
Page 9
ENERGY UPGRADE SCREENING STUDY
Job No. 28471.00 - October 28, 2016 Page | 6
The load profile was also sorted to include only the daylight hours available for solar power generation. This load duration curve was used to size solar power generation equipment. The load duration curve is included below.
The available solar load duration curve shows solar availability for 4,500 hours (51% of the time) above 3,200 kW.
-
1,000
2,000
3,000
4,000
5,000
6,000
7,000
8,000
9,000
0 500 1,000 1,500 2,000 2,500 3,000 3,500 4,000 4,500 5,000 5,500 6,000 6,500 7,000 7,500 8,000 8,500
Ele
ctr
ic D
em
an
d (
kW
)
Hours
University of Maine Electric Load Duration CurveSolar Available Hours
Page 10
ENERGY UPGRADE SCREENING STUDY
Job No. 28471.00 - October 28, 2016 Page | 7
STEAM LOAD
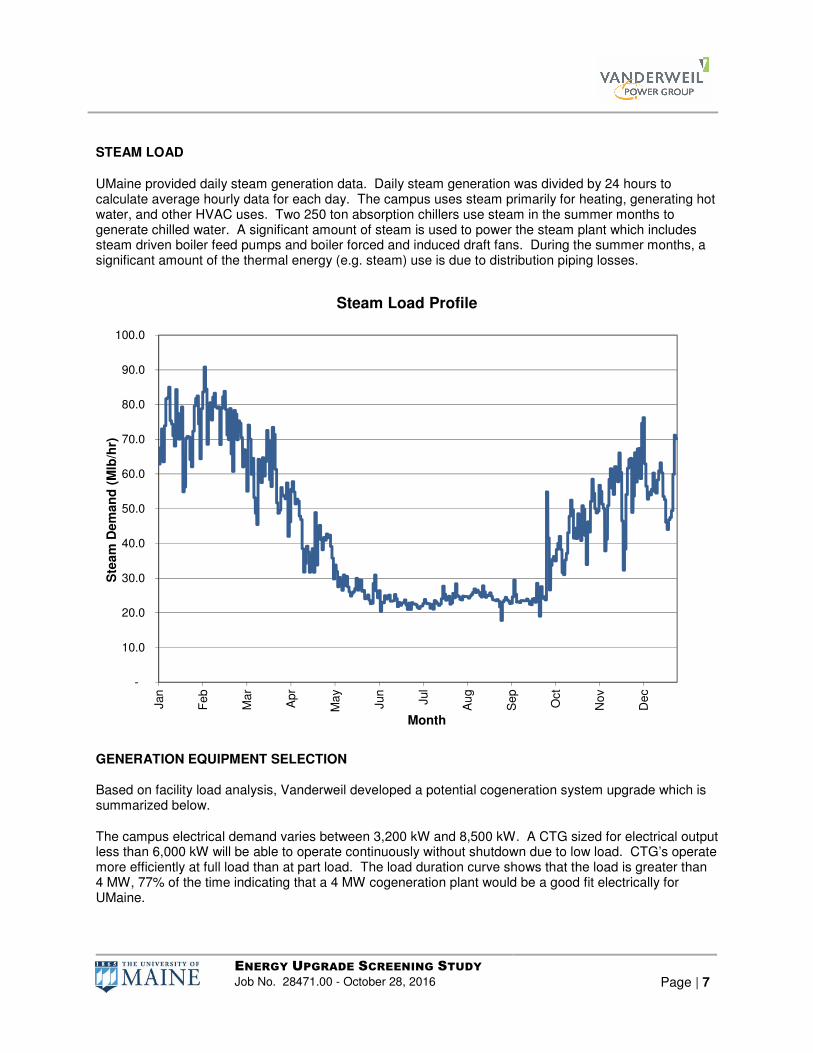
UMaine provided daily steam generation data. Daily steam generation was divided by 24 hours to calculate average hourly data for each day. The campus uses steam primarily for heating, generating hot water, and other HVAC uses. Two 250 ton absorption chillers use steam in the summer months to generate chilled water. A significant amount of steam is used to power the steam plant which includes steam driven boiler feed pumps and boiler forced and induced draft fans. During the summer months, a significant amount of the thermal energy (e.g. steam) use is due to distribution piping losses.
GENERATION EQUIPMENT SELECTION Based on facility load analysis, Vanderweil developed a potential cogeneration system upgrade which is summarized below.
The campus electrical demand varies between 3,200 kW and 8,500 kW. A CTG sized for electrical output less than 6,000 kW will be able to operate continuously without shutdown due to low load. CTG’s operate more efficiently at full load than at part load. The load duration curve shows that the load is greater than 4 MW, 77% of the time indicating that a 4 MW cogeneration plant would be a good fit electrically for UMaine.
-
10.0
20.0
30.0
40.0
50.0
60.0
70.0
80.0
90.0
100.0
Jan
Fe
b
Ma
r
Ap
r
Ma
y
Jun
Jul
Au
g
Se
p
Oct
No
v
De
c
Ste
am
Dem
an
d (
Mlb
/hr)
Month
Steam Load Profile
Page 11
ENERGY UPGRADE SCREENING STUDY
Job No. 28471.00 - October 28, 2016 Page | 8
The steam load profile shows that campus load is greater than 20,000 lb/hr for most of the year. During the heating season, the load increases above 40,000 lb/hr and peaks over 100,000 lb/hr (full peak is not seen due to using calculated average hourly data). A review of the campus’s electrical load duration curve shows that a Solar Centaur 50 CTG is a good fit for these profiles. The Centaur 50 generates 4,500 kW nominal at standard conditions. The CTG’s Heat Recovery Steam Generator (HRSG) produces approximately 25,000 lb/hr without the use of supplemental duct burners. Duct burner operation can increase the HRSG steam production to 48,000 lb/hr. The CTG could operate most of the year at full load. During the heating season, supplemental duct burner firing would produce additional steam capacity at high efficiency. Duct burners would be shut down during the summer months. Study cases that include both cogeneration and photovoltaic electrical production, would include 1,500 kW AC of PV solar panels with 4,500 kW of cogeneration. The load duration curve for daylight hours shows diminishing returns above 6,000 kW of electrical generation. This is seen by the steep slope above 6,000 kW. A standalone PV installation would be sized for 6,000 kW AC, where the alternating current size is based on inverter capacity. The direct current size would be 8,000 kW, the installed capacity of the photovoltaic cells. Typically, inverter capacity is sized lower than the total capacity of the solar array. This practice is to maximize the value of the combination. The DC panel capacity is oversized to allow for an increased generating capacity earlier and later in the day when the sun is at a lower angle of incidence.
4. ENERGY UPGRADES UMaine identified three energy upgrade options for analysis in this study. The first option consists of updating the base case energy model developed in 2010. Since 2010, UMaine installed a high efficiency 60,000 lb/hr gas-fired watertube boiler with an economizer. The other two options analyze adding a Combustion Gas Turbine. OPTION 1 - EXISTING CAMPUS/BASE CASE WITH ALTERNATIVES The base case consists of the existing campus steam plant that houses four watertube steam boilers sized at approximately 60,000 lb/hr each. Boiler #7 and new Boiler #8 are used as the primary source of steam generation with Boilers #5 and #6 serving as backup. The combination of Boilers #5, #6, #7 and #8 provide full redundancy for the peak campus steam load between 100,000 lb/hr and120,000 lb/hr.
Page 12
ENERGY UPGRADE SCREENING STUDY
Job No. 28471.00 - October 28, 2016 Page | 9
Option
Year 1 20 Year PV
Energy Cost without Carbon Offsets
20 Year PV Energy Cost with Carbon
Offsets
Generated (kWh)
Purchased (kWh)
Purchased Natural
Gas1 (DTherms)
Energy Cost
(Electricity & Natural
Gas)
Base Case – Existing Operation
1,078,617 42,178,862 509,381 $9,350,477 $184,765,690 $196,196,226
1A Existing Campus & Eliminate Summer Steam Load
877,753 42,759,457 455,549 $9,104,612 $180,624,920 $194,849,298
1B Existing Campus & Solar Energy
10,651,683 32,605,796 516,237 $8,820,118 $169,145,577 $183,024,754
1C Existing Campus, Eliminate Summer Steam Load & Solar Energy
10,450,819 33,186,392 455,549 $8,551,385 $164,596,726 $177,468,100
Note: 1. Base Case Purchased Natural Gas includes 272,711 equivalent therms of fuel oil consumed.
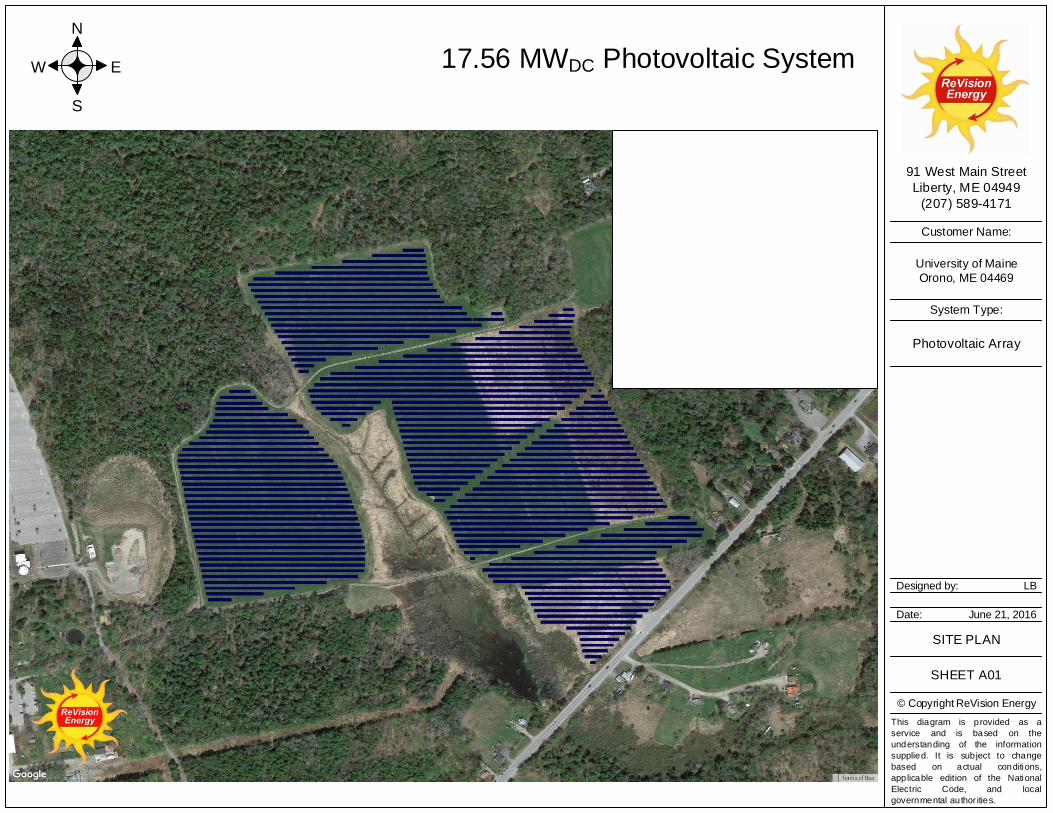
Option 1 has three (3) alternatives to the base case. 1A - Eliminate Summer Steam Load The summer steam load consists of campus loads such as domestic hot water, absorption chiller cooling, and HVAC. To generate steam, the campus steam plant uses parasitic steam for powering boiler draft fans, boiler feed water pumps, and by the deaerator. Localized hot water generation would be employed to replace campus steam. Decentralized hot water boilers and hot water heaters would be installed to generate domestic hot water and hot water for HVAC. Electric chillers would be installed in Barrows and Aubert to replace steam consuming absorption chillers. The chillers are sized 287 tons and 200 tons respectively. Note: In order to eliminate steam usage in the summer, the existing steam piping system will need to be evaluated to ensure that the change in pipe temperature due to de-energizing it in the summer will not compromise the integrity of the steam distribution system. 1B - Solar Energy Farm UMaine has a large plot of land on the east side of campus. It is divided into two usable parcels of 17 acres and 51 acres. A qualified solar energy contractor/developer could construct and maintain arrays of photovoltaic solar energy panels on this property. It is estimated that the site can support a 17.5 MW solar energy installation with inverters sized to deliver a maximum of 13.1 MW AC. Based on the campus load duration curve, an 8,000 kW array with a 6,000 kW AC inverter capacity would be a reasonable size to assume at this time, reserving the remaining land for possible future expansion. The installation would be installed behind UMaine’s electric meter and sold
Page 13
ENERGY UPGRADE SCREENING STUDY
Job No. 28471.00 - October 28, 2016 Page | 10
to the university by the developer at a competitive rate. The developer would own the Renewable Energy Credits (RECs). 1C - Combination Eliminate Summer Steam Load and Solar Farm This alternative combines elimination of the summer steam load and the installation of a third-party solar energy farm. This alternative would realize an increase in summer purchased electricity due to the conversion of absorption chillers to electric centrifugal chillers and summer shutdown of the steam turbine generators in the heating plant. OPTION 2 - COMBINED HEAT AND POWER (THERMAL LOAD FOLLOWING) Option 2 has four (4) alternative cases for a new Combined Heat and Power (CHP) plant located on the east side of campus adjacent to the east substation near the service building. These alternatives calculate energy consumption with the CHP plant thermal load following. Thermal load following attempts to minimize thermal losses by reducing turbine load when campus thermal energy/steam demand is less than the potential unfired output of the turbine exhaust. On low campus steam demand, CHP controls will vary the CTG load in attempt to match steam output to campus demand. On very low campus steam load, the CTG will operate at minimum load. On very low campus electric load, the CTG will shut down. This CHP plant would be electrically connected to the east substation and mechanically connected to the steam and condensate distribution system. A new 4” pumped condensate pipeline is needed with these alternatives to bring condensate return from the College Avenue steam plant to the new CHP plant. The new CHP facility would include power island equipment and balance of plant equipment required for a new steam and power generation facility.
Option
Year 1 20 Year PV
Energy Cost without Carbon Offsets
20 Year PV Energy Cost with Carbon
Offsets
Generated (kWh)
Purchased (kWh)
Purchased Natural
Gas (DTherms)
Energy Cost
(Electricity & Natural
Gas)
Base Case – Existing Operation
1,078,617 42,178,862 509,381 $9,350,477 $184,765,690 $196,196,226
2A Thermal Load Following Gas Turbine Generator (CTG)
31,077,260 13,179,387 722,984 $7,211,279 $145,161,204 $160,007,621
2B Thermal Load Following CTG & Eliminate Summer Steam Load
30,878,683 13,760,986 701,578 $7,163,956 $144,563,725 $159,107,935
2C Thermal Load Following CTG & Solar Energy
32,784,160 11,452,904 718,140 $7,124,192 $142,335,253 $156,850,670
2D Thermal Following CTG, Eliminate Summer Steam Load & Solar Energy
32,586,423 12,034,585 696,743 $7,076,929 $141,738,893 $155,952,272
Page 14
ENERGY UPGRADE SCREENING STUDY
Job No. 28471.00 - October 28, 2016 Page | 11
2A - CTG with Heat Recovery Steam Generator (Thermal Load Following)
This alternative is the installation of a CHP plant based on a 4.5 MW natural gas fired combustion turbine generator (Solar Centaur 50) with an HRSG utilizing duct burners. The HSRG would be capable of producing approximately 25,000 lb/hr of 150 psig saturated steam unfired, and up to 48,000 lb/hr of steam with the addition of a duct burner. The existing boilers in the College Avenue steam plant would be required to meet steam demand greater than 48,000 lb/hr and to provide backup in the event of an equipment trip or maintenance outage. Most of the time the HRSG will operate without thermal venting or bypassing. Subject to ME DEP permit approval, the new CHP power island equipment would be located in a new building near the east substation. CTG could be designed to burn two fuels (natural gas and #2 oil) to provide fuel redundancy in the event of natural gas curtailment. The HRSG duct burner would burn natural gas only. 2B - Eliminate Summer Steam Load The summer steam load consists of campus loads such as domestic hot water, absorption chiller cooling and HVAC. To generate steam, the campus steam plant uses parasitic steam for powering boiler draft fans, boiler feed water pumps and by the deaerator. Localized hot water generation would be employed to replace campus steam. Decentralized hot water boilers and hot water heaters would be installed to generate domestic hot water and hot water for HVAC. Electric chillers would be installed in Barrows and Aubert to replace steam consuming absorption chillers. The chillers are sized 287 tons and 200 tons respectively. The CHP plant would operate at minimum capacity from June through the end of August to generate electricity, keep steam distribution piping warm to minimize thermal cycling and serve as backup. The existing steam piping system should be evaluated to ensure that change in pipe temperature due to de-energizing the existing heating plant in the summer will not compromise the integrity of the steam distribution system. 2C - Solar Energy Farm UMaine has 68 acres of land on the east side of campus that can be used to develop a solar energy farm. A qualified solar energy contractor/developer could construct and maintain arrays of photovoltaic solar energy panels on this property. Based on the campus’s load duration curve, combined generation capacity of CHP with a solar energy farm was selected at 6,000 kW (4,500 kW CHP generation and 1,500 kW solar generation). Solar panel capacity will be 2,000 kW with 1,500 kW of AC inverter capacity. The solar installation would be installed behind UMaine’s electric meter and sold to the university by the developer at a competitive rate. The developer would own the Renewable Energy Credits (RECs). 2D - Combination Eliminate Summer Steam Load and Solar Farm This alternative combines elimination of the summer steam load and the installation of a third-party solar energy farm. This alternative would realize an increase in summer electrical load due to the conversion of absorption chillers to electric centrifugal chillers and summer shutdown of the steam turbine generators in the heating plant.
Page 15
ENERGY UPGRADE SCREENING STUDY
Job No. 28471.00 - October 28, 2016 Page | 12
OPTION 3 - COMBINED HEAT AND POWER (ELECTRIC LOAD FOLLOWING) Option 3 has four (4) alternative cases for a new Combined Heat and Power (CHP) plant located on the east side of campus adjacent to the east substation near the service building. These alternatives calculate energy consumption with the CHP plant electric load following. Electric load following controls will vary the CTG load in attempt to match electric generation output to campus electrical demand. On very low campus electric load, the CTG will shut down. This CHP plant would be electrically connected to the east substation and mechanically connected to the steam and condensate distribution system. A new 4” pumped condensate pipeline is needed with these alternatives to bring condensate return from the College Avenue steam plant to the new CHP plant. The new CHP facility would include power island equipment and balance of plant equipment required for a new steam and power generation facility.
Option
Year 1 20 Year PV
Energy Cost without Carbon Offsets
20 Year PV Energy Cost with Carbon
Offsets
Generated (kWh)
Purchased (kWh)
Purchased Natural
Gas (DTherms)
Energy Cost
(Electricity & Natural
Gas)
Base Case – Existing Operation
1,078,617 42,178,862 509,381 $9,350,477 $184,765,690 $196,196,226
3A Thermal Load Following Gas Turbine Generator (CTG)
37,648,704 6,607,943 780,433 $6,703,707 $133,313,253 $148,262,606
3B Thermal Load Following CTG & Eliminate Summer Steam Load
37,617,231 7,022,438 760,727 $6,644,906 $132,440,008 $147,094,060
3C Thermal Load Following CTG & Solar Energy
39,077,744 5,159,267 772,818 $6,636,060 130,952,181 $145,560,024
3D Thermal Following CTG, Eliminate Summer Steam Load & Solar Energy
39,094,500 5,526,509 753,584 $6,537,970 $130,000,169 $144,314,515
3A - CTG with Heat Recovery Steam Generator (Electric Load Following) This alternative is the installation of a CHP plant based on a 4.5 MW natural gas fired combustion turbine generator (Solar Centaur 50) with heat recovery steam generator utilizing duct burners (HRSG). The HSRG would be capable of producing approximately 25,000 lb/hr of 150 psig saturated steam unfired, and up to 48,000 lb/hr of steam with the addition of a duct burner. The existing boilers in the College Avenue steam plant would be required to meet steam demand greater than 48,000 lb/hr and to provide backup in the event of an equipment trip or maintenance outage. Most of the time the HRSG will operate without thermal venting or bypassing.
kdoiron
Callout
A recuperating NG turbine generates ~13,000# steam/hr, which would be a closer match if summer steam losses were reduced by shutting off sections of piping, or conversion of steam chillers to electric. ksd 2016-12-23
Page 16
ENERGY UPGRADE SCREENING STUDY
Job No. 28471.00 - October 28, 2016 Page | 13
Subject to ME DEP permit approval, the new CHP power island equipment would be located in a new building near the east substation. CTG could be designed to burn two fuels (natural gas and #2 oil) to provide fuel redundancy in the event of natural gas curtailment. The HRSG duct burner would burn natural gas only. 3B - Eliminate Summer Steam Load The summer steam load consists of campus loads such as domestic hot water, absorption chiller cooling, and HVAC. To generate steam, the campus steam plant uses parasitic steam for powering boiler draft fans, boiler feed water pumps and by the deaerator. Localized hot water generation would be employed to replace campus steam. Decentralized hot water boilers and hot water heaters would be installed to generate domestic hot water and hot water for HVAC. Electric chillers would be installed in Barrows and Aubert to replace steam generated hot water absorption chillers. The chillers are sized 287 tons and 200 tons respectively. The CHP plant would operate at its minimum electrical generation capacity from June through the end of August to generate electricity, keep steam distribution piping warm to minimize thermal cycling, and serve as backup. The existing steam piping system should be evaluated to ensure that change in pipe temperature due to de-energizing the existing heating plant in the summer would not compromise the integrity of the steam distribution system that is affected. 3C - Solar Energy Farm UMaine has 68 acres of land on the east side of campus that could be used to develop a solar energy farm. A qualified solar energy contractor/developer could construct and maintain arrays of photovoltaic solar energy panels on this property. Based on the campus’s load duration curve, combined generation capacity of CHP with a solar energy farm was selected at 6,000 kW (4,500 kW CHP generation and 1,500 kW solar generation). Solar panel capacity will be 2 MW with 1.5 MW of AC inverter capacity. The solar installation would be installed behind UMaine’s electric meter and sold to the university by the developer at a competitive rate. The developer would own the Renewable Energy Credits (RECs). 3D - Combination Eliminate Summer Steam Load and Solar Farm This alternative combines elimination of the summer steam load and the installation of a third-party solar energy farm. This alternative would realize an increase in summer electrical load due to the conversion of absorption chillers to electric centrifugal chillers and summer shutdown of the steam turbine generators in the heating plant.
Page 17
ENERGY UPGRADE SCREENING STUDY
Job No. 28471.00 - October 28, 2016 Page | 14
5. METHODOLOGY
An hourly cogeneration analysis was performed for each of the options and alternatives to determine an expected energy consumption and cost. UMaine provided electric, steam, and gas use profiles for the period of November 2014 through October 2015. UMaine also included electric generation from its two back pressure steam turbines. Electric demand (kW) data was provided as 15 minute readings. Natural gas consumption and steam production were provided as daily totals. Electric demand data was combined to form an hourly electric profile for an entire year. Daily natural gas and steam totals were divided evenly over 24 hours for each day to generate an hourly profile for an entire year. Hourly electric, natural gas and steam profiles were entered into an analysis that calculates hourly energy consumption using equipment sequencing and equipment part load performance data. The results from the hourly analysis is summarized into monthly summary totals as presented in Appendix A. Average hourly DOE-2 weather data for Bangor, ME was used in the analysis. Using manufacturer provided part load performance data at various ambient conditions and engine loads, equations were developed to predict electrical generation, steam output and natural gas consumption. Cogeneration part load performance was provided by Solar Turbines. HRSG performance data was provided by Cleaver Brooks. Hourly ambient dry bulb temperature was used in the calculations to determine the maximum capacity of the CTG. If the electrical load of the campus is greater than or equal to the maximum engine capacity, the CTG will operate at 100% load. If the campus load falls below the capacity of the CTG, then the CTG is run at part load. Under certain circumstances, the engine is shut off if the campus load falls below a minimum load threshold as determined by the engines efficiency and emissions (typically 50% load). Based on the ambient temperature and percent load of the engine as determined above, the output of the unfired HRSG is determined from another developed equation. If the unfired HRSG steam output is insufficient for the campus steam load, supplemental duct firing will occur up to the max HRSG output. The existing boilers will meet the remainder of the steam loads, if any. Similar equations are used to determine the CTG fuel gas consumption. Thermal load following alternatives attempt to match the thermal output of the CTG and HRSG to the campus steam load. The CTG is allowed to remain in operation at minimum load when the campus load is less than the HRSG’s unfired output. This mode of operation also applies to the ‘eliminate summer steam load’ alternatives. Thermal losses will occur during those hours. It is assumed that there is a greater cost benefit operating the CTG at minimum load than shutting the CTG down. Excess thermal output will be vented as steam or bypassed to the stack as hot gas exhaust via a diverter damper. Solar alternatives assume that electricity is generated without export and that the alternatives that include cogeneration assume electrical generation is modulated to maintain a minimum 200 kW import. The solar installation assumes a fixed axis array. The financial Pro-forma analysis compares alternatives on a 20 year present value basis. First year energy costs were calculated by utility rates supplied by Competitive Energy Services (CES). Monthly average predicted utility rates were provided for natural gas only. Annual average blended rates were provided for purchased electricity, solar produced electricity and carbon credits. Blended rates include the effects of several billing components such as energy charges, demand charges, generation rates, transmission rates, and distribution rates.
Page 18
ENERGY UPGRADE SCREENING STUDY
Job No. 28471.00 - October 28, 2016 Page | 15
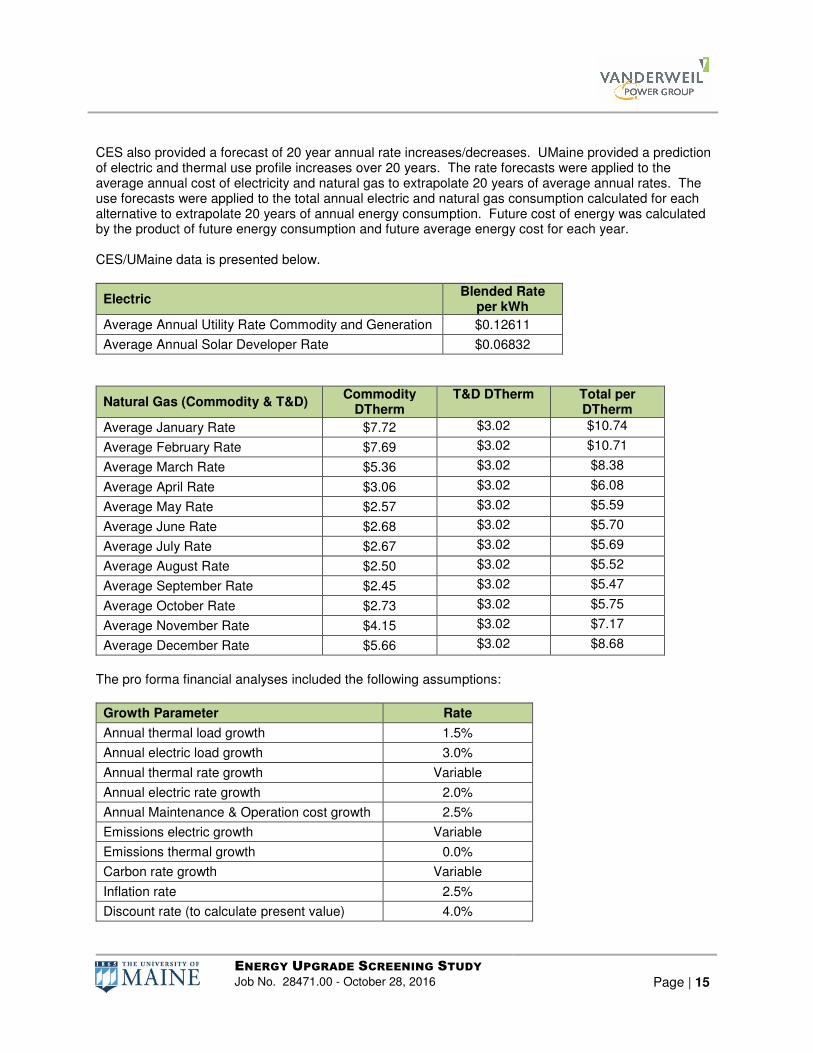
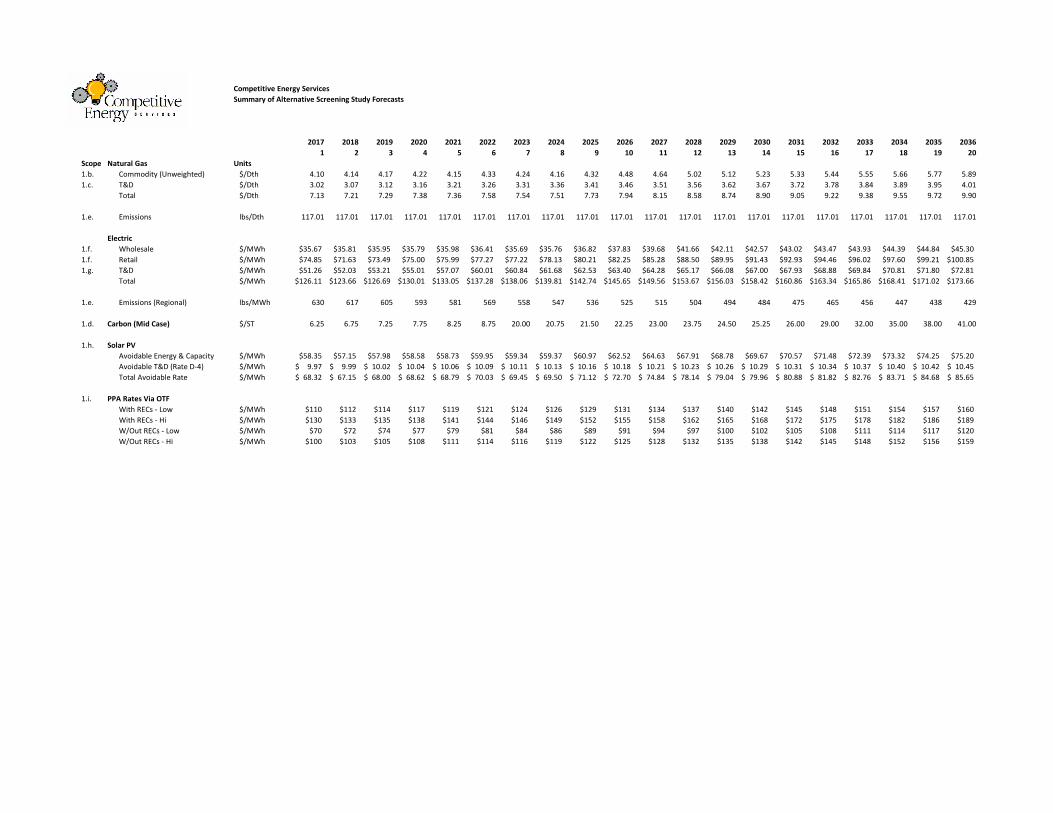
CES also provided a forecast of 20 year annual rate increases/decreases. UMaine provided a prediction of electric and thermal use profile increases over 20 years. The rate forecasts were applied to the average annual cost of electricity and natural gas to extrapolate 20 years of average annual rates. The use forecasts were applied to the total annual electric and natural gas consumption calculated for each alternative to extrapolate 20 years of annual energy consumption. Future cost of energy was calculated by the product of future energy consumption and future average energy cost for each year. CES/UMaine data is presented below.
Electric Blended Rate
per kWh
Average Annual Utility Rate Commodity and Generation $0.12611
Average Annual Solar Developer Rate $0.06832
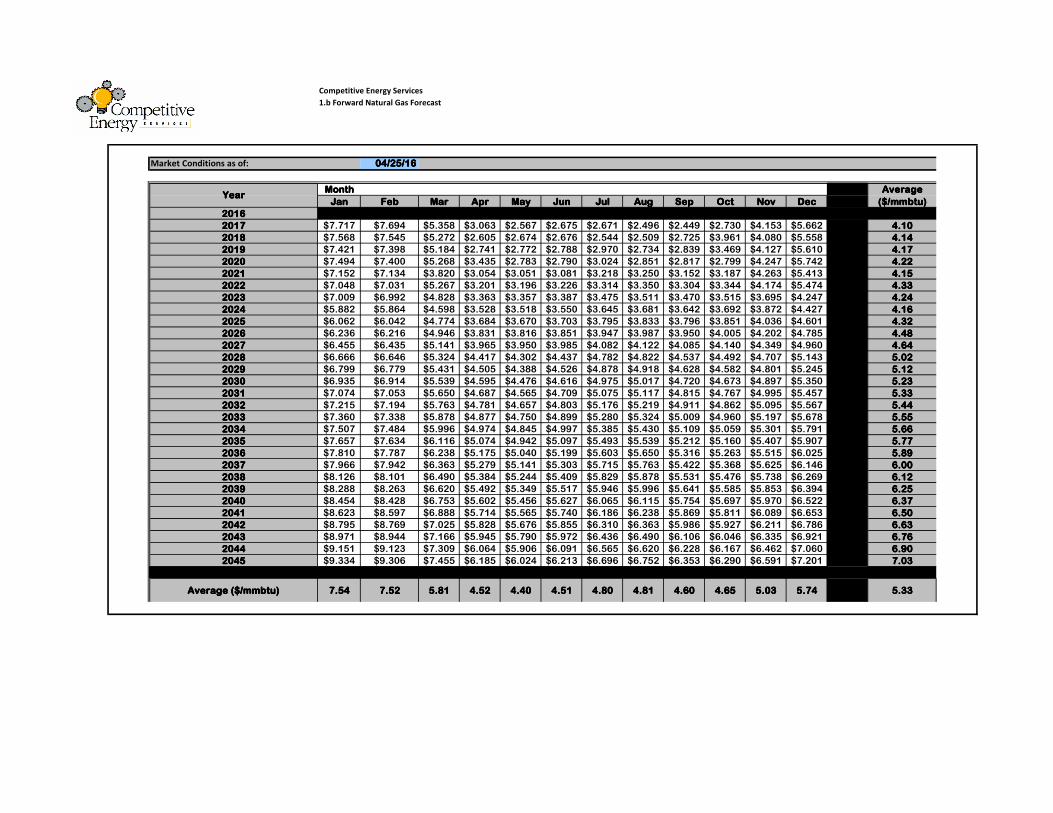
Natural Gas (Commodity & T&D) Commodity
DTherm T&D DTherm Total per
DTherm
Average January Rate $7.72 $3.02 $10.74
Average February Rate $7.69 $3.02 $10.71
Average March Rate $5.36 $3.02 $8.38
Average April Rate $3.06 $3.02 $6.08
Average May Rate $2.57 $3.02 $5.59
Average June Rate $2.68 $3.02 $5.70
Average July Rate $2.67 $3.02 $5.69
Average August Rate $2.50 $3.02 $5.52
Average September Rate $2.45 $3.02 $5.47
Average October Rate $2.73 $3.02 $5.75
Average November Rate $4.15 $3.02 $7.17
Average December Rate $5.66 $3.02 $8.68
The pro forma financial analyses included the following assumptions:
Growth Parameter Rate
Annual thermal load growth 1.5%
Annual electric load growth 3.0%
Annual thermal rate growth Variable
Annual electric rate growth 2.0%
Annual Maintenance & Operation cost growth 2.5%
Emissions electric growth Variable
Emissions thermal growth 0.0%
Carbon rate growth Variable
Inflation rate 2.5%
Discount rate (to calculate present value) 4.0%
Page 19
ENERGY UPGRADE SCREENING STUDY
Job No. 28471.00 - October 28, 2016 Page | 16
6. CONCLUSIONS
The potential energy upgrades and savings summarized above show some basic trends:
� Thermal Load Following vs Electric Load Following: Electric load following results in greater financial savings. This is due to more electric generation when electric load following. Thermal load following reduces CTG load to reduce thermal venting or bypass. Although thermal load following increases overall cogeneration plant efficiency, it is restricts the CTG from operating, particularly during the summer months when operating the cogeneration plant is most attractive. During the summer, electric rates are typically higher and gas rates are lower. Per CES, the average gas rate in the winter can be almost double the lowest month’s average during the summer. Given the current electric and gas rates, it is more attractive to operate a cogeneration plant that follows the electric load profile.
� Eliminate Summer Steam Load: Eliminating summer steam load shows moderate savings when performed without cogeneration. Elimination of steam to the campus will require additional electrical consumption from 500 tons of added electrical centrifugal chillers, reduced energy from existing cooling tower fans and condenser pumps, the addition of hot water pumps required for new summer boilers, and the loss of STG cogeneration in the steam plant. The benefits of eliminating steam consumption at the steam plant and eliminating steam piping losses outweigh the added purchased electricity in the option without CHP.
However, when the eliminate summer steam load alternative is combined with CHP, the CHP plant would bypass or dump waste heat during the summer if it were to operate. Minimal additional savings occur with when combined with CHP.
� Solar Farm Generation: A solar farm without cogeneration results in a modest financial benefit to UMaine. Combining solar generation with CHP results in marginal cost savings. Two factors that limit savings are a reduced solar farm size from 6,000 kW AC to 1,500 kW AC and reduction of CTG generation due to the interaction between solar and CHP generation.
� Combination Eliminate Summer Steam Load and Solar Farm Generation: The combination of the two alternatives has the best cost savings when CHP is not installed. Due to interactions between the combined alternatives and CHP, cost savings with CHP are marginal. The combined effect limits the amount of generation available for the CTG, especially during the summer months where operating the CTG is most attractive.
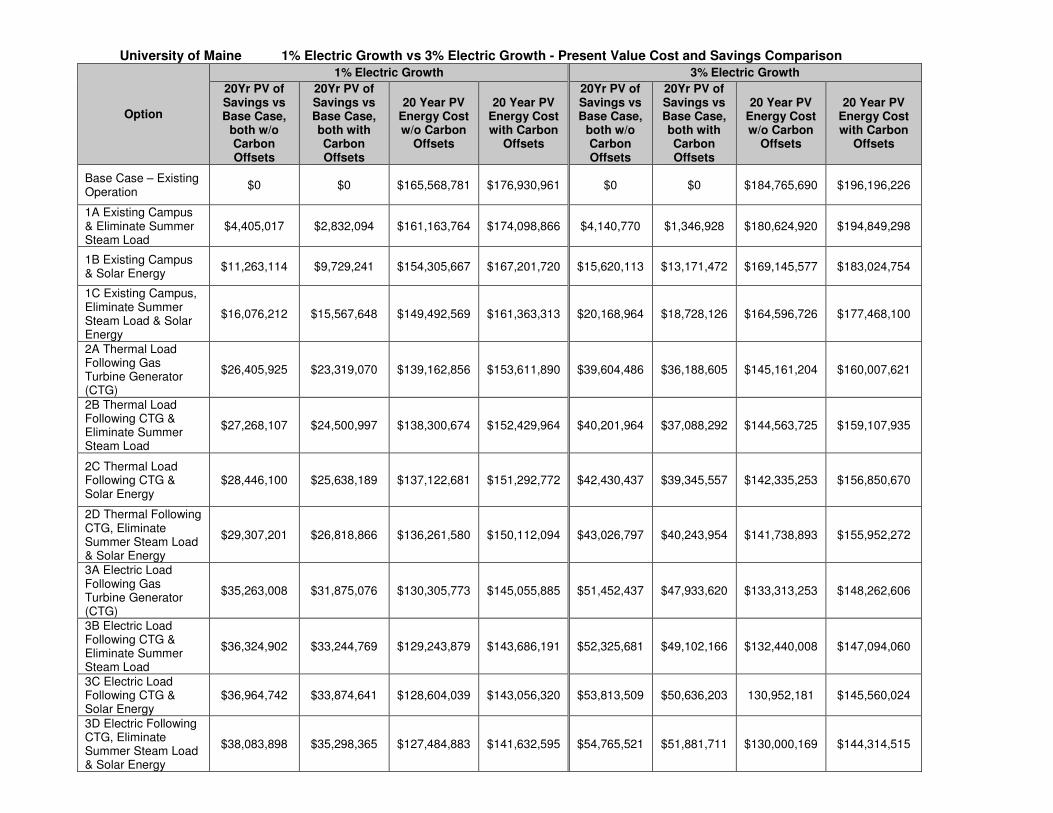
� Annual Electric Load Growth: The present value analysis was run with 3% electric load growth and
1% electric load growth. Present value costs are reduced when the model is run with 1% electric growth except Option 1A “Existing Campus and Eliminate Summer Steam Load”. Option 1A results in an increase in electrical consumption due to new electrical equipment required. Greater annual electrical consumption results in less cost savings and a higher present value cost. The trend of 20 year present value costs between options was similar.
A table comparing the results between 1% electric growth and 3% electric growth is included in Appendix B.
kdoiron
Text Box
SEE ADDITIONAL COMMENTS ON PAGE 17 RECOMMENDATIONS SECTION. ksd 2016-12-23
Page 20
ENERGY UPGRADE SCREENING STUDY
Job No. 28471.00 - October 28, 2016 Page | 17
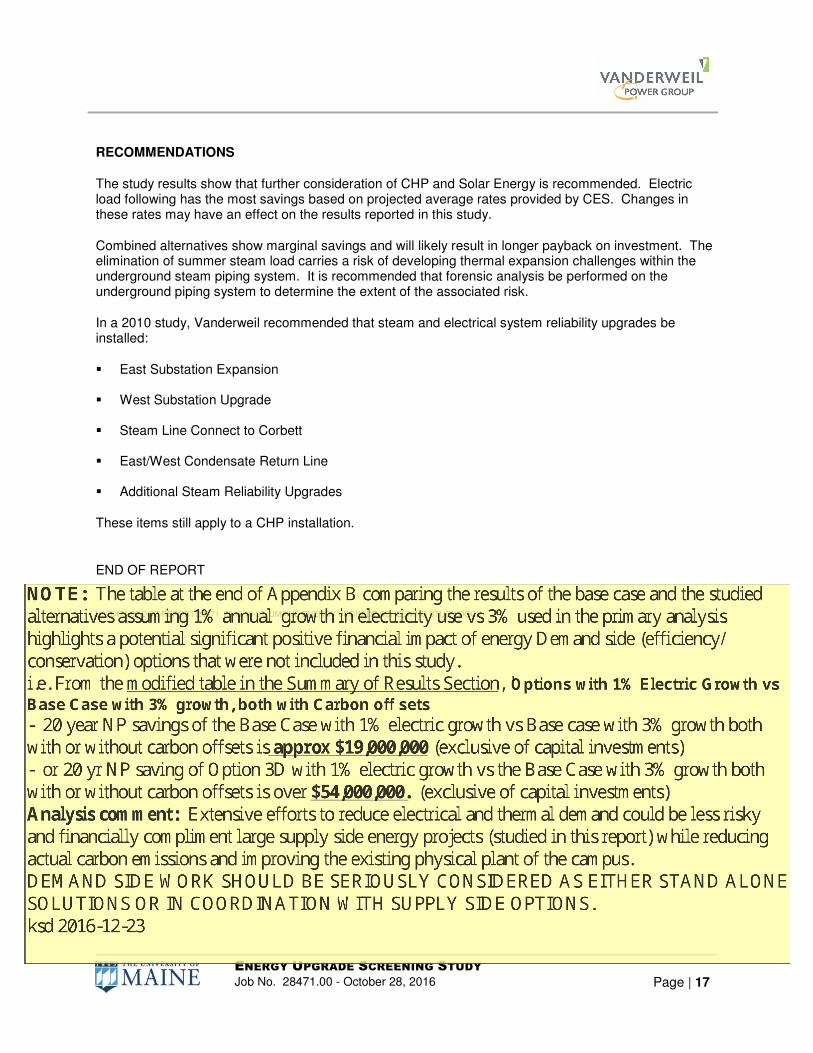
RECOMMENDATIONS
The study results show that further consideration of CHP and Solar Energy is recommended. Electric load following has the most savings based on projected average rates provided by CES. Changes in these rates may have an effect on the results reported in this study.
Combined alternatives show marginal savings and will likely result in longer payback on investment. The elimination of summer steam load carries a risk of developing thermal expansion challenges within the underground steam piping system. It is recommended that forensic analysis be performed on the underground piping system to determine the extent of the associated risk.
In a 2010 study, Vanderweil recommended that steam and electrical system reliability upgrades be installed:
� East Substation Expansion
� West Substation Upgrade � Steam Line Connect to Corbett � East/West Condensate Return Line � Additional Steam Reliability Upgrades
These items still apply to a CHP installation.
END OF REPORT
H:\28471.00\DOC\REPORT\28471_2016-10-28_UMAINE ENERGY UPGRADE SCREENING STUDY.DOCX
kdoiron
Text Box
NOTE: The table at the end of Appendix B comparing the results of the base case and the studied alternatives assuming 1% annual growth in electricity use vs 3% used in the primary analysis highlights a potential significant positive financial impact of energy Demand side (efficiency/conservation) options that were not included in this study. i.e. From the modified table in the Summary of Results Section, 'Options with 1% Electric Growth vs Base Case with 3% growth, both with Carbon off sets - 20 year NP savings of the Base Case with 1% electric growth vs Base case with 3% growth both with or without carbon offsets is approx $19,000,000 (exclusive of capital investments) - or 20 yr NP saving of Option 3D with 1% electric growth vs the Base Case with 3% growth both with or without carbon offsets is over $54,000,000. (exclusive of capital investments) Analysis comment: Extensive efforts to reduce electrical and thermal demand could be less risky and financially compliment large supply side energy projects (studied in this report) while reducing actual carbon emissions and improving the existing physical plant of the campus. DEMAND SIDE WORK SHOULD BE SERIOUSLY CONSIDERED AS EITHER STAND ALONE SOLUTIONS OR IN COORDINATION WITH SUPPLY SIDE OPTIONS. ksd 2016-12-23
Page 21
APPENDIX A
Energy Upgrade Results
Page 22
Client:
Calc By: Check By: Job No.: File Name: Sheet Name: Date:
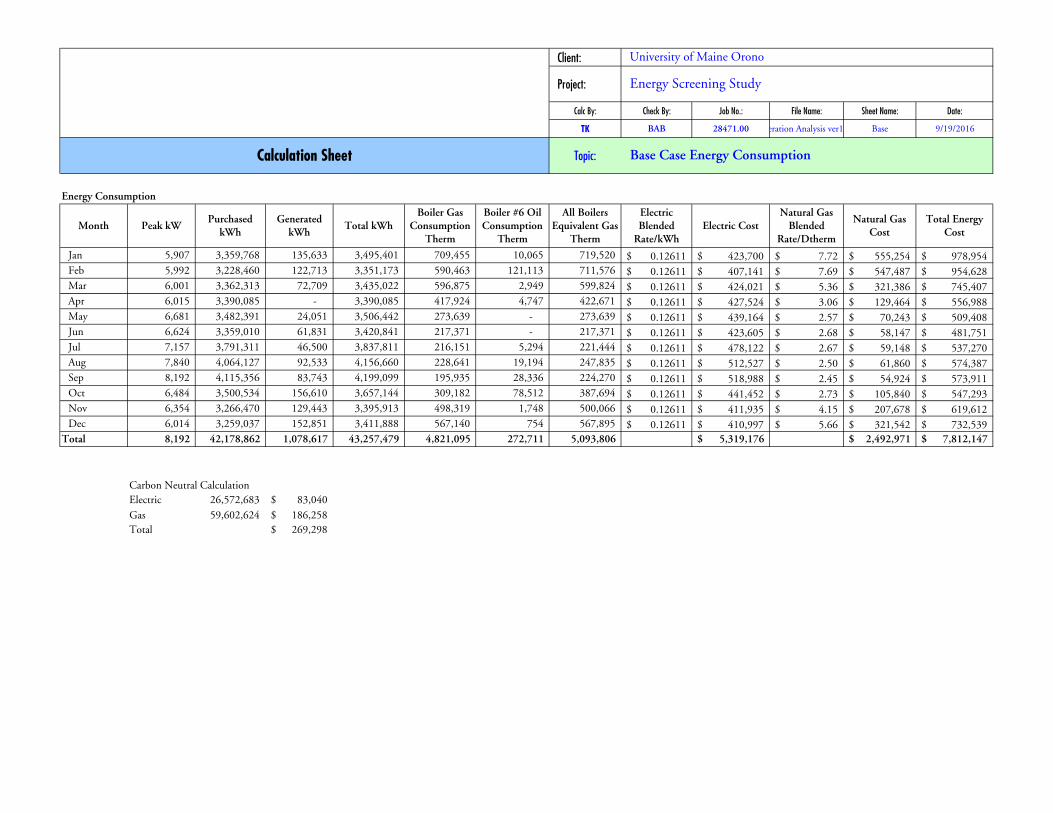
TK BAB 28471.00Cogeneration Analysis ver18 final. Base 9/19/2016
Energy Consumption
Month Peak kWPurchased
kWhGenerated
kWhTotal kWh
Boiler Gas Consumption
Therm
Boiler #6 Oil Consumption
Therm
All Boilers Equivalent Gas
Therm
Electric Blended
Rate/kWhElectric Cost
Natural Gas Blended
Rate/Dtherm
Natural Gas Cost
Total Energy Cost
Jan 5,907 3,359,768 135,633 3,495,401 709,455 10,065 719,520 0.12611$ 423,700$ 7.72$ 555,254$ 978,954$
Feb 5,992 3,228,460 122,713 3,351,173 590,463 121,113 711,576 0.12611$ 407,141$ 7.69$ 547,487$ 954,628$
Mar 6,001 3,362,313 72,709 3,435,022 596,875 2,949 599,824 0.12611$ 424,021$ 5.36$ 321,386$ 745,407$
Apr 6,015 3,390,085 - 3,390,085 417,924 4,747 422,671 0.12611$ 427,524$ 3.06$ 129,464$ 556,988$
May 6,681 3,482,391 24,051 3,506,442 273,639 - 273,639 0.12611$ 439,164$ 2.57$ 70,243$ 509,408$
Jun 6,624 3,359,010 61,831 3,420,841 217,371 - 217,371 0.12611$ 423,605$ 2.68$ 58,147$ 481,751$
Jul 7,157 3,791,311 46,500 3,837,811 216,151 5,294 221,444 0.12611$ 478,122$ 2.67$ 59,148$ 537,270$
Aug 7,840 4,064,127 92,533 4,156,660 228,641 19,194 247,835 0.12611$ 512,527$ 2.50$ 61,860$ 574,387$
Sep 8,192 4,115,356 83,743 4,199,099 195,935 28,336 224,270 0.12611$ 518,988$ 2.45$ 54,924$ 573,911$
Oct 6,484 3,500,534 156,610 3,657,144 309,182 78,512 387,694 0.12611$ 441,452$ 2.73$ 105,840$ 547,293$
Nov 6,354 3,266,470 129,443 3,395,913 498,319 1,748 500,066 0.12611$ 411,935$ 4.15$ 207,678$ 619,612$
Dec 6,014 3,259,037 152,851 3,411,888 567,140 754 567,895 0.12611$ 410,997$ 5.66$ 321,542$ 732,539$
Total 8,192 42,178,862 1,078,617 43,257,479 4,821,095 272,711 5,093,806 5,319,176$ 2,492,971$ 7,812,147$
Carbon Neutral Calculation
Electric 26,572,683 83,040$
Gas 59,602,624 186,258$
Total 269,298$
University of Maine Orono
Base Case Energy Consumption
Energy Screening Study
Calculation Sheet
Project:
Topic:
Page 23
Client:
Calc By: Check By: Job No.: File Name: Sheet Name: Date:
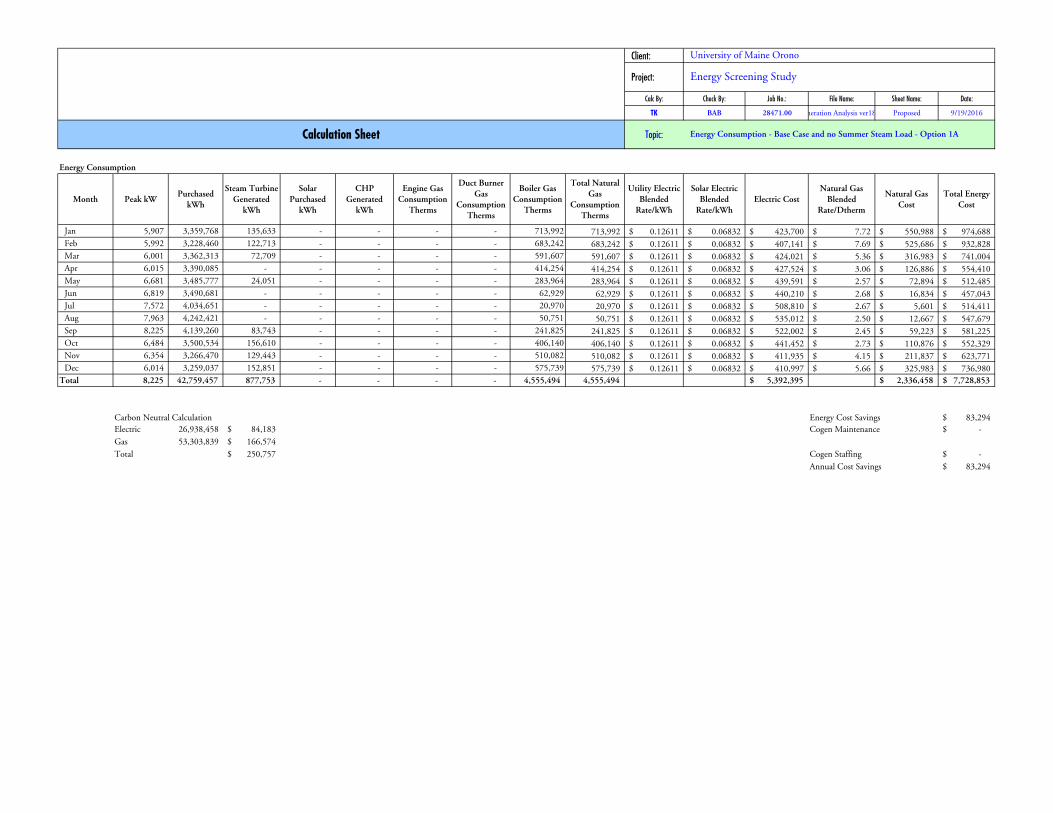
TK BAB 28471.00Cogeneration Analysis ver18 final.Proposed 9/19/2016
Energy Consumption
Month Peak kWPurchased
kWh
Steam Turbine Generated
kWh
Solar Purchased
kWh
CHP Generated
kWh
Engine Gas Consumption
Therms
Duct Burner Gas
Consumption Therms
Boiler Gas Consumption
Therms
Total Natural Gas
Consumption Therms
Utility Electric Blended
Rate/kWh
Solar Electric Blended
Rate/kWhElectric Cost
Natural Gas Blended
Rate/Dtherm
Natural Gas Cost
Total Energy Cost
Jan 5,907 3,359,768 135,633 - - - - 713,992 713,992 0.12611$ 0.06832$ 423,700$ 7.72$ 550,988$ 974,688$
Feb 5,992 3,228,460 122,713 - - - - 683,242 683,242 0.12611$ 0.06832$ 407,141$ 7.69$ 525,686$ 932,828$
Mar 6,001 3,362,313 72,709 - - - - 591,607 591,607 0.12611$ 0.06832$ 424,021$ 5.36$ 316,983$ 741,004$
Apr 6,015 3,390,085 - - - - - 414,254 414,254 0.12611$ 0.06832$ 427,524$ 3.06$ 126,886$ 554,410$
May 6,681 3,485,777 24,051 - - - - 283,964 283,964 0.12611$ 0.06832$ 439,591$ 2.57$ 72,894$ 512,485$
Jun 6,819 3,490,681 - - - - - 62,929 62,929 0.12611$ 0.06832$ 440,210$ 2.68$ 16,834$ 457,043$
Jul 7,572 4,034,651 - - - - - 20,970 20,970 0.12611$ 0.06832$ 508,810$ 2.67$ 5,601$ 514,411$
Aug 7,963 4,242,421 - - - - - 50,751 50,751 0.12611$ 0.06832$ 535,012$ 2.50$ 12,667$ 547,679$
Sep 8,225 4,139,260 83,743 - - - - 241,825 241,825 0.12611$ 0.06832$ 522,002$ 2.45$ 59,223$ 581,225$
Oct 6,484 3,500,534 156,610 - - - - 406,140 406,140 0.12611$ 0.06832$ 441,452$ 2.73$ 110,876$ 552,329$
Nov 6,354 3,266,470 129,443 - - - - 510,082 510,082 0.12611$ 0.06832$ 411,935$ 4.15$ 211,837$ 623,771$
Dec 6,014 3,259,037 152,851 - - - - 575,739 575,739 0.12611$ 0.06832$ 410,997$ 5.66$ 325,983$ 736,980$
Total 8,225 42,759,457 877,753 - - - - 4,555,494 4,555,494 5,392,395$ 2,336,458$ 7,728,853$
Carbon Neutral Calculation Energy Cost Savings 83,294$
Electric 26,938,458 84,183$ Cogen Maintenance -$
Gas 53,303,839 166,574$
Total 250,757$ Cogen Staffing -$
Annual Cost Savings 83,294$
University of Maine Orono
Energy Consumption - Base Case and no Summer Steam Load - Option 1A
Energy Screening Study
Calculation Sheet
Project:
Topic:
Page 24
Client:
Calc By: Check By: Job No.: File Name: Sheet Name: Date:
TK BAB 28471.00Cogeneration Analysis ver18 final.Proposed 9/19/2016
Energy Consumption
Month Peak kWPurchased
kWh
Steam Turbine Generated
kWh
Solar Purchased
kWh
CHP Generated
kWh
Engine Gas Consumption
Therms
Duct Burner Gas
Consumption Therms
Boiler Gas Consumption
Therms
Total Natural Gas
Consumption Therms
Utility Electric Blended
Rate/kWh
Solar Electric Blended
Rate/kWhElectric Cost
Natural Gas Blended
Rate/Dtherm
Natural Gas Cost
Total Energy Cost
Jan 5,762 2,842,106 135,633 517,662 - - - 713,992 713,992 0.12611$ 0.06832$ 393,785$ 7.72$ 550,988$ 944,772$
Feb 5,748 2,721,008 122,713 507,452 - - - 683,242 683,242 0.12611$ 0.06832$ 377,815$ 7.69$ 525,686$ 903,502$
Mar 5,311 2,447,008 72,709 915,305 - - - 591,607 591,607 0.12611$ 0.06832$ 371,126$ 5.36$ 316,983$ 688,109$
Apr 5,553 2,443,981 - 946,103 - - - 414,254 414,254 0.12611$ 0.06832$ 372,848$ 3.06$ 126,886$ 499,734$
May 5,724 2,439,209 24,051 1,043,182 - - - 283,964 283,964 0.12611$ 0.06832$ 378,879$ 2.57$ 72,894$ 451,772$
Jun 5,477 2,333,990 61,831 1,025,019 - - - 242,541 242,541 0.12611$ 0.06832$ 364,369$ 2.68$ 64,880$ 429,249$
Jul 6,397 2,760,832 46,500 1,030,480 - - - 248,619 248,619 0.12611$ 0.06832$ 418,571$ 2.67$ 66,406$ 484,977$
Aug 7,073 3,001,341 92,533 1,062,787 - - - 250,366 250,366 0.12611$ 0.06832$ 451,109$ 2.50$ 62,491$ 513,600$
Sep 7,694 3,141,604 83,743 973,752 - - - 241,825 241,825 0.12611$ 0.06832$ 462,714$ 2.45$ 59,223$ 521,937$
Oct 6,439 2,780,168 156,610 720,366 - - - 406,140 406,140 0.12611$ 0.06832$ 399,822$ 2.73$ 110,876$ 510,699$
Nov 6,354 2,777,607 129,443 488,862 - - - 510,082 510,082 0.12611$ 0.06832$ 383,683$ 4.15$ 211,837$ 595,520$
Dec 6,014 2,916,941 152,851 342,095 - - - 575,739 575,739 0.12611$ 0.06832$ 391,227$ 5.66$ 325,983$ 717,211$
Total 7,694 32,605,796 1,078,617 9,573,066 - - - 5,162,371 5,162,371 4,765,949$ 2,495,133$ 7,261,082$
Carbon Neutral Calculation Energy Cost Savings 551,065$
Electric 20,541,652 64,193$ Cogen Maintenance -$
Gas 60,404,906 188,765$
Total 252,958$ Cogen Staffing -$
Annual Cost Savings 551,065$
University of Maine Orono
Energy Consumption - Base Case and Solar Generation - Option 1B
Energy Screening Study
Calculation Sheet
Project:
Topic:
Page 25
Client:
Calc By: Check By: Job No.: File Name: Sheet Name: Date:
TK BAB 28471.00Cogeneration Analysis ver18 final.Proposed 9/16/2016
Energy Consumption
Month Peak kWPurchased
kWh
Steam Turbine Generated
kWh
Solar Purchased
kWh
CHP Generated
kWh
Engine Gas Consumption
Therms
Duct Burner Gas
Consumption Therms
Boiler Gas Consumption
Therms
Total Natural Gas
Consumption Therms
Utility Electric Blended
Rate/kWh
Solar Electric Blended
Rate/kWhElectric Cost
Natural Gas Blended
Rate/Dtherm
Natural Gas Cost
Total Energy Cost
Jan 5,762 2,842,106 135,633 517,662 - - - 713,992 713,992 0.12611$ 0.06832$ 393,785$ 7.72$ 550,988$ 944,772$
Feb 5,748 2,721,008 122,713 507,452 - - - 683,242 683,242 0.12611$ 0.06832$ 377,815$ 7.69$ 525,686$ 903,502$
Mar 5,311 2,447,008 72,709 915,305 - - - 591,607 591,607 0.12611$ 0.06832$ 371,126$ 5.36$ 316,983$ 688,109$
Apr 5,553 2,443,981 - 946,103 - - - 414,254 414,254 0.12611$ 0.06832$ 372,848$ 3.06$ 126,886$ 499,734$
May 5,724 2,442,595 24,051 1,043,182 - - - 283,964 283,964 0.12611$ 0.06832$ 379,306$ 2.57$ 72,894$ 452,199$
Jun 5,666 2,465,661 - 1,025,019 - - - 62,929 62,929 0.12611$ 0.06832$ 380,974$ 2.68$ 16,834$ 397,807$
Jul 6,798 3,004,172 - 1,030,480 - - - 20,970 20,970 0.12611$ 0.06832$ 449,258$ 2.67$ 5,601$ 454,859$
Aug 7,293 3,179,634 - 1,062,787 - - - 50,751 50,751 0.12611$ 0.06832$ 473,593$ 2.50$ 12,667$ 486,261$
Sep 7,727 3,165,508 83,743 973,752 - - - 241,825 241,825 0.12611$ 0.06832$ 465,729$ 2.45$ 59,223$ 524,952$
Oct 6,439 2,780,168 156,610 720,366 - - - 406,140 406,140 0.12611$ 0.06832$ 399,822$ 2.73$ 110,876$ 510,699$
Nov 6,354 2,777,607 129,443 488,862 - - - 510,082 510,082 0.12611$ 0.06832$ 383,683$ 4.15$ 211,837$ 595,520$
Dec 6,014 2,916,941 152,851 342,095 - - - 575,739 575,739 0.12611$ 0.06832$ 391,227$ 5.66$ 325,983$ 717,211$
Total 7,727 33,186,392 877,753 9,573,066 - - - 4,555,494 4,555,494 4,839,168$ 2,336,458$ 7,175,626$
Carbon Neutral Calculation Energy Cost Savings 636,522$
Electric 20,907,427 65,336$ Cogen Maintenance -$
Gas 53,303,839 166,574$
Total 231,910$ Cogen Staffing -$
Annual Cost Savings 636,522$
University of Maine Orono
Energy Consumption - Base Case and Solar Generation and no Summer Steam Load - Option 1C
Energy Screening Study
Calculation Sheet
Project:
Topic:
Page 26
Client:
Calc By: Check By: Job No.: File Name: Sheet Name: Date:
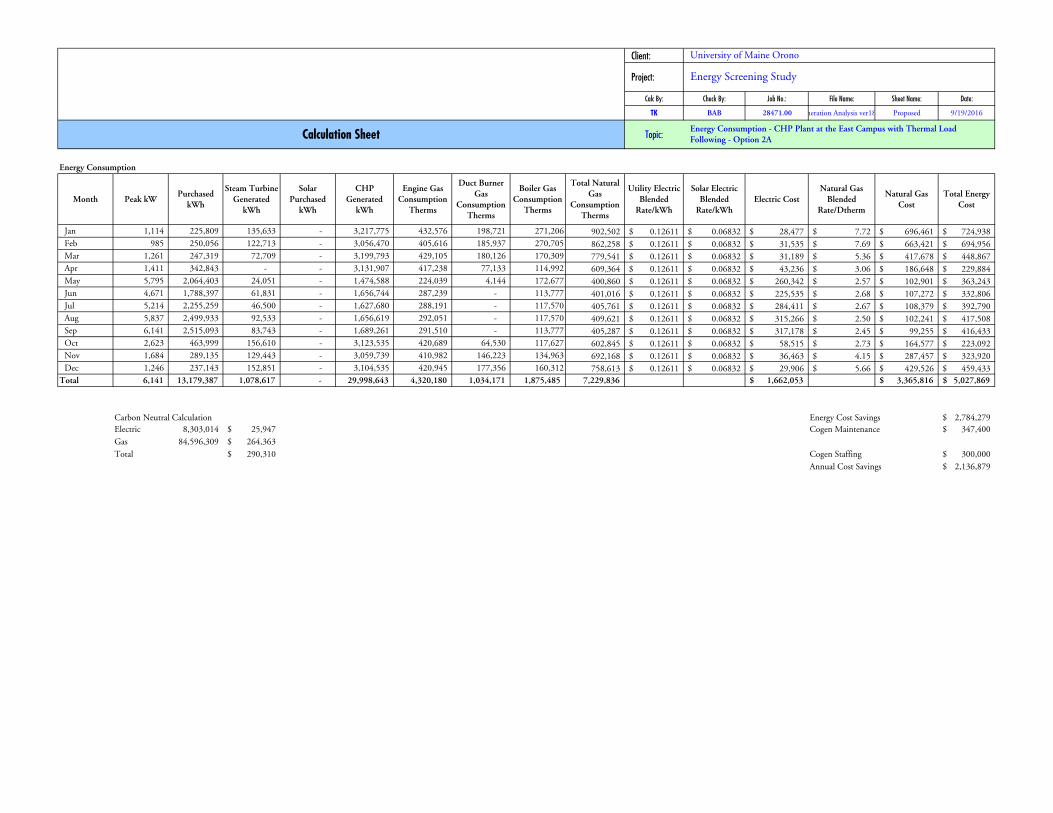
TK BAB 28471.00Cogeneration Analysis ver18 final.Proposed 9/19/2016
Energy Consumption
Month Peak kWPurchased
kWh
Steam Turbine Generated
kWh
Solar Purchased
kWh
CHP Generated
kWh
Engine Gas Consumption
Therms
Duct Burner Gas
Consumption Therms
Boiler Gas Consumption
Therms
Total Natural Gas
Consumption Therms
Utility Electric Blended
Rate/kWh
Solar Electric Blended
Rate/kWhElectric Cost
Natural Gas Blended
Rate/Dtherm
Natural Gas Cost
Total Energy Cost
Jan 1,114 225,809 135,633 - 3,217,775 432,576 198,721 271,206 902,502 0.12611$ 0.06832$ 28,477$ 7.72$ 696,461$ 724,938$
Feb 985 250,056 122,713 - 3,056,470 405,616 185,937 270,705 862,258 0.12611$ 0.06832$ 31,535$ 7.69$ 663,421$ 694,956$
Mar 1,261 247,319 72,709 - 3,199,793 429,105 180,126 170,309 779,541 0.12611$ 0.06832$ 31,189$ 5.36$ 417,678$ 448,867$
Apr 1,411 342,843 - - 3,131,907 417,238 77,133 114,992 609,364 0.12611$ 0.06832$ 43,236$ 3.06$ 186,648$ 229,884$
May 5,795 2,064,403 24,051 - 1,474,588 224,039 4,144 172,677 400,860 0.12611$ 0.06832$ 260,342$ 2.57$ 102,901$ 363,243$
Jun 4,671 1,788,397 61,831 - 1,656,744 287,239 - 113,777 401,016 0.12611$ 0.06832$ 225,535$ 2.68$ 107,272$ 332,806$
Jul 5,214 2,255,259 46,500 - 1,627,680 288,191 - 117,570 405,761 0.12611$ 0.06832$ 284,411$ 2.67$ 108,379$ 392,790$
Aug 5,837 2,499,933 92,533 - 1,656,619 292,051 - 117,570 409,621 0.12611$ 0.06832$ 315,266$ 2.50$ 102,241$ 417,508$
Sep 6,141 2,515,093 83,743 - 1,689,261 291,510 - 113,777 405,287 0.12611$ 0.06832$ 317,178$ 2.45$ 99,255$ 416,433$
Oct 2,623 463,999 156,610 - 3,123,535 420,689 64,530 117,627 602,845 0.12611$ 0.06832$ 58,515$ 2.73$ 164,577$ 223,092$
Nov 1,684 289,135 129,443 - 3,059,739 410,982 146,223 134,963 692,168 0.12611$ 0.06832$ 36,463$ 4.15$ 287,457$ 323,920$
Dec 1,246 237,143 152,851 - 3,104,535 420,945 177,356 160,312 758,613 0.12611$ 0.06832$ 29,906$ 5.66$ 429,526$ 459,433$
Total 6,141 13,179,387 1,078,617 - 29,998,643 4,320,180 1,034,171 1,875,485 7,229,836 1,662,053$ 3,365,816$ 5,027,869$
Carbon Neutral Calculation Energy Cost Savings 2,784,279$
Electric 8,303,014 25,947$ Cogen Maintenance 347,400$
Gas 84,596,309 264,363$
Total 290,310$ Cogen Staffing 300,000$
Annual Cost Savings 2,136,879$
University of Maine Orono
Energy Consumption - CHP Plant at the East Campus with Thermal Load Following - Option 2A
Energy Screening Study
Calculation Sheet
Project:
Topic:
Page 27
Client:
Calc By: Check By: Job No.: File Name: Sheet Name: Date:
TK BAB 28471.00Cogeneration Analysis ver18 final.Proposed 9/19/2016
Energy Consumption
Month Peak kWPurchased
kWh
Steam Turbine Generated
kWh
Solar Purchased
kWh
CHP Generated
kWh
Engine Gas Consumption
Therms
Duct Burner Gas
Consumption Therms
Boiler Gas Consumption
Therms
Total Natural Gas
Consumption Therms
Utility Electric Blended
Rate/kWh
Solar Electric Blended
Rate/kWhElectric Cost
Natural Gas Blended
Rate/Dtherm
Natural Gas Cost
Total Energy Cost
Jan 1,114 225,809 135,633 - 3,217,775 432,576 198,721 271,206 902,502 0.12611$ 0.06832$ 28,477$ 7.72$ 696,461$ 724,938$
Feb 985 250,056 122,713 - 3,056,470 405,616 185,937 270,705 862,258 0.12611$ 0.06832$ 31,535$ 7.69$ 663,421$ 694,956$
Mar 1,261 247,319 72,709 - 3,199,793 429,105 180,126 170,309 779,541 0.12611$ 0.06832$ 31,189$ 5.36$ 417,678$ 448,867$
Apr 1,411 342,843 - - 3,131,907 417,238 77,133 114,992 609,364 0.12611$ 0.06832$ 43,236$ 3.06$ 186,648$ 229,884$
May 5,804 2,067,787 24,051 - 1,474,615 224,042 4,144 172,677 400,863 0.12611$ 0.06832$ 260,769$ 2.57$ 102,901$ 363,670$
Jun 4,866 1,919,003 - - 1,659,003 287,451 - 62,929 350,380 0.12611$ 0.06832$ 242,006$ 2.68$ 93,727$ 335,732$
Jul 5,628 2,499,874 - - 1,627,680 288,191 - 20,970 309,161 0.12611$ 0.06832$ 315,259$ 2.67$ 82,577$ 397,836$
Aug 5,952 2,678,903 - - 1,656,619 292,051 - 50,751 342,801 0.12611$ 0.06832$ 337,837$ 2.50$ 85,563$ 423,400$
Sep 6,175 2,539,115 83,743 - 1,689,261 291,510 - 113,777 405,287 0.12611$ 0.06832$ 320,208$ 2.45$ 99,255$ 419,463$
Oct 2,623 463,999 156,610 - 3,123,535 420,689 64,530 117,627 602,845 0.12611$ 0.06832$ 58,515$ 2.73$ 164,577$ 223,092$
Nov 1,684 289,135 129,443 - 3,059,739 410,982 146,223 134,963 692,168 0.12611$ 0.06832$ 36,463$ 4.15$ 287,457$ 323,920$
Dec 1,246 237,143 152,851 - 3,104,535 420,945 177,356 160,312 758,613 0.12611$ 0.06832$ 29,906$ 5.66$ 429,526$ 459,433$
Total 6,175 13,760,986 877,753 - 30,000,930 4,320,394 1,034,171 1,661,218 7,015,783 1,735,398$ 3,309,792$ 5,045,190$
Carbon Neutral Calculation Energy Cost Savings 2,766,958$
Electric 8,669,421 27,092$ Cogen Maintenance 347,400$
Gas 82,091,673 256,536$
Total 283,628$ Cogen Staffing 300,000$
Annual Cost Savings 2,119,558$
University of Maine Orono
Energy Consumption - CHP Plant at the East Campus with Thermal Load Following and no Summer Steam Load - Option 2B
Energy Screening Study
Calculation Sheet
Project:
Topic:
Page 28
Client:
Calc By: Check By: Job No.: File Name: Sheet Name: Date:
TK BAB 28471.00Cogeneration Analysis ver18 final.Proposed 9/19/2016
Energy Consumption
Month Peak kWPurchased
kWh
Steam Turbine Generated
kWh
Solar Purchased
kWh
CHP Generated
kWh
Engine Gas Consumption
Therms
Duct Burner Gas
Consumption Therms
Boiler Gas Consumption
Therms
Total Natural Gas
Consumption Therms
Utility Electric Blended
Rate/kWh
Solar Electric Blended
Rate/kWhElectric Cost
Natural Gas Blended
Rate/Dtherm
Natural Gas Cost
Total Energy Cost
Jan 1,024 190,740 135,633 132,731 3,118,385 423,058 195,212 278,323 896,593 0.12611$ 0.06832$ 33,122$ 7.72$ 691,901$ 725,023$
Feb 824 185,201 122,713 127,616 2,992,608 399,284 183,351 275,823 858,457 0.12611$ 0.06832$ 32,074$ 7.69$ 660,497$ 692,571$
Mar 2,512 181,322 72,709 242,277 3,020,280 412,043 177,067 179,515 768,625 0.12611$ 0.06832$ 39,419$ 5.36$ 411,829$ 451,248$
Apr 983 226,536 - 247,106 2,998,590 404,466 80,099 115,604 600,169 0.12611$ 0.06832$ 45,451$ 3.06$ 183,832$ 229,283$
May 5,469 1,833,968 24,051 272,371 1,430,212 219,225 4,666 173,611 397,502 0.12611$ 0.06832$ 249,890$ 2.57$ 102,039$ 351,929$
Jun 4,120 1,525,108 61,831 262,940 1,655,428 287,107 - 113,777 400,884 0.12611$ 0.06832$ 210,295$ 2.68$ 107,237$ 317,532$
Jul 4,808 1,992,044 46,500 262,299 1,627,680 288,191 - 117,570 405,761 0.12611$ 0.06832$ 269,137$ 2.67$ 108,379$ 377,516$
Aug 5,265 2,230,743 92,533 268,633 1,656,619 292,051 - 117,570 409,621 0.12611$ 0.06832$ 299,672$ 2.50$ 102,241$ 401,913$
Sep 5,698 2,267,329 83,743 247,079 1,689,261 291,510 - 113,777 405,287 0.12611$ 0.06832$ 302,813$ 2.45$ 99,255$ 402,068$
Oct 2,584 346,793 156,610 184,176 3,055,068 413,977 66,530 117,628 598,135 0.12611$ 0.06832$ 56,317$ 2.73$ 163,291$ 219,608$
Nov 2,420 259,818 129,443 132,326 2,954,680 400,648 145,247 139,811 685,706 0.12611$ 0.06832$ 41,806$ 4.15$ 284,774$ 326,580$
Dec 2,549 213,302 152,851 87,131 3,039,994 414,459 176,809 163,388 754,657 0.12611$ 0.06832$ 32,852$ 5.66$ 427,287$ 460,139$
Total 5,698 11,452,904 1,078,617 2,466,685 29,238,804 4,246,018 1,028,982 1,906,397 7,181,397 1,612,850$ 3,342,560$ 4,955,410$
Carbon Neutral Calculation Energy Cost Savings 2,856,738$
Electric 7,215,329 22,548$ Cogen Maintenance 347,400$
Gas 84,029,527 262,592$
Total 285,140$ Cogen Staffing 300,000$
Annual Cost Savings 2,209,338$
University of Maine Orono
Energy Consumption - CHP Plant at the East Campus with Thermal Load Following and Solar Generation - Option 2C
Energy Screening Study
Calculation Sheet
Project:
Topic:
Page 29
Client:
Calc By: Check By: Job No.: File Name: Sheet Name: Date:
TK BAB 28471.00Cogeneration Analysis ver18 final.Proposed 9/19/2016
Energy Consumption
Month Peak kWPurchased
kWh
Steam Turbine Generated
kWh
Solar Purchased
kWh
CHP Generated
kWh
Engine Gas Consumption
Therms
Duct Burner Gas
Consumption Therms
Boiler Gas Consumption
Therms
Total Natural Gas
Consumption Therms
Utility Electric Blended
Rate/kWh
Solar Electric Blended
Rate/kWhElectric Cost
Natural Gas Blended
Rate/Dtherm
Natural Gas Cost
Total Energy Cost
Jan 1,024 190,740 135,633 132,731 3,118,385 423,058 195,212 278,323 896,593 0.12611$ 0.06832$ 33,122$ 7.72$ 691,901$ 725,023$
Feb 824 185,201 122,713 127,616 2,992,608 399,284 183,351 275,823 858,457 0.12611$ 0.06832$ 32,074$ 7.69$ 660,497$ 692,571$
Mar 2,512 181,322 72,709 242,277 3,020,280 412,043 177,067 179,515 768,625 0.12611$ 0.06832$ 39,419$ 5.36$ 411,829$ 451,248$
Apr 983 226,536 - 247,106 2,998,590 404,466 80,099 115,604 600,169 0.12611$ 0.06832$ 45,451$ 3.06$ 183,832$ 229,283$
May 5,477 1,837,312 24,051 272,371 1,430,282 219,230 4,666 173,611 397,507 0.12611$ 0.06832$ 250,312$ 2.57$ 102,040$ 352,352$
Jun 4,290 1,655,271 - 262,940 1,658,539 287,404 - 62,929 350,334 0.12611$ 0.06832$ 226,710$ 2.68$ 93,714$ 320,425$
Jul 5,186 2,237,001 - 262,299 1,627,680 288,191 - 20,970 309,161 0.12611$ 0.06832$ 300,028$ 2.67$ 82,577$ 382,605$
Aug 5,531 2,409,910 - 268,633 1,656,619 292,051 - 50,751 342,801 0.12611$ 0.06832$ 322,267$ 2.50$ 85,563$ 407,830$
Sep 5,731 2,291,379 83,743 247,079 1,689,261 291,510 - 113,777 405,287 0.12611$ 0.06832$ 305,846$ 2.45$ 99,255$ 405,101$
Oct 2,584 346,793 156,610 184,176 3,055,068 413,977 66,530 117,628 598,135 0.12611$ 0.06832$ 56,317$ 2.73$ 163,291$ 219,608$
Nov 2,420 259,818 129,443 132,326 2,954,680 400,648 145,247 139,811 685,706 0.12611$ 0.06832$ 41,806$ 4.15$ 284,774$ 326,580$
Dec 2,549 213,302 152,851 87,131 3,039,994 414,459 176,809 163,388 754,657 0.12611$ 0.06832$ 32,852$ 5.66$ 427,287$ 460,139$
Total 5,731 12,034,585 877,753 2,466,685 29,241,985 4,246,321 1,028,982 1,692,130 6,967,432 1,686,205$ 3,286,559$ 4,972,765$
Carbon Neutral Calculation Energy Cost Savings 2,839,383$
Electric 7,581,788 23,693$ Cogen Maintenance 347,400$
Gas 81,525,927 254,769$
Total 278,462$ Cogen Staffing 300,000$
Annual Cost Savings 2,191,983$
University of Maine Orono
Energy Consumption - CHP Plant at the East Campus with Thermal Load Following and Solar Generation and no Summer Steam Load - Option 2D
Energy Screening Study
Calculation Sheet
Project:
Topic:
Page 30
Client:
Calc By: Check By: Job No.: File Name: Sheet Name: Date:
TK BAB 28471.00Cogeneration Analysis ver18 final.Proposed 9/19/2016
Energy Consumption
Month Peak kWPurchased
kWh
Steam Turbine Generated
kWh
Solar Purchased
kWh
CHP Generated
kWh
Engine Gas Consumption
Therms
Duct Burner Gas
Consumption Therms
Boiler Gas Consumption
Therms
Total Natural Gas
Consumption Therms
Utility Electric Blended
Rate/kWh
Solar Electric Blended
Rate/kWhElectric Cost
Natural Gas Blended
Rate/Dtherm
Natural Gas Cost
Total Energy Cost
Jan 1,114 225,809 135,633 - 3,217,775 432,576 198,721 271,206 902,502 0.12611$ 0.06832$ 28,477$ 7.72$ 696,461$ 724,938$
Feb 985 250,056 122,713 - 3,056,470 405,616 185,937 270,705 862,258 0.12611$ 0.06832$ 31,535$ 7.69$ 663,421$ 694,956$
Mar 1,261 247,319 72,709 - 3,199,793 429,105 180,126 170,309 779,541 0.12611$ 0.06832$ 31,189$ 5.36$ 417,678$ 448,867$
Apr 1,310 333,047 - - 3,141,703 418,282 77,133 114,992 610,408 0.12611$ 0.06832$ 42,001$ 3.06$ 186,968$ 228,968$
May 5,795 1,502,686 24,051 - 2,036,305 272,682 4,144 172,677 449,503 0.12611$ 0.06832$ 189,504$ 2.57$ 115,387$ 304,891$
Jun 2,591 465,685 61,831 - 2,979,455 401,572 - 113,777 515,350 0.12611$ 0.06832$ 58,728$ 2.68$ 137,856$ 196,584$
Jul 3,144 751,897 46,500 - 3,131,042 420,347 - 117,570 537,917 0.12611$ 0.06832$ 94,822$ 2.67$ 143,678$ 238,499$
Aug 3,708 911,741 92,533 - 3,244,811 431,576 - 117,570 549,146 0.12611$ 0.06832$ 114,980$ 2.50$ 137,067$ 252,047$
Sep 3,965 980,181 83,743 - 3,224,173 425,840 - 113,777 539,618 0.12611$ 0.06832$ 123,611$ 2.45$ 132,152$ 255,763$
Oct 2,070 414,808 156,610 - 3,172,725 424,984 64,530 117,627 607,141 0.12611$ 0.06832$ 52,311$ 2.73$ 165,749$ 218,061$
Nov 1,684 287,573 129,443 - 3,061,301 411,149 146,223 134,963 692,336 0.12611$ 0.06832$ 36,266$ 4.15$ 287,527$ 323,793$
Dec 1,246 237,143 152,851 - 3,104,535 420,945 177,356 160,312 758,613 0.12611$ 0.06832$ 29,906$ 5.66$ 429,526$ 459,433$
Total 5,795 6,607,943 1,078,617 - 36,570,087 4,894,675 1,034,171 1,875,485 7,804,331 833,328$ 3,513,471$ 4,346,799$
Carbon Neutral Calculation Energy Cost Savings 3,465,349$
Electric 4,163,004 13,009$ Cogen Maintenance 347,400$
Gas 91,318,473 285,370$
Total 298,380$ Cogen Staffing 300,000$
Annual Cost Savings 2,817,949$
University of Maine Orono
Energy Consumption - CHP Plant at the East Campus with Electric Load Following - Option 3A
Energy Screening Study
Calculation Sheet
Project:
Topic:
Page 31
Client:
Calc By: Check By: Job No.: File Name: Sheet Name: Date:
TK BAB 28471.00Cogeneration Analysis ver18 final.Proposed 9/19/2016
Energy Consumption
Month Peak kWPurchased
kWh
Steam Turbine Generated
kWh
Solar Purchased
kWh
CHP Generated
kWh
Engine Gas Consumption
Therms
Duct Burner Gas
Consumption Therms
Boiler Gas Consumption
Therms
Total Natural Gas
Consumption Therms
Utility Electric Blended
Rate/kWh
Solar Electric Blended
Rate/kWhElectric Cost
Natural Gas Blended
Rate/Dtherm
Natural Gas Cost
Total Energy Cost
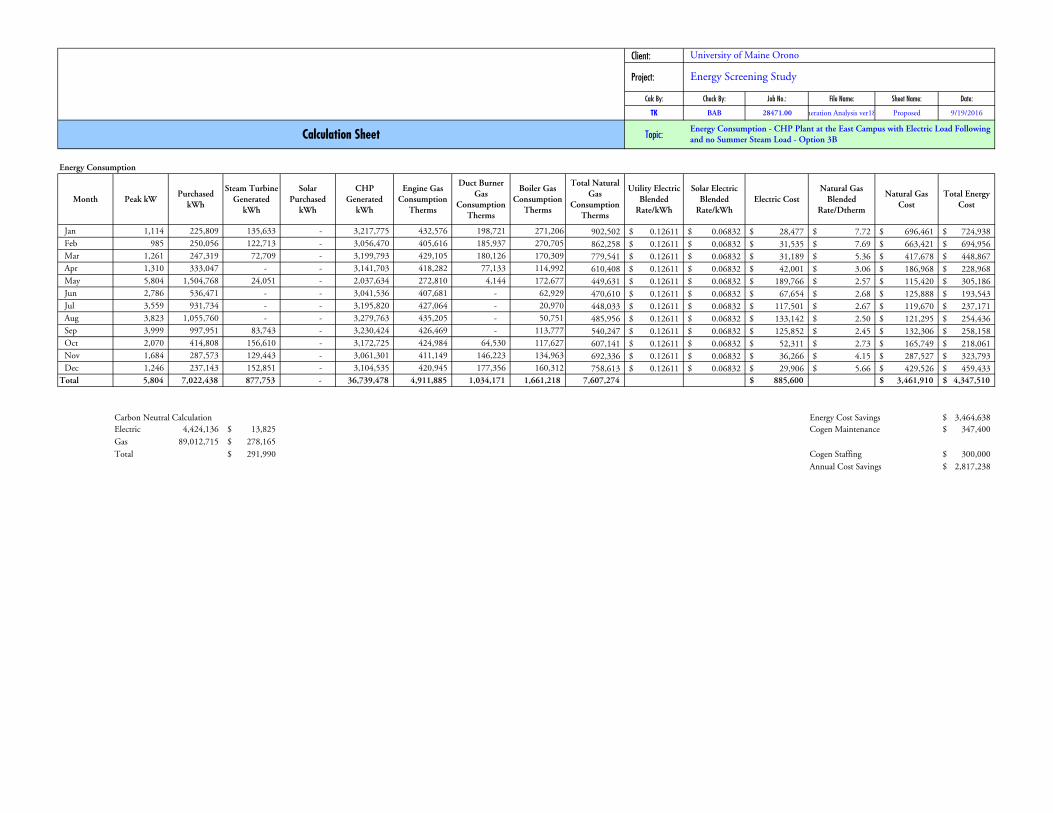
Jan 1,114 225,809 135,633 - 3,217,775 432,576 198,721 271,206 902,502 0.12611$ 0.06832$ 28,477$ 7.72$ 696,461$ 724,938$
Feb 985 250,056 122,713 - 3,056,470 405,616 185,937 270,705 862,258 0.12611$ 0.06832$ 31,535$ 7.69$ 663,421$ 694,956$
Mar 1,261 247,319 72,709 - 3,199,793 429,105 180,126 170,309 779,541 0.12611$ 0.06832$ 31,189$ 5.36$ 417,678$ 448,867$
Apr 1,310 333,047 - - 3,141,703 418,282 77,133 114,992 610,408 0.12611$ 0.06832$ 42,001$ 3.06$ 186,968$ 228,968$
May 5,804 1,504,768 24,051 - 2,037,634 272,810 4,144 172,677 449,631 0.12611$ 0.06832$ 189,766$ 2.57$ 115,420$ 305,186$
Jun 2,786 536,471 - - 3,041,536 407,681 - 62,929 470,610 0.12611$ 0.06832$ 67,654$ 2.68$ 125,888$ 193,543$
Jul 3,559 931,734 - - 3,195,820 427,064 - 20,970 448,033 0.12611$ 0.06832$ 117,501$ 2.67$ 119,670$ 237,171$
Aug 3,823 1,055,760 - - 3,279,763 435,205 - 50,751 485,956 0.12611$ 0.06832$ 133,142$ 2.50$ 121,295$ 254,436$
Sep 3,999 997,951 83,743 - 3,230,424 426,469 - 113,777 540,247 0.12611$ 0.06832$ 125,852$ 2.45$ 132,306$ 258,158$
Oct 2,070 414,808 156,610 - 3,172,725 424,984 64,530 117,627 607,141 0.12611$ 0.06832$ 52,311$ 2.73$ 165,749$ 218,061$
Nov 1,684 287,573 129,443 - 3,061,301 411,149 146,223 134,963 692,336 0.12611$ 0.06832$ 36,266$ 4.15$ 287,527$ 323,793$
Dec 1,246 237,143 152,851 - 3,104,535 420,945 177,356 160,312 758,613 0.12611$ 0.06832$ 29,906$ 5.66$ 429,526$ 459,433$
Total 5,804 7,022,438 877,753 - 36,739,478 4,911,885 1,034,171 1,661,218 7,607,274 885,600$ 3,461,910$ 4,347,510$
Carbon Neutral Calculation Energy Cost Savings 3,464,638$
Electric 4,424,136 13,825$ Cogen Maintenance 347,400$
Gas 89,012,715 278,165$
Total 291,990$ Cogen Staffing 300,000$
Annual Cost Savings 2,817,238$
University of Maine Orono
Energy Consumption - CHP Plant at the East Campus with Electric Load Following and no Summer Steam Load - Option 3B
Energy Screening Study
Calculation Sheet
Project:
Topic:
Page 32
Client:
Calc By: Check By: Job No.: File Name: Sheet Name: Date:
TK BAB 28471.00Cogeneration Analysis ver18 final.Proposed 9/19/2016
Energy Consumption
Month Peak kWPurchased
kWh
Steam Turbine Generated
kWh
Solar Purchased
kWh
CHP Generated
kWh
Engine Gas Consumption
Therms
Duct Burner Gas
Consumption Therms
Boiler Gas Consumption
Therms
Total Natural Gas
Consumption Therms
Utility Electric Blended
Rate/kWh
Solar Electric Blended
Rate/kWhElectric Cost
Natural Gas Blended
Rate/Dtherm
Natural Gas Cost
Total Energy Cost
Jan 1,024 190,740 135,633 132,731 3,118,385 423,058 195,212 278,323 896,593 0.12611$ 0.06832$ 33,122$ 7.72$ 691,901$ 725,023$
Feb 824 185,201 122,713 127,616 2,992,608 399,284 183,351 275,823 858,457 0.12611$ 0.06832$ 32,074$ 7.69$ 660,497$ 692,571$
Mar 2,512 181,322 72,709 242,277 3,020,280 412,043 177,067 179,515 768,625 0.12611$ 0.06832$ 39,419$ 5.36$ 411,829$ 451,248$
Apr 983 219,595 - 247,106 3,005,532 405,204 80,099 115,604 600,907 0.12611$ 0.06832$ 44,575$ 3.06$ 184,058$ 228,633$
May 5,469 1,346,558 24,051 272,371 1,917,622 260,723 4,666 173,611 439,000 0.12611$ 0.06832$ 188,423$ 2.57$ 112,691$ 301,114$
Jun 2,021 283,694 61,831 262,940 2,896,842 393,204 - 113,777 506,981 0.12611$ 0.06832$ 53,741$ 2.68$ 135,618$ 189,358$
Jul 2,699 533,576 46,500 262,299 3,086,148 415,768 - 117,570 533,338 0.12611$ 0.06832$ 85,210$ 2.67$ 142,454$ 227,664$
Aug 3,088 670,320 92,533 268,633 3,217,042 428,714 - 117,570 546,284 0.12611$ 0.06832$ 102,887$ 2.50$ 136,353$ 239,240$
Sep 3,550 767,788 83,743 247,079 3,188,802 422,328 - 113,777 536,106 0.12611$ 0.06832$ 113,706$ 2.45$ 131,292$ 244,998$
Oct 2,070 308,859 156,610 184,176 3,093,001 417,202 66,530 117,628 601,361 0.12611$ 0.06832$ 51,533$ 2.73$ 164,171$ 215,705$
Nov 2,420 258,312 129,443 132,326 2,956,187 400,809 145,247 139,811 685,868 0.12611$ 0.06832$ 41,616$ 4.15$ 284,841$ 326,457$
Dec 2,549 213,302 152,851 87,131 3,039,994 414,459 176,809 163,388 754,657 0.12611$ 0.06832$ 32,852$ 5.66$ 427,287$ 460,139$
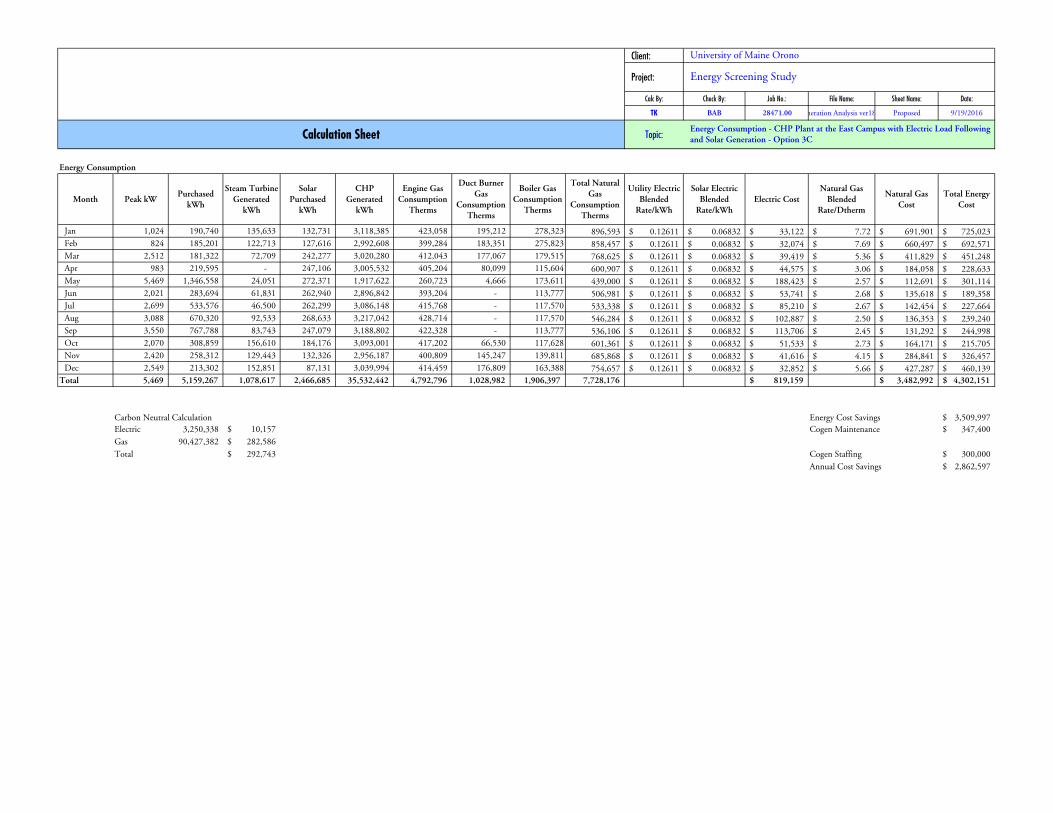
Total 5,469 5,159,267 1,078,617 2,466,685 35,532,442 4,792,796 1,028,982 1,906,397 7,728,176 819,159$ 3,482,992$ 4,302,151$
Carbon Neutral Calculation Energy Cost Savings 3,509,997$
Electric 3,250,338 10,157$ Cogen Maintenance 347,400$
Gas 90,427,382 282,586$
Total 292,743$ Cogen Staffing 300,000$
Annual Cost Savings 2,862,597$
University of Maine Orono
Energy Consumption - CHP Plant at the East Campus with Electric Load Following and Solar Generation - Option 3C
Energy Screening Study
Calculation Sheet
Project:
Topic:
Page 33
Client:
Calc By: Check By: Job No.: File Name: Sheet Name: Date:
TK BAB 28471.00Cogeneration Analysis ver18 final.Proposed 9/19/2016
Energy Consumption
Month Peak kWPurchased
kWh
Steam Turbine Generated
kWh
Solar Purchased
kWh
CHP Generated
kWh
Engine Gas Consumption
Therms
Duct Burner Gas
Consumption Therms
Boiler Gas Consumption
Therms
Total Natural Gas
Consumption Therms
Utility Electric Blended
Rate/kWh
Solar Electric Blended
Rate/kWhElectric Cost
Natural Gas Blended
Rate/Dtherm
Natural Gas Cost
Total Energy Cost
Jan 1,024 190,740 135,633 132,731 3,118,385 423,058 195,212 278,323 896,593 0.12611$ 0.06832$ 33,122$ 7.72$ 691,901$ 725,023$
Feb 824 185,201 122,713 127,616 2,992,608 399,284 183,351 275,823 858,457 0.12611$ 0.06832$ 32,074$ 7.69$ 660,497$ 692,571$
Mar 2,512 181,322 72,709 242,277 3,020,280 412,043 177,067 179,515 768,625 0.12611$ 0.06832$ 39,419$ 5.36$ 411,829$ 451,248$
Apr 983 219,595 - 247,106 3,005,532 405,204 80,099 115,604 600,907 0.12611$ 0.06832$ 44,575$ 3.06$ 184,058$ 228,633$
May 5,477 1,348,515 24,051 272,371 1,919,079 260,857 4,666 173,611 439,134 0.12611$ 0.06832$ 188,670$ 2.57$ 112,726$ 301,395$
Jun 2,191 334,639 - 262,940 2,979,171 401,289 - 62,929 464,219 0.12611$ 0.06832$ 60,165$ 2.68$ 124,179$ 184,344$
Jul 3,077 697,089 - 262,299 3,167,592 424,111 - 20,970 445,080 0.12611$ 0.06832$ 105,830$ 2.67$ 118,881$ 224,711$
Aug 3,355 804,794 - 268,633 3,261,735 433,321 - 50,751 484,072 0.12611$ 0.06832$ 119,846$ 2.50$ 120,824$ 240,670$
Sep 3,583 784,141 83,743 247,079 3,196,499 423,094 - 113,777 536,872 0.12611$ 0.06832$ 115,768$ 2.45$ 131,480$ 247,248$
Oct 2,070 308,859 156,610 184,176 3,093,001 417,202 66,530 117,628 601,361 0.12611$ 0.06832$ 51,533$ 2.73$ 164,171$ 215,705$
Nov 2,420 258,312 129,443 132,326 2,956,187 400,809 145,247 139,811 685,868 0.12611$ 0.06832$ 41,616$ 4.15$ 284,841$ 326,457$
Dec 2,549 213,302 152,851 87,131 3,039,994 414,459 176,809 163,388 754,657 0.12611$ 0.06832$ 32,852$ 5.66$ 427,287$ 460,139$
Total 5,477 5,526,509 877,753 2,466,685 35,750,062 4,814,732 1,028,982 1,692,130 7,535,844 865,472$ 3,432,673$ 4,298,145$
Carbon Neutral Calculation Energy Cost Savings 3,514,002$
Electric 3,481,700 10,880$ Cogen Maintenance 347,400$
Gas 88,176,906 275,553$
Total 286,433$ Cogen Staffing 300,000$
Annual Cost Savings 2,866,602$
University of Maine Orono
Energy Consumption - CHP Plant at the East Campus with Electric Load Following and Solar Generation and no Summer Steam Load - Option 3D
Energy Screening Study
Calculation Sheet
Project:
Topic:
Page 34
APPENDIX B
Financial Summary Results
Page 35
Client:
Calc By: Check By: Job No.: File Name: Sheet Name: Date:
TK BAB 25025.00 Cogeneration Analysis ver18 final. NPV 10/26/2016
Depreciation schedule 4.0%
240
3.0%
$0
$0
0 1 2 3 4 5 6 7 8 9 10 11 12 13 14 15 16 17 18 19 20
Start 2017 Year-2017 Year-2018 Year-2019 Year-2020 Year-2021 Year-2022 Year-2023 Year-2024 Year-2025 Year-2026 Year-2027 Year-2028 Year-2029 Year-2030 Year-2031 Year-2032 Year-2033 Year-2034 Year-2035 Year-2036
2.5% 2.5% 2.5% 2.5% 2.5% 2.5% 2.5% 2.5% 2.5% 2.5% 2.5% 2.5% 2.5% 2.5% 2.5% 2.5% 2.5% 2.5% 2.5% 2.5%
2.0% 2.0% 2.0% 2.0% 2.0% 2.0% 2.0% 2.0% 2.0% 2.0% 2.0% 2.0% 2.0% 2.0% 2.0% 2.0% 2.0% 2.0% 2.0% 2.0%
Electric Demand Growth 3.0% 3.0% 3.0% 3.0% 3.0% 3.0% 3.0% 3.0% 3.0% 3.0% 3.0% 3.0% 3.0% 3.0% 3.0% 3.0% 3.0% 3.0% 3.0% 3.0%
0.0% -1.9% 2.5% 2.6% 2.3% 3.2% 0.6% 1.3% 2.1% 2.0% 2.7% 2.7% 1.5% 1.5% 1.5% 1.5% 1.5% 1.5% 1.5% 1.5%
1.5% 1.5% 1.5% 1.5% 1.5% 1.5% 1.5% 1.5% 1.5% 1.5% 1.5% 1.5% 1.5% 1.5% 1.5% 1.5% 1.5% 1.5% 1.5% 1.5%
Water 2.0% 2.0% 2.0% 2.0% 2.0% 2.0% 2.0% 2.0% 2.0% 2.0% 2.0% 2.0% 2.0% 2.0% 2.0% 2.0% 2.0% 2.0% 2.0% 2.0%
Solar Generation Degradation -0.04% -0.04% -0.04% -0.04% -0.04% -0.04% -0.04% -0.04% -0.04% -0.04% -0.04% -0.04% -0.04% -0.04% -0.04% -0.04% -0.04% -0.04% -0.04% -0.04%
Solar Rate Escalation 0.0% -1.7% 1.3% 0.9% 0.2% 1.8% -0.8% 0.1% 2.3% 2.2% 2.9% 4.4% 1.2% 1.2% 1.2% 1.2% 1.2% 1.2% 1.2% 1.2%
2.5% 2.5% 2.5% 2.5% 2.5% 2.5% 2.5% 2.5% 2.5% 2.5% 2.5% 2.5% 2.5% 2.5% 2.5% 2.5% 2.5% 2.5% 2.5% 2.5%
Emissions Growth Electric 0.0% -1.9% 2.5% 2.6% 2.3% 3.2% 0.6% 1.3% 2.1% 2.0% 2.7% 2.7% 1.5% 1.5% 1.5% 1.5% 1.5% 1.5% 1.5% 1.5%
Emissions Growth Gas 0.0% 0.0% 0.0% 0.0% 0.0% 0.0% 0.0% 0.0% 0.0% 0.0% 0.0% 0.0% 0.0% 0.0% 0.0% 0.0% 0.0% 0.0% 0.0% 0.0%
Carbon Rate Escalation 0.0% 8.0% 7.4% 6.9% 6.5% 6.1% 128.6% 3.8% 3.6% 3.5% 3.4% 3.3% 3.2% 3.1% 3.0% 11.5% 10.3% 9.4% 8.6% 7.9%
Year-2017 Year-2018 Year-2019 Year-2020 Year-2021 Year-2022 Year-2023 Year-2024 Year-2025 Year-2026 Year-2027 Year-2028 Year-2029 Year-2030 Year-2031 Year-2032 Year-2033 Year-2034 Year-2035 Year-2036
ELECTRIC ($/kWh) $0.126 $0.126 $0.129 $0.131 $0.134 $0.137 $0.139 $0.142 $0.145 $0.148 $0.151 $0.154 $0.157 $0.160 $0.163 $0.166 $0.170 $0.173 $0.177 $0.180 $0.184
NATURAL GAS ($/therm) $0.791 $0.79 $0.776 $0.80 $0.82 $0.83 $0.86 $0.87 $0.88 $0.90 $0.91 $0.94 $0.96 $0.98 $0.99 $1.01 $1.03 $1.04 $1.06 $1.07 $1.09
Year-2017 Year-2018 Year-2019 Year-2020 Year-2021 Year-2022 Year-2023 Year-2024 Year-2025 Year-2026 Year-2027 Year-2028 Year-2029 Year-2030 Year-2031 Year-2032 Year-2033 Year-2034 Year-2035 Year-2036 Total
ELECTRIC (kWh) 42,178,862 42,178,862 43,444,228 44,747,555 46,089,981 47,472,681 48,896,861 50,363,767 51,874,680 53,430,920 55,033,848 56,684,863 58,385,409 60,136,972 61,941,081 63,799,313 65,713,293 67,684,691 69,715,232 71,806,689 73,960,890 1,133,361,815
GAS (Therms) 5,093,806 5,093,806 5,170,213 5,247,766 5,326,483 5,406,380 5,487,476 5,569,788 5,653,335 5,738,135 5,824,207 5,911,570 6,000,243 6,090,247 6,181,601 6,274,325 6,368,440 6,463,966 6,560,926 6,659,340 6,759,230 117,787,475
Year-2017 Year-2018 Year-2019 Year-2020 Year-2021 Year-2022 Year-2023 Year-2024 Year-2025 Year-2026 Year-2027 Year-2028 Year-2029 Year-2030 Year-2031 Year-2032 Year-2033 Year-2034 Year-2035 Year-2036 Total
ELECTRIC $5,319,176 $5,319,176 $5,588,327 $5,871,096 $6,168,173 $6,480,283 $6,808,185 $7,152,679 $7,514,605 $7,894,844 $8,294,323 $8,714,016 $9,154,945 $9,618,185 $10,104,865 $10,616,172 $11,153,350 $11,717,709 $12,310,626 $12,933,543 $13,587,981 177,003,084$
GAS $4,031,301 $4,031,301 $4,012,083 $4,172,338 $4,345,876 $4,514,157 $4,727,385 $4,825,706 $4,960,073 $5,139,981 $5,323,333 $5,548,227 $5,786,175 $5,963,166 $6,145,656 $6,333,817 $6,527,827 $6,727,870 $6,934,135 $7,146,819 $7,366,122 110,532,046$
BASE CASE TOTAL $9,350,477 9,350,477$ 9,600,410$ 10,043,434$ 10,514,050$ 10,994,440$ 11,535,570$ 11,978,386$ 12,474,678$ 13,034,825$ 13,617,656$ 14,262,243$ 14,941,120$ 15,581,351$ 16,250,521$ 16,949,988$ 17,681,177$ 18,445,579$ 19,244,761$ 20,080,362$ 20,954,103$ 287,535,131$
Year-2017 Year-2018 Year-2019 Year-2020 Year-2021 Year-2022 Year-2023 Year-2024 Year-2025 Year-2026 Year-2027 Year-2028 Year-2029 Year-2030 Year-2031 Year-2032 Year-2033 Year-2034 Year-2035 Year-2036
ELECTRIC ($/kWh) $0.126 $0.126 $0.129 $0.131 $0.134 $0.137 $0.139 $0.142 $0.145 $0.148 $0.151 $0.154 $0.157 $0.160 $0.163 $0.166 $0.170 $0.173 $0.177 $0.180 $0.184
NATURAL GAS ($/therm) $0.815 $0.81 $0.80 $0.82 $0.84 $0.86 $0.89 $0.89 $0.90 $0.92 $0.94 $0.97 $0.99 $1.01 $1.02 $1.04 $1.06 $1.07 $1.09 $1.11 $1.12
WATER ($/CCF) $0.860 $0.86 $0.88 $0.89 $0.91 $0.93 $0.95 $0.97 $0.99 $1.01 $1.03 $1.05 $1.07 $1.09 $1.11 $1.13 $1.16 $1.18 $1.20 $1.23 $1.25
SOLAR ($/kWh) $0.068 $0.07 $0.07 $0.07 $0.07 $0.07 $0.07 $0.07 $0.07 $0.07 $0.07 $0.07 $0.08 $0.08 $0.08 $0.08 $0.08 $0.08 $0.08 $0.08 $0.09
CARBON CREDIT ($/Short Ton) $6.25 $6.25 $6.75 $7.25 $7.75 $8.25 $8.75 $20.00 $20.75 $21.50 $22.25 $23.00 $23.75 $24.50 $25.25 $26.00 $29.00 $32.00 $35.00 $38.00 $41.00
Year-2017 Year-2018 Year-2019 Year-2020 Year-2021 Year-2022 Year-2023 Year-2024 Year-2025 Year-2026 Year-2027 Year-2028 Year-2029 Year-2030 Year-2031 Year-2032 Year-2033 Year-2034 Year-2035 Year-2036 Total
PURCHASED ELECTRIC (kWh) 42,759,457 42,759,457 44,042,241 45,363,508 46,724,413 48,126,146 49,569,930 51,057,028 52,588,739 54,166,401 55,791,393 57,465,135 59,189,089 60,964,762 62,793,705 64,677,516 66,617,841 68,616,376 70,674,868 72,795,114 74,978,967 1,148,962,630
PURCHASED SOLAR (kWh) 0 0 0 0 0 0 0 0 0 0 0 0 0 0 0 0 0 0 0 0 0 0
COGEN + BOILER GAS (Therms) 4,555,494 4,555,494 4,623,827 4,693,184 4,763,582 4,835,036 4,907,561 4,981,175 5,055,892 5,131,731 5,208,707 5,286,837 5,366,140 5,446,632 5,528,331 5,611,256 5,695,425 5,780,856 5,867,569 5,955,583 6,044,917 105,339,735
WATER (Gallons) 0 0 0 0 0 0 0 0 0 0 0 0 0 0 0 0 0 0 0 0 0 0
Short Ton CO2 Electric Consumption 13,469 13,469 13,603 14,356 15,174 15,994 16,997 17,607 18,365 19,312 20,297 21,467 22,718 23,759 24,848 25,987 27,179 28,426 29,730 31,095 32,523 432,905
Short Ton CO2 Gas Consumption 26,652 26,652 27,052 27,457 27,869 28,287 28,712 29,142 29,579 30,023 30,474 30,931 31,395 31,866 32,344 32,829 33,321 33,821 34,328 34,843 35,366 616,290
Year-2017 Year-2018 Year-2019 Year-2020 Year-2021 Year-2022 Year-2023 Year-2024 Year-2025 Year-2026 Year-2027 Year-2028 Year-2029 Year-2030 Year-2031 Year-2032 Year-2033 Year-2034 Year-2035 Year-2036 Total
ELECTRIC $5,392,395 $5,392,395 $5,665,250 $5,951,912 $6,253,079 $6,569,485 $6,901,900 $7,251,137 $7,618,044 $8,003,517 $8,408,495 $8,833,965 $9,280,964 $9,750,580 $10,243,960 $10,762,304 $11,306,877 $11,879,005 $12,480,082 $13,111,574 $13,775,020 179,439,546$
SOLAR $0 $0 $0 $0 $0 $0 $0 $0 $0 $0 $0 $0 $0 $0 $0 $0 $0 $0 $0 $0 $0 -$
GAS $3,712,217 $3,712,217 $3,694,521 $3,842,091 $4,001,894 $4,156,855 $4,353,206 $4,443,745 $4,567,475 $4,733,144 $4,901,983 $5,109,076 $5,328,190 $5,491,173 $5,659,218 $5,832,486 $6,011,139 $6,195,349 $6,385,288 $6,581,137 $6,783,083 101,783,270$
MAINTENANCE $0 $0 $0 $0 $0 $0 $0 $0 $0 $0 $0 $0 $0 $0 $0 $0 $0 $0 $0 $0 $0 -$
STAFFING $0 $0 $0 $0 $0 $0 $0 $0 $0 $0 $0 $0 $0 $0 $0 $0 $0 $0 $0 $0 $0 -$
Other $0 $0 $0 $0 $0 $0 $0 $0 $0 $0 $0 $0 $0 $0 $0 $0 $0 $0 $0 $0 $0 -$
WATER $0 $0 $0 $0 $0 $0 $0 $0 $0 $0 $0 $0 $0 $0 $0 $0 $0 $0 $0 $0 $0 -$
PROPOSED CASE TOTAL 9,104,612$ 9,104,612$ 9,359,771$ 9,794,003$ 10,254,973$ 10,726,340$ 11,255,106$ 11,694,881$ 12,185,520$ 12,736,661$ 13,310,478$ 13,943,041$ 14,609,154$ 15,241,753$ 15,903,178$ 16,594,790$ 17,318,016$ 18,074,353$ 18,865,370$ 19,692,712$ 20,558,103$ 281,222,816$
Year-2017 Year-2018 Year-2019 Year-2020 Year-2021 Year-2022 Year-2023 Year-2024 Year-2025 Year-2026 Year-2027 Year-2028 Year-2029 Year-2030 Year-2031 Year-2032 Year-2033 Year-2034 Year-2035 Year-2036 Total
Net Energy Savings 245,865$ 245,865$ 240,639$ 249,431$ 259,077$ 268,101$ 280,464$ 283,505$ 289,158$ 298,164$ 307,178$ 319,201$ 331,966$ 339,598$ 347,344$ 355,199$ 363,160$ 371,226$ 379,390$ 387,650$ 396,000$ 6,312,315$
Depreciation -$ -$ -$ -$ -$ -$ -$ -$ -$
Interest -$ -$ -$ -$ -$ -$ -$ -$ -$ -$ -$ -$ -$ -$ -$ -$ -$ -$ -$ -$ -$
Net Taxable Income 245,865$ 240,639$ 249,431$ 259,077$ 268,101$ 280,464$ 283,505$ 289,158$ 298,164$ 307,178$ 319,201$ 331,966$ 339,598$ 347,344$ 355,199$ 363,160$ 371,226$ 379,390$ 387,650$ 396,000$ 6,312,315$
Income Tax $0 $0 $0 $0 $0 $0 $0 $0 $0 $0 $0 $0 $0 $0 $0 $0 $0 $0 $0 $0 -$
After Tax Income 245,865$ 240,639$ 249,431$ 259,077$ 268,101$ 280,464$ 283,505$ 289,158$ 298,164$ 307,178$ 319,201$ 331,966$ 339,598$ 347,344$ 355,199$ 363,160$ 371,226$ 379,390$ 387,650$ 396,000$ 6,312,315$
Principal -$ -$ -$ -$ -$ -$ -$ -$ -$ -$ -$ -$ -$ -$ -$ -$ -$ -$ -$ -$ -$
Net Savings $0 $245,865 $240,639 $249,431 $259,077 $268,101 $280,464 $283,505 $289,158 $298,164 $307,178 $319,201 $331,966 $339,598 $347,344 $355,199 $363,160 $371,226 $379,390 $387,650 $396,000 6,312,315$
Carbon Credit Cost $250,757 $250,757 $274,420 $303,144 $333,583 $365,322 $399,952 $934,987 $994,842 $1,060,708 $1,129,634 $1,205,137 $1,285,177 $1,362,801 $1,444,085 $1,529,212 $1,754,503 $1,991,897 $2,242,050 $2,505,652 $2,783,435 24,151,299$
Proposed Total With Carbon Credits $9,355,370 $9,355,370 $9,634,191 $10,097,148 $10,588,555 $11,091,662 $11,655,058 $12,629,869 $13,180,362 $13,797,369 $14,440,112 $15,148,178 $15,894,331 $16,604,554 $17,347,263 $18,124,002 $19,072,519 $20,066,251 $21,107,420 $22,198,364 $23,341,538 305,374,115$
20 Yr PV of Savings vs Base Case both w/Carbon Offsets
20 Yr PV Cost without Carbon Offsets
20 Yr PV Cost with Carbon Offsets
$4,140,770$4,140,770$4,140,770$4,140,770
$180,624,920$180,624,920$180,624,920$180,624,920
$194,849,298$194,849,298$194,849,298$194,849,298
20 Yr PV Cost of Carbon Offsets
$1,346,928$1,346,928$1,346,928$1,346,928
$14,224,378$14,224,378$14,224,378$14,224,378
Base Case Rates
Base Case Consumption
Electric Rate Escalation
Gas Rate Escalation
University of Maine Orono
Project:
Proposed Case Consumption
Yearly Loan PaymentEstimated Federal and State Tax Rate
-$ Installed Cost
0.0%
Gas Demand Growth
Cogeneration Feasibility Study
Inflation rate
Interest Rate
Maintenance & Operation
Energy Consumption - Base Case and no Summer Steam Load - Option 1A ECONOMIC PRO FORMA
Discount Rate
Topic:
20 Yr PV of Savings vs Base Case both w/o Carbon Offsets
Savings
Length of Loan (months)
Interest Rate
Monthly Loan Payment
Inflation rate
2.5%
Proposed Case Cost
Base Case Cost
3.0%
Proposed Case Rates
Page 36
Client:
Calc By: Check By: Job No.: File Name: Sheet Name: Date:
TK BAB 25025.00 Cogeneration Analysis ver18 final. NPV 10/26/2016
Depreciation schedule 4.0%
240
3.0%
$0
$0
0 1 2 3 4 5 6 7 8 9 10 11 12 13 14 15 16 17 18 19 20
Start 2017 Year-2017 Year-2018 Year-2019 Year-2020 Year-2021 Year-2022 Year-2023 Year-2024 Year-2025 Year-2026 Year-2027 Year-2028 Year-2029 Year-2030 Year-2031 Year-2032 Year-2033 Year-2034 Year-2035 Year-2036
2.5% 2.5% 2.5% 2.5% 2.5% 2.5% 2.5% 2.5% 2.5% 2.5% 2.5% 2.5% 2.5% 2.5% 2.5% 2.5% 2.5% 2.5% 2.5% 2.5%
2.0% 2.0% 2.0% 2.0% 2.0% 2.0% 2.0% 2.0% 2.0% 2.0% 2.0% 2.0% 2.0% 2.0% 2.0% 2.0% 2.0% 2.0% 2.0% 2.0%
Electric Demand Growth 3.0% 3.0% 3.0% 3.0% 3.0% 3.0% 3.0% 3.0% 3.0% 3.0% 3.0% 3.0% 3.0% 3.0% 3.0% 3.0% 3.0% 3.0% 3.0% 3.0%
0.0% -1.9% 2.5% 2.6% 2.3% 3.2% 0.6% 1.3% 2.1% 2.0% 2.7% 2.7% 1.5% 1.5% 1.5% 1.5% 1.5% 1.5% 1.5% 1.5%
1.5% 1.5% 1.5% 1.5% 1.5% 1.5% 1.5% 1.5% 1.5% 1.5% 1.5% 1.5% 1.5% 1.5% 1.5% 1.5% 1.5% 1.5% 1.5% 1.5%
Water 2.0% 2.0% 2.0% 2.0% 2.0% 2.0% 2.0% 2.0% 2.0% 2.0% 2.0% 2.0% 2.0% 2.0% 2.0% 2.0% 2.0% 2.0% 2.0% 2.0%
Solar Generation Degradation -0.04% -0.04% -0.04% -0.04% -0.04% -0.04% -0.04% -0.04% -0.04% -0.04% -0.04% -0.04% -0.04% -0.04% -0.04% -0.04% -0.04% -0.04% -0.04% -0.04%
Solar Rate Escalation 0.0% -1.7% 1.3% 0.9% 0.2% 1.8% -0.8% 0.1% 2.3% 2.2% 2.9% 4.4% 1.2% 1.2% 1.2% 1.2% 1.2% 1.2% 1.2% 1.2%
2.5% 2.5% 2.5% 2.5% 2.5% 2.5% 2.5% 2.5% 2.5% 2.5% 2.5% 2.5% 2.5% 2.5% 2.5% 2.5% 2.5% 2.5% 2.5% 2.5%
Emissions Growth Electric 0.0% -1.9% 2.5% 2.6% 2.3% 3.2% 0.6% 1.3% 2.1% 2.0% 2.7% 2.7% 1.5% 1.5% 1.5% 1.5% 1.5% 1.5% 1.5% 1.5%
Emissions Growth Gas 0.0% 0.0% 0.0% 0.0% 0.0% 0.0% 0.0% 0.0% 0.0% 0.0% 0.0% 0.0% 0.0% 0.0% 0.0% 0.0% 0.0% 0.0% 0.0% 0.0%
Carbon Rate Escalation 0.0% 8.0% 7.4% 6.9% 6.5% 6.1% 128.6% 3.8% 3.6% 3.5% 3.4% 3.3% 3.2% 3.1% 3.0% 11.5% 10.3% 9.4% 8.6% 7.9%
Year-2017 Year-2018 Year-2019 Year-2020 Year-2021 Year-2022 Year-2023 Year-2024 Year-2025 Year-2026 Year-2027 Year-2028 Year-2029 Year-2030 Year-2031 Year-2032 Year-2033 Year-2034 Year-2035 Year-2036
ELECTRIC ($/kWh) $0.126 $0.126 $0.129 $0.131 $0.134 $0.137 $0.139 $0.142 $0.145 $0.148 $0.151 $0.154 $0.157 $0.160 $0.163 $0.166 $0.170 $0.173 $0.177 $0.180 $0.184
NATURAL GAS ($/therm) $0.791 $0.79 $0.776 $0.80 $0.82 $0.83 $0.86 $0.87 $0.88 $0.90 $0.91 $0.94 $0.96 $0.98 $0.99 $1.01 $1.03 $1.04 $1.06 $1.07 $1.09
Year-2017 Year-2018 Year-2019 Year-2020 Year-2021 Year-2022 Year-2023 Year-2024 Year-2025 Year-2026 Year-2027 Year-2028 Year-2029 Year-2030 Year-2031 Year-2032 Year-2033 Year-2034 Year-2035 Year-2036 Total
ELECTRIC (kWh) 42,178,862 42,178,862 43,444,228 44,747,555 46,089,981 47,472,681 48,896,861 50,363,767 51,874,680 53,430,920 55,033,848 56,684,863 58,385,409 60,136,972 61,941,081 63,799,313 65,713,293 67,684,691 69,715,232 71,806,689 73,960,890 1,133,361,815
GAS (Therms) 5,093,806 5,093,806 5,170,213 5,247,766 5,326,483 5,406,380 5,487,476 5,569,788 5,653,335 5,738,135 5,824,207 5,911,570 6,000,243 6,090,247 6,181,601 6,274,325 6,368,440 6,463,966 6,560,926 6,659,340 6,759,230 117,787,475
Year-2017 Year-2018 Year-2019 Year-2020 Year-2021 Year-2022 Year-2023 Year-2024 Year-2025 Year-2026 Year-2027 Year-2028 Year-2029 Year-2030 Year-2031 Year-2032 Year-2033 Year-2034 Year-2035 Year-2036 Total
ELECTRIC $5,319,176 $5,319,176 $5,588,327 $5,871,096 $6,168,173 $6,480,283 $6,808,185 $7,152,679 $7,514,605 $7,894,844 $8,294,323 $8,714,016 $9,154,945 $9,618,185 $10,104,865 $10,616,172 $11,153,350 $11,717,709 $12,310,626 $12,933,543 $13,587,981 177,003,084$
GAS $4,031,301 $4,031,301 $4,012,083 $4,172,338 $4,345,876 $4,514,157 $4,727,385 $4,825,706 $4,960,073 $5,139,981 $5,323,333 $5,548,227 $5,786,175 $5,963,166 $6,145,656 $6,333,817 $6,527,827 $6,727,870 $6,934,135 $7,146,819 $7,366,122 110,532,046$
BASE CASE TOTAL $9,350,477 9,350,477$ 9,600,410$ 10,043,434$ 10,514,050$ 10,994,440$ 11,535,570$ 11,978,386$ 12,474,678$ 13,034,825$ 13,617,656$ 14,262,243$ 14,941,120$ 15,581,351$ 16,250,521$ 16,949,988$ 17,681,177$ 18,445,579$ 19,244,761$ 20,080,362$ 20,954,103$ 287,535,131$
Year-2017 Year-2018 Year-2019 Year-2020 Year-2021 Year-2022 Year-2023 Year-2024 Year-2025 Year-2026 Year-2027 Year-2028 Year-2029 Year-2030 Year-2031 Year-2032 Year-2033 Year-2034 Year-2035 Year-2036
ELECTRIC ($/kWh) $0.126 $0.126 $0.129 $0.131 $0.134 $0.137 $0.139 $0.142 $0.145 $0.148 $0.151 $0.154 $0.157 $0.160 $0.163 $0.166 $0.170 $0.173 $0.177 $0.180 $0.184
NATURAL GAS ($/therm) $0.785 $0.79 $0.77 $0.79 $0.81 $0.83 $0.85 $0.86 $0.87 $0.89 $0.91 $0.93 $0.96 $0.97 $0.99 $1.00 $1.02 $1.03 $1.05 $1.06 $1.08
WATER ($/CCF) $0.860 $0.86 $0.88 $0.89 $0.91 $0.93 $0.95 $0.97 $0.99 $1.01 $1.03 $1.05 $1.07 $1.09 $1.11 $1.13 $1.16 $1.18 $1.20 $1.23 $1.25
SOLAR ($/kWh) $0.068 $0.07 $0.07 $0.07 $0.07 $0.07 $0.07 $0.07 $0.07 $0.07 $0.07 $0.07 $0.08 $0.08 $0.08 $0.08 $0.08 $0.08 $0.08 $0.08 $0.09
CARBON CREDIT ($/Short Ton) $6.25 $6.25 $6.75 $7.25 $7.75 $8.25 $8.75 $20.00 $20.75 $21.50 $22.25 $23.00 $23.75 $24.50 $25.25 $26.00 $29.00 $32.00 $35.00 $38.00 $41.00
Year-2017 Year-2018 Year-2019 Year-2020 Year-2021 Year-2022 Year-2023 Year-2024 Year-2025 Year-2026 Year-2027 Year-2028 Year-2029 Year-2030 Year-2031 Year-2032 Year-2033 Year-2034 Year-2035 Year-2036 Total
PURCHASED ELECTRIC (kWh) 32,605,796 32,605,796 33,583,970 34,591,489 35,629,234 36,698,111 37,799,054 38,933,026 40,101,017 41,304,047 42,543,169 43,819,464 45,134,048 46,488,069 47,882,711 49,319,192 50,798,768 52,322,731 53,892,413 55,509,186 57,174,461 876,129,958
PURCHASED SOLAR (kWh) 9,573,066 9,573,066 9,569,236 9,565,409 9,561,583 9,557,758 9,553,935 9,550,113 9,546,293 9,542,475 9,538,658 9,534,842 9,531,028 9,527,216 9,523,405 9,519,596 9,515,788 9,511,981 9,508,177 9,504,373 9,500,572 190,735,502
COGEN + BOILER GAS (Therms) 5,162,371 5,162,371 5,239,807 5,318,404 5,398,180 5,479,153 5,561,340 5,644,760 5,729,431 5,815,373 5,902,603 5,991,143 6,081,010 6,172,225 6,264,808 6,358,780 6,454,162 6,550,974 6,649,239 6,748,978 6,850,212 119,372,953
WATER (Gallons) 0 0 0 0 0 0 0 0 0 0 0 0 0 0 0 0 0 0 0 0 0 0
Short Ton CO2 Electric Consumption 10,271 10,271 10,373 10,947 11,570 12,196 12,961 13,426 14,004 14,726 15,477 16,369 17,323 18,117 18,948 19,816 20,725 21,676 22,671 23,711 24,800 330,107
Short Ton CO2 Gas Consumption 30,202 30,202 30,655 31,115 31,582 32,056 32,537 33,025 33,520 34,023 34,533 35,051 35,577 36,111 36,652 37,202 37,760 38,326 38,901 39,485 40,077 698,391
Year-2017 Year-2018 Year-2019 Year-2020 Year-2021 Year-2022 Year-2023 Year-2024 Year-2025 Year-2026 Year-2027 Year-2028 Year-2029 Year-2030 Year-2031 Year-2032 Year-2033 Year-2034 Year-2035 Year-2036 Total
ELECTRIC $4,111,917 $4,111,917 $4,319,980 $4,538,571 $4,768,223 $5,009,495 $5,262,975 $5,529,282 $5,809,063 $6,103,002 $6,411,814 $6,736,252 $7,077,106 $7,435,208 $7,811,429 $8,206,687 $8,621,946 $9,058,216 $9,516,562 $9,998,100 $10,504,004 136,829,830$
SOLAR $654,032 $654,032 $642,563 $650,435 $656,135 $657,484 $669,094 $663,265 $663,500 $678,723 $693,478 $713,595 $744,786 $753,102 $761,506 $769,996 $778,575 $787,241 $795,996 $804,839 $813,770 14,352,113$
GAS $4,054,169 $4,054,169 $4,034,843 $4,196,007 $4,370,530 $4,539,765 $4,754,203 $4,853,082 $4,988,210 $5,169,139 $5,353,531 $5,579,701 $5,818,999 $5,996,994 $6,180,519 $6,369,747 $6,564,858 $6,766,035 $6,973,471 $7,187,361 $7,407,909 111,159,072$
MAINTENANCE $0 $0 $0 $0 $0 $0 $0 $0 $0 $0 $0 $0 $0 $0 $0 $0 $0 $0 $0 $0 $0 -$
STAFFING $0 $0 $0 $0 $0 $0 $0 $0 $0 $0 $0 $0 $0 $0 $0 $0 $0 $0 $0 $0 $0 -$
Other $0 $0 $0 $0 $0 $0 $0 $0 $0 $0 $0 $0 $0 $0 $0 $0 $0 $0 $0 $0 $0 -$
WATER $0 $0 $0 $0 $0 $0 $0 $0 $0 $0 $0 $0 $0 $0 $0 $0 $0 $0 $0 $0 $0 -$
PROPOSED CASE TOTAL 8,820,118$ 8,820,118$ 8,997,385$ 9,385,013$ 9,794,887$ 10,206,744$ 10,686,271$ 11,045,628$ 11,460,773$ 11,950,865$ 12,458,822$ 13,029,547$ 13,640,891$ 14,185,304$ 14,753,454$ 15,346,431$ 15,965,378$ 16,611,493$ 17,286,029$ 17,990,300$ 18,725,683$ 262,341,016$
Year-2017 Year-2018 Year-2019 Year-2020 Year-2021 Year-2022 Year-2023 Year-2024 Year-2025 Year-2026 Year-2027 Year-2028 Year-2029 Year-2030 Year-2031 Year-2032 Year-2033 Year-2034 Year-2035 Year-2036 Total
Net Energy Savings 530,359$ 530,359$ 603,024$ 658,421$ 719,163$ 787,697$ 849,299$ 932,758$ 1,013,904$ 1,083,961$ 1,158,833$ 1,232,696$ 1,300,229$ 1,396,048$ 1,497,068$ 1,603,558$ 1,715,798$ 1,834,086$ 1,958,732$ 2,090,062$ 2,228,420$ 25,194,115$
Depreciation -$ -$ -$ -$ -$ -$ -$ -$ -$
Interest -$ -$ -$ -$ -$ -$ -$ -$ -$ -$ -$ -$ -$ -$ -$ -$ -$ -$ -$ -$ -$
Net Taxable Income 530,359$ 603,024$ 658,421$ 719,163$ 787,697$ 849,299$ 932,758$ 1,013,904$ 1,083,961$ 1,158,833$ 1,232,696$ 1,300,229$ 1,396,048$ 1,497,068$ 1,603,558$ 1,715,798$ 1,834,086$ 1,958,732$ 2,090,062$ 2,228,420$ 25,194,115$
Income Tax $0 $0 $0 $0 $0 $0 $0 $0 $0 $0 $0 $0 $0 $0 $0 $0 $0 $0 $0 $0 -$
After Tax Income 530,359$ 603,024$ 658,421$ 719,163$ 787,697$ 849,299$ 932,758$ 1,013,904$ 1,083,961$ 1,158,833$ 1,232,696$ 1,300,229$ 1,396,048$ 1,497,068$ 1,603,558$ 1,715,798$ 1,834,086$ 1,958,732$ 2,090,062$ 2,228,420$ 25,194,115$
Principal -$ -$ -$ -$ -$ -$ -$ -$ -$ -$ -$ -$ -$ -$ -$ -$ -$ -$ -$ -$ -$
Net Savings $0 $530,359 $603,024 $658,421 $719,163 $787,697 $849,299 $932,758 $1,013,904 $1,083,961 $1,158,833 $1,232,696 $1,300,229 $1,396,048 $1,497,068 $1,603,558 $1,715,798 $1,834,086 $1,958,732 $2,090,062 $2,228,420 25,194,115$
Carbon Credit Cost $252,958 $252,958 $276,942 $304,949 $334,432 $365,078 $398,104 $929,014 $986,120 $1,048,105 $1,112,725 $1,182,668 $1,256,385 $1,328,581 $1,403,896 $1,482,477 $1,696,070 $1,920,075 $2,155,018 $2,401,453 $2,659,964 23,495,013$
Proposed Total With Carbon Credits $9,073,076 $9,073,076 $9,274,327 $9,689,963 $10,129,319 $10,571,822 $11,084,375 $11,974,642 $12,446,893 $12,998,969 $13,571,547 $14,212,215 $14,897,275 $15,513,885 $16,157,350 $16,828,907 $17,661,448 $18,531,568 $19,441,047 $20,391,753 $21,385,647 285,836,029$
20 Yr PV of Savings vs Base Case both w/Carbon Offsets
20 Yr PV Cost without Carbon Offsets
20 Yr PV Cost with Carbon Offsets
$15,620,113$15,620,113$15,620,113$15,620,113
$169,145,577$169,145,577$169,145,577$169,145,577
$183,024,754$183,024,754$183,024,754$183,024,754
20 Yr PV Cost of Carbon Offsets
$13,171,472$13,171,472$13,171,472$13,171,472
$13,879,177$13,879,177$13,879,177$13,879,177
Base Case Rates
Base Case Consumption
Electric Rate Escalation
Gas Rate Escalation
University of Maine Orono
Project:
Proposed Case Consumption
Yearly Loan PaymentEstimated Federal and State Tax Rate
-$ Installed Cost
0.0%
Gas Demand Growth
Cogeneration Feasibility Study
Inflation rate
Interest Rate
Maintenance & Operation
Energy Consumption - Base Case and Solar Generation - Option 1B ECONOMIC PRO FORMA
Discount Rate
Topic:
20 Yr PV of Savings vs Base Case both w/o Carbon Offsets
Savings
Length of Loan (months)
Interest Rate
Monthly Loan Payment
Inflation rate
2.5%
Proposed Case Cost
Base Case Cost
3.0%
Proposed Case Rates
Page 37
Client:
Calc By: Check By: Job No.: File Name: Sheet Name: Date:
TK BAB 25025.00 Cogeneration Analysis ver18 final. NPV 10/26/2016
Depreciation schedule 4.0%
240
3.0%
$0
$0
0 1 2 3 4 5 6 7 8 9 10 11 12 13 14 15 16 17 18 19 20
Start 2017 Year-2017 Year-2018 Year-2019 Year-2020 Year-2021 Year-2022 Year-2023 Year-2024 Year-2025 Year-2026 Year-2027 Year-2028 Year-2029 Year-2030 Year-2031 Year-2032 Year-2033 Year-2034 Year-2035 Year-2036
2.5% 2.5% 2.5% 2.5% 2.5% 2.5% 2.5% 2.5% 2.5% 2.5% 2.5% 2.5% 2.5% 2.5% 2.5% 2.5% 2.5% 2.5% 2.5% 2.5%
2.0% 2.0% 2.0% 2.0% 2.0% 2.0% 2.0% 2.0% 2.0% 2.0% 2.0% 2.0% 2.0% 2.0% 2.0% 2.0% 2.0% 2.0% 2.0% 2.0%
Electric Demand Growth 3.0% 3.0% 3.0% 3.0% 3.0% 3.0% 3.0% 3.0% 3.0% 3.0% 3.0% 3.0% 3.0% 3.0% 3.0% 3.0% 3.0% 3.0% 3.0% 3.0%
0.0% -1.9% 2.5% 2.6% 2.3% 3.2% 0.6% 1.3% 2.1% 2.0% 2.7% 2.7% 1.5% 1.5% 1.5% 1.5% 1.5% 1.5% 1.5% 1.5%
1.5% 1.5% 1.5% 1.5% 1.5% 1.5% 1.5% 1.5% 1.5% 1.5% 1.5% 1.5% 1.5% 1.5% 1.5% 1.5% 1.5% 1.5% 1.5% 1.5%
Water 2.0% 2.0% 2.0% 2.0% 2.0% 2.0% 2.0% 2.0% 2.0% 2.0% 2.0% 2.0% 2.0% 2.0% 2.0% 2.0% 2.0% 2.0% 2.0% 2.0%
Solar Generation Degradation -0.04% -0.04% -0.04% -0.04% -0.04% -0.04% -0.04% -0.04% -0.04% -0.04% -0.04% -0.04% -0.04% -0.04% -0.04% -0.04% -0.04% -0.04% -0.04% -0.04%
Solar Rate Escalation 0.0% -1.7% 1.3% 0.9% 0.2% 1.8% -0.8% 0.1% 2.3% 2.2% 2.9% 4.4% 1.2% 1.2% 1.2% 1.2% 1.2% 1.2% 1.2% 1.2%
2.5% 2.5% 2.5% 2.5% 2.5% 2.5% 2.5% 2.5% 2.5% 2.5% 2.5% 2.5% 2.5% 2.5% 2.5% 2.5% 2.5% 2.5% 2.5% 2.5%
Emissions Growth Electric 0.0% -1.9% 2.5% 2.6% 2.3% 3.2% 0.6% 1.3% 2.1% 2.0% 2.7% 2.7% 1.5% 1.5% 1.5% 1.5% 1.5% 1.5% 1.5% 1.5%
Emissions Growth Gas 0.0% 0.0% 0.0% 0.0% 0.0% 0.0% 0.0% 0.0% 0.0% 0.0% 0.0% 0.0% 0.0% 0.0% 0.0% 0.0% 0.0% 0.0% 0.0% 0.0%
Carbon Rate Escalation 0.0% 8.0% 7.4% 6.9% 6.5% 6.1% 128.6% 3.8% 3.6% 3.5% 3.4% 3.3% 3.2% 3.1% 3.0% 11.5% 10.3% 9.4% 8.6% 7.9%
Year-2017 Year-2018 Year-2019 Year-2020 Year-2021 Year-2022 Year-2023 Year-2024 Year-2025 Year-2026 Year-2027 Year-2028 Year-2029 Year-2030 Year-2031 Year-2032 Year-2033 Year-2034 Year-2035 Year-2036
ELECTRIC ($/kWh) $0.126 $0.126 $0.129 $0.131 $0.134 $0.137 $0.139 $0.142 $0.145 $0.148 $0.151 $0.154 $0.157 $0.160 $0.163 $0.166 $0.170 $0.173 $0.177 $0.180 $0.184
NATURAL GAS ($/therm) $0.791 $0.79 $0.776 $0.80 $0.82 $0.83 $0.86 $0.87 $0.88 $0.90 $0.91 $0.94 $0.96 $0.98 $0.99 $1.01 $1.03 $1.04 $1.06 $1.07 $1.09
Year-2017 Year-2018 Year-2019 Year-2020 Year-2021 Year-2022 Year-2023 Year-2024 Year-2025 Year-2026 Year-2027 Year-2028 Year-2029 Year-2030 Year-2031 Year-2032 Year-2033 Year-2034 Year-2035 Year-2036 Total
ELECTRIC (kWh) 42,178,862 42,178,862 43,444,228 44,747,555 46,089,981 47,472,681 48,896,861 50,363,767 51,874,680 53,430,920 55,033,848 56,684,863 58,385,409 60,136,972 61,941,081 63,799,313 65,713,293 67,684,691 69,715,232 71,806,689 73,960,890 1,133,361,815
GAS (Therms) 5,093,806 5,093,806 5,170,213 5,247,766 5,326,483 5,406,380 5,487,476 5,569,788 5,653,335 5,738,135 5,824,207 5,911,570 6,000,243 6,090,247 6,181,601 6,274,325 6,368,440 6,463,966 6,560,926 6,659,340 6,759,230 117,787,475
Year-2017 Year-2018 Year-2019 Year-2020 Year-2021 Year-2022 Year-2023 Year-2024 Year-2025 Year-2026 Year-2027 Year-2028 Year-2029 Year-2030 Year-2031 Year-2032 Year-2033 Year-2034 Year-2035 Year-2036 Total
ELECTRIC $5,319,176 $5,319,176 $5,588,327 $5,871,096 $6,168,173 $6,480,283 $6,808,185 $7,152,679 $7,514,605 $7,894,844 $8,294,323 $8,714,016 $9,154,945 $9,618,185 $10,104,865 $10,616,172 $11,153,350 $11,717,709 $12,310,626 $12,933,543 $13,587,981 177,003,084$
GAS $4,031,301 $4,031,301 $4,012,083 $4,172,338 $4,345,876 $4,514,157 $4,727,385 $4,825,706 $4,960,073 $5,139,981 $5,323,333 $5,548,227 $5,786,175 $5,963,166 $6,145,656 $6,333,817 $6,527,827 $6,727,870 $6,934,135 $7,146,819 $7,366,122 110,532,046$
BASE CASE TOTAL $9,350,477 9,350,477$ 9,600,410$ 10,043,434$ 10,514,050$ 10,994,440$ 11,535,570$ 11,978,386$ 12,474,678$ 13,034,825$ 13,617,656$ 14,262,243$ 14,941,120$ 15,581,351$ 16,250,521$ 16,949,988$ 17,681,177$ 18,445,579$ 19,244,761$ 20,080,362$ 20,954,103$ 287,535,131$
Year-2017 Year-2018 Year-2019 Year-2020 Year-2021 Year-2022 Year-2023 Year-2024 Year-2025 Year-2026 Year-2027 Year-2028 Year-2029 Year-2030 Year-2031 Year-2032 Year-2033 Year-2034 Year-2035 Year-2036
ELECTRIC ($/kWh) $0.126 $0.126 $0.129 $0.131 $0.134 $0.137 $0.139 $0.142 $0.145 $0.148 $0.151 $0.154 $0.157 $0.160 $0.163 $0.166 $0.170 $0.173 $0.177 $0.180 $0.184
NATURAL GAS ($/therm) $0.815 $0.81 $0.80 $0.82 $0.84 $0.86 $0.89 $0.89 $0.90 $0.92 $0.94 $0.97 $0.99 $1.01 $1.02 $1.04 $1.06 $1.07 $1.09 $1.11 $1.12
WATER ($/CCF) $0.860 $0.86 $0.88 $0.89 $0.91 $0.93 $0.95 $0.97 $0.99 $1.01 $1.03 $1.05 $1.07 $1.09 $1.11 $1.13 $1.16 $1.18 $1.20 $1.23 $1.25
SOLAR ($/kWh) $0.068 $0.07 $0.07 $0.07 $0.07 $0.07 $0.07 $0.07 $0.07 $0.07 $0.07 $0.07 $0.08 $0.08 $0.08 $0.08 $0.08 $0.08 $0.08 $0.08 $0.09
CARBON CREDIT ($/Short Ton) $6.25 $6.25 $6.75 $7.25 $7.75 $8.25 $8.75 $20.00 $20.75 $21.50 $22.25 $23.00 $23.75 $24.50 $25.25 $26.00 $29.00 $32.00 $35.00 $38.00 $41.00
Year-2017 Year-2018 Year-2019 Year-2020 Year-2021 Year-2022 Year-2023 Year-2024 Year-2025 Year-2026 Year-2027 Year-2028 Year-2029 Year-2030 Year-2031 Year-2032 Year-2033 Year-2034 Year-2035 Year-2036 Total
PURCHASED ELECTRIC (kWh) 33,186,392 33,186,392 34,181,983 35,207,443 36,263,666 37,351,576 38,472,123 39,626,287 40,815,076 42,039,528 43,300,714 44,599,735 45,937,727 47,315,859 48,735,335 50,197,395 51,703,317 53,254,416 54,852,049 56,497,610 58,192,539 891,730,772
PURCHASED SOLAR (kWh) 9,573,066 9,573,066 9,569,236 9,565,409 9,561,583 9,557,758 9,553,935 9,550,113 9,546,293 9,542,475 9,538,658 9,534,842 9,531,028 9,527,216 9,523,405 9,519,596 9,515,788 9,511,981 9,508,177 9,504,373 9,500,572 190,735,502
COGEN + BOILER GAS (Therms) 4,555,494 4,555,494 4,623,827 4,693,184 4,763,582 4,835,036 4,907,561 4,981,175 5,055,892 5,131,731 5,208,707 5,286,837 5,366,140 5,446,632 5,528,331 5,611,256 5,695,425 5,780,856 5,867,569 5,955,583 6,044,917 105,339,735
WATER (Gallons) 0 0 0 0 0 0 0 0 0 0 0 0 0 0 0 0 0 0 0 0 0 0
Short Ton CO2 Electric Consumption 10,454 10,454 10,558 11,142 11,777 12,413 13,192 13,665 14,253 14,988 15,753 16,661 17,632 18,440 19,285 20,169 21,094 22,062 23,074 24,133 25,242 335,986
Short Ton CO2 Gas Consumption 26,652 26,652 27,052 27,457 27,869 28,287 28,712 29,142 29,579 30,023 30,474 30,931 31,395 31,866 32,344 32,829 33,321 33,821 34,328 34,843 35,366 616,290
Year-2017 Year-2018 Year-2019 Year-2020 Year-2021 Year-2022 Year-2023 Year-2024 Year-2025 Year-2026 Year-2027 Year-2028 Year-2029 Year-2030 Year-2031 Year-2032 Year-2033 Year-2034 Year-2035 Year-2036 Total
ELECTRIC $4,185,136 $4,185,136 $4,396,904 $4,619,387 $4,853,128 $5,098,696 $5,356,690 $5,627,739 $5,912,502 $6,211,675 $6,525,986 $6,856,201 $7,203,125 $7,567,603 $7,950,523 $8,352,820 $8,775,472 $9,219,511 $9,686,019 $10,176,131 $10,691,043 139,266,292$
SOLAR $654,032 $654,032 $642,563 $650,435 $656,135 $657,484 $669,094 $663,265 $663,500 $678,723 $693,478 $713,595 $744,786 $753,102 $761,506 $769,996 $778,575 $787,241 $795,996 $804,839 $813,770 14,352,113$
GAS $3,712,217 $3,712,217 $3,694,521 $3,842,091 $4,001,894 $4,156,855 $4,353,206 $4,443,745 $4,567,475 $4,733,144 $4,901,983 $5,109,076 $5,328,190 $5,491,173 $5,659,218 $5,832,486 $6,011,139 $6,195,349 $6,385,288 $6,581,137 $6,783,083 101,783,270$
MAINTENANCE $0 $0 $0 $0 $0 $0 $0 $0 $0 $0 $0 $0 $0 $0 $0 $0 $0 $0 $0 $0 $0 -$
STAFFING $0 $0 $0 $0 $0 $0 $0 $0 $0 $0 $0 $0 $0 $0 $0 $0 $0 $0 $0 $0 $0 -$
Other $0 $0 $0 $0 $0 $0 $0 $0 $0 $0 $0 $0 $0 $0 $0 $0 $0 $0 $0 $0 $0 -$
WATER $0 $0 $0 $0 $0 $0 $0 $0 $0 $0 $0 $0 $0 $0 $0 $0 $0 $0 $0 $0 $0 -$
PROPOSED CASE TOTAL 8,551,385$ 8,551,385$ 8,733,987$ 9,111,914$ 9,511,156$ 9,913,035$ 10,378,990$ 10,734,748$ 11,143,478$ 11,623,543$ 12,121,447$ 12,678,872$ 13,276,101$ 13,811,877$ 14,371,247$ 14,955,302$ 15,565,187$ 16,202,101$ 16,867,302$ 17,562,107$ 18,287,897$ 255,401,675$
Year-2017 Year-2018 Year-2019 Year-2020 Year-2021 Year-2022 Year-2023 Year-2024 Year-2025 Year-2026 Year-2027 Year-2028 Year-2029 Year-2030 Year-2031 Year-2032 Year-2033 Year-2034 Year-2035 Year-2036 Total
Net Energy Savings 799,092$ 799,092$ 866,423$ 931,520$ 1,002,893$ 1,081,405$ 1,156,581$ 1,243,638$ 1,331,200$ 1,411,283$ 1,496,209$ 1,583,371$ 1,665,019$ 1,769,474$ 1,879,274$ 1,994,687$ 2,115,990$ 2,243,478$ 2,377,458$ 2,518,255$ 2,666,206$ 32,133,455$
Depreciation -$ -$ -$ -$ -$ -$ -$ -$ -$
Interest -$ -$ -$ -$ -$ -$ -$ -$ -$ -$ -$ -$ -$ -$ -$ -$ -$ -$ -$ -$ -$
Net Taxable Income 799,092$ 866,423$ 931,520$ 1,002,893$ 1,081,405$ 1,156,581$ 1,243,638$ 1,331,200$ 1,411,283$ 1,496,209$ 1,583,371$ 1,665,019$ 1,769,474$ 1,879,274$ 1,994,687$ 2,115,990$ 2,243,478$ 2,377,458$ 2,518,255$ 2,666,206$ 32,133,455$
Income Tax $0 $0 $0 $0 $0 $0 $0 $0 $0 $0 $0 $0 $0 $0 $0 $0 $0 $0 $0 $0 -$
After Tax Income 799,092$ 866,423$ 931,520$ 1,002,893$ 1,081,405$ 1,156,581$ 1,243,638$ 1,331,200$ 1,411,283$ 1,496,209$ 1,583,371$ 1,665,019$ 1,769,474$ 1,879,274$ 1,994,687$ 2,115,990$ 2,243,478$ 2,377,458$ 2,518,255$ 2,666,206$ 32,133,455$
Principal -$ -$ -$ -$ -$ -$ -$ -$ -$ -$ -$ -$ -$ -$ -$ -$ -$ -$ -$ -$ -$
Net Savings $0 $799,092 $866,423 $931,520 $1,002,893 $1,081,405 $1,156,581 $1,243,638 $1,331,200 $1,411,283 $1,496,209 $1,583,371 $1,665,019 $1,769,474 $1,879,274 $1,994,687 $2,115,990 $2,243,478 $2,377,458 $2,518,255 $2,666,206 32,133,455$
Carbon Credit Cost $231,910 $231,910 $253,863 $279,843 $307,255 $335,780 $366,655 $856,150 $909,528 $967,750 $1,028,529 $1,094,599 $1,164,380 $1,232,481 $1,303,619 $1,377,943 $1,578,041 $1,788,248 $2,009,087 $2,241,110 $2,484,903 21,811,675$
Proposed Total With Carbon Credits $8,783,295 $8,783,295 $8,987,850 $9,391,757 $9,818,412 $10,248,816 $10,745,645 $11,590,898 $12,053,006 $12,591,293 $13,149,976 $13,773,471 $14,440,481 $15,044,358 $15,674,866 $16,333,245 $17,143,228 $17,990,349 $18,876,389 $19,803,218 $20,772,799 277,213,350$
20 Yr PV of Savings vs Base Case both w/Carbon Offsets
20 Yr PV Cost without Carbon Offsets
20 Yr PV Cost with Carbon Offsets
$20,168,964$20,168,964$20,168,964$20,168,964
$164,596,726$164,596,726$164,596,726$164,596,726
$177,468,100$177,468,100$177,468,100$177,468,100
20 Yr PV Cost of Carbon Offsets
$18,728,126$18,728,126$18,728,126$18,728,126
$12,871,374$12,871,374$12,871,374$12,871,374
Base Case Rates
Base Case Consumption
Electric Rate Escalation
Gas Rate Escalation
University of Maine Orono
Project:
Proposed Case Consumption
Yearly Loan PaymentEstimated Federal and State Tax Rate
-$ Installed Cost
0.0%
Gas Demand Growth
Cogeneration Feasibility Study
Inflation rate
Interest Rate
Maintenance & Operation
Energy Consumption - Base Case and Solar Generation and no Summer Steam Load - Option 1C ECONOMIC PRO FORMA
Discount Rate
Topic:
20 Yr PV of Savings vs Base Case both w/o Carbon Offsets
Savings
Length of Loan (months)
Interest Rate
Monthly Loan Payment
Inflation rate
2.5%
Proposed Case Cost
Base Case Cost
3.0%
Proposed Case Rates
Page 38
Client:
Calc By: Check By: Job No.: File Name: Sheet Name: Date:
TK BAB 25025.00 Cogeneration Analysis ver18 final. NPV 10/26/2016
Depreciation schedule 4.0%
240
3.0%
$0
$0
0 1 2 3 4 5 6 7 8 9 10 11 12 13 14 15 16 17 18 19 20
Start 2017 Year-2017 Year-2018 Year-2019 Year-2020 Year-2021 Year-2022 Year-2023 Year-2024 Year-2025 Year-2026 Year-2027 Year-2028 Year-2029 Year-2030 Year-2031 Year-2032 Year-2033 Year-2034 Year-2035 Year-2036
2.5% 2.5% 2.5% 2.5% 2.5% 2.5% 2.5% 2.5% 2.5% 2.5% 2.5% 2.5% 2.5% 2.5% 2.5% 2.5% 2.5% 2.5% 2.5% 2.5%
2.0% 2.0% 2.0% 2.0% 2.0% 2.0% 2.0% 2.0% 2.0% 2.0% 2.0% 2.0% 2.0% 2.0% 2.0% 2.0% 2.0% 2.0% 2.0% 2.0%
Electric Demand Growth 3.0% 3.0% 3.0% 3.0% 3.0% 3.0% 3.0% 3.0% 3.0% 3.0% 3.0% 3.0% 3.0% 3.0% 3.0% 3.0% 3.0% 3.0% 3.0% 3.0%
0.0% -1.9% 2.5% 2.6% 2.3% 3.2% 0.6% 1.3% 2.1% 2.0% 2.7% 2.7% 1.5% 1.5% 1.5% 1.5% 1.5% 1.5% 1.5% 1.5%
1.5% 1.5% 1.5% 1.5% 1.5% 1.5% 1.5% 1.5% 1.5% 1.5% 1.5% 1.5% 1.5% 1.5% 1.5% 1.5% 1.5% 1.5% 1.5% 1.5%
Water 2.0% 2.0% 2.0% 2.0% 2.0% 2.0% 2.0% 2.0% 2.0% 2.0% 2.0% 2.0% 2.0% 2.0% 2.0% 2.0% 2.0% 2.0% 2.0% 2.0%
Solar Generation Degradation -0.04% -0.04% -0.04% -0.04% -0.04% -0.04% -0.04% -0.04% -0.04% -0.04% -0.04% -0.04% -0.04% -0.04% -0.04% -0.04% -0.04% -0.04% -0.04% -0.04%
Solar Rate Escalation 0.0% -1.7% 1.3% 0.9% 0.2% 1.8% -0.8% 0.1% 2.3% 2.2% 2.9% 4.4% 1.2% 1.2% 1.2% 1.2% 1.2% 1.2% 1.2% 1.2%
2.5% 2.5% 2.5% 2.5% 2.5% 2.5% 2.5% 2.5% 2.5% 2.5% 2.5% 2.5% 2.5% 2.5% 2.5% 2.5% 2.5% 2.5% 2.5% 2.5%
Emissions Growth Electric 0.0% -1.9% 2.5% 2.6% 2.3% 3.2% 0.6% 1.3% 2.1% 2.0% 2.7% 2.7% 1.5% 1.5% 1.5% 1.5% 1.5% 1.5% 1.5% 1.5%
Emissions Growth Gas 0.0% 0.0% 0.0% 0.0% 0.0% 0.0% 0.0% 0.0% 0.0% 0.0% 0.0% 0.0% 0.0% 0.0% 0.0% 0.0% 0.0% 0.0% 0.0% 0.0%
Carbon Rate Escalation 0.0% 8.0% 7.4% 6.9% 6.5% 6.1% 128.6% 3.8% 3.6% 3.5% 3.4% 3.3% 3.2% 3.1% 3.0% 11.5% 10.3% 9.4% 8.6% 7.9%
Year-2017 Year-2018 Year-2019 Year-2020 Year-2021 Year-2022 Year-2023 Year-2024 Year-2025 Year-2026 Year-2027 Year-2028 Year-2029 Year-2030 Year-2031 Year-2032 Year-2033 Year-2034 Year-2035 Year-2036
ELECTRIC ($/kWh) $0.126 $0.126 $0.129 $0.131 $0.134 $0.137 $0.139 $0.142 $0.145 $0.148 $0.151 $0.154 $0.157 $0.160 $0.163 $0.166 $0.170 $0.173 $0.177 $0.180 $0.184
NATURAL GAS ($/therm) $0.791 $0.79 $0.776 $0.80 $0.82 $0.83 $0.86 $0.87 $0.88 $0.90 $0.91 $0.94 $0.96 $0.98 $0.99 $1.01 $1.03 $1.04 $1.06 $1.07 $1.09
Year-2017 Year-2018 Year-2019 Year-2020 Year-2021 Year-2022 Year-2023 Year-2024 Year-2025 Year-2026 Year-2027 Year-2028 Year-2029 Year-2030 Year-2031 Year-2032 Year-2033 Year-2034 Year-2035 Year-2036 Total
ELECTRIC (kWh) 42,178,862 42,178,862 43,444,228 44,747,555 46,089,981 47,472,681 48,896,861 50,363,767 51,874,680 53,430,920 55,033,848 56,684,863 58,385,409 60,136,972 61,941,081 63,799,313 65,713,293 67,684,691 69,715,232 71,806,689 73,960,890 1,133,361,815
GAS (Therms) 5,093,806 5,093,806 5,170,213 5,247,766 5,326,483 5,406,380 5,487,476 5,569,788 5,653,335 5,738,135 5,824,207 5,911,570 6,000,243 6,090,247 6,181,601 6,274,325 6,368,440 6,463,966 6,560,926 6,659,340 6,759,230 117,787,475
Year-2017 Year-2018 Year-2019 Year-2020 Year-2021 Year-2022 Year-2023 Year-2024 Year-2025 Year-2026 Year-2027 Year-2028 Year-2029 Year-2030 Year-2031 Year-2032 Year-2033 Year-2034 Year-2035 Year-2036 Total
ELECTRIC $5,319,176 $5,319,176 $5,588,327 $5,871,096 $6,168,173 $6,480,283 $6,808,185 $7,152,679 $7,514,605 $7,894,844 $8,294,323 $8,714,016 $9,154,945 $9,618,185 $10,104,865 $10,616,172 $11,153,350 $11,717,709 $12,310,626 $12,933,543 $13,587,981 177,003,084$
GAS $4,031,301 $4,031,301 $4,012,083 $4,172,338 $4,345,876 $4,514,157 $4,727,385 $4,825,706 $4,960,073 $5,139,981 $5,323,333 $5,548,227 $5,786,175 $5,963,166 $6,145,656 $6,333,817 $6,527,827 $6,727,870 $6,934,135 $7,146,819 $7,366,122 110,532,046$
BASE CASE TOTAL $9,350,477 9,350,477$ 9,600,410$ 10,043,434$ 10,514,050$ 10,994,440$ 11,535,570$ 11,978,386$ 12,474,678$ 13,034,825$ 13,617,656$ 14,262,243$ 14,941,120$ 15,581,351$ 16,250,521$ 16,949,988$ 17,681,177$ 18,445,579$ 19,244,761$ 20,080,362$ 20,954,103$ 287,535,131$
Year-2017 Year-2018 Year-2019 Year-2020 Year-2021 Year-2022 Year-2023 Year-2024 Year-2025 Year-2026 Year-2027 Year-2028 Year-2029 Year-2030 Year-2031 Year-2032 Year-2033 Year-2034 Year-2035 Year-2036
ELECTRIC ($/kWh) $0.126 $0.126 $0.129 $0.131 $0.134 $0.137 $0.139 $0.142 $0.145 $0.148 $0.151 $0.154 $0.157 $0.160 $0.163 $0.166 $0.170 $0.173 $0.177 $0.180 $0.184
NATURAL GAS ($/therm) $0.768 $0.77 $0.75 $0.77 $0.79 $0.81 $0.84 $0.84 $0.85 $0.87 $0.89 $0.91 $0.94 $0.95 $0.96 $0.98 $0.99 $1.01 $1.03 $1.04 $1.06
WATER ($/CCF) $0.860 $0.86 $0.88 $0.89 $0.91 $0.93 $0.95 $0.97 $0.99 $1.01 $1.03 $1.05 $1.07 $1.09 $1.11 $1.13 $1.16 $1.18 $1.20 $1.23 $1.25
SOLAR ($/kWh) $0.068 $0.07 $0.07 $0.07 $0.07 $0.07 $0.07 $0.07 $0.07 $0.07 $0.07 $0.07 $0.08 $0.08 $0.08 $0.08 $0.08 $0.08 $0.08 $0.08 $0.09
CARBON CREDIT ($/Short Ton) $6.25 $6.25 $6.75 $7.25 $7.75 $8.25 $8.75 $20.00 $20.75 $21.50 $22.25 $23.00 $23.75 $24.50 $25.25 $26.00 $29.00 $32.00 $35.00 $38.00 $41.00
Year-2017 Year-2018 Year-2019 Year-2020 Year-2021 Year-2022 Year-2023 Year-2024 Year-2025 Year-2026 Year-2027 Year-2028 Year-2029 Year-2030 Year-2031 Year-2032 Year-2033 Year-2034 Year-2035 Year-2036 Total
PURCHASED ELECTRIC (kWh) 13,179,387 13,179,387 13,574,769 13,982,012 14,401,472 14,833,516 15,278,522 15,736,878 16,208,984 16,695,253 17,196,111 17,711,994 18,243,354 18,790,655 19,354,374 19,935,006 20,533,056 21,149,047 21,783,519 22,437,024 23,110,135 354,135,069
PURCHASED SOLAR (kWh) 0 0 0 0 0 0 0 0 0 0 0 0 0 0 0 0 0 0 0 0 0 0
COGEN + BOILER GAS (Therms) 7,229,836 7,229,836 7,338,283 7,448,358 7,560,083 7,673,484 7,788,586 7,905,415 8,023,996 8,144,356 8,266,522 8,390,520 8,516,377 8,644,123 8,773,785 8,905,392 9,038,973 9,174,557 9,312,176 9,451,858 9,593,636 167,180,316
WATER (Gallons) 0 0 0 0 0 0 0 0 0 0 0 0 0 0 0 0 0 0 0 0 0 0
Short Ton CO2 Electric Consumption 4,152 4,152 4,193 4,425 4,677 4,930 5,239 5,427 5,660 5,952 6,256 6,616 7,002 7,323 7,659 8,010 8,377 8,761 9,164 9,584 10,024 133,431
Short Ton CO2 Gas Consumption 42,298 42,298 42,933 43,577 44,230 44,894 45,567 46,251 46,944 47,649 48,363 49,089 49,825 50,572 51,331 52,101 52,883 53,676 54,481 55,298 56,128 978,088
Year-2017 Year-2018 Year-2019 Year-2020 Year-2021 Year-2022 Year-2023 Year-2024 Year-2025 Year-2026 Year-2027 Year-2028 Year-2029 Year-2030 Year-2031 Year-2032 Year-2033 Year-2034 Year-2035 Year-2036 Total
ELECTRIC $1,662,053 $1,662,053 $1,746,152 $1,834,508 $1,927,334 $2,024,857 $2,127,315 $2,234,957 $2,348,046 $2,466,857 $2,591,680 $2,722,819 $2,860,593 $3,005,339 $3,157,409 $3,317,174 $3,485,023 $3,661,366 $3,846,631 $4,041,270 $4,245,758 55,307,139$
SOLAR $0 $0 $0 $0 $0 $0 $0 $0 $0 $0 $0 $0 $0 $0 $0 $0 $0 $0 $0 $0 $0 -$
GAS $5,549,227 $5,549,227 $5,522,773 $5,743,370 $5,982,251 $6,213,896 $6,507,412 $6,642,754 $6,827,714 $7,075,364 $7,327,754 $7,637,329 $7,964,873 $8,208,507 $8,459,711 $8,718,721 $8,985,782 $9,261,149 $9,545,080 $9,837,847 $10,139,726 152,151,241$
MAINTENANCE $347,400 $347,400 $356,085 $364,987 $374,112 $383,465 $393,051 $402,877 $412,949 $423,273 $433,855 $444,701 $455,819 $467,214 $478,895 $490,867 $503,139 $515,717 $528,610 $541,825 $555,371 8,874,214$
STAFFING $300,000 $300,000 $307,500 $315,188 $323,067 $331,144 $339,422 $347,908 $356,606 $365,521 $374,659 $384,025 $393,626 $403,467 $413,553 $423,892 $434,489 $445,352 $456,485 $467,898 $479,595 7,663,397$
Other $0 $0 $0 $0 $0 $0 $0 $0 $0 $0 $0 $0 $0 $0 $0 $0 $0 $0 $0 $0 $0 -$
WATER $0 $0 $0 $0 $0 $0 $0 $0 $0 $0 $0 $0 $0 $0 $0 $0 $0 $0 $0 $0 $0 -$
PROPOSED CASE TOTAL 7,858,679$ 7,858,679$ 7,932,511$ 8,258,052$ 8,606,764$ 8,953,362$ 9,367,200$ 9,628,497$ 9,945,315$ 10,331,015$ 10,727,948$ 11,188,874$ 11,674,911$ 12,084,528$ 12,509,568$ 12,950,654$ 13,408,434$ 13,883,583$ 14,376,806$ 14,888,840$ 15,420,450$ 223,995,991$
Year-2017 Year-2018 Year-2019 Year-2020 Year-2021 Year-2022 Year-2023 Year-2024 Year-2025 Year-2026 Year-2027 Year-2028 Year-2029 Year-2030 Year-2031 Year-2032 Year-2033 Year-2034 Year-2035 Year-2036 Total
Net Energy Savings 1,491,798$ 1,491,798$ 1,667,899$ 1,785,382$ 1,907,286$ 2,041,079$ 2,168,371$ 2,349,889$ 2,529,363$ 2,703,810$ 2,889,708$ 3,073,368$ 3,266,209$ 3,496,824$ 3,740,953$ 3,999,334$ 4,272,743$ 4,561,996$ 4,867,954$ 5,191,522$ 5,533,652$ 63,539,140$
Depreciation -$ -$ -$ -$ -$ -$ -$ -$ -$
Interest -$ -$ -$ -$ -$ -$ -$ -$ -$ -$ -$ -$ -$ -$ -$ -$ -$ -$ -$ -$ -$
Net Taxable Income 1,491,798$ 1,667,899$ 1,785,382$ 1,907,286$ 2,041,079$ 2,168,371$ 2,349,889$ 2,529,363$ 2,703,810$ 2,889,708$ 3,073,368$ 3,266,209$ 3,496,824$ 3,740,953$ 3,999,334$ 4,272,743$ 4,561,996$ 4,867,954$ 5,191,522$ 5,533,652$ 63,539,140$
Income Tax $0 $0 $0 $0 $0 $0 $0 $0 $0 $0 $0 $0 $0 $0 $0 $0 $0 $0 $0 $0 -$
After Tax Income 1,491,798$ 1,667,899$ 1,785,382$ 1,907,286$ 2,041,079$ 2,168,371$ 2,349,889$ 2,529,363$ 2,703,810$ 2,889,708$ 3,073,368$ 3,266,209$ 3,496,824$ 3,740,953$ 3,999,334$ 4,272,743$ 4,561,996$ 4,867,954$ 5,191,522$ 5,533,652$ 63,539,140$
Principal -$ -$ -$ -$ -$ -$ -$ -$ -$ -$ -$ -$ -$ -$ -$ -$ -$ -$ -$ -$ -$
Net Savings $0 $1,491,798 $1,667,899 $1,785,382 $1,907,286 $2,041,079 $2,168,371 $2,349,889 $2,529,363 $2,703,810 $2,889,708 $3,073,368 $3,266,209 $3,496,824 $3,740,953 $3,999,334 $4,272,743 $4,561,996 $4,867,954 $5,191,522 $5,533,652 63,539,140$
Carbon Credit Cost $290,310 $290,310 $318,096 $348,009 $379,030 $411,043 $444,552 $1,033,550 $1,091,549 $1,152,420 $1,215,275 $1,281,220 $1,349,648 $1,418,439 $1,489,490 $1,562,881 $1,776,530 $1,997,991 $2,227,555 $2,465,526 $2,712,225 24,965,342$
Proposed Total With Carbon Credits $8,148,990 $8,148,990 $8,250,607 $8,606,062 $8,985,794 $9,364,405 $9,811,752 $10,662,046 $11,036,864 $11,483,436 $11,943,223 $12,470,094 $13,024,559 $13,502,967 $13,999,059 $14,513,536 $15,184,964 $15,881,574 $16,604,361 $17,354,366 $18,132,675 248,961,333$
20 Yr PV of Savings vs Base Case both w/Carbon Offsets
20 Yr PV Cost without Carbon Offsets
20 Yr PV Cost with Carbon Offsets
$39,604,486$39,604,486$39,604,486$39,604,486
$145,161,204$145,161,204$145,161,204$145,161,204
$160,007,621$160,007,621$160,007,621$160,007,621
20 Yr PV Cost of Carbon Offsets
$36,188,605$36,188,605$36,188,605$36,188,605
$14,846,417$14,846,417$14,846,417$14,846,417
Base Case Rates
Base Case Consumption
Electric Rate Escalation
Gas Rate Escalation
University of Maine Orono
Project:
Proposed Case Consumption
Yearly Loan PaymentEstimated Federal and State Tax Rate
-$ Installed Cost
0.0%
Gas Demand Growth
Cogeneration Feasibility Study
Inflation rate
Interest Rate
Maintenance & Operation
Energy Consumption - CHP Plant at the East Campus with Thermal Load Following - Option 2A ECONOMIC PRO FORMA
Discount Rate
Topic:
20 Yr PV of Savings vs Base Case both w/o Carbon Offsets
Savings
Length of Loan (months)
Interest Rate
Monthly Loan Payment
Inflation rate
2.5%
Proposed Case Cost
Base Case Cost
3.0%
Proposed Case Rates
Page 39
Client:
Calc By: Check By: Job No.: File Name: Sheet Name: Date:
TK BAB 25025.00 Cogeneration Analysis ver18 final. NPV 10/26/2016
Depreciation schedule 4.0%
240
3.0%
$0
$0
0 1 2 3 4 5 6 7 8 9 10 11 12 13 14 15 16 17 18 19 20
Start 2017 Year-2017 Year-2018 Year-2019 Year-2020 Year-2021 Year-2022 Year-2023 Year-2024 Year-2025 Year-2026 Year-2027 Year-2028 Year-2029 Year-2030 Year-2031 Year-2032 Year-2033 Year-2034 Year-2035 Year-2036
2.5% 2.5% 2.5% 2.5% 2.5% 2.5% 2.5% 2.5% 2.5% 2.5% 2.5% 2.5% 2.5% 2.5% 2.5% 2.5% 2.5% 2.5% 2.5% 2.5%
2.0% 2.0% 2.0% 2.0% 2.0% 2.0% 2.0% 2.0% 2.0% 2.0% 2.0% 2.0% 2.0% 2.0% 2.0% 2.0% 2.0% 2.0% 2.0% 2.0%
Electric Demand Growth 3.0% 3.0% 3.0% 3.0% 3.0% 3.0% 3.0% 3.0% 3.0% 3.0% 3.0% 3.0% 3.0% 3.0% 3.0% 3.0% 3.0% 3.0% 3.0% 3.0%
0.0% -1.9% 2.5% 2.6% 2.3% 3.2% 0.6% 1.3% 2.1% 2.0% 2.7% 2.7% 1.5% 1.5% 1.5% 1.5% 1.5% 1.5% 1.5% 1.5%
1.5% 1.5% 1.5% 1.5% 1.5% 1.5% 1.5% 1.5% 1.5% 1.5% 1.5% 1.5% 1.5% 1.5% 1.5% 1.5% 1.5% 1.5% 1.5% 1.5%
Water 2.0% 2.0% 2.0% 2.0% 2.0% 2.0% 2.0% 2.0% 2.0% 2.0% 2.0% 2.0% 2.0% 2.0% 2.0% 2.0% 2.0% 2.0% 2.0% 2.0%
Solar Generation Degradation -0.04% -0.04% -0.04% -0.04% -0.04% -0.04% -0.04% -0.04% -0.04% -0.04% -0.04% -0.04% -0.04% -0.04% -0.04% -0.04% -0.04% -0.04% -0.04% -0.04%
Solar Rate Escalation 0.0% -1.7% 1.3% 0.9% 0.2% 1.8% -0.8% 0.1% 2.3% 2.2% 2.9% 4.4% 1.2% 1.2% 1.2% 1.2% 1.2% 1.2% 1.2% 1.2%
2.5% 2.5% 2.5% 2.5% 2.5% 2.5% 2.5% 2.5% 2.5% 2.5% 2.5% 2.5% 2.5% 2.5% 2.5% 2.5% 2.5% 2.5% 2.5% 2.5%
Emissions Growth Electric 0.0% -1.9% 2.5% 2.6% 2.3% 3.2% 0.6% 1.3% 2.1% 2.0% 2.7% 2.7% 1.5% 1.5% 1.5% 1.5% 1.5% 1.5% 1.5% 1.5%
Emissions Growth Gas 0.0% 0.0% 0.0% 0.0% 0.0% 0.0% 0.0% 0.0% 0.0% 0.0% 0.0% 0.0% 0.0% 0.0% 0.0% 0.0% 0.0% 0.0% 0.0% 0.0%
Carbon Rate Escalation 0.0% 8.0% 7.4% 6.9% 6.5% 6.1% 128.6% 3.8% 3.6% 3.5% 3.4% 3.3% 3.2% 3.1% 3.0% 11.5% 10.3% 9.4% 8.6% 7.9%
Year-2017 Year-2018 Year-2019 Year-2020 Year-2021 Year-2022 Year-2023 Year-2024 Year-2025 Year-2026 Year-2027 Year-2028 Year-2029 Year-2030 Year-2031 Year-2032 Year-2033 Year-2034 Year-2035 Year-2036
ELECTRIC ($/kWh) $0.126 $0.126 $0.129 $0.131 $0.134 $0.137 $0.139 $0.142 $0.145 $0.148 $0.151 $0.154 $0.157 $0.160 $0.163 $0.166 $0.170 $0.173 $0.177 $0.180 $0.184
NATURAL GAS ($/therm) $0.791 $0.79 $0.776 $0.80 $0.82 $0.83 $0.86 $0.87 $0.88 $0.90 $0.91 $0.94 $0.96 $0.98 $0.99 $1.01 $1.03 $1.04 $1.06 $1.07 $1.09
Year-2017 Year-2018 Year-2019 Year-2020 Year-2021 Year-2022 Year-2023 Year-2024 Year-2025 Year-2026 Year-2027 Year-2028 Year-2029 Year-2030 Year-2031 Year-2032 Year-2033 Year-2034 Year-2035 Year-2036 Total
ELECTRIC (kWh) 42,178,862 42,178,862 43,444,228 44,747,555 46,089,981 47,472,681 48,896,861 50,363,767 51,874,680 53,430,920 55,033,848 56,684,863 58,385,409 60,136,972 61,941,081 63,799,313 65,713,293 67,684,691 69,715,232 71,806,689 73,960,890 1,133,361,815
GAS (Therms) 5,093,806 5,093,806 5,170,213 5,247,766 5,326,483 5,406,380 5,487,476 5,569,788 5,653,335 5,738,135 5,824,207 5,911,570 6,000,243 6,090,247 6,181,601 6,274,325 6,368,440 6,463,966 6,560,926 6,659,340 6,759,230 117,787,475
Year-2017 Year-2018 Year-2019 Year-2020 Year-2021 Year-2022 Year-2023 Year-2024 Year-2025 Year-2026 Year-2027 Year-2028 Year-2029 Year-2030 Year-2031 Year-2032 Year-2033 Year-2034 Year-2035 Year-2036 Total
ELECTRIC $5,319,176 $5,319,176 $5,588,327 $5,871,096 $6,168,173 $6,480,283 $6,808,185 $7,152,679 $7,514,605 $7,894,844 $8,294,323 $8,714,016 $9,154,945 $9,618,185 $10,104,865 $10,616,172 $11,153,350 $11,717,709 $12,310,626 $12,933,543 $13,587,981 177,003,084$
GAS $4,031,301 $4,031,301 $4,012,083 $4,172,338 $4,345,876 $4,514,157 $4,727,385 $4,825,706 $4,960,073 $5,139,981 $5,323,333 $5,548,227 $5,786,175 $5,963,166 $6,145,656 $6,333,817 $6,527,827 $6,727,870 $6,934,135 $7,146,819 $7,366,122 110,532,046$
BASE CASE TOTAL $9,350,477 9,350,477$ 9,600,410$ 10,043,434$ 10,514,050$ 10,994,440$ 11,535,570$ 11,978,386$ 12,474,678$ 13,034,825$ 13,617,656$ 14,262,243$ 14,941,120$ 15,581,351$ 16,250,521$ 16,949,988$ 17,681,177$ 18,445,579$ 19,244,761$ 20,080,362$ 20,954,103$ 287,535,131$
Year-2017 Year-2018 Year-2019 Year-2020 Year-2021 Year-2022 Year-2023 Year-2024 Year-2025 Year-2026 Year-2027 Year-2028 Year-2029 Year-2030 Year-2031 Year-2032 Year-2033 Year-2034 Year-2035 Year-2036
ELECTRIC ($/kWh) $0.126 $0.126 $0.129 $0.131 $0.134 $0.137 $0.139 $0.142 $0.145 $0.148 $0.151 $0.154 $0.157 $0.160 $0.163 $0.166 $0.170 $0.173 $0.177 $0.180 $0.184
NATURAL GAS ($/therm) $0.774 $0.77 $0.76 $0.78 $0.80 $0.82 $0.84 $0.85 $0.86 $0.88 $0.89 $0.92 $0.94 $0.96 $0.97 $0.99 $1.00 $1.02 $1.03 $1.05 $1.07
WATER ($/CCF) $0.860 $0.86 $0.88 $0.89 $0.91 $0.93 $0.95 $0.97 $0.99 $1.01 $1.03 $1.05 $1.07 $1.09 $1.11 $1.13 $1.16 $1.18 $1.20 $1.23 $1.25
SOLAR ($/kWh) $0.068 $0.07 $0.07 $0.07 $0.07 $0.07 $0.07 $0.07 $0.07 $0.07 $0.07 $0.07 $0.08 $0.08 $0.08 $0.08 $0.08 $0.08 $0.08 $0.08 $0.09
CARBON CREDIT ($/Short Ton) $6.25 $6.25 $6.75 $7.25 $7.75 $8.25 $8.75 $20.00 $20.75 $21.50 $22.25 $23.00 $23.75 $24.50 $25.25 $26.00 $29.00 $32.00 $35.00 $38.00 $41.00
Year-2017 Year-2018 Year-2019 Year-2020 Year-2021 Year-2022 Year-2023 Year-2024 Year-2025 Year-2026 Year-2027 Year-2028 Year-2029 Year-2030 Year-2031 Year-2032 Year-2033 Year-2034 Year-2035 Year-2036 Total
PURCHASED ELECTRIC (kWh) 13,760,986 13,760,986 14,173,816 14,599,030 15,037,001 15,488,111 15,952,754 16,431,337 16,924,277 17,432,005 17,954,965 18,493,614 19,048,423 19,619,876 20,208,472 20,814,726 21,439,168 22,082,343 22,744,813 23,427,157 24,129,972 369,762,847
PURCHASED SOLAR (kWh) 0 0 0 0 0 0 0 0 0 0 0 0 0 0 0 0 0 0 0 0 0 0
COGEN + BOILER GAS (Therms) 7,015,783 7,015,783 7,121,019 7,227,835 7,336,252 7,446,296 7,557,990 7,671,360 7,786,431 7,903,227 8,021,776 8,142,102 8,264,234 8,388,197 8,514,020 8,641,731 8,771,356 8,902,927 9,036,471 9,172,018 9,309,598 162,230,623
WATER (Gallons) 0 0 0 0 0 0 0 0 0 0 0 0 0 0 0 0 0 0 0 0 0 0
Short Ton CO2 Electric Consumption 4,335 4,335 4,378 4,620 4,883 5,147 5,470 5,666 5,910 6,215 6,532 6,908 7,311 7,646 7,997 8,363 8,747 9,148 9,568 10,007 10,467 139,319
Short Ton CO2 Gas Consumption 41,046 41,046 41,662 42,286 42,921 43,565 44,218 44,881 45,555 46,238 46,931 47,635 48,350 49,075 49,811 50,558 51,317 52,087 52,868 53,661 54,466 949,130
Year-2017 Year-2018 Year-2019 Year-2020 Year-2021 Year-2022 Year-2023 Year-2024 Year-2025 Year-2026 Year-2027 Year-2028 Year-2029 Year-2030 Year-2031 Year-2032 Year-2033 Year-2034 Year-2035 Year-2036 Total
ELECTRIC $1,735,398 $1,735,398 $1,823,209 $1,915,463 $2,012,386 $2,114,213 $2,221,192 $2,333,584 $2,451,663 $2,575,718 $2,706,049 $2,842,975 $2,986,830 $3,137,963 $3,296,744 $3,463,559 $3,638,815 $3,822,939 $4,016,380 $4,219,609 $4,433,121 57,747,811$
SOLAR $0 $0 $0 $0 $0 $0 $0 $0 $0 $0 $0 $0 $0 $0 $0 $0 $0 $0 $0 $0 $0 -$
GAS $5,428,558 $5,428,558 $5,402,680 $5,618,480 $5,852,167 $6,078,774 $6,365,907 $6,498,307 $6,679,244 $6,921,510 $7,168,411 $7,471,254 $7,791,676 $8,030,012 $8,275,754 $8,529,131 $8,790,386 $9,059,764 $9,337,521 $9,623,922 $9,919,236 148,842,694$
MAINTENANCE $347,400 $347,400 $356,085 $364,987 $374,112 $383,465 $393,051 $402,877 $412,949 $423,273 $433,855 $444,701 $455,819 $467,214 $478,895 $490,867 $503,139 $515,717 $528,610 $541,825 $555,371 8,874,214$
STAFFING $300,000 $300,000 $307,500 $315,188 $323,067 $331,144 $339,422 $347,908 $356,606 $365,521 $374,659 $384,025 $393,626 $403,467 $413,553 $423,892 $434,489 $445,352 $456,485 $467,898 $479,595 7,663,397$
Other $0 $0 $0 $0 $0 $0 $0 $0 $0 $0 $0 $0 $0 $0 $0 $0 $0 $0 $0 $0 $0 -$
WATER $0 $0 $0 $0 $0 $0 $0 $0 $0 $0 $0 $0 $0 $0 $0 $0 $0 $0 $0 $0 $0 -$
PROPOSED CASE TOTAL 7,811,356$ 7,811,356$ 7,889,474$ 8,214,118$ 8,561,731$ 8,907,595$ 9,319,573$ 9,582,676$ 9,900,463$ 10,286,021$ 10,682,974$ 11,142,956$ 11,627,950$ 12,038,657$ 12,464,946$ 12,907,450$ 13,366,829$ 13,843,772$ 14,338,997$ 14,853,254$ 15,387,324$ 223,128,117$
Year-2017 Year-2018 Year-2019 Year-2020 Year-2021 Year-2022 Year-2023 Year-2024 Year-2025 Year-2026 Year-2027 Year-2028 Year-2029 Year-2030 Year-2031 Year-2032 Year-2033 Year-2034 Year-2035 Year-2036 Total
Net Energy Savings 1,539,121$ 1,539,121$ 1,710,936$ 1,829,316$ 1,952,318$ 2,086,845$ 2,215,998$ 2,395,709$ 2,574,214$ 2,748,804$ 2,934,682$ 3,119,287$ 3,313,170$ 3,542,695$ 3,785,576$ 4,042,538$ 4,314,347$ 4,601,807$ 4,905,763$ 5,227,108$ 5,566,779$ 64,407,014$
Depreciation -$ -$ -$ -$ -$ -$ -$ -$ -$
Interest -$ -$ -$ -$ -$ -$ -$ -$ -$ -$ -$ -$ -$ -$ -$ -$ -$ -$ -$ -$ -$
Net Taxable Income 1,539,121$ 1,710,936$ 1,829,316$ 1,952,318$ 2,086,845$ 2,215,998$ 2,395,709$ 2,574,214$ 2,748,804$ 2,934,682$ 3,119,287$ 3,313,170$ 3,542,695$ 3,785,576$ 4,042,538$ 4,314,347$ 4,601,807$ 4,905,763$ 5,227,108$ 5,566,779$ 64,407,014$
Income Tax $0 $0 $0 $0 $0 $0 $0 $0 $0 $0 $0 $0 $0 $0 $0 $0 $0 $0 $0 $0 -$
After Tax Income 1,539,121$ 1,710,936$ 1,829,316$ 1,952,318$ 2,086,845$ 2,215,998$ 2,395,709$ 2,574,214$ 2,748,804$ 2,934,682$ 3,119,287$ 3,313,170$ 3,542,695$ 3,785,576$ 4,042,538$ 4,314,347$ 4,601,807$ 4,905,763$ 5,227,108$ 5,566,779$ 64,407,014$
Principal -$ -$ -$ -$ -$ -$ -$ -$ -$ -$ -$ -$ -$ -$ -$ -$ -$ -$ -$ -$ -$
Net Savings $0 $1,539,121 $1,710,936 $1,829,316 $1,952,318 $2,086,845 $2,215,998 $2,395,709 $2,574,214 $2,748,804 $2,934,682 $3,119,287 $3,313,170 $3,542,695 $3,785,576 $4,042,538 $4,314,347 $4,601,807 $4,905,763 $5,227,108 $5,566,779 64,407,014$
Carbon Credit Cost $283,628 $283,628 $310,765 $340,071 $370,481 $401,872 $434,771 $1,010,953 $1,067,893 $1,127,737 $1,189,558 $1,254,508 $1,321,951 $1,389,673 $1,459,650 $1,531,965 $1,741,846 $1,959,510 $2,185,253 $2,419,384 $2,662,229 24,463,700$
Proposed Total With Carbon Credits $8,094,985 $8,094,985 $8,200,240 $8,554,189 $8,932,212 $9,309,468 $9,754,343 $10,593,629 $10,968,356 $11,413,759 $11,872,532 $12,397,464 $12,949,901 $13,428,330 $13,924,596 $14,439,415 $15,108,675 $15,803,282 $16,524,250 $17,272,638 $18,049,553 247,591,817$
20 Yr PV of Savings vs Base Case both w/Carbon Offsets
20 Yr PV Cost without Carbon Offsets
20 Yr PV Cost with Carbon Offsets
$40,201,964$40,201,964$40,201,964$40,201,964
$144,563,725$144,563,725$144,563,725$144,563,725
$159,107,935$159,107,935$159,107,935$159,107,935
20 Yr PV Cost of Carbon Offsets
$37,088,292$37,088,292$37,088,292$37,088,292
$14,544,209$14,544,209$14,544,209$14,544,209
Base Case Rates
Base Case Consumption
Electric Rate Escalation
Gas Rate Escalation
University of Maine Orono
Project:
Proposed Case Consumption
Yearly Loan PaymentEstimated Federal and State Tax Rate
-$ Installed Cost
0.0%
Gas Demand Growth
Cogeneration Feasibility Study
Inflation rate
Interest Rate
Maintenance & Operation
Energy Consumption - CHP Plant at the East Campus with Thermal Load Following and no Summer Steam Load - Option 2B ECONOMIC PRO FORMA
Discount Rate
Topic:
20 Yr PV of Savings vs Base Case both w/o Carbon Offsets
Savings
Length of Loan (months)
Interest Rate
Monthly Loan Payment
Inflation rate
2.5%
Proposed Case Cost
Base Case Cost
3.0%
Proposed Case Rates
Page 40
Client:
Calc By: Check By: Job No.: File Name: Sheet Name: Date:
TK BAB 25025.00 Cogeneration Analysis ver18 final. NPV 10/26/2016
Depreciation schedule 4.0%
240
3.0%
$0
$0
0 1 2 3 4 5 6 7 8 9 10 11 12 13 14 15 16 17 18 19 20
Start 2017 Year-2017 Year-2018 Year-2019 Year-2020 Year-2021 Year-2022 Year-2023 Year-2024 Year-2025 Year-2026 Year-2027 Year-2028 Year-2029 Year-2030 Year-2031 Year-2032 Year-2033 Year-2034 Year-2035 Year-2036
2.5% 2.5% 2.5% 2.5% 2.5% 2.5% 2.5% 2.5% 2.5% 2.5% 2.5% 2.5% 2.5% 2.5% 2.5% 2.5% 2.5% 2.5% 2.5% 2.5%
2.0% 2.0% 2.0% 2.0% 2.0% 2.0% 2.0% 2.0% 2.0% 2.0% 2.0% 2.0% 2.0% 2.0% 2.0% 2.0% 2.0% 2.0% 2.0% 2.0%
Electric Demand Growth 3.0% 3.0% 3.0% 3.0% 3.0% 3.0% 3.0% 3.0% 3.0% 3.0% 3.0% 3.0% 3.0% 3.0% 3.0% 3.0% 3.0% 3.0% 3.0% 3.0%
0.0% -1.9% 2.5% 2.6% 2.3% 3.2% 0.6% 1.3% 2.1% 2.0% 2.7% 2.7% 1.5% 1.5% 1.5% 1.5% 1.5% 1.5% 1.5% 1.5%
1.5% 1.5% 1.5% 1.5% 1.5% 1.5% 1.5% 1.5% 1.5% 1.5% 1.5% 1.5% 1.5% 1.5% 1.5% 1.5% 1.5% 1.5% 1.5% 1.5%
Water 2.0% 2.0% 2.0% 2.0% 2.0% 2.0% 2.0% 2.0% 2.0% 2.0% 2.0% 2.0% 2.0% 2.0% 2.0% 2.0% 2.0% 2.0% 2.0% 2.0%
Solar Generation Degradation -0.04% -0.04% -0.04% -0.04% -0.04% -0.04% -0.04% -0.04% -0.04% -0.04% -0.04% -0.04% -0.04% -0.04% -0.04% -0.04% -0.04% -0.04% -0.04% -0.04%
Solar Rate Escalation 0.0% -1.7% 1.3% 0.9% 0.2% 1.8% -0.8% 0.1% 2.3% 2.2% 2.9% 4.4% 1.2% 1.2% 1.2% 1.2% 1.2% 1.2% 1.2% 1.2%
2.5% 2.5% 2.5% 2.5% 2.5% 2.5% 2.5% 2.5% 2.5% 2.5% 2.5% 2.5% 2.5% 2.5% 2.5% 2.5% 2.5% 2.5% 2.5% 2.5%
Emissions Growth Electric 0.0% -1.9% 2.5% 2.6% 2.3% 3.2% 0.6% 1.3% 2.1% 2.0% 2.7% 2.7% 1.5% 1.5% 1.5% 1.5% 1.5% 1.5% 1.5% 1.5%
Emissions Growth Gas 0.0% 0.0% 0.0% 0.0% 0.0% 0.0% 0.0% 0.0% 0.0% 0.0% 0.0% 0.0% 0.0% 0.0% 0.0% 0.0% 0.0% 0.0% 0.0% 0.0%
Carbon Rate Escalation 0.0% 8.0% 7.4% 6.9% 6.5% 6.1% 128.6% 3.8% 3.6% 3.5% 3.4% 3.3% 3.2% 3.1% 3.0% 11.5% 10.3% 9.4% 8.6% 7.9%
Year-2017 Year-2018 Year-2019 Year-2020 Year-2021 Year-2022 Year-2023 Year-2024 Year-2025 Year-2026 Year-2027 Year-2028 Year-2029 Year-2030 Year-2031 Year-2032 Year-2033 Year-2034 Year-2035 Year-2036
ELECTRIC ($/kWh) $0.126 $0.126 $0.129 $0.131 $0.134 $0.137 $0.139 $0.142 $0.145 $0.148 $0.151 $0.154 $0.157 $0.160 $0.163 $0.166 $0.170 $0.173 $0.177 $0.180 $0.184
NATURAL GAS ($/therm) $0.791 $0.79 $0.776 $0.80 $0.82 $0.83 $0.86 $0.87 $0.88 $0.90 $0.91 $0.94 $0.96 $0.98 $0.99 $1.01 $1.03 $1.04 $1.06 $1.07 $1.09
Year-2017 Year-2018 Year-2019 Year-2020 Year-2021 Year-2022 Year-2023 Year-2024 Year-2025 Year-2026 Year-2027 Year-2028 Year-2029 Year-2030 Year-2031 Year-2032 Year-2033 Year-2034 Year-2035 Year-2036 Total
ELECTRIC (kWh) 42,178,862 42,178,862 43,444,228 44,747,555 46,089,981 47,472,681 48,896,861 50,363,767 51,874,680 53,430,920 55,033,848 56,684,863 58,385,409 60,136,972 61,941,081 63,799,313 65,713,293 67,684,691 69,715,232 71,806,689 73,960,890 1,133,361,815
GAS (Therms) 5,093,806 5,093,806 5,170,213 5,247,766 5,326,483 5,406,380 5,487,476 5,569,788 5,653,335 5,738,135 5,824,207 5,911,570 6,000,243 6,090,247 6,181,601 6,274,325 6,368,440 6,463,966 6,560,926 6,659,340 6,759,230 117,787,475
Year-2017 Year-2018 Year-2019 Year-2020 Year-2021 Year-2022 Year-2023 Year-2024 Year-2025 Year-2026 Year-2027 Year-2028 Year-2029 Year-2030 Year-2031 Year-2032 Year-2033 Year-2034 Year-2035 Year-2036 Total
ELECTRIC $5,319,176 $5,319,176 $5,588,327 $5,871,096 $6,168,173 $6,480,283 $6,808,185 $7,152,679 $7,514,605 $7,894,844 $8,294,323 $8,714,016 $9,154,945 $9,618,185 $10,104,865 $10,616,172 $11,153,350 $11,717,709 $12,310,626 $12,933,543 $13,587,981 177,003,084$
GAS $4,031,301 $4,031,301 $4,012,083 $4,172,338 $4,345,876 $4,514,157 $4,727,385 $4,825,706 $4,960,073 $5,139,981 $5,323,333 $5,548,227 $5,786,175 $5,963,166 $6,145,656 $6,333,817 $6,527,827 $6,727,870 $6,934,135 $7,146,819 $7,366,122 110,532,046$
BASE CASE TOTAL $9,350,477 9,350,477$ 9,600,410$ 10,043,434$ 10,514,050$ 10,994,440$ 11,535,570$ 11,978,386$ 12,474,678$ 13,034,825$ 13,617,656$ 14,262,243$ 14,941,120$ 15,581,351$ 16,250,521$ 16,949,988$ 17,681,177$ 18,445,579$ 19,244,761$ 20,080,362$ 20,954,103$ 287,535,131$
Year-2017 Year-2018 Year-2019 Year-2020 Year-2021 Year-2022 Year-2023 Year-2024 Year-2025 Year-2026 Year-2027 Year-2028 Year-2029 Year-2030 Year-2031 Year-2032 Year-2033 Year-2034 Year-2035 Year-2036
ELECTRIC ($/kWh) $0.126 $0.126 $0.129 $0.131 $0.134 $0.137 $0.139 $0.142 $0.145 $0.148 $0.151 $0.154 $0.157 $0.160 $0.163 $0.166 $0.170 $0.173 $0.177 $0.180 $0.184
NATURAL GAS ($/therm) $0.767 $0.77 $0.75 $0.77 $0.79 $0.81 $0.84 $0.84 $0.85 $0.87 $0.89 $0.91 $0.94 $0.95 $0.96 $0.98 $0.99 $1.01 $1.02 $1.04 $1.06
WATER ($/CCF) $0.860 $0.86 $0.88 $0.89 $0.91 $0.93 $0.95 $0.97 $0.99 $1.01 $1.03 $1.05 $1.07 $1.09 $1.11 $1.13 $1.16 $1.18 $1.20 $1.23 $1.25
SOLAR ($/kWh) $0.068 $0.07 $0.07 $0.07 $0.07 $0.07 $0.07 $0.07 $0.07 $0.07 $0.07 $0.07 $0.08 $0.08 $0.08 $0.08 $0.08 $0.08 $0.08 $0.08 $0.09
CARBON CREDIT ($/Short Ton) $6.25 $6.25 $6.75 $7.25 $7.75 $8.25 $8.75 $20.00 $20.75 $21.50 $22.25 $23.00 $23.75 $24.50 $25.25 $26.00 $29.00 $32.00 $35.00 $38.00 $41.00
Year-2017 Year-2018 Year-2019 Year-2020 Year-2021 Year-2022 Year-2023 Year-2024 Year-2025 Year-2026 Year-2027 Year-2028 Year-2029 Year-2030 Year-2031 Year-2032 Year-2033 Year-2034 Year-2035 Year-2036 Total
PURCHASED ELECTRIC (kWh) 11,452,904 11,452,904 11,796,491 12,150,386 12,514,897 12,890,344 13,277,055 13,675,366 14,085,627 14,508,196 14,943,442 15,391,745 15,853,497 16,329,102 16,818,975 17,323,545 17,843,251 18,378,549 18,929,905 19,497,802 20,082,736 307,743,817
PURCHASED SOLAR (kWh) 2,466,685 2,466,685 2,465,699 2,464,712 2,463,727 2,462,741 2,461,756 2,460,771 2,459,787 2,458,803 2,457,819 2,456,836 2,455,854 2,454,871 2,453,889 2,452,908 2,451,927 2,450,946 2,449,965 2,448,985 2,448,006 49,146,688
COGEN + BOILER GAS (Therms) 7,181,397 7,181,397 7,289,118 7,398,455 7,509,432 7,622,073 7,736,404 7,852,450 7,970,237 8,089,791 8,211,137 8,334,304 8,459,319 8,586,209 8,715,002 8,845,727 8,978,413 9,113,089 9,249,785 9,388,532 9,529,360 166,060,235
WATER (Gallons) 0 0 0 0 0 0 0 0 0 0 0 0 0 0 0 0 0 0 0 0 0 0
Short Ton CO2 Electric Consumption 3,608 3,608 3,644 3,845 4,064 4,284 4,553 4,716 4,919 5,173 5,436 5,750 6,085 6,364 6,655 6,961 7,280 7,614 7,963 8,329 8,711 115,951
Short Ton CO2 Gas Consumption 42,015 42,015 42,645 43,285 43,934 44,593 45,262 45,941 46,630 47,329 48,039 48,760 49,491 50,234 50,987 51,752 52,528 53,316 54,116 54,928 55,752 971,535
Year-2017 Year-2018 Year-2019 Year-2020 Year-2021 Year-2022 Year-2023 Year-2024 Year-2025 Year-2026 Year-2027 Year-2028 Year-2029 Year-2030 Year-2031 Year-2032 Year-2033 Year-2034 Year-2035 Year-2036 Total
ELECTRIC $1,444,326 $1,444,326 $1,517,409 $1,594,189 $1,674,855 $1,759,603 $1,848,639 $1,942,180 $2,040,455 $2,143,702 $2,252,173 $2,366,133 $2,485,859 $2,611,644 $2,743,793 $2,882,629 $3,028,490 $3,181,731 $3,342,727 $3,511,869 $3,689,569 48,061,973$
SOLAR $168,524 $168,524 $165,569 $167,597 $169,066 $169,413 $172,405 $170,903 $170,964 $174,886 $178,688 $183,871 $191,909 $194,051 $196,217 $198,404 $200,615 $202,848 $205,104 $207,382 $209,684 3,698,099$
GAS $5,511,342 $5,511,342 $5,485,069 $5,704,160 $5,941,410 $6,171,474 $6,462,985 $6,597,404 $6,781,101 $7,027,061 $7,277,727 $7,585,189 $7,910,496 $8,152,468 $8,401,956 $8,659,198 $8,924,436 $9,197,923 $9,479,916 $9,770,684 $10,070,502 151,112,501$
MAINTENANCE $347,400 $347,400 $356,085 $364,987 $374,112 $383,465 $393,051 $402,877 $412,949 $423,273 $433,855 $444,701 $455,819 $467,214 $478,895 $490,867 $503,139 $515,717 $528,610 $541,825 $555,371 8,874,214$
STAFFING $300,000 $300,000 $307,500 $315,188 $323,067 $331,144 $339,422 $347,908 $356,606 $365,521 $374,659 $384,025 $393,626 $403,467 $413,553 $423,892 $434,489 $445,352 $456,485 $467,898 $479,595 7,663,397$
Other $0 $0 $0 $0 $0 $0 $0 $0 $0 $0 $0 $0 $0 $0 $0 $0 $0 $0 $0 $0 $0 -$
WATER $0 $0 $0 $0 $0 $0 $0 $0 $0 $0 $0 $0 $0 $0 $0 $0 $0 $0 $0 $0 $0 -$
PROPOSED CASE TOTAL 7,771,592$ 7,771,592$ 7,831,632$ 8,146,121$ 8,482,511$ 8,815,099$ 9,216,503$ 9,461,273$ 9,762,074$ 10,134,443$ 10,517,102$ 10,963,920$ 11,437,709$ 11,828,844$ 12,234,414$ 12,654,990$ 13,091,169$ 13,543,571$ 14,012,842$ 14,499,658$ 15,004,721$ 219,410,185$
Year-2017 Year-2018 Year-2019 Year-2020 Year-2021 Year-2022 Year-2023 Year-2024 Year-2025 Year-2026 Year-2027 Year-2028 Year-2029 Year-2030 Year-2031 Year-2032 Year-2033 Year-2034 Year-2035 Year-2036 Total
Net Energy Savings 1,578,885$ 1,578,885$ 1,768,778$ 1,897,313$ 2,031,539$ 2,179,342$ 2,319,067$ 2,517,113$ 2,712,603$ 2,900,383$ 3,100,554$ 3,298,323$ 3,503,411$ 3,752,508$ 4,016,108$ 4,294,998$ 4,590,008$ 4,902,008$ 5,231,919$ 5,580,704$ 5,949,382$ 68,124,946$
Depreciation -$ -$ -$ -$ -$ -$ -$ -$ -$
Interest -$ -$ -$ -$ -$ -$ -$ -$ -$ -$ -$ -$ -$ -$ -$ -$ -$ -$ -$ -$ -$
Net Taxable Income 1,578,885$ 1,768,778$ 1,897,313$ 2,031,539$ 2,179,342$ 2,319,067$ 2,517,113$ 2,712,603$ 2,900,383$ 3,100,554$ 3,298,323$ 3,503,411$ 3,752,508$ 4,016,108$ 4,294,998$ 4,590,008$ 4,902,008$ 5,231,919$ 5,580,704$ 5,949,382$ 68,124,946$
Income Tax $0 $0 $0 $0 $0 $0 $0 $0 $0 $0 $0 $0 $0 $0 $0 $0 $0 $0 $0 $0 -$
After Tax Income 1,578,885$ 1,768,778$ 1,897,313$ 2,031,539$ 2,179,342$ 2,319,067$ 2,517,113$ 2,712,603$ 2,900,383$ 3,100,554$ 3,298,323$ 3,503,411$ 3,752,508$ 4,016,108$ 4,294,998$ 4,590,008$ 4,902,008$ 5,231,919$ 5,580,704$ 5,949,382$ 68,124,946$
Principal -$ -$ -$ -$ -$ -$ -$ -$ -$ -$ -$ -$ -$ -$ -$ -$ -$ -$ -$ -$ -$
Net Savings $0 $1,578,885 $1,768,778 $1,897,313 $2,031,539 $2,179,342 $2,319,067 $2,517,113 $2,712,603 $2,900,383 $3,100,554 $3,298,323 $3,503,411 $3,752,508 $4,016,108 $4,294,998 $4,590,008 $4,902,008 $5,231,919 $5,580,704 $5,949,382 68,124,946$
Carbon Credit Cost $285,140 $285,140 $312,447 $341,690 $371,985 $403,234 $435,876 $1,013,134 $1,069,637 $1,128,792 $1,189,832 $1,253,720 $1,319,934 $1,386,635 $1,455,474 $1,526,524 $1,734,431 $1,949,755 $2,172,765 $2,403,738 $2,642,967 24,397,712$
Proposed Total With Carbon Credits $8,056,732 $8,056,732 $8,144,079 $8,487,812 $8,854,496 $9,218,333 $9,652,379 $10,474,407 $10,831,711 $11,263,235 $11,706,934 $12,217,640 $12,757,643 $13,215,479 $13,689,888 $14,181,514 $14,825,600 $15,493,326 $16,185,607 $16,903,396 $17,647,688 243,807,897$
20 Yr PV of Savings vs Base Case both w/Carbon Offsets
20 Yr PV Cost without Carbon Offsets
20 Yr PV Cost with Carbon Offsets
$42,430,437$42,430,437$42,430,437$42,430,437
$142,335,253$142,335,253$142,335,253$142,335,253
$156,850,670$156,850,670$156,850,670$156,850,670
20 Yr PV Cost of Carbon Offsets
$39,345,557$39,345,557$39,345,557$39,345,557
$14,515,417$14,515,417$14,515,417$14,515,417
Base Case Rates
Base Case Consumption
Electric Rate Escalation
Gas Rate Escalation
University of Maine Orono
Project:
Proposed Case Consumption
Yearly Loan PaymentEstimated Federal and State Tax Rate
-$ Installed Cost
0.0%
Gas Demand Growth
Cogeneration Feasibility Study
Inflation rate
Interest Rate
Maintenance & Operation
Energy Consumption - CHP Plant at the East Campus with Thermal Load Following and Solar Generation - Option 2C ECONOMIC PRO FORMA
Discount Rate
Topic:
20 Yr PV of Savings vs Base Case both w/o Carbon Offsets
Savings
Length of Loan (months)
Interest Rate
Monthly Loan Payment
Inflation rate
2.5%
Proposed Case Cost
Base Case Cost
3.0%
Proposed Case Rates
Page 41
Client:
Calc By: Check By: Job No.: File Name: Sheet Name: Date:
TK BAB 25025.00 Cogeneration Analysis ver18 final. NPV 10/26/2016
Depreciation schedule 4.0%
240
3.0%
$0
$0
0 1 2 3 4 5 6 7 8 9 10 11 12 13 14 15 16 17 18 19 20
Start 2017 Year-2017 Year-2018 Year-2019 Year-2020 Year-2021 Year-2022 Year-2023 Year-2024 Year-2025 Year-2026 Year-2027 Year-2028 Year-2029 Year-2030 Year-2031 Year-2032 Year-2033 Year-2034 Year-2035 Year-2036
2.5% 2.5% 2.5% 2.5% 2.5% 2.5% 2.5% 2.5% 2.5% 2.5% 2.5% 2.5% 2.5% 2.5% 2.5% 2.5% 2.5% 2.5% 2.5% 2.5%
2.0% 2.0% 2.0% 2.0% 2.0% 2.0% 2.0% 2.0% 2.0% 2.0% 2.0% 2.0% 2.0% 2.0% 2.0% 2.0% 2.0% 2.0% 2.0% 2.0%
Electric Demand Growth 3.0% 3.0% 3.0% 3.0% 3.0% 3.0% 3.0% 3.0% 3.0% 3.0% 3.0% 3.0% 3.0% 3.0% 3.0% 3.0% 3.0% 3.0% 3.0% 3.0%
0.0% -1.9% 2.5% 2.6% 2.3% 3.2% 0.6% 1.3% 2.1% 2.0% 2.7% 2.7% 1.5% 1.5% 1.5% 1.5% 1.5% 1.5% 1.5% 1.5%
1.5% 1.5% 1.5% 1.5% 1.5% 1.5% 1.5% 1.5% 1.5% 1.5% 1.5% 1.5% 1.5% 1.5% 1.5% 1.5% 1.5% 1.5% 1.5% 1.5%
Water 2.0% 2.0% 2.0% 2.0% 2.0% 2.0% 2.0% 2.0% 2.0% 2.0% 2.0% 2.0% 2.0% 2.0% 2.0% 2.0% 2.0% 2.0% 2.0% 2.0%
Solar Generation Degradation -0.04% -0.04% -0.04% -0.04% -0.04% -0.04% -0.04% -0.04% -0.04% -0.04% -0.04% -0.04% -0.04% -0.04% -0.04% -0.04% -0.04% -0.04% -0.04% -0.04%
Solar Rate Escalation 0.0% -1.7% 1.3% 0.9% 0.2% 1.8% -0.8% 0.1% 2.3% 2.2% 2.9% 4.4% 1.2% 1.2% 1.2% 1.2% 1.2% 1.2% 1.2% 1.2%
2.5% 2.5% 2.5% 2.5% 2.5% 2.5% 2.5% 2.5% 2.5% 2.5% 2.5% 2.5% 2.5% 2.5% 2.5% 2.5% 2.5% 2.5% 2.5% 2.5%
Emissions Growth Electric 0.0% -1.9% 2.5% 2.6% 2.3% 3.2% 0.6% 1.3% 2.1% 2.0% 2.7% 2.7% 1.5% 1.5% 1.5% 1.5% 1.5% 1.5% 1.5% 1.5%
Emissions Growth Gas 0.0% 0.0% 0.0% 0.0% 0.0% 0.0% 0.0% 0.0% 0.0% 0.0% 0.0% 0.0% 0.0% 0.0% 0.0% 0.0% 0.0% 0.0% 0.0% 0.0%
Carbon Rate Escalation 0.0% 8.0% 7.4% 6.9% 6.5% 6.1% 128.6% 3.8% 3.6% 3.5% 3.4% 3.3% 3.2% 3.1% 3.0% 11.5% 10.3% 9.4% 8.6% 7.9%
Year-2017 Year-2018 Year-2019 Year-2020 Year-2021 Year-2022 Year-2023 Year-2024 Year-2025 Year-2026 Year-2027 Year-2028 Year-2029 Year-2030 Year-2031 Year-2032 Year-2033 Year-2034 Year-2035 Year-2036
ELECTRIC ($/kWh) $0.126 $0.126 $0.129 $0.131 $0.134 $0.137 $0.139 $0.142 $0.145 $0.148 $0.151 $0.154 $0.157 $0.160 $0.163 $0.166 $0.170 $0.173 $0.177 $0.180 $0.184
NATURAL GAS ($/therm) $0.791 $0.79 $0.776 $0.80 $0.82 $0.83 $0.86 $0.87 $0.88 $0.90 $0.91 $0.94 $0.96 $0.98 $0.99 $1.01 $1.03 $1.04 $1.06 $1.07 $1.09
Year-2017 Year-2018 Year-2019 Year-2020 Year-2021 Year-2022 Year-2023 Year-2024 Year-2025 Year-2026 Year-2027 Year-2028 Year-2029 Year-2030 Year-2031 Year-2032 Year-2033 Year-2034 Year-2035 Year-2036 Total
ELECTRIC (kWh) 42,178,862 42,178,862 43,444,228 44,747,555 46,089,981 47,472,681 48,896,861 50,363,767 51,874,680 53,430,920 55,033,848 56,684,863 58,385,409 60,136,972 61,941,081 63,799,313 65,713,293 67,684,691 69,715,232 71,806,689 73,960,890 1,133,361,815
GAS (Therms) 5,093,806 5,093,806 5,170,213 5,247,766 5,326,483 5,406,380 5,487,476 5,569,788 5,653,335 5,738,135 5,824,207 5,911,570 6,000,243 6,090,247 6,181,601 6,274,325 6,368,440 6,463,966 6,560,926 6,659,340 6,759,230 117,787,475
Year-2017 Year-2018 Year-2019 Year-2020 Year-2021 Year-2022 Year-2023 Year-2024 Year-2025 Year-2026 Year-2027 Year-2028 Year-2029 Year-2030 Year-2031 Year-2032 Year-2033 Year-2034 Year-2035 Year-2036 Total
ELECTRIC $5,319,176 $5,319,176 $5,588,327 $5,871,096 $6,168,173 $6,480,283 $6,808,185 $7,152,679 $7,514,605 $7,894,844 $8,294,323 $8,714,016 $9,154,945 $9,618,185 $10,104,865 $10,616,172 $11,153,350 $11,717,709 $12,310,626 $12,933,543 $13,587,981 177,003,084$
GAS $4,031,301 $4,031,301 $4,012,083 $4,172,338 $4,345,876 $4,514,157 $4,727,385 $4,825,706 $4,960,073 $5,139,981 $5,323,333 $5,548,227 $5,786,175 $5,963,166 $6,145,656 $6,333,817 $6,527,827 $6,727,870 $6,934,135 $7,146,819 $7,366,122 110,532,046$
BASE CASE TOTAL $9,350,477 9,350,477$ 9,600,410$ 10,043,434$ 10,514,050$ 10,994,440$ 11,535,570$ 11,978,386$ 12,474,678$ 13,034,825$ 13,617,656$ 14,262,243$ 14,941,120$ 15,581,351$ 16,250,521$ 16,949,988$ 17,681,177$ 18,445,579$ 19,244,761$ 20,080,362$ 20,954,103$ 287,535,131$
Year-2017 Year-2018 Year-2019 Year-2020 Year-2021 Year-2022 Year-2023 Year-2024 Year-2025 Year-2026 Year-2027 Year-2028 Year-2029 Year-2030 Year-2031 Year-2032 Year-2033 Year-2034 Year-2035 Year-2036
ELECTRIC ($/kWh) $0.126 $0.126 $0.129 $0.131 $0.134 $0.137 $0.139 $0.142 $0.145 $0.148 $0.151 $0.154 $0.157 $0.160 $0.163 $0.166 $0.170 $0.173 $0.177 $0.180 $0.184
NATURAL GAS ($/therm) $0.774 $0.77 $0.76 $0.78 $0.80 $0.82 $0.84 $0.85 $0.86 $0.88 $0.89 $0.92 $0.94 $0.96 $0.97 $0.99 $1.00 $1.02 $1.03 $1.05 $1.07
WATER ($/CCF) $0.860 $0.86 $0.88 $0.89 $0.91 $0.93 $0.95 $0.97 $0.99 $1.01 $1.03 $1.05 $1.07 $1.09 $1.11 $1.13 $1.16 $1.18 $1.20 $1.23 $1.25
SOLAR ($/kWh) $0.068 $0.07 $0.07 $0.07 $0.07 $0.07 $0.07 $0.07 $0.07 $0.07 $0.07 $0.07 $0.08 $0.08 $0.08 $0.08 $0.08 $0.08 $0.08 $0.08 $0.09
CARBON CREDIT ($/Short Ton) $6.25 $6.25 $6.75 $7.25 $7.75 $8.25 $8.75 $20.00 $20.75 $21.50 $22.25 $23.00 $23.75 $24.50 $25.25 $26.00 $29.00 $32.00 $35.00 $38.00 $41.00
Year-2017 Year-2018 Year-2019 Year-2020 Year-2021 Year-2022 Year-2023 Year-2024 Year-2025 Year-2026 Year-2027 Year-2028 Year-2029 Year-2030 Year-2031 Year-2032 Year-2033 Year-2034 Year-2035 Year-2036 Total
PURCHASED ELECTRIC (kWh) 12,034,585 12,034,585 12,395,622 12,767,491 13,150,516 13,545,031 13,951,382 14,369,923 14,801,021 15,245,052 15,702,403 16,173,475 16,658,680 17,158,440 17,673,193 18,203,389 18,749,491 19,311,976 19,891,335 20,488,075 21,102,717 323,373,798
PURCHASED SOLAR (kWh) 2,466,685 2,466,685 2,465,699 2,464,712 2,463,727 2,462,741 2,461,756 2,460,771 2,459,787 2,458,803 2,457,819 2,456,836 2,455,854 2,454,871 2,453,889 2,452,908 2,451,927 2,450,946 2,449,965 2,448,985 2,448,006 49,146,688
COGEN + BOILER GAS (Therms) 6,967,432 6,967,432 7,071,944 7,178,023 7,285,693 7,394,979 7,505,903 7,618,492 7,732,769 7,848,761 7,966,492 8,085,990 8,207,280 8,330,389 8,455,345 8,582,175 8,710,907 8,841,571 8,974,195 9,108,808 9,245,440 161,112,587
WATER (Gallons) 0 0 0 0 0 0 0 0 0 0 0 0 0 0 0 0 0 0 0 0 0 0
Short Ton CO2 Electric Consumption 3,791 3,791 3,829 4,040 4,271 4,502 4,784 4,955 5,169 5,435 5,712 6,042 6,394 6,687 6,993 7,314 7,649 8,000 8,368 8,752 9,154 121,840
Short Ton CO2 Gas Consumption 40,763 40,763 41,374 41,995 42,625 43,264 43,913 44,572 45,241 45,919 46,608 47,307 48,017 48,737 49,468 50,210 50,963 51,728 52,504 53,291 54,090 942,589
Year-2017 Year-2018 Year-2019 Year-2020 Year-2021 Year-2022 Year-2023 Year-2024 Year-2025 Year-2026 Year-2027 Year-2028 Year-2029 Year-2030 Year-2031 Year-2032 Year-2033 Year-2034 Year-2035 Year-2036 Total
ELECTRIC $1,517,681 $1,517,681 $1,594,476 $1,675,157 $1,759,920 $1,848,972 $1,942,529 $2,040,821 $2,144,087 $2,252,578 $2,366,558 $2,486,306 $2,612,113 $2,744,286 $2,883,147 $3,029,034 $3,182,303 $3,343,328 $3,512,500 $3,690,233 $3,876,959 50,502,989$
SOLAR $168,524 $168,524 $165,569 $167,597 $169,066 $169,413 $172,405 $170,903 $170,964 $174,886 $178,688 $183,871 $191,909 $194,051 $196,217 $198,404 $200,615 $202,848 $205,104 $207,382 $209,684 3,698,099$
GAS $5,390,724 $5,390,724 $5,365,026 $5,579,322 $5,811,380 $6,036,408 $6,321,540 $6,453,017 $6,632,693 $6,873,270 $7,118,451 $7,419,184 $7,737,372 $7,974,047 $8,218,076 $8,469,688 $8,729,121 $8,996,622 $9,272,444 $9,556,848 $9,850,104 147,805,336$
MAINTENANCE $347,400 $347,400 $356,085 $364,987 $374,112 $383,465 $393,051 $402,877 $412,949 $423,273 $433,855 $444,701 $455,819 $467,214 $478,895 $490,867 $503,139 $515,717 $528,610 $541,825 $555,371 8,874,214$
STAFFING $300,000 $300,000 $307,500 $315,188 $323,067 $331,144 $339,422 $347,908 $356,606 $365,521 $374,659 $384,025 $393,626 $403,467 $413,553 $423,892 $434,489 $445,352 $456,485 $467,898 $479,595 7,663,397$
Other $0 $0 $0 $0 $0 $0 $0 $0 $0 $0 $0 $0 $0 $0 $0 $0 $0 $0 $0 $0 $0 -$
WATER $0 $0 $0 $0 $0 $0 $0 $0 $0 $0 $0 $0 $0 $0 $0 $0 $0 $0 $0 $0 $0 -$
PROPOSED CASE TOTAL 7,724,329$ 7,724,329$ 7,788,656$ 8,102,250$ 8,437,544$ 8,769,402$ 9,168,948$ 9,415,527$ 9,717,299$ 10,089,528$ 10,472,211$ 10,918,088$ 11,390,838$ 11,783,066$ 12,189,887$ 12,611,886$ 13,049,667$ 13,503,867$ 13,975,143$ 14,464,186$ 14,971,713$ 218,544,036$
Year-2017 Year-2018 Year-2019 Year-2020 Year-2021 Year-2022 Year-2023 Year-2024 Year-2025 Year-2026 Year-2027 Year-2028 Year-2029 Year-2030 Year-2031 Year-2032 Year-2033 Year-2034 Year-2035 Year-2036 Total
Net Energy Savings 1,626,148$ 1,626,148$ 1,811,754$ 1,941,184$ 2,076,505$ 2,225,039$ 2,366,622$ 2,562,859$ 2,757,378$ 2,945,297$ 3,145,445$ 3,344,155$ 3,550,282$ 3,798,286$ 4,060,634$ 4,338,103$ 4,631,509$ 4,941,712$ 5,269,617$ 5,616,176$ 5,982,390$ 68,991,095$
Depreciation -$ -$ -$ -$ -$ -$ -$ -$ -$
Interest -$ -$ -$ -$ -$ -$ -$ -$ -$ -$ -$ -$ -$ -$ -$ -$ -$ -$ -$ -$ -$
Net Taxable Income 1,626,148$ 1,811,754$ 1,941,184$ 2,076,505$ 2,225,039$ 2,366,622$ 2,562,859$ 2,757,378$ 2,945,297$ 3,145,445$ 3,344,155$ 3,550,282$ 3,798,286$ 4,060,634$ 4,338,103$ 4,631,509$ 4,941,712$ 5,269,617$ 5,616,176$ 5,982,390$ 68,991,095$
Income Tax $0 $0 $0 $0 $0 $0 $0 $0 $0 $0 $0 $0 $0 $0 $0 $0 $0 $0 $0 $0 -$
After Tax Income 1,626,148$ 1,811,754$ 1,941,184$ 2,076,505$ 2,225,039$ 2,366,622$ 2,562,859$ 2,757,378$ 2,945,297$ 3,145,445$ 3,344,155$ 3,550,282$ 3,798,286$ 4,060,634$ 4,338,103$ 4,631,509$ 4,941,712$ 5,269,617$ 5,616,176$ 5,982,390$ 68,991,095$
Principal -$ -$ -$ -$ -$ -$ -$ -$ -$ -$ -$ -$ -$ -$ -$ -$ -$ -$ -$ -$ -$
Net Savings $0 $1,626,148 $1,811,754 $1,941,184 $2,076,505 $2,225,039 $2,366,622 $2,562,859 $2,757,378 $2,945,297 $3,145,445 $3,344,155 $3,550,282 $3,798,286 $4,060,634 $4,338,103 $4,631,509 $4,941,712 $5,269,617 $5,616,176 $5,982,390 68,991,095$
Carbon Credit Cost $278,462 $278,462 $305,120 $333,756 $363,440 $394,068 $426,100 $990,549 $1,045,993 $1,104,122 $1,164,129 $1,227,023 $1,292,253 $1,357,885 $1,425,651 $1,495,626 $1,699,767 $1,911,297 $2,130,488 $2,357,624 $2,593,002 23,896,356$
Proposed Total With Carbon Credits $8,002,791 $8,002,791 $8,093,776 $8,436,007 $8,800,985 $9,163,470 $9,595,048 $10,406,076 $10,763,292 $11,193,651 $11,636,340 $12,145,111 $12,683,091 $13,140,951 $13,615,538 $14,107,511 $14,749,435 $15,415,164 $16,105,631 $16,821,810 $17,564,715 242,440,392$
20 Yr PV of Savings vs Base Case both w/Carbon Offsets
20 Yr PV Cost without Carbon Offsets
20 Yr PV Cost with Carbon Offsets
$43,026,797$43,026,797$43,026,797$43,026,797
$141,738,893$141,738,893$141,738,893$141,738,893
$155,952,272$155,952,272$155,952,272$155,952,272
20 Yr PV Cost of Carbon Offsets
$40,243,954$40,243,954$40,243,954$40,243,954
$14,213,379$14,213,379$14,213,379$14,213,379
Base Case Rates
Base Case Consumption
Electric Rate Escalation
Gas Rate Escalation
University of Maine Orono
Project:
Proposed Case Consumption
Yearly Loan PaymentEstimated Federal and State Tax Rate
-$ Installed Cost
0.0%
Gas Demand Growth
Cogeneration Feasibility Study
Inflation rate
Interest Rate
Maintenance & Operation
Energy Consumption - CHP Plant at the East Campus with Thermal Load Following and Solar Generation and no Summer Steam Load - Option 2D ECONOMIC PRO FORMA
Discount Rate
Topic:
20 Yr PV of Savings vs Base Case both w/o Carbon Offsets
Savings
Length of Loan (months)
Interest Rate
Monthly Loan Payment
Inflation rate
2.5%
Proposed Case Cost
Base Case Cost
3.0%
Proposed Case Rates
Page 42
Client:
Calc By: Check By: Job No.: File Name: Sheet Name: Date:
TK BAB 25025.00 Cogeneration Analysis ver18 final. NPV 10/26/2016
Depreciation schedule 4.0%
240
3.0%
$0
$0
0 1 2 3 4 5 6 7 8 9 10 11 12 13 14 15 16 17 18 19 20
Start 2017 Year-2017 Year-2018 Year-2019 Year-2020 Year-2021 Year-2022 Year-2023 Year-2024 Year-2025 Year-2026 Year-2027 Year-2028 Year-2029 Year-2030 Year-2031 Year-2032 Year-2033 Year-2034 Year-2035 Year-2036
2.5% 2.5% 2.5% 2.5% 2.5% 2.5% 2.5% 2.5% 2.5% 2.5% 2.5% 2.5% 2.5% 2.5% 2.5% 2.5% 2.5% 2.5% 2.5% 2.5%
2.0% 2.0% 2.0% 2.0% 2.0% 2.0% 2.0% 2.0% 2.0% 2.0% 2.0% 2.0% 2.0% 2.0% 2.0% 2.0% 2.0% 2.0% 2.0% 2.0%
Electric Demand Growth 3.0% 3.0% 3.0% 3.0% 3.0% 3.0% 3.0% 3.0% 3.0% 3.0% 3.0% 3.0% 3.0% 3.0% 3.0% 3.0% 3.0% 3.0% 3.0% 3.0%
0.0% -1.9% 2.5% 2.6% 2.3% 3.2% 0.6% 1.3% 2.1% 2.0% 2.7% 2.7% 1.5% 1.5% 1.5% 1.5% 1.5% 1.5% 1.5% 1.5%
1.5% 1.5% 1.5% 1.5% 1.5% 1.5% 1.5% 1.5% 1.5% 1.5% 1.5% 1.5% 1.5% 1.5% 1.5% 1.5% 1.5% 1.5% 1.5% 1.5%
Water 2.0% 2.0% 2.0% 2.0% 2.0% 2.0% 2.0% 2.0% 2.0% 2.0% 2.0% 2.0% 2.0% 2.0% 2.0% 2.0% 2.0% 2.0% 2.0% 2.0%
Solar Generation Degradation -0.04% -0.04% -0.04% -0.04% -0.04% -0.04% -0.04% -0.04% -0.04% -0.04% -0.04% -0.04% -0.04% -0.04% -0.04% -0.04% -0.04% -0.04% -0.04% -0.04%
Solar Rate Escalation 0.0% -1.7% 1.3% 0.9% 0.2% 1.8% -0.8% 0.1% 2.3% 2.2% 2.9% 4.4% 1.2% 1.2% 1.2% 1.2% 1.2% 1.2% 1.2% 1.2%
2.5% 2.5% 2.5% 2.5% 2.5% 2.5% 2.5% 2.5% 2.5% 2.5% 2.5% 2.5% 2.5% 2.5% 2.5% 2.5% 2.5% 2.5% 2.5% 2.5%
Emissions Growth Electric 0.0% -1.9% 2.5% 2.6% 2.3% 3.2% 0.6% 1.3% 2.1% 2.0% 2.7% 2.7% 1.5% 1.5% 1.5% 1.5% 1.5% 1.5% 1.5% 1.5%
Emissions Growth Gas 0.0% 0.0% 0.0% 0.0% 0.0% 0.0% 0.0% 0.0% 0.0% 0.0% 0.0% 0.0% 0.0% 0.0% 0.0% 0.0% 0.0% 0.0% 0.0% 0.0%
Carbon Rate Escalation 0.0% 8.0% 7.4% 6.9% 6.5% 6.1% 128.6% 3.8% 3.6% 3.5% 3.4% 3.3% 3.2% 3.1% 3.0% 11.5% 10.3% 9.4% 8.6% 7.9%
Year-2017 Year-2018 Year-2019 Year-2020 Year-2021 Year-2022 Year-2023 Year-2024 Year-2025 Year-2026 Year-2027 Year-2028 Year-2029 Year-2030 Year-2031 Year-2032 Year-2033 Year-2034 Year-2035 Year-2036
ELECTRIC ($/kWh) $0.126 $0.126 $0.129 $0.131 $0.134 $0.137 $0.139 $0.142 $0.145 $0.148 $0.151 $0.154 $0.157 $0.160 $0.163 $0.166 $0.170 $0.173 $0.177 $0.180 $0.184
NATURAL GAS ($/therm) $0.791 $0.79 $0.776 $0.80 $0.82 $0.83 $0.86 $0.87 $0.88 $0.90 $0.91 $0.94 $0.96 $0.98 $0.99 $1.01 $1.03 $1.04 $1.06 $1.07 $1.09
Year-2017 Year-2018 Year-2019 Year-2020 Year-2021 Year-2022 Year-2023 Year-2024 Year-2025 Year-2026 Year-2027 Year-2028 Year-2029 Year-2030 Year-2031 Year-2032 Year-2033 Year-2034 Year-2035 Year-2036 Total
ELECTRIC (kWh) 42,178,862 42,178,862 43,444,228 44,747,555 46,089,981 47,472,681 48,896,861 50,363,767 51,874,680 53,430,920 55,033,848 56,684,863 58,385,409 60,136,972 61,941,081 63,799,313 65,713,293 67,684,691 69,715,232 71,806,689 73,960,890 1,133,361,815
GAS (Therms) 5,093,806 5,093,806 5,170,213 5,247,766 5,326,483 5,406,380 5,487,476 5,569,788 5,653,335 5,738,135 5,824,207 5,911,570 6,000,243 6,090,247 6,181,601 6,274,325 6,368,440 6,463,966 6,560,926 6,659,340 6,759,230 117,787,475
Year-2017 Year-2018 Year-2019 Year-2020 Year-2021 Year-2022 Year-2023 Year-2024 Year-2025 Year-2026 Year-2027 Year-2028 Year-2029 Year-2030 Year-2031 Year-2032 Year-2033 Year-2034 Year-2035 Year-2036 Total
ELECTRIC $5,319,176 $5,319,176 $5,588,327 $5,871,096 $6,168,173 $6,480,283 $6,808,185 $7,152,679 $7,514,605 $7,894,844 $8,294,323 $8,714,016 $9,154,945 $9,618,185 $10,104,865 $10,616,172 $11,153,350 $11,717,709 $12,310,626 $12,933,543 $13,587,981 177,003,084$
GAS $4,031,301 $4,031,301 $4,012,083 $4,172,338 $4,345,876 $4,514,157 $4,727,385 $4,825,706 $4,960,073 $5,139,981 $5,323,333 $5,548,227 $5,786,175 $5,963,166 $6,145,656 $6,333,817 $6,527,827 $6,727,870 $6,934,135 $7,146,819 $7,366,122 110,532,046$
BASE CASE TOTAL $9,350,477 9,350,477$ 9,600,410$ 10,043,434$ 10,514,050$ 10,994,440$ 11,535,570$ 11,978,386$ 12,474,678$ 13,034,825$ 13,617,656$ 14,262,243$ 14,941,120$ 15,581,351$ 16,250,521$ 16,949,988$ 17,681,177$ 18,445,579$ 19,244,761$ 20,080,362$ 20,954,103$ 287,535,131$
Year-2017 Year-2018 Year-2019 Year-2020 Year-2021 Year-2022 Year-2023 Year-2024 Year-2025 Year-2026 Year-2027 Year-2028 Year-2029 Year-2030 Year-2031 Year-2032 Year-2033 Year-2034 Year-2035 Year-2036
ELECTRIC ($/kWh) $0.126 $0.126 $0.129 $0.131 $0.134 $0.137 $0.139 $0.142 $0.145 $0.148 $0.151 $0.154 $0.157 $0.160 $0.163 $0.166 $0.170 $0.173 $0.177 $0.180 $0.184
NATURAL GAS ($/therm) $0.752 $0.75 $0.74 $0.76 $0.78 $0.79 $0.82 $0.82 $0.83 $0.85 $0.87 $0.89 $0.92 $0.93 $0.94 $0.96 $0.97 $0.99 $1.00 $1.02 $1.04
WATER ($/CCF) $0.860 $0.86 $0.88 $0.89 $0.91 $0.93 $0.95 $0.97 $0.99 $1.01 $1.03 $1.05 $1.07 $1.09 $1.11 $1.13 $1.16 $1.18 $1.20 $1.23 $1.25
SOLAR ($/kWh) $0.068 $0.07 $0.07 $0.07 $0.07 $0.07 $0.07 $0.07 $0.07 $0.07 $0.07 $0.07 $0.08 $0.08 $0.08 $0.08 $0.08 $0.08 $0.08 $0.08 $0.09
CARBON CREDIT ($/Short Ton) $6.25 $6.25 $6.75 $7.25 $7.75 $8.25 $8.75 $20.00 $20.75 $21.50 $22.25 $23.00 $23.75 $24.50 $25.25 $26.00 $29.00 $32.00 $35.00 $38.00 $41.00
Year-2017 Year-2018 Year-2019 Year-2020 Year-2021 Year-2022 Year-2023 Year-2024 Year-2025 Year-2026 Year-2027 Year-2028 Year-2029 Year-2030 Year-2031 Year-2032 Year-2033 Year-2034 Year-2035 Year-2036 Total
PURCHASED ELECTRIC (kWh) 6,607,943 6,607,943 6,806,182 7,010,367 7,220,678 7,437,298 7,660,417 7,890,230 8,126,937 8,370,745 8,621,867 8,880,523 9,146,939 9,421,347 9,703,988 9,995,107 10,294,960 10,603,809 10,921,923 11,249,581 11,587,069 177,557,912
PURCHASED SOLAR (kWh) 0 0 0 0 0 0 0 0 0 0 0 0 0 0 0 0 0 0 0 0 0 0
COGEN + BOILER GAS (Therms) 7,804,331 7,804,331 7,921,396 8,040,217 8,160,820 8,283,232 8,407,481 8,533,593 8,661,597 8,791,521 8,923,393 9,057,244 9,193,103 9,331,000 9,470,965 9,613,029 9,757,224 9,903,583 10,052,137 10,202,919 10,355,962 180,464,745
WATER (Gallons) 0 0 0 0 0 0 0 0 0 0 0 0 0 0 0 0 0 0 0 0 0 0
Short Ton CO2 Electric Consumption 2,082 2,082 2,102 2,218 2,345 2,472 2,627 2,721 2,838 2,984 3,137 3,317 3,511 3,672 3,840 4,016 4,200 4,393 4,594 4,805 5,026 66,900
Short Ton CO2 Gas Consumption 45,659 45,659 46,344 47,039 47,745 48,461 49,188 49,926 50,675 51,435 52,206 52,989 53,784 54,591 55,410 56,241 57,085 57,941 58,810 59,692 60,588 1,055,809
Year-2017 Year-2018 Year-2019 Year-2020 Year-2021 Year-2022 Year-2023 Year-2024 Year-2025 Year-2026 Year-2027 Year-2028 Year-2029 Year-2030 Year-2031 Year-2032 Year-2033 Year-2034 Year-2035 Year-2036 Total
ELECTRIC $833,328 $833,328 $875,494 $919,794 $966,336 $1,015,232 $1,066,603 $1,120,573 $1,177,274 $1,236,844 $1,299,429 $1,365,180 $1,434,258 $1,506,831 $1,583,077 $1,663,181 $1,747,337 $1,835,753 $1,928,642 $2,026,231 $2,128,758 27,730,154$
SOLAR $0 $0 $0 $0 $0 $0 $0 $0 $0 $0 $0 $0 $0 $0 $0 $0 $0 $0 $0 $0 $0 -$
GAS $5,870,379 $5,870,379 $5,842,395 $6,075,758 $6,328,464 $6,573,515 $6,884,017 $7,027,193 $7,222,856 $7,484,839 $7,751,836 $8,079,327 $8,425,826 $8,683,561 $8,949,302 $9,223,302 $9,505,819 $9,797,122 $10,097,486 $10,407,196 $10,726,545 160,956,738$
MAINTENANCE $347,400 $347,400 $356,085 $364,987 $374,112 $383,465 $393,051 $402,877 $412,949 $423,273 $433,855 $444,701 $455,819 $467,214 $478,895 $490,867 $503,139 $515,717 $528,610 $541,825 $555,371 8,874,214$
STAFFING $300,000 $300,000 $307,500 $315,188 $323,067 $331,144 $339,422 $347,908 $356,606 $365,521 $374,659 $384,025 $393,626 $403,467 $413,553 $423,892 $434,489 $445,352 $456,485 $467,898 $479,595 7,663,397$
Other $0 $0 $0 $0 $0 $0 $0 $0 $0 $0 $0 $0 $0 $0 $0 $0 $0 $0 $0 $0 $0 -$
WATER $0 $0 $0 $0 $0 $0 $0 $0 $0 $0 $0 $0 $0 $0 $0 $0 $0 $0 $0 $0 $0 -$
PROPOSED CASE TOTAL 7,351,107$ 7,351,107$ 7,381,474$ 7,675,726$ 7,991,979$ 8,303,356$ 8,683,094$ 8,898,551$ 9,169,686$ 9,510,478$ 9,859,778$ 10,273,233$ 10,709,529$ 11,061,073$ 11,424,827$ 11,801,242$ 12,190,785$ 12,593,944$ 13,011,223$ 13,443,150$ 13,890,270$ 205,224,503$
Year-2017 Year-2018 Year-2019 Year-2020 Year-2021 Year-2022 Year-2023 Year-2024 Year-2025 Year-2026 Year-2027 Year-2028 Year-2029 Year-2030 Year-2031 Year-2032 Year-2033 Year-2034 Year-2035 Year-2036 Total
Net Energy Savings 1,999,370$ 1,999,370$ 2,218,936$ 2,367,708$ 2,522,071$ 2,691,085$ 2,852,477$ 3,079,835$ 3,304,992$ 3,524,348$ 3,757,878$ 3,989,010$ 4,231,591$ 4,520,278$ 4,825,694$ 5,148,746$ 5,490,391$ 5,851,635$ 6,233,537$ 6,637,212$ 7,063,833$ 82,310,627$
Depreciation -$ -$ -$ -$ -$ -$ -$ -$ -$
Interest -$ -$ -$ -$ -$ -$ -$ -$ -$ -$ -$ -$ -$ -$ -$ -$ -$ -$ -$ -$ -$
Net Taxable Income 1,999,370$ 2,218,936$ 2,367,708$ 2,522,071$ 2,691,085$ 2,852,477$ 3,079,835$ 3,304,992$ 3,524,348$ 3,757,878$ 3,989,010$ 4,231,591$ 4,520,278$ 4,825,694$ 5,148,746$ 5,490,391$ 5,851,635$ 6,233,537$ 6,637,212$ 7,063,833$ 82,310,627$
Income Tax $0 $0 $0 $0 $0 $0 $0 $0 $0 $0 $0 $0 $0 $0 $0 $0 $0 $0 $0 $0 -$
After Tax Income 1,999,370$ 2,218,936$ 2,367,708$ 2,522,071$ 2,691,085$ 2,852,477$ 3,079,835$ 3,304,992$ 3,524,348$ 3,757,878$ 3,989,010$ 4,231,591$ 4,520,278$ 4,825,694$ 5,148,746$ 5,490,391$ 5,851,635$ 6,233,537$ 6,637,212$ 7,063,833$ 82,310,627$
Principal -$ -$ -$ -$ -$ -$ -$ -$ -$ -$ -$ -$ -$ -$ -$ -$ -$ -$ -$ -$ -$
Net Savings $0 $1,999,370 $2,218,936 $2,367,708 $2,522,071 $2,691,085 $2,852,477 $3,079,835 $3,304,992 $3,524,348 $3,757,878 $3,989,010 $4,231,591 $4,520,278 $4,825,694 $5,148,746 $5,490,391 $5,851,635 $6,233,537 $6,637,212 $7,063,833 82,310,627$
Carbon Credit Cost $298,380 $298,380 $327,013 $357,119 $388,196 $420,195 $453,378 $1,052,935 $1,110,389 $1,170,013 $1,231,379 $1,295,057 $1,360,757 $1,427,436 $1,496,058 $1,566,683 $1,777,260 $1,994,681 $2,219,157 $2,450,906 $2,690,156 25,087,146$
Proposed Total With Carbon Credits $7,649,486 $7,649,486 $7,708,486 $8,032,845 $8,380,174 $8,723,551 $9,136,472 $9,951,486 $10,280,074 $10,680,491 $11,091,157 $11,568,290 $12,070,286 $12,488,509 $12,920,885 $13,367,925 $13,968,045 $14,588,625 $15,230,380 $15,894,056 $16,580,426 230,311,650$
20 Yr PV of Savings vs Base Case both w/Carbon Offsets
20 Yr PV Cost without Carbon Offsets
20 Yr PV Cost with Carbon Offsets
$51,452,437$51,452,437$51,452,437$51,452,437
$133,313,253$133,313,253$133,313,253$133,313,253
$148,262,606$148,262,606$148,262,606$148,262,606
20 Yr PV Cost of Carbon Offsets
$47,933,620$47,933,620$47,933,620$47,933,620
$14,949,354$14,949,354$14,949,354$14,949,354
Base Case Rates
Base Case Consumption
Electric Rate Escalation
Gas Rate Escalation
University of Maine Orono
Project:
Proposed Case Consumption
Yearly Loan PaymentEstimated Federal and State Tax Rate
-$ Installed Cost
0.0%
Gas Demand Growth
Cogeneration Feasibility Study
Inflation rate
Interest Rate
Maintenance & Operation
Energy Consumption - CHP Plant at the East Campus with Electric Load Following - Option 3A ECONOMIC PRO FORMA
Discount Rate
Topic:
20 Yr PV of Savings vs Base Case both w/o Carbon Offsets
Savings
Length of Loan (months)
Interest Rate
Monthly Loan Payment
Inflation rate
2.5%
Proposed Case Cost
Base Case Cost
3.0%
Proposed Case Rates
Page 43
Client:
Calc By: Check By: Job No.: File Name: Sheet Name: Date:
TK BAB 25025.00 Cogeneration Analysis ver18 final. NPV 10/26/2016
Depreciation schedule 4.0%
240
3.0%
$0
$0
0 1 2 3 4 5 6 7 8 9 10 11 12 13 14 15 16 17 18 19 20
Start 2017 Year-2017 Year-2018 Year-2019 Year-2020 Year-2021 Year-2022 Year-2023 Year-2024 Year-2025 Year-2026 Year-2027 Year-2028 Year-2029 Year-2030 Year-2031 Year-2032 Year-2033 Year-2034 Year-2035 Year-2036
2.5% 2.5% 2.5% 2.5% 2.5% 2.5% 2.5% 2.5% 2.5% 2.5% 2.5% 2.5% 2.5% 2.5% 2.5% 2.5% 2.5% 2.5% 2.5% 2.5%
2.0% 2.0% 2.0% 2.0% 2.0% 2.0% 2.0% 2.0% 2.0% 2.0% 2.0% 2.0% 2.0% 2.0% 2.0% 2.0% 2.0% 2.0% 2.0% 2.0%
Electric Demand Growth 3.0% 3.0% 3.0% 3.0% 3.0% 3.0% 3.0% 3.0% 3.0% 3.0% 3.0% 3.0% 3.0% 3.0% 3.0% 3.0% 3.0% 3.0% 3.0% 3.0%
0.0% -1.9% 2.5% 2.6% 2.3% 3.2% 0.6% 1.3% 2.1% 2.0% 2.7% 2.7% 1.5% 1.5% 1.5% 1.5% 1.5% 1.5% 1.5% 1.5%
1.5% 1.5% 1.5% 1.5% 1.5% 1.5% 1.5% 1.5% 1.5% 1.5% 1.5% 1.5% 1.5% 1.5% 1.5% 1.5% 1.5% 1.5% 1.5% 1.5%
Water 2.0% 2.0% 2.0% 2.0% 2.0% 2.0% 2.0% 2.0% 2.0% 2.0% 2.0% 2.0% 2.0% 2.0% 2.0% 2.0% 2.0% 2.0% 2.0% 2.0%
Solar Generation Degradation -0.04% -0.04% -0.04% -0.04% -0.04% -0.04% -0.04% -0.04% -0.04% -0.04% -0.04% -0.04% -0.04% -0.04% -0.04% -0.04% -0.04% -0.04% -0.04% -0.04%
Solar Rate Escalation 0.0% -1.7% 1.3% 0.9% 0.2% 1.8% -0.8% 0.1% 2.3% 2.2% 2.9% 4.4% 1.2% 1.2% 1.2% 1.2% 1.2% 1.2% 1.2% 1.2%
2.5% 2.5% 2.5% 2.5% 2.5% 2.5% 2.5% 2.5% 2.5% 2.5% 2.5% 2.5% 2.5% 2.5% 2.5% 2.5% 2.5% 2.5% 2.5% 2.5%
Emissions Growth Electric 0.0% -1.9% 2.5% 2.6% 2.3% 3.2% 0.6% 1.3% 2.1% 2.0% 2.7% 2.7% 1.5% 1.5% 1.5% 1.5% 1.5% 1.5% 1.5% 1.5%
Emissions Growth Gas 0.0% 0.0% 0.0% 0.0% 0.0% 0.0% 0.0% 0.0% 0.0% 0.0% 0.0% 0.0% 0.0% 0.0% 0.0% 0.0% 0.0% 0.0% 0.0% 0.0%
Carbon Rate Escalation 0.0% 8.0% 7.4% 6.9% 6.5% 6.1% 128.6% 3.8% 3.6% 3.5% 3.4% 3.3% 3.2% 3.1% 3.0% 11.5% 10.3% 9.4% 8.6% 7.9%
Year-2017 Year-2018 Year-2019 Year-2020 Year-2021 Year-2022 Year-2023 Year-2024 Year-2025 Year-2026 Year-2027 Year-2028 Year-2029 Year-2030 Year-2031 Year-2032 Year-2033 Year-2034 Year-2035 Year-2036
ELECTRIC ($/kWh) $0.126 $0.126 $0.129 $0.131 $0.134 $0.137 $0.139 $0.142 $0.145 $0.148 $0.151 $0.154 $0.157 $0.160 $0.163 $0.166 $0.170 $0.173 $0.177 $0.180 $0.184
NATURAL GAS ($/therm) $0.791 $0.79 $0.776 $0.80 $0.82 $0.83 $0.86 $0.87 $0.88 $0.90 $0.91 $0.94 $0.96 $0.98 $0.99 $1.01 $1.03 $1.04 $1.06 $1.07 $1.09
Year-2017 Year-2018 Year-2019 Year-2020 Year-2021 Year-2022 Year-2023 Year-2024 Year-2025 Year-2026 Year-2027 Year-2028 Year-2029 Year-2030 Year-2031 Year-2032 Year-2033 Year-2034 Year-2035 Year-2036 Total
ELECTRIC (kWh) 42,178,862 42,178,862 43,444,228 44,747,555 46,089,981 47,472,681 48,896,861 50,363,767 51,874,680 53,430,920 55,033,848 56,684,863 58,385,409 60,136,972 61,941,081 63,799,313 65,713,293 67,684,691 69,715,232 71,806,689 73,960,890 1,133,361,815
GAS (Therms) 5,093,806 5,093,806 5,170,213 5,247,766 5,326,483 5,406,380 5,487,476 5,569,788 5,653,335 5,738,135 5,824,207 5,911,570 6,000,243 6,090,247 6,181,601 6,274,325 6,368,440 6,463,966 6,560,926 6,659,340 6,759,230 117,787,475
Year-2017 Year-2018 Year-2019 Year-2020 Year-2021 Year-2022 Year-2023 Year-2024 Year-2025 Year-2026 Year-2027 Year-2028 Year-2029 Year-2030 Year-2031 Year-2032 Year-2033 Year-2034 Year-2035 Year-2036 Total
ELECTRIC $5,319,176 $5,319,176 $5,588,327 $5,871,096 $6,168,173 $6,480,283 $6,808,185 $7,152,679 $7,514,605 $7,894,844 $8,294,323 $8,714,016 $9,154,945 $9,618,185 $10,104,865 $10,616,172 $11,153,350 $11,717,709 $12,310,626 $12,933,543 $13,587,981 177,003,084$
GAS $4,031,301 $4,031,301 $4,012,083 $4,172,338 $4,345,876 $4,514,157 $4,727,385 $4,825,706 $4,960,073 $5,139,981 $5,323,333 $5,548,227 $5,786,175 $5,963,166 $6,145,656 $6,333,817 $6,527,827 $6,727,870 $6,934,135 $7,146,819 $7,366,122 110,532,046$
BASE CASE TOTAL $9,350,477 9,350,477$ 9,600,410$ 10,043,434$ 10,514,050$ 10,994,440$ 11,535,570$ 11,978,386$ 12,474,678$ 13,034,825$ 13,617,656$ 14,262,243$ 14,941,120$ 15,581,351$ 16,250,521$ 16,949,988$ 17,681,177$ 18,445,579$ 19,244,761$ 20,080,362$ 20,954,103$ 287,535,131$
Year-2017 Year-2018 Year-2019 Year-2020 Year-2021 Year-2022 Year-2023 Year-2024 Year-2025 Year-2026 Year-2027 Year-2028 Year-2029 Year-2030 Year-2031 Year-2032 Year-2033 Year-2034 Year-2035 Year-2036
ELECTRIC ($/kWh) $0.126 $0.126 $0.129 $0.131 $0.134 $0.137 $0.139 $0.142 $0.145 $0.148 $0.151 $0.154 $0.157 $0.160 $0.163 $0.166 $0.170 $0.173 $0.177 $0.180 $0.184
NATURAL GAS ($/therm) $0.757 $0.76 $0.74 $0.76 $0.78 $0.80 $0.82 $0.83 $0.84 $0.86 $0.87 $0.90 $0.92 $0.94 $0.95 $0.97 $0.98 $1.00 $1.01 $1.03 $1.04
WATER ($/CCF) $0.860 $0.86 $0.88 $0.89 $0.91 $0.93 $0.95 $0.97 $0.99 $1.01 $1.03 $1.05 $1.07 $1.09 $1.11 $1.13 $1.16 $1.18 $1.20 $1.23 $1.25
SOLAR ($/kWh) $0.068 $0.07 $0.07 $0.07 $0.07 $0.07 $0.07 $0.07 $0.07 $0.07 $0.07 $0.07 $0.08 $0.08 $0.08 $0.08 $0.08 $0.08 $0.08 $0.08 $0.09
CARBON CREDIT ($/Short Ton) $6.25 $6.25 $6.75 $7.25 $7.75 $8.25 $8.75 $20.00 $20.75 $21.50 $22.25 $23.00 $23.75 $24.50 $25.25 $26.00 $29.00 $32.00 $35.00 $38.00 $41.00
Year-2017 Year-2018 Year-2019 Year-2020 Year-2021 Year-2022 Year-2023 Year-2024 Year-2025 Year-2026 Year-2027 Year-2028 Year-2029 Year-2030 Year-2031 Year-2032 Year-2033 Year-2034 Year-2035 Year-2036 Total
PURCHASED ELECTRIC (kWh) 7,022,438 7,022,438 7,233,111 7,450,104 7,673,607 7,903,815 8,140,930 8,385,158 8,636,713 8,895,814 9,162,688 9,437,569 9,720,696 10,012,317 10,312,686 10,622,067 10,940,729 11,268,951 11,607,019 11,955,230 12,313,887 188,695,530
PURCHASED SOLAR (kWh) 0 0 0 0 0 0 0 0 0 0 0 0 0 0 0 0 0 0 0 0 0 0
COGEN + BOILER GAS (Therms) 7,607,274 7,607,274 7,721,383 7,837,204 7,954,762 8,074,084 8,195,195 8,318,123 8,442,895 8,569,538 8,698,081 8,828,552 8,960,981 9,095,395 9,231,826 9,370,304 9,510,858 9,653,521 9,798,324 9,945,299 10,094,478 175,908,075
WATER (Gallons) 0 0 0 0 0 0 0 0 0 0 0 0 0 0 0 0 0 0 0 0 0 0
Short Ton CO2 Electric Consumption 2,212 2,212 2,234 2,358 2,492 2,627 2,791 2,892 3,016 3,172 3,333 3,525 3,731 3,902 4,081 4,268 4,464 4,668 4,883 5,107 5,341 71,097
Short Ton CO2 Gas Consumption 44,506 44,506 45,174 45,852 46,539 47,237 47,946 48,665 49,395 50,136 50,888 51,651 52,426 53,213 54,011 54,821 55,643 56,478 57,325 58,185 59,058 1,029,150
Year-2017 Year-2018 Year-2019 Year-2020 Year-2021 Year-2022 Year-2023 Year-2024 Year-2025 Year-2026 Year-2027 Year-2028 Year-2029 Year-2030 Year-2031 Year-2032 Year-2033 Year-2034 Year-2035 Year-2036 Total
ELECTRIC $885,600 $885,600 $930,411 $977,490 $1,026,951 $1,078,914 $1,133,508 $1,190,863 $1,251,121 $1,314,427 $1,380,937 $1,450,813 $1,524,224 $1,601,350 $1,682,378 $1,767,506 $1,856,942 $1,950,903 $2,049,619 $2,153,330 $2,262,288 29,469,575$
SOLAR $0 $0 $0 $0 $0 $0 $0 $0 $0 $0 $0 $0 $0 $0 $0 $0 $0 $0 $0 $0 $0 -$
GAS $5,759,307 $5,759,307 $5,731,852 $5,960,800 $6,208,724 $6,449,139 $6,753,766 $6,894,232 $7,086,194 $7,343,220 $7,605,165 $7,926,459 $8,266,403 $8,519,261 $8,779,975 $9,048,790 $9,325,962 $9,611,753 $9,906,433 $10,210,283 $10,523,591 157,911,308$
MAINTENANCE $347,400 $347,400 $356,085 $364,987 $374,112 $383,465 $393,051 $402,877 $412,949 $423,273 $433,855 $444,701 $455,819 $467,214 $478,895 $490,867 $503,139 $515,717 $528,610 $541,825 $555,371 8,874,214$
STAFFING $300,000 $300,000 $307,500 $315,188 $323,067 $331,144 $339,422 $347,908 $356,606 $365,521 $374,659 $384,025 $393,626 $403,467 $413,553 $423,892 $434,489 $445,352 $456,485 $467,898 $479,595 7,663,397$
Other $0 $0 $0 $0 $0 $0 $0 $0 $0 $0 $0 $0 $0 $0 $0 $0 $0 $0 $0 $0 $0 -$
WATER $0 $0 $0 $0 $0 $0 $0 $0 $0 $0 $0 $0 $0 $0 $0 $0 $0 $0 $0 $0 $0 -$
PROPOSED CASE TOTAL 7,292,306$ 7,292,306$ 7,325,848$ 7,618,464$ 7,932,854$ 8,242,662$ 8,619,747$ 8,835,881$ 9,106,870$ 9,446,442$ 9,794,616$ 10,205,999$ 10,640,072$ 10,991,292$ 11,354,801$ 11,731,056$ 12,120,532$ 12,523,725$ 12,941,148$ 13,373,336$ 13,820,845$ 203,918,494$
Year-2017 Year-2018 Year-2019 Year-2020 Year-2021 Year-2022 Year-2023 Year-2024 Year-2025 Year-2026 Year-2027 Year-2028 Year-2029 Year-2030 Year-2031 Year-2032 Year-2033 Year-2034 Year-2035 Year-2036 Total
Net Energy Savings 2,058,171$ 2,058,171$ 2,274,562$ 2,424,970$ 2,581,196$ 2,751,779$ 2,915,823$ 3,142,505$ 3,367,808$ 3,588,384$ 3,823,040$ 4,056,244$ 4,301,048$ 4,590,060$ 4,895,721$ 5,218,933$ 5,560,644$ 5,921,854$ 6,303,613$ 6,707,026$ 7,133,258$ 83,616,636$
Depreciation -$ -$ -$ -$ -$ -$ -$ -$ -$
Interest -$ -$ -$ -$ -$ -$ -$ -$ -$ -$ -$ -$ -$ -$ -$ -$ -$ -$ -$ -$ -$
Net Taxable Income 2,058,171$ 2,274,562$ 2,424,970$ 2,581,196$ 2,751,779$ 2,915,823$ 3,142,505$ 3,367,808$ 3,588,384$ 3,823,040$ 4,056,244$ 4,301,048$ 4,590,060$ 4,895,721$ 5,218,933$ 5,560,644$ 5,921,854$ 6,303,613$ 6,707,026$ 7,133,258$ 83,616,636$
Income Tax $0 $0 $0 $0 $0 $0 $0 $0 $0 $0 $0 $0 $0 $0 $0 $0 $0 $0 $0 $0 -$
After Tax Income 2,058,171$ 2,274,562$ 2,424,970$ 2,581,196$ 2,751,779$ 2,915,823$ 3,142,505$ 3,367,808$ 3,588,384$ 3,823,040$ 4,056,244$ 4,301,048$ 4,590,060$ 4,895,721$ 5,218,933$ 5,560,644$ 5,921,854$ 6,303,613$ 6,707,026$ 7,133,258$ 83,616,636$
Principal -$ -$ -$ -$ -$ -$ -$ -$ -$ -$ -$ -$ -$ -$ -$ -$ -$ -$ -$ -$ -$
Net Savings $0 $2,058,171 $2,274,562 $2,424,970 $2,581,196 $2,751,779 $2,915,823 $3,142,505 $3,367,808 $3,588,384 $3,823,040 $4,056,244 $4,301,048 $4,590,060 $4,895,721 $5,218,933 $5,560,644 $5,921,854 $6,303,613 $6,707,026 $7,133,258 83,616,636$
Carbon Credit Cost $291,990 $291,990 $320,004 $349,517 $379,993 $411,379 $443,953 $1,031,136 $1,087,533 $1,146,116 $1,206,427 $1,269,069 $1,333,734 $1,399,307 $1,466,813 $1,536,311 $1,743,101 $1,956,683 $2,177,271 $2,405,087 $2,640,360 24,595,783$
Proposed Total With Carbon Credits $7,584,296 $7,584,296 $7,645,852 $7,967,981 $8,312,847 $8,654,041 $9,063,700 $9,867,017 $10,194,403 $10,592,558 $11,001,043 $11,475,068 $11,973,806 $12,390,599 $12,821,614 $13,267,366 $13,863,633 $14,480,408 $15,118,419 $15,778,423 $16,461,205 228,514,278$
20 Yr PV of Savings vs Base Case both w/Carbon Offsets
20 Yr PV Cost without Carbon Offsets
20 Yr PV Cost with Carbon Offsets
$52,325,681$52,325,681$52,325,681$52,325,681
$132,440,008$132,440,008$132,440,008$132,440,008
$147,094,060$147,094,060$147,094,060$147,094,060
20 Yr PV Cost of Carbon Offsets
$49,102,166$49,102,166$49,102,166$49,102,166
$14,654,052$14,654,052$14,654,052$14,654,052
Base Case Rates
Base Case Consumption
Electric Rate Escalation
Gas Rate Escalation
University of Maine Orono
Project:
Proposed Case Consumption
Yearly Loan PaymentEstimated Federal and State Tax Rate
-$ Installed Cost
0.0%
Gas Demand Growth
Cogeneration Feasibility Study
Inflation rate
Interest Rate
Maintenance & Operation
Energy Consumption - CHP Plant at the East Campus with Electric Load Following and no Summer Steam Load - Option 3B ECONOMIC PRO FORMA
Discount Rate
Topic:
20 Yr PV of Savings vs Base Case both w/o Carbon Offsets
Savings
Length of Loan (months)
Interest Rate
Monthly Loan Payment
Inflation rate
2.5%
Proposed Case Cost
Base Case Cost
3.0%
Proposed Case Rates
Page 44
Client:
Calc By: Check By: Job No.: File Name: Sheet Name: Date:
TK BAB 25025.00 Cogeneration Analysis ver18 final. NPV 10/26/2016
Depreciation schedule 4.0%
240
3.0%
$0
$0
0 1 2 3 4 5 6 7 8 9 10 11 12 13 14 15 16 17 18 19 20
Start 2017 Year-2017 Year-2018 Year-2019 Year-2020 Year-2021 Year-2022 Year-2023 Year-2024 Year-2025 Year-2026 Year-2027 Year-2028 Year-2029 Year-2030 Year-2031 Year-2032 Year-2033 Year-2034 Year-2035 Year-2036
2.5% 2.5% 2.5% 2.5% 2.5% 2.5% 2.5% 2.5% 2.5% 2.5% 2.5% 2.5% 2.5% 2.5% 2.5% 2.5% 2.5% 2.5% 2.5% 2.5%
2.0% 2.0% 2.0% 2.0% 2.0% 2.0% 2.0% 2.0% 2.0% 2.0% 2.0% 2.0% 2.0% 2.0% 2.0% 2.0% 2.0% 2.0% 2.0% 2.0%
Electric Demand Growth 3.0% 3.0% 3.0% 3.0% 3.0% 3.0% 3.0% 3.0% 3.0% 3.0% 3.0% 3.0% 3.0% 3.0% 3.0% 3.0% 3.0% 3.0% 3.0% 3.0%
0.0% -1.9% 2.5% 2.6% 2.3% 3.2% 0.6% 1.3% 2.1% 2.0% 2.7% 2.7% 1.5% 1.5% 1.5% 1.5% 1.5% 1.5% 1.5% 1.5%
1.5% 1.5% 1.5% 1.5% 1.5% 1.5% 1.5% 1.5% 1.5% 1.5% 1.5% 1.5% 1.5% 1.5% 1.5% 1.5% 1.5% 1.5% 1.5% 1.5%
Water 2.0% 2.0% 2.0% 2.0% 2.0% 2.0% 2.0% 2.0% 2.0% 2.0% 2.0% 2.0% 2.0% 2.0% 2.0% 2.0% 2.0% 2.0% 2.0% 2.0%
Solar Generation Degradation -0.04% -0.04% -0.04% -0.04% -0.04% -0.04% -0.04% -0.04% -0.04% -0.04% -0.04% -0.04% -0.04% -0.04% -0.04% -0.04% -0.04% -0.04% -0.04% -0.04%
Solar Rate Escalation 0.0% -1.7% 1.3% 0.9% 0.2% 1.8% -0.8% 0.1% 2.3% 2.2% 2.9% 4.4% 1.2% 1.2% 1.2% 1.2% 1.2% 1.2% 1.2% 1.2%
2.5% 2.5% 2.5% 2.5% 2.5% 2.5% 2.5% 2.5% 2.5% 2.5% 2.5% 2.5% 2.5% 2.5% 2.5% 2.5% 2.5% 2.5% 2.5% 2.5%
Emissions Growth Electric 0.0% -1.9% 2.5% 2.6% 2.3% 3.2% 0.6% 1.3% 2.1% 2.0% 2.7% 2.7% 1.5% 1.5% 1.5% 1.5% 1.5% 1.5% 1.5% 1.5%
Emissions Growth Gas 0.0% 0.0% 0.0% 0.0% 0.0% 0.0% 0.0% 0.0% 0.0% 0.0% 0.0% 0.0% 0.0% 0.0% 0.0% 0.0% 0.0% 0.0% 0.0% 0.0%
Carbon Rate Escalation 0.0% 8.0% 7.4% 6.9% 6.5% 6.1% 128.6% 3.8% 3.6% 3.5% 3.4% 3.3% 3.2% 3.1% 3.0% 11.5% 10.3% 9.4% 8.6% 7.9%
Year-2017 Year-2018 Year-2019 Year-2020 Year-2021 Year-2022 Year-2023 Year-2024 Year-2025 Year-2026 Year-2027 Year-2028 Year-2029 Year-2030 Year-2031 Year-2032 Year-2033 Year-2034 Year-2035 Year-2036
ELECTRIC ($/kWh) $0.126 $0.126 $0.129 $0.131 $0.134 $0.137 $0.139 $0.142 $0.145 $0.148 $0.151 $0.154 $0.157 $0.160 $0.163 $0.166 $0.170 $0.173 $0.177 $0.180 $0.184
NATURAL GAS ($/therm) $0.791 $0.79 $0.776 $0.80 $0.82 $0.83 $0.86 $0.87 $0.88 $0.90 $0.91 $0.94 $0.96 $0.98 $0.99 $1.01 $1.03 $1.04 $1.06 $1.07 $1.09
Year-2017 Year-2018 Year-2019 Year-2020 Year-2021 Year-2022 Year-2023 Year-2024 Year-2025 Year-2026 Year-2027 Year-2028 Year-2029 Year-2030 Year-2031 Year-2032 Year-2033 Year-2034 Year-2035 Year-2036 Total
ELECTRIC (kWh) 42,178,862 42,178,862 43,444,228 44,747,555 46,089,981 47,472,681 48,896,861 50,363,767 51,874,680 53,430,920 55,033,848 56,684,863 58,385,409 60,136,972 61,941,081 63,799,313 65,713,293 67,684,691 69,715,232 71,806,689 73,960,890 1,133,361,815
GAS (Therms) 5,093,806 5,093,806 5,170,213 5,247,766 5,326,483 5,406,380 5,487,476 5,569,788 5,653,335 5,738,135 5,824,207 5,911,570 6,000,243 6,090,247 6,181,601 6,274,325 6,368,440 6,463,966 6,560,926 6,659,340 6,759,230 117,787,475
Year-2017 Year-2018 Year-2019 Year-2020 Year-2021 Year-2022 Year-2023 Year-2024 Year-2025 Year-2026 Year-2027 Year-2028 Year-2029 Year-2030 Year-2031 Year-2032 Year-2033 Year-2034 Year-2035 Year-2036 Total
ELECTRIC $5,319,176 $5,319,176 $5,588,327 $5,871,096 $6,168,173 $6,480,283 $6,808,185 $7,152,679 $7,514,605 $7,894,844 $8,294,323 $8,714,016 $9,154,945 $9,618,185 $10,104,865 $10,616,172 $11,153,350 $11,717,709 $12,310,626 $12,933,543 $13,587,981 177,003,084$
GAS $4,031,301 $4,031,301 $4,012,083 $4,172,338 $4,345,876 $4,514,157 $4,727,385 $4,825,706 $4,960,073 $5,139,981 $5,323,333 $5,548,227 $5,786,175 $5,963,166 $6,145,656 $6,333,817 $6,527,827 $6,727,870 $6,934,135 $7,146,819 $7,366,122 110,532,046$
BASE CASE TOTAL $9,350,477 9,350,477$ 9,600,410$ 10,043,434$ 10,514,050$ 10,994,440$ 11,535,570$ 11,978,386$ 12,474,678$ 13,034,825$ 13,617,656$ 14,262,243$ 14,941,120$ 15,581,351$ 16,250,521$ 16,949,988$ 17,681,177$ 18,445,579$ 19,244,761$ 20,080,362$ 20,954,103$ 287,535,131$
Year-2017 Year-2018 Year-2019 Year-2020 Year-2021 Year-2022 Year-2023 Year-2024 Year-2025 Year-2026 Year-2027 Year-2028 Year-2029 Year-2030 Year-2031 Year-2032 Year-2033 Year-2034 Year-2035 Year-2036
ELECTRIC ($/kWh) $0.126 $0.126 $0.129 $0.131 $0.134 $0.137 $0.139 $0.142 $0.145 $0.148 $0.151 $0.154 $0.157 $0.160 $0.163 $0.166 $0.170 $0.173 $0.177 $0.180 $0.184
NATURAL GAS ($/therm) $0.753 $0.75 $0.74 $0.76 $0.78 $0.79 $0.82 $0.82 $0.83 $0.85 $0.87 $0.89 $0.92 $0.93 $0.95 $0.96 $0.97 $0.99 $1.01 $1.02 $1.04
WATER ($/CCF) $0.860 $0.86 $0.88 $0.89 $0.91 $0.93 $0.95 $0.97 $0.99 $1.01 $1.03 $1.05 $1.07 $1.09 $1.11 $1.13 $1.16 $1.18 $1.20 $1.23 $1.25
SOLAR ($/kWh) $0.068 $0.07 $0.07 $0.07 $0.07 $0.07 $0.07 $0.07 $0.07 $0.07 $0.07 $0.07 $0.08 $0.08 $0.08 $0.08 $0.08 $0.08 $0.08 $0.08 $0.09
CARBON CREDIT ($/Short Ton) $6.25 $6.25 $6.75 $7.25 $7.75 $8.25 $8.75 $20.00 $20.75 $21.50 $22.25 $23.00 $23.75 $24.50 $25.25 $26.00 $29.00 $32.00 $35.00 $38.00 $41.00
Year-2017 Year-2018 Year-2019 Year-2020 Year-2021 Year-2022 Year-2023 Year-2024 Year-2025 Year-2026 Year-2027 Year-2028 Year-2029 Year-2030 Year-2031 Year-2032 Year-2033 Year-2034 Year-2035 Year-2036 Total
PURCHASED ELECTRIC (kWh) 5,159,267 5,159,267 5,314,045 5,473,466 5,637,670 5,806,800 5,981,004 6,160,434 6,345,247 6,535,604 6,731,673 6,933,623 7,141,631 7,355,880 7,576,557 7,803,854 8,037,969 8,279,108 8,527,481 8,783,306 9,046,805 138,631,423
PURCHASED SOLAR (kWh) 2,466,685 2,466,685 2,465,699 2,464,712 2,463,727 2,462,741 2,461,756 2,460,771 2,459,787 2,458,803 2,457,819 2,456,836 2,455,854 2,454,871 2,453,889 2,452,908 2,451,927 2,450,946 2,449,965 2,448,985 2,448,006 49,146,688
COGEN + BOILER GAS (Therms) 7,728,176 7,728,176 7,844,098 7,961,760 8,081,186 8,202,404 8,325,440 8,450,321 8,577,076 8,705,732 8,836,318 8,968,863 9,103,396 9,239,947 9,378,546 9,519,224 9,662,013 9,806,943 9,954,047 10,103,358 10,254,908 178,703,758
WATER (Gallons) 0 0 0 0 0 0 0 0 0 0 0 0 0 0 0 0 0 0 0 0 0 0
Short Ton CO2 Electric Consumption 1,625 1,625 1,641 1,732 1,831 1,930 2,051 2,124 2,216 2,330 2,449 2,590 2,741 2,867 2,998 3,136 3,279 3,430 3,587 3,752 3,924 52,233
Short Ton CO2 Gas Consumption 45,214 45,214 45,892 46,580 47,279 47,988 48,708 49,439 50,180 50,933 51,697 52,472 53,259 54,058 54,869 55,692 56,528 57,376 58,236 59,110 59,996 1,045,506
Year-2017 Year-2018 Year-2019 Year-2020 Year-2021 Year-2022 Year-2023 Year-2024 Year-2025 Year-2026 Year-2027 Year-2028 Year-2029 Year-2030 Year-2031 Year-2032 Year-2033 Year-2034 Year-2035 Year-2036 Total
ELECTRIC $650,635 $650,635 $683,557 $718,145 $754,483 $792,660 $832,769 $874,907 $919,177 $965,688 $1,014,551 $1,065,888 $1,119,822 $1,176,485 $1,236,015 $1,298,557 $1,364,264 $1,433,296 $1,505,821 $1,582,015 $1,662,065 21,650,800$
SOLAR $168,524 $168,524 $165,569 $167,597 $169,066 $169,413 $172,405 $170,903 $170,964 $174,886 $178,688 $183,871 $191,909 $194,051 $196,217 $198,404 $200,615 $202,848 $205,104 $207,382 $209,684 3,698,099$
GAS $5,816,901 $5,816,901 $5,789,171 $6,020,409 $6,270,813 $6,513,631 $6,821,305 $6,963,176 $7,157,057 $7,416,654 $7,681,218 $8,005,725 $8,349,068 $8,604,455 $8,867,776 $9,139,279 $9,419,223 $9,707,872 $10,005,499 $10,312,388 $10,628,828 159,490,447$
MAINTENANCE $347,400 $347,400 $356,085 $364,987 $374,112 $383,465 $393,051 $402,877 $412,949 $423,273 $433,855 $444,701 $455,819 $467,214 $478,895 $490,867 $503,139 $515,717 $528,610 $541,825 $555,371 8,874,214$
STAFFING $300,000 $300,000 $307,500 $315,188 $323,067 $331,144 $339,422 $347,908 $356,606 $365,521 $374,659 $384,025 $393,626 $403,467 $413,553 $423,892 $434,489 $445,352 $456,485 $467,898 $479,595 7,663,397$
Other $0 $0 $0 $0 $0 $0 $0 $0 $0 $0 $0 $0 $0 $0 $0 $0 $0 $0 $0 $0 $0 -$
WATER $0 $0 $0 $0 $0 $0 $0 $0 $0 $0 $0 $0 $0 $0 $0 $0 $0 $0 $0 $0 $0 -$
PROPOSED CASE TOTAL 7,283,460$ 7,283,460$ 7,301,882$ 7,586,326$ 7,891,541$ 8,190,313$ 8,558,952$ 8,759,771$ 9,016,753$ 9,346,021$ 9,682,971$ 10,084,211$ 10,510,243$ 10,845,672$ 11,192,455$ 11,551,000$ 11,921,730$ 12,305,084$ 12,701,519$ 13,111,508$ 13,535,543$ 201,376,958$
Year-2017 Year-2018 Year-2019 Year-2020 Year-2021 Year-2022 Year-2023 Year-2024 Year-2025 Year-2026 Year-2027 Year-2028 Year-2029 Year-2030 Year-2031 Year-2032 Year-2033 Year-2034 Year-2035 Year-2036 Total
Net Energy Savings 2,067,017$ 2,067,017$ 2,298,528$ 2,457,108$ 2,622,509$ 2,804,127$ 2,976,618$ 3,218,615$ 3,457,924$ 3,688,804$ 3,934,685$ 4,178,032$ 4,430,877$ 4,735,679$ 5,058,066$ 5,398,988$ 5,759,446$ 6,140,495$ 6,543,241$ 6,968,854$ 7,418,560$ 86,158,173$
Depreciation -$ -$ -$ -$ -$ -$ -$ -$ -$
Interest -$ -$ -$ -$ -$ -$ -$ -$ -$ -$ -$ -$ -$ -$ -$ -$ -$ -$ -$ -$ -$
Net Taxable Income 2,067,017$ 2,298,528$ 2,457,108$ 2,622,509$ 2,804,127$ 2,976,618$ 3,218,615$ 3,457,924$ 3,688,804$ 3,934,685$ 4,178,032$ 4,430,877$ 4,735,679$ 5,058,066$ 5,398,988$ 5,759,446$ 6,140,495$ 6,543,241$ 6,968,854$ 7,418,560$ 86,158,173$
Income Tax $0 $0 $0 $0 $0 $0 $0 $0 $0 $0 $0 $0 $0 $0 $0 $0 $0 $0 $0 $0 -$
After Tax Income 2,067,017$ 2,298,528$ 2,457,108$ 2,622,509$ 2,804,127$ 2,976,618$ 3,218,615$ 3,457,924$ 3,688,804$ 3,934,685$ 4,178,032$ 4,430,877$ 4,735,679$ 5,058,066$ 5,398,988$ 5,759,446$ 6,140,495$ 6,543,241$ 6,968,854$ 7,418,560$ 86,158,173$
Principal -$ -$ -$ -$ -$ -$ -$ -$ -$ -$ -$ -$ -$ -$ -$ -$ -$ -$ -$ -$ -$
Net Savings $0 $2,067,017 $2,298,528 $2,457,108 $2,622,509 $2,804,127 $2,976,618 $3,218,615 $3,457,924 $3,688,804 $3,934,685 $4,178,032 $4,430,877 $4,735,679 $5,058,066 $5,398,988 $5,759,446 $6,140,495 $6,543,241 $6,968,854 $7,418,560 86,158,173$
Carbon Credit Cost $292,743 $292,743 $320,849 $350,265 $380,601 $411,823 $444,140 $1,031,261 $1,087,218 $1,145,155 $1,204,744 $1,266,436 $1,330,013 $1,394,663 $1,461,149 $1,529,522 $1,734,402 $1,945,771 $2,163,817 $2,388,739 $2,620,740 24,504,052$
Proposed Total With Carbon Credits $7,576,203 $7,576,203 $7,622,731 $7,936,590 $8,272,142 $8,602,137 $9,003,092 $9,791,032 $10,103,971 $10,491,177 $10,887,715 $11,350,648 $11,840,256 $12,240,335 $12,653,604 $13,080,523 $13,656,132 $14,250,855 $14,865,337 $15,500,247 $16,156,283 225,881,010$
20 Yr PV of Savings vs Base Case both w/Carbon Offsets
20 Yr PV Cost without Carbon Offsets
20 Yr PV Cost with Carbon Offsets
$53,813,509$53,813,509$53,813,509$53,813,509
$130,952,181$130,952,181$130,952,181$130,952,181
$145,560,024$145,560,024$145,560,024$145,560,024
20 Yr PV Cost of Carbon Offsets
$50,636,203$50,636,203$50,636,203$50,636,203
$14,607,842$14,607,842$14,607,842$14,607,842
Base Case Rates
Base Case Consumption
Electric Rate Escalation
Gas Rate Escalation
University of Maine Orono
Project:
Proposed Case Consumption
Yearly Loan PaymentEstimated Federal and State Tax Rate
-$ Installed Cost
0.0%
Gas Demand Growth
Cogeneration Feasibility Study
Inflation rate
Interest Rate
Maintenance & Operation
Energy Consumption - CHP Plant at the East Campus with Electric Load Following and Solar Generation - Option 3C ECONOMIC PRO FORMA
Discount Rate
Topic:
20 Yr PV of Savings vs Base Case both w/o Carbon Offsets
Savings
Length of Loan (months)
Interest Rate
Monthly Loan Payment
Inflation rate
2.5%
Proposed Case Cost
Base Case Cost
3.0%
Proposed Case Rates
Page 45
Client:
Calc By: Check By: Job No.: File Name: Sheet Name: Date:
TK BAB 25025.00 Cogeneration Analysis ver18 final. NPV 10/26/2016
Depreciation schedule 4.0%
240
3.0%
$0
$0
0 1 2 3 4 5 6 7 8 9 10 11 12 13 14 15 16 17 18 19 20
Start 2017 Year-2017 Year-2018 Year-2019 Year-2020 Year-2021 Year-2022 Year-2023 Year-2024 Year-2025 Year-2026 Year-2027 Year-2028 Year-2029 Year-2030 Year-2031 Year-2032 Year-2033 Year-2034 Year-2035 Year-2036
2.5% 2.5% 2.5% 2.5% 2.5% 2.5% 2.5% 2.5% 2.5% 2.5% 2.5% 2.5% 2.5% 2.5% 2.5% 2.5% 2.5% 2.5% 2.5% 2.5%
2.0% 2.0% 2.0% 2.0% 2.0% 2.0% 2.0% 2.0% 2.0% 2.0% 2.0% 2.0% 2.0% 2.0% 2.0% 2.0% 2.0% 2.0% 2.0% 2.0%
Electric Demand Growth 3.0% 3.0% 3.0% 3.0% 3.0% 3.0% 3.0% 3.0% 3.0% 3.0% 3.0% 3.0% 3.0% 3.0% 3.0% 3.0% 3.0% 3.0% 3.0% 3.0%
0.0% -1.9% 2.5% 2.6% 2.3% 3.2% 0.6% 1.3% 2.1% 2.0% 2.7% 2.7% 1.5% 1.5% 1.5% 1.5% 1.5% 1.5% 1.5% 1.5%
1.5% 1.5% 1.5% 1.5% 1.5% 1.5% 1.5% 1.5% 1.5% 1.5% 1.5% 1.5% 1.5% 1.5% 1.5% 1.5% 1.5% 1.5% 1.5% 1.5%
Water 2.0% 2.0% 2.0% 2.0% 2.0% 2.0% 2.0% 2.0% 2.0% 2.0% 2.0% 2.0% 2.0% 2.0% 2.0% 2.0% 2.0% 2.0% 2.0% 2.0%
Solar Generation Degradation -0.04% -0.04% -0.04% -0.04% -0.04% -0.04% -0.04% -0.04% -0.04% -0.04% -0.04% -0.04% -0.04% -0.04% -0.04% -0.04% -0.04% -0.04% -0.04% -0.04%
Solar Rate Escalation 0.0% -1.7% 1.3% 0.9% 0.2% 1.8% -0.8% 0.1% 2.3% 2.2% 2.9% 4.4% 1.2% 1.2% 1.2% 1.2% 1.2% 1.2% 1.2% 1.2%
2.5% 2.5% 2.5% 2.5% 2.5% 2.5% 2.5% 2.5% 2.5% 2.5% 2.5% 2.5% 2.5% 2.5% 2.5% 2.5% 2.5% 2.5% 2.5% 2.5%
Emissions Growth Electric 0.0% -1.9% 2.5% 2.6% 2.3% 3.2% 0.6% 1.3% 2.1% 2.0% 2.7% 2.7% 1.5% 1.5% 1.5% 1.5% 1.5% 1.5% 1.5% 1.5%
Emissions Growth Gas 0.0% 0.0% 0.0% 0.0% 0.0% 0.0% 0.0% 0.0% 0.0% 0.0% 0.0% 0.0% 0.0% 0.0% 0.0% 0.0% 0.0% 0.0% 0.0% 0.0%
Carbon Rate Escalation 0.0% 8.0% 7.4% 6.9% 6.5% 6.1% 128.6% 3.8% 3.6% 3.5% 3.4% 3.3% 3.2% 3.1% 3.0% 11.5% 10.3% 9.4% 8.6% 7.9%
Year-2017 Year-2018 Year-2019 Year-2020 Year-2021 Year-2022 Year-2023 Year-2024 Year-2025 Year-2026 Year-2027 Year-2028 Year-2029 Year-2030 Year-2031 Year-2032 Year-2033 Year-2034 Year-2035 Year-2036
ELECTRIC ($/kWh) $0.126 $0.126 $0.129 $0.131 $0.134 $0.137 $0.139 $0.142 $0.145 $0.148 $0.151 $0.154 $0.157 $0.160 $0.163 $0.166 $0.170 $0.173 $0.177 $0.180 $0.184
NATURAL GAS ($/therm) $0.791 $0.79 $0.776 $0.80 $0.82 $0.83 $0.86 $0.87 $0.88 $0.90 $0.91 $0.94 $0.96 $0.98 $0.99 $1.01 $1.03 $1.04 $1.06 $1.07 $1.09
Year-2017 Year-2018 Year-2019 Year-2020 Year-2021 Year-2022 Year-2023 Year-2024 Year-2025 Year-2026 Year-2027 Year-2028 Year-2029 Year-2030 Year-2031 Year-2032 Year-2033 Year-2034 Year-2035 Year-2036 Total
ELECTRIC (kWh) 42,178,862 42,178,862 43,444,228 44,747,555 46,089,981 47,472,681 48,896,861 50,363,767 51,874,680 53,430,920 55,033,848 56,684,863 58,385,409 60,136,972 61,941,081 63,799,313 65,713,293 67,684,691 69,715,232 71,806,689 73,960,890 1,133,361,815
GAS (Therms) 5,093,806 5,093,806 5,170,213 5,247,766 5,326,483 5,406,380 5,487,476 5,569,788 5,653,335 5,738,135 5,824,207 5,911,570 6,000,243 6,090,247 6,181,601 6,274,325 6,368,440 6,463,966 6,560,926 6,659,340 6,759,230 117,787,475
Year-2017 Year-2018 Year-2019 Year-2020 Year-2021 Year-2022 Year-2023 Year-2024 Year-2025 Year-2026 Year-2027 Year-2028 Year-2029 Year-2030 Year-2031 Year-2032 Year-2033 Year-2034 Year-2035 Year-2036 Total
ELECTRIC $5,319,176 $5,319,176 $5,588,327 $5,871,096 $6,168,173 $6,480,283 $6,808,185 $7,152,679 $7,514,605 $7,894,844 $8,294,323 $8,714,016 $9,154,945 $9,618,185 $10,104,865 $10,616,172 $11,153,350 $11,717,709 $12,310,626 $12,933,543 $13,587,981 177,003,084$
GAS $4,031,301 $4,031,301 $4,012,083 $4,172,338 $4,345,876 $4,514,157 $4,727,385 $4,825,706 $4,960,073 $5,139,981 $5,323,333 $5,548,227 $5,786,175 $5,963,166 $6,145,656 $6,333,817 $6,527,827 $6,727,870 $6,934,135 $7,146,819 $7,366,122 110,532,046$
BASE CASE TOTAL $9,350,477 9,350,477$ 9,600,410$ 10,043,434$ 10,514,050$ 10,994,440$ 11,535,570$ 11,978,386$ 12,474,678$ 13,034,825$ 13,617,656$ 14,262,243$ 14,941,120$ 15,581,351$ 16,250,521$ 16,949,988$ 17,681,177$ 18,445,579$ 19,244,761$ 20,080,362$ 20,954,103$ 287,535,131$
Year-2017 Year-2018 Year-2019 Year-2020 Year-2021 Year-2022 Year-2023 Year-2024 Year-2025 Year-2026 Year-2027 Year-2028 Year-2029 Year-2030 Year-2031 Year-2032 Year-2033 Year-2034 Year-2035 Year-2036
ELECTRIC ($/kWh) $0.126 $0.126 $0.129 $0.131 $0.134 $0.137 $0.139 $0.142 $0.145 $0.148 $0.151 $0.154 $0.157 $0.160 $0.163 $0.166 $0.170 $0.173 $0.177 $0.180 $0.184
NATURAL GAS ($/therm) $0.758 $0.76 $0.74 $0.76 $0.78 $0.80 $0.82 $0.83 $0.84 $0.86 $0.87 $0.90 $0.92 $0.94 $0.95 $0.97 $0.98 $1.00 $1.01 $1.03 $1.04
WATER ($/CCF) $0.860 $0.86 $0.88 $0.89 $0.91 $0.93 $0.95 $0.97 $0.99 $1.01 $1.03 $1.05 $1.07 $1.09 $1.11 $1.13 $1.16 $1.18 $1.20 $1.23 $1.25
SOLAR ($/kWh) $0.068 $0.07 $0.07 $0.07 $0.07 $0.07 $0.07 $0.07 $0.07 $0.07 $0.07 $0.07 $0.08 $0.08 $0.08 $0.08 $0.08 $0.08 $0.08 $0.08 $0.09
CARBON CREDIT ($/Short Ton) $6.25 $6.25 $6.75 $7.25 $7.75 $8.25 $8.75 $20.00 $20.75 $21.50 $22.25 $23.00 $23.75 $24.50 $25.25 $26.00 $29.00 $32.00 $35.00 $38.00 $41.00
Year-2017 Year-2018 Year-2019 Year-2020 Year-2021 Year-2022 Year-2023 Year-2024 Year-2025 Year-2026 Year-2027 Year-2028 Year-2029 Year-2030 Year-2031 Year-2032 Year-2033 Year-2034 Year-2035 Year-2036 Total
PURCHASED ELECTRIC (kWh) 5,526,509 5,526,509 5,692,304 5,863,073 6,038,965 6,220,134 6,406,738 6,598,940 6,796,908 7,000,816 7,210,840 7,427,165 7,649,980 7,879,480 8,115,864 8,359,340 8,610,120 8,868,424 9,134,477 9,408,511 9,690,766 148,499,355
PURCHASED SOLAR (kWh) 2,466,685 2,466,685 2,465,699 2,464,712 2,463,727 2,462,741 2,461,756 2,460,771 2,459,787 2,458,803 2,457,819 2,456,836 2,455,854 2,454,871 2,453,889 2,452,908 2,451,927 2,450,946 2,449,965 2,448,985 2,448,006 49,146,688
COGEN + BOILER GAS (Therms) 7,535,844 7,535,844 7,648,881 7,763,614 7,880,069 7,998,270 8,118,244 8,240,017 8,363,618 8,489,072 8,616,408 8,745,654 8,876,839 9,009,992 9,145,141 9,282,318 9,421,553 9,562,877 9,706,320 9,851,915 9,999,693 174,256,338
WATER (Gallons) 0 0 0 0 0 0 0 0 0 0 0 0 0 0 0 0 0 0 0 0 0 0
Short Ton CO2 Electric Consumption 1,741 1,741 1,758 1,855 1,961 2,067 2,197 2,276 2,374 2,496 2,623 2,774 2,936 3,071 3,212 3,359 3,513 3,674 3,843 4,019 4,203 55,951
Short Ton CO2 Gas Consumption 44,088 44,088 44,750 45,421 46,102 46,794 47,496 48,208 48,931 49,665 50,410 51,166 51,934 52,713 53,504 54,306 55,121 55,948 56,787 57,639 58,503 1,019,487
Year-2017 Year-2018 Year-2019 Year-2020 Year-2021 Year-2022 Year-2023 Year-2024 Year-2025 Year-2026 Year-2027 Year-2028 Year-2029 Year-2030 Year-2031 Year-2032 Year-2033 Year-2034 Year-2035 Year-2036 Total
ELECTRIC $696,948 $696,948 $732,214 $769,264 $808,188 $849,083 $892,046 $937,184 $984,605 $1,034,426 $1,086,768 $1,141,759 $1,199,532 $1,260,228 $1,323,996 $1,390,990 $1,461,374 $1,535,319 $1,613,006 $1,694,625 $1,780,373 23,191,926$
SOLAR $168,524 $168,524 $165,569 $167,597 $169,066 $169,413 $172,405 $170,903 $170,964 $174,886 $178,688 $183,871 $191,909 $194,051 $196,217 $198,404 $200,615 $202,848 $205,104 $207,382 $209,684 3,698,099$
GAS $5,708,498 $5,708,498 $5,681,285 $5,908,213 $6,153,951 $6,392,244 $6,694,184 $6,833,411 $7,023,679 $7,278,438 $7,538,072 $7,856,532 $8,193,476 $8,444,104 $8,702,517 $8,968,961 $9,243,688 $9,526,957 $9,819,038 $10,120,207 $10,430,751 156,518,207$
MAINTENANCE $347,400 $347,400 $356,085 $364,987 $374,112 $383,465 $393,051 $402,877 $412,949 $423,273 $433,855 $444,701 $455,819 $467,214 $478,895 $490,867 $503,139 $515,717 $528,610 $541,825 $555,371 8,874,214$
STAFFING $300,000 $300,000 $307,500 $315,188 $323,067 $331,144 $339,422 $347,908 $356,606 $365,521 $374,659 $384,025 $393,626 $403,467 $413,553 $423,892 $434,489 $445,352 $456,485 $467,898 $479,595 7,663,397$
Other $0 $0 $0 $0 $0 $0 $0 $0 $0 $0 $0 $0 $0 $0 $0 $0 $0 $0 $0 $0 $0 -$
WATER $0 $0 $0 $0 $0 $0 $0 $0 $0 $0 $0 $0 $0 $0 $0 $0 $0 $0 $0 $0 $0 -$
PROPOSED CASE TOTAL 7,221,370$ 7,221,370$ 7,242,652$ 7,525,248$ 7,828,384$ 8,125,349$ 8,491,109$ 8,692,283$ 8,948,803$ 9,276,544$ 9,612,042$ 10,010,889$ 10,434,361$ 10,769,064$ 11,115,177$ 11,473,115$ 11,843,305$ 12,226,193$ 12,622,244$ 13,031,937$ 13,455,773$ 199,945,844$
Year-2017 Year-2018 Year-2019 Year-2020 Year-2021 Year-2022 Year-2023 Year-2024 Year-2025 Year-2026 Year-2027 Year-2028 Year-2029 Year-2030 Year-2031 Year-2032 Year-2033 Year-2034 Year-2035 Year-2036 Total
Net Energy Savings 2,129,107$ 2,129,107$ 2,357,757$ 2,518,186$ 2,685,666$ 2,869,092$ 3,044,462$ 3,286,102$ 3,525,874$ 3,758,281$ 4,005,614$ 4,251,354$ 4,506,758$ 4,812,287$ 5,135,344$ 5,476,874$ 5,837,872$ 6,219,386$ 6,622,517$ 7,048,424$ 7,498,329$ 87,589,287$
Depreciation -$ -$ -$ -$ -$ -$ -$ -$ -$
Interest -$ -$ -$ -$ -$ -$ -$ -$ -$ -$ -$ -$ -$ -$ -$ -$ -$ -$ -$ -$ -$
Net Taxable Income 2,129,107$ 2,357,757$ 2,518,186$ 2,685,666$ 2,869,092$ 3,044,462$ 3,286,102$ 3,525,874$ 3,758,281$ 4,005,614$ 4,251,354$ 4,506,758$ 4,812,287$ 5,135,344$ 5,476,874$ 5,837,872$ 6,219,386$ 6,622,517$ 7,048,424$ 7,498,329$ 87,589,287$
Income Tax $0 $0 $0 $0 $0 $0 $0 $0 $0 $0 $0 $0 $0 $0 $0 $0 $0 $0 $0 $0 -$
After Tax Income 2,129,107$ 2,357,757$ 2,518,186$ 2,685,666$ 2,869,092$ 3,044,462$ 3,286,102$ 3,525,874$ 3,758,281$ 4,005,614$ 4,251,354$ 4,506,758$ 4,812,287$ 5,135,344$ 5,476,874$ 5,837,872$ 6,219,386$ 6,622,517$ 7,048,424$ 7,498,329$ 87,589,287$
Principal -$ -$ -$ -$ -$ -$ -$ -$ -$ -$ -$ -$ -$ -$ -$ -$ -$ -$ -$ -$ -$
Net Savings $0 $2,129,107 $2,357,757 $2,518,186 $2,685,666 $2,869,092 $3,044,462 $3,286,102 $3,525,874 $3,758,281 $4,005,614 $4,251,354 $4,506,758 $4,812,287 $5,135,344 $5,476,874 $5,837,872 $6,219,386 $6,622,517 $7,048,424 $7,498,329 87,589,287$
Carbon Credit Cost $286,433 $286,433 $313,929 $342,754 $372,492 $403,104 $434,810 $1,009,677 $1,064,577 $1,121,469 $1,179,996 $1,240,641 $1,303,167 $1,366,701 $1,432,058 $1,499,289 $1,700,374 $1,907,890 $2,122,028 $2,342,987 $2,570,974 24,015,350$
Proposed Total With Carbon Credits $7,507,803 $7,507,803 $7,556,581 $7,868,003 $8,200,876 $8,528,452 $8,925,919 $9,701,961 $10,013,380 $10,398,013 $10,792,038 $11,251,530 $11,737,528 $12,135,765 $12,547,235 $12,972,403 $13,543,679 $14,134,083 $14,744,272 $15,374,924 $16,026,747 223,961,194$
20 Yr PV of Savings vs Base Case both w/Carbon Offsets
20 Yr PV Cost without Carbon Offsets
20 Yr PV Cost with Carbon Offsets
$54,765,521$54,765,521$54,765,521$54,765,521
$130,000,169$130,000,169$130,000,169$130,000,169
$144,314,515$144,314,515$144,314,515$144,314,515
20 Yr PV Cost of Carbon Offsets
$51,881,711$51,881,711$51,881,711$51,881,711
$14,314,347$14,314,347$14,314,347$14,314,347
Base Case Rates
Base Case Consumption
Electric Rate Escalation
Gas Rate Escalation
University of Maine Orono
Project:
Proposed Case Consumption
Yearly Loan PaymentEstimated Federal and State Tax Rate
-$ Installed Cost
0.0%
Gas Demand Growth
Cogeneration Feasibility Study
Inflation rate
Interest Rate
Maintenance & Operation
Energy Consumption - CHP Plant at the East Campus with Electric Load Following and Solar Generation and no Summer Steam Load - Option 3D ECONOMIC PRO FORMA
Discount Rate
Topic:
20 Yr PV of Savings vs Base Case both w/o Carbon Offsets
Savings
Length of Loan (months)
Interest Rate
Monthly Loan Payment
Inflation rate
2.5%
Proposed Case Cost
Base Case Cost
3.0%
Proposed Case Rates
Page 46
University of Maine 1% Electric Growth vs 3% Electric Growth - Present Value Cost and Savings Comparison
Option
1% Electric Growth 3% Electric Growth
20Yr PV of Savings vs Base Case,
both w/o Carbon Offsets
20Yr PV of Savings vs Base Case, both with Carbon Offsets
20 Year PV Energy Cost w/o Carbon
Offsets
20 Year PV Energy Cost with Carbon
Offsets
20Yr PV of Savings vs Base Case,
both w/o Carbon Offsets
20Yr PV of Savings vs Base Case, both with Carbon Offsets
20 Year PV Energy Cost w/o Carbon
Offsets
20 Year PV Energy Cost with Carbon
Offsets
Base Case – Existing Operation
$0 $0 $165,568,781 $176,930,961 $0 $0 $184,765,690 $196,196,226
1A Existing Campus & Eliminate Summer Steam Load
$4,405,017 $2,832,094 $161,163,764 $174,098,866 $4,140,770 $1,346,928 $180,624,920 $194,849,298
1B Existing Campus & Solar Energy
$11,263,114 $9,729,241 $154,305,667 $167,201,720 $15,620,113 $13,171,472 $169,145,577 $183,024,754
1C Existing Campus, Eliminate Summer Steam Load & Solar Energy
$16,076,212 $15,567,648 $149,492,569 $161,363,313 $20,168,964 $18,728,126 $164,596,726 $177,468,100
2A Thermal Load Following Gas Turbine Generator (CTG)
$26,405,925 $23,319,070 $139,162,856 $153,611,890 $39,604,486 $36,188,605 $145,161,204 $160,007,621
2B Thermal Load Following CTG & Eliminate Summer Steam Load
$27,268,107 $24,500,997 $138,300,674 $152,429,964 $40,201,964 $37,088,292 $144,563,725 $159,107,935
2C Thermal Load Following CTG & Solar Energy
$28,446,100 $25,638,189 $137,122,681 $151,292,772 $42,430,437 $39,345,557 $142,335,253 $156,850,670
2D Thermal Following CTG, Eliminate Summer Steam Load & Solar Energy
$29,307,201 $26,818,866 $136,261,580 $150,112,094 $43,026,797 $40,243,954 $141,738,893 $155,952,272
3A Electric Load Following Gas Turbine Generator (CTG)
$35,263,008 $31,875,076 $130,305,773 $145,055,885 $51,452,437 $47,933,620 $133,313,253 $148,262,606
3B Electric Load Following CTG & Eliminate Summer Steam Load
$36,324,902 $33,244,769 $129,243,879 $143,686,191 $52,325,681 $49,102,166 $132,440,008 $147,094,060
3C Electric Load Following CTG & Solar Energy
$36,964,742 $33,874,641 $128,604,039 $143,056,320 $53,813,509 $50,636,203 130,952,181 $145,560,024
3D Electric Following CTG, Eliminate Summer Steam Load & Solar Energy
$38,083,898 $35,298,365 $127,484,883 $141,632,595 $54,765,521 $51,881,711 $130,000,169 $144,314,515
Page 47
# Option
Electrical Generated(kWh/yr)
20Yr PV of Savings vs Base Case, both No Carbon Offsets
20Yr PV of Savings vs Base Case, both
with Carbon Offsets
20Yr PV of Energy Cost
No Carbon Offsets
20Yr PV of Energy Cost
with Carbon Offsets
20Yr PV of Carbon Offset
Cost
20Yr PV of Savings vs Base Case, both No Carbon Offsets
20Yr PV of Savings vs Base Case, both
with Carbon Offsets
20Yr PV of Energy Cost
No Carbon Offsets
20Yr PV of Energy Cost
with Carbon Offsets
20Yr PV of Carbon Offset
Cost
Base case with 3%/yr both
No Carbon Offsets
Base case with 3%/yr both
with Carbon Offsets
Base Case
Existing Campus Operations 1,078,617 $0 $0 $165,568,781 $176,930,961 $11,362,180 $0 $0 $184,765,690 $196,196,226 $11,430,536 $19,196,909 $19,265,265
1A Existing Campus Ops & Eliminate Summer Steam Load
877,753 $4,405,017 $2,832,095 $161,163,764 $174,098,866 $12,935,102 $4,140,770 $1,346,928 $180,624,920 $194,849,298 $14,224,378 $23,601,926 $22,097,360
1B Existing Campus Ops & Solar Energy (8Mw dc)
10,651,683 $11,263,114 $9,729,241 $154,305,667 $167,201,720 $12,896,053 $15,620,113 $13,171,472 $169,145,577 $183,024,754 $13,879,177 $30,460,023 $28,994,506
1C Existing Campus, Eliminate Summer Steam Load &Solar Energy (8Mw dc)
10,450,819 $16,076,212 $15,567,648 $149,492,569 $161,363,313 $11,870,744 $20,168,964 $18,728,126 $164,596,726 $177,468,100 $12,871,374 $35,273,121 $34,832,913
2A Thermal Load FollowingGas Turbine Generator (non recuperated CTG) (4.5Mw)
31,077,260 $26,405,925 $23,319,071 $139,162,856 $153,611,890 $14,449,034 $39,604,486 $36,188,605 $145,161,204 $160,007,621 $14,846,417 $45,602,834 $42,584,336
2B 2B Thermal Load FollowingGas Turbine Generator (non recuperated CTG) (4.5Mw) & Eliminate Summer Steam Load
30,878,683 $27,268,107 $24,500,997 $138,300,674 $152,429,964 $14,129,290 $40,201,965 $37,088,291 $144,563,725 $159,107,935 $14,544,210 $46,465,016 $43,766,262
2C Thermal Load FollowingGas Turbine Generator (non recuperated CTG) (4.5Mw) & Solar Energy (2Mw dc)
32,784,160 $28,446,100 $25,638,189 $137,122,681 $151,292,772 $14,170,091 $42,430,437 $39,345,556 $142,335,253 $156,850,670 $14,515,417 $47,643,009 $44,903,454
2D Thermal Load FollowingGas Turbine Generator (non recuperated CTG) (4.5Mw) & Eliminate Summer Steam Load & Solar Energy (2Mw dc)
32,586,423 $29,307,201 $26,818,867 $136,261,580 $150,112,094 $13,850,514 $43,026,797 $40,243,954 $141,738,893 $155,952,272 $14,213,379 $48,504,110 $46,084,132
3A Electric Load FollowingGas Turbine Generator (non recuperated CTG)
37,648,704 $35,263,008 $31,875,076 $130,305,773 $145,055,885 $14,750,112 $51,452,437 $47,933,620 $133,313,253 $148,262,606 $14,949,353 $54,459,917 $51,140,341
3B Electric Load FollowingGas Turbine Generator (non recuperated CTG) (4.5Mw) & Eliminate Summer Steam Load
37,617,231 $36,324,902 $33,244,770 $129,243,879 $143,686,191 $14,442,312 $52,325,682 $49,102,166 $132,440,008 $147,094,060 $14,654,052 $55,521,811 $52,510,035
3C Elecgtric Load FollowingGas Turbine Generator (non recuperated CTG) (4.5Mw) & Solar Energy (2Mw dc)
39,077,744 $36,964,742 $33,874,641 $128,604,039 $143,056,320 $14,452,281 $53,813,509 $50,636,202 $130,952,181 $145,560,024 $14,607,843 $56,161,651 $53,139,906
3D Electric Load FollowingGas Turbine Generator (non recuperated CTG) (4.5Mw) & Eliminate Summer Steam Load & Solar Energy (2Mw dc)
39,094,500 $38,083,898 $35,298,366 $127,484,883 $141,632,595 $14,147,712 $54,765,521 $51,881,711 $130,000,169 $144,314,515 $14,314,346 $57,280,807 $54,563,631
20yr PV of Savings of Slower 1% Growth in Assume 1% /yr Growth in Electrical use Assume 3%/yr Growth in Electrical useUniversity of Maine - Estimated 20yr Present Value of Cost Savings of studied Options, comparing 1%/yr Electric Growth rate vs the Base Case with 3%/yr Electric use growth*
file: 2016‐12‐02 rev of final scrn stdy rpt analysis table.xlsx* Source data: 2016‐10‐28 UMaine Energy Upgrade Screening Study by Vanderweil Eng
NOTE: The study does not include capital investments in the calculations for the 20yr PV Cost Saving. Ken Doiron, PE University of Maine
Page 1 of 1
Page 48
APPENDIX C
CES Data
Page 49
Competitive Energy Services
Summary of Alternative Screening Study Forecasts
2017 2018 2019 2020 2021 2022 2023 2024 2025 2026 2027 2028 2029 2030 2031 2032 2033 2034 2035 2036
1 2 3 4 5 6 7 8 9 10 11 12 13 14 15 16 17 18 19 20
Scope Natural Gas Units
1.b. Commodity (Unweighted) $/Dth 4.10 4.14 4.17 4.22 4.15 4.33 4.24 4.16 4.32 4.48 4.64 5.02 5.12 5.23 5.33 5.44 5.55 5.66 5.77 5.89
1.c. T&D $/Dth 3.02 3.07 3.12 3.16 3.21 3.26 3.31 3.36 3.41 3.46 3.51 3.56 3.62 3.67 3.72 3.78 3.84 3.89 3.95 4.01
Total $/Dth 7.13 7.21 7.29 7.38 7.36 7.58 7.54 7.51 7.73 7.94 8.15 8.58 8.74 8.90 9.05 9.22 9.38 9.55 9.72 9.90
1.e. Emissions lbs/Dth 117.01 117.01 117.01 117.01 117.01 117.01 117.01 117.01 117.01 117.01 117.01 117.01 117.01 117.01 117.01 117.01 117.01 117.01 117.01 117.01
Electric
1.f. Wholesale $/MWh $35.67 $35.81 $35.95 $35.79 $35.98 $36.41 $35.69 $35.76 $36.82 $37.83 $39.68 $41.66 $42.11 $42.57 $43.02 $43.47 $43.93 $44.39 $44.84 $45.30
1.f. Retail $/MWh $74.85 $71.63 $73.49 $75.00 $75.99 $77.27 $77.22 $78.13 $80.21 $82.25 $85.28 $88.50 $89.95 $91.43 $92.93 $94.46 $96.02 $97.60 $99.21 $100.85
1.g. T&D $/MWh $51.26 $52.03 $53.21 $55.01 $57.07 $60.01 $60.84 $61.68 $62.53 $63.40 $64.28 $65.17 $66.08 $67.00 $67.93 $68.88 $69.84 $70.81 $71.80 $72.81
Total $/MWh $126.11 $123.66 $126.69 $130.01 $133.05 $137.28 $138.06 $139.81 $142.74 $145.65 $149.56 $153.67 $156.03 $158.42 $160.86 $163.34 $165.86 $168.41 $171.02 $173.66
1.e. Emissions (Regional) lbs/MWh 630 617 605 593 581 569 558 547 536 525 515 504 494 484 475 465 456 447 438 429
1.d. Carbon (Mid Case) $/ST 6.25 6.75 7.25 7.75 8.25 8.75 20.00 20.75 21.50 22.25 23.00 23.75 24.50 25.25 26.00 29.00 32.00 35.00 38.00 41.00
1.h. Solar PV
Avoidable Energy & Capacity $/MWh $58.35 $57.15 $57.98 $58.58 $58.73 $59.95 $59.34 $59.37 $60.97 $62.52 $64.63 $67.91 $68.78 $69.67 $70.57 $71.48 $72.39 $73.32 $74.25 $75.20
Avoidable T&D (Rate D-4) $/MWh 9.97$ 9.99$ 10.02$ 10.04$ 10.06$ 10.09$ 10.11$ 10.13$ 10.16$ 10.18$ 10.21$ 10.23$ 10.26$ 10.29$ 10.31$ 10.34$ 10.37$ 10.40$ 10.42$ 10.45$
Total Avoidable Rate $/MWh 68.32$ 67.15$ 68.00$ 68.62$ 68.79$ 70.03$ 69.45$ 69.50$ 71.12$ 72.70$ 74.84$ 78.14$ 79.04$ 79.96$ 80.88$ 81.82$ 82.76$ 83.71$ 84.68$ 85.65$
1.i. PPA Rates Via OTF
With RECs - Low $/MWh $110 $112 $114 $117 $119 $121 $124 $126 $129 $131 $134 $137 $140 $142 $145 $148 $151 $154 $157 $160
With RECs - Hi $/MWh $130 $133 $135 $138 $141 $144 $146 $149 $152 $155 $158 $162 $165 $168 $172 $175 $178 $182 $186 $189
W/Out RECs - Low $/MWh $70 $72 $74 $77 $79 $81 $84 $86 $89 $91 $94 $97 $100 $102 $105 $108 $111 $114 $117 $120
W/Out RECs - Hi $/MWh $100 $103 $105 $108 $111 $114 $116 $119 $122 $125 $128 $132 $135 $138 $142 $145 $148 $152 $156 $159
Page 50
Competitive Energy Services
1.b Forward Natural Gas Forecast
Market Conditions as of: 04/25/1604/25/1604/25/1604/25/16
MonthMonthMonthMonth AverageAverageAverageAverage
JanJanJanJan FebFebFebFeb MarMarMarMar AprAprAprApr MayMayMayMay JunJunJunJun JulJulJulJul AugAugAugAug SepSepSepSep OctOctOctOct NovNovNovNov DecDecDecDec ($/mmbtu)($/mmbtu)($/mmbtu)($/mmbtu)20162016201620162017201720172017 $7.717 $7.694 $5.358 $3.063 $2.567 $2.675 $2.671 $2.496 $2.449 $2.730 $4.153 $5.662 4.104.104.104.102018201820182018 $7.568 $7.545 $5.272 $2.605 $2.674 $2.676 $2.544 $2.509 $2.725 $3.961 $4.080 $5.558 4.144.144.144.142019201920192019 $7.421 $7.398 $5.184 $2.741 $2.772 $2.788 $2.970 $2.734 $2.839 $3.469 $4.127 $5.610 4.174.174.174.172020202020202020 $7.494 $7.400 $5.268 $3.435 $2.783 $2.790 $3.024 $2.851 $2.817 $2.799 $4.247 $5.742 4.224.224.224.222021202120212021 $7.152 $7.134 $3.820 $3.054 $3.051 $3.081 $3.218 $3.250 $3.152 $3.187 $4.263 $5.413 4.154.154.154.152022202220222022 $7.048 $7.031 $5.267 $3.201 $3.196 $3.226 $3.314 $3.350 $3.304 $3.344 $4.174 $5.474 4.334.334.334.332023202320232023 $7.009 $6.992 $4.828 $3.363 $3.357 $3.387 $3.475 $3.511 $3.470 $3.515 $3.695 $4.247 4.244.244.244.242024202420242024 $5.882 $5.864 $4.598 $3.528 $3.518 $3.550 $3.645 $3.681 $3.642 $3.692 $3.872 $4.427 4.164.164.164.162025202520252025 $6.062 $6.042 $4.774 $3.684 $3.670 $3.703 $3.795 $3.833 $3.796 $3.851 $4.036 $4.601 4.324.324.324.322026202620262026 $6.236 $6.216 $4.946 $3.831 $3.816 $3.851 $3.947 $3.987 $3.950 $4.005 $4.202 $4.785 4.484.484.484.482027202720272027 $6.455 $6.435 $5.141 $3.965 $3.950 $3.985 $4.082 $4.122 $4.085 $4.140 $4.349 $4.960 4.644.644.644.642028202820282028 $6.666 $6.646 $5.324 $4.417 $4.302 $4.437 $4.782 $4.822 $4.537 $4.492 $4.707 $5.143 5.025.025.025.022029202920292029 $6.799 $6.779 $5.431 $4.505 $4.388 $4.526 $4.878 $4.918 $4.628 $4.582 $4.801 $5.245 5.125.125.125.122030203020302030 $6.935 $6.914 $5.539 $4.595 $4.476 $4.616 $4.975 $5.017 $4.720 $4.673 $4.897 $5.350 5.235.235.235.232031203120312031 $7.074 $7.053 $5.650 $4.687 $4.565 $4.709 $5.075 $5.117 $4.815 $4.767 $4.995 $5.457 5.335.335.335.332032203220322032 $7.215 $7.194 $5.763 $4.781 $4.657 $4.803 $5.176 $5.219 $4.911 $4.862 $5.095 $5.567 5.445.445.445.442033203320332033 $7.360 $7.338 $5.878 $4.877 $4.750 $4.899 $5.280 $5.324 $5.009 $4.960 $5.197 $5.678 5.555.555.555.552034203420342034 $7.507 $7.484 $5.996 $4.974 $4.845 $4.997 $5.385 $5.430 $5.109 $5.059 $5.301 $5.791 5.665.665.665.662035203520352035 $7.657 $7.634 $6.116 $5.074 $4.942 $5.097 $5.493 $5.539 $5.212 $5.160 $5.407 $5.907 5.775.775.775.772036203620362036 $7.810 $7.787 $6.238 $5.175 $5.040 $5.199 $5.603 $5.650 $5.316 $5.263 $5.515 $6.025 5.895.895.895.892037203720372037 $7.966 $7.942 $6.363 $5.279 $5.141 $5.303 $5.715 $5.763 $5.422 $5.368 $5.625 $6.146 6.006.006.006.002038203820382038 $8.126 $8.101 $6.490 $5.384 $5.244 $5.409 $5.829 $5.878 $5.531 $5.476 $5.738 $6.269 6.126.126.126.122039203920392039 $8.288 $8.263 $6.620 $5.492 $5.349 $5.517 $5.946 $5.996 $5.641 $5.585 $5.853 $6.394 6.256.256.256.252040204020402040 $8.454 $8.428 $6.753 $5.602 $5.456 $5.627 $6.065 $6.115 $5.754 $5.697 $5.970 $6.522 6.376.376.376.372041204120412041 $8.623 $8.597 $6.888 $5.714 $5.565 $5.740 $6.186 $6.238 $5.869 $5.811 $6.089 $6.653 6.506.506.506.502042204220422042 $8.795 $8.769 $7.025 $5.828 $5.676 $5.855 $6.310 $6.363 $5.986 $5.927 $6.211 $6.786 6.636.636.636.632043204320432043 $8.971 $8.944 $7.166 $5.945 $5.790 $5.972 $6.436 $6.490 $6.106 $6.046 $6.335 $6.921 6.766.766.766.762044204420442044 $9.151 $9.123 $7.309 $6.064 $5.906 $6.091 $6.565 $6.620 $6.228 $6.167 $6.462 $7.060 6.906.906.906.902045204520452045 $9.334 $9.306 $7.455 $6.185 $6.024 $6.213 $6.696 $6.752 $6.353 $6.290 $6.591 $7.201 7.037.037.037.03
Average ($/mmbtu)Average ($/mmbtu)Average ($/mmbtu)Average ($/mmbtu) 7.547.547.547.54 7.527.527.527.52 5.815.815.815.81 4.524.524.524.52 4.404.404.404.40 4.514.514.514.51 4.804.804.804.80 4.814.814.814.81 4.604.604.604.60 4.654.654.654.65 5.035.035.035.03 5.745.745.745.74 5.335.335.335.33
YearYearYearYear
Page 51
APPENDIX D
Photovoltaic Consultant Data
Page 52
University of Maine
Orono, ME 04469
91 West Main Street
Liberty, ME 04949
(207) 589-4171
This diagram is provided as a
service and is based on the
understanding of the information
supplied. It is subject to change
based on actual conditions,
applicable edition of the National
Electric Code, and local
governmental author ities.
© Copyright ReVision Energy
Date: June 21, 2016
Designed by: LB
Customer Name:
System Type:
Photovoltaic Array
17.56 MWDC Photovoltaic System
SITE PLAN
SHEET A01
N
S
EW
Page 53
AnnualProductionReportproducedbyLukasBrostek
©2016FolsomLabs June22,2016
kWh
Jan Feb Mar Apr May Jun Jul Aug Sep Oct Nov Dec0k
200k
400k
600k
800k