168
GE Digital Energy Instruction Manual Product version: 7.2x GE publication code: 1601-0270-C1 (GEK-119694) EnerVista Viewpoint Monitoring 1601-0270-C1

GEDigital Energy
Instruction ManualProduct version: 7.2x
GE publication code: 1601-0270-C1 (GEK-119694)
EnerVistaViewpoint Monitoring
1601-0270-C1

Copyright © 2015 GE Multilin Inc. All rights reserved.
EnerVista Viewpoint Monitoring Instruction Manual for version 7.2x.
EnerVista, Viewpoint Monitoring, Digital Energy, Multilin, and GE Multilin are trademarks or registered trademarks of GE Multilin Inc.
The contents of this manual are the property of GE Multilin Inc. This documentation is furnished on license and may not be reproduced in whole or in part without the permission of GE Multilin. The content of this manual is for informational use only and is subject to change without notice.
Part number: 1601-0270-C1 (April 2015)

ENERVISTA VIEWPOINT MONITORING – INSTRUCTION MANUAL iii
EnerVista Viewpoint Monitoring
Table of contents
1 INTRODUCTION Safety symbols and definitions....................................................................................1For further assistance ...................................................................................................1
2 PRODUCT DESCRIPTION
Introduction.....................................................................................................................3What’s new......................................................................................................................3Features ...........................................................................................................................4
Add any device ................................................................................................................................................4View remotely on multiple computers .................................................................................................4Remote desktop troubleshooting ...........................................................................................................4Scalable licensing...........................................................................................................................................4Send data to any device .............................................................................................................................5
Functions .........................................................................................................................5IED Dashboard.................................................................................................................................................5Device Setup.....................................................................................................................................................6One-Line Editor and Viewer.......................................................................................................................6Annunciator ......................................................................................................................................................7Events...................................................................................................................................................................7Trending Reports ............................................................................................................................................8Waveforms ........................................................................................................................................................8Administration..................................................................................................................................................9
Demonstration files .......................................................................................................9Trial version...................................................................................................................10
3 INTERFACE Main window .................................................................................................................11Full screen mode ..........................................................................................................12Preferences....................................................................................................................13
Security............................................................................................................................................................. 13Startup screen .............................................................................................................................................. 14Audible alarms.............................................................................................................................................. 15Annunciator ................................................................................................................................................... 16Waveform and events...............................................................................................................................17Event logging................................................................................................................................................. 18Control .............................................................................................................................................................. 18Host information.......................................................................................................................................... 19

iv ENERVISTA VIEWPOINT MONITORING – INSTRUCTION MANUAL
TABLE OF CONTENTS
Watchdog........................................................................................................................................................19Trending reports ...........................................................................................................................................20
Communication status ................................................................................................21Device status..................................................................................................................................................22
Alarm and alert LED indicators..................................................................................24Status explained...........................................................................................................................................24Add LED indicator.........................................................................................................................................26
Formula editor ..............................................................................................................31Add formula....................................................................................................................................................32Use formula ....................................................................................................................................................33Duplicate formula ........................................................................................................................................34Import formula ..............................................................................................................................................34Export formula...............................................................................................................................................34Update formula.............................................................................................................................................35Delete formula...............................................................................................................................................35
Online help.....................................................................................................................35
4 IED DASHBOARD Introduction...................................................................................................................37Access dashboard ........................................................................................................39Access device front panel ...........................................................................................41Import templates for customization.........................................................................42Toolbar and buttons ....................................................................................................44
5 DEVICE SETUP Introduction...................................................................................................................45Add device......................................................................................................................45Add and manage devices with custom file editor ..................................................46
Custom Device Definition window.......................................................................................................47Apply to server...............................................................................................................................................52Delete device with custom file editor .................................................................................................52
Import device ................................................................................................................52Update device ...............................................................................................................53Delete device.................................................................................................................53
6 ONE-LINE EDITOR Introduction...................................................................................................................55View demonstration files ............................................................................................55Draw schema diagram ................................................................................................56
Add gauge parameter ...............................................................................................................................58Add component for manual indication .............................................................................................60Add alarm or alert........................................................................................................................................61Add component for control .....................................................................................................................61Add figure to a schema.............................................................................................................................63
Save file ..........................................................................................................................64Connect / test with One Shot .....................................................................................64Update schema diagram.............................................................................................65Delete schema diagram ..............................................................................................65Edit and view simultaneously ....................................................................................65Change page size and units........................................................................................67Create custom symbols...............................................................................................67Toolbars and buttons ..................................................................................................68
Links....................................................................................................................................................................69Drawing ............................................................................................................................................................69System Editor .................................................................................................................................................70

TABLE OF CONTENTS
ENERVISTA VIEWPOINT MONITORING – INSTRUCTION MANUAL v
Zoom ................................................................................................................................................................. 71Align ................................................................................................................................................................... 71Nudge ............................................................................................................................................................... 71Structure.......................................................................................................................................................... 72Rotate................................................................................................................................................................ 72Layout ............................................................................................................................................................... 72Gauges ............................................................................................................................................................. 73Symbols............................................................................................................................................................ 74Switch Gear and Control .......................................................................................................................... 74Transformers and Symbols..................................................................................................................... 75
7 ONE-LINE VIEWER Introduction...................................................................................................................77View data .......................................................................................................................77Control devices .............................................................................................................78Create screen captures...............................................................................................79Toolbar and buttons ....................................................................................................79LED indicators ...............................................................................................................80
8 ANNUNCIATOR ALARMS
Introduction...................................................................................................................81Add alarm ......................................................................................................................82Acknowledge and reset alarm ...................................................................................87Manage email notification..........................................................................................88Manage alarm sounds.................................................................................................88Toolbar and buttons ....................................................................................................88
9 EVENTS Introduction...................................................................................................................91Enable or disable event recording ............................................................................91View events....................................................................................................................92Filter events...................................................................................................................92
Configure events displayed .................................................................................................................... 92Filter events.................................................................................................................................................... 93
Change event type .......................................................................................................93Delete event ..................................................................................................................93Toolbar and buttons ....................................................................................................94
10 TRENDING REPORTS Introduction...................................................................................................................95Add report......................................................................................................................96View report ....................................................................................................................99
Change time period in chart ............................................................................................................... 100Change reports and parameters............................................................................ 100Print chart................................................................................................................... 101Export chart................................................................................................................ 101Archive report ............................................................................................................ 102Automatic backup and purge ................................................................................. 103Delete report or chart .............................................................................................. 103Purge report data...................................................................................................... 104Toolbar and buttons ................................................................................................. 105
11 WAVEFORMS Introduction................................................................................................................ 107Waveform files........................................................................................................................................... 107
vi ENERVISTA VIEWPOINT MONITORING – INSTRUCTION MANUAL
TABLE OF CONTENTS
COMTRADE files..........................................................................................................................................108View demonstration files ......................................................................................... 108View COMTRADE file.................................................................................................. 109
Set preferences..........................................................................................................................................111View phasors .............................................................................................................. 113View harmonics ......................................................................................................... 114Convert waveform to COMTRADE file.................................................................... 115Merge COMTRADE files............................................................................................. 117Resample COMTRADE file ........................................................................................ 119Toolbar and buttons ................................................................................................. 120
Toolbar ...........................................................................................................................................................120Waveform functions................................................................................................................................121Phasor window...........................................................................................................................................122
12 ADMINISTRATION Introduction................................................................................................................ 123Default passwords .................................................................................................... 124Password rules........................................................................................................... 124Administrator user account and group................................................................. 124Guest user account and group ............................................................................... 124Turn login on and off................................................................................................. 125Manage password ..................................................................................................... 125
Set password ..............................................................................................................................................126Change password.....................................................................................................................................126
Lost password ............................................................................................................ 127Manage user accounts ............................................................................................. 127
Add user account......................................................................................................................................128Update user account...............................................................................................................................129Delete user account.................................................................................................................................130
Manage user groups ................................................................................................. 130Add group.....................................................................................................................................................130Update group..............................................................................................................................................131Delete group................................................................................................................................................131
Remote Desktop Services for troubleshooting .................................................... 131
13 REMOTE COMPUTERS
Introduction................................................................................................................ 133Trial version..................................................................................................................................................133
Set up Viewpoint Monitoring for remote access.................................................. 133Software requirements for Viewpoint Monitoring.....................................................................134Set up and configure ViewNode support.......................................................................................135Reset remote access ...............................................................................................................................139Remove remote access..........................................................................................................................139
Install remote access client software.................................................................... 140Software requirements for remote computer.............................................................................140Install client software..............................................................................................................................140
Access Viewpoint Monitoring remotely................................................................. 141Troubleshooting for Windows XP ......................................................................................................145
Uninstall remote access client software............................................................... 146Remote computer interface .................................................................................... 146
14 MAINTENANCE View software version .............................................................................................. 149Update software ........................................................................................................ 149Manage activation code........................................................................................... 150

TABLE OF CONTENTS
ENERVISTA VIEWPOINT MONITORING – INSTRUCTION MANUAL vii
Transfer software license ........................................................................................ 150Uninstall software ..................................................................................................... 151
Uninstall Viewpoint Monitoring.......................................................................................................... 151Uninstall ViewNode remote client .................................................................................................... 152
A MISCELLANEOUS Revision history ........................................................................................................ 153
INDEX

viii ENERVISTA VIEWPOINT MONITORING – INSTRUCTION MANUAL
TABLE OF CONTENTS

ENERVISTA VIEWPOINT MONITORING – INSTRUCTION MANUAL 1
EnerVista Viewpoint Monitoring
Chapter 1: Introduction
Introduction
This Instruction Manual outlines how to use EnerVistaTM Viewpoint MonitoringTM software. For installation, launch, activation, and adding devices, follow the Quickstart Guide instead.
This chapter outlines the following:
• Safety information
• Technical support contacts
Safety symbols and definitionsBefore attempting to install or use any device, review all safety indicators in its and this document to help prevent injury, equipment damage, or downtime.
The following safety and equipment symbols are used in this document.
Indicates a hazardous situation which, if not avoided, will result in death or serious injury.
Indicates a hazardous situation which, if not avoided, could result in death or serious injury.
Indicates a hazardous situation which, if not avoided, could result in minor or moderate injury.
Indicates practices not related to personal injury.
For further assistanceFor product support, contact the information and call center as follows:
GE Digital Energy650 Markland StreetMarkham, OntarioCanada L6C 0M1Worldwide telephone: +1 905 927 7070

2 ENERVISTA VIEWPOINT MONITORING – INSTRUCTION MANUAL
FOR FURTHER ASSISTANCE CHAPTER 1: INTRODUCTION
Europe/Middle East/Africa telephone: +34 94 485 88 54North America toll-free: 1 800 547 8629Fax: +1 905 927 5098Worldwide e-mail: [email protected] e-mail: [email protected]: http://www.gedigitalenergy.com/multilin
ENERVISTA VIEWPOINT MONITORING – INSTRUCTION MANUAL 3
EnerVista Viewpoint Monitoring
Chapter 2: Product description
Product description
This chapter outlines the following:
• What is new
• Viewpoint Monitoring
• Demonstration files
• Trial version
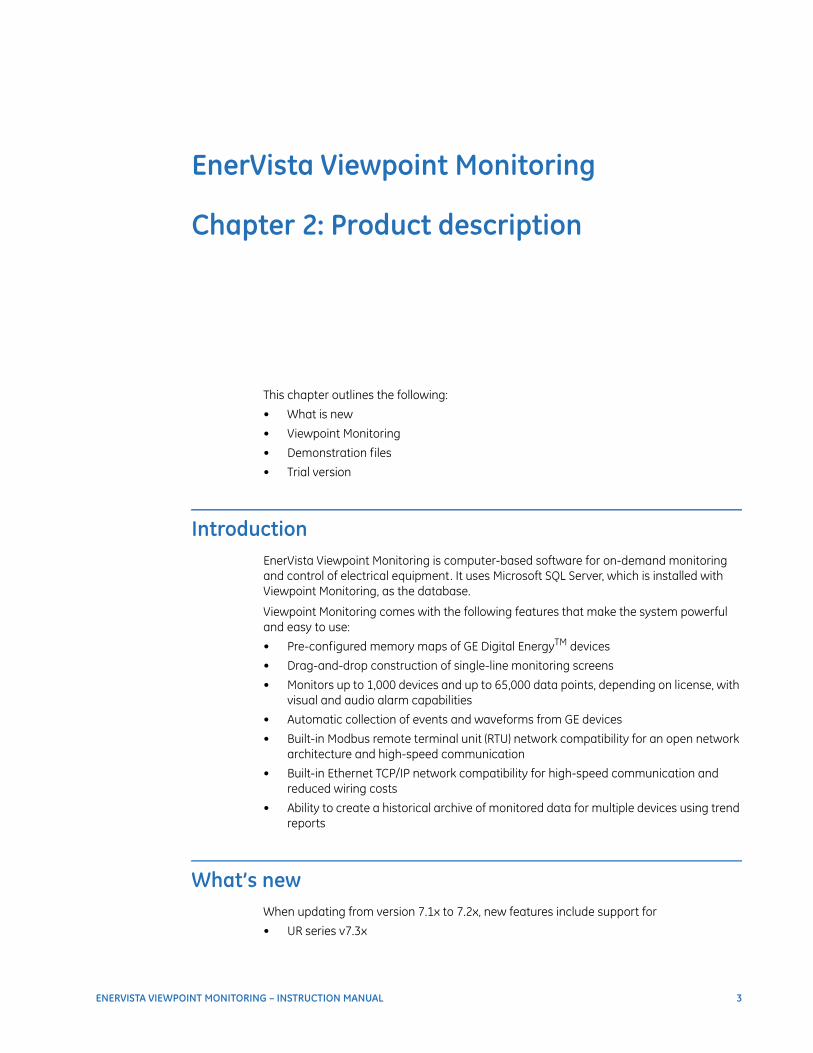
IntroductionEnerVista Viewpoint Monitoring is computer-based software for on-demand monitoring and control of electrical equipment. It uses Microsoft SQL Server, which is installed with Viewpoint Monitoring, as the database.
Viewpoint Monitoring comes with the following features that make the system powerful and easy to use:
• Pre-configured memory maps of GE Digital EnergyTM devices
• Drag-and-drop construction of single-line monitoring screens
• Monitors up to 1,000 devices and up to 65,000 data points, depending on license, with visual and audio alarm capabilities
• Automatic collection of events and waveforms from GE devices
• Built-in Modbus remote terminal unit (RTU) network compatibility for an open network architecture and high-speed communication
• Built-in Ethernet TCP/IP network compatibility for high-speed communication and reduced wiring costs
• Ability to create a historical archive of monitored data for multiple devices using trend reports
What’s newWhen updating from version 7.1x to 7.2x, new features include support for
• UR series v7.3x

4 ENERVISTA VIEWPOINT MONITORING – INSTRUCTION MANUAL
FEATURES CHAPTER 2: PRODUCT DESCRIPTION
• 869 - Motor Protection System
• 845 - Transformer Protection System
• EPM 4600S, EPM 4600T
• DGCM - Multilin DGCM Field RTU
• SR3 (350) to v2.0x
• MM300 to v1.60
• F650 to v5.60
• MX350 to v1.20
For more information, see the Release Notes under Start > All Programs > EnerVista > Monitoring Release Notes.
FeaturesSome of the features of Viewpoint Monitoring include the following.
Add any deviceIn addition to easy device setup of GE devices and import of setup files, the Custom File Editor allows you to define a new device to be used within Viewpoint Monitoring as well as edit and delete devices already defined. This allows Viewpoint Monitoring to communicate with any device that uses the Modbus protocol for accessing data.
Fast and slow polling of devices is performed by the software for actual values and settings respectively. The polling/scan interval for actual values is every second.
View remotely on multiple computersViewpoint Monitoring is installed a computer that is used to setup, view, and control devices. In addition, the option exists to install remote viewer capability on other computers. This means that other computers can be used to access One-Line diagrams, which are views of devices, for example. This remote computer and function is referred to as a ViewNode.
Remote desktop troubleshootingWhen Viewpoint Monitoring is installed on a Windows 2008 Server computer, Windows Remote Desktop Services can be used. Remote Desktop Services includes remote control of user computers with the Remote Desktop Connection application in Windows, which is useful for troubleshooting.
Scalable licensingDepending on the license, 50, 100, 300, 500, or 1000 devices can be configured in the software. When using the trial version, the number of devices is limited to 100. The licensing is summarized as follows:
• 50 devices and 3,000 data points
• 100 devices and 5,000 data points
• 300 devices and 30,000 data points
• 500 devices and 65,000 data points
• 1,000 devices and 20,000 data points

CHAPTER 2: PRODUCT DESCRIPTION FUNCTIONS
ENERVISTA VIEWPOINT MONITORING – INSTRUCTION MANUAL 5
Send data to any deviceObject Linking and Embedding (OLE) for Process Control (OPC) and Dynamic Data Exchange (DDE) are possible with the "OPC/DDE Option," (selected at time of purchase, or a later upgrade). With OPC/DDE, Viewpoint Monitoring can send the data that is being read from the relays and meters to any third-party OPC-compliant automation or monitoring system. That includes the ability to send data from third-party devices added to the Viewpoint Monitoring database.
FunctionsThis section explains each component that displays in the main window of Viewpoint Monitoring. In addition, there are menu functions, such as password management, support for adding third-party devices, and template importing.
The general approach to using Viewpoint Monitoring is as follows:
• Add device
• Configure a one-line schema diagram in the One-Line Editor
• View the data in the One-Line Viewer
• Set alarms in the Annunciator
• Monitor device operation in the IED Dashboard and/or the Annunciator
Figure 1: Viewpoint Monitoring main window
IED DashboardWhen "Plug And Play" is enabled for a device, the device displays in the IED Dashboard. The device can be controlled from the dashboard, for example using a virtual view of its front panel. There is access to a set of device-specific online diagrams that offer a quick view of the most critical information for that device type.

6 ENERVISTA VIEWPOINT MONITORING – INSTRUCTION MANUAL
FUNCTIONS CHAPTER 2: PRODUCT DESCRIPTION
Figure 2: IED Dashboard
Device SetupThe Device Setup function is used to identify devices for use in Viewpoint Monitoring. The information is added automatically, by import, or manually.
Figure 3: Name and Viewpoint Monitoring options for a device
One-Line Editor and ViewerThe One-Line Editor is used to draw diagrams for equipment monitoring and control. It is used to create interactive and graphical one-line diagrams that are connected to devices to monitor and understand remote site configuration as well as view readings and status updates.
The One-Line Viewer then displays the data from the equipment.
The figure shows an example for monitoring motor status.
CHAPTER 2: PRODUCT DESCRIPTION FUNCTIONS
ENERVISTA VIEWPOINT MONITORING – INSTRUCTION MANUAL 7
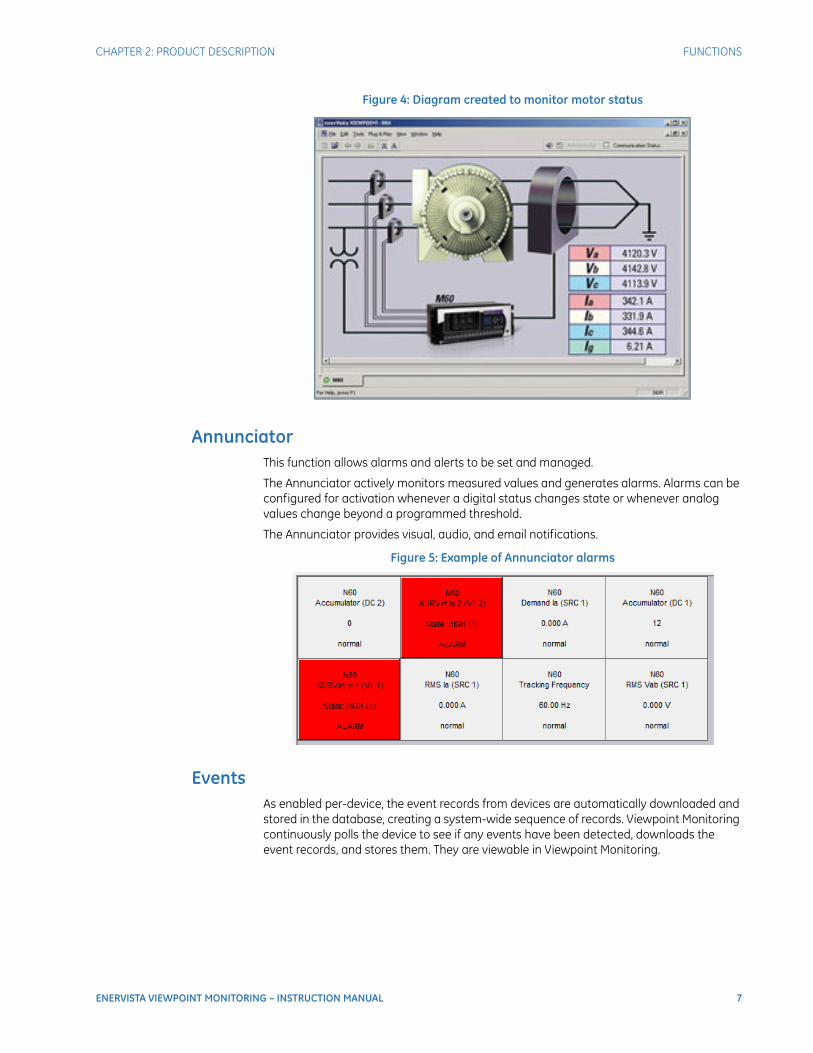
Figure 4: Diagram created to monitor motor status
AnnunciatorThis function allows alarms and alerts to be set and managed.
The Annunciator actively monitors measured values and generates alarms. Alarms can be configured for activation whenever a digital status changes state or whenever analog values change beyond a programmed threshold.
The Annunciator provides visual, audio, and email notifications.
Figure 5: Example of Annunciator alarms
EventsAs enabled per-device, the event records from devices are automatically downloaded and stored in the database, creating a system-wide sequence of records. Viewpoint Monitoring continuously polls the device to see if any events have been detected, downloads the event records, and stores them. They are viewable in Viewpoint Monitoring.
8 ENERVISTA VIEWPOINT MONITORING – INSTRUCTION MANUAL
FUNCTIONS CHAPTER 2: PRODUCT DESCRIPTION
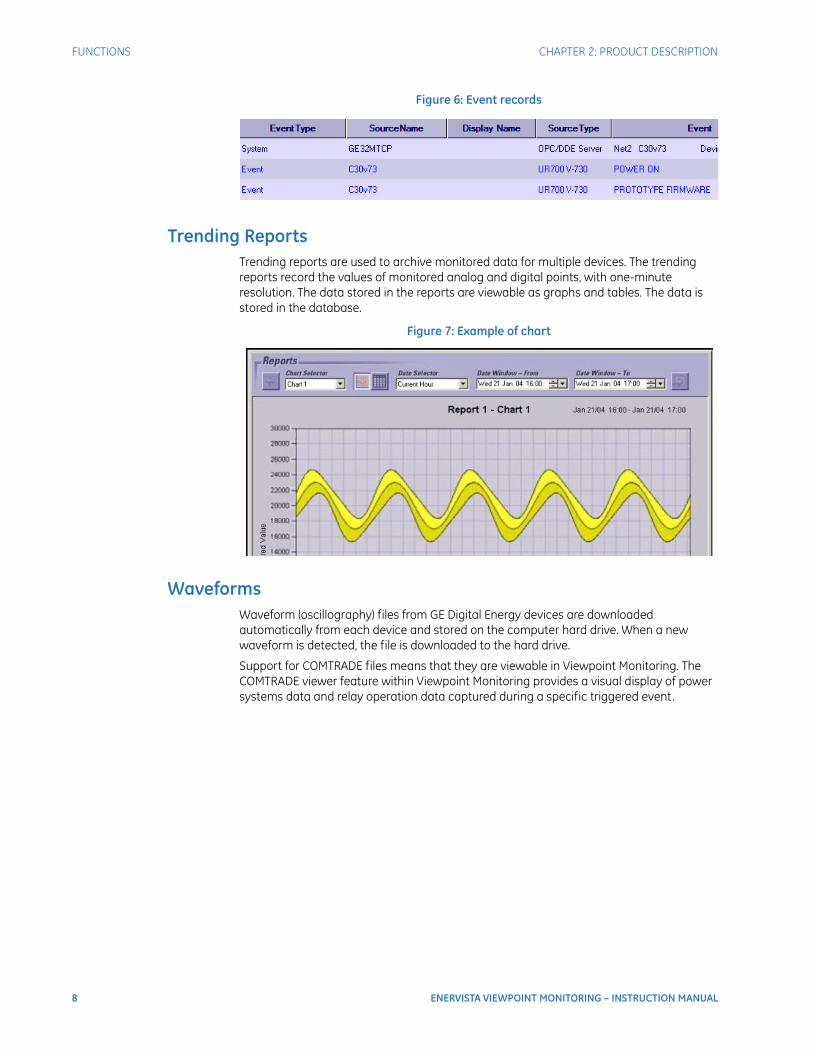
Figure 6: Event records
Trending ReportsTrending reports are used to archive monitored data for multiple devices. The trending reports record the values of monitored analog and digital points, with one-minute resolution. The data stored in the reports are viewable as graphs and tables. The data is stored in the database.
Figure 7: Example of chart
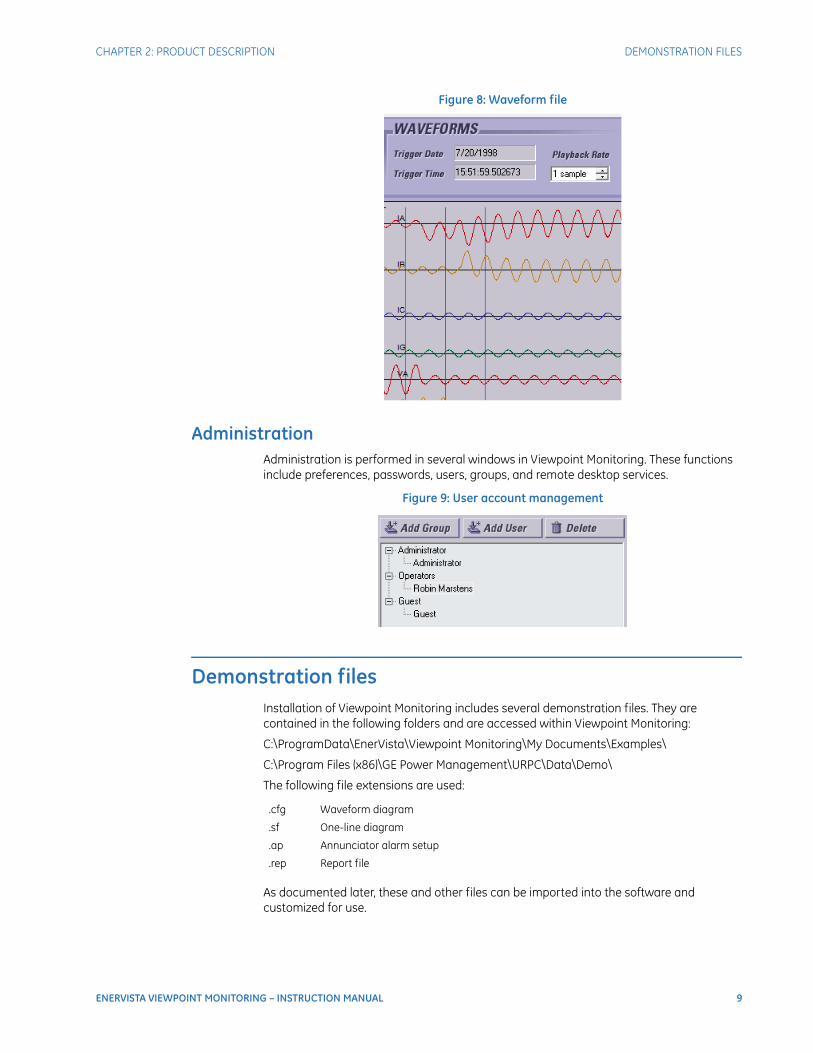
WaveformsWaveform (oscillography) files from GE Digital Energy devices are downloaded automatically from each device and stored on the computer hard drive. When a new waveform is detected, the file is downloaded to the hard drive.
Support for COMTRADE files means that they are viewable in Viewpoint Monitoring. The COMTRADE viewer feature within Viewpoint Monitoring provides a visual display of power systems data and relay operation data captured during a specific triggered event.
CHAPTER 2: PRODUCT DESCRIPTION DEMONSTRATION FILES
ENERVISTA VIEWPOINT MONITORING – INSTRUCTION MANUAL 9
Figure 8: Waveform file
AdministrationAdministration is performed in several windows in Viewpoint Monitoring. These functions include preferences, passwords, users, groups, and remote desktop services.
Figure 9: User account management
Demonstration filesInstallation of Viewpoint Monitoring includes several demonstration files. They are contained in the following folders and are accessed within Viewpoint Monitoring:
C:\ProgramData\EnerVista\Viewpoint Monitoring\My Documents\Examples\
C:\Program Files (x86)\GE Power Management\URPC\Data\Demo\
The following file extensions are used:
As documented later, these and other files can be imported into the software and customized for use.
.cfg Waveform diagram
.sf One-line diagram
.ap Annunciator alarm setup
.rep Report file

10 ENERVISTA VIEWPOINT MONITORING – INSTRUCTION MANUAL
TRIAL VERSION CHAPTER 2: PRODUCT DESCRIPTION
To view a demo file:
1. In the Control Panel for Windows, change the Folder Options so that hidden files and folders show.
2. In the main Viewpoint Monitoring window, click File > Open and open the following file, which is a one-line diagram used as an example:
C:\ProgramData\EnerVista\Viewpoint Monitoring\My Documents\Examples\SUBSTATION3.SF
3. When done, turn off hidden files and folders.
Figure 10: Viewing a one-line demonstration file of a substation
Trial versionBy default the software installs in trial mode and runs in trail mode. Behavior is as follows:
• Use of Viewpoint Monitoring for to 90 days
• Limited to 100 devices
• Use of ViewNode remote access for 15 days
You unlock the software by entering the activation code as outlined in the Quickstart Guide.
ENERVISTA VIEWPOINT MONITORING – INSTRUCTION MANUAL 11
EnerVista Viewpoint Monitoring
Chapter 3: Interface
Interface
This chapter explains the software interface, preferences, communication status indicator, schema indicator, and formula editor. It explains the main Viewpoint Monitoring interface. Toolbars and buttons for individual windows are explained in relevant chapters.
There are no "must configure" settings outlined in this chapter. If you are first getting started with Viewpoint Monitoring, consider adding passwords and user accounts as outlined in the Administration chapter, then skim this chapter to view the features available.
This chapter outlines the following:
• Main window
• Full screen mode
• Preferences
• Communication status
• Alarm indicators
• Formula editor
• Online help
Main windowUpon launch of Viewpoint Monitoring, the default view is the main window. This default can be changed, as outlined in this chapter.
12 ENERVISTA VIEWPOINT MONITORING – INSTRUCTION MANUAL
FULL SCREEN MODE CHAPTER 3: INTERFACE
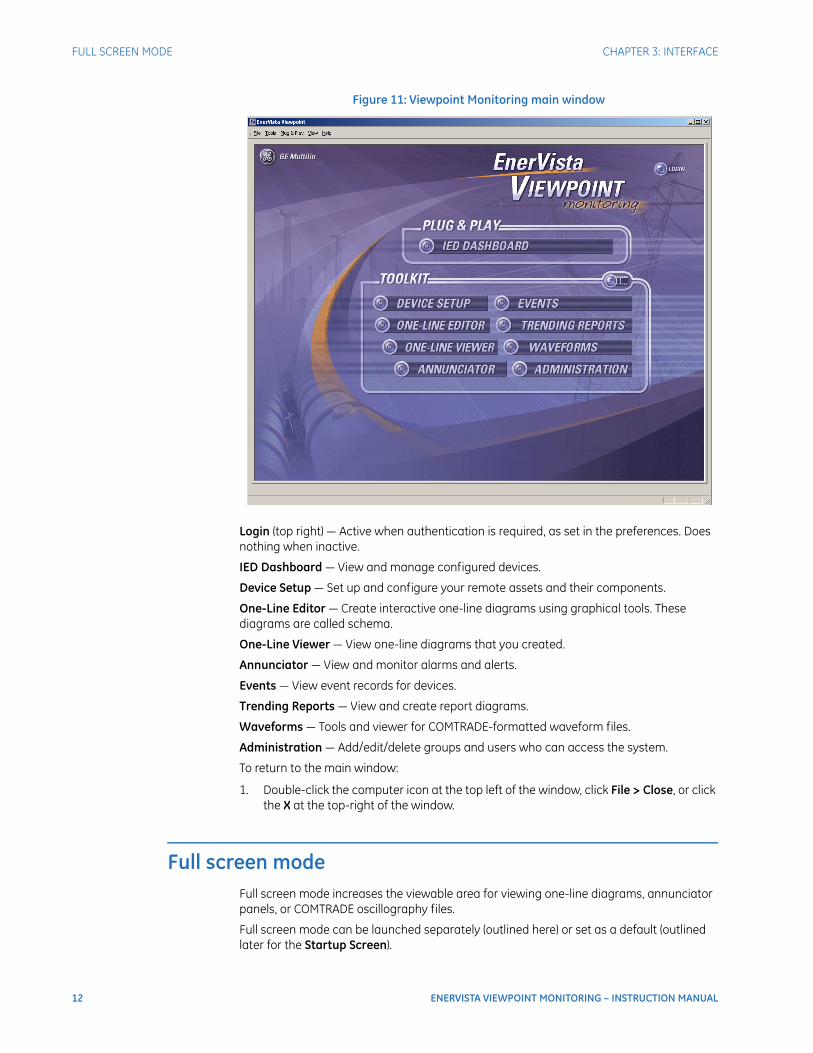
Figure 11: Viewpoint Monitoring main window
Login (top right) — Active when authentication is required, as set in the preferences. Does nothing when inactive.
IED Dashboard — View and manage configured devices.
Device Setup — Set up and configure your remote assets and their components.
One-Line Editor — Create interactive one-line diagrams using graphical tools. These diagrams are called schema.
One-Line Viewer — View one-line diagrams that you created.
Annunciator — View and monitor alarms and alerts.
Events — View event records for devices.
Trending Reports — View and create report diagrams.
Waveforms — Tools and viewer for COMTRADE-formatted waveform files.
Administration — Add/edit/delete groups and users who can access the system.
To return to the main window:
1. Double-click the computer icon at the top left of the window, click File > Close, or click the X at the top-right of the window.
Full screen modeFull screen mode increases the viewable area for viewing one-line diagrams, annunciator panels, or COMTRADE oscillography files.
Full screen mode can be launched separately (outlined here) or set as a default (outlined later for the Startup Screen).

CHAPTER 3: INTERFACE PREFERENCES
ENERVISTA VIEWPOINT MONITORING – INSTRUCTION MANUAL 13
To access Full Screen mode:
1. Click View > Full Screen Mode. The display fills the entire monitor view.
Figure 12: Accessing Full Screen mode
To return the screen to original view:
1. Click the Close FullScreen icon, press the Esc key, or mouse-over the hidden menu at the top and select the View > Full Screen option.
Figure 13: Close FullScreen icon to exit Full Screen mode
Figure 14: Mouse-over hidden menu to exit Full Screen mode
PreferencesThough the software is fully functional using the default values, these defaults can be configured.
To access preferences:
1. Click File > Preferences.
Each of the tabs is outlined as follows.
SecurityThe following security settings can be configured in the File > Preferences > Security tab. The settings here over-ride individual user account settings. For example, if the tab is used to specify that users do not log in to Viewpoint Monitoring, then users do not log in even when the user accounts have passwords assigned to them.
None — Users are not required to log in. Default.
FULL — Users must log in at startup.
Enhanced — Users receive guest privileges at startup, without login. Access is granted to the IED Dashboard, Waveforms, and viewing in One-Line Viewer, Annunciator, Events, and Trending Reports. A user can then log in to receive additional permissions assigned to their user account, such as full access to the One-Line Editor or Annunciator.
In addition, by default a user must hold down the CTRL key when entering a command. This feature is configured in the Control tab, outlined later.

14 ENERVISTA VIEWPOINT MONITORING – INSTRUCTION MANUAL
PREFERENCES CHAPTER 3: INTERFACE
Figure 15: Security tab
Startup screenThe main window displays by default with launch of Viewpoint Monitoring. The following windows can be selected under the File > Preferences > Startup Screen tab to display upon launch:
• Main window
• IED Dashboard
• Specific schema, such as an alert
• Specific Annunciator panel
• Full screen mode or normal
Figure 16: Default for startup
Up to 10 files can be opened automatically upon start of Viewpoint Monitoring.
To select files to open upon startup:
1. Click the ... Browse button and select one or multiple files.
The files are stored with full path, delimited by the ;.
There is a limitation of 1024 characters for the total of this composed path.
An example of the path is
CHAPTER 3: INTERFACE PREFERENCES
ENERVISTA VIEWPOINT MONITORING – INSTRUCTION MANUAL 15
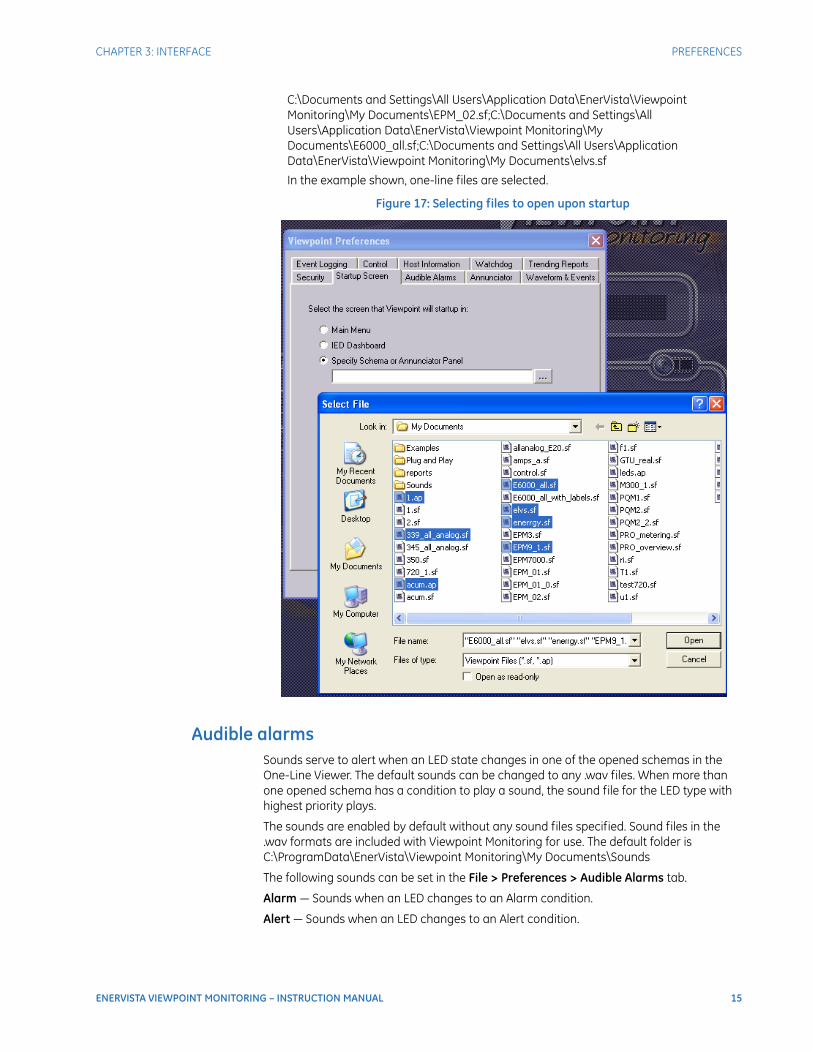
C:\Documents and Settings\All Users\Application Data\EnerVista\Viewpoint Monitoring\My Documents\EPM_02.sf;C:\Documents and Settings\All Users\Application Data\EnerVista\Viewpoint Monitoring\My Documents\E6000_all.sf;C:\Documents and Settings\All Users\Application Data\EnerVista\Viewpoint Monitoring\My Documents\elvs.sf
In the example shown, one-line files are selected.
Figure 17: Selecting files to open upon startup
Audible alarmsSounds serve to alert when an LED state changes in one of the opened schemas in the One-Line Viewer. The default sounds can be changed to any .wav files. When more than one opened schema has a condition to play a sound, the sound file for the LED type with highest priority plays.
The sounds are enabled by default without any sound files specified. Sound files in the .wav formats are included with Viewpoint Monitoring for use. The default folder is C:\ProgramData\EnerVista\Viewpoint Monitoring\My Documents\Sounds
The following sounds can be set in the File > Preferences > Audible Alarms tab.
Alarm — Sounds when an LED changes to an Alarm condition.
Alert — Sounds when an LED changes to an Alert condition.

16 ENERVISTA VIEWPOINT MONITORING – INSTRUCTION MANUAL
PREFERENCES CHAPTER 3: INTERFACE
Reset — Sounds when LED changes state back to Normal after being Acknowledged and Reset.
Figure 18: Setting the sound file for alarms
To stop the sound:
1. Click the Acknowledge button when viewing the schema containing the active condition.
AnnunciatorUse the File > Preferences > Annunciator tab to send email notifications from the Annunciator panel. You enter the Simple Mail Transfer Protocol (SMTP) mail server address in the space provided.
To configure email notification:
1. Consult your information technology (IT) department for the correct SMTP mail server address, to ensure that the mail server is configured to accept SMTP mail requests, and that a user name and a password are not required when sending messages.
2. Configure the window.
SMTP Mail Server — Address of the email server. Examples are mail.yourcompany.com and smtp.yourcompany.com.au. The address can be viewed in Microsoft Outlook under File > Info > Account Settings > Account Settings Email in Windows 7, for example, or consult your IT department as outlined.
Messages sent from the Annunciator Panel originate from — Enter a valid email address that is recognized by the SMTP mail server. Otherwise email cannot be sent by the mail server. An example is to use the email address of the employee who is the main Viewpoint Monitoring administrator or to create an email account specifically for Viewpoint Monitoring.
Message Format:
– Standard Format — The email message contains several lines of information:
Name — Indicator's display name
Device — Device name
Report Type — Parameter name = Value
– Short Format — This is a single line that can be used for texting to a mobile phone:
time
indicator's display name
device name
CHAPTER 3: INTERFACE PREFERENCES
ENERVISTA VIEWPOINT MONITORING – INSTRUCTION MANUAL 17
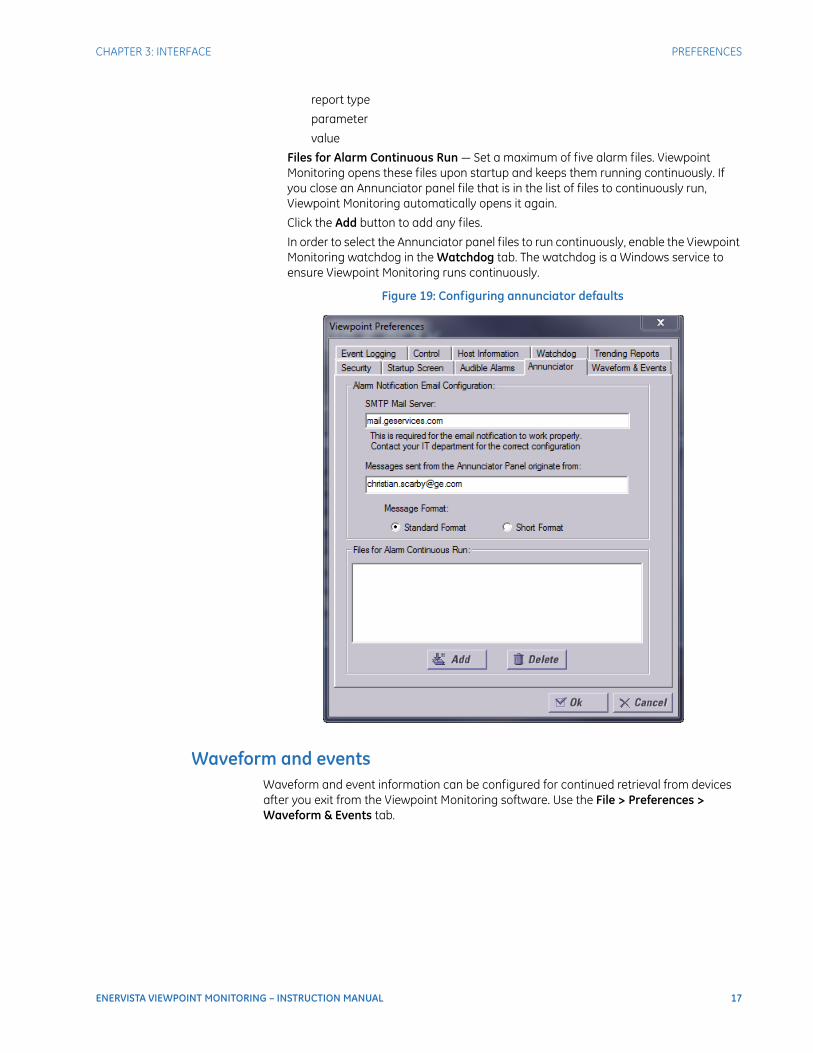
report type
parameter
value
Files for Alarm Continuous Run — Set a maximum of five alarm files. Viewpoint Monitoring opens these files upon startup and keeps them running continuously. If you close an Annunciator panel file that is in the list of files to continuously run, Viewpoint Monitoring automatically opens it again.
Click the Add button to add any files.
In order to select the Annunciator panel files to run continuously, enable the Viewpoint Monitoring watchdog in the Watchdog tab. The watchdog is a Windows service to ensure Viewpoint Monitoring runs continuously.
Figure 19: Configuring annunciator defaults
Waveform and eventsWaveform and event information can be configured for continued retrieval from devices after you exit from the Viewpoint Monitoring software. Use the File > Preferences > Waveform & Events tab.

18 ENERVISTA VIEWPOINT MONITORING – INSTRUCTION MANUAL
PREFERENCES CHAPTER 3: INTERFACE
Figure 20: Retrieve waveforms and events after software shutdown
Event loggingOptions for event logging are configured under the File > Preferences > Event Logging tab and can include login/logout event logging and alarms and alerts from the one-line diagram and annunciator panels. This tab sets defaults for activity within the Viewpoint Monitoring software.
Events are accessed using the Events option in the main window.
Devices are configured for event retrieval using the Device Setup option in the main window.
Figure 21: Event logging of activity within the software
ControlFor security, by default the action of sending a control command to a relay requires the user to hold down the CTRL key as they select a button with the mouse pointer. This key can be changed to the Shift key or disabled under the File > Preferences > Control tab.
CHAPTER 3: INTERFACE PREFERENCES
ENERVISTA VIEWPOINT MONITORING – INSTRUCTION MANUAL 19
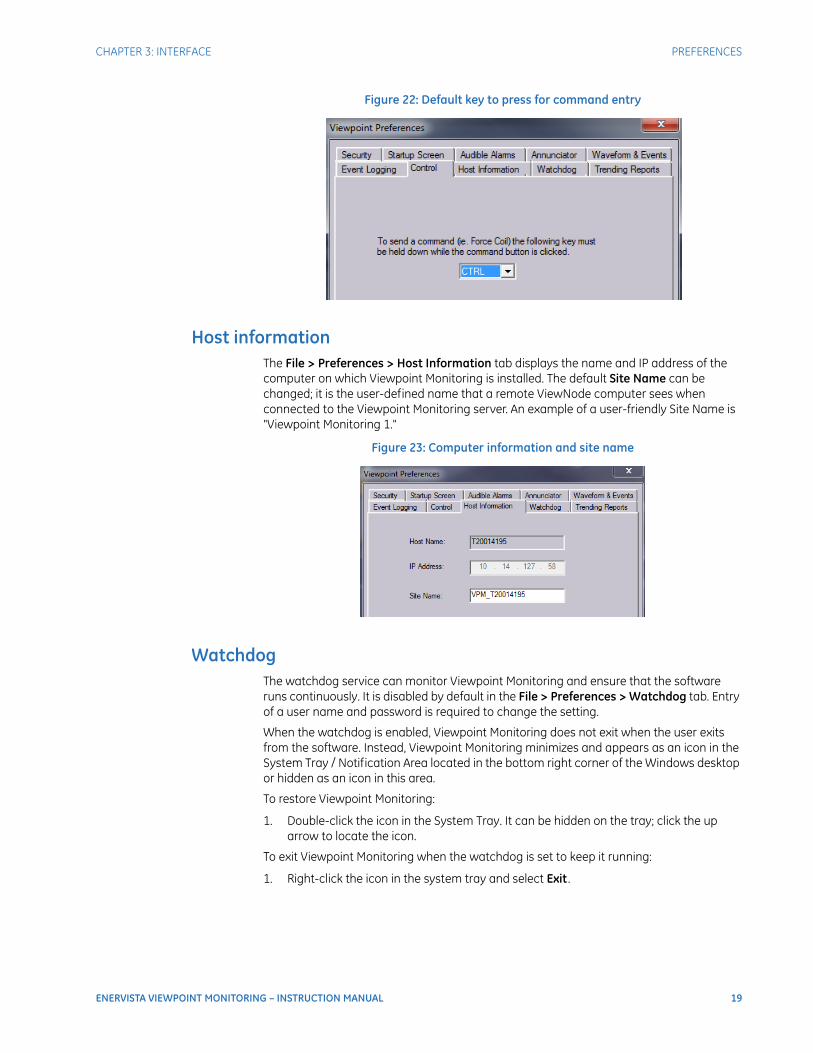
Figure 22: Default key to press for command entry
Host informationThe File > Preferences > Host Information tab displays the name and IP address of the computer on which Viewpoint Monitoring is installed. The default Site Name can be changed; it is the user-defined name that a remote ViewNode computer sees when connected to the Viewpoint Monitoring server. An example of a user-friendly Site Name is "Viewpoint Monitoring 1."
Figure 23: Computer information and site name
WatchdogThe watchdog service can monitor Viewpoint Monitoring and ensure that the software runs continuously. It is disabled by default in the File > Preferences > Watchdog tab. Entry of a user name and password is required to change the setting.
When the watchdog is enabled, Viewpoint Monitoring does not exit when the user exits from the software. Instead, Viewpoint Monitoring minimizes and appears as an icon in the System Tray / Notification Area located in the bottom right corner of the Windows desktop or hidden as an icon in this area.
To restore Viewpoint Monitoring:
1. Double-click the icon in the System Tray. It can be hidden on the tray; click the up arrow to locate the icon.
To exit Viewpoint Monitoring when the watchdog is set to keep it running:
1. Right-click the icon in the system tray and select Exit .

20 ENERVISTA VIEWPOINT MONITORING – INSTRUCTION MANUAL
PREFERENCES CHAPTER 3: INTERFACE
Figure 24: Viewpoint Monitoring computer icon on System Tray
Figure 25: Watchdog set to keep software running
Trending reportsTrending Reports are stored in the local database. To prevent size-related problems, old records can be purged periodically. The preferences here purges records based on the number of days. There are additional purge functions in the Trending Reports function; see the Trending Reports chapter.
Use the File > Preferences > Trending Reports tab to set the following purge options.
Perform Automatic Purge — For the SQL Server Express database, automatic purge is mandatory, so this option is enabled by default and cannot be disabled. For all other editions of the installed SQL Server, users can opt out of automatic purge and do maintenance themselves.
Based on configuration maximum days available — For SQL Server Express, the maximum is 365 days. For all other SQL Server editions, the maximum is 730 days. The maximum is adjusted each time that a parameter is added/deleted. As such, the setting is read-only.
Preferred maximum days — Decreases or increases the maximum days. The minimum is 30 days. The maximum is determined by the previous field and the parameters added/deleted, for example 365 or 730 days.

CHAPTER 3: INTERFACE COMMUNICATION STATUS
ENERVISTA VIEWPOINT MONITORING – INSTRUCTION MANUAL 21
Figure 26: Setting number of days for report storage
Communication statusThis status, or LED, indicator is the latest tool available with Viewpoint Monitoring. It provides visual and/or audible notification when an undesirable condition occurs. Both a digital state and an analog parameter can be attached to an LED state. In addition, existing analog parameters have been enhanced to include the option of defining an alarm condition.
The communication status is located at the top-right of a window when a schema is opened in a One-Line Viewer, when using the Annunciator tool, and when in the IED Dashboard.
The communication status shows one of two states:
To view additional information about the communication state:
1. Click the Communication Status button. The Device Status window opens. This window is explained in the next section.
All relays on the schema are successfully communicating
The schema is having communication problems with at least one relay
22 ENERVISTA VIEWPOINT MONITORING – INSTRUCTION MANUAL
COMMUNICATION STATUS CHAPTER 3: INTERFACE
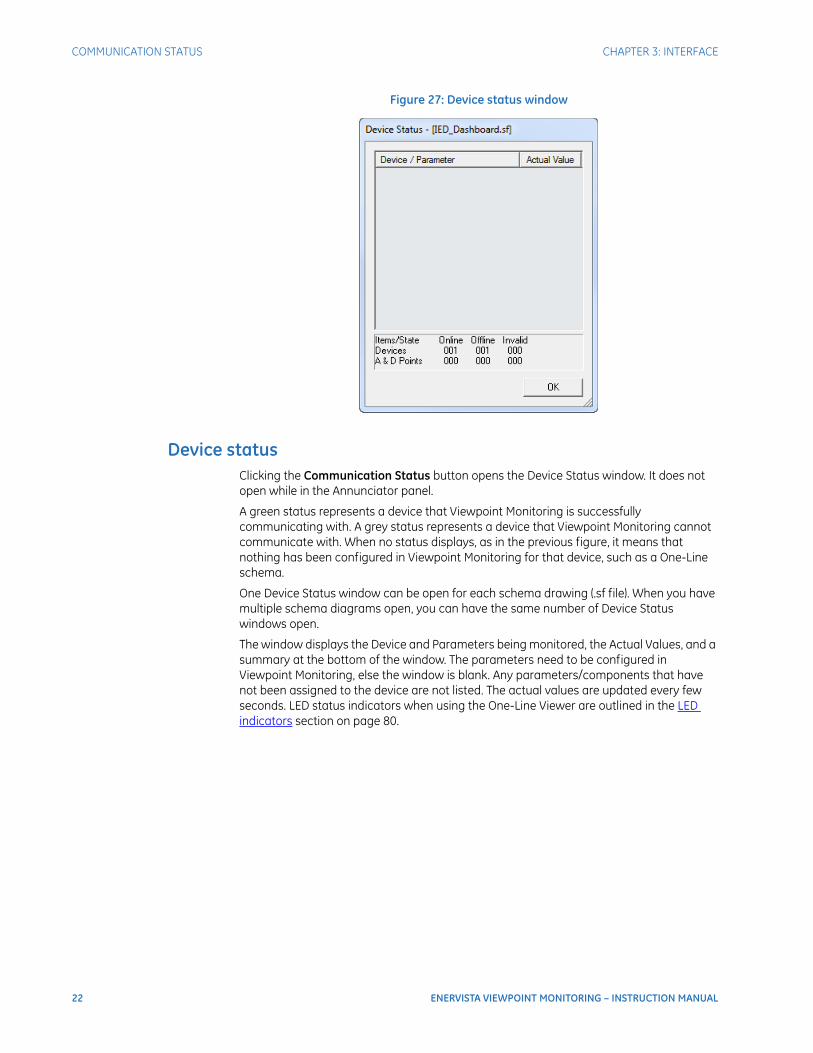
Figure 27: Device status window
Device statusClicking the Communication Status button opens the Device Status window. It does not open while in the Annunciator panel.
A green status represents a device that Viewpoint Monitoring is successfully communicating with. A grey status represents a device that Viewpoint Monitoring cannot communicate with. When no status displays, as in the previous figure, it means that nothing has been configured in Viewpoint Monitoring for that device, such as a One-Line schema.
One Device Status window can be open for each schema drawing (.sf file). When you have multiple schema diagrams open, you can have the same number of Device Status windows open.
The window displays the Device and Parameters being monitored, the Actual Values, and a summary at the bottom of the window. The parameters need to be configured in Viewpoint Monitoring, else the window is blank. Any parameters/components that have not been assigned to the device are not listed. The actual values are updated every few seconds. LED status indicators when using the One-Line Viewer are outlined in the LED indicators section on page 80.
CHAPTER 3: INTERFACE COMMUNICATION STATUS
ENERVISTA VIEWPOINT MONITORING – INSTRUCTION MANUAL 23
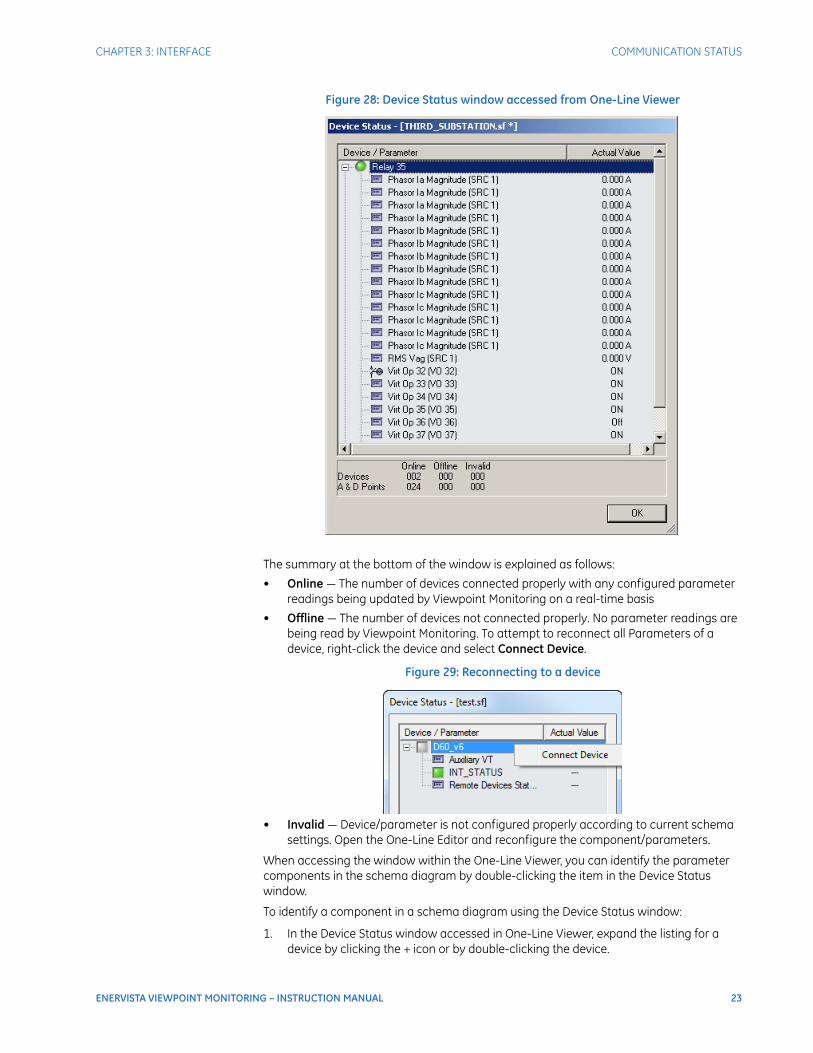
Figure 28: Device Status window accessed from One-Line Viewer
The summary at the bottom of the window is explained as follows:
• Online — The number of devices connected properly with any configured parameter readings being updated by Viewpoint Monitoring on a real-time basis
• Offline — The number of devices not connected properly. No parameter readings are being read by Viewpoint Monitoring. To attempt to reconnect all Parameters of a device, right-click the device and select Connect Device.
Figure 29: Reconnecting to a device
• Invalid — Device/parameter is not configured properly according to current schema settings. Open the One-Line Editor and reconfigure the component/parameters.
When accessing the window within the One-Line Viewer, you can identify the parameter components in the schema diagram by double-clicking the item in the Device Status window.
To identify a component in a schema diagram using the Device Status window:
1. In the Device Status window accessed in One-Line Viewer, expand the listing for a device by clicking the + icon or by double-clicking the device.

24 ENERVISTA VIEWPOINT MONITORING – INSTRUCTION MANUAL
ALARM AND ALERT LED INDICATORS CHAPTER 3: INTERFACE
2. Double-click a parameter to identify it in the One-Line Viewer window. The parameter is highlighted in the One-Line Viewer window.
Alarm and alert LED indicatorsEach opened schema has an associated tab located at the bottom-left of the screen. This section explains the status indicators and how to add them.
Figure 30: Schema indicator
Status explainedEach schema tab can have two pieces of information:
• A schema Indicator (round colored LED button)
• The name of the schema
For the tab to display a Schema Indicator, one of two rules must be satisfied as follows:
• The schema must contain at least one LED, or
• The schema must contain at least one analog parameter that has at least one alarm condition defined
A flashing indicator means that there has been a state change.
The indicator displayed is the one with the highest priority, outlined as follows.
Table 1: Priorities
There are no LEDs on the schema
All LEDs are in normal condition
At least one LED is in alert condition and the operator has acknowledged the LED. There are no alarm conditions present.
At least one LED is in alarm condition and the operator has acknowledged the LED
(flashing)
At least one LED has been reset. There are no alarms or alerts present.
(flashing)
At least one LED is in alert condition. There are no alarms. At least one LED has changed state.
(flashing)
At least one LED is in alarm condition. At least one LED has changed state.
No communications to any of the relays on the schema
Priority Level 1 - Lowest
CHAPTER 3: INTERFACE ALARM AND ALERT LED INDICATORS
ENERVISTA VIEWPOINT MONITORING – INSTRUCTION MANUAL 25
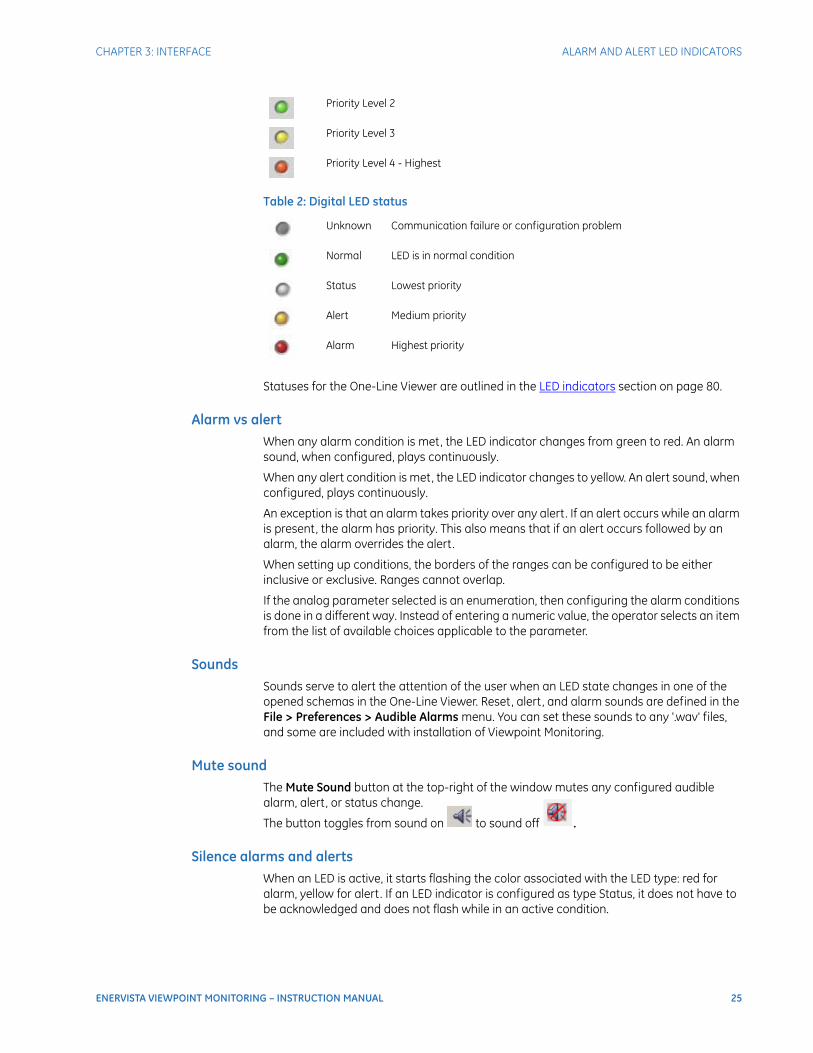
Table 2: Digital LED status
Statuses for the One-Line Viewer are outlined in the LED indicators section on page 80.
Alarm vs alertWhen any alarm condition is met, the LED indicator changes from green to red. An alarm sound, when configured, plays continuously.
When any alert condition is met, the LED indicator changes to yellow. An alert sound, when configured, plays continuously.
An exception is that an alarm takes priority over any alert. If an alert occurs while an alarm is present, the alarm has priority. This also means that if an alert occurs followed by an alarm, the alarm overrides the alert.
When setting up conditions, the borders of the ranges can be configured to be either inclusive or exclusive. Ranges cannot overlap.
If the analog parameter selected is an enumeration, then configuring the alarm conditions is done in a different way. Instead of entering a numeric value, the operator selects an item from the list of available choices applicable to the parameter.
SoundsSounds serve to alert the attention of the user when an LED state changes in one of the opened schemas in the One-Line Viewer. Reset, alert, and alarm sounds are defined in the File > Preferences > Audible Alarms menu. You can set these sounds to any '.wav' files, and some are included with installation of Viewpoint Monitoring.
Mute soundThe Mute Sound button at the top-right of the window mutes any configured audible alarm, alert, or status change.
The button toggles from sound on to sound off .
Silence alarms and alertsWhen an LED is active, it starts flashing the color associated with the LED type: red for alarm, yellow for alert. If an LED indicator is configured as type Status, it does not have to be acknowledged and does not flash while in an active condition.
Priority Level 2
Priority Level 3
Priority Level 4 - Highest
Unknown Communication failure or configuration problem
Normal LED is in normal condition
Status Lowest priority
Alert Medium priority
Alarm Highest priority
26 ENERVISTA VIEWPOINT MONITORING – INSTRUCTION MANUAL
ALARM AND ALERT LED INDICATORS CHAPTER 3: INTERFACE
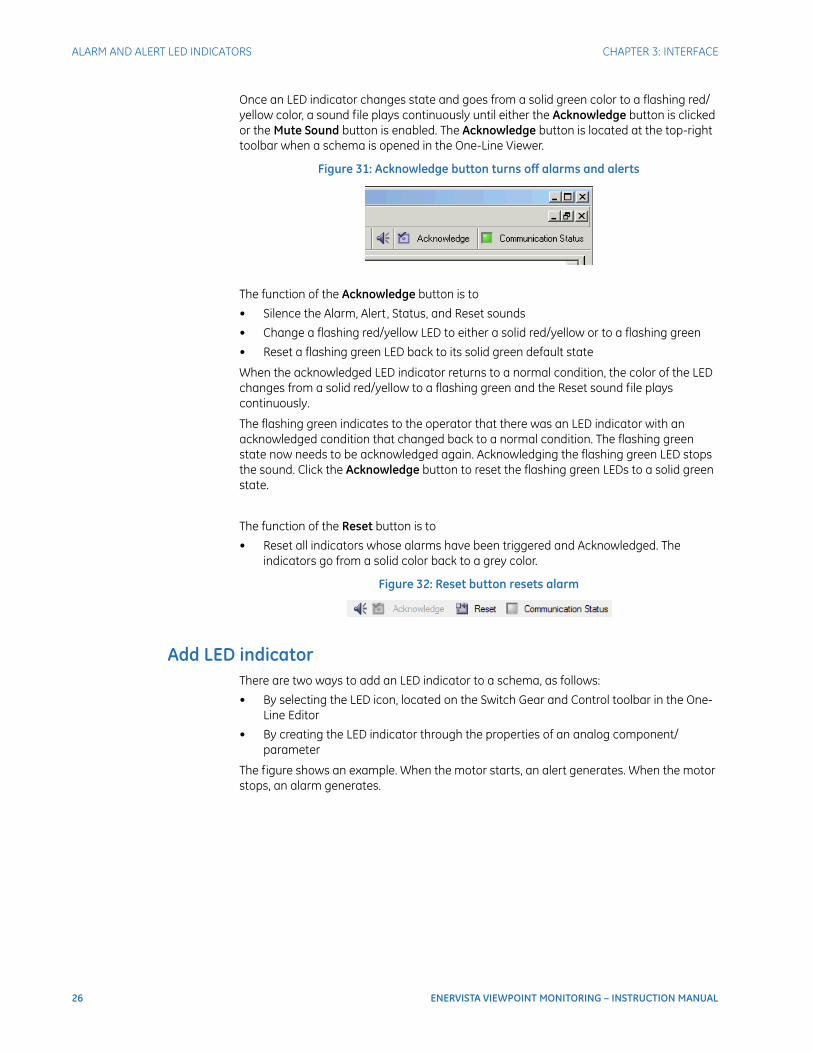
Once an LED indicator changes state and goes from a solid green color to a flashing red/yellow color, a sound file plays continuously until either the Acknowledge button is clicked or the Mute Sound button is enabled. The Acknowledge button is located at the top-right toolbar when a schema is opened in the One-Line Viewer.
Figure 31: Acknowledge button turns off alarms and alerts
The function of the Acknowledge button is to
• Silence the Alarm, Alert, Status, and Reset sounds
• Change a flashing red/yellow LED to either a solid red/yellow or to a flashing green
• Reset a flashing green LED back to its solid green default state
When the acknowledged LED indicator returns to a normal condition, the color of the LED changes from a solid red/yellow to a flashing green and the Reset sound file plays continuously.
The flashing green indicates to the operator that there was an LED indicator with an acknowledged condition that changed back to a normal condition. The flashing green state now needs to be acknowledged again. Acknowledging the flashing green LED stops the sound. Click the Acknowledge button to reset the flashing green LEDs to a solid green state.
The function of the Reset button is to
• Reset all indicators whose alarms have been triggered and Acknowledged. The indicators go from a solid color back to a grey color.
Figure 32: Reset button resets alarm
Add LED indicatorThere are two ways to add an LED indicator to a schema, as follows:
• By selecting the LED icon, located on the Switch Gear and Control toolbar in the One-Line Editor
• By creating the LED indicator through the properties of an analog component/parameter
The figure shows an example. When the motor starts, an alert generates. When the motor stops, an alarm generates.

CHAPTER 3: INTERFACE ALARM AND ALERT LED INDICATORS
ENERVISTA VIEWPOINT MONITORING – INSTRUCTION MANUAL 27
Figure 33: Configuring alert and alarm
Analog and digital indicators are outlined here. The analog format enters normal equations, while the digital formula performs AND, OR, and NOT calculations.
Add analog LED indicatorAn analog format enters normal equations. An LED indicator can be added.
There are two ways of placing an LED indicator on an analog schema. The direct way is to select the LED icon and place the icon in the schema work area. The indirect way of creating an analog LED indicator is by means of the analog component/parameter.
Method 1: DirectTo create an analog indicator:
1. In the main window of Viewpoint Monitoring, click the One-Line Editor option. The window opens.
2. Click the LED icon on the Switch Gear and Control toolbar. (If the toolbar is not present, enable it under the View > Toolbar menu.) The Create LED window opens.
Figure 34: Switch Gear and Control toolbar
3. Select the Analog option, then the size of the LED indicator. The size is either Small or Large.
28 ENERVISTA VIEWPOINT MONITORING – INSTRUCTION MANUAL
ALARM AND ALERT LED INDICATORS CHAPTER 3: INTERFACE
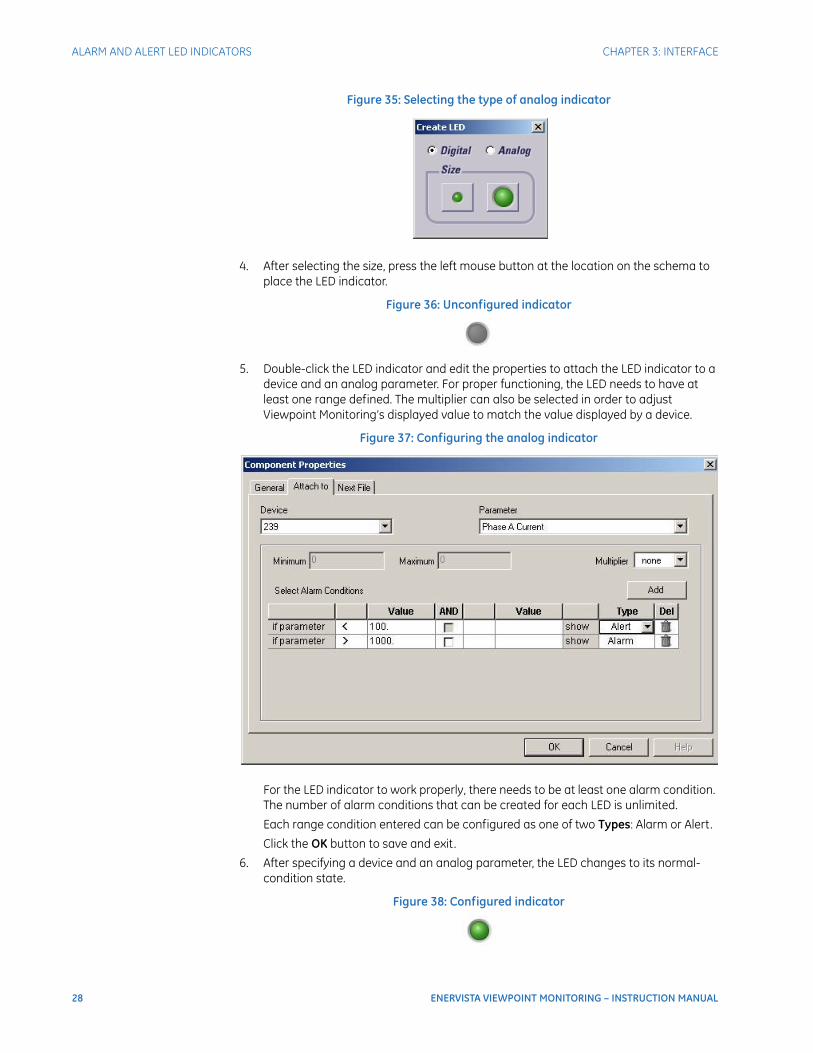
Figure 35: Selecting the type of analog indicator
4. After selecting the size, press the left mouse button at the location on the schema to place the LED indicator.
Figure 36: Unconfigured indicator
5. Double-click the LED indicator and edit the properties to attach the LED indicator to a device and an analog parameter. For proper functioning, the LED needs to have at least one range defined. The multiplier can also be selected in order to adjust Viewpoint Monitoring’s displayed value to match the value displayed by a device.
Figure 37: Configuring the analog indicator
For the LED indicator to work properly, there needs to be at least one alarm condition. The number of alarm conditions that can be created for each LED is unlimited.
Each range condition entered can be configured as one of two Types: Alarm or Alert.
Click the OK button to save and exit.
6. After specifying a device and an analog parameter, the LED changes to its normal-condition state.
Figure 38: Configured indicator
CHAPTER 3: INTERFACE ALARM AND ALERT LED INDICATORS
ENERVISTA VIEWPOINT MONITORING – INSTRUCTION MANUAL 29
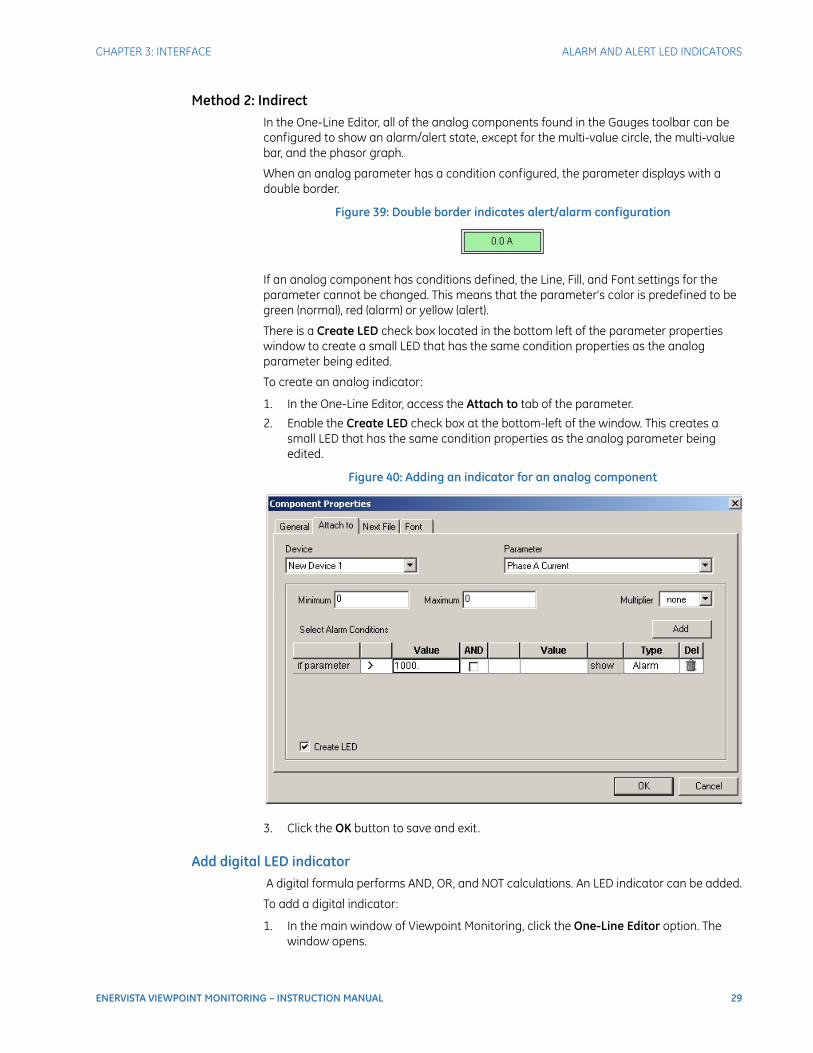
Method 2: IndirectIn the One-Line Editor, all of the analog components found in the Gauges toolbar can be configured to show an alarm/alert state, except for the multi-value circle, the multi-value bar, and the phasor graph.
When an analog parameter has a condition configured, the parameter displays with a double border.
Figure 39: Double border indicates alert/alarm configuration
If an analog component has conditions defined, the Line, Fill, and Font settings for the parameter cannot be changed. This means that the parameter's color is predefined to be green (normal), red (alarm) or yellow (alert).
There is a Create LED check box located in the bottom left of the parameter properties window to create a small LED that has the same condition properties as the analog parameter being edited.
To create an analog indicator:
1. In the One-Line Editor, access the Attach to tab of the parameter.
2. Enable the Create LED check box at the bottom-left of the window. This creates a small LED that has the same condition properties as the analog parameter being edited.
Figure 40: Adding an indicator for an analog component
3. Click the OK button to save and exit.
Add digital LED indicator A digital formula performs AND, OR, and NOT calculations. An LED indicator can be added.
To add a digital indicator:
1. In the main window of Viewpoint Monitoring, click the One-Line Editor option. The window opens.

30 ENERVISTA VIEWPOINT MONITORING – INSTRUCTION MANUAL
ALARM AND ALERT LED INDICATORS CHAPTER 3: INTERFACE
2. Click the LED icon on the Switch Gear and Control toolbar. (If the toolbar is not present, enable it under the View > Toolbar menu.) The Create LED window opens.
Figure 41: Switch Gear and Control toolbar
3. Select the Digital option, then the size of the LED indicator. The size is either Small or Large.
Figure 42: Selecting the type of digital indicator
4. After selecting the size, press the left mouse button at the location on the schema to place the LED indicator.
Figure 43: Unconfigured indicator
5. Double-click the LED indicator and edit the properties. In the Attach to tab, edit the LED properties to attach the indicator to a device and a parameter. The indicator can also be configured to become active when the digital parameter has a value of 0 by enabling the Reverse Indication check box. The LED indicator shows the current state of device's digital parameter (0 or 1).
Figure 44: Configuring the digital indicator
6. In the General tab, select the LED Type. A digital LED indicator can be one of three LED types: Alarm, Alert, or Status.
CHAPTER 3: INTERFACE FORMULA EDITOR
ENERVISTA VIEWPOINT MONITORING – INSTRUCTION MANUAL 31
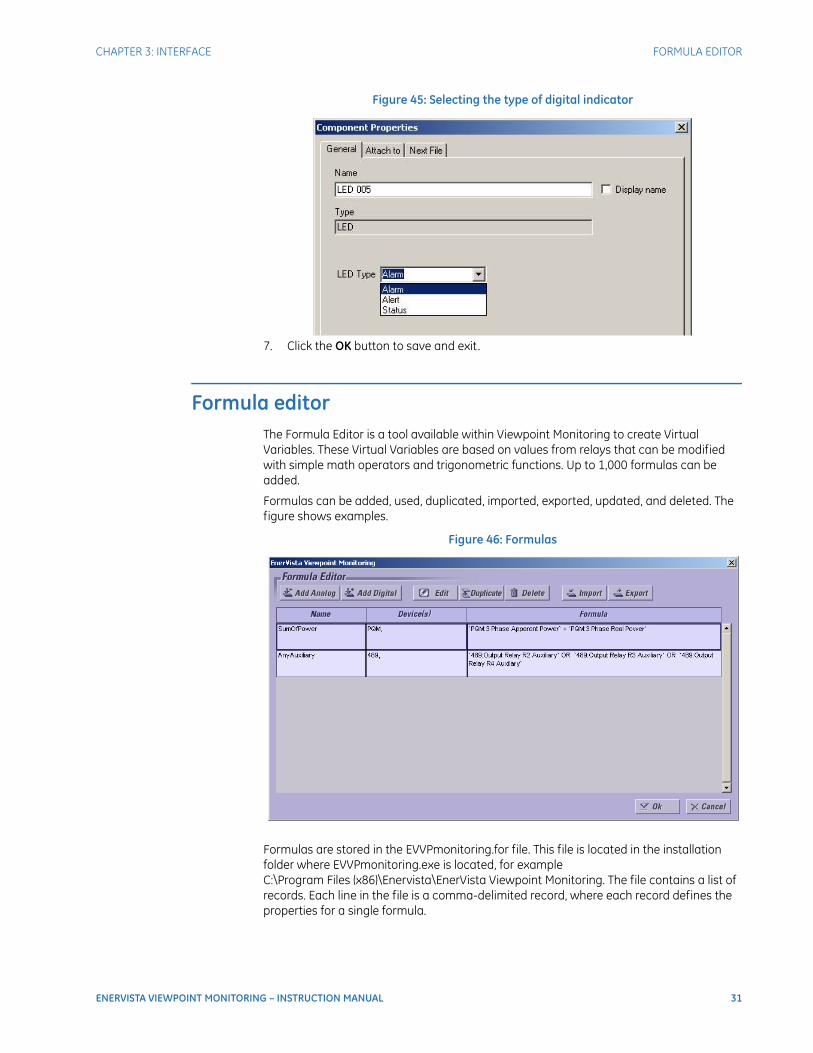
Figure 45: Selecting the type of digital indicator
7. Click the OK button to save and exit.
Formula editorThe Formula Editor is a tool available within Viewpoint Monitoring to create Virtual Variables. These Virtual Variables are based on values from relays that can be modified with simple math operators and trigonometric functions. Up to 1,000 formulas can be added.
Formulas can be added, used, duplicated, imported, exported, updated, and deleted. The figure shows examples.
Figure 46: Formulas
Formulas are stored in the EVVPmonitoring.for file. This file is located in the installation folder where EVVPmonitoring.exe is located, for example C:\Program Files (x86)\Enervista\EnerVista Viewpoint Monitoring. The file contains a list of records. Each line in the file is a comma-delimited record, where each record defines the properties for a single formula.

32 ENERVISTA VIEWPOINT MONITORING – INSTRUCTION MANUAL
FORMULA EDITOR CHAPTER 3: INTERFACE
Add formulaTo add a formula:
1. In the main window of Viewpoint Monitoring, click Tools > Formula Editor. The window opens.
Figure 47: Accessing the Formula Editor
2. Click the Add Analog or Add Digital button. The analog format enters normal equations, while the digital formula performs AND, OR, and NOT calculations. The Edit Formula window opens.
Figure 48: Formula Editor window
3. Use the graphical keypad and buttons displayed to enter the formula. Use the mouse to move the cursor position and to highlight blocks of the formula.

CHAPTER 3: INTERFACE FORMULA EDITOR
ENERVISTA VIEWPOINT MONITORING – INSTRUCTION MANUAL 33
Figure 49: Analog formula window
Formula Name — Name of formula. Required field.
Units — The units the formula is evaluated in. Required field.
Device — Select a device from which the parameters are selected. The device is used only as a template. If you reference another, similar device, then the same formula is available to other devices.
Formula — Enter the formula. To use a parameter from the device, clicking the Parameter button inserts a parameter variable in the formula. You then click it to select this parameter to specify the exact parameter from the drop-down box containing a list of all possible analog parameters for this particular device.
Del — Click this button to delete any selected formula entry, for example when you add two parameter fields and only want one.
4. Click the Evaluate button to have the formula parameters resolved (communication requests retrieve data values). Instead of the formula, all of the individual parameter values and the formula results display.
5. Click the Ok button to save and exit.
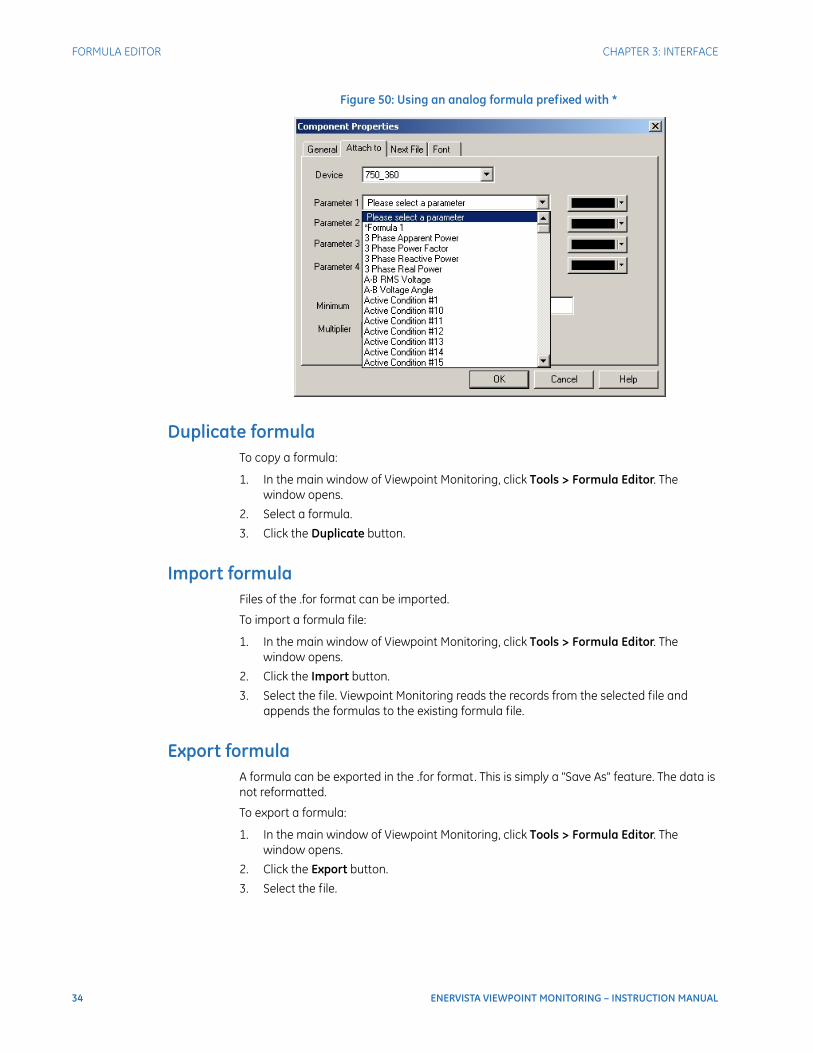
Use formulaDevice formulas are accessible in any parameter list. The list of formulas created for a device is appended to the parameter list of a device. Analog formula names are prefixed with a "*" to differentiate the formulas from the device's analog parameters. Digital formula names are prefixed with a '#' to differentiate the formulas from the device's digital parameters.
The figure shows the component properties of a multi-value circle gauge. Formula 1 was previously created for the 750_360 device and is seen in the analog parameter list prefixed by a "*".
34 ENERVISTA VIEWPOINT MONITORING – INSTRUCTION MANUAL
FORMULA EDITOR CHAPTER 3: INTERFACE
Figure 50: Using an analog formula prefixed with *
Duplicate formulaTo copy a formula:
1. In the main window of Viewpoint Monitoring, click Tools > Formula Editor. The window opens.
2. Select a formula.
3. Click the Duplicate button.
Import formulaFiles of the .for format can be imported.
To import a formula file:
1. In the main window of Viewpoint Monitoring, click Tools > Formula Editor. The window opens.
2. Click the Import button.
3. Select the file. Viewpoint Monitoring reads the records from the selected file and appends the formulas to the existing formula file.
Export formulaA formula can be exported in the .for format. This is simply a "Save As" feature. The data is not reformatted.
To export a formula:
1. In the main window of Viewpoint Monitoring, click Tools > Formula Editor. The window opens.
2. Click the Export button.
3. Select the file.
CHAPTER 3: INTERFACE ONLINE HELP
ENERVISTA VIEWPOINT MONITORING – INSTRUCTION MANUAL 35
Update formulaTo edit a formula:
1. In the main window of Viewpoint Monitoring, click Tools > Formula Editor. The window opens.
2. Select the formula.
3. Click the Edit button.
Delete formulaTo delete a formula:
1. In the main window of Viewpoint Monitoring, click Tools > Formula Editor. The window opens.
2. Select the formula.
3. Click the Delete button.
Online helpTo view this instruction manual, click Help > Contents.
To view video-based help, click Help > Help - Getting Started or click the help icon that displays in a few windows, including the main window.
Figure 51: Online video help icon

36 ENERVISTA VIEWPOINT MONITORING – INSTRUCTION MANUAL
ONLINE HELP CHAPTER 3: INTERFACE
ENERVISTA VIEWPOINT MONITORING – INSTRUCTION MANUAL 37
EnerVista Viewpoint Monitoring
Chapter 4: IED Dashboard
IED Dashboard
This chapter outlines how to use the dashboard.
• Access dashboard
• Access device front panel
• Import templates
• Toolbars and buttons
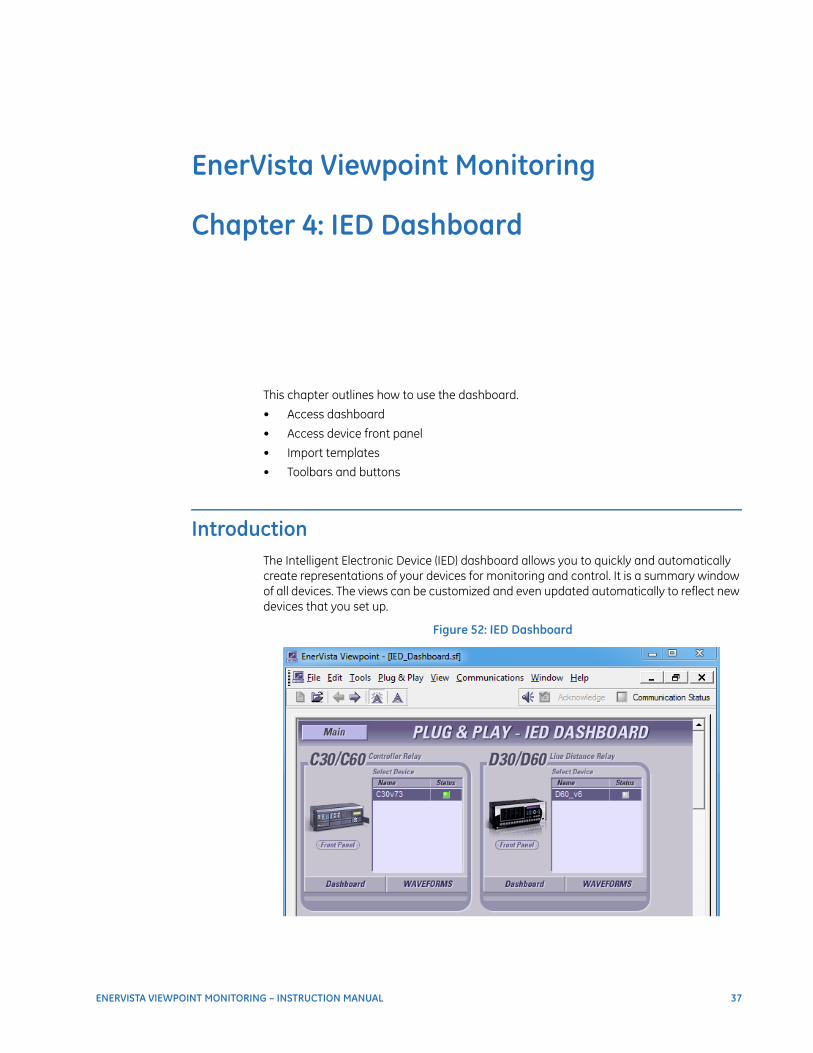
IntroductionThe Intelligent Electronic Device (IED) dashboard allows you to quickly and automatically create representations of your devices for monitoring and control. It is a summary window of all devices. The views can be customized and even updated automatically to reflect new devices that you set up.
Figure 52: IED Dashboard
38 ENERVISTA VIEWPOINT MONITORING – INSTRUCTION MANUAL
INTRODUCTION CHAPTER 4: IED DASHBOARD
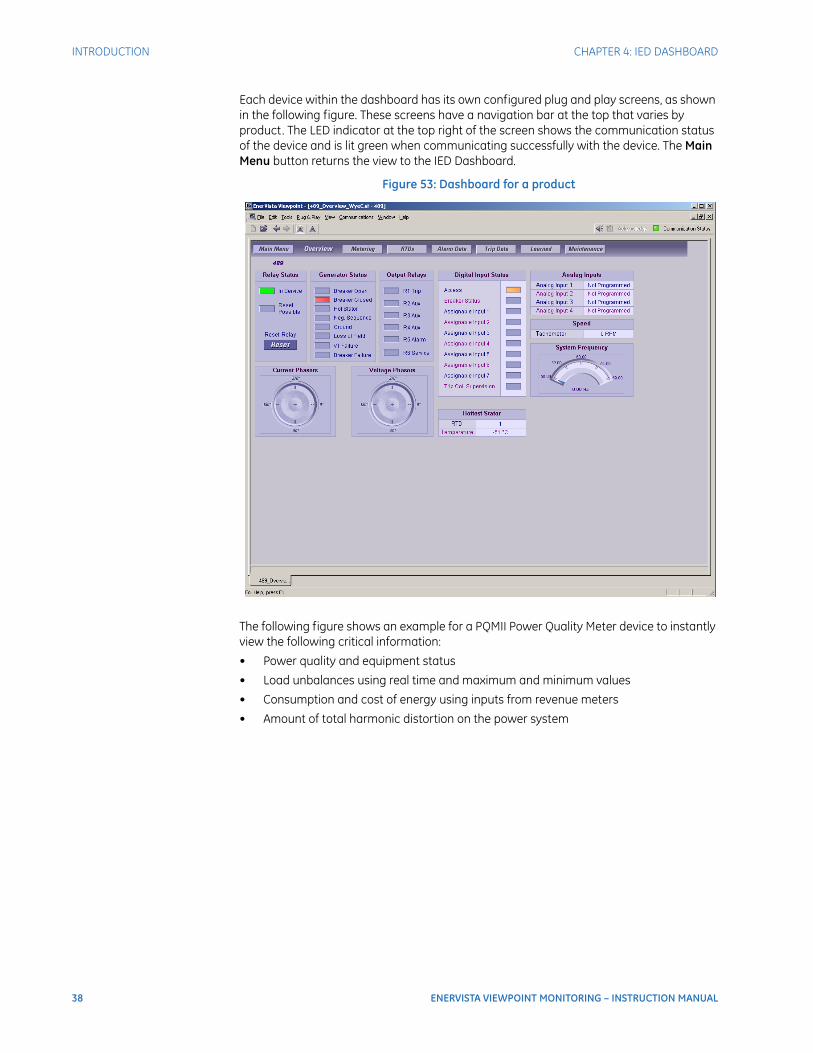
Each device within the dashboard has its own configured plug and play screens, as shown in the following figure. These screens have a navigation bar at the top that varies by product. The LED indicator at the top right of the screen shows the communication status of the device and is lit green when communicating successfully with the device. The Main Menu button returns the view to the IED Dashboard.
Figure 53: Dashboard for a product
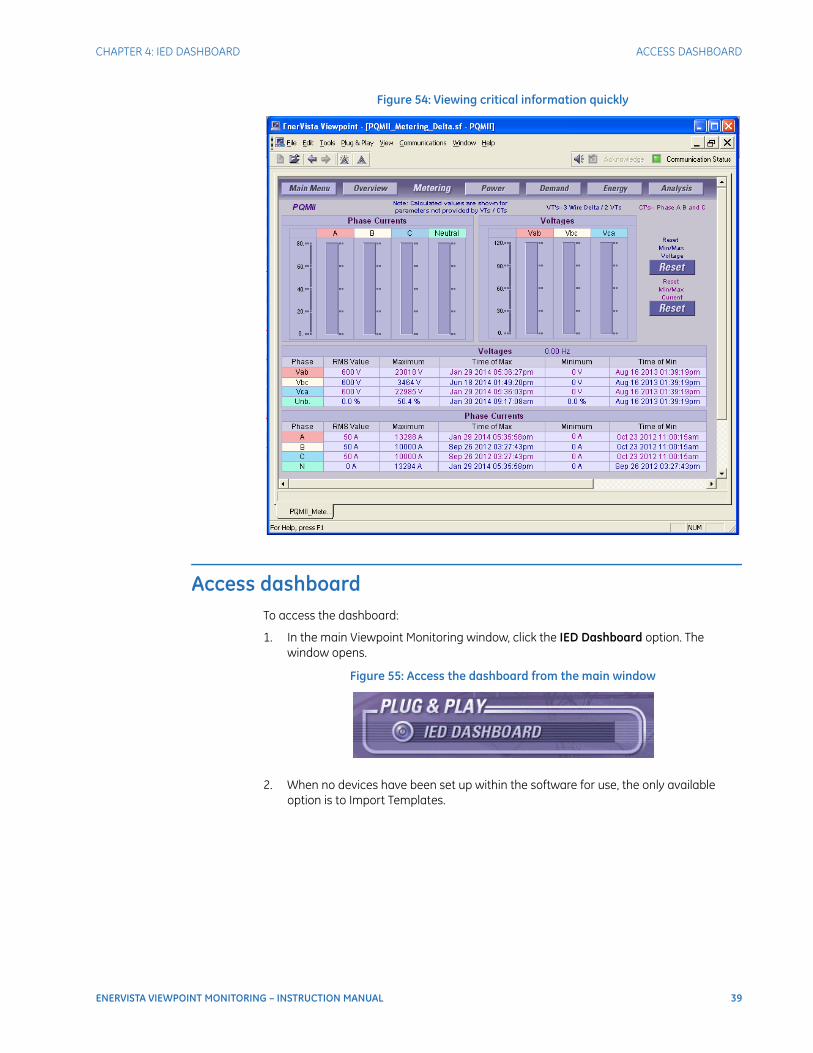
The following figure shows an example for a PQMII Power Quality Meter device to instantly view the following critical information:
• Power quality and equipment status
• Load unbalances using real time and maximum and minimum values
• Consumption and cost of energy using inputs from revenue meters
• Amount of total harmonic distortion on the power system
CHAPTER 4: IED DASHBOARD ACCESS DASHBOARD
ENERVISTA VIEWPOINT MONITORING – INSTRUCTION MANUAL 39
Figure 54: Viewing critical information quickly
Access dashboardTo access the dashboard:
1. In the main Viewpoint Monitoring window, click the IED Dashboard option. The window opens.
Figure 55: Access the dashboard from the main window
2. When no devices have been set up within the software for use, the only available option is to Import Templates.
40 ENERVISTA VIEWPOINT MONITORING – INSTRUCTION MANUAL
ACCESS DASHBOARD CHAPTER 4: IED DASHBOARD
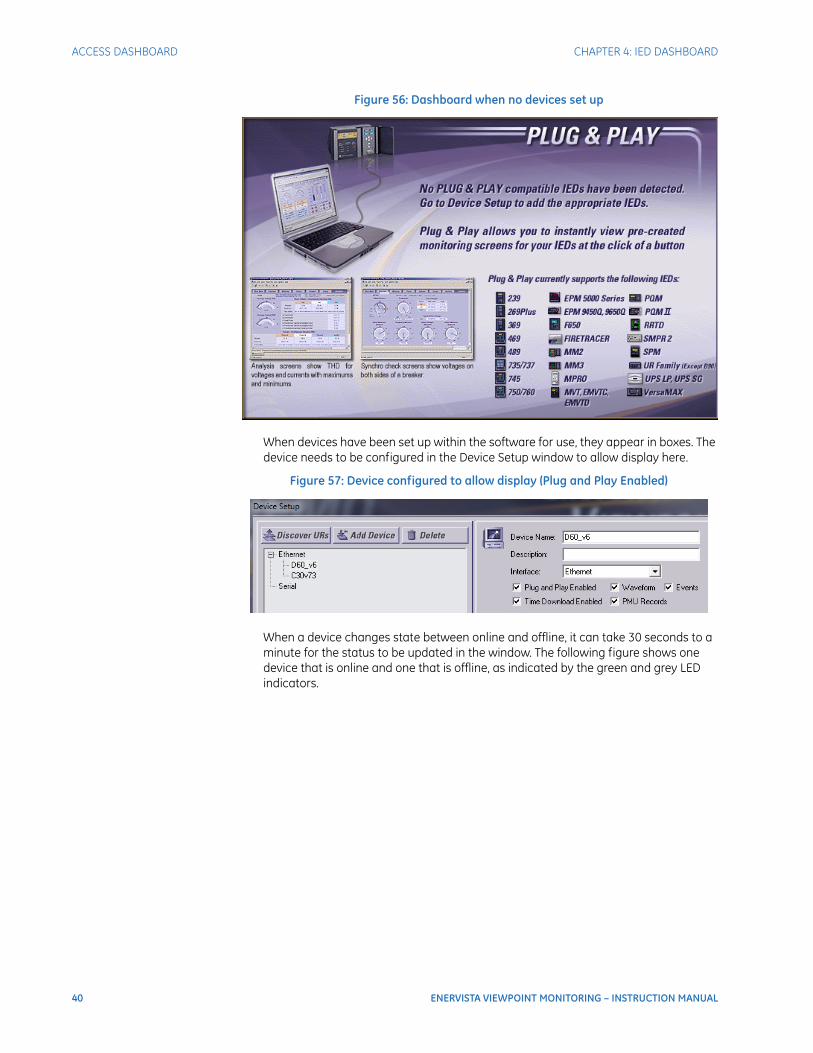
Figure 56: Dashboard when no devices set up
When devices have been set up within the software for use, they appear in boxes. The device needs to be configured in the Device Setup window to allow display here.
Figure 57: Device configured to allow display (Plug and Play Enabled)
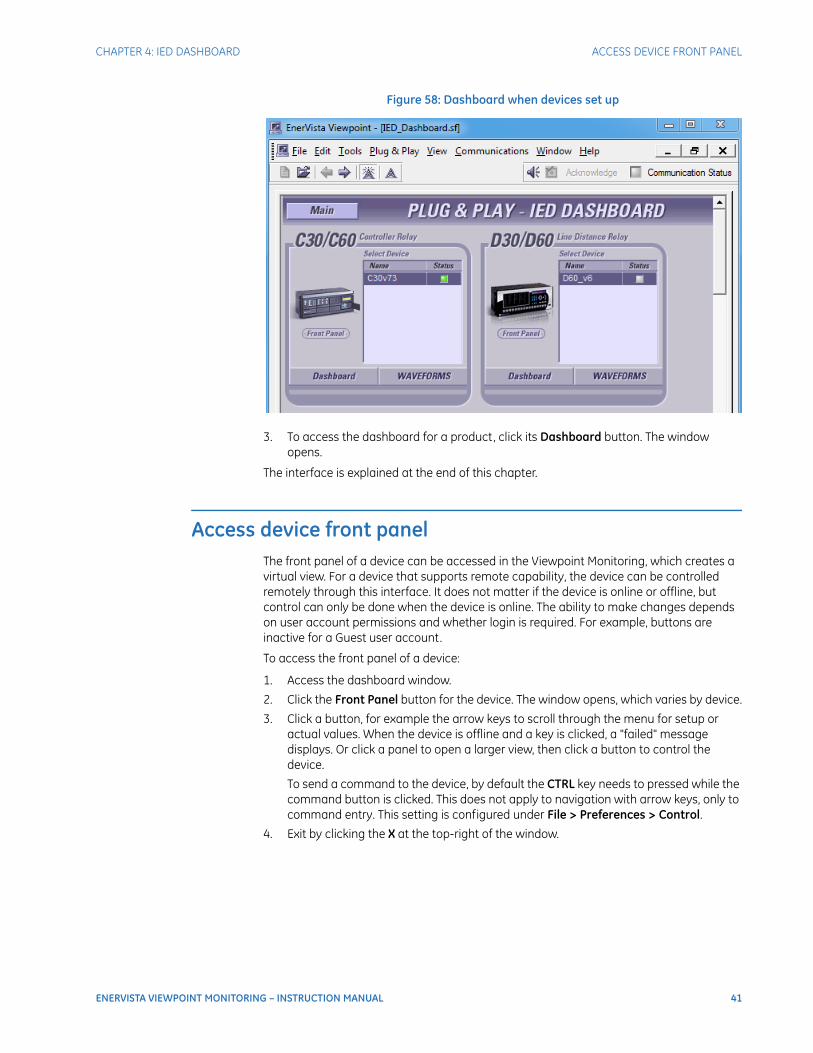
When a device changes state between online and offline, it can take 30 seconds to a minute for the status to be updated in the window. The following figure shows one device that is online and one that is offline, as indicated by the green and grey LED indicators.
CHAPTER 4: IED DASHBOARD ACCESS DEVICE FRONT PANEL
ENERVISTA VIEWPOINT MONITORING – INSTRUCTION MANUAL 41
Figure 58: Dashboard when devices set up
3. To access the dashboard for a product, click its Dashboard button. The window opens.
The interface is explained at the end of this chapter.
Access device front panelThe front panel of a device can be accessed in the Viewpoint Monitoring, which creates a virtual view. For a device that supports remote capability, the device can be controlled remotely through this interface. It does not matter if the device is online or offline, but control can only be done when the device is online. The ability to make changes depends on user account permissions and whether login is required. For example, buttons are inactive for a Guest user account.
To access the front panel of a device:
1. Access the dashboard window.
2. Click the Front Panel button for the device. The window opens, which varies by device.
3. Click a button, for example the arrow keys to scroll through the menu for setup or actual values. When the device is offline and a key is clicked, a "failed" message displays. Or click a panel to open a larger view, then click a button to control the device.
To send a command to the device, by default the CTRL key needs to pressed while the command button is clicked. This does not apply to navigation with arrow keys, only to command entry. This setting is configured under File > Preferences > Control.
4. Exit by clicking the X at the top-right of the window.

42 ENERVISTA VIEWPOINT MONITORING – INSTRUCTION MANUAL
IMPORT TEMPLATES FOR CUSTOMIZATION CHAPTER 4: IED DASHBOARD
Figure 59: Controlling a device in Viewpoint Monitoring
Import templates for customizationThe virtual views of devices in the dashboard are templates. These templates are included with installation of Viewpoint Monitoring. These are the demonstration files referred to elsewhere in this document. They can be imported into Viewpoint Monitoring, opened, and customized for use.
With hidden files and folders showing (as set in the Control Panel in Windows), files can be imported from the following folders:
C:\ProgramData\EnerVista\Viewpoint Monitoring\My Documents\Plug and Play\Templates\
C:\ProgramData\EnerVista\Viewpoint Monitoring\My Documents\Examples\
To import templates:
1. In the main Viewpoint Monitoring window, click Plug & Play > Import Templates. A window opens.
2. In the Templates or other folder, select one of the .sf files. At the prompt, verify the import of all information associated with that file.
CHAPTER 4: IED DASHBOARD IMPORT TEMPLATES FOR CUSTOMIZATION
ENERVISTA VIEWPOINT MONITORING – INSTRUCTION MANUAL 43
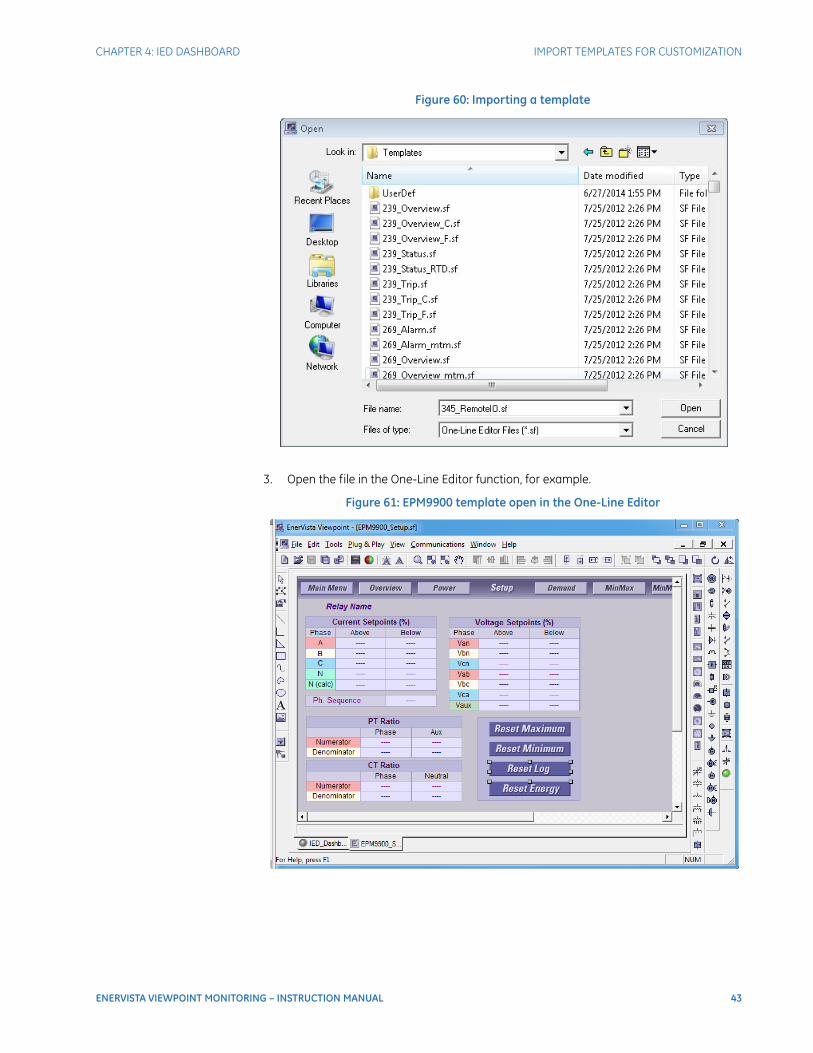
Figure 60: Importing a template
3. Open the file in the One-Line Editor function, for example.
Figure 61: EPM9900 template open in the One-Line Editor
44 ENERVISTA VIEWPOINT MONITORING – INSTRUCTION MANUAL
TOOLBAR AND BUTTONS CHAPTER 4: IED DASHBOARD
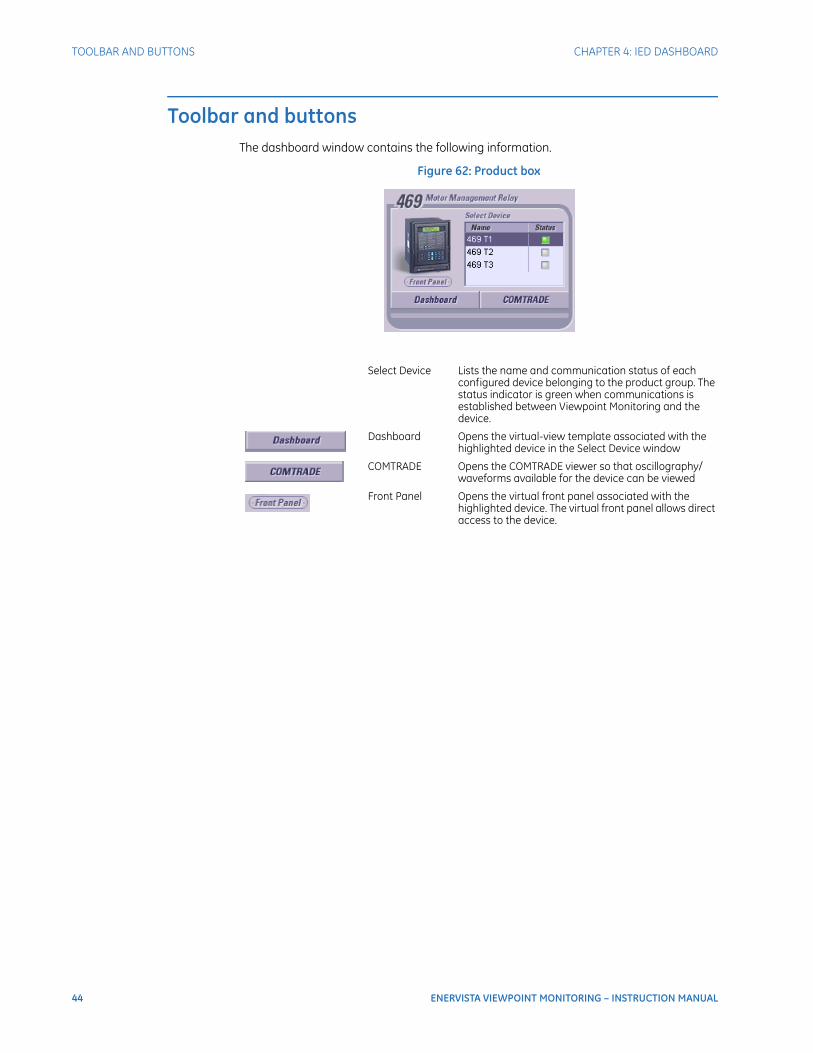
Toolbar and buttonsThe dashboard window contains the following information.
Figure 62: Product box
Select Device Lists the name and communication status of each configured device belonging to the product group. The status indicator is green when communications is established between Viewpoint Monitoring and the device.
Dashboard Opens the virtual-view template associated with the highlighted device in the Select Device window
COMTRADE Opens the COMTRADE viewer so that oscillography/waveforms available for the device can be viewed
Front Panel Opens the virtual front panel associated with the highlighted device. The virtual front panel allows direct access to the device.

ENERVISTA VIEWPOINT MONITORING – INSTRUCTION MANUAL 45
EnerVista Viewpoint Monitoring
Chapter 5: Device Setup
Device Setup
This chapter outlines device configuration within Viewpoint Monitoring.
• Add device
• Add and manage devices with customer file editor
• Import device
• Update device
• Delete device
IntroductionViewpoint Monitoring needs to be set up for a device before it can monitor the device. Information is added automatically, manually, or by import.
GE and non-GE devices can be added.
The Device Setup option in Viewpoint Monitoring is used to manage devices.
The files that define devices, meaning the .cdd definition file and .bmp image file, are located in the C:\ProgramData\EnerVista\Viewpoint Monitoring\Devices folder.
Add deviceSee the Quickstart Guide for instructions on adding or importing GE devices and adding non-GE devices for which you have a .cdd file. For all other devices, use the next section to manually define and add a device.
For a list of devices supported, see the Release Notes under Start > All Programs > EnerVista > Monitoring Release Notes.
46 ENERVISTA VIEWPOINT MONITORING – INSTRUCTION MANUAL
ADD AND MANAGE DEVICES WITH CUSTOM FILE EDITOR CHAPTER 5: DEVICE SETUP
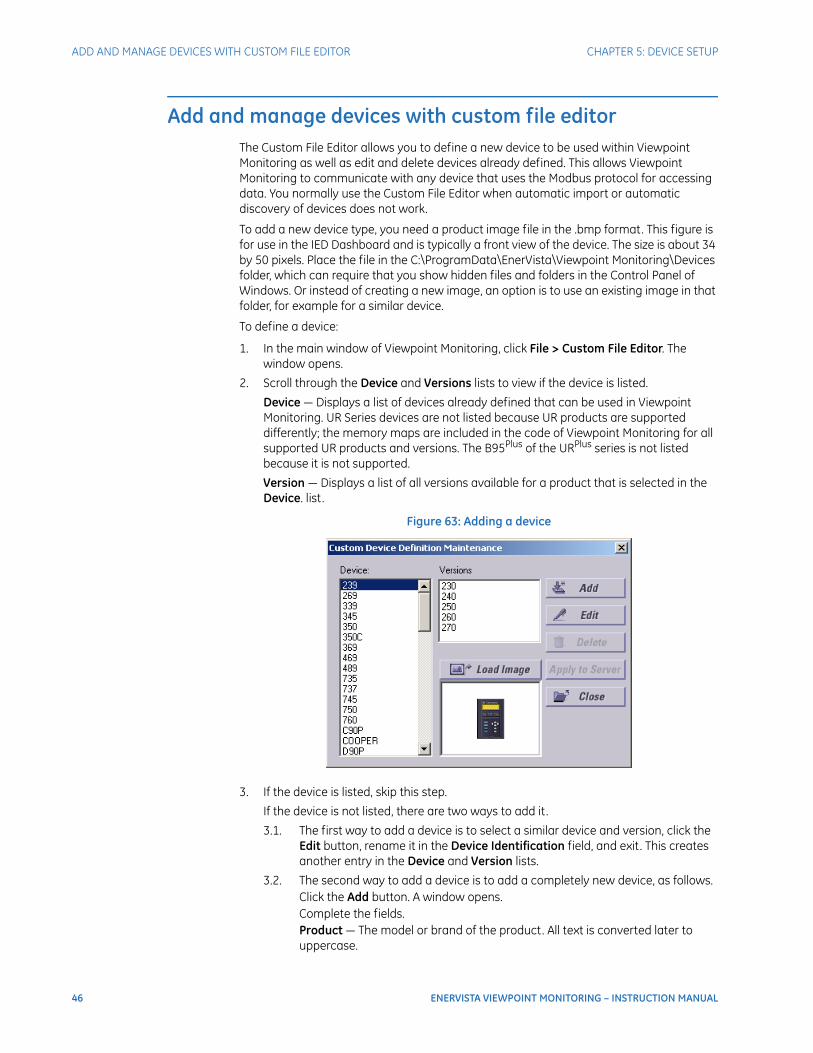
Add and manage devices with custom file editorThe Custom File Editor allows you to define a new device to be used within Viewpoint Monitoring as well as edit and delete devices already defined. This allows Viewpoint Monitoring to communicate with any device that uses the Modbus protocol for accessing data. You normally use the Custom File Editor when automatic import or automatic discovery of devices does not work.
To add a new device type, you need a product image file in the .bmp format. This figure is for use in the IED Dashboard and is typically a front view of the device. The size is about 34 by 50 pixels. Place the file in the C:\ProgramData\EnerVista\Viewpoint Monitoring\Devices folder, which can require that you show hidden files and folders in the Control Panel of Windows. Or instead of creating a new image, an option is to use an existing image in that folder, for example for a similar device.
To define a device:
1. In the main window of Viewpoint Monitoring, click File > Custom File Editor. The window opens.
2. Scroll through the Device and Versions lists to view if the device is listed.
Device — Displays a list of devices already defined that can be used in Viewpoint Monitoring. UR Series devices are not listed because UR products are supported differently; the memory maps are included in the code of Viewpoint Monitoring for all supported UR products and versions. The B95Plus of the URPlus series is not listed because it is not supported.
Version — Displays a list of all versions available for a product that is selected in the Device. list.
Figure 63: Adding a device
3. If the device is listed, skip this step.
If the device is not listed, there are two ways to add it .
3.1. The first way to add a device is to select a similar device and version, click the Edit button, rename it in the Device Identification field, and exit. This creates another entry in the Device and Version lists.
3.2. The second way to add a device is to add a completely new device, as follows.Click the Add button. A window opens.Complete the fields.Product — The model or brand of the product. All text is converted later to uppercase.

CHAPTER 5: DEVICE SETUP ADD AND MANAGE DEVICES WITH CUSTOM FILE EDITOR
ENERVISTA VIEWPOINT MONITORING – INSTRUCTION MANUAL 47
Version — The version number of the device firmware without punctuation, for example 100 instead of 1.00.
Figure 64: Defining a device
Click the OK button to save and exit. Select the Device and Version. Click the Load Image button.In the window that opens, upload a figure to display in the IED Dashboard in Viewpoint Monitoring. The default folder for the other images is the C:\ProgramData\EnerVista\Viewpoint Monitoring\Devices folder. Only the .bmp format is supported. Any other uploaded file type does not display.
4. In the Custom Device Definition Maintenance window, click the Edit button. The Custom Device Definition window opens.
5. Add the Modbus entries or edit any existing .cdd file that displays. The window is explained in the next section.
6. To add the new custom device type to GE32MTCP or GE32MODB servers, with the Device and Version selected, click the Apply to Server button.
7. Click the Close button to exit.
Custom Device Definition windowThis section is for advanced users.
The Custom Device Definition window is used to configure existing and new devices using Modbus addresses. Changes made here affect the .cdd file for the device. The window varies with device, for example the check boxes displayed. By completing this window, you manually create a representation of the memory map of the device in the form of a .cdd file.
There is no option to import a .cdd file.
When entering in a new Modbus entry in the spreadsheet part of the window, the Label and Modbus Address are required. All other fields load automatically with default values.
You add only the registry entries that you want to read/monitor, not the entire memory map of a device. The entries added are usually actual values, such as power, energy, and currents. You look them up in the communications guide / memory map supplied with the device.
All entries in the custom table need to be in the communications guide / memory map supplied with the product.
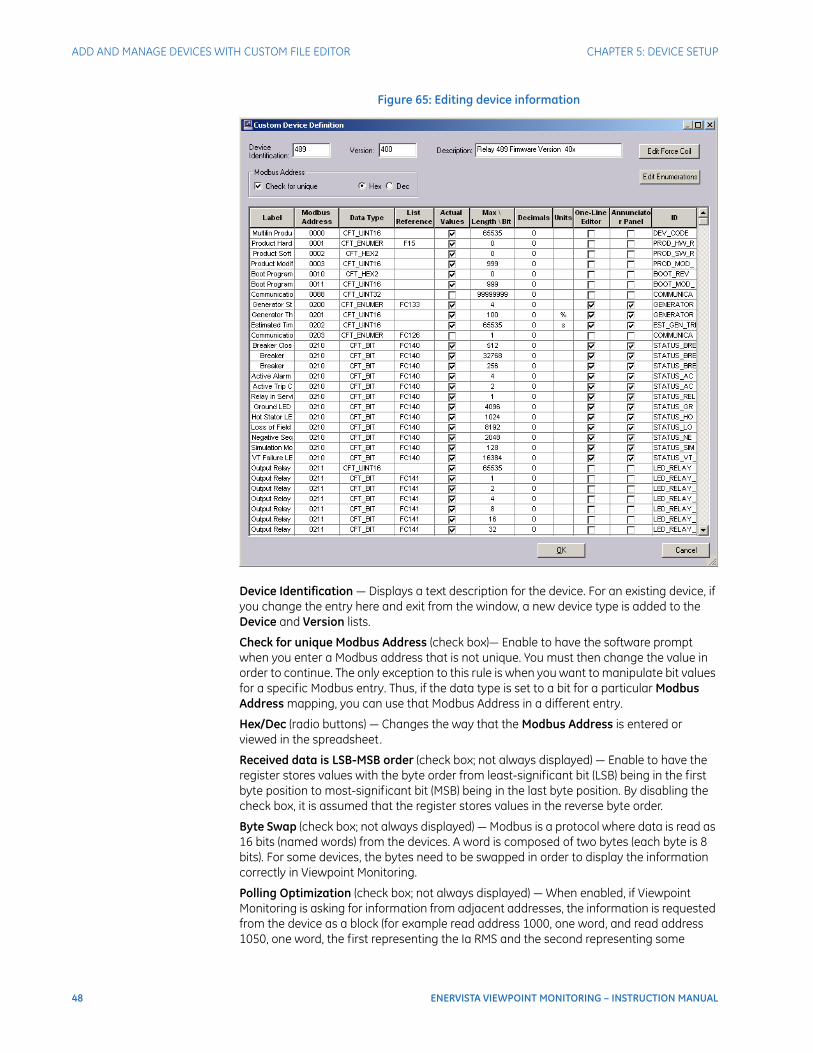
48 ENERVISTA VIEWPOINT MONITORING – INSTRUCTION MANUAL
ADD AND MANAGE DEVICES WITH CUSTOM FILE EDITOR CHAPTER 5: DEVICE SETUP
Figure 65: Editing device information
Device Identification — Displays a text description for the device. For an existing device, if you change the entry here and exit from the window, a new device type is added to the Device and Version lists.
Check for unique Modbus Address (check box)— Enable to have the software prompt when you enter a Modbus address that is not unique. You must then change the value in order to continue. The only exception to this rule is when you want to manipulate bit values for a specific Modbus entry. Thus, if the data type is set to a bit for a particular Modbus Address mapping, you can use that Modbus Address in a different entry.
Hex/Dec (radio buttons) — Changes the way that the Modbus Address is entered or viewed in the spreadsheet.
Received data is LSB-MSB order (check box; not always displayed) — Enable to have the register stores values with the byte order from least-significant bit (LSB) being in the first byte position to most-significant bit (MSB) being in the last byte position. By disabling the check box, it is assumed that the register stores values in the reverse byte order.
Byte Swap (check box; not always displayed) — Modbus is a protocol where data is read as 16 bits (named words) from the devices. A word is composed of two bytes (each byte is 8 bits). For some devices, the bytes need to be swapped in order to display the information correctly in Viewpoint Monitoring.
Polling Optimization (check box; not always displayed) — When enabled, if Viewpoint Monitoring is asking for information from adjacent addresses, the information is requested from the device as a block (for example read address 1000, one word, and read address 1050, one word, the first representing the Ia RMS and the second representing some
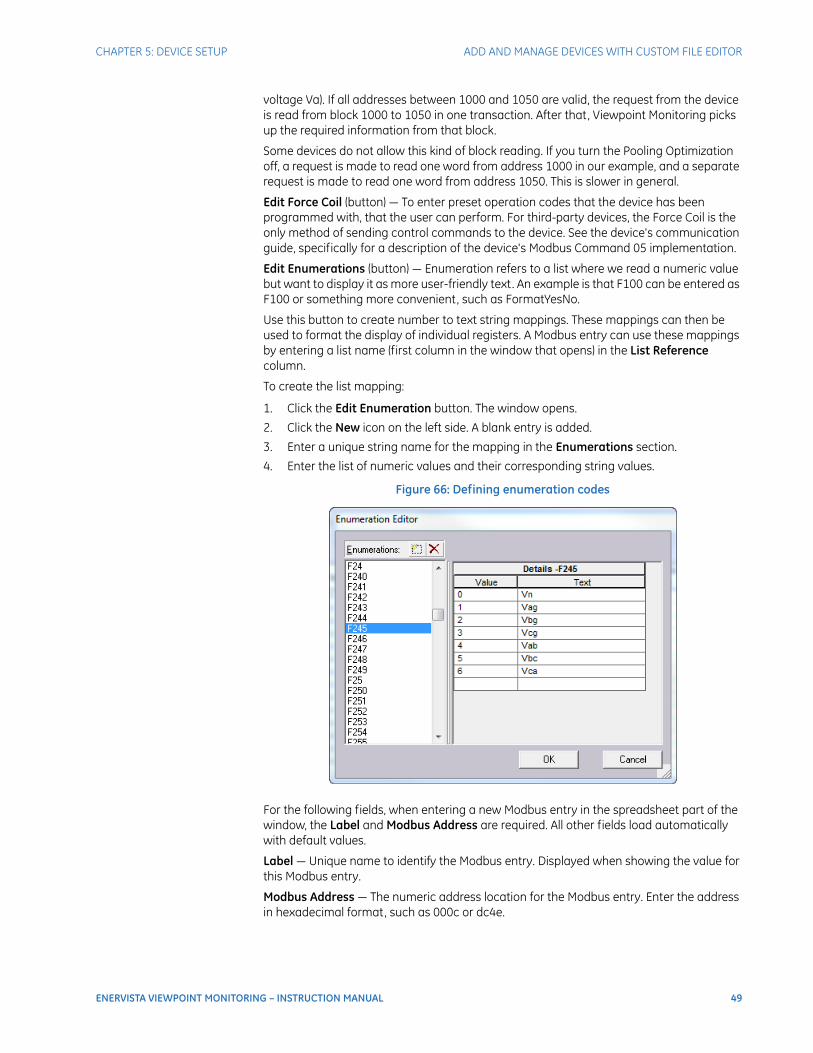
CHAPTER 5: DEVICE SETUP ADD AND MANAGE DEVICES WITH CUSTOM FILE EDITOR
ENERVISTA VIEWPOINT MONITORING – INSTRUCTION MANUAL 49
voltage Va). If all addresses between 1000 and 1050 are valid, the request from the device is read from block 1000 to 1050 in one transaction. After that, Viewpoint Monitoring picks up the required information from that block.
Some devices do not allow this kind of block reading. If you turn the Pooling Optimization off, a request is made to read one word from address 1000 in our example, and a separate request is made to read one word from address 1050. This is slower in general.
Edit Force Coil (button) — To enter preset operation codes that the device has been programmed with, that the user can perform. For third-party devices, the Force Coil is the only method of sending control commands to the device. See the device's communication guide, specifically for a description of the device's Modbus Command 05 implementation.
Edit Enumerations (button) — Enumeration refers to a list where we read a numeric value but want to display it as more user-friendly text. An example is that F100 can be entered as F100 or something more convenient, such as FormatYesNo.
Use this button to create number to text string mappings. These mappings can then be used to format the display of individual registers. A Modbus entry can use these mappings by entering a list name (first column in the window that opens) in the List Reference column.
To create the list mapping:
1. Click the Edit Enumeration button. The window opens.
2. Click the New icon on the left side. A blank entry is added.
3. Enter a unique string name for the mapping in the Enumerations section.
4. Enter the list of numeric values and their corresponding string values.
Figure 66: Defining enumeration codes
For the following fields, when entering a new Modbus entry in the spreadsheet part of the window, the Label and Modbus Address are required. All other fields load automatically with default values.
Label — Unique name to identify the Modbus entry. Displayed when showing the value for this Modbus entry.
Modbus Address — The numeric address location for the Modbus entry. Enter the address in hexadecimal format, such as 000c or dc4e.
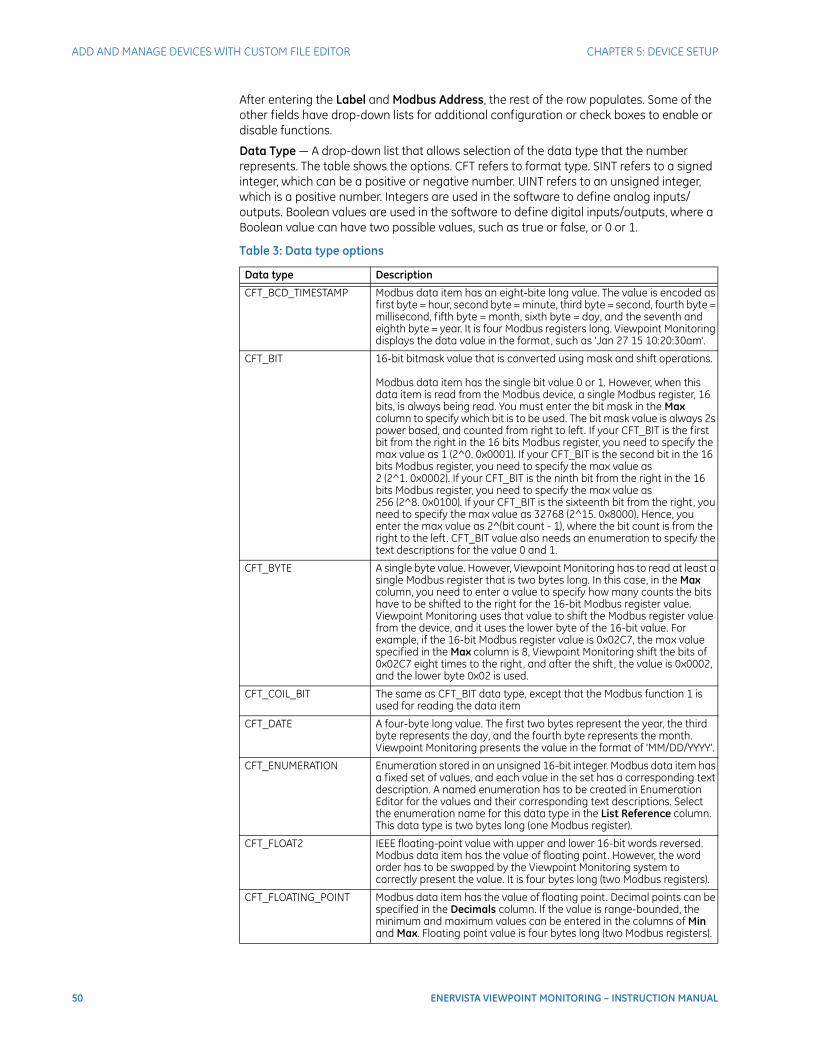
50 ENERVISTA VIEWPOINT MONITORING – INSTRUCTION MANUAL
ADD AND MANAGE DEVICES WITH CUSTOM FILE EDITOR CHAPTER 5: DEVICE SETUP
After entering the Label and Modbus Address, the rest of the row populates. Some of the other fields have drop-down lists for additional configuration or check boxes to enable or disable functions.
Data Type — A drop-down list that allows selection of the data type that the number represents. The table shows the options. CFT refers to format type. SINT refers to a signed integer, which can be a positive or negative number. UINT refers to an unsigned integer, which is a positive number. Integers are used in the software to define analog inputs/outputs. Boolean values are used in the software to define digital inputs/outputs, where a Boolean value can have two possible values, such as true or false, or 0 or 1.
Table 3: Data type options
Data type Description
CFT_BCD_TIMESTAMP Modbus data item has an eight-bite long value. The value is encoded as first byte = hour, second byte = minute, third byte = second, fourth byte = millisecond, fifth byte = month, sixth byte = day, and the seventh and eighth byte = year. It is four Modbus registers long. Viewpoint Monitoring displays the data value in the format, such as 'Jan 27 15 10:20:30am'.
CFT_BIT 16-bit bitmask value that is converted using mask and shift operations.
Modbus data item has the single bit value 0 or 1. However, when this data item is read from the Modbus device, a single Modbus register, 16 bits, is always being read. You must enter the bit mask in the Max column to specify which bit is to be used. The bit mask value is always 2s power based, and counted from right to left. If your CFT_BIT is the first bit from the right in the 16 bits Modbus register, you need to specify the max value as 1 (2^0. 0x0001). If your CFT_BIT is the second bit in the 16 bits Modbus register, you need to specify the max value as 2 (2^1. 0x0002). If your CFT_BIT is the ninth bit from the right in the 16 bits Modbus register, you need to specify the max value as 256 (2^8. 0x0100). If your CFT_BIT is the sixteenth bit from the right, you need to specify the max value as 32768 (2^15. 0x8000). Hence, you enter the max value as 2^(bit count - 1), where the bit count is from the right to the left . CFT_BIT value also needs an enumeration to specify the text descriptions for the value 0 and 1.
CFT_BYTE A single byte value. However, Viewpoint Monitoring has to read at least a single Modbus register that is two bytes long. In this case, in the Max column, you need to enter a value to specify how many counts the bits have to be shifted to the right for the 16-bit Modbus register value. Viewpoint Monitoring uses that value to shift the Modbus register value from the device, and it uses the lower byte of the 16-bit value. For example, if the 16-bit Modbus register value is 0x02C7, the max value specified in the Max column is 8, Viewpoint Monitoring shift the bits of 0x02C7 eight times to the right, and after the shift, the value is 0x0002, and the lower byte 0x02 is used.
CFT_COIL_BIT The same as CFT_BIT data type, except that the Modbus function 1 is used for reading the data item
CFT_DATE A four-byte long value. The first two bytes represent the year, the third byte represents the day, and the fourth byte represents the month. Viewpoint Monitoring presents the value in the format of 'MM/DD/YYYY'.
CFT_ENUMERATION Enumeration stored in an unsigned 16-bit integer. Modbus data item has a fixed set of values, and each value in the set has a corresponding text description. A named enumeration has to be created in Enumeration Editor for the values and their corresponding text descriptions. Select the enumeration name for this data type in the List Reference column. This data type is two bytes long (one Modbus register).
CFT_FLOAT2 IEEE floating-point value with upper and lower 16-bit words reversed.Modbus data item has the value of floating point. However, the word order has to be swapped by the Viewpoint Monitoring system to correctly present the value. It is four bytes long (two Modbus registers).
CFT_FLOATING_POINT Modbus data item has the value of floating point. Decimal points can be specified in the Decimals column. If the value is range-bounded, the minimum and maximum values can be entered in the columns of Min and Max. Floating point value is four bytes long (two Modbus registers).

CHAPTER 5: DEVICE SETUP ADD AND MANAGE DEVICES WITH CUSTOM FILE EDITOR
ENERVISTA VIEWPOINT MONITORING – INSTRUCTION MANUAL 51
List Reference — Configured with the Edit Enumerations button, which creates a drop-down list here for selection. It maps the output values for this specific register to a text string. The text string displays instead of the numeric value on the device. Click the cell to select the enumeration mapping from the drop-down list. You can define the number-to-string mapping by clicking the Edit Numerations button.
Actual Values (check box) — Identifies if this register stores an actual value. When enabled, an Actual Value register is read from the device using the Modbus function 4. When disabled, the read uses Modbus function 3. This does not apply for the CFT_COIL_BIT and CFT_INPUT_BIT data types.
Max \ Length \ Bit — Largest stored value. When the Data Type is a String, the maximum value represents the maximum string size.
Decimals — Enter the number of decimals to display for the Modbus value.
Units — Enter the unit of measure that the register value is in, for example Hz, Hz/s, or kV. The unit string is appended to the data value prior to displaying the data.
One-Line Editor (check box) — Enable to allow the One-Line Editor to see this register mapping.
Annunciator Panel (check box) — Enable to allow the Annunciator function to see this register mapping.
CFT_HEX2 Modbus data item is a Modbus register, 16 bits long. Viewpoint Monitoring presents the value in the format of '0x?? 0x??', such as '0x1A 0x20'.
CFT_INPUT_BIT The same as CFT_BIT data type, except that the Modbus function 2 is used for reading the data item
CFT_MILLI_SEC_COUNTS A six-byte long Modbus data item. It represents the milliseconds since Jan. 1, 2000, 00:00:00. Viewpoint Monitoring system presents it in the format of 'MM/DD/YYYY HH:MM:SS.ssss'. It is three Modbus registers long.
CFT_SINT16 Signed 16-bit integer.If the value is range-bounded, the minimum and maximum values can be entered in the columns of Min and Max. It is two bytes long (one Modbus register).
CFT_SINT32 Signed 32-bit integer.If the value is range bounded, the minimum and maximum values can be entered in the columns of Min and Max. It is four bytes long (two Modbus registers).
CFT_SINT64 Signed 64-bit integer (four Modbus registers long)
CFT_TEXT Modbus data item has the value of text string. You must enter how many characters in this text string in the Max column.
CFT_TIME A four-byte long value. The first byte represents the hundredth of a second. The second byte represents the second. The third byte represents the minutes, and the fourth byte represents the hours. Viewpoint Monitoring presents the value in the format of 'HH:MM:SS:hh'.
CFT_UINT16 Unsigned 16-bit integer.If the value is range-bounded, the minimum and maximum values can be entered in the columns of Min and Max. It is two bytes long (one Modbus register).
CFT_UINT32 Unsigned 32-bit integer.If the value is range-bounded, the minimum and maximum values can be entered in the columns of Min and Max. It is four bytes long (two Modbus registers).
CFT_UINT64 Unsigned 64-bit integer (four Modbus registers long)
Data type Description

52 ENERVISTA VIEWPOINT MONITORING – INSTRUCTION MANUAL
IMPORT DEVICE CHAPTER 5: DEVICE SETUP
ID — Unique identification. Examples are PRODUCT_ID and UR_DATA_AUTOMATION_VIRTUAL_INPUT_STATES107. These values are generated automatically by the editor, for example if the label entered in the first column is "Ia RMS," then the ID generated is IA_RMS.
Apply to serverClicking the Apply to Server button allows the user to add new custom device type to GE32MTCP or GE32MODB servers. The button is active only for new device types. Select the Device and Version before clicking the button.
Delete device with custom file editorTo delete a device:
1. In the main window of Viewpoint Monitoring, click File > Custom File Editor. The window opens.
2. Select the Device and Version.
3. Click the Delete button and confirm the deletion. This deletes the .cdd file from Viewpoint Monitoring. The default folder with the files is C:\ProgramData\EnerVista\Viewpoint Monitoring\Devices
4. Manually delete the image file if you know its name and folder location. The default folder is C:\ProgramData\EnerVista\Viewpoint Monitoring\Devices
Import deviceDuring installation of the Viewpoint Monitoring software, the system checked automatically for devices and provided the opportunity to import configurations. The function also can be invoked manually.
Each time that the software launches, it checks for existing 32-bit xxxPC programs (for example, 469PC and PQMPC). The xxxPC environment files are searched and any new devices are added to a list from which you can select the devices to import into Viewpoint Monitoring.
In addition to checking for xxxPC programs, a system scan is done for the EnerVista UR Setup environment file and EnerVista URPlus Setup environment files.
There are two options for importing devices. One is to search. The second is to specify the file location. First try the search, then use the second option to browse for the device.
Figure 67: Importing devices

CHAPTER 5: DEVICE SETUP UPDATE DEVICE
ENERVISTA VIEWPOINT MONITORING – INSTRUCTION MANUAL 53
To import devices:
1. Click File > Import Devices > Perform Search.
If you import any devices, verify in Device Setup that the devices were imported; sometimes it appears that a device is to be imported but then it is not.
2. If Viewpoint Monitoring cannot locate automatically the environment file, select Specify Location instead. This allows you to browse and select a specific environment file (.ENV or .DS file).
Update deviceDevice information can be updated, for example when the device is upgraded or moved.
To update device information:
1. In the main window of EnerVista Viewpoint Monitoring, click the Device Setup option. The window opens.
2. Expand the Ethernet or Serial category as required, and click the device. Information for the device displays on the right side.
3. Edit the fields. See the Quickstart Guide for an explanation of the fields.
4. Click the Ok button to save and exit.
Delete deviceDevice configuration can be deleted to remove the device from the system.
To delete a device:
1. In the main window of EnerVista Viewpoint Monitoring, click the Device Setup option. The window opens.
2. Expand the Ethernet or Serial category if required, and click the device. Information for the device displays on the right side.
3. Click the Delete button, and confirm the deletion.
Figure 68: Deleting a device

54 ENERVISTA VIEWPOINT MONITORING – INSTRUCTION MANUAL
DELETE DEVICE CHAPTER 5: DEVICE SETUP
ENERVISTA VIEWPOINT MONITORING – INSTRUCTION MANUAL 55
EnerVista Viewpoint Monitoring
Chapter 6: One-Line Editor
One-Line Editor
This chapter outlines use of the One-Line Editor.
• View demonstration files
• Draw schema diagram
• Save file
• Connect / test with One Shot
• Update schema diagram
• Delete schema diagram
• Edit and view simultaneously
• Change page size and units
• Create custom symbols
• Toolbars and buttons
IntroductionThe One-Line Editor is used to draw diagrams, called schemas, for equipment monitoring and control. It is used to create interactive and graphical one-line, or single-line, diagrams that are connected to devices to monitor and understand remote site configuration as well as to view readings and status updates.
You create a schema in the One-Line Editor, then view the data from the device in the One-Line Viewer (next chapter).
The toolbars and buttons are explained at the end of the chapter, as well as how to change page size, units of measure, and create custom symbols.
View demonstration filesExamples of one-line diagrams can be viewed.
As documented in the IED Dashboard chapter, these and other files can be imported into the software and customized for use.
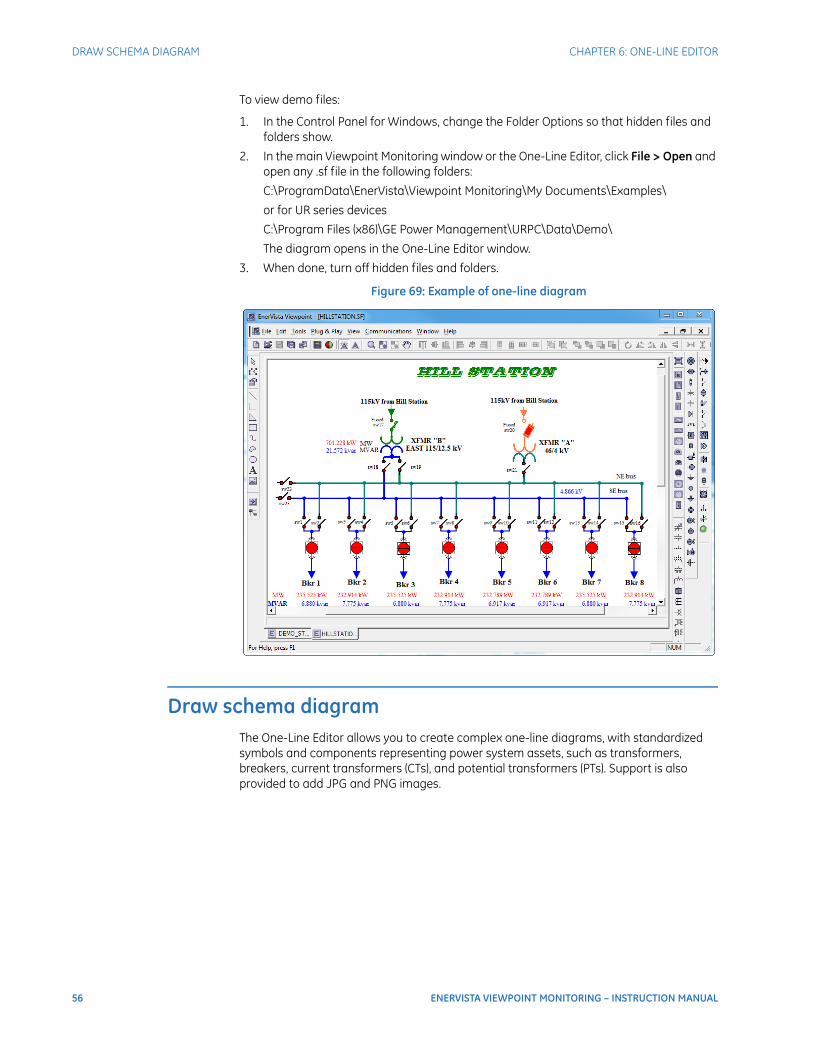
56 ENERVISTA VIEWPOINT MONITORING – INSTRUCTION MANUAL
DRAW SCHEMA DIAGRAM CHAPTER 6: ONE-LINE EDITOR
To view demo files:
1. In the Control Panel for Windows, change the Folder Options so that hidden files and folders show.
2. In the main Viewpoint Monitoring window or the One-Line Editor, click File > Open and open any .sf file in the following folders:
C:\ProgramData\EnerVista\Viewpoint Monitoring\My Documents\Examples\
or for UR series devices
C:\Program Files (x86)\GE Power Management\URPC\Data\Demo\
The diagram opens in the One-Line Editor window.
3. When done, turn off hidden files and folders.
Figure 69: Example of one-line diagram
Draw schema diagramThe One-Line Editor allows you to create complex one-line diagrams, with standardized symbols and components representing power system assets, such as transformers, breakers, current transformers (CTs), and potential transformers (PTs). Support is also provided to add JPG and PNG images.
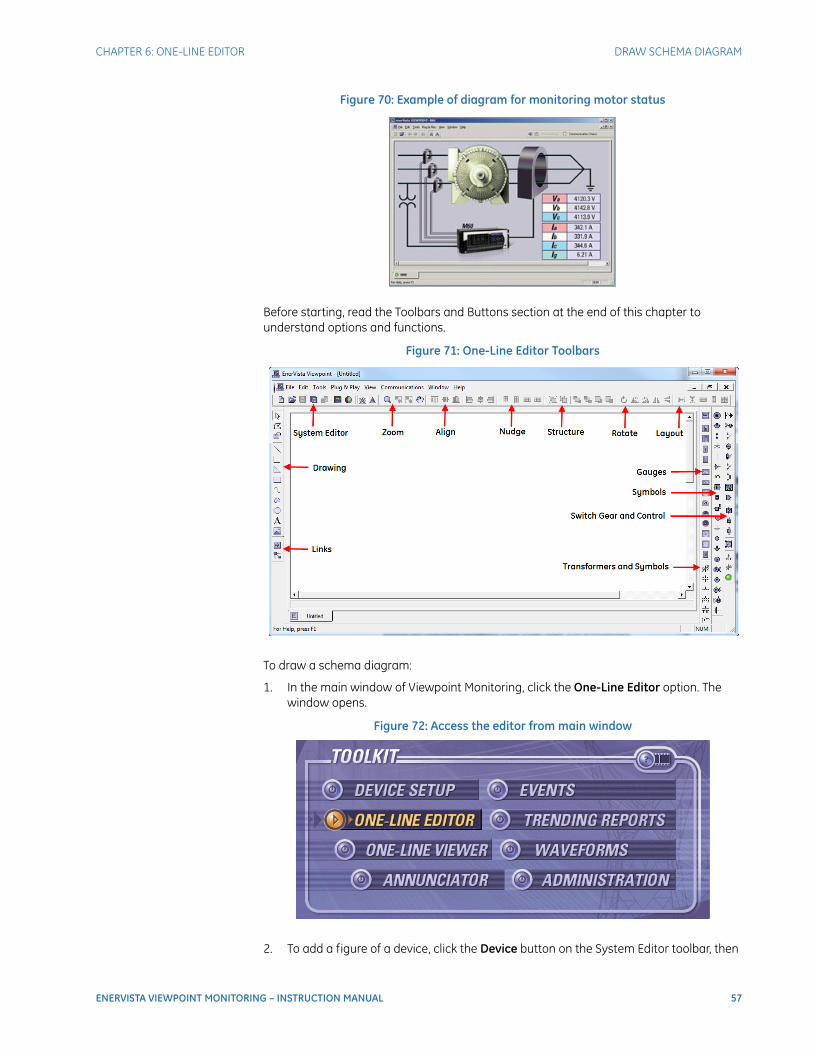
CHAPTER 6: ONE-LINE EDITOR DRAW SCHEMA DIAGRAM
ENERVISTA VIEWPOINT MONITORING – INSTRUCTION MANUAL 57
Figure 70: Example of diagram for monitoring motor status
Before starting, read the Toolbars and Buttons section at the end of this chapter to understand options and functions.
Figure 71: One-Line Editor Toolbars
To draw a schema diagram:
1. In the main window of Viewpoint Monitoring, click the One-Line Editor option. The window opens.
Figure 72: Access the editor from main window
2. To add a figure of a device, click the Device button on the System Editor toolbar, then
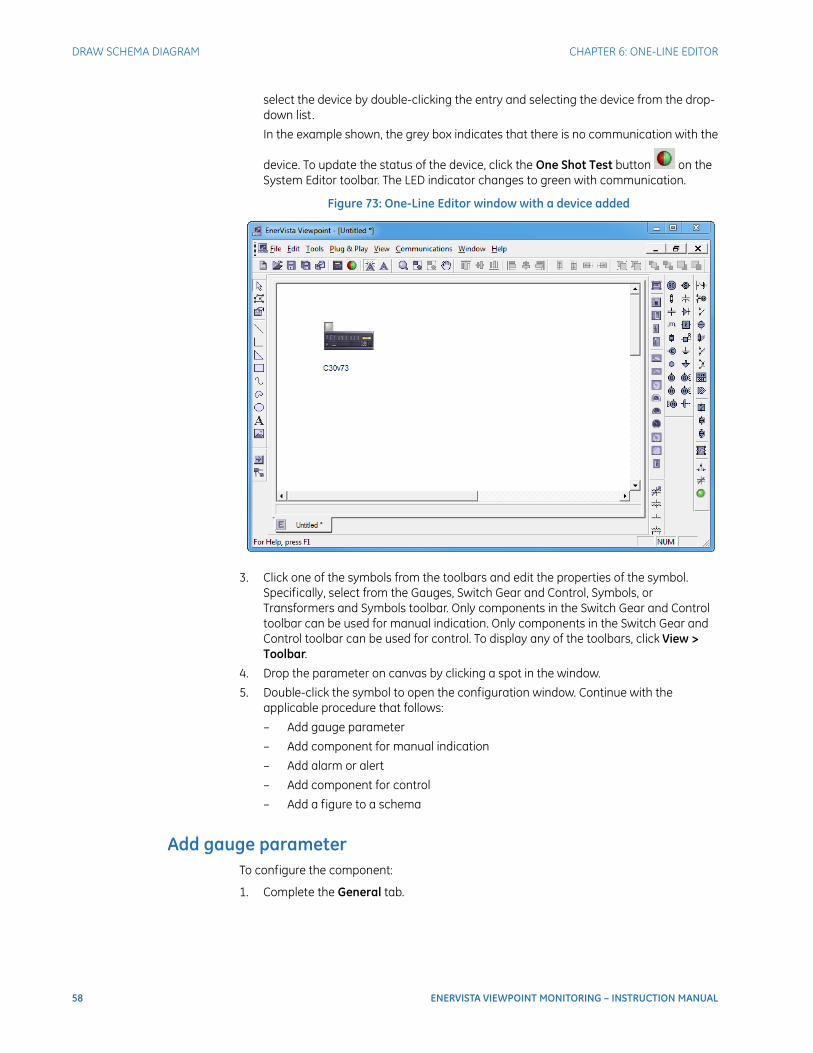
58 ENERVISTA VIEWPOINT MONITORING – INSTRUCTION MANUAL
DRAW SCHEMA DIAGRAM CHAPTER 6: ONE-LINE EDITOR
select the device by double-clicking the entry and selecting the device from the drop-down list.
In the example shown, the grey box indicates that there is no communication with the
device. To update the status of the device, click the One Shot Test button on the System Editor toolbar. The LED indicator changes to green with communication.
Figure 73: One-Line Editor window with a device added
3. Click one of the symbols from the toolbars and edit the properties of the symbol. Specifically, select from the Gauges, Switch Gear and Control, Symbols, or Transformers and Symbols toolbar. Only components in the Switch Gear and Control toolbar can be used for manual indication. Only components in the Switch Gear and Control toolbar can be used for control. To display any of the toolbars, click View > Toolbar.
4. Drop the parameter on canvas by clicking a spot in the window.
5. Double-click the symbol to open the configuration window. Continue with the applicable procedure that follows:
– Add gauge parameter
– Add component for manual indication
– Add alarm or alert
– Add component for control
– Add a figure to a schema
Add gauge parameterTo configure the component:
1. Complete the General tab.

CHAPTER 6: ONE-LINE EDITOR DRAW SCHEMA DIAGRAM
ENERVISTA VIEWPOINT MONITORING – INSTRUCTION MANUAL 59
Figure 74: Naming the component
2. In the Attach to tab, select the device and parameter to associate with.
Figure 75: Setting device and parameter
3. The Line, Fill, and Font tabs provide options to set object borders, fill, and font.
4. Click the OK button to save and exit the configuration window and return to the One-Line Editor window. Then save the One-Line Editor file.
5. In the main window of Viewpoint Monitoring, click the One-Line Viewer option to open the viewer. Open the file in One-line Viewer. Viewpoint Monitoring then reads the value from the device and shows it inside the Parameter symbol.

60 ENERVISTA VIEWPOINT MONITORING – INSTRUCTION MANUAL
DRAW SCHEMA DIAGRAM CHAPTER 6: ONE-LINE EDITOR
Figure 76: Parameter display
Add component for manual indicationTo configure the component:
1. Complete the General tab.
Figure 77: Naming the component
2. In the Attach to tab, select the Manual radio button to specify that the component is a manual indicator. Select the Status to be either in the ON or OFF state. Optionally select the color to fill the component in each state (ON and OFF) if the selected component supports this function.
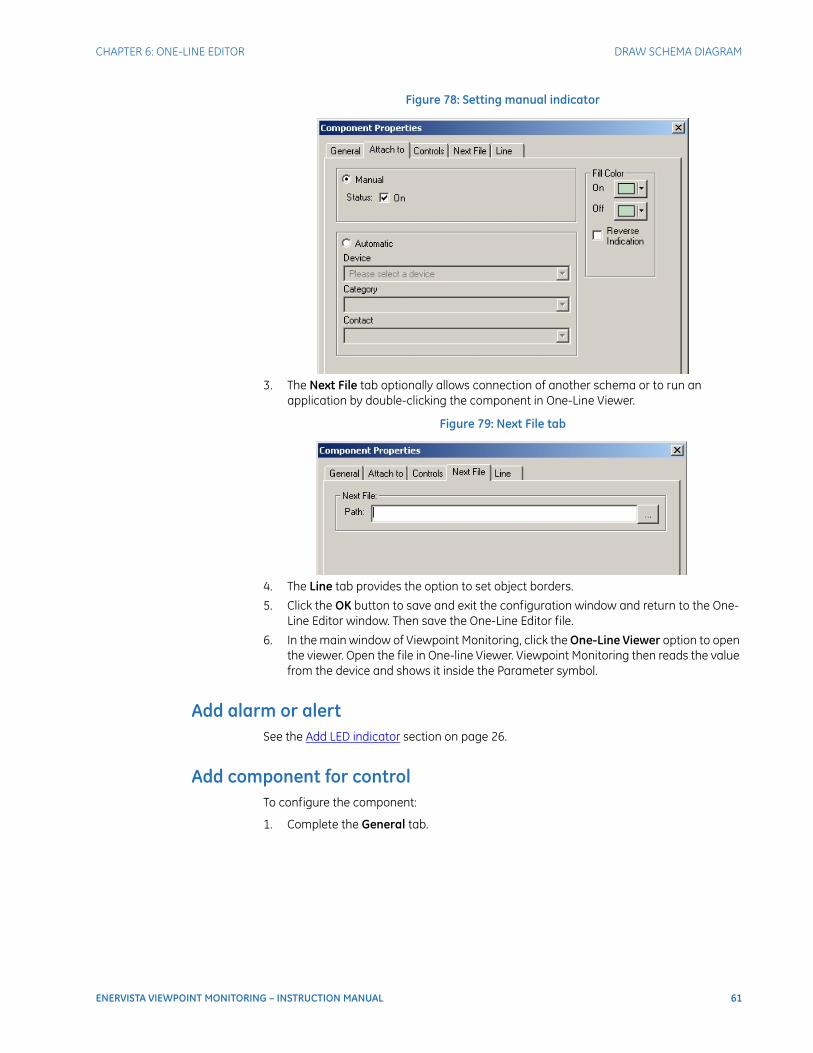
CHAPTER 6: ONE-LINE EDITOR DRAW SCHEMA DIAGRAM
ENERVISTA VIEWPOINT MONITORING – INSTRUCTION MANUAL 61
Figure 78: Setting manual indicator
3. The Next File tab optionally allows connection of another schema or to run an application by double-clicking the component in One-Line Viewer.
Figure 79: Next File tab
4. The Line tab provides the option to set object borders.
5. Click the OK button to save and exit the configuration window and return to the One-Line Editor window. Then save the One-Line Editor file.
6. In the main window of Viewpoint Monitoring, click the One-Line Viewer option to open the viewer. Open the file in One-line Viewer. Viewpoint Monitoring then reads the value from the device and shows it inside the Parameter symbol.
Add alarm or alertSee the Add LED indicator section on page 26.
Add component for controlTo configure the component:
1. Complete the General tab.

62 ENERVISTA VIEWPOINT MONITORING – INSTRUCTION MANUAL
DRAW SCHEMA DIAGRAM CHAPTER 6: ONE-LINE EDITOR
Figure 80: Naming the component
2. In the Attach to tab, select the Automatic indication from radio button. Select the Device to which the component is connected. Select the indication Category. Select the Contact that you want the component to control.
Figure 81: Setting automatic indicator
3. In the Controls tab, enable the check box for control 1 or 2. Select the Device associated with this component. Select the control-type Category. Select the corresponding Category Force Coil or Virtual Input command below the Category. Change the text of the Command Name to what you want. Select a Value to send when control is initiated.
If you want another control function added to this component, enable the other check box for control 1 or 2 and complete the fields.

CHAPTER 6: ONE-LINE EDITOR DRAW SCHEMA DIAGRAM
ENERVISTA VIEWPOINT MONITORING – INSTRUCTION MANUAL 63
Figure 82: Controls tab
4. The Next File tab optionally allows connection of another schema or to run an application by double-clicking the component in One-Line Viewer.
Figure 83: Next File tab
5. The Line tab provides the option to set object borders.
6. Click the OK button to save and exit the configuration window and return to the One-Line Editor window. Then save the One-Line Editor file.
7. In the main window of Viewpoint Monitoring, click the One-Line Viewer option to open the viewer. Open the file in One-line Viewer. Viewpoint Monitoring then reads the value from the device and shows it inside the Parameter symbol.
Add figure to a schemaFollow the steps to add an image file to your schema work area. Viewpoint Monitoring allows bitmap files to be imported (.bmp, .dib, .jpg, .png).
To add an image of a device, see the Draw schema diagram section on page 56.
To add an image to the drawing:
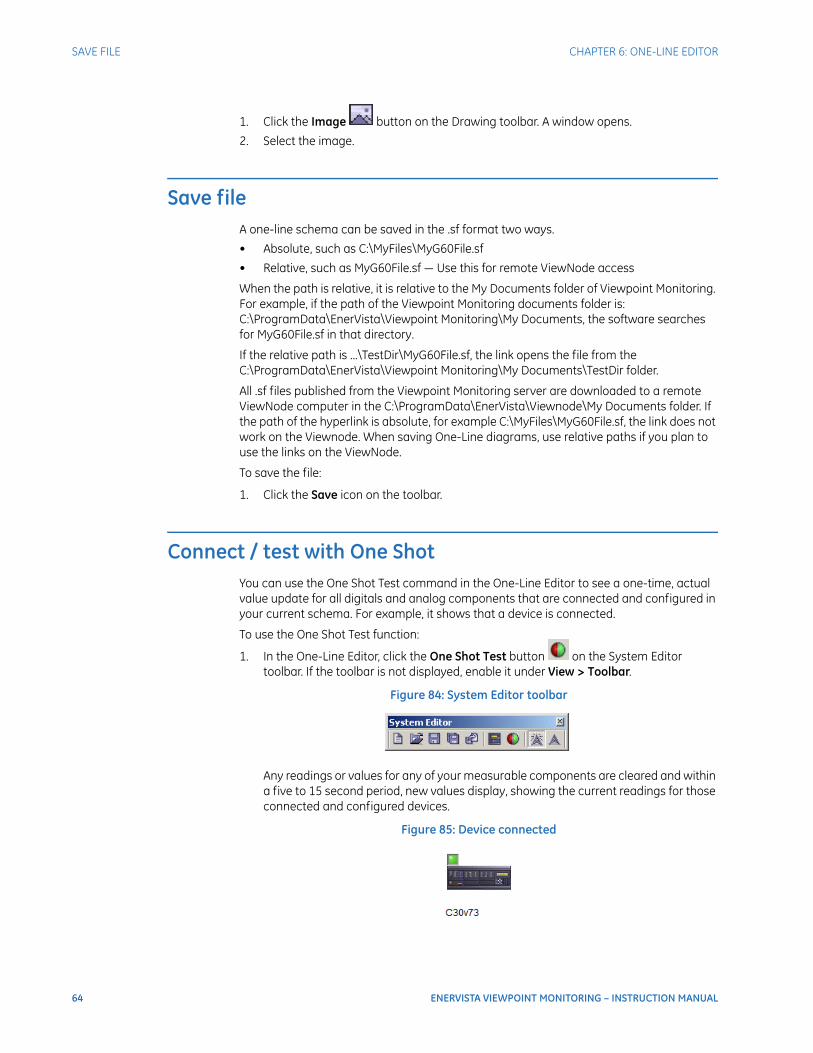
64 ENERVISTA VIEWPOINT MONITORING – INSTRUCTION MANUAL
SAVE FILE CHAPTER 6: ONE-LINE EDITOR
1. Click the Image button on the Drawing toolbar. A window opens.
2. Select the image.
Save fileA one-line schema can be saved in the .sf format two ways.
• Absolute, such as C:\MyFiles\MyG60File.sf
• Relative, such as MyG60File.sf — Use this for remote ViewNode access
When the path is relative, it is relative to the My Documents folder of Viewpoint Monitoring. For example, if the path of the Viewpoint Monitoring documents folder is: C:\ProgramData\EnerVista\Viewpoint Monitoring\My Documents, the software searches for MyG60File.sf in that directory.
If the relative path is ...\TestDir\MyG60File.sf, the link opens the file from the C:\ProgramData\EnerVista\Viewpoint Monitoring\My Documents\TestDir folder.
All .sf files published from the Viewpoint Monitoring server are downloaded to a remote ViewNode computer in the C:\ProgramData\EnerVista\Viewnode\My Documents folder. If the path of the hyperlink is absolute, for example C:\MyFiles\MyG60File.sf, the link does not work on the Viewnode. When saving One-Line diagrams, use relative paths if you plan to use the links on the ViewNode.
To save the file:
1. Click the Save icon on the toolbar.
Connect / test with One ShotYou can use the One Shot Test command in the One-Line Editor to see a one-time, actual value update for all digitals and analog components that are connected and configured in your current schema. For example, it shows that a device is connected.
To use the One Shot Test function:
1. In the One-Line Editor, click the One Shot Test button on the System Editor toolbar. If the toolbar is not displayed, enable it under View > Toolbar.
Figure 84: System Editor toolbar
Any readings or values for any of your measurable components are cleared and within a five to 15 second period, new values display, showing the current readings for those connected and configured devices.
Figure 85: Device connected
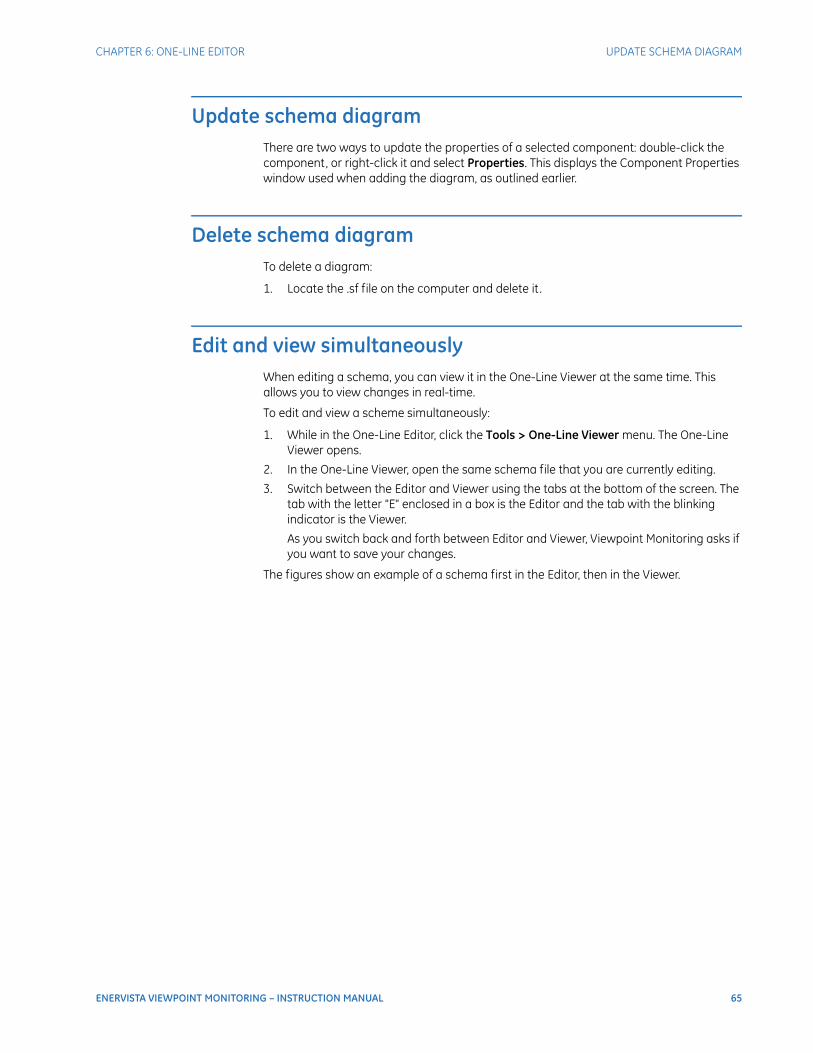
CHAPTER 6: ONE-LINE EDITOR UPDATE SCHEMA DIAGRAM
ENERVISTA VIEWPOINT MONITORING – INSTRUCTION MANUAL 65
Update schema diagramThere are two ways to update the properties of a selected component: double-click the component, or right-click it and select Properties. This displays the Component Properties window used when adding the diagram, as outlined earlier.
Delete schema diagramTo delete a diagram:
1. Locate the .sf file on the computer and delete it .
Edit and view simultaneouslyWhen editing a schema, you can view it in the One-Line Viewer at the same time. This allows you to view changes in real-time.
To edit and view a scheme simultaneously:
1. While in the One-Line Editor, click the Tools > One-Line Viewer menu. The One-Line Viewer opens.
2. In the One-Line Viewer, open the same schema file that you are currently editing.
3. Switch between the Editor and Viewer using the tabs at the bottom of the screen. The tab with the letter "E" enclosed in a box is the Editor and the tab with the blinking indicator is the Viewer.
As you switch back and forth between Editor and Viewer, Viewpoint Monitoring asks if you want to save your changes.
The figures show an example of a schema first in the Editor, then in the Viewer.
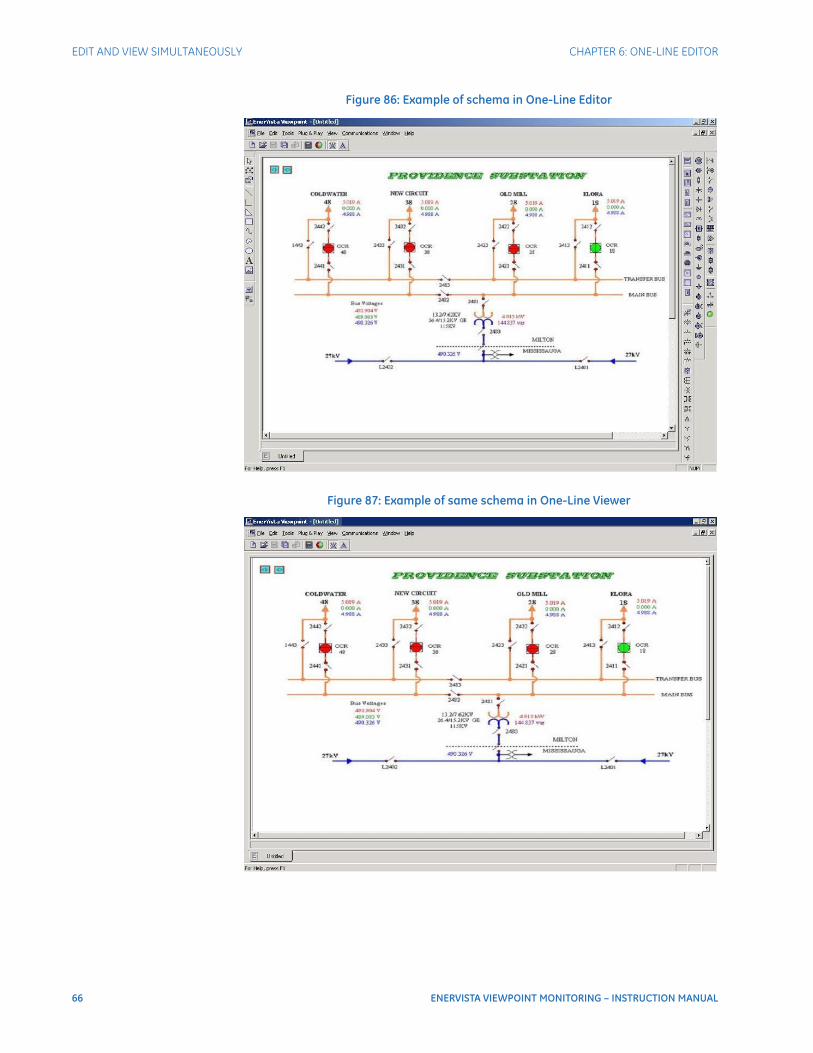
66 ENERVISTA VIEWPOINT MONITORING – INSTRUCTION MANUAL
EDIT AND VIEW SIMULTANEOUSLY CHAPTER 6: ONE-LINE EDITOR
Figure 86: Example of schema in One-Line Editor
Figure 87: Example of same schema in One-Line Viewer
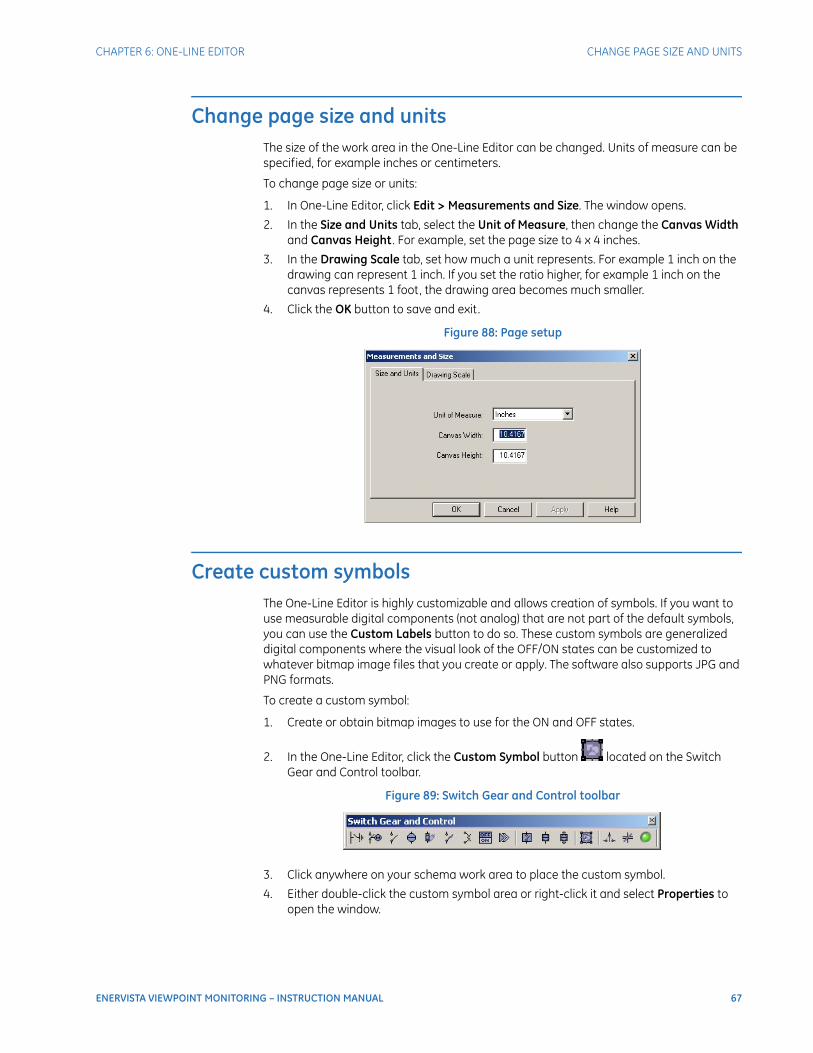
CHAPTER 6: ONE-LINE EDITOR CHANGE PAGE SIZE AND UNITS
ENERVISTA VIEWPOINT MONITORING – INSTRUCTION MANUAL 67
Change page size and unitsThe size of the work area in the One-Line Editor can be changed. Units of measure can be specified, for example inches or centimeters.
To change page size or units:
1. In One-Line Editor, click Edit > Measurements and Size. The window opens.
2. In the Size and Units tab, select the Unit of Measure, then change the Canvas Width and Canvas Height . For example, set the page size to 4 x 4 inches.
3. In the Drawing Scale tab, set how much a unit represents. For example 1 inch on the drawing can represent 1 inch. If you set the ratio higher, for example 1 inch on the canvas represents 1 foot, the drawing area becomes much smaller.
4. Click the OK button to save and exit.
Figure 88: Page setup
Create custom symbolsThe One-Line Editor is highly customizable and allows creation of symbols. If you want to use measurable digital components (not analog) that are not part of the default symbols, you can use the Custom Labels button to do so. These custom symbols are generalized digital components where the visual look of the OFF/ON states can be customized to whatever bitmap image files that you create or apply. The software also supports JPG and PNG formats.
To create a custom symbol:
1. Create or obtain bitmap images to use for the ON and OFF states.
2. In the One-Line Editor, click the Custom Symbol button located on the Switch Gear and Control toolbar.
Figure 89: Switch Gear and Control toolbar
3. Click anywhere on your schema work area to place the custom symbol.
4. Either double-click the custom symbol area or right-click it and select Properties to open the window.
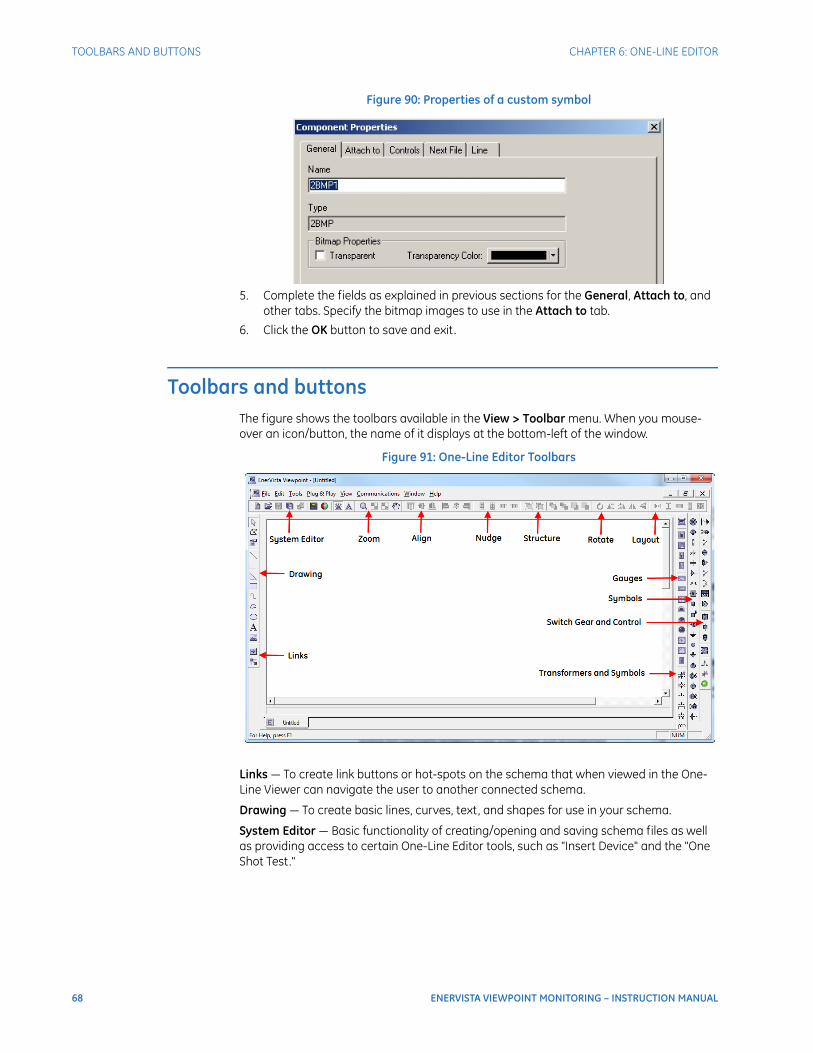
68 ENERVISTA VIEWPOINT MONITORING – INSTRUCTION MANUAL
TOOLBARS AND BUTTONS CHAPTER 6: ONE-LINE EDITOR
Figure 90: Properties of a custom symbol
5. Complete the fields as explained in previous sections for the General, Attach to, and other tabs. Specify the bitmap images to use in the Attach to tab.
6. Click the OK button to save and exit.
Toolbars and buttonsThe figure shows the toolbars available in the View > Toolbar menu. When you mouse-over an icon/button, the name of it displays at the bottom-left of the window.
Figure 91: One-Line Editor Toolbars
Links — To create link buttons or hot-spots on the schema that when viewed in the One-Line Viewer can navigate the user to another connected schema.
Drawing — To create basic lines, curves, text, and shapes for use in your schema.
System Editor — Basic functionality of creating/opening and saving schema files as well as providing access to certain One-Line Editor tools, such as "Insert Device" and the "One Shot Test."
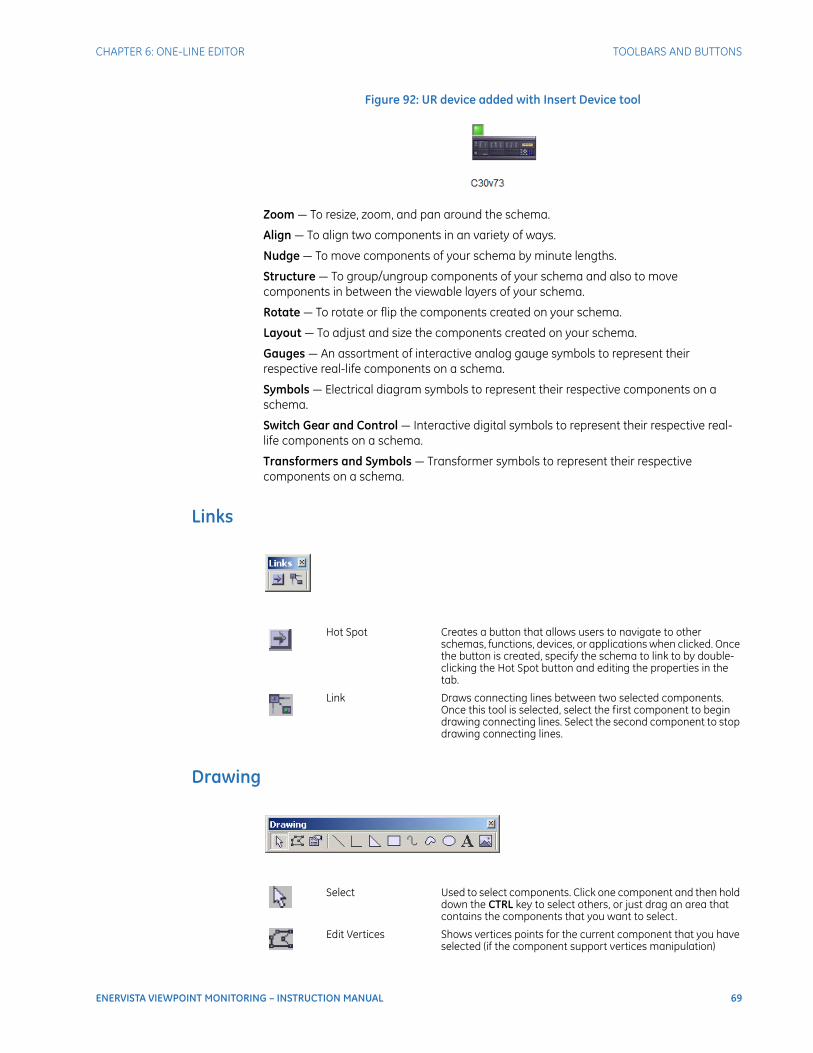
CHAPTER 6: ONE-LINE EDITOR TOOLBARS AND BUTTONS
ENERVISTA VIEWPOINT MONITORING – INSTRUCTION MANUAL 69
Figure 92: UR device added with Insert Device tool
Zoom — To resize, zoom, and pan around the schema.
Align — To align two components in an variety of ways.
Nudge — To move components of your schema by minute lengths.
Structure — To group/ungroup components of your schema and also to move components in between the viewable layers of your schema.
Rotate — To rotate or flip the components created on your schema.
Layout — To adjust and size the components created on your schema.
Gauges — An assortment of interactive analog gauge symbols to represent their respective real-life components on a schema.
Symbols — Electrical diagram symbols to represent their respective components on a schema.
Switch Gear and Control — Interactive digital symbols to represent their respective real-life components on a schema.
Transformers and Symbols — Transformer symbols to represent their respective components on a schema.
Links
Drawing
Hot Spot Creates a button that allows users to navigate to other schemas, functions, devices, or applications when clicked. Once the button is created, specify the schema to link to by double-clicking the Hot Spot button and editing the properties in the tab.
Link Draws connecting lines between two selected components. Once this tool is selected, select the first component to begin drawing connecting lines. Select the second component to stop drawing connecting lines.
Select Used to select components. Click one component and then hold down the CTRL key to select others, or just drag an area that contains the components that you want to select.
Edit Vertices Shows vertices points for the current component that you have selected (if the component support vertices manipulation)

70 ENERVISTA VIEWPOINT MONITORING – INSTRUCTION MANUAL
TOOLBARS AND BUTTONS CHAPTER 6: ONE-LINE EDITOR
System Editor
Properties Shows the properties of the selected component
Line Used to draw one line
Polyline Used to draw connecting lines. Double-click to end drawing a component.
Polygon Used to draw an enclosed variable-sided polygon. Double-click to end drawing a component.
Rectangle Used to draw a right-angle rectangle
Polycurve Used to draw connecting curved lines. Double-click to end drawing a component.
Close Curve Used to draw an enclosed connecting curved lined object. Double-click to end drawing a component.
Ellipse Used to draw a elliptical component
Text Used to add text to your schema
Image Used to insert a figure into your schema
New Schema Creates a new schema (.sf) file
Open File Opens and loads an existing schema
Save File Saves current schema with current file name (if there is none, Viewpoint Monitoring asks you to provide a file name)
Save As Saves current schema by specifying the file name
Save and View Schema
Saves current schema and then displays schema using the One-Line Viewer
Insert Device Inserts a device picture into the schema. This picture then can be connected and configured to a real device.
One Shot Test Provides a one-time reading of all the current values or status from each of the connected and configured components on the schema
Master Connect On Allows for but does not initiate connections to devices. Use One Shot Test or open the One-Line Viewer to initiate connections to devices.
Master Connect Off Disconnects all connected devices
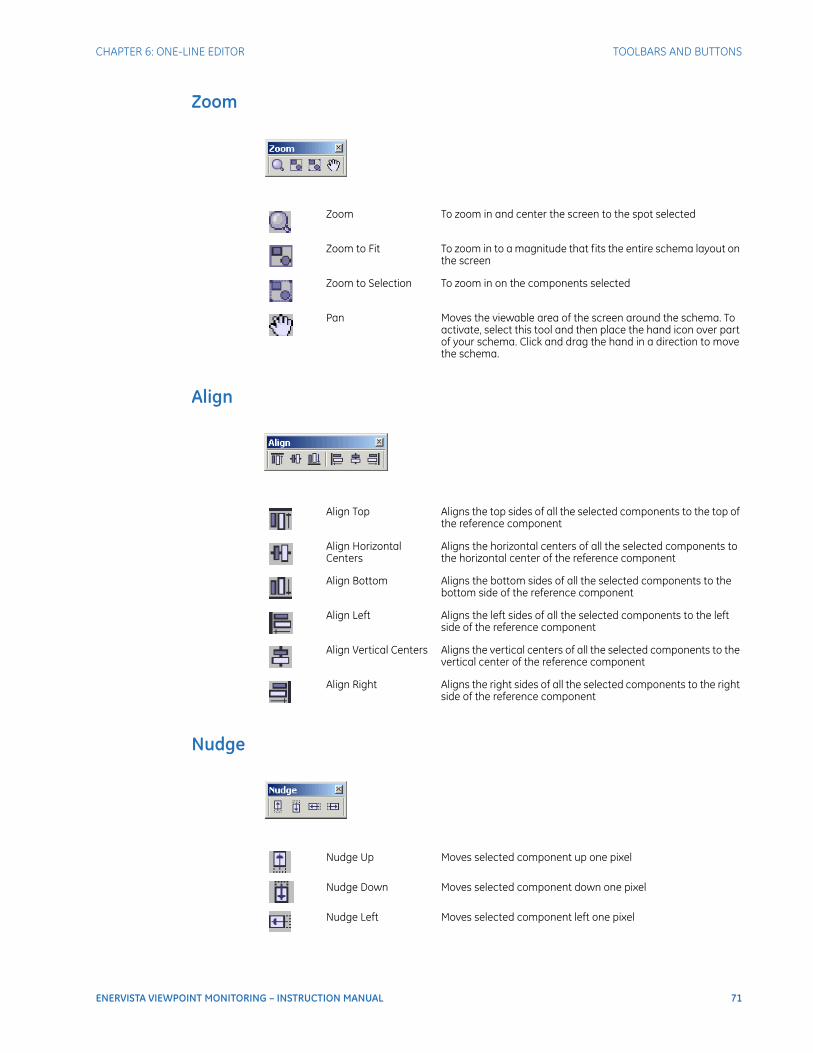
CHAPTER 6: ONE-LINE EDITOR TOOLBARS AND BUTTONS
ENERVISTA VIEWPOINT MONITORING – INSTRUCTION MANUAL 71
Zoom
Align
Nudge
Zoom To zoom in and center the screen to the spot selected
Zoom to Fit To zoom in to a magnitude that fits the entire schema layout on the screen
Zoom to Selection To zoom in on the components selected
Pan Moves the viewable area of the screen around the schema. To activate, select this tool and then place the hand icon over part of your schema. Click and drag the hand in a direction to move the schema.
Align Top Aligns the top sides of all the selected components to the top of the reference component
Align Horizontal Centers
Aligns the horizontal centers of all the selected components to the horizontal center of the reference component
Align Bottom Aligns the bottom sides of all the selected components to the bottom side of the reference component
Align Left Aligns the left sides of all the selected components to the left side of the reference component
Align Vertical Centers Aligns the vertical centers of all the selected components to the vertical center of the reference component
Align Right Aligns the right sides of all the selected components to the right side of the reference component
Nudge Up Moves selected component up one pixel
Nudge Down Moves selected component down one pixel
Nudge Left Moves selected component left one pixel
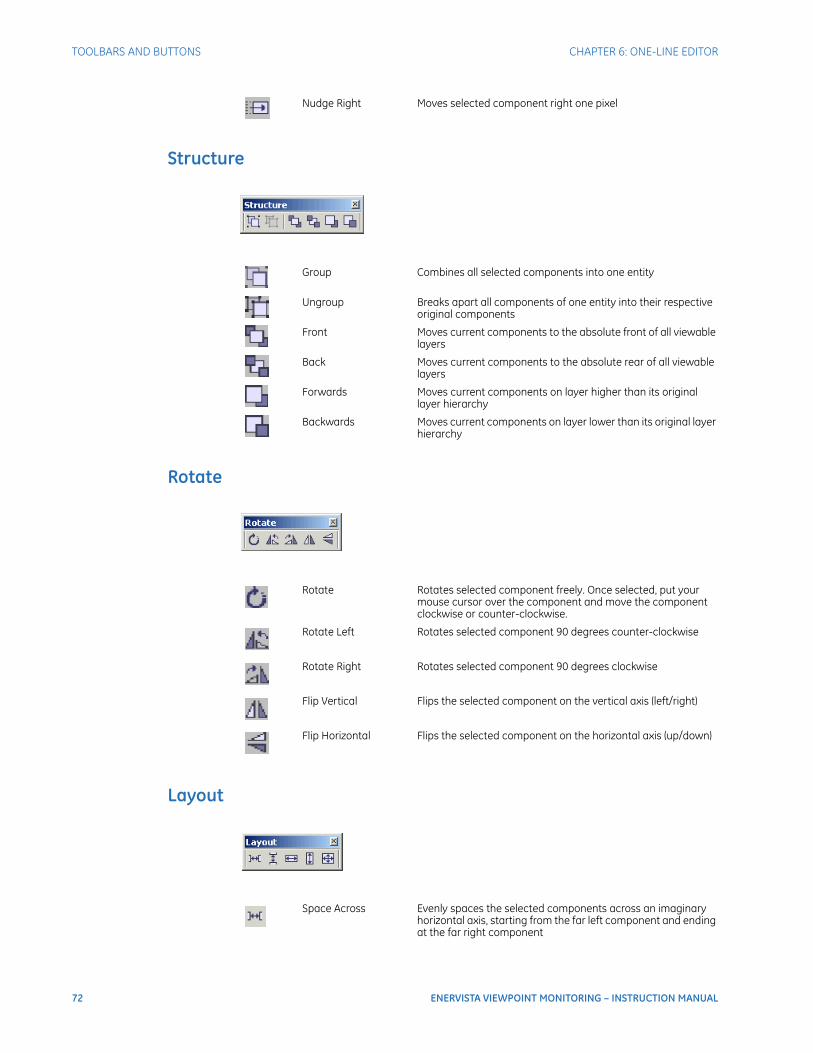
72 ENERVISTA VIEWPOINT MONITORING – INSTRUCTION MANUAL
TOOLBARS AND BUTTONS CHAPTER 6: ONE-LINE EDITOR
Structure
Rotate
Layout
Nudge Right Moves selected component right one pixel
Group Combines all selected components into one entity
Ungroup Breaks apart all components of one entity into their respective
original components
Front Moves current components to the absolute front of all viewable layers
Back Moves current components to the absolute rear of all viewable layers
Forwards Moves current components on layer higher than its original layer hierarchy
Backwards Moves current components on layer lower than its original layer hierarchy
Rotate Rotates selected component freely. Once selected, put your mouse cursor over the component and move the component clockwise or counter-clockwise.
Rotate Left Rotates selected component 90 degrees counter-clockwise
Rotate Right Rotates selected component 90 degrees clockwise
Flip Vertical Flips the selected component on the vertical axis (left/right)
Flip Horizontal Flips the selected component on the horizontal axis (up/down)
Space Across Evenly spaces the selected components across an imaginary horizontal axis, starting from the far left component and ending at the far right component

CHAPTER 6: ONE-LINE EDITOR TOOLBARS AND BUTTONS
ENERVISTA VIEWPOINT MONITORING – INSTRUCTION MANUAL 73
GaugesBefore these gauges can measure real time values, you specify the device to connect the gauge to by double-clicking the gauge.
Space Down Evenly spaces the selected components across an imaginary vertical axis, starting from the top component and ending at the bottom component
Same Width Sets the width of the selected components to the same width as the reference component
Same Height Sets the height of the selected components to the same height as the reference component
Same Size Sets the width and height of the selected components to the same width and height of the reference component
Parameter Creates a generic analog reading component
Bar 2D Creates a 2D bar gauge component
Bar 3D Creates a 3D bar gauge component
Thermometer 2D Creates a 2D thermometer gauge component
Thermometer 3D Creates a 3D thermometer gauge component
Semicircle 2D Creates a 2D semicircle gauge component
Segment 2D Creates a 2D segment gauge component
Circle 2D Creates a 2D circle gauge component
Semicircle 3D Creates a 3D semicircle gauge component
Segment 3D Creates a 3D segment gauge component
Circle 3D Creates a 3D circle gauge component
Circle Multi Values Creates a multi-value circle gauge component
Phasors Creates a phasor gauge component
Bar Multi Values Creates a multi-value bar gauge component
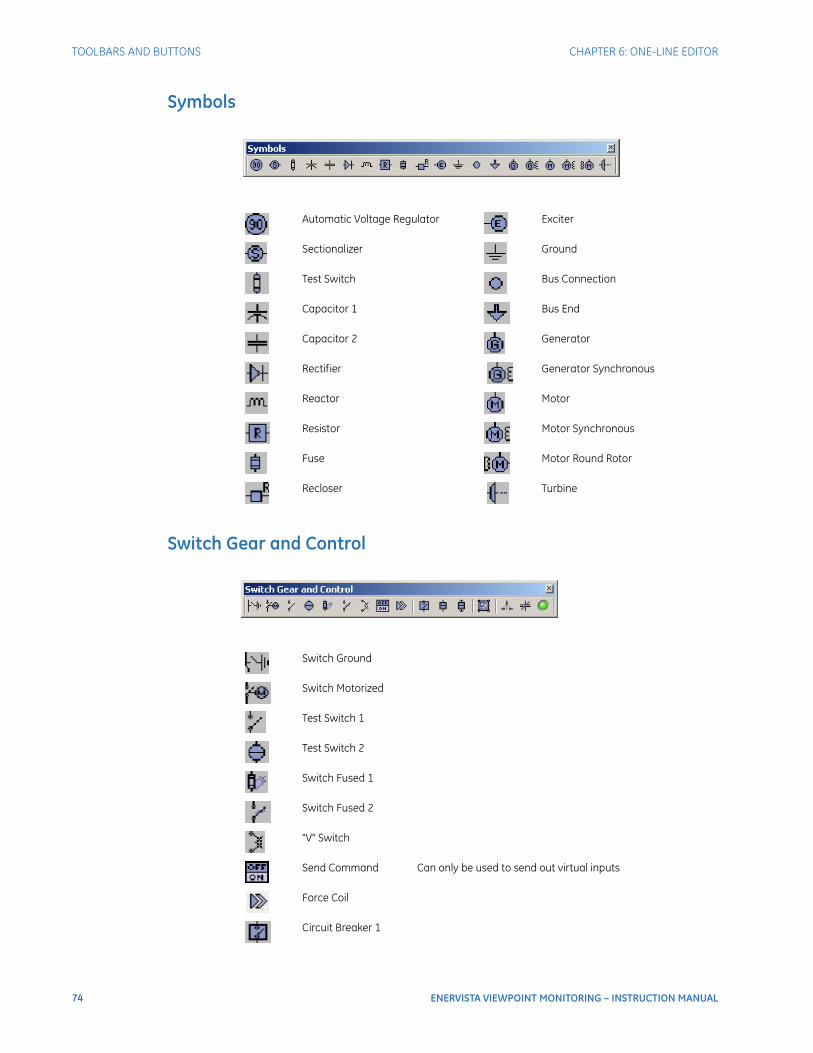
74 ENERVISTA VIEWPOINT MONITORING – INSTRUCTION MANUAL
TOOLBARS AND BUTTONS CHAPTER 6: ONE-LINE EDITOR
Symbols
Switch Gear and Control
Automatic Voltage Regulator Exciter
Sectionalizer Ground
Test Switch Bus Connection
Capacitor 1 Bus End
Capacitor 2 Generator
Rectifier
Generator Synchronous
Reactor Motor
Resistor Motor Synchronous
Fuse Motor Round Rotor
Recloser
Turbine
Switch Ground
Switch Motorized
Test Switch 1
Test Switch 2
Switch Fused 1
Switch Fused 2
"V" Switch
Send Command Can only be used to send out virtual inputs
Force Coil
Circuit Breaker 1

CHAPTER 6: ONE-LINE EDITOR TOOLBARS AND BUTTONS
ENERVISTA VIEWPOINT MONITORING – INSTRUCTION MANUAL 75
Transformers and Symbols
Circuit Breaker 2
Drawout Breaker
Custom Symbol
Switch Double Throw
Contactor
LED Indicator Analog and Digital types
Tapchanger Transformer Voltage 1
Transformer 1 Transformer Voltage 2
Transformer 2 Transformer 5
Transformer 3 Transformer Delta
Transformer 4 Star
Transformer AUTO Zig Zag
Transformer Phase Shifting Star Grounded
Transformer Current Star Zig Zag Grounded

76 ENERVISTA VIEWPOINT MONITORING – INSTRUCTION MANUAL
TOOLBARS AND BUTTONS CHAPTER 6: ONE-LINE EDITOR

ENERVISTA VIEWPOINT MONITORING – INSTRUCTION MANUAL 77
EnerVista Viewpoint Monitoring
Chapter 7: One-Line Viewer
One-Line Viewer
This chapter outlines use of the One-Line Viewer.
• View data
• Control devices
• Create screen captures
• Toolbar and buttons
• LED indicators
IntroductionThe One-Line Viewer displays data from the equipment and allows you to control devices. An example is turning a motor on and off. A schema diagram needs to be created first using the One-Line Editor (previous chapter). For the on/off example for a motor, a digital schema is created.
With the One-Live Viewer, you can view data, control the device, and take screen captures.
The toolbar and buttons are explained at the end of the chapter.
View dataTo view data from a One-Line diagram:
1. In the main window of Viewpoint Monitoring, click the One-Line Viewer option to open the Viewer.
2. Open a file by clicking the Open File button on the toolbar, or click File > Open and select the .sf file.
Viewpoint Monitoring reads the values from the device and displays them. In the example shown here, Viewpoint Monitoring has communicated successfully withe device, shown by the green LED indicator.

78 ENERVISTA VIEWPOINT MONITORING – INSTRUCTION MANUAL
CONTROL DEVICES CHAPTER 7: ONE-LINE VIEWER
Figure 93: Successful communication with a UR device
3. Check the LED indicator in the tab at the bottom of the window or by the Communication Status button at the top-right. These are explained at the end of the chapter and in the Interface chapter. Clicking the Communication Status button opens the Device Status window, which is outlined in the Device status section on page 22.
Figure 94: Parameter display
Control devicesWhen viewing schemas, you can manually convert non-connected, digital components to their other state. An example is to switch a motor from ON to OFF. The schema diagram already needs to have the functions added as Switch Gear and Control buttons in the One-Line Editor.
You can also toggle between states, for example from ON to OFF then OFF to ON, for digital components.
If you click an inserted picture of a device, it opens the virtual front panel.
To control a device:
1. In the One-Line Viewer, select the digital component to be switched by clicking it once. The front panel of the device displays or the system prompts if you want to change the status of the symbol.
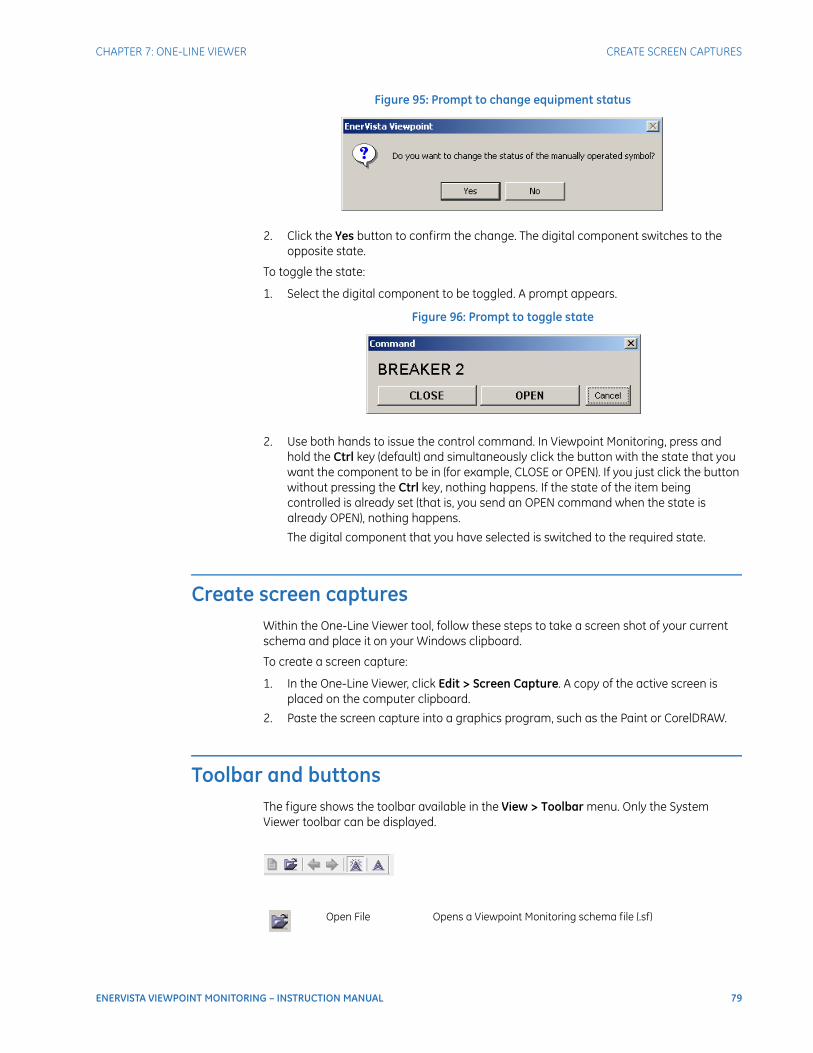
CHAPTER 7: ONE-LINE VIEWER CREATE SCREEN CAPTURES
ENERVISTA VIEWPOINT MONITORING – INSTRUCTION MANUAL 79
Figure 95: Prompt to change equipment status
2. Click the Yes button to confirm the change. The digital component switches to the opposite state.
To toggle the state:
1. Select the digital component to be toggled. A prompt appears.
Figure 96: Prompt to toggle state
2. Use both hands to issue the control command. In Viewpoint Monitoring, press and hold the Ctrl key (default) and simultaneously click the button with the state that you want the component to be in (for example, CLOSE or OPEN). If you just click the button without pressing the Ctrl key, nothing happens. If the state of the item being controlled is already set (that is, you send an OPEN command when the state is already OPEN), nothing happens.
The digital component that you have selected is switched to the required state.
Create screen capturesWithin the One-Line Viewer tool, follow these steps to take a screen shot of your current schema and place it on your Windows clipboard.
To create a screen capture:
1. In the One-Line Viewer, click Edit > Screen Capture. A copy of the active screen is placed on the computer clipboard.
2. Paste the screen capture into a graphics program, such as the Paint or CorelDRAW.
Toolbar and buttonsThe figure shows the toolbar available in the View > Toolbar menu. Only the System Viewer toolbar can be displayed.
Open File Opens a Viewpoint Monitoring schema file (.sf)
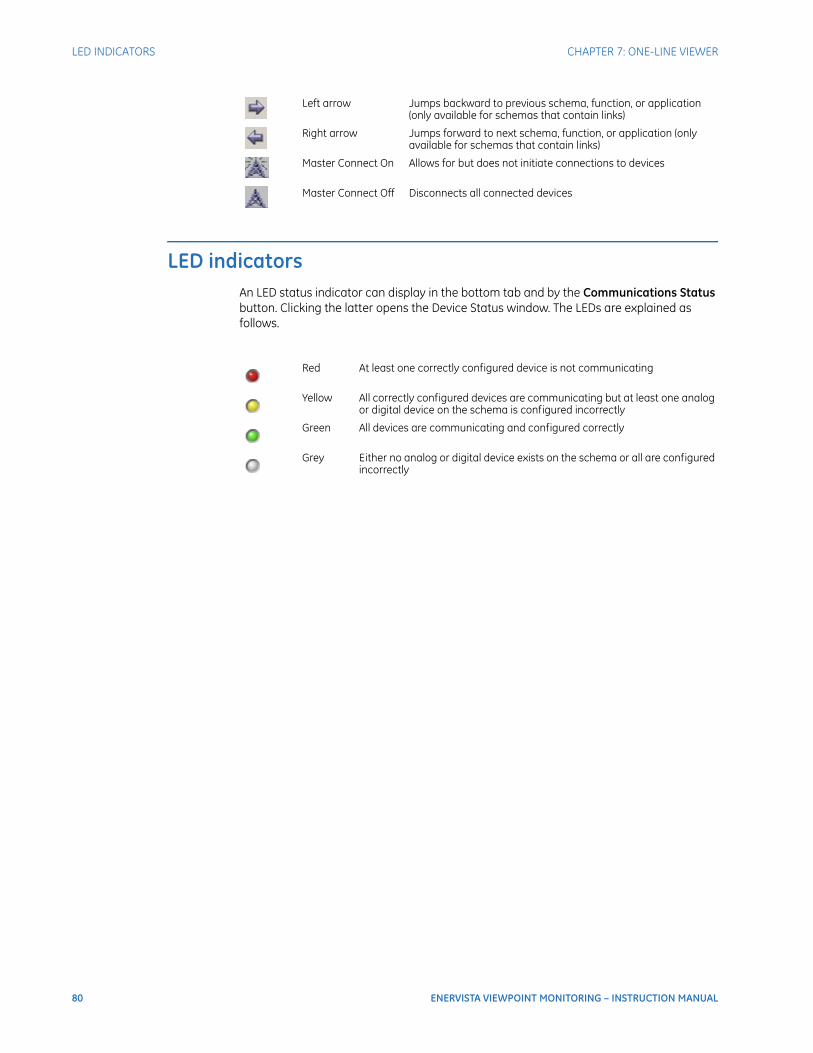
80 ENERVISTA VIEWPOINT MONITORING – INSTRUCTION MANUAL
LED INDICATORS CHAPTER 7: ONE-LINE VIEWER
LED indicatorsAn LED status indicator can display in the bottom tab and by the Communications Status button. Clicking the latter opens the Device Status window. The LEDs are explained as follows.
Left arrow Jumps backward to previous schema, function, or application (only available for schemas that contain links)
Right arrow Jumps forward to next schema, function, or application (only available for schemas that contain links)
Master Connect On Allows for but does not initiate connections to devices
Master Connect Off Disconnects all connected devices
Red At least one correctly configured device is not communicating
Yellow All correctly configured devices are communicating but at least one analog or digital device on the schema is configured incorrectly
Green All devices are communicating and configured correctly
Grey Either no analog or digital device exists on the schema or all are configured incorrectly

ENERVISTA VIEWPOINT MONITORING – INSTRUCTION MANUAL 81
EnerVista Viewpoint Monitoring
Chapter 8: Annunciator alarms
Annunciator alarms
This chapter outlines use of the Annunciator.
• Add alarm
• Acknowledge and reset alarm
• Manage email notification
• Manage alarm sounds
• Toolbar and buttons
IntroductionThe Annunciator actively monitors measured values and generates alarms. Alarms can be configured for activation whenever a digital status changes state or whenever analog values change beyond a programmed threshold.
The Annunciator provides visual, audio, and email notifications. The notifications can be recorded in the database for post-event analysis.
Use the Annunciator to create and view visual dashboards or alarm status screens to monitor and acknowledge the status of remote sites and devices on one convenient screen.
This chapter outlines the Annunciator window to set up alarms. Alarm sounds are configured under File > Preferences > Audible Alarms. To have the alarms that you set up in the Annunciator window run after you exit Viewpoint Monitoring, configure File > Preferences > Annunciator.
The toolbar and buttons are explained at the end of the chapter.

82 ENERVISTA VIEWPOINT MONITORING – INSTRUCTION MANUAL
ADD ALARM CHAPTER 8: ANNUNCIATOR ALARMS
Figure 97: Example of Annunciator alarms
Add alarmEach Annunciator panel can have a maximum of 100 alarm indicators.
To add an alarm:
1. In the main window of EnerVista Viewpoint Monitoring, click the Annunciator option. The Annunciator window launches with an empty box.
Figure 98: Creating the first alarm
2. Click the Insert Indicator button on the toolbar, or right-click the empty and select Insert . This creates an alarm box in the empty box.

CHAPTER 8: ANNUNCIATOR ALARMS ADD ALARM
ENERVISTA VIEWPOINT MONITORING – INSTRUCTION MANUAL 83
Figure 99: Alarm ready for configuration
3. With the box selected, double-click it , right-click it and select Properties, or click the
Edit button on the toolbar. The preferences window opens for configuration.
Figure 100: Alarm setup configuration window
4. Configure the Setup tab.
Display Name — The name of the indicator.
Device — The device to attach this indicator to.
Analog Parameter or Digital Parameter — Select one. You cannot configure both. Selects the alarm trigger. For a Digital Parameter, also select the Digital Item, which is a more specific trigger, such as a specific contact input.
Row and Col — The location of the indicator on the Annunciator panel.
5. Configure the Active tab. The active options depend on the analog or digital parameters set in the previous tab.

84 ENERVISTA VIEWPOINT MONITORING – INSTRUCTION MANUAL
ADD ALARM CHAPTER 8: ANNUNCIATOR ALARMS
Figure 101: Active configuration window
Stay InActive — This option displays with selection of a digital parameter as a data item for the indicator. When enabled, there is no alarming for the parameter, which means that the Annunciator displays the value, it does not become alarmed, and the state displays as normal. In other words, the alarm remains inactive.
HIGH/LOW — This option displays with selection of a digital parameter as a data item for the indicator. An example is a digital output of 0 or 1. If you set the High option and the value 1 is read from the device, the alarm displays. If you set the Low option and the value 0 is read from the device, the alarm displays. An example is Virtual Inputs that can have a 0 or 1 value.
Figure 102: Digital parameter set
Value — The high and/or low conditions to trigger the indicator alarm.
Latency Period — The amount of time that the value is in the alarm state before the alarm is triggered. The period is specified in milliseconds, where 3000 ms equals one three seconds.
6. Configure the Colour tab. The active options depend on the analog or digital parameters set in the previous tabs.
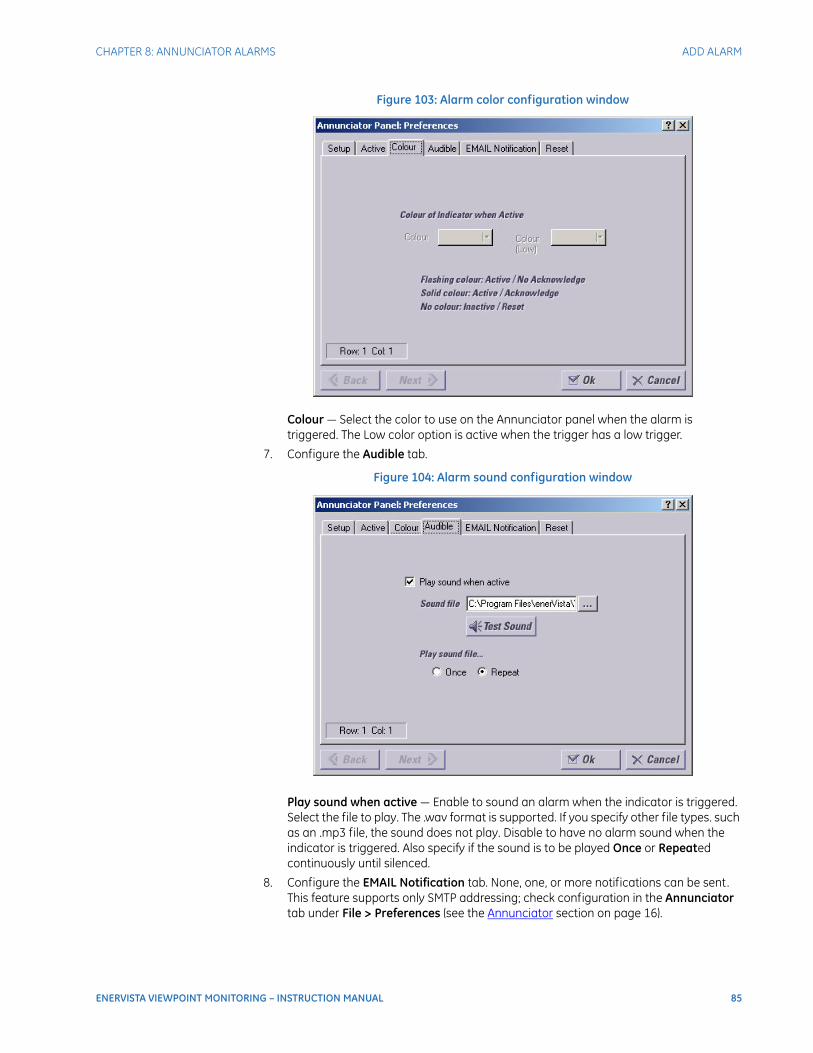
CHAPTER 8: ANNUNCIATOR ALARMS ADD ALARM
ENERVISTA VIEWPOINT MONITORING – INSTRUCTION MANUAL 85
Figure 103: Alarm color configuration window
Colour — Select the color to use on the Annunciator panel when the alarm is triggered. The Low color option is active when the trigger has a low trigger.
7. Configure the Audible tab.
Figure 104: Alarm sound configuration window
Play sound when active — Enable to sound an alarm when the indicator is triggered. Select the file to play. The .wav format is supported. If you specify other file types. such as an .mp3 file, the sound does not play. Disable to have no alarm sound when the indicator is triggered. Also specify if the sound is to be played Once or Repeated continuously until silenced.
8. Configure the EMAIL Notification tab. None, one, or more notifications can be sent. This feature supports only SMTP addressing; check configuration in the Annunciator tab under File > Preferences (see the Annunciator section on page 16).
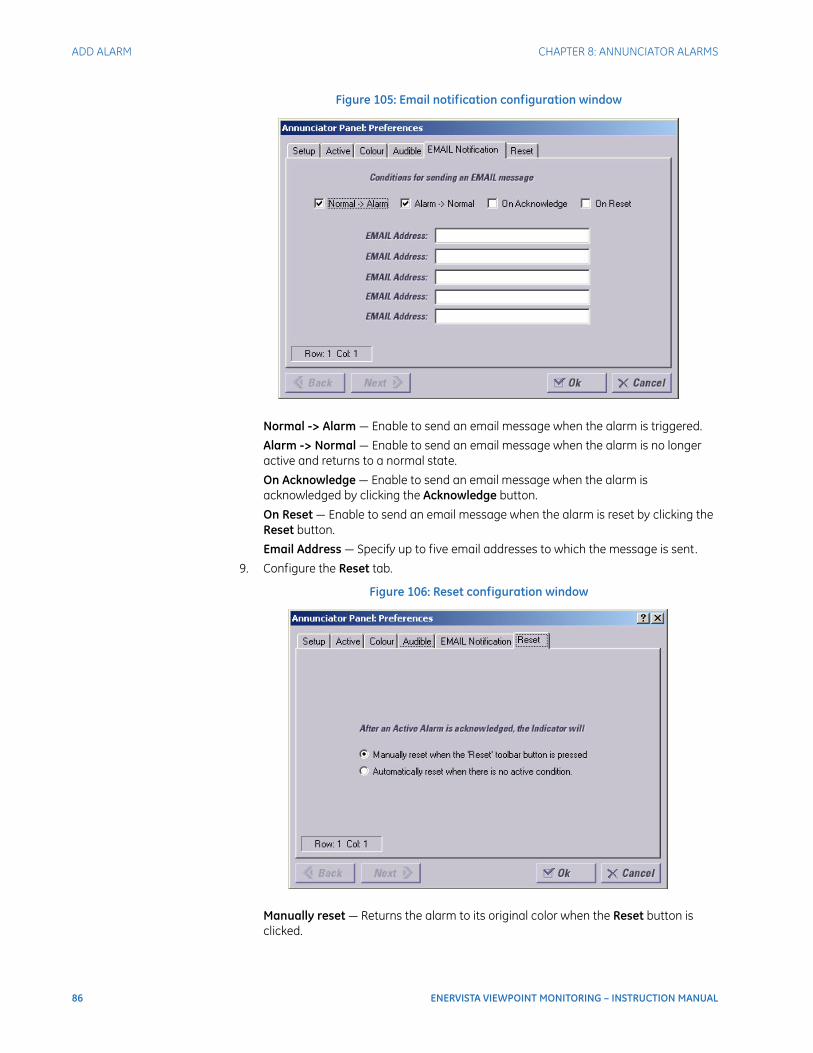
86 ENERVISTA VIEWPOINT MONITORING – INSTRUCTION MANUAL
ADD ALARM CHAPTER 8: ANNUNCIATOR ALARMS
Figure 105: Email notification configuration window
Normal -> Alarm — Enable to send an email message when the alarm is triggered.
Alarm -> Normal — Enable to send an email message when the alarm is no longer active and returns to a normal state.
On Acknowledge — Enable to send an email message when the alarm is acknowledged by clicking the Acknowledge button.
On Reset — Enable to send an email message when the alarm is reset by clicking the Reset button.
Email Address — Specify up to five email addresses to which the message is sent.
9. Configure the Reset tab.
Figure 106: Reset configuration window
Manually reset — Returns the alarm to its original color when the Reset button is clicked.
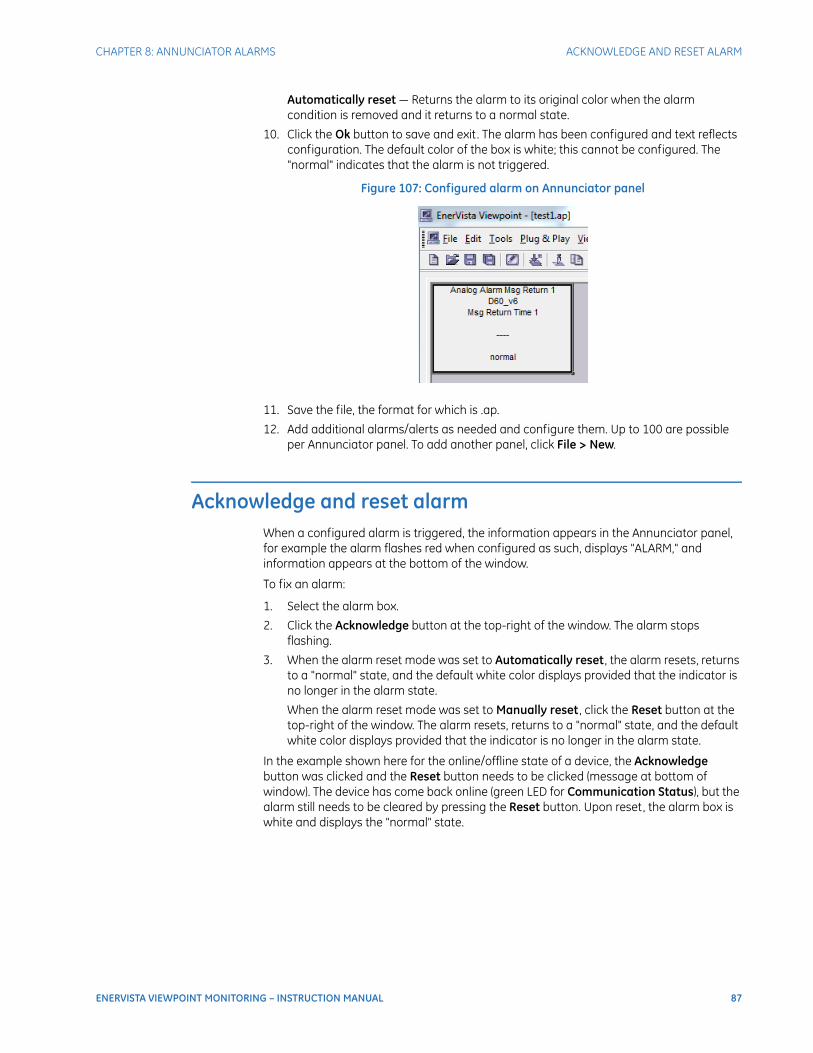
CHAPTER 8: ANNUNCIATOR ALARMS ACKNOWLEDGE AND RESET ALARM
ENERVISTA VIEWPOINT MONITORING – INSTRUCTION MANUAL 87
Automatically reset — Returns the alarm to its original color when the alarm condition is removed and it returns to a normal state.
10. Click the Ok button to save and exit. The alarm has been configured and text reflects configuration. The default color of the box is white; this cannot be configured. The "normal" indicates that the alarm is not triggered.
Figure 107: Configured alarm on Annunciator panel
11. Save the file, the format for which is .ap.
12. Add additional alarms/alerts as needed and configure them. Up to 100 are possible per Annunciator panel. To add another panel, click File > New.
Acknowledge and reset alarmWhen a configured alarm is triggered, the information appears in the Annunciator panel, for example the alarm flashes red when configured as such, displays "ALARM," and information appears at the bottom of the window.
To fix an alarm:
1. Select the alarm box.
2. Click the Acknowledge button at the top-right of the window. The alarm stops flashing.
3. When the alarm reset mode was set to Automatically reset , the alarm resets, returns to a "normal" state, and the default white color displays provided that the indicator is no longer in the alarm state.
When the alarm reset mode was set to Manually reset , click the Reset button at the top-right of the window. The alarm resets, returns to a "normal" state, and the default white color displays provided that the indicator is no longer in the alarm state.
In the example shown here for the online/offline state of a device, the Acknowledge button was clicked and the Reset button needs to be clicked (message at bottom of window). The device has come back online (green LED for Communication Status), but the alarm still needs to be cleared by pressing the Reset button. Upon reset, the alarm box is white and displays the "normal" state.

88 ENERVISTA VIEWPOINT MONITORING – INSTRUCTION MANUAL
MANAGE EMAIL NOTIFICATION CHAPTER 8: ANNUNCIATOR ALARMS
Figure 108: Alarm for online/offline status of device
Manage email notificationEmails can be sent when alarms are triggered, acknowledged, reset, and/or returned to a normal state. Configuration is done in the following two places:
• EMAIL Notification tab when configuring an alarm (outlined earlier in this chapter)
• File > Preferences > Annunciator (see the Annunciator section on page 16)
To view who receives email notification for an alarm:
1. Right-click the alarm and select Notification Report .
Manage alarm soundsAlarm sounds can be triggered. Configuration is done in the following two places:
• Audible tab when configuring an alarm (outlined earlier in this chapter)
• File > Preferences > Audible Alarms (see the Audible alarms section on page 15)
Use the Mute Sound button at the top-right of the window to turn off sound. This does not affect the alarm itself.
The button toggles from sound on to sound off .
Toolbar and buttonsA single toolbar displays in the Annunciator window. There are no optional toolbars.
New Creates a new annunciator panel file (.ap)
Open Opens/loads an existing annunciator panel file (.ap)
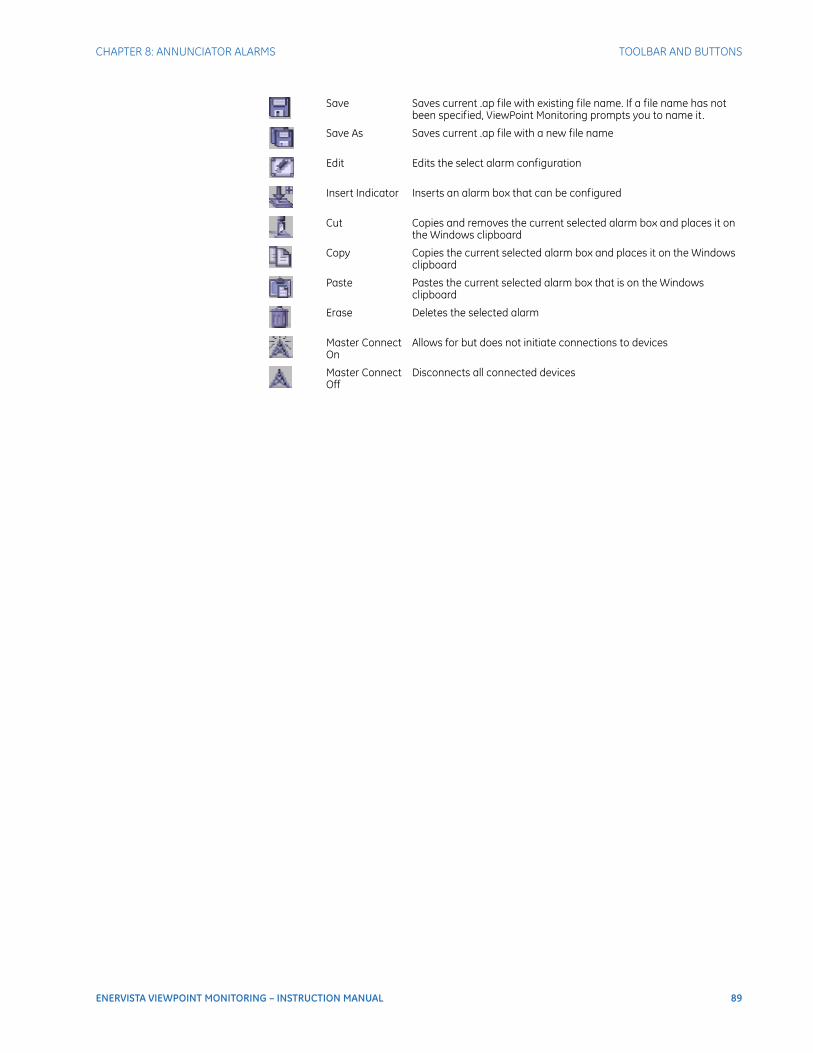
CHAPTER 8: ANNUNCIATOR ALARMS TOOLBAR AND BUTTONS
ENERVISTA VIEWPOINT MONITORING – INSTRUCTION MANUAL 89
Save Saves current .ap file with existing file name. If a file name has not been specified, ViewPoint Monitoring prompts you to name it.
Save As Saves current .ap file with a new file name
Edit Edits the select alarm configuration
Insert Indicator Inserts an alarm box that can be configured
Cut Copies and removes the current selected alarm box and places it on the Windows clipboard
Copy Copies the current selected alarm box and places it on the Windows clipboard
Paste Pastes the current selected alarm box that is on the Windows clipboard
Erase Deletes the selected alarm
Master Connect On
Allows for but does not initiate connections to devices
Master Connect Off
Disconnects all connected devices

90 ENERVISTA VIEWPOINT MONITORING – INSTRUCTION MANUAL
TOOLBAR AND BUTTONS CHAPTER 8: ANNUNCIATOR ALARMS

ENERVISTA VIEWPOINT MONITORING – INSTRUCTION MANUAL 91
EnerVista Viewpoint Monitoring
Chapter 9: Events
Events
This chapter outlines use of event records.
• Enable or disable event recording
• View events
• Filter events
• Change event type
• Delete event
• Toolbar and buttons
IntroductionEvent records can be viewed for Viewpoint Monitoring and devices.
As enabled per-device, the event records from devices are automatically downloaded and stored in the database, creating system-wide sequence of event records. When the Events check box is enabled in the Device Setup window for a device, Viewpoint Monitoring continuously polls the device to see if any events have been detected, downloads the event records, and stores them.
Event entries are color-coded and can be filtered.
Enable or disable event recordingConfiguration was done when adding the device, and it can be changed at any time.
To have events retrieved from devices after you exit from Viewpoint Monitoring, configure the Waveform & Events tab under File > Preferences.
To enable or disable event recording for a device:
1. In the main window of Viewpoint Monitoring, click the Device Setup option. The window launches.
2. Access the device.
3. Enable or disable the Events check box.
4. Click the OK button to save and exit.
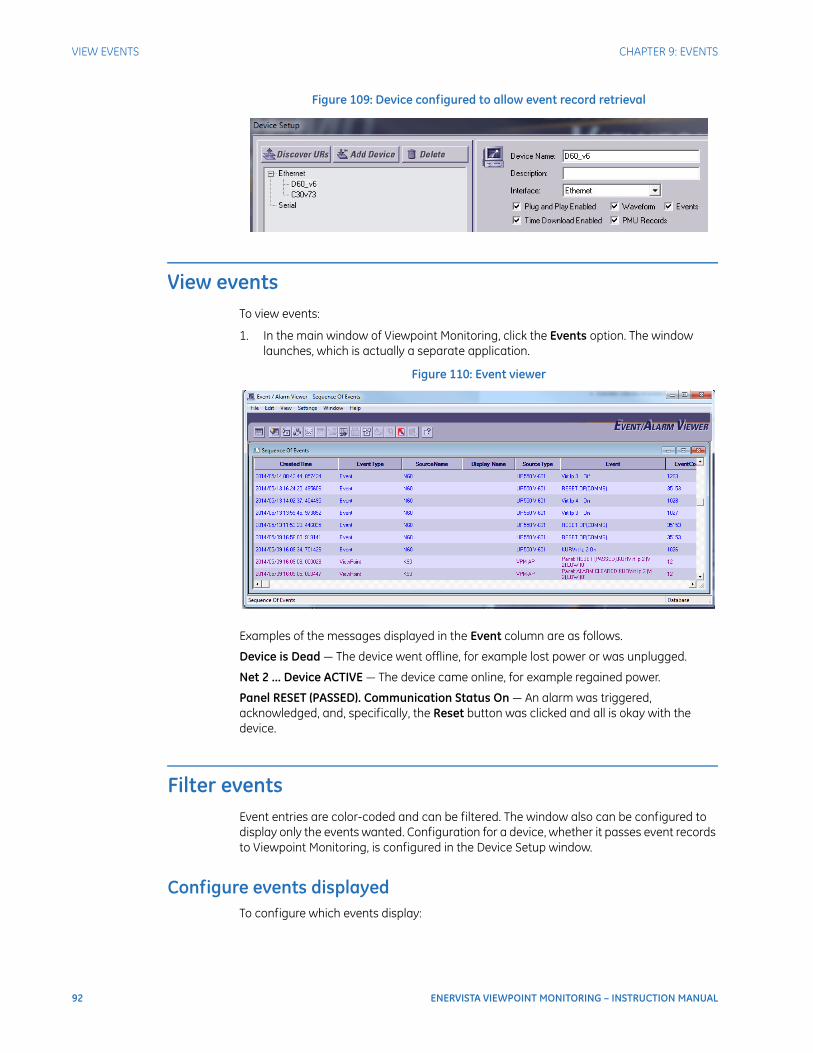
92 ENERVISTA VIEWPOINT MONITORING – INSTRUCTION MANUAL
VIEW EVENTS CHAPTER 9: EVENTS
Figure 109: Device configured to allow event record retrieval
View eventsTo view events:
1. In the main window of Viewpoint Monitoring, click the Events option. The window launches, which is actually a separate application.
Figure 110: Event viewer
Examples of the messages displayed in the Event column are as follows.
Device is Dead — The device went offline, for example lost power or was unplugged.
Net 2 ... Device ACTIVE — The device came online, for example regained power.
Panel RESET (PASSED). Communication Status On — An alarm was triggered, acknowledged, and, specifically, the Reset button was clicked and all is okay with the device.
Filter eventsEvent entries are color-coded and can be filtered. The window also can be configured to display only the events wanted. Configuration for a device, whether it passes event records to Viewpoint Monitoring, is configured in the Device Setup window.
Configure events displayedTo configure which events display:

CHAPTER 9: EVENTS CHANGE EVENT TYPE
ENERVISTA VIEWPOINT MONITORING – INSTRUCTION MANUAL 93
1. Click the Seq. Config button on the toolbar. The window opens.
2. Enable and disable the appropriate check boxes of the event types in the window. The System Events, ViewPoint Events, and ViewNode Events are for Viewpoint Monitoring. To view only events for devices, disable these three options.
3. Click the Ok button to save and exit.
Figure 111: Configure events displayed
Filter eventsTo filter events:
1. Click one of the filtering buttons on the toolbar, which is explained at the end of the chapter. A new window opens with the filtered events. The window is blank where there are no event entries.
Change event typeEvents can be changed to alarms and vice-versa.
To change an event type:
1. In the event record window, select an event.
2. Right-click the event, select ChangeEvent Type, and select Event or Alarm.
Delete eventEntries can be deleted.
To delete an event:
1. In the event record window, select an event.
2. Right-click the event and select Delete. The entry is deleted. The entry needs to be selected in order for it to be deleted; else nothing happens.
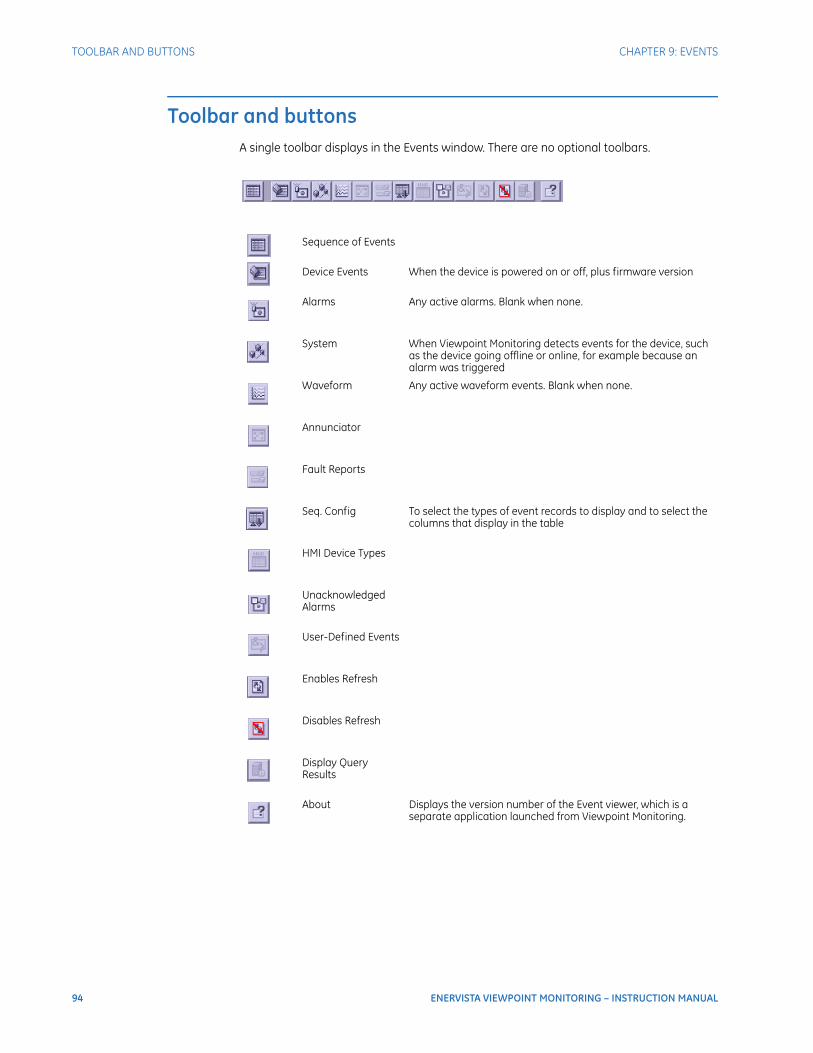
94 ENERVISTA VIEWPOINT MONITORING – INSTRUCTION MANUAL
TOOLBAR AND BUTTONS CHAPTER 9: EVENTS
Toolbar and buttonsA single toolbar displays in the Events window. There are no optional toolbars.
Sequence of Events
Device Events When the device is powered on or off, plus firmware version
Alarms Any active alarms. Blank when none.
System When Viewpoint Monitoring detects events for the device, such as the device going offline or online, for example because an alarm was triggered
Waveform Any active waveform events. Blank when none.
Annunciator
Fault Reports
Seq. Config To select the types of event records to display and to select the columns that display in the table
HMI Device Types
Unacknowledged Alarms
User-Defined Events
Enables Refresh
Disables Refresh
Display Query Results
About Displays the version number of the Event viewer, which is a separate application launched from Viewpoint Monitoring.
ENERVISTA VIEWPOINT MONITORING – INSTRUCTION MANUAL 95
EnerVista Viewpoint Monitoring
Chapter 10: Trending Reports
Trending Reports
This chapter outlines use of reports.
• Add report
• View report
• Change reports and parameters
• Print chart
• Export chart
• Archive report
• Automatic backup and purge
• Delete report or chart
• Purge report data
• Toolbars and buttons
IntroductionTrending reports are used to archive monitored data for devices. The trending reports record the values of monitored analog and digital points, with one-minute resolution. The data stored in the reports is viewable as graphs and tables.
This version of Viewpoint Monitoring uses a database instead of the flat files used with previous versions. Legacy .REP files are supported in a view mode. Legacy reports can be converted to the database. Reports for conversion are listed in a .RPC Reports Configuration file and reside in the C:\ Program Data\EnerVista\Viewpoint Monitoring\My Documents\reports\ folder. Database Reports support all functionality available in the previous Viewpoint Monitoring versions. The method for calculating Reports daily and hourly averages also was changed, allowing more precise averaging. This explains any noticeable deviation when comparing an old flat file report and new database reports.
Reports are stored in the table ReportData in the local database, meaning the PMCSSQLSERVER12 database that is used for storing events from devices. The ReportData table has ChannelID, Time, and Data columns, where ChannelID corresponds to ParameterID, Time is a timestamp, and Data is polled value of data point.
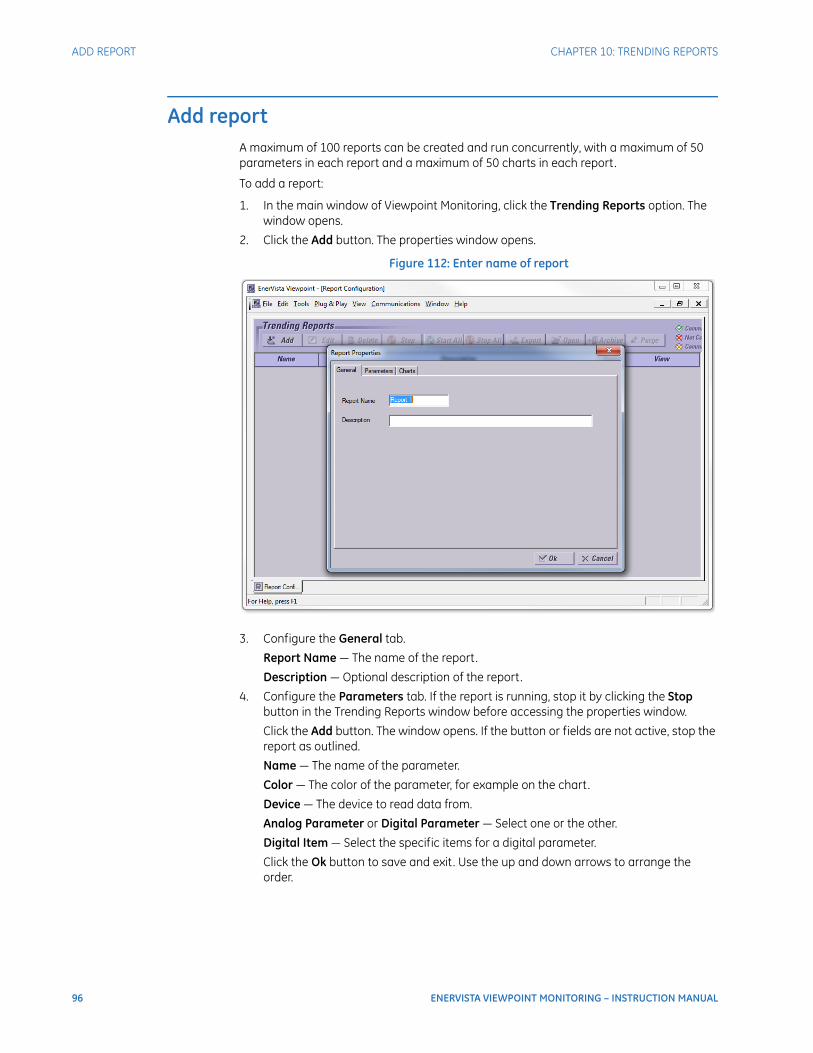
96 ENERVISTA VIEWPOINT MONITORING – INSTRUCTION MANUAL
ADD REPORT CHAPTER 10: TRENDING REPORTS
Add reportA maximum of 100 reports can be created and run concurrently, with a maximum of 50 parameters in each report and a maximum of 50 charts in each report.
To add a report:
1. In the main window of Viewpoint Monitoring, click the Trending Reports option. The window opens.
2. Click the Add button. The properties window opens.
Figure 112: Enter name of report
3. Configure the General tab.
Report Name — The name of the report.
Description — Optional description of the report.
4. Configure the Parameters tab. If the report is running, stop it by clicking the Stop button in the Trending Reports window before accessing the properties window.
Click the Add button. The window opens. If the button or fields are not active, stop the report as outlined.
Name — The name of the parameter.
Color — The color of the parameter, for example on the chart.
Device — The device to read data from.
Analog Parameter or Digital Parameter — Select one or the other.
Digital Item — Select the specific items for a digital parameter.
Click the Ok button to save and exit. Use the up and down arrows to arrange the order.
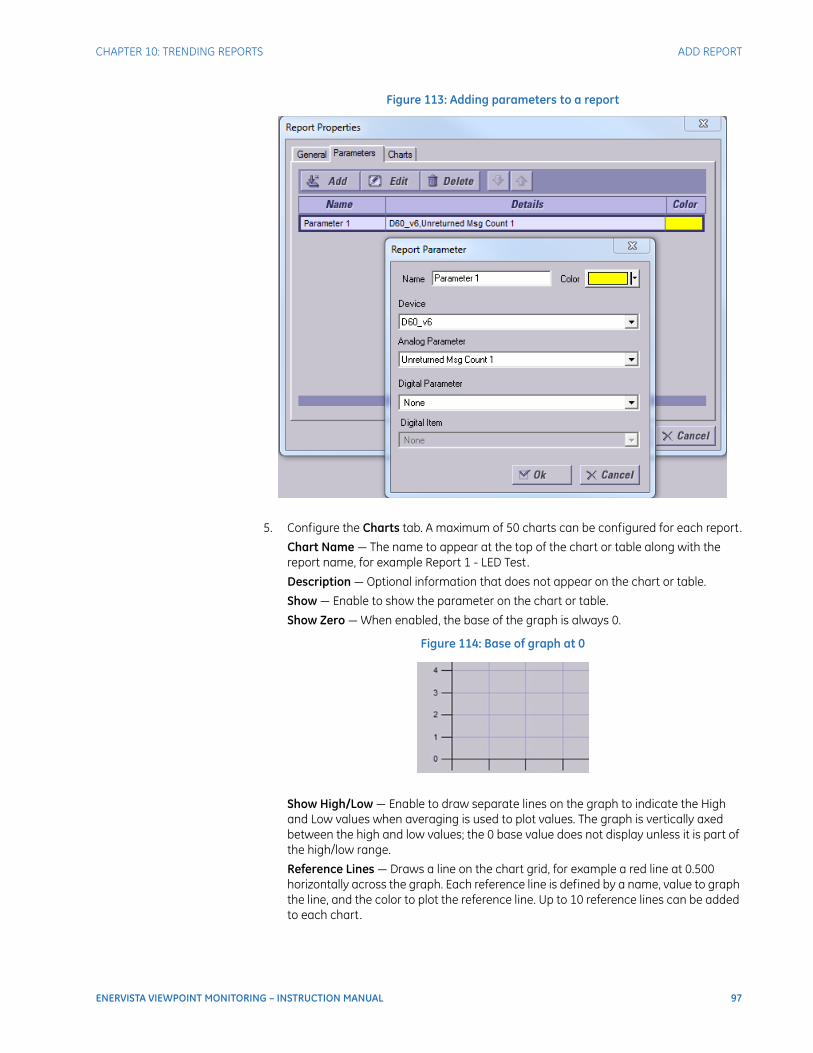
CHAPTER 10: TRENDING REPORTS ADD REPORT
ENERVISTA VIEWPOINT MONITORING – INSTRUCTION MANUAL 97
Figure 113: Adding parameters to a report
5. Configure the Charts tab. A maximum of 50 charts can be configured for each report.
Chart Name — The name to appear at the top of the chart or table along with the report name, for example Report 1 - LED Test.
Description — Optional information that does not appear on the chart or table.
Show — Enable to show the parameter on the chart or table.
Show Zero — When enabled, the base of the graph is always 0.
Figure 114: Base of graph at 0
Show High/Low — Enable to draw separate lines on the graph to indicate the High and Low values when averaging is used to plot values. The graph is vertically axed between the high and low values; the 0 base value does not display unless it is part of the high/low range.
Reference Lines — Draws a line on the chart grid, for example a red line at 0.500 horizontally across the graph. Each reference line is defined by a name, value to graph the line, and the color to plot the reference line. Up to 10 reference lines can be added to each chart.

98 ENERVISTA VIEWPOINT MONITORING – INSTRUCTION MANUAL
ADD REPORT CHAPTER 10: TRENDING REPORTS
Figure 115: Chart configuration window
6. Click the Ok button to save and exit. A window asks if you want to start the report. If the answer is Yes, Viewpoint Monitoring records each minute the value for the parameters configured in the report. The values are stored in the database, and they can be exported to a file in comma-delimited format that can be imported into Microsoft Excel. If No, data is not recorded.
Figure 116: Prompt to create report
7. Save the report under File > Save. The file is saved in a .sf format; you are not saving individual reports in the .rep format.

CHAPTER 10: TRENDING REPORTS VIEW REPORT
ENERVISTA VIEWPOINT MONITORING – INSTRUCTION MANUAL 99
View reportThe chart must be configured and enabled before display (previous section). You launch the chart, then can switch to a table view, as well as change the time period used to display the chart.
Figure 117: Example of chart
Reports are listed automatically when opening the Trending Reports application; you do not need to manually open a file. When a report is not running, it is listed with a lighter font. In the example shown here, two reports are inactive and one is active.
Figure 118: Two reports not running
To start a report:
1. Select the entry, and click the Run button.
To view an archived report by opening the file:
1. Click File > Open, and select the .rep file.
To view a chart in a report:
1. In the View column of the Trending Reports window, select the chart from the Select

100 ENERVISTA VIEWPOINT MONITORING – INSTRUCTION MANUAL
CHANGE REPORTS AND PARAMETERS CHAPTER 10: TRENDING REPORTS
chart drop-down list. The pre-configured chart opens.
Figure 119: Displaying a report chart
2. To view a table, click the table icon.
Change time period in chartData points are sampled constantly and an average for a data point is calculated every minute.
In order for the data to display properly, the size of the date window determines the format of the data displayed. The following rules governs how the time range displays:
• If the date window is less than one day, the minute data is charted
• If the date window is greater than one day and less than two months, each data point is the average for an hour. There is an option to show the High/Low range on the same graph.
• If the date window is greater than three months, each data point is the average for a day. There is an option to show the High/Low range on the same graph.
The High/Low range is based on the highest and lowest stored minute samples.
To change the time period in a chart:
1. Open the chart as outlined.
2. Select the period from the Date Selector drop-down list or change it in the From and To fields. The period is not saved, even when you save the report; you select the period each time that you access the chart.
Figure 120: Selecting time period to display
Change reports and parametersStarting from ViewPoint Monitoring 7.10, parameters can be added to existing reports that were already run. You can also add parameters from other reports, existing and running for a while. The data previously accumulated in these reports can be viewed in the report to which the parameters were added.
Once set, default values can be changed in the reports and chart windows.
To change the parameters:
1. In the Trending Reports window, double-click the entry. In the chart window, click the

CHAPTER 10: TRENDING REPORTS PRINT CHART
ENERVISTA VIEWPOINT MONITORING – INSTRUCTION MANUAL 101
Preferences button on the toolbar. The window opens.
2. Configure as outlined.
Print chartCharts can be output in print formats supported by your computer, such as PDF or a printer.
To print a chart:
1. Open the chart as outlined.
2. Click the Print button on the toolbar.
3. Select the print output.
Export chartCharts can be exported in the .csv format, which can be opened in Microsoft Excel. The time period and frequency can be specified. The export can be performed in the report and chart windows, both outlined here.
The previous section outlines how to export a chart as a PDF file.
To export a chart in the Trending Reports window:
1. Select the report. The software needs to be communicating with the device in order to export, as indicated in the Status column.
Figure 121: One report ready for exporting
2. Click the Export button at the top of the window. The window opens.
Figure 122: Export button
3. Select the time period to export, the frequency to export, and check the file name and location for the export. If the fields are inactive, it means that there is a problem communicating with the device; the Status needs to be good in the main window.

102 ENERVISTA VIEWPOINT MONITORING – INSTRUCTION MANUAL
ARCHIVE REPORT CHAPTER 10: TRENDING REPORTS
Show Min/Max — This check box is active when the Frequency selected is other than "Minute samples." Enable the check box to export the minimum and maximum hourly or daily averages.
Clicking the left arrow button sets the start date to the oldest date recorded in the report. Clicking the right arrow button sets the last date recorded in the report.
4. Click the Ok button to export and exit. In the following figure, the --- values indicate time in the future so no readings have been reported.
Figure 123: Example of report in Excel
To export a chart in the chart window:
1. Click the Export button on the toolbar.
2. Select the time period to export, the frequency to export, and check the file name and location for the export. If the fields are inactive, it means that there is a problem communicating with the device; the Status needs to be good in the main window.
3. Click the Ok button to export and exit.
Archive reportReports, meaning the data and charts, can be manually archived. The data is saved from the database into the .rep format. The next section outlines automatic backups.
The default location is C:\ProgramData\EnerVista\Viewpoint Monitoring\My Documents\Reports\
To archive a report:
1. In the Trending Reports window, select the report.
2. Click the Archive button. The window opens.

CHAPTER 10: TRENDING REPORTS AUTOMATIC BACKUP AND PURGE
ENERVISTA VIEWPOINT MONITORING – INSTRUCTION MANUAL 103
Figure 124: Archiving chart data for a report
3. Specify the time period, and check or specify the file name and location for the archive.
Clicking the left arrow button sets the start date to the oldest data recorded in the report. Clicking the right arrow button sets the end date to the last date recorded in the report.
If the start date selected is the start of the report data, the software prompts if you want to purge the data after the archiving is completed.
If the report contains Parameters shared with other reports, the software prompts if shared channels are to be purged.
4. Click the Ok button to archive and exit.
Automatic backup and purgeStarting from ViewPoint Monitoring 7.10, a new feature was added to the reports: Automatic Backup and Purge. This purge function is not the same as the Purge Data outlined later.
Backup and Purge is performed every day at midnight, after reaching the Preferred Maximum of days set in Preferences. Backup data is saved to "…\EnerVista\Viewpoint Monitoring\My Documents\ \Reports\Backup\ ReportData_YYYY_MM(n).csv" files, where n is a zero-based index, indicating number of files in a month. After creating a first file, at the beginning of each month new portions of data are appended to the end of the existing file every day up to the end of the month. Unless the CSV file reaches maximum size of 100 MB, only one CSV file is created monthly. If the file exceeds maximum size, a new file for that month is created.
There are no instructions for backup and purge, which are performed automatically every day at midnight.
Delete report or chartIf a report appears inactive in the window, it means that its file is not running or it has been deleted. You can still click into the entries and save them.
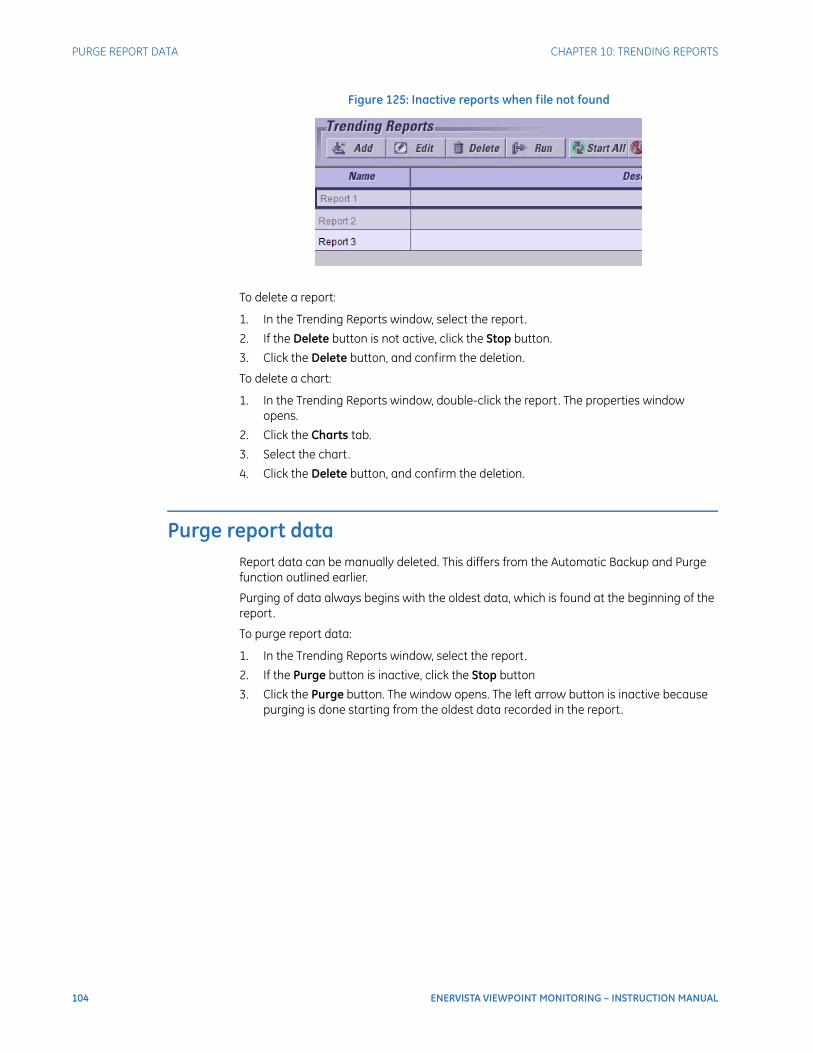
104 ENERVISTA VIEWPOINT MONITORING – INSTRUCTION MANUAL
PURGE REPORT DATA CHAPTER 10: TRENDING REPORTS
Figure 125: Inactive reports when file not found
To delete a report:
1. In the Trending Reports window, select the report.
2. If the Delete button is not active, click the Stop button.
3. Click the Delete button, and confirm the deletion.
To delete a chart:
1. In the Trending Reports window, double-click the report. The properties window opens.
2. Click the Charts tab.
3. Select the chart.
4. Click the Delete button, and confirm the deletion.
Purge report dataReport data can be manually deleted. This differs from the Automatic Backup and Purge function outlined earlier.
Purging of data always begins with the oldest data, which is found at the beginning of the report.
To purge report data:
1. In the Trending Reports window, select the report.
2. If the Purge button is inactive, click the Stop button
3. Click the Purge button. The window opens. The left arrow button is inactive because purging is done starting from the oldest data recorded in the report.

CHAPTER 10: TRENDING REPORTS TOOLBAR AND BUTTONS
ENERVISTA VIEWPOINT MONITORING – INSTRUCTION MANUAL 105
Figure 126: Deleting oldest data from report
4. Check the end period in the To field. Clicking the right arrow button sets the end date to the last date recorded in the report, which is selected by default when the window opens.
If the report contains Parameters shared with other reports, the software prompts if shared channels are to be purged.
5. Click the Ok button to purge, confirm the purge, and exit. If there is no data to purge, a message displays to this effect.
Toolbar and buttonsThe following toolbar and buttons display in a chart window.
Open Opens an archive report file in the .rep format
Preferences Opens the window to configure the chart
Export Exports the chart data as an Excel spreadsheet in the .csv format
Print Outputs the chart to a printer, a PDF file, or other formats supported by the computer
Left Arrow Button The Left Arrow Button is used to return back to the larger time range graph.When viewing a graph that displays the time in days, click that day in the graph to display the hours of that days in a graph. Similarly, when viewing a graph that displays the time in hour, click that hour in the graph to display the minutes of that hour in a graph.
Graph Button Displays the data in a 2D graph
Chart Button Displays the data in a table
106 ENERVISTA VIEWPOINT MONITORING – INSTRUCTION MANUAL
TOOLBAR AND BUTTONS CHAPTER 10: TRENDING REPORTS
Date Selector Select one of the Report's predefined charts. Selecting from the Date Selector drop-down list initializes the Date Window to the specified date range. Options for the Date Selector are:
Current HourLast HourTodayLast 24 HoursYesterdayCurrent Week (M-S)Current Week (S-S)Last 7 daysCurrent MonthLast 30 daysCurrent YearCustom Date
Date From ... To To select a custom time range to view the data. Simply select the start and end time in 'the Date Window From and Date Window To drop-down boxes. When the user edits these drop down boxes, the Date Selector drop-down box displays "Custom Date." The user must then click the right arrow button to display the Custom Date in the viewer.
Right Arrow Button Select a custom date with the Date Window From and Date Window To drop down boxes, then click the right arrow button to display the time range in the viewer

ENERVISTA VIEWPOINT MONITORING – INSTRUCTION MANUAL 107
EnerVista Viewpoint Monitoring
Chapter 11: Waveforms
Waveforms
This chapter outlines use of waveform diagrams and COMTRADE files.
• View demonstration files
• View COMTRADE file
• View phasors
• View harmonics
• Convert waveform to COMTRADE file
• Merge COMTRADE files
• Resample COMTRADE file
• Toolbar and buttons
Introduction
Waveform filesWaveform (oscillography) files from GE Digital Energy devices are automatically downloaded from each device and stored on the computer hard drive. When a new waveform is detected, the file is downloaded to the hard drive.
Figure 127: Waveform files are downloaded from GE devices
Waveform files from third-party devices are not supported. They cannot be downloaded from a third-party device or viewed in Viewpoint Monitoring.
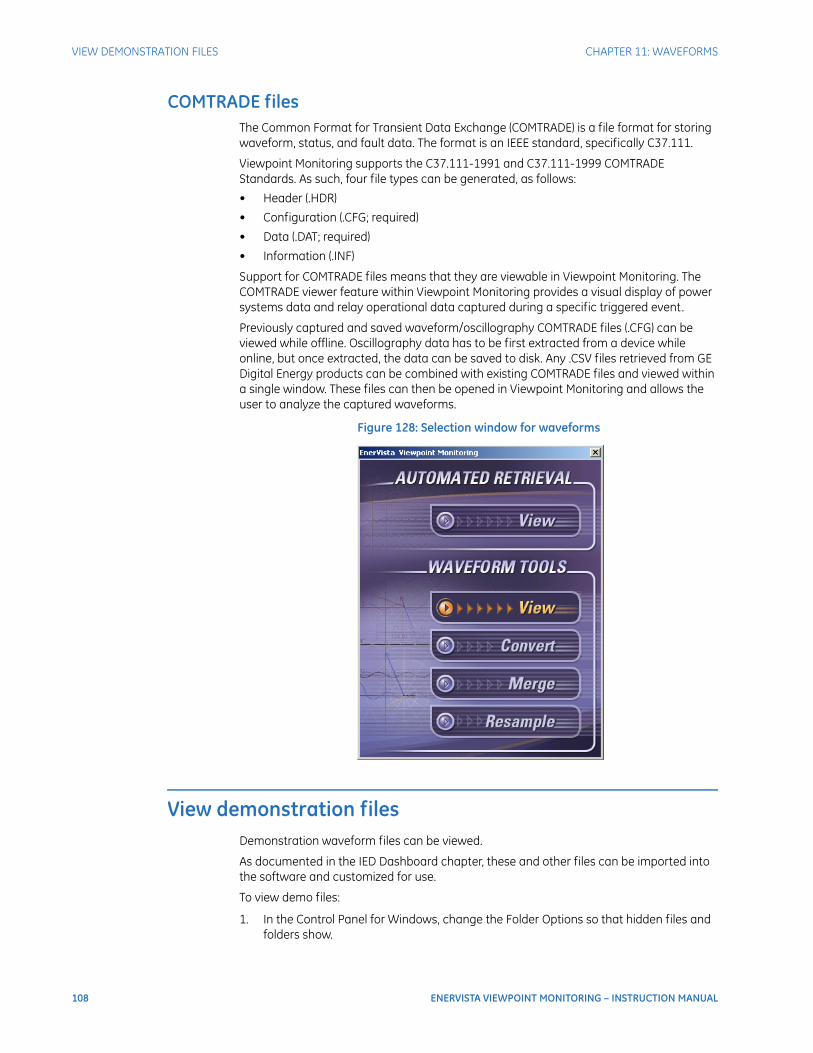
108 ENERVISTA VIEWPOINT MONITORING – INSTRUCTION MANUAL
VIEW DEMONSTRATION FILES CHAPTER 11: WAVEFORMS
COMTRADE filesThe Common Format for Transient Data Exchange (COMTRADE) is a file format for storing waveform, status, and fault data. The format is an IEEE standard, specifically C37.111.
Viewpoint Monitoring supports the C37.111-1991 and C37.111-1999 COMTRADE Standards. As such, four file types can be generated, as follows:
• Header (.HDR)
• Configuration (.CFG; required)
• Data (.DAT; required)
• Information (.INF)
Support for COMTRADE files means that they are viewable in Viewpoint Monitoring. The COMTRADE viewer feature within Viewpoint Monitoring provides a visual display of power systems data and relay operational data captured during a specific triggered event.
Previously captured and saved waveform/oscillography COMTRADE files (.CFG) can be viewed while offline. Oscillography data has to be first extracted from a device while online, but once extracted, the data can be saved to disk. Any .CSV files retrieved from GE Digital Energy products can be combined with existing COMTRADE files and viewed within a single window. These files can then be opened in Viewpoint Monitoring and allows the user to analyze the captured waveforms.
Figure 128: Selection window for waveforms
View demonstration filesDemonstration waveform files can be viewed.
As documented in the IED Dashboard chapter, these and other files can be imported into the software and customized for use.
To view demo files:
1. In the Control Panel for Windows, change the Folder Options so that hidden files and folders show.

CHAPTER 11: WAVEFORMS VIEW COMTRADE FILE
ENERVISTA VIEWPOINT MONITORING – INSTRUCTION MANUAL 109
2. In the main Viewpoint Monitoring window, click File > Open and open the following file as an example:
C:\ProgramData\EnerVista\Viewpoint Monitoring\My Documents\Examples\OVERCURRENT.cfg
or when using a UR device
C:\Program Files (x86)\GE Power Management\URPC\Data\Demo\OVERCURRENT.cfg
Note that other .cfg files for viewing are located in the same directory.
3. When done, turn off hidden files and folders.
Figure 129: Demonstration file
View COMTRADE fileThe viewer provides a visual display of power systems data and relay operational data captured during a specific triggered event. It can display oscillography, phasors, harmonics, and actual values retrieved from the COMTRADE file.

110 ENERVISTA VIEWPOINT MONITORING – INSTRUCTION MANUAL
VIEW COMTRADE FILE CHAPTER 11: WAVEFORMS
Figure 130: COMTRADE file displayed in Viewpoint Monitoring
Files can be viewed that were downloaded automatically by Viewpoint Monitoring or that are available separately. Both methods are documented here. The toolbars and functions are explained at the end of the chapter.
The device needs to be configured in the Device Setup window to allow waveform retrieval.
Figure 131: Device configured to allow waveform retrieval
To view a COMTRADE file that was downloaded automatically:
1. In the main window of Viewpoint Monitoring, click the Waveforms option. The selection window opens.
2. Click the upper View option to open files that were downloaded automatically by Viewpoint Monitoring. If there are no such files to open, a message appears to that
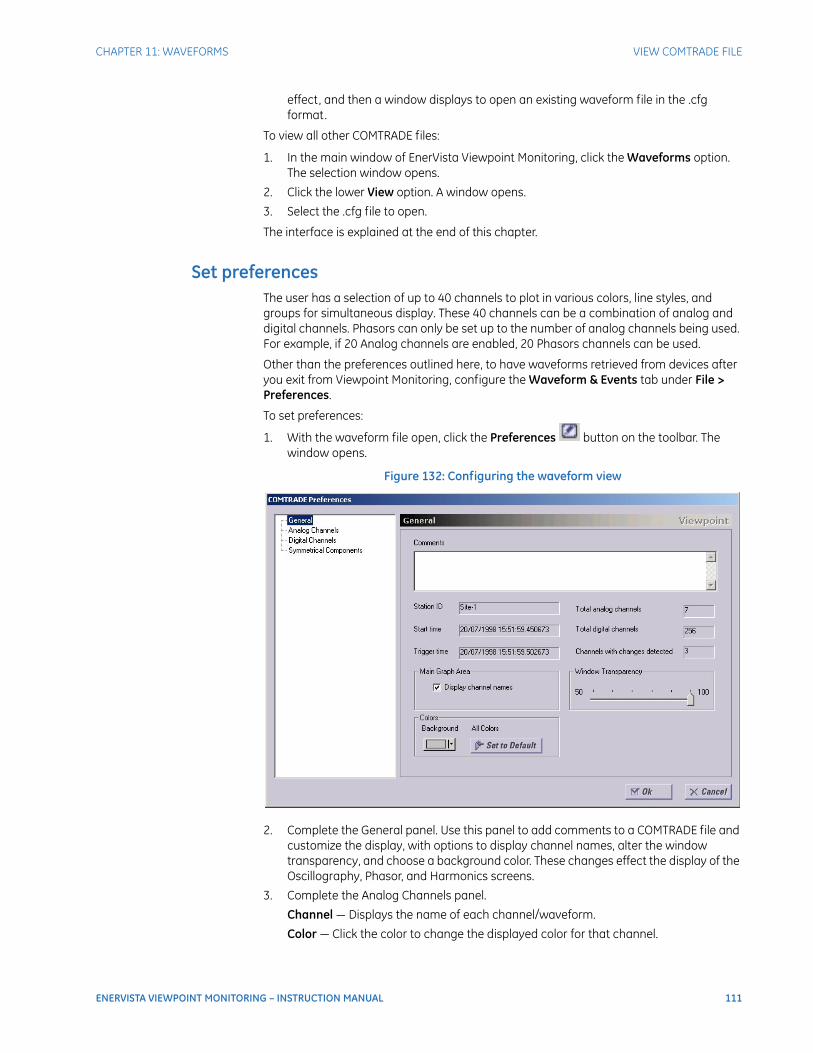
CHAPTER 11: WAVEFORMS VIEW COMTRADE FILE
ENERVISTA VIEWPOINT MONITORING – INSTRUCTION MANUAL 111
effect, and then a window displays to open an existing waveform file in the .cfg format.
To view all other COMTRADE files:
1. In the main window of EnerVista Viewpoint Monitoring, click the Waveforms option. The selection window opens.
2. Click the lower View option. A window opens.
3. Select the .cfg file to open.
The interface is explained at the end of this chapter.
Set preferencesThe user has a selection of up to 40 channels to plot in various colors, line styles, and groups for simultaneous display. These 40 channels can be a combination of analog and digital channels. Phasors can only be set up to the number of analog channels being used. For example, if 20 Analog channels are enabled, 20 Phasors channels can be used.
Other than the preferences outlined here, to have waveforms retrieved from devices after you exit from Viewpoint Monitoring, configure the Waveform & Events tab under File > Preferences.
To set preferences:
1. With the waveform file open, click the Preferences button on the toolbar. The window opens.
Figure 132: Configuring the waveform view
2. Complete the General panel. Use this panel to add comments to a COMTRADE file and customize the display, with options to display channel names, alter the window transparency, and choose a background color. These changes effect the display of the Oscillography, Phasor, and Harmonics screens.
3. Complete the Analog Channels panel.
Channel — Displays the name of each channel/waveform.
Color — Click the color to change the displayed color for that channel.
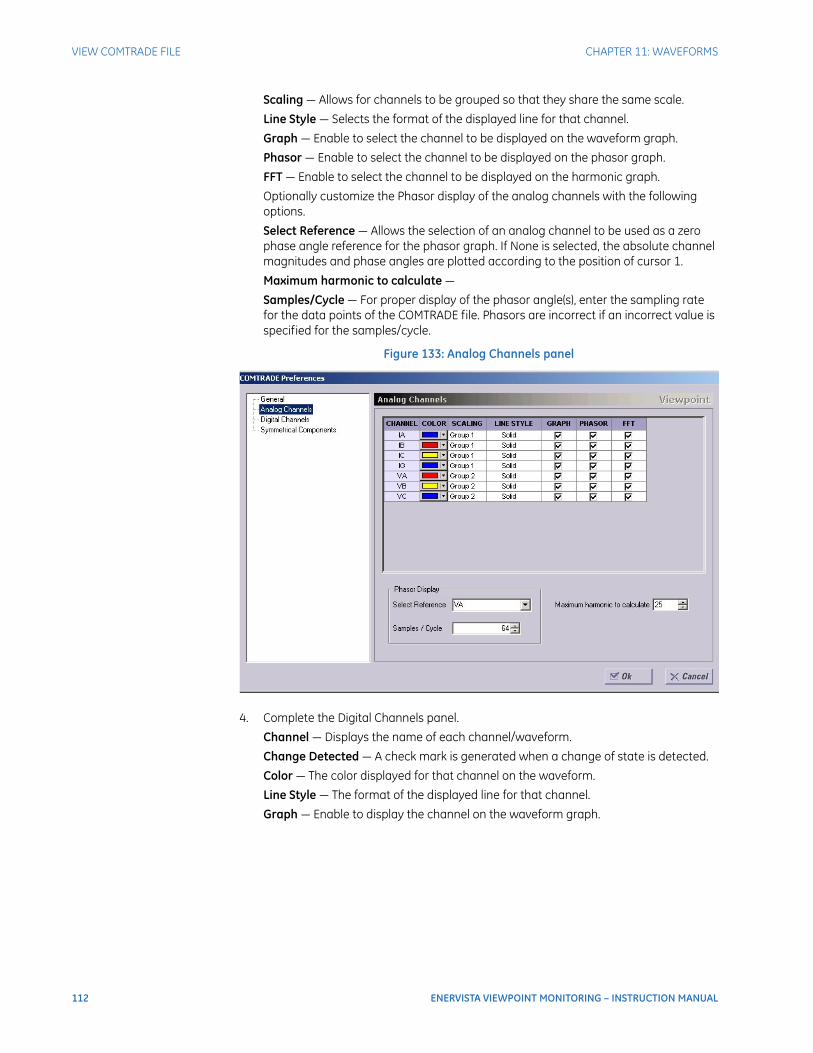
112 ENERVISTA VIEWPOINT MONITORING – INSTRUCTION MANUAL
VIEW COMTRADE FILE CHAPTER 11: WAVEFORMS
Scaling — Allows for channels to be grouped so that they share the same scale.
Line Style — Selects the format of the displayed line for that channel.
Graph — Enable to select the channel to be displayed on the waveform graph.
Phasor — Enable to select the channel to be displayed on the phasor graph.
FFT — Enable to select the channel to be displayed on the harmonic graph.
Optionally customize the Phasor display of the analog channels with the following options.
Select Reference — Allows the selection of an analog channel to be used as a zero phase angle reference for the phasor graph. If None is selected, the absolute channel magnitudes and phase angles are plotted according to the position of cursor 1.
Maximum harmonic to calculate —
Samples/Cycle — For proper display of the phasor angle(s), enter the sampling rate for the data points of the COMTRADE file. Phasors are incorrect if an incorrect value is specified for the samples/cycle.
Figure 133: Analog Channels panel
4. Complete the Digital Channels panel.
Channel — Displays the name of each channel/waveform.
Change Detected — A check mark is generated when a change of state is detected.
Color — The color displayed for that channel on the waveform.
Line Style — The format of the displayed line for that channel.
Graph — Enable to display the channel on the waveform graph.
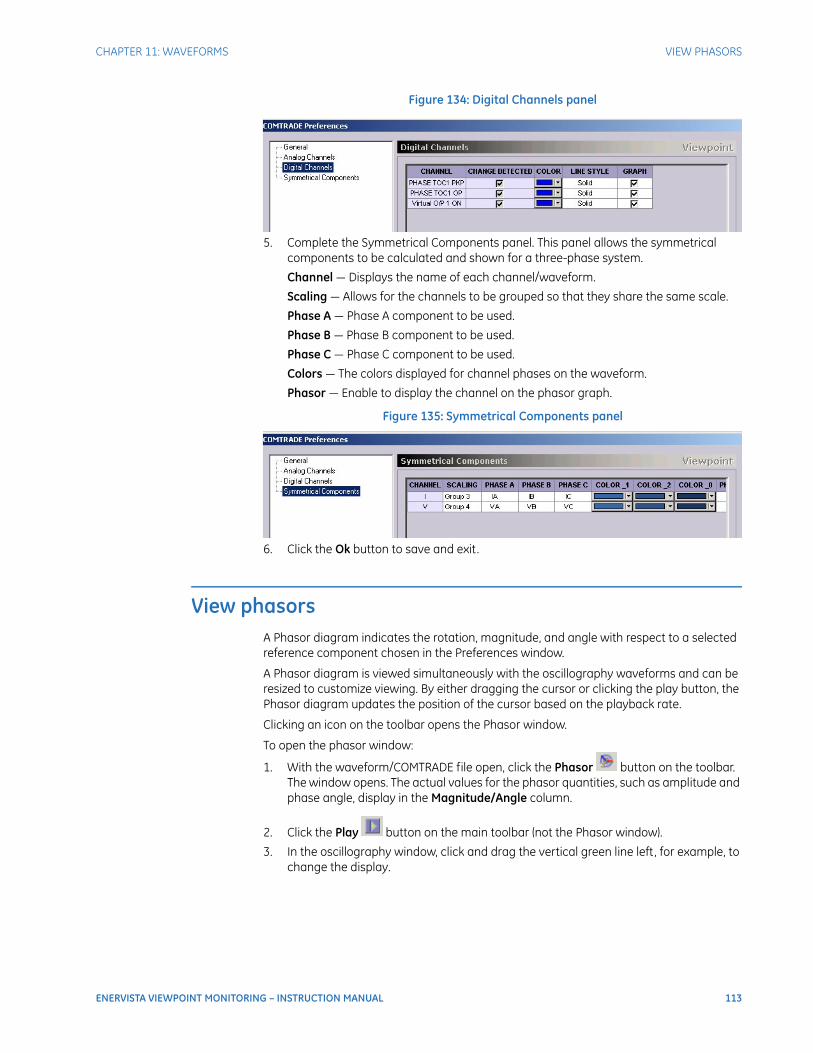
CHAPTER 11: WAVEFORMS VIEW PHASORS
ENERVISTA VIEWPOINT MONITORING – INSTRUCTION MANUAL 113
Figure 134: Digital Channels panel
5. Complete the Symmetrical Components panel. This panel allows the symmetrical components to be calculated and shown for a three-phase system.
Channel — Displays the name of each channel/waveform.
Scaling — Allows for the channels to be grouped so that they share the same scale.
Phase A — Phase A component to be used.
Phase B — Phase B component to be used.
Phase C — Phase C component to be used.
Colors — The colors displayed for channel phases on the waveform.
Phasor — Enable to display the channel on the phasor graph.
Figure 135: Symmetrical Components panel
6. Click the Ok button to save and exit.
View phasorsA Phasor diagram indicates the rotation, magnitude, and angle with respect to a selected reference component chosen in the Preferences window.
A Phasor diagram is viewed simultaneously with the oscillography waveforms and can be resized to customize viewing. By either dragging the cursor or clicking the play button, the Phasor diagram updates the position of the cursor based on the playback rate.
Clicking an icon on the toolbar opens the Phasor window.
To open the phasor window:
1. With the waveform/COMTRADE file open, click the Phasor button on the toolbar. The window opens. The actual values for the phasor quantities, such as amplitude and phase angle, display in the Magnitude/Angle column.
2. Click the Play button on the main toolbar (not the Phasor window).
3. In the oscillography window, click and drag the vertical green line left, for example, to change the display.

114 ENERVISTA VIEWPOINT MONITORING – INSTRUCTION MANUAL
VIEW HARMONICS CHAPTER 11: WAVEFORMS
Figure 136: Phasor window
The interface is explained at the end of this chapter.
View harmonicsThe Harmonics table lists the calculated percentage of total harmonic distortion (THD) due to each phase. The Preferences window can be used to change which values display on the harmonic diagram and the colors.
The harmonic spectrum is viewed simultaneously with the oscillography waveforms. Clicking an icon on the toolbar opens the window. The window can be resized.
To open the harmonics window:
1. With the waveform/COMTRADE file open, click the Harmonics button on the toolbar. The window opens.
2. Click the Play button on the main toolbar (not the Harmonics window).
3. In the oscillography window, by either dragging the green line or clicking the Cursor 1 or 2 button, the diagram updates to the corresponding position of the cursor.

CHAPTER 11: WAVEFORMS CONVERT WAVEFORM TO COMTRADE FILE
ENERVISTA VIEWPOINT MONITORING – INSTRUCTION MANUAL 115
Figure 137: Harmonics window
Convert waveform to COMTRADE fileThis function converts a CSV oscillography file into a COMTRADE file viewable by the COMTRADE viewer within Viewpoint Monitoring. GE Digital Energy products that create CSV oscillography files include 369PC, 469PC, 489PC, 745PC, 750/760PC, PQMPC, and PQMIIPC.
If converted into an ASCII data file, an oscillography COMTRADE (.cfg) file can be readable by spreadsheet applications.
You specify the CSV file, the name for the resulting COMTRADE file, and configure the COMTRADE file.
Waveform files from third-party devices are not supported.
To convert a CSV file to a COMTRADE file:
1. In the main Viewpoint Monitoring window, click the Waveforms option. The selection window opens.
2. Click the Convert option. The window opens.
3. Complete the fields.

116 ENERVISTA VIEWPOINT MONITORING – INSTRUCTION MANUAL
CONVERT WAVEFORM TO COMTRADE FILE CHAPTER 11: WAVEFORMS
Figure 138: Converting a file
Select Source CSV File — Click the ... browse button and select the .csv file to convert.
Select Destination COMTRADE file — Enter the name and destination of the output file. Use the ... browse button to navigate.
Format of COMTRADE Data file — Select ASCII to save the files in a text format and view them as a spreadsheet. Select Binary to save smaller files that are viewable only in the COMTRADE viewer.
CT Configuration — Specify the current transformer (CT) ratios for the phase and ground CTs for the current channels. The CSV file displays only Primary values, but COMTRADE has support for displaying current information in either Primary or Secondary quantities. Locate this information for a GE device in its EnerVista software under Settings > System Setup > AC Inputs > Current.
VT Configuration — Specify the voltage transformer (VT) ratio for the voltage channels. The CSV file displays only Primary values, but COMTRADE has support for displaying voltage information in either Primary or Secondary quantities. Locate this information for a GE device in its EnerVista software under Settings > System Setup > AC Inputs > Voltage.
Line Frequency — Specify the line frequency at which the CSV information was recorded. The line frequency is the frequency for electrical currents and plugs used in countries, which is 60 Hz in North America and 50 Hz in Europe, for example. Electrical line frequency by country can be looked up on the Internet.
Open in COMTRADE Viewer — Enable the check box to view the COMTRADE file after it is created. Disable to convert the file and not view it.
4. Click the Convert button in the window to convert and exit. If the file is a .csv file but not a waveform file, a message appears to that effect. With conversion, a .CFG file results. When the option to open the file is selected, the viewer launches.

CHAPTER 11: WAVEFORMS MERGE COMTRADE FILES
ENERVISTA VIEWPOINT MONITORING – INSTRUCTION MANUAL 117
Merge COMTRADE filesThe convert utility converts a CSV oscillography file into a COMTRADE file viewable by COMTRADE viewer. If converted into an ASCII Data file, an oscillography COMTRADE (.cfg) file can be readable by spreadsheet applications. Such files can be merged.
To merge CFG files:
1. In the main Viewpoint Monitoring window, click the Waveforms option. The window opens.
2. Click the Merge option. A wizard opens.
3. Complete the fields.
Figure 139: Merging files
Select 1 or 2 COMTRADE files — Click the ... browse button and select the .cfg files to merge. The first COMTRADE file entered in the list is considered the reference file, which determines the start time and trigger time of the merged file.
Select Destination COMTRADE file — Enter the name and destination of the output file. Use the ... browse button to navigate.
Format of COMTRADE Data file — Select ASCII to save the files in a text format and view them as a spreadsheet. Select Binary to save smaller files that are viewable only in the COMTRADE viewer.
Click the Next button. The wizard advances.
4. Complete the fields.
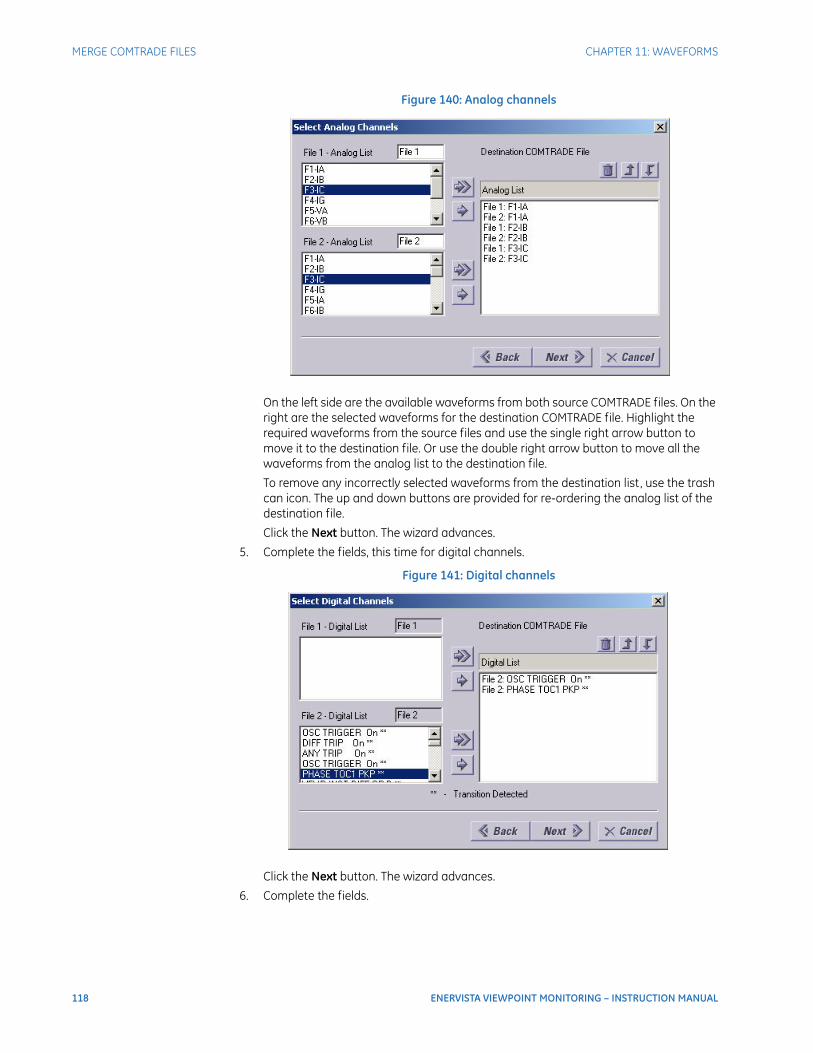
118 ENERVISTA VIEWPOINT MONITORING – INSTRUCTION MANUAL
MERGE COMTRADE FILES CHAPTER 11: WAVEFORMS
Figure 140: Analog channels
On the left side are the available waveforms from both source COMTRADE files. On the right are the selected waveforms for the destination COMTRADE file. Highlight the required waveforms from the source files and use the single right arrow button to move it to the destination file. Or use the double right arrow button to move all the waveforms from the analog list to the destination file.
To remove any incorrectly selected waveforms from the destination list, use the trash can icon. The up and down buttons are provided for re-ordering the analog list of the destination file.
Click the Next button. The wizard advances.
5. Complete the fields, this time for digital channels.
Figure 141: Digital channels
Click the Next button. The wizard advances.
6. Complete the fields.
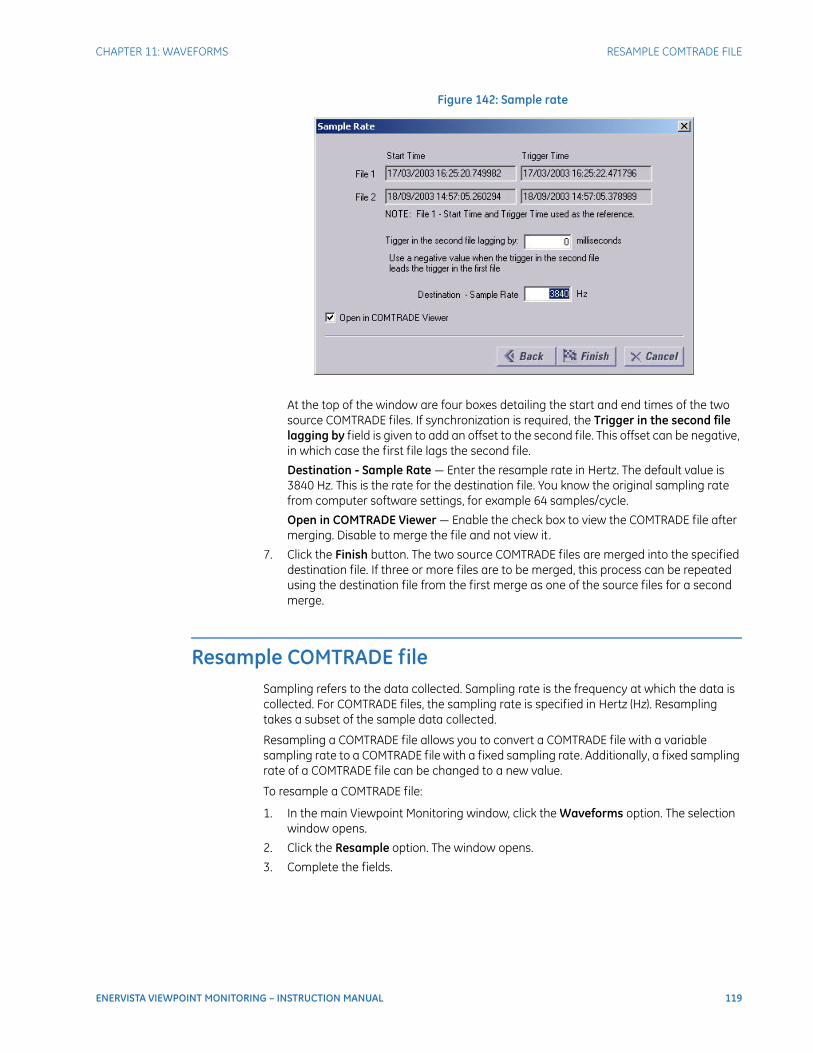
CHAPTER 11: WAVEFORMS RESAMPLE COMTRADE FILE
ENERVISTA VIEWPOINT MONITORING – INSTRUCTION MANUAL 119
Figure 142: Sample rate
At the top of the window are four boxes detailing the start and end times of the two source COMTRADE files. If synchronization is required, the Trigger in the second file lagging by field is given to add an offset to the second file. This offset can be negative, in which case the first file lags the second file.
Destination - Sample Rate — Enter the resample rate in Hertz. The default value is 3840 Hz. This is the rate for the destination file. You know the original sampling rate from computer software settings, for example 64 samples/cycle.
Open in COMTRADE Viewer — Enable the check box to view the COMTRADE file after merging. Disable to merge the file and not view it.
7. Click the Finish button. The two source COMTRADE files are merged into the specified destination file. If three or more files are to be merged, this process can be repeated using the destination file from the first merge as one of the source files for a second merge.
Resample COMTRADE fileSampling refers to the data collected. Sampling rate is the frequency at which the data is collected. For COMTRADE files, the sampling rate is specified in Hertz (Hz). Resampling takes a subset of the sample data collected.
Resampling a COMTRADE file allows you to convert a COMTRADE file with a variable sampling rate to a COMTRADE file with a fixed sampling rate. Additionally, a fixed sampling rate of a COMTRADE file can be changed to a new value.
To resample a COMTRADE file:
1. In the main Viewpoint Monitoring window, click the Waveforms option. The selection window opens.
2. Click the Resample option. The window opens.
3. Complete the fields.

120 ENERVISTA VIEWPOINT MONITORING – INSTRUCTION MANUAL
TOOLBAR AND BUTTONS CHAPTER 11: WAVEFORMS
Figure 143: Changing the sampling rate
Select Source COMTRADE file — Click the ... browse button and select the .cfg file to resample.
Select Destination COMTRADE file — Enter the name and destination of the output file. Use the ... browse button to navigate.
Format of COMTRADE Data file — Select ASCII to save the files in a text format and view them as a spreadsheet. Select Binary to save smaller files that are viewable only in the COMTRADE viewer.
Destination - Sample Rate — Enter the resample rate in Hertz. The default value is 3840 Hz. You know the original sampling rate from computer software settings, for example 64 samples/cycle.
Open in COMTRADE Viewer — Enable the check box to view the COMTRADE file after it is created. Disable to resample the file and not view it.
4. Click the Resample button in the window to resample and exit. When the option to open the file is selected, the viewer launches.
Toolbar and buttonsThis section explains the waveform viewer and the phasor window.
Toolbar
Open Opens/loads an existing COMTRADE file (.CFG)
Save Saves current .CFG file with existing file name. If a file name has not been specified, the software prompts you to name it.
Print Prints the waveform
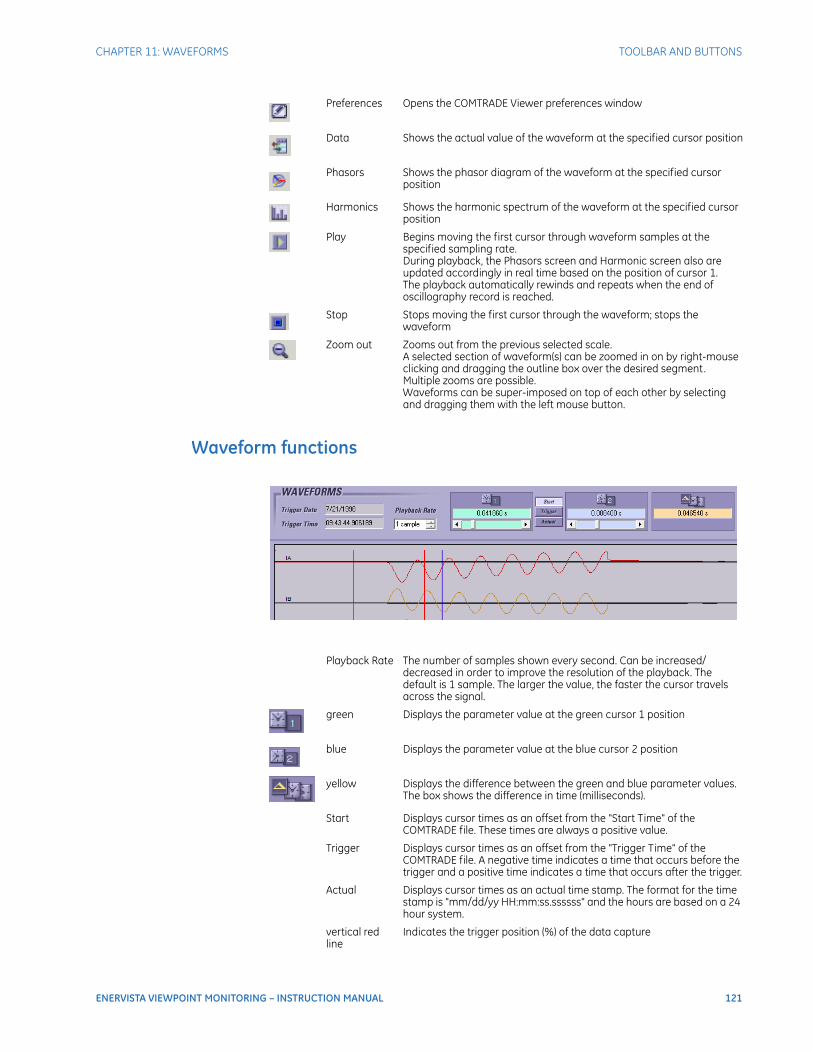
CHAPTER 11: WAVEFORMS TOOLBAR AND BUTTONS
ENERVISTA VIEWPOINT MONITORING – INSTRUCTION MANUAL 121
Waveform functions
Preferences Opens the COMTRADE Viewer preferences window
Data Shows the actual value of the waveform at the specified cursor position
Phasors Shows the phasor diagram of the waveform at the specified cursor position
Harmonics Shows the harmonic spectrum of the waveform at the specified cursor position
Play Begins moving the first cursor through waveform samples at the specified sampling rate.During playback, the Phasors screen and Harmonic screen also are updated accordingly in real time based on the position of cursor 1.The playback automatically rewinds and repeats when the end of oscillography record is reached.
Stop Stops moving the first cursor through the waveform; stops the
waveform
Zoom out Zooms out from the previous selected scale.A selected section of waveform(s) can be zoomed in on by right-mouse clicking and dragging the outline box over the desired segment. Multiple zooms are possible.Waveforms can be super-imposed on top of each other by selecting and dragging them with the left mouse button.
Playback Rate The number of samples shown every second. Can be increased/decreased in order to improve the resolution of the playback. The default is 1 sample. The larger the value, the faster the cursor travels across the signal.
green Displays the parameter value at the green cursor 1 position
blue Displays the parameter value at the blue cursor 2 position
yellow Displays the difference between the green and blue parameter values. The box shows the difference in time (milliseconds).
Start Displays cursor times as an offset from the "Start Time" of the COMTRADE file. These times are always a positive value.
Trigger Displays cursor times as an offset from the "Trigger Time" of the COMTRADE file. A negative time indicates a time that occurs before the trigger and a positive time indicates a time that occurs after the trigger.
Actual Displays cursor times as an actual time stamp. The format for the time stamp is "mm/dd/yy HH:mm:ss.ssssss" and the hours are based on a 24 hour system.
vertical red line
Indicates the trigger position (%) of the data capture
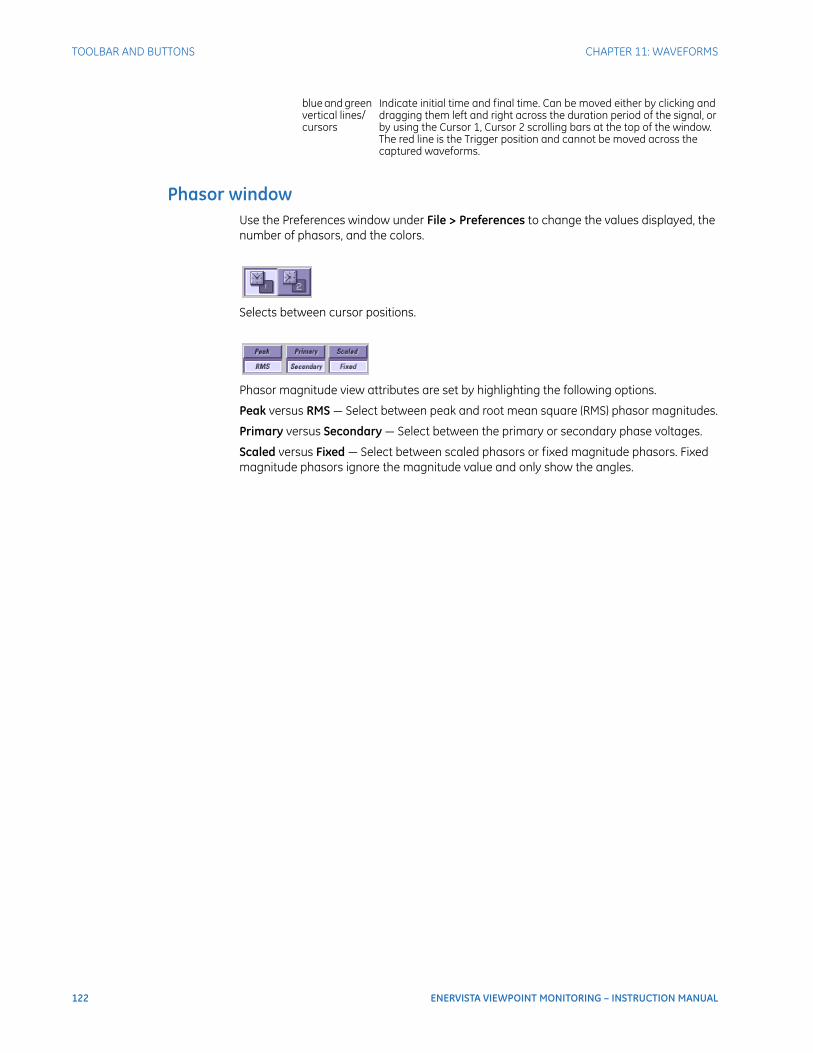
122 ENERVISTA VIEWPOINT MONITORING – INSTRUCTION MANUAL
TOOLBAR AND BUTTONS CHAPTER 11: WAVEFORMS
Phasor windowUse the Preferences window under File > Preferences to change the values displayed, the number of phasors, and the colors.
Selects between cursor positions.
Phasor magnitude view attributes are set by highlighting the following options.
Peak versus RMS — Select between peak and root mean square (RMS) phasor magnitudes.
Primary versus Secondary — Select between the primary or secondary phase voltages.
Scaled versus Fixed — Select between scaled phasors or fixed magnitude phasors. Fixed magnitude phasors ignore the magnitude value and only show the angles.
blue and green vertical lines/cursors
Indicate initial time and final time. Can be moved either by clicking and dragging them left and right across the duration period of the signal, or by using the Cursor 1, Cursor 2 scrolling bars at the top of the window. The red line is the Trigger position and cannot be moved across the captured waveforms.

ENERVISTA VIEWPOINT MONITORING – INSTRUCTION MANUAL 123
EnerVista Viewpoint Monitoring
Chapter 12: Administration
Administration
This chapter outlines passwords, users, groups, and Remote Desktop Services. See the Quickstart Guide and the Device Setup chapter for device management.
This chapter outlines the following:
• Default passwords
• Password rules
• Administrator user account and group
• Guest user account and group
• Turn login on and off
• Manage password
• Lost password
• Manage user accounts
• Manager user groups
• Remote Desktop Services for troubleshooting
IntroductionAdministration is performed in several windows in Viewpoint Monitoring.
By default, no login or password are required to open and use Viewpoint Monitoring, there are Administrator and guest user accounts, and there are three user groups.
Upon installation of Viewpoint Monitoring, the change password window appears repeatedly when accessing some functions for as long as the Administrator password remains at the default of "password".
Permissions to various functions in Viewpoint Monitoring first are set on a group level, then on an individual basis as a subset of the group permissions.
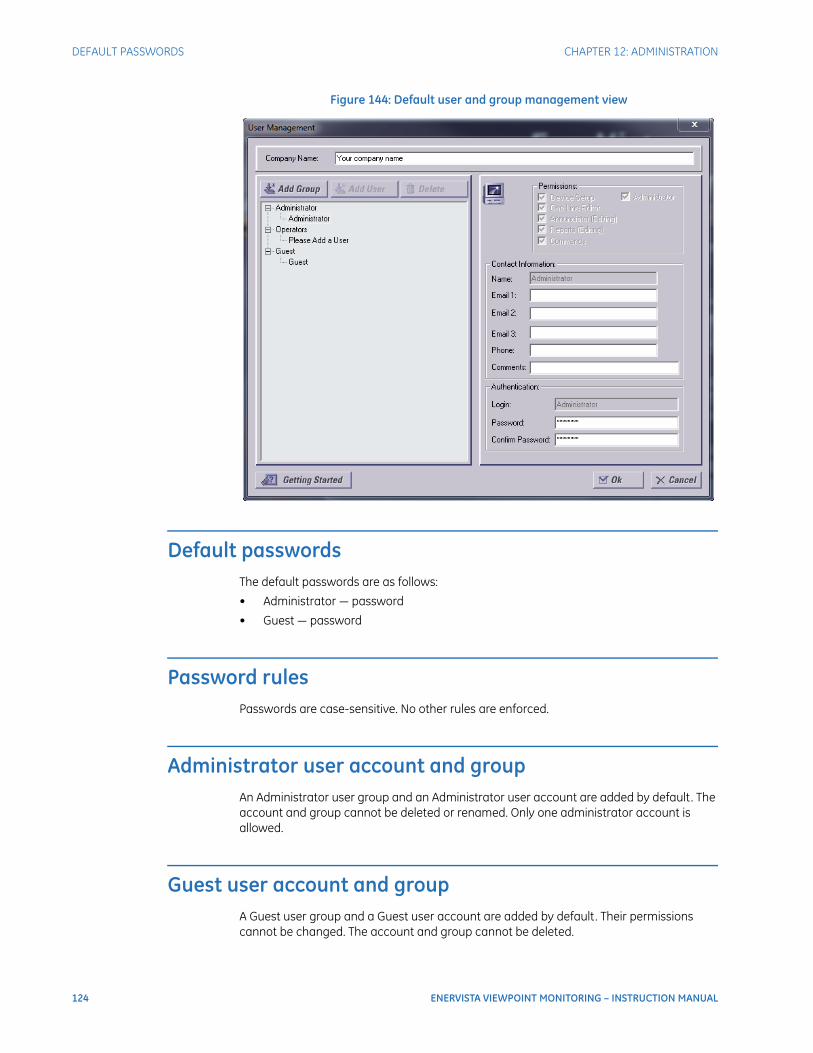
124 ENERVISTA VIEWPOINT MONITORING – INSTRUCTION MANUAL
DEFAULT PASSWORDS CHAPTER 12: ADMINISTRATION
Figure 144: Default user and group management view
Default passwordsThe default passwords are as follows:
• Administrator — password
• Guest — password
Password rulesPasswords are case-sensitive. No other rules are enforced.
Administrator user account and groupAn Administrator user group and an Administrator user account are added by default. The account and group cannot be deleted or renamed. Only one administrator account is allowed.
Guest user account and groupA Guest user group and a Guest user account are added by default. Their permissions cannot be changed. The account and group cannot be deleted.

CHAPTER 12: ADMINISTRATION TURN LOGIN ON AND OFF
ENERVISTA VIEWPOINT MONITORING – INSTRUCTION MANUAL 125
The Guest user account becomes active when you set Viewpoint Monitoring to require login. There is also a separate access mode with limited functions, as outlined here.
To turn Guest use on or off:
1. In the main window of Viewpoint Monitoring, click File > Preferences. The window opens.
2. Set the security to FULL or Enhanced.
FULL — Users must log in at startup, in this case with the Guest user account.
Enhanced — Users receive limited privileges at startup, without login. Access is granted to the IED Dashboard, Waveforms, and viewing in One-Line Viewer, Annunciator, Events, and Trending Reports. A user can then log in to receive additional permissions assigned to their user account, such as full access to the One-Line Editor or Annunciator.
3. Click the Ok button to save and exit.
To exit from Enhanced mode, click Tools > Administration > Login User and log in as Administrator, for example.
Figure 145: Active options when Enhanced access set in preferences
Turn login on and offThe requirement to enter a user name and password can be turned on an off and over-rides any authentication configuration in the user account setup. For example, if you enter a user name and password for a user account, the user is not required to log in unless ViewPoint Monitoring is configured to force login.
This configuration is done in the Security tab under File > Preferences. See the Security section on page 13.
Manage passwordBy default, no password is required to open and use Viewpoint Monitoring. The software prompts for the Administrator password to be set before access to user account management is allowed. This window continues to appear as long as the Administrator password remains at the default of "password". You can simply re-enter this password to continue use without resetting the password, but the window re-appears with next access.

126 ENERVISTA VIEWPOINT MONITORING – INSTRUCTION MANUAL
MANAGE PASSWORD CHAPTER 12: ADMINISTRATION
The setting in the Security tab under File > Preferences determines if users are actually required to login, regardless of any passwords set.
Set passwordTo set the password immediately after installation:
1. In the main Viewpoint Monitoring window, click the Administration option. The Set Password window opens. A password appears in the Enter Old Password field even when one has not yet been set.
2. Enter the password in the two password fields. Passwords are case-sensitive and no other rules are enforced.
3. Add a question and answer to use when you forget or lose the password. Examples of questions are what make was your first car, what is your mother’s maiden name, and what is your favorite color.
The window shown here is the one that appears repeatedly as long as the Administrator password remains at the default.
Figure 146: Password window
4. Click the Change button. The password and security question are set, and the user management window opens.
Change passwordTo change the set password:
1. In the main Viewpoint Monitoring window, click Tools > Administration > Change Password. The Change Password window opens.
2. Enter the existing password in the field. Other fields do not become active until the correct password is entered. When the fields do become active, the existing security question and answer display.
3. Enter the new password in the two new password fields. Passwords are case-sensitive and no other rules are enforced.
4. Leave or change question and answer to use when you forget or lose the password. Examples of questions are what make was your first car, what is your mother’s maiden name, and what is your favorite color.

CHAPTER 12: ADMINISTRATION LOST PASSWORD
ENERVISTA VIEWPOINT MONITORING – INSTRUCTION MANUAL 127
5. Click the Change button. The password and security question are set, and the window closes.
Lost passwordThe default passwords for the Administrator and Guest are "password".
For user accounts other than Guest, there is a Forget your password? button to click in the login window if you forget your password. This allows you to answer whatever security question was set for your user account.
If these methods do not work and you are locked out of the software, contact GE Digital Energy technical support as outlined in the For further assistance section on page 1. There is a procedure to default the passwords.
Figure 147: Login window
Manage user accountsBy default, there is an Administrator account that is included in an Administrator group. Neither can be deleted. Only one administrate account is allowed, and its name cannot be changed.
The three types of user accounts are described as follows:
• Administrator — All access
• User account — Specified permissions for viewing or modifying functions
• Guest — View-only. Cannot modify any functions or acknowledge any alarms. No permissions can be set for guests.
Upon installation, the software prompts for the Administrator password to be set before access to user account management is allowed. This window continues to appear as long as the Administrator password remains at the default of "password". You can simply re-enter this password to continue use without resetting the password, but the window re-appears with next access.
Permissions to various functions in Viewpoint Monitoring first are set on a group level, then on an individual basis as a subset of the group permissions. For example, if a group has permission to three of four functions, a user account in the group can have permission to three or fewer functions.
The setting in the Security tab under File > Preferences determines if users are required to login, regardless of any passwords set at the user account level.

128 ENERVISTA VIEWPOINT MONITORING – INSTRUCTION MANUAL
MANAGE USER ACCOUNTS CHAPTER 12: ADMINISTRATION
Add user accountTo add a user account:
1. In the main window of Viewpoint Monitoring, click the Administration option or click Tools > Administration > User Management . The user management window opens.
2. Click and expand a group on the left side of the window, for example Operators. You cannot add a user to the Administrator or Guest groups.
3. Click the Add User button. The panel displays on the right side.
4. Configure the user account on the right side of the panel. For the permissions, all or a subset of the permissions granted at the group level can be granted. All four permission entries appear only when configured as such for the group.
Figure 148: User account settings
One-Line Editor — Enable to allow access to the One-Line Editor in which to draw diagrams for control and monitoring of devices.
Annunciator — Enable to allow access to the Annunciator, to set and manage alarms and alerts.
Reports — Enable to allow access to the Trending Reports, to view and archive data.
Commands — Enable to allow the user to send commands to devices. For the N60 example shown as follows, the user can click the Reset button. (This view is accessed by clicking the Dashboard button on a device in the IED Dashboard.) When the user is not allowed to send commands, the button is inactive/disabled.

CHAPTER 12: ADMINISTRATION MANAGE USER ACCOUNTS
ENERVISTA VIEWPOINT MONITORING – INSTRUCTION MANUAL 129
Figure 149: Reset button command example
Name — The name of the user account, for example John Smith.
Email 1, 2, 3 — Optionally enter email address(es) for the user account. The address here has nothing to do with email addresses entered in the Annunciator for alarm notification. The email address(es) are for reference only.
Phone — Optionally enter a telephone number for the user.
Comments — Optionally enter information about the user, such as job function, location, employment status.
Login — Enter a user name for logging in to the user account. A random default is provided, such as User458923732, which can be overwritten.
Password — Enter a password for logging in to the user account, overwriting the default entered.
Confirm Password — Re-enter the password.
Changes are saved in real-time when you click into another panel; you do not need to click the Ok button, which exits from the window.
5. Record the user name and password, and provide them to the user.
6. When done working in the panel for all users and groups, click the Ok button to exit.
Update user accountTo update a user account:
1. In the User Management window, select the user account.
2. Enter the changes on the right side of the panel. The Administrator or Guest account name cannot be changed.
3. Click the OK button to exit.
130 ENERVISTA VIEWPOINT MONITORING – INSTRUCTION MANUAL
MANAGE USER GROUPS CHAPTER 12: ADMINISTRATION
Delete user accountTo delete a user account:
1. In the User Management window, select the user account. Or select a group to deleted all user accounts in the group and the group itself.
2. Click the Delete button. The button is inactive for the Administrator and Guest user accounts because they cannot be deleted.
3. Confirm the deletion. The user account is deleted. This action cannot be reversed.
4. Click the OK button to exit.
Manage user groupsBy default, there is an Administrator account that is included in an Administrator group. Neither can be deleted.
Upon installation, the software prompts for the Administrator password to be set before access to user account management is allowed. This window continues to appear as long as the Administrator password remains at the default of "password". You can simply re-enter this password to continue use without resetting the password, but the window re-appears with next access.
Permissions to various functions in Viewpoint Monitoring first are set on a group level, then on an individual basis as a subset of the group permissions. For example, if a group has permission to three of four functions, a user in the group can have permission to three or fewer functions.
Add groupTo add a group:
1. In the main window of Viewpoint Monitoring, click the Administration option or click Tools > Administration > User Management . The user management window opens.
2. Click the Add Group button. A group is added at the bottom of the list; subgroups cannot be added to existing groups.
3. Configure the group on the right side of the panel.
Name — The name of the user group, for example Technicians.
Comments — Optionally add information about the group, such as location or type of employee included in the group.
One-Line Editor — Enable to allow access to the One-Line Editor in which to draw diagrams for control and monitoring of devices.
Annunciator — Enable to allow access to the Annunciator, to set and manage alarms and alerts.
Reports — Enable to allow access to the Trending Reports, to view and archive data.
Commands — Enable to allow the user to send commands to devices, for example click a Reset button in the IED Dashboard of a device.
Changes are saved in real-time when you click into another panel; you do not need to click the Ok button, which exits from the window.
4. Add a user to the group by clicking the Please Add a User entry on the left side of the window, and enter the information as outlined previously.
5. When done working in the panel for all users and groups, click the Ok button to exit.

CHAPTER 12: ADMINISTRATION REMOTE DESKTOP SERVICES FOR TROUBLESHOOTING
ENERVISTA VIEWPOINT MONITORING – INSTRUCTION MANUAL 131
Update groupTo update a group:
1. In the User Management window, select the group.
2. Enter the changes on the right side of the panel.
The Administrator or Guest group name cannot be changed.
If you disable any permissions that apply to user accounts in the group, the user accounts are also affected. This can mean that some user accounts have no permissions assigned to them, for example you disable the One-Line Editor permission and a user with access to only that one function no longer has permissions assigned to them.
3. Click the OK button to exit.
Delete groupTo delete a group:
1. In the User Management window, select the group.
2. Click the Delete button. The button is inactive for the Administrator and Guest groups because they cannot be deleted.
3. Confirm the deletion. The user accounts and group are deleted. This action cannot be reversed.
4. Click the OK button to exit.
Remote Desktop Services for troubleshootingWhen Viewpoint Monitoring is installed on a Windows 2008 Server computer, Windows Remote Desktop Services (formerly Terminal Services) can be used. Remote Desktop Services includes remote control of user computers with the Remote Desktop Connection application in Windows, which is useful for troubleshooting.
You can run the service over the Internet with the Windows Remote Desktop Connection application. Four concurrent connections to Viewpoint Monitoring are available. Since multiple users can run Viewpoint Monitoring on the same machine, to avoid concurrency conflicts, adhere to the following rules:
• One instance of Viewpoint Monitoring — Master instance, always run locally on the Windows 2008 Server computer
• Administration including Preferences handling and License Management are not available on Remote Desktop Services
• ViewNode support management is not available on Remote Desktop Services
• Custom File Editor and Formula Editor are not available on Remote Desktop Services
• Device Setup is not available on Remote Desktop Services. All devices must be configured only in the master instance.
• Watchdog Service does not restart Viewpoint Monitoring on Remote Desktop
• Reports can be configured, run, and stopped only in the master instance. Reports on Remote Desktop Services are available in a viewing mode.
• Events and Waveforms can be configured only in the master instance. On Remote Desktop Services, they are available in view mode.
• One-Line Editor and Viewer as well as Annunciator are available for configuring and viewing both locally and in Remote Desktop Services
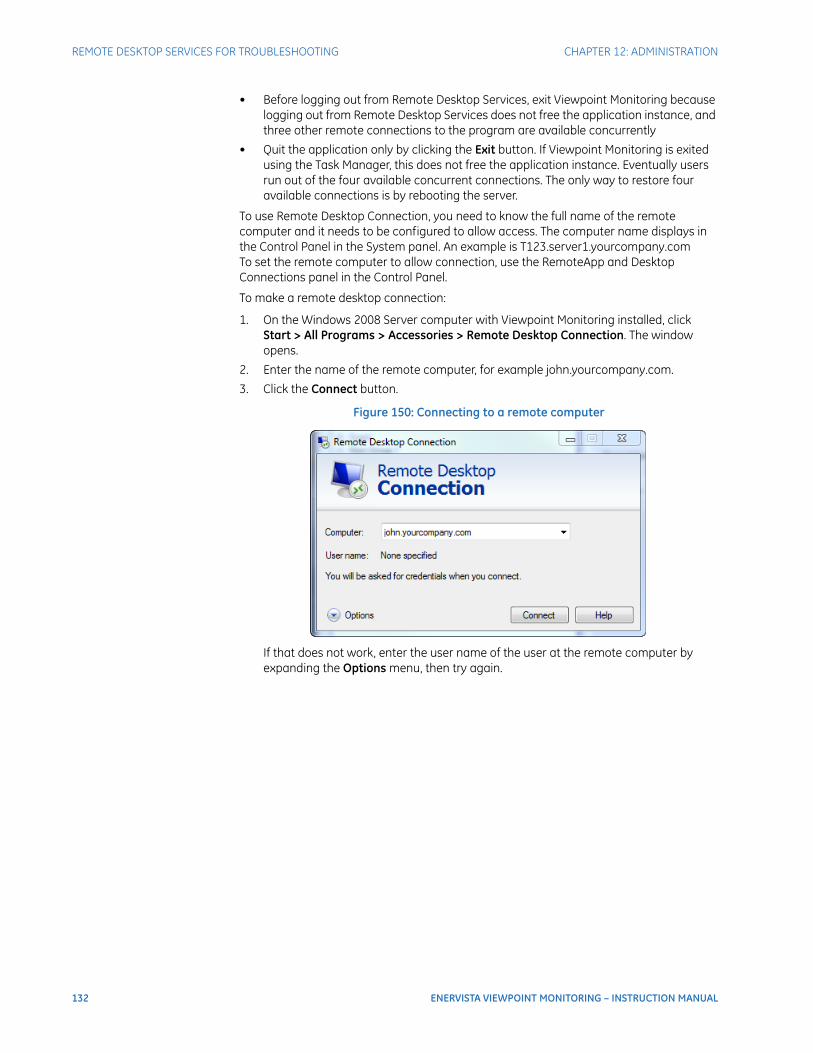
132 ENERVISTA VIEWPOINT MONITORING – INSTRUCTION MANUAL
REMOTE DESKTOP SERVICES FOR TROUBLESHOOTING CHAPTER 12: ADMINISTRATION
• Before logging out from Remote Desktop Services, exit Viewpoint Monitoring because logging out from Remote Desktop Services does not free the application instance, and three other remote connections to the program are available concurrently
• Quit the application only by clicking the Exit button. If Viewpoint Monitoring is exited using the Task Manager, this does not free the application instance. Eventually users run out of the four available concurrent connections. The only way to restore four available connections is by rebooting the server.
To use Remote Desktop Connection, you need to know the full name of the remote computer and it needs to be configured to allow access. The computer name displays in the Control Panel in the System panel. An example is T123.server1.yourcompany.comTo set the remote computer to allow connection, use the RemoteApp and Desktop Connections panel in the Control Panel.
To make a remote desktop connection:
1. On the Windows 2008 Server computer with Viewpoint Monitoring installed, click Start > All Programs > Accessories > Remote Desktop Connection. The window opens.
2. Enter the name of the remote computer, for example john.yourcompany.com.
3. Click the Connect button.
Figure 150: Connecting to a remote computer
If that does not work, enter the user name of the user at the remote computer by expanding the Options menu, then try again.
ENERVISTA VIEWPOINT MONITORING – INSTRUCTION MANUAL 133
EnerVista Viewpoint Monitoring
Chapter 13: Remote computers
Remote computers
This chapter outlines how to add computers for remote viewing of Viewpoint Monitoring windows.
• Set up Viewpoint Monitoring for remote access
• Install remote access client software on a computer
• Access Viewpoint Monitoring remotely
• Uninstall remote access client software
• Remote computer interface
IntroductionViewpoint Monitoring is installed on a computer that is used to set up, view, and control devices. In addition, the option exists to install remote viewer capability on other computers. This means that other computers can be used to access One-Line diagrams, for example, but not have administration access. The remote computer and function is referred to as a ViewNode.
Remote computers are added by installing ViewNode client software on them. There are no additional licensing requirements; any number of remote computers can be added.
The approach is to configure support for the service in Viewpoint Monitoring, then install the ViewNode client software on a remote computer.
Trial versionWhen using the trial version of the ViewNode software, access is limited to 15 days.
Set up Viewpoint Monitoring for remote accessWhile the Viewpoint Monitoring software is installed on a computer and managed from that computer, other computers can be added to the system for remote viewing of information. A remote computer and the function are referred to as a ViewNode.

134 ENERVISTA VIEWPOINT MONITORING – INSTRUCTION MANUAL
SET UP VIEWPOINT MONITORING FOR REMOTE ACCESS CHAPTER 13: REMOTE COMPUTERS
Viewpoint Monitoring supports multiple ViewNodes remotely connecting to it and viewing its published One-Line diagrams, Annunciator panels, Trending Reports, Waveforms, and Events. A maximum of 10 ViewNodes are allowed to connect to a single Viewpoint Monitoring system at one time.
Communication between Viewpoint Monitoring and ViewNodes is HTTP-based. The default HTTP port 80 is used. If you have trouble with any procedures outlined here, consult your system administrator to have your Viewpoint Monitoring system accessible from the Internet.
The ViewNode software needs to be installed on the remote computer. Other than provision on the CD, the ViewNode software can be downloaded from the Internet. No additional licensing is required to use the ViewNode client software.
ViewNode Support on the Viewpoint Monitoring computer requires Microsoft .NET Framework 2.0. This is because the XML-DA web service is a Microsoft .NET 2.0 based web application. If .NET Framework 2.0 is not present, it is installed when Viewpoint Monitoring installs.
You configure support for the service in Viewpoint Monitoring, then install the ViewNode client software on a remote computer.
Software requirements for Viewpoint MonitoringMicrosoft Internet Services Manager (IIS) is required to use remote workstations. It needs to be installed on the host computer only, meaning the computer with Viewpoint Monitoring already installed.
To check if Internet Services Manager (IIS) is installed:
1. On the computer with Viewpoint Monitoring installed, click Start > Control Panel and open the Programs and Features. The window opens.
2. Click the Turn Windows features on or off option on the left side. At the prompt, allow the program to make changes to the computer. A window opens.
3. Scroll down. Check if the Internet Information Services check box is colored or enabled. (See the following figure.)
If yes, expand the entry, then the World Wide Web Services folder, then the Application Development Features folder, and check if ASP.NET is installed.
If no (both IIS and ASP.NET are not installed), install them as outlined in the next procedure.
To install Internet Services Manager (IIS):
1. Close Viewpoint Monitoring.
2. In the Programs and Features window outlined, click the Turn Windows features on or off option on the left side. At the prompt, allow the program to make changes to the computer. A window opens.
3. Scroll down and expand the Internet Information Services entry.
4. Expand the World Wide Web Services entry.
5. Enable the Internet Information Services and ASP.NET options. Leave the other default selections as is. A colored box without a check mark indicates that the function is selected and some but not all features selected; this is okay.
6. Click the OK button to install, and restart the computer at the prompt. Internet Information Services installs. Continue with the next section to configure Viewpoint Monitoring in the wizard.
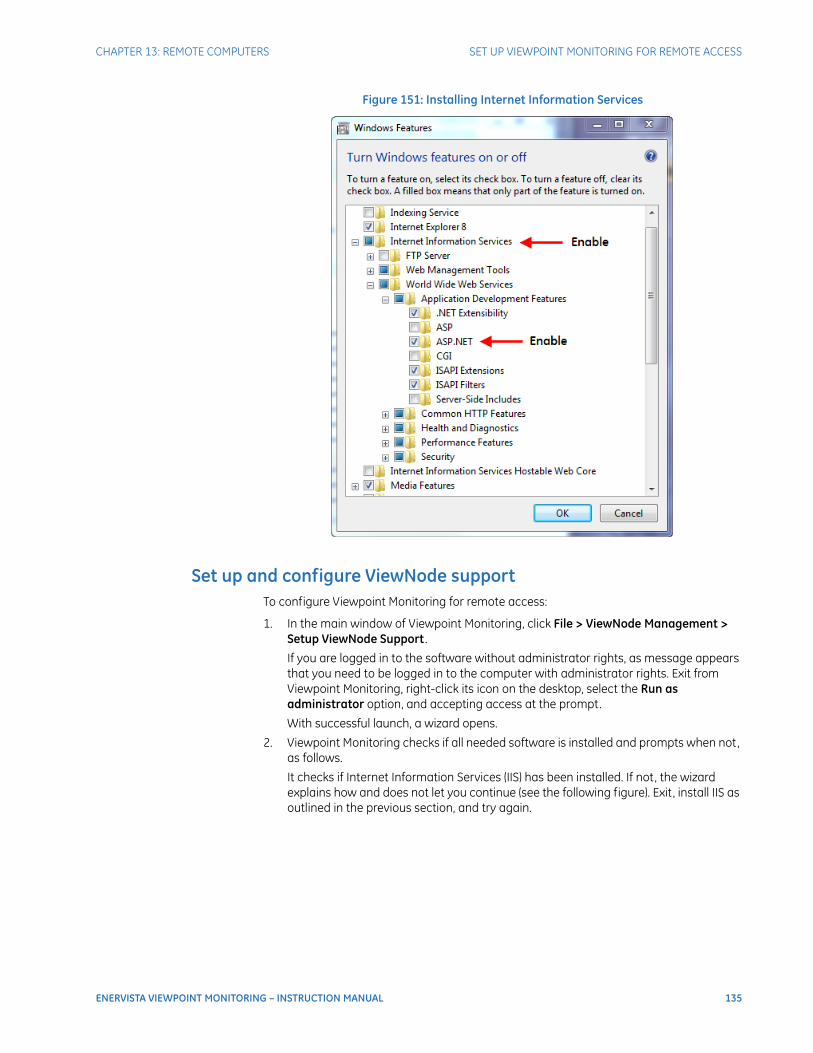
CHAPTER 13: REMOTE COMPUTERS SET UP VIEWPOINT MONITORING FOR REMOTE ACCESS
ENERVISTA VIEWPOINT MONITORING – INSTRUCTION MANUAL 135
Figure 151: Installing Internet Information Services
Set up and configure ViewNode supportTo configure Viewpoint Monitoring for remote access:
1. In the main window of Viewpoint Monitoring, click File > ViewNode Management > Setup ViewNode Support .
If you are logged in to the software without administrator rights, as message appears that you need to be logged in to the computer with administrator rights. Exit from Viewpoint Monitoring, right-click its icon on the desktop, select the Run as administrator option, and accepting access at the prompt.
With successful launch, a wizard opens.
2. Viewpoint Monitoring checks if all needed software is installed and prompts when not, as follows.
It checks if Internet Information Services (IIS) has been installed. If not, the wizard explains how and does not let you continue (see the following figure). Exit, install IIS as outlined in the previous section, and try again.

136 ENERVISTA VIEWPOINT MONITORING – INSTRUCTION MANUAL
SET UP VIEWPOINT MONITORING FOR REMOTE ACCESS CHAPTER 13: REMOTE COMPUTERS
Figure 152: Prompt to install Microsoft Internet Information Services (IIS)
Viewpoint Monitoring checks that Microsoft .NET Framework is installed. If not, the Install .NET Framework window opens. Click the button to install .NET.
Figure 153: Prompt to install Microsoft .NET Framework
Viewpoint Monitoring checks that required web applications are installed. If not, the Install Viewpoint Web Applications window opens. Click the button to install them.

CHAPTER 13: REMOTE COMPUTERS SET UP VIEWPOINT MONITORING FOR REMOTE ACCESS
ENERVISTA VIEWPOINT MONITORING – INSTRUCTION MANUAL 137
Figure 154: Prompt to install related web components
3. With all components installed, click the Next button in the wizard. The Publishing window opens. After initial setup, to access the window manually for configuration, click File > ViewNode Management > Configure ViewNode Support .
4. Complete the fields.
Site Name — The computer or site name for the Viewpoint Monitoring installation. This is used for the remote computer to know which Viewpoint Monitoring they are connecting to. In the example shown, the name of the Viewpoint Monitoring installation is "Viewpoint Monitoring 1."
Waveforms — Enable to allow waveform/oscillography diagrams to be published to and viewable by the remote ViewNode computers.
Events — Enable to allow event records to be published to and viewable by the remote ViewNode computers.
Reports — Enable to allow trending reports to be published to and viewable by the remote ViewNode computers.
Publishing Single Line Diagrams — Click the Add button to enable specific One-Line Editor diagrams to be made available to the remote ViewNode computers. You can choose not to publish any diagrams at this time and do configuration later.
Publishing Annunciator Panels — Click the Add button to enable specific alarm panels created in the Annunciator function to be made available to the remote ViewNode computers. You can choose not to publish any annunciator panels at this time and do configuration later.

138 ENERVISTA VIEWPOINT MONITORING – INSTRUCTION MANUAL
SET UP VIEWPOINT MONITORING FOR REMOTE ACCESS CHAPTER 13: REMOTE COMPUTERS
Figure 155: ViewNode support configuration window
When done, click the Next button to continue in the wizard. The Access Control window opens.
5. The Access Control window/tab displays all ViewNodes currently connected to your system in the ViewNode Access Information table. You can also enable the Deny Access from all ViewNodes check box to deny access. At initial setup of ViewNodes, there are none connected to your system.
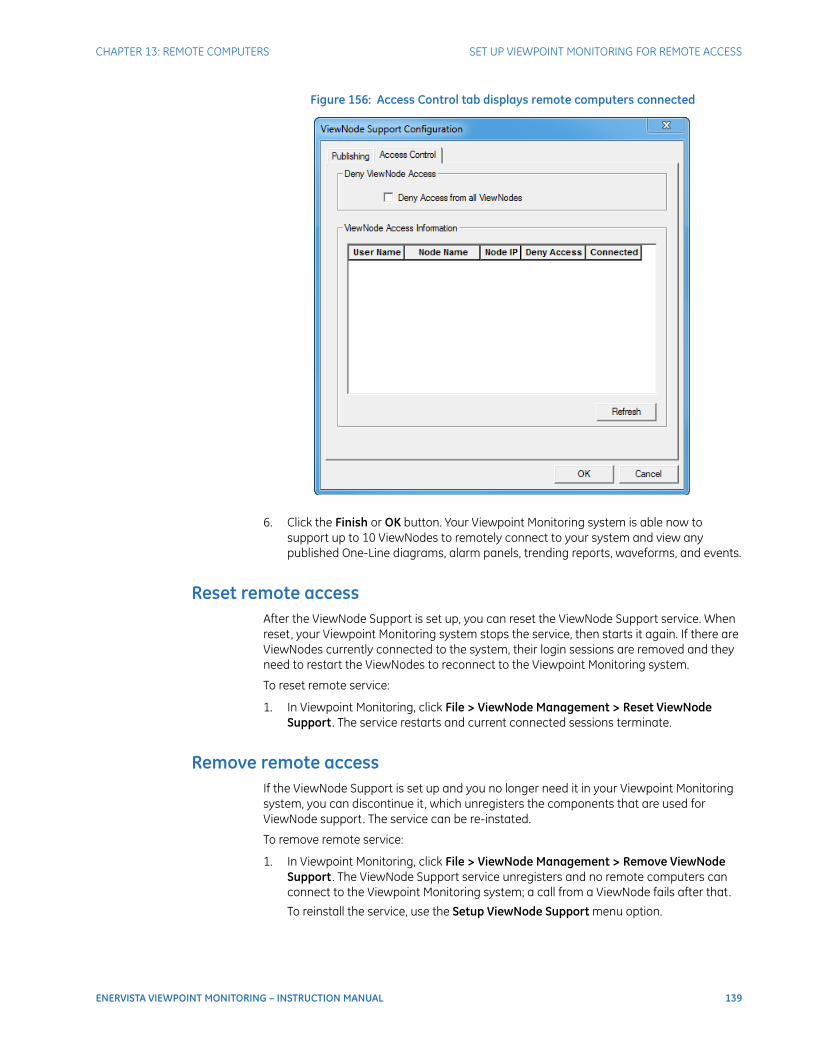
CHAPTER 13: REMOTE COMPUTERS SET UP VIEWPOINT MONITORING FOR REMOTE ACCESS
ENERVISTA VIEWPOINT MONITORING – INSTRUCTION MANUAL 139
Figure 156: Access Control tab displays remote computers connected
6. Click the Finish or OK button. Your Viewpoint Monitoring system is able now to support up to 10 ViewNodes to remotely connect to your system and view any published One-Line diagrams, alarm panels, trending reports, waveforms, and events.
Reset remote accessAfter the ViewNode Support is set up, you can reset the ViewNode Support service. When reset, your Viewpoint Monitoring system stops the service, then starts it again. If there are ViewNodes currently connected to the system, their login sessions are removed and they need to restart the ViewNodes to reconnect to the Viewpoint Monitoring system.
To reset remote service:
1. In Viewpoint Monitoring, click File > ViewNode Management > Reset ViewNode Support . The service restarts and current connected sessions terminate.
Remove remote accessIf the ViewNode Support is set up and you no longer need it in your Viewpoint Monitoring system, you can discontinue it , which unregisters the components that are used for ViewNode support. The service can be re-instated.
To remove remote service:
1. In Viewpoint Monitoring, click File > ViewNode Management > Remove ViewNode Support . The ViewNode Support service unregisters and no remote computers can connect to the Viewpoint Monitoring system; a call from a ViewNode fails after that.
To reinstall the service, use the Setup ViewNode Support menu option.
140 ENERVISTA VIEWPOINT MONITORING – INSTRUCTION MANUAL
INSTALL REMOTE ACCESS CLIENT SOFTWARE CHAPTER 13: REMOTE COMPUTERS
Install remote access client softwareThe ViewNodes software needs to be installed on each computer that is to access Viewpoint Monitoring remotely. No additional licensing is required. The software is on the Viewpoint Monitoring CD or can be downloaded from the GE Digital Energy website at http://www.gedigitalenergy.com/multilin/
The client software cannot be installed on the same computer as the Viewpoint Monitoring system.
All .sf files published from the Viewpoint Monitoring server are downloaded to the ViewNode in the C:\ProgramData\EnerVista\Viewnode\My Documents folder. If the path of the hyperlink is absolute, for example C:\MyFiles\MyG60File.sf, the link does not work on the ViewNode. When saving One-Line diagrams, use relative paths if you plan to use the links on the ViewNode, instead of absolute paths.
Software requirements for remote computerThe ViewNode client software can be installed on computers running the following operating systems:
• Windows 7 with SP1 or later (32 and 64 bit)
The software can work with Windows Vista and Windows XP computers, but they are not supported officially.
Windows Server 2008 is not supported.
The ViewNode client software needs to be the same or greater version as the Viewpoint Monitoring installation being accessed. For example, ViewNode 5.71 works with Viewpoint Monitoring 5.71, 7.1, and 7.2, but not with 5.70.
The remote computer also requires Microsoft SQL Server 2012 Express SP1. The wizard prompts automatically to install it when not found on the computer. This package also requires Microsoft .Net Framework 3.5 SP1 or Microsoft .Net Framework 4.0. All packages can be downloaded from Microsoft over the Internet if required.
Install client softwareTo install the ViewNodes remote access client software:
1. Locate and click or double-click the VPMon710NodeSetup.exe file, for example by placing it on the computer desktop. Allow changes to the computer at the prompt. The wizard opens.
2. When the computer does not have Microsoft SQL Server 2012 Express SP1 installed, the system prompts to install it . Click the Install button to do so. The software installs; Viewpoint Monitoring ViewNode installs, with an icon placed on the computer desktop and Start menu item.
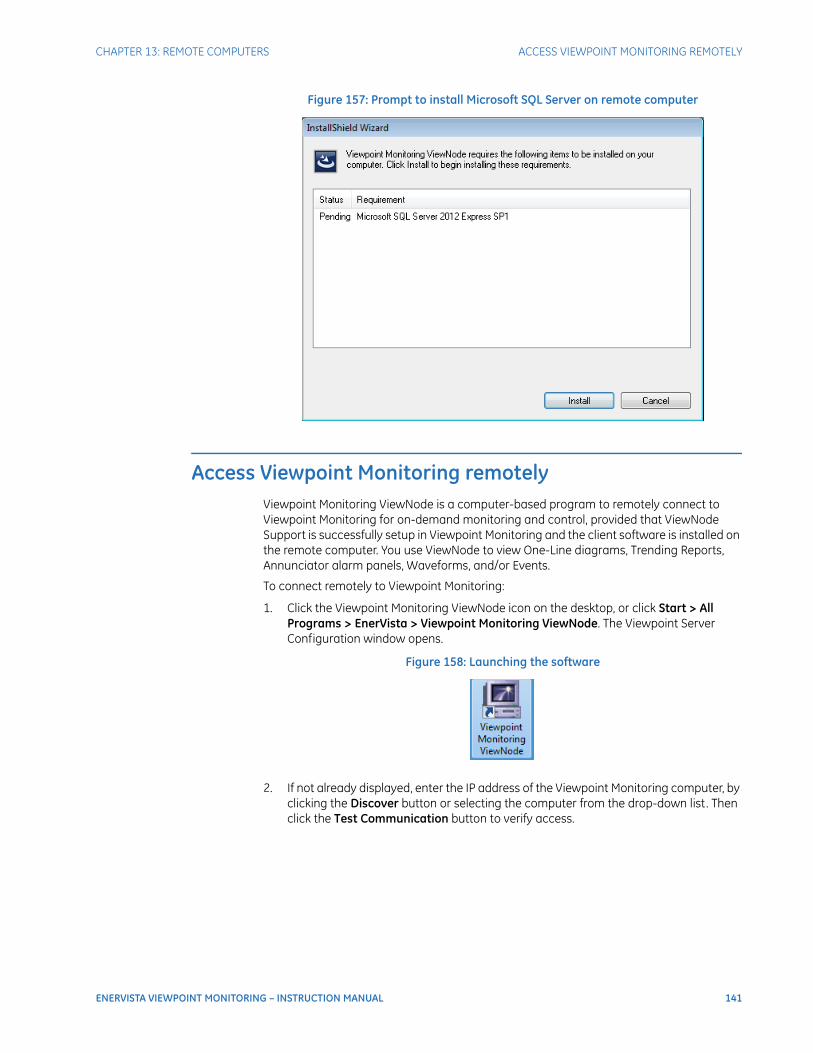
CHAPTER 13: REMOTE COMPUTERS ACCESS VIEWPOINT MONITORING REMOTELY
ENERVISTA VIEWPOINT MONITORING – INSTRUCTION MANUAL 141
Figure 157: Prompt to install Microsoft SQL Server on remote computer
Access Viewpoint Monitoring remotelyViewpoint Monitoring ViewNode is a computer-based program to remotely connect to Viewpoint Monitoring for on-demand monitoring and control, provided that ViewNode Support is successfully setup in Viewpoint Monitoring and the client software is installed on the remote computer. You use ViewNode to view One-Line diagrams, Trending Reports, Annunciator alarm panels, Waveforms, and/or Events.
To connect remotely to Viewpoint Monitoring:
1. Click the Viewpoint Monitoring ViewNode icon on the desktop, or click Start > All Programs > EnerVista > Viewpoint Monitoring ViewNode. The Viewpoint Server Configuration window opens.
Figure 158: Launching the software
2. If not already displayed, enter the IP address of the Viewpoint Monitoring computer, by clicking the Discover button or selecting the computer from the drop-down list. Then click the Test Communication button to verify access.

142 ENERVISTA VIEWPOINT MONITORING – INSTRUCTION MANUAL
ACCESS VIEWPOINT MONITORING REMOTELY CHAPTER 13: REMOTE COMPUTERS
Figure 159: Enter the Viewpoint Monitoring computer information
Figure 160: Automatic discovery of Viewpoint Monitoring computers
If the Viewpoint Monitoring computer is not located automatically, then enter its IP Address in the box. (Find the IP address at the ViewPoint Monitoring computer in the Host Information tab under File > Preferences.) After entering the IP address, click the Test Communication button to verify access.

CHAPTER 13: REMOTE COMPUTERS ACCESS VIEWPOINT MONITORING REMOTELY
ENERVISTA VIEWPOINT MONITORING – INSTRUCTION MANUAL 143
Figure 161: IP address of Viewpoint Monitoring in Preferences
A proxy server is a computer on your network that sits between your computer and the Internet, transferring information for web browsing. It is used for security, website blocking, caching, and to obscure IP addresses of senders. To view proxy server information, open the Control Panel in Windows, access the Internet Options function, click the Connections tab, then the LAN settings button. Or look in the same panel in the Internet Explorer web browser. Or contact your information technology (IT) department for the information to enter in the fields. Because the proxy server information is not always visible when scripts are used for computer settings, you can need to contact your IT department.
Click the Ok button when done.
3. If messages display that the device is not supported or the file cannot be located, it means that the ViewNode client software version is too old. Upgrade the ViewNode client software on the remote computer.
Figure 162: Errors when using old ViewNode client software
4. With successful launch of the Viewpoint Monitoring ViewNode application the ViewNode login window displays. Log in as Guest or with another user account. When logging in as Guest, leave the password at the default; simply click the OK button to log in.
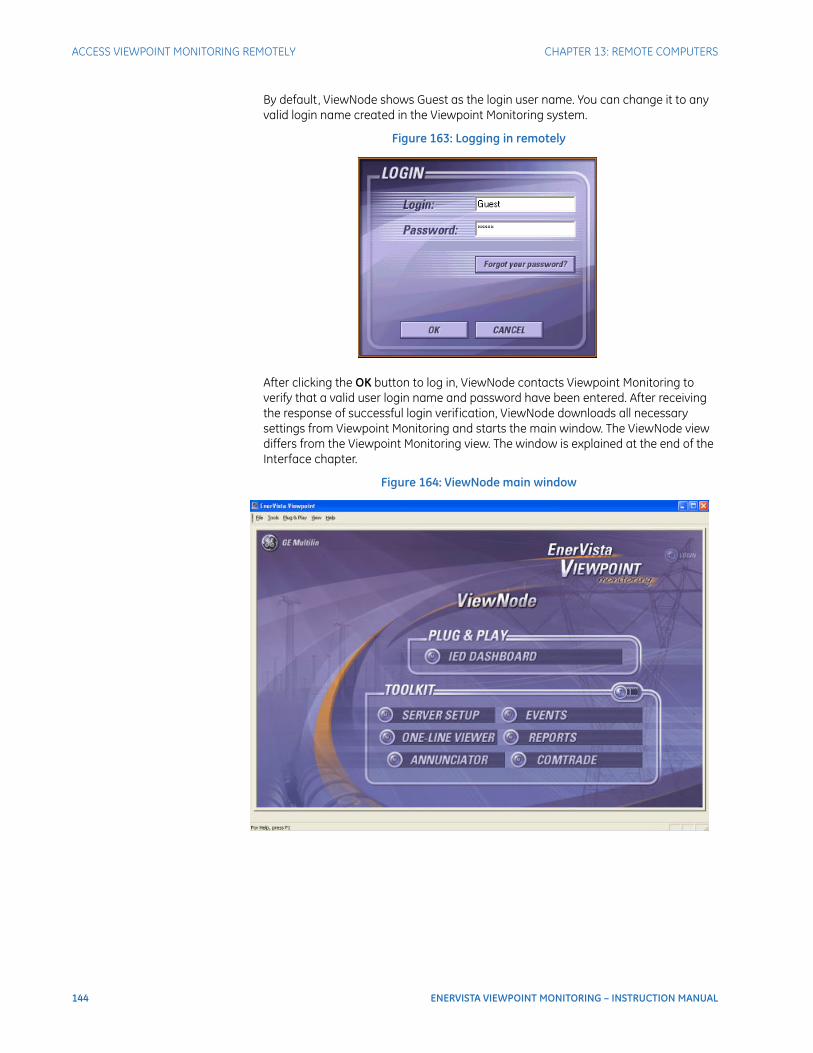
144 ENERVISTA VIEWPOINT MONITORING – INSTRUCTION MANUAL
ACCESS VIEWPOINT MONITORING REMOTELY CHAPTER 13: REMOTE COMPUTERS
By default, ViewNode shows Guest as the login user name. You can change it to any valid login name created in the Viewpoint Monitoring system.
Figure 163: Logging in remotely
After clicking the OK button to log in, ViewNode contacts Viewpoint Monitoring to verify that a valid user login name and password have been entered. After receiving the response of successful login verification, ViewNode downloads all necessary settings from Viewpoint Monitoring and starts the main window. The ViewNode view differs from the Viewpoint Monitoring view. The window is explained at the end of the Interface chapter.
Figure 164: ViewNode main window

CHAPTER 13: REMOTE COMPUTERS ACCESS VIEWPOINT MONITORING REMOTELY
ENERVISTA VIEWPOINT MONITORING – INSTRUCTION MANUAL 145
Troubleshooting for Windows XPDuring ViewNode Support setup to allow remote access of Viewpoint Monitoring, Viewpoint Monitoring automatically uses the interactive account for DCOM server GE32MTCP and GE32MODB. When using the remote desktop client to remotely log in to your Viewpoint Monitoring in Windows XP, ViewNode can report communication problems with the Viewpoint Monitoring system. To solve the problem, use the following procedure.
To troubleshoot remote access for a Windows XP computer:
1. At the Windows XP computer, click Start > Run or enter run in the empty field and launch the program. The Run window opens.
2. Enter dcomcnfg and click the OK button. The Component Services window opens.
3. On the left side of the Component Services, go to Component Services > Computers > My Computer > DCOM Config.
4. In the right panel, right-click GE32MTCP OPC Server and select Properties. The GE32MTCP OPC Server Properties window opens.
Figure 165: Modifying the server for Windows XP
5. Click the Identity tab.
6. Enable the This user radio button and enter the user ID and password that you used to run Viewpoint Monitoring system.

146 ENERVISTA VIEWPOINT MONITORING – INSTRUCTION MANUAL
UNINSTALL REMOTE ACCESS CLIENT SOFTWARE CHAPTER 13: REMOTE COMPUTERS
Figure 166: Configuring for Windows XP
7. Click the OK button to save and exit.
8. Repeat the steps for the GE32MODB OPC server.
Uninstall remote access client softwareSee the Uninstall software section on page 151.
Remote computer interfaceRemote computers accessing Viewpoint Monitoring with the client software are referred to as ViewNodes. The ViewNode interface differs from the Viewpoint Monitoring interface and is explained here. Functions accessible depend on permissions.
When ViewNode starts, a portion of report data, meaning the current hour, is synchronized immediately. The rest of the historical data is downloaded gradually. Data is downloaded backward for the period defined in the preferences, but not greater than 180 days. The speed of download depends on a number of parameters. For 500 parameters in all reports, a block of data of one-hour length is downloaded each 30 seconds. The period for download is dynamically readjusted, if the number of parameters changes. For example, for 50 parameters, a block of data of 10 hours length is downloaded every 30 seconds.
For the Reports function, the Communication Status legend in a ViewNode is labelled Communicating and differs from the ViewPoint Monitoring server in that it has two states, as follows:
• Connected — When reports are dynamically updated
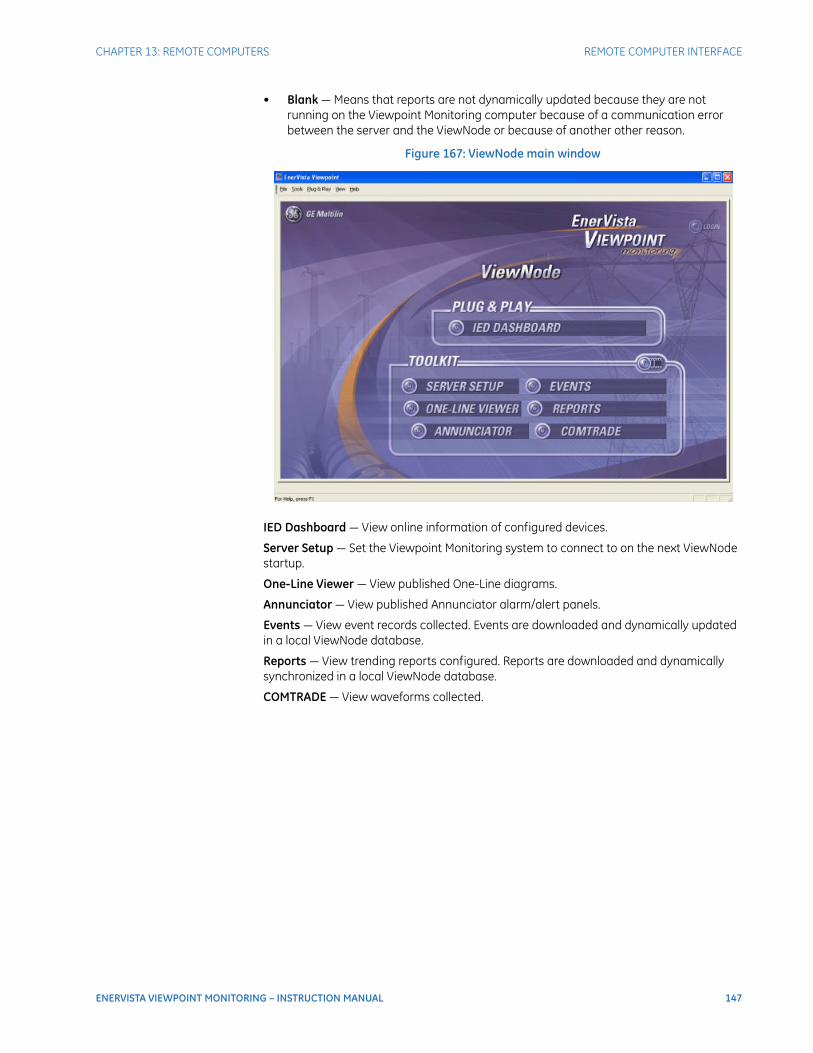
CHAPTER 13: REMOTE COMPUTERS REMOTE COMPUTER INTERFACE
ENERVISTA VIEWPOINT MONITORING – INSTRUCTION MANUAL 147
• Blank — Means that reports are not dynamically updated because they are not running on the Viewpoint Monitoring computer because of a communication error between the server and the ViewNode or because of another other reason.
Figure 167: ViewNode main window
IED Dashboard — View online information of configured devices.
Server Setup — Set the Viewpoint Monitoring system to connect to on the next ViewNode startup.
One-Line Viewer — View published One-Line diagrams.
Annunciator — View published Annunciator alarm/alert panels.
Events — View event records collected. Events are downloaded and dynamically updated in a local ViewNode database.
Reports — View trending reports configured. Reports are downloaded and dynamically synchronized in a local ViewNode database.
COMTRADE — View waveforms collected.

148 ENERVISTA VIEWPOINT MONITORING – INSTRUCTION MANUAL
REMOTE COMPUTER INTERFACE CHAPTER 13: REMOTE COMPUTERS

ENERVISTA VIEWPOINT MONITORING – INSTRUCTION MANUAL 149
EnerVista Viewpoint Monitoring
Chapter 14: Maintenance
Maintenance
This chapter outlines maintenance of the software.
• View software version
• Update software
• Manage activation code
• Transfer software license
• Uninstall software
View software versionTo view the version number of Viewpoint Monitoring:
1. Click Help > About EnerVista Viewpoint... The window opens.
2. View the number in the Version field.
3. Click the window to exit.
The Events window is a separate application.
To view the version number of the Event viewer:
1. In the main window of Viewpoint Monitoring, click the Events option. The window opens.
2. Click the About icon on the toolbar or click Help > About Event/Alarm Viewer. The window opens.
3. View the number in the Version field.
4. Click the window to exit.
Update softwareThe software can be upgraded for new features and fixes. When purchased with the optional upgrade package, the updates are free for one year.
The Viewpoint Monitoring license also can be upgraded to add new Viewpoint Monitoring installations and/or options (purchase required) by entering a new activation code.
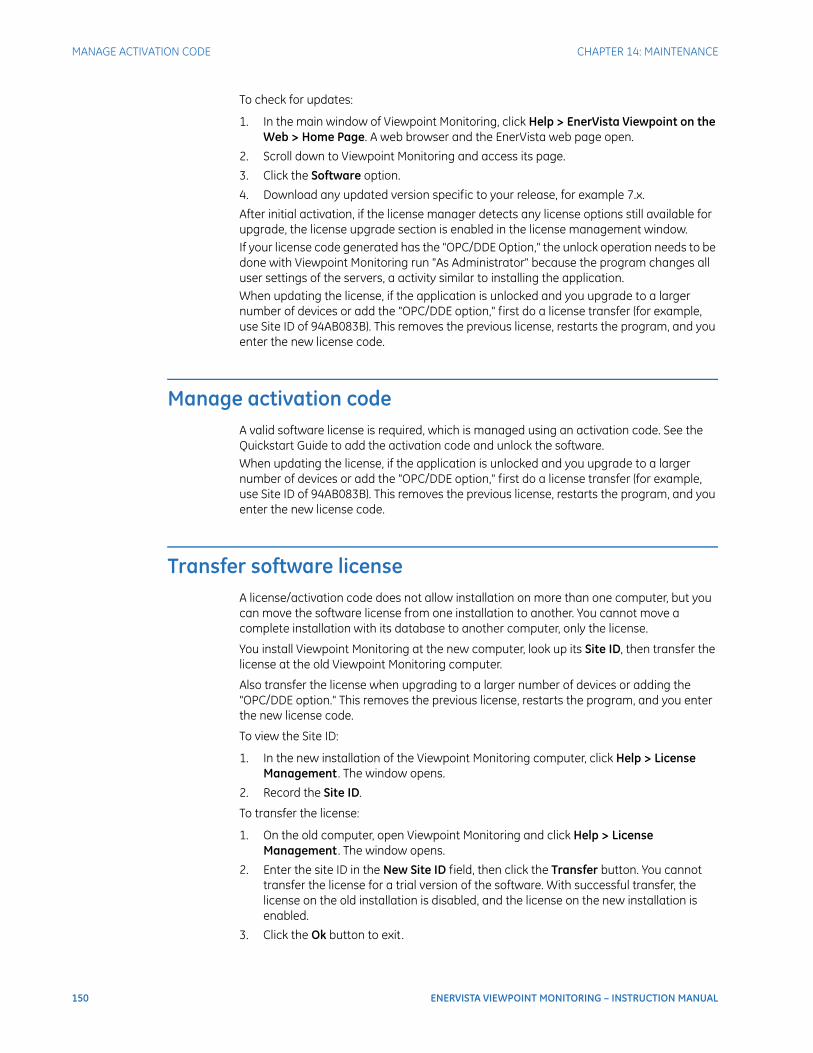
150 ENERVISTA VIEWPOINT MONITORING – INSTRUCTION MANUAL
MANAGE ACTIVATION CODE CHAPTER 14: MAINTENANCE
To check for updates:
1. In the main window of Viewpoint Monitoring, click Help > EnerVista Viewpoint on the Web > Home Page. A web browser and the EnerVista web page open.
2. Scroll down to Viewpoint Monitoring and access its page.
3. Click the Software option.
4. Download any updated version specific to your release, for example 7.x.
After initial activation, if the license manager detects any license options still available for upgrade, the license upgrade section is enabled in the license management window.If your license code generated has the "OPC/DDE Option," the unlock operation needs to be done with Viewpoint Monitoring run "As Administrator" because the program changes all user settings of the servers, a activity similar to installing the application.When updating the license, if the application is unlocked and you upgrade to a larger number of devices or add the "OPC/DDE option," first do a license transfer (for example, use Site ID of 94AB083B). This removes the previous license, restarts the program, and you enter the new license code.
Manage activation codeA valid software license is required, which is managed using an activation code. See the Quickstart Guide to add the activation code and unlock the software.When updating the license, if the application is unlocked and you upgrade to a larger number of devices or add the "OPC/DDE option," first do a license transfer (for example, use Site ID of 94AB083B). This removes the previous license, restarts the program, and you enter the new license code.
Transfer software licenseA license/activation code does not allow installation on more than one computer, but you can move the software license from one installation to another. You cannot move a complete installation with its database to another computer, only the license.
You install Viewpoint Monitoring at the new computer, look up its Site ID, then transfer the license at the old Viewpoint Monitoring computer.
Also transfer the license when upgrading to a larger number of devices or adding the "OPC/DDE option." This removes the previous license, restarts the program, and you enter the new license code.
To view the Site ID:
1. In the new installation of the Viewpoint Monitoring computer, click Help > License Management . The window opens.
2. Record the Site ID.
To transfer the license:
1. On the old computer, open Viewpoint Monitoring and click Help > License Management . The window opens.
2. Enter the site ID in the New Site ID field, then click the Transfer button. You cannot transfer the license for a trial version of the software. With successful transfer, the license on the old installation is disabled, and the license on the new installation is enabled.
3. Click the Ok button to exit.
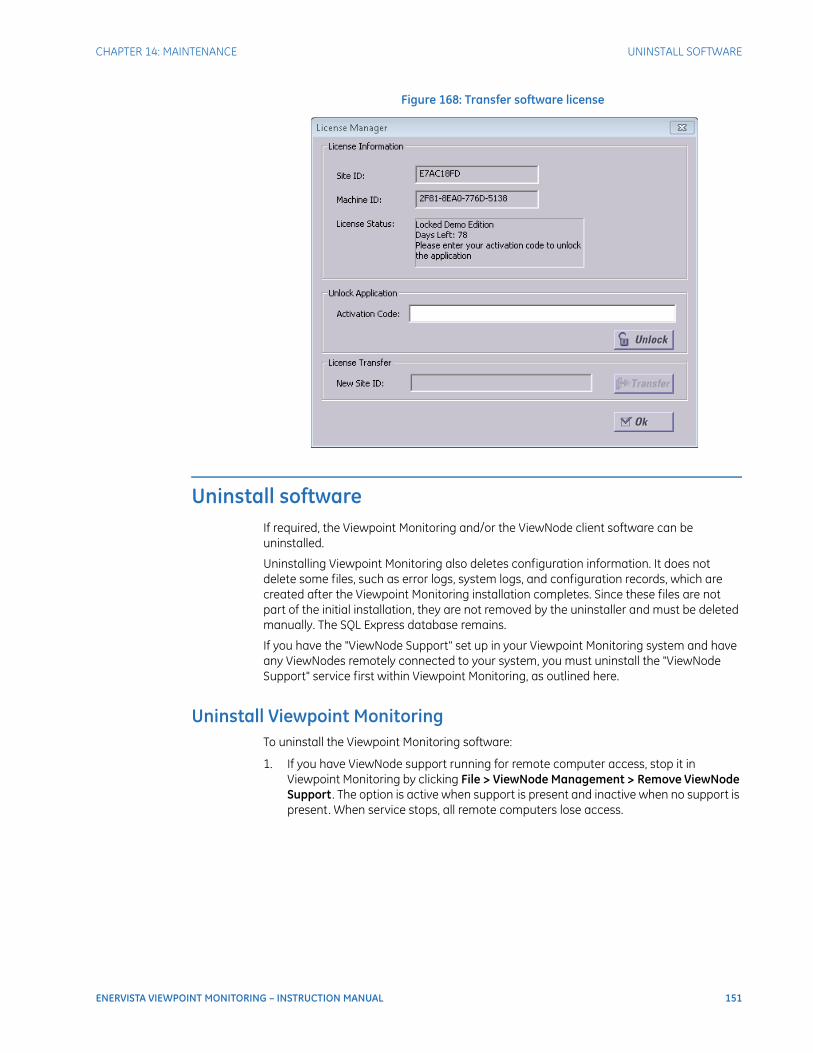
CHAPTER 14: MAINTENANCE UNINSTALL SOFTWARE
ENERVISTA VIEWPOINT MONITORING – INSTRUCTION MANUAL 151
Figure 168: Transfer software license
Uninstall softwareIf required, the Viewpoint Monitoring and/or the ViewNode client software can be uninstalled.
Uninstalling Viewpoint Monitoring also deletes configuration information. It does not delete some files, such as error logs, system logs, and configuration records, which are created after the Viewpoint Monitoring installation completes. Since these files are not part of the initial installation, they are not removed by the uninstaller and must be deleted manually. The SQL Express database remains.
If you have the "ViewNode Support" set up in your Viewpoint Monitoring system and have any ViewNodes remotely connected to your system, you must uninstall the "ViewNode Support" service first within Viewpoint Monitoring, as outlined here.
Uninstall Viewpoint MonitoringTo uninstall the Viewpoint Monitoring software:
1. If you have ViewNode support running for remote computer access, stop it in Viewpoint Monitoring by clicking File > ViewNode Management > Remove ViewNode Support . The option is active when support is present and inactive when no support is present. When service stops, all remote computers lose access.

152 ENERVISTA VIEWPOINT MONITORING – INSTRUCTION MANUAL
UNINSTALL SOFTWARE CHAPTER 14: MAINTENANCE
Figure 169: Stopping remote access
The Viewpoint Monitoring software can now be uninstalled.
2. In Windows, click Start > Control Panel.
3. Click Programs and Features.
4. Click EnerVista Viewpoint Monitoring.
5. Click Uninstall and confirm the deletion. The Viewpoint Monitoring software is deleted.
To uninstall the Microsoft .NET Framework and Microsoft SQL Server that was installed/used by Viewpoint Monitoring, follow a similar approach. Do not uninstall these applications when they are being used by other software on your computer.
Uninstall ViewNode remote clientTo uninstall the ViewNode client software:
1. At the remote computer, click Start > Control Panel.
2. Click Programs and Features.
3. Click Viewpoint Monitoring ViewNode.
4. Click Uninstall and confirm the deletion. The client software is deleted.
To uninstall the Microsoft .NET Framework and Microsoft SQL Server that was installed/used by the remote computer, follow a similar approach. Do not uninstall these applications when they are being used by other software on your computer.

ENERVISTA VIEWPOINT MONITORING – INSTRUCTION MANUAL 153
EnerVista Viewpoint Monitoring
Appendix A: Miscellaneous
Appendices Miscellaneous
This chapter outlines the document revision history.
Revision historyThe tables outline the releases and revision history of this document.
Table 4: Revision history
Table 5: Major changes for version C1
Table 6: Major changes for version B1
GEK publication number
1601 part number Software Release date ECO
GEK-113605 1601-0270-A1 5.7x 21 March 2013 13-
GEK-119654 1601-0270-B1 7.1x 1 August 2014 14-
GEK-119694 1601-0270-C1 7.2x 8 April 2015 15-
Page Change
3 Added support for more products
4 Updated Scalable Licensing section
Page Change
--- Major revision. Updated to new template and editing of content. Complementary Quickstart Guide created for installation of product. Reduced page count.

154 ENERVISTA VIEWPOINT MONITORING – INSTRUCTION MANUAL
REVISION HISTORY APPENDIX A: MISCELLANEOUS
ENERVISTA VIEWPOINT MONITORING – INSTRUCTION MANUAL 155
EnerVista Viewpoint Monitoring
Index
AAcknowledge
alarm or alert .......................................................................................... 87button ......................................................................................................... 26event records .......................................................................................... 92
Activation code ...................................................................................... 150Add
alarm or alert .......................................................................................... 82chart ............................................................................................................ 96device ..................................................................................................45, 46device in One-Line Editor .................................................................. 68formula ...................................................................................................... 32group ....................................................................................................... 130password for user account ........................................................... 124remote access ..................................................................................... 133remote computer .............................................................................. 140report .......................................................................................................... 96user account ........................................................................................ 127
Administration .............................................................................. 123, 149Administrator default password .................................................. 124Alarm
acknowledge ...................................................................................26, 87add ............................................................................................................... 82add LED indicator ................................................................................. 26email notification .................................................................................. 88event record change ........................................................................... 93event records .......................................................................................... 92keep monitoring .................................................................................... 16LED indicator ........................................................................................... 24mute sound ............................................................................................. 25not sounding ........................................................................................... 16not triggered ........................................................................................... 16permission to access ....................................................................... 128reset .....................................................................................................26, 87settings ...................................................................................................... 16silence ........................................................................................................ 15sounds ................................................................................................15, 88versus alert .............................................................................................. 25
Alertacknowledge ................................................................................... 26, 87add ...............................................................................................................82add LED indicator ..................................................................................26email notification ..................................................................................88event records ..........................................................................................92LED indicator ...........................................................................................24mute sound ..............................................................................................25not sounding ...........................................................................................16not triggered ...........................................................................................16permission to access ........................................................................128reset ..................................................................................................... 26, 87sounds ................................................................................................ 15, 88versus alarm ............................................................................................25
Analog versus digital indicators ......................................................27Annunciator
acknowledge ...........................................................................................87add alarm or alert .................................................................................82email notification ..................................................................................88event records ..........................................................................................92permission for users .........................................................................128preferences ..............................................................................................16reset .............................................................................................................87sound ..........................................................................................................88toolbar and buttons .............................................................................88
Archive reports .......................................................................................102Audible Alarms tab ..................................................................................15Automatic backup and purge ........................................................103Automatic purge .......................................................................................20
BBackup reports .............................................................................102, 103
Index
156 ENERVISTA VIEWPOINT MONITORING – INSTRUCTION MANUAL
INDEX
ButtonsAnnunciator .............................................................................................88Events .........................................................................................................94IED Dashboard .......................................................................................44not working ....................................................................................18, 128One-Line Editor ......................................................................................68One-Line Viewer ....................................................................................79phasor diagrams ................................................................................ 122Trending Reports ................................................................................ 105troubleshooting .....................................................................................18Waveforms ........................................................................................... 120
CChanges to document ....................................................................... 153Chart
add ...............................................................................................................96delete ....................................................................................................... 103preferences ..............................................................................................96view .............................................................................................................99
Close, troubleshooting ..........................................................................19Commands
permission for users to issue ....................................................... 128press CTRL key to enter .....................................................................18troubleshooting .....................................................................................18
Communication StatusDevice Status window ........................................................................22icon ..............................................................................................................21
Computer namehost name ................................................................................................19
COMTRADE fileconvert waveform to ....................................................................... 115explained ............................................................................................... 108merge files ............................................................................................. 117resample ................................................................................................ 119view .......................................................................................................... 109
Connect to device ............................................................................ 23, 41Control device ............................................................................................78Control tab, CTRL key to enter command .................................18Convert waveform to COMTRADE ............................................... 115Custom Device Definition window .................................................47Custom File Editor ....................................................................................46Customization
event records displayed ....................................................................92symbols in One-Line Editor ..............................................................67
DDashboard
access ........................................................................................................39buttons do not work ............................................................................18customization with template ..........................................................42device front panel .................................................................................41interface ....................................................................................................44introduction .............................................................................................37open ............................................................................................................39toolbar and buttons .............................................................................44
Dataarchive .....................................................................................................102backup .....................................................................................................103delete .............................................................................................103, 104harmonics ..............................................................................................114phasor .....................................................................................................113polling interval .......................................................................................... 4view .......................................................................... 64, 77, 99, 113, 114
DDE option ................................................................................................150DDE support .................................................................................................. 5Defaults ..........................................................................................................13
Annunciator .............................................................................................16archiving ....................................................................................................20backup ........................................................................................................20command entry key .............................................................................18keep monitoring after exit ........................................................ 17, 19login .............................................................................................................13logs ...............................................................................................................18passwords .............................................................................................124purge data ................................................................................................20security .......................................................................................................13sounds ........................................................................................................15user accounts and groups .............................................................124view on startup ......................................................................................14
Deletechart .........................................................................................................103data .................................................................................................. 20, 104device .................................................................................................. 52, 53event record ............................................................................................93files ...............................................................................................................20formula .......................................................................................................35group ........................................................................................................131report .......................................................................................................103schema diagram ...................................................................................65user account ........................................................................................130
Demonstration files ..................................................................9, 55, 108Description of software .......................................................................... 3Device
add ...............................................................................................................45add in One-Line Editor ........................................................................68add remote computer ......................................................................140alarm and alert .......................................................................................81buttons do not work ................................................................. 18, 128charts ..........................................................................................................95connect ......................................................................................................23control ........................................................................................................78delete .................................................................................................. 52, 53event records ..........................................................................................91front panel access ..................................................................... 41, 128import .........................................................................................................52list of supported .....................................................................................45Number supported ...............................................................................10number supported .................................................................................. 4permission to click buttons ............................................................128reconnect ..................................................................................................23reports ........................................................................................................95status window ........................................................................................22update ........................................................................................................53
INDEX
ENERVISTA VIEWPOINT MONITORING – INSTRUCTION MANUAL 157
Device Setupadd device ................................................................................................ 45delete ...................................................................................................52, 53event records .......................................................................................... 91import ......................................................................................................... 52update ........................................................................................................ 53
Diagramcharts ......................................................................................................... 95delete .......................................................................................................... 65draw ............................................................................................................ 56harmonics ............................................................................................. 114permissions .......................................................................................... 128phasor ..................................................................................................... 113update ........................................................................................................ 65view ............................................................................................................. 64view data .................................................................................................. 77waveform .............................................................................................. 107
Draw schema ...................................................................................56, 128
EEmail
notification for alarm or alert .......................................................... 88set addresses for server .................................................................... 16
Event logging for Viewpoint Monitoring ..................................... 18Event Logging tab ................................................................................... 18Event records
change event type ............................................................................... 93customize ................................................................................................. 92delete .......................................................................................................... 93enable for device .................................................................................. 91filter ............................................................................................................. 92keep monitoring .................................................................................... 17preferences ............................................................................................. 17toolbar and buttons .............................................................................94troubleshooting ..................................................................................... 19version number .................................................................................. 149view ............................................................................................................. 92
Examples ................................................................................................. 9, 55Exit, troubleshooting .............................................................................. 19Export
formula ...................................................................................................... 34report ....................................................................................................... 101
FFeatures ...........................................................................................................3File formats ....................................................................................................9Files
cannot open remotely ........................................................................ 64formats .........................................................................................................9saving relative or absolute path .................................................... 64
Filter event records ................................................................................. 92Forgot password ................................................................................... 127Format, file ......................................................................................................9Formula editor ........................................................................................... 31Full screen .................................................................................................... 12
GGreen LED indicator ........................................................................ 24, 80Group
add ............................................................................................................130default .....................................................................................................124delete .......................................................................................................131update .....................................................................................................131
Guestpassword, default ..............................................................................124permissions ...........................................................................................127
HHarmonics diagrams ..........................................................................114Help
online ..........................................................................................................35technical support .................................................................................... 1
Host Information tab .............................................................................19
IIED Dashboard
access .........................................................................................................39buttons do not work ............................................................................18customization with template ...........................................................42device front panel .................................................................................41interface ....................................................................................................44introduction .............................................................................................37open ............................................................................................................39toolbar and buttons .............................................................................44
Importdevice ................................................................................................. 42, 52formula ......................................................................................................34
Install remote viewer software .....................................................140Installation of Viewpoint Monitoring ............................................... 1Installation, move ..................................................................................150Interface
Events .........................................................................................................94general .......................................................................................................11IED Dashboard .......................................................................................44One-Line Editor ......................................................................................68One-Line Viewer ....................................................................................79phasor diagrams ................................................................................122remote computer ...............................................................................146Trending Reports ................................................................................105Waveforms ............................................................................................120
IP address of Viewpoint Monitoring ..............................................19
KKeep software running ................................................................. 17, 19

158 ENERVISTA VIEWPOINT MONITORING – INSTRUCTION MANUAL
INDEX
LLED
add indicator ...........................................................................................26analog ........................................................................................................27digital ..........................................................................................................27One-Line Viewer ....................................................................................80priority ........................................................................................................24
Licensenot required for remote computer ............................................ 133number of devices supported ............................................................4software ................................................................................................. 150transfer ................................................................................................... 150
Locked out of software ...................................................................... 127Log files ..........................................................................................................18Login
password lost ...................................................................................... 127requirement .............................................................................................13turn on or off ........................................................................................ 125
Lost password ........................................................................................ 127
MMain window ..............................................................................................11Merge COMTRADE files ...................................................................... 117Modbus registers .....................................................................................47Move software license ....................................................................... 150Mute sound .................................................................................................25
NName of Viewpoint Monitoring installation ..............................19Notification by email for alarm or alert ......................................88Number of devices supported ..................................................... 4, 10
OOne Shot to view data ..........................................................................64One-Line Editor
buttons .......................................................................................................68custom symbols ....................................................................................67delete schema ........................................................................................65demonstration files ..............................................................................55draw ............................................................................................................56edit and view simultaneously .........................................................65page size ...................................................................................................67permission for users ......................................................................... 128save file as relative for remote viewing .....................................64toolbars .....................................................................................................68units of measurement ........................................................................67update schema ......................................................................................65view data with One Shot ...................................................................64
One-Line Viewercontrol device .........................................................................................78LED indicators .........................................................................................80screen capture .......................................................................................79toolbar and buttons .............................................................................79view data ...................................................................................................77
Online help ...................................................................................................35OPC option ................................................................................................150OPC support .................................................................................................. 5Oscillography ...........................................................................................107
PPage size, One-Line Editor ..................................................................67Passwords
defaults ...................................................................................................124lost .............................................................................................................127reset ..........................................................................................................127rules ..........................................................................................................124set ..............................................................................................................126
PDF file creation .....................................................................................101Phasor diagrams .........................................................................113, 122Polling rate ..................................................................................................... 4Preferences ..................................................................................................13
alarms and alerts ..................................................................................82Annunciator tab .....................................................................................16Audible Alarms tab ...............................................................................15chart ............................................................................................................96Control tab ................................................................................................18Event Logging tab .................................................................................18event records ..........................................................................................92Host Information tab ...........................................................................19report ..........................................................................................................96Security tab ..............................................................................................13Startup Screen tab ................................................................................14Trending Reports tab ...........................................................................20Watchdog tab .........................................................................................19waveform ...............................................................................................111Waveform & Events tab .....................................................................17
Print report ................................................................................................101Product description ................................................................................... 3Purge
number of days ......................................................................................20preferences ..............................................................................................20reports ...........................................................................................103, 104
QQuickstart Guide ......................................................................................... 1Quit, troubleshooting .............................................................................19
RReconnect to device ...............................................................................23Red LED indicator ............................................................................. 24, 80Remote Desktop Connection .........................................................131
INDEX
ENERVISTA VIEWPOINT MONITORING – INSTRUCTION MANUAL 159
Remote Desktop Services for troubleshooting .................... 131Remote viewing
access Viewpoint Monitoring ....................................................... 141cannot open file .................................................................................... 64configure Viewpoint Monitoring ................................................. 133install software ................................................................................... 140interface ................................................................................................. 146license not required .......................................................................... 133reset access ......................................................................................... 139stop access ........................................................................................... 139trial version ........................................................................................... 133Windows XP troubleshooting ....................................................... 145
Repair ................................................................................................................1Report
add ............................................................................................................... 96archive .................................................................................................... 102delete ....................................................................................................... 103export ...................................................................................................... 101PDF file .................................................................................................... 101permission for users ......................................................................... 128preferences ............................................................................................. 20print .......................................................................................................... 101toolbar and buttons .......................................................................... 105view ............................................................................................................. 99
Resample COMTRADE file ................................................................ 119Reset
alarm or alert ...................................................................................26, 87passwords ............................................................................................. 127remote access ..................................................................................... 139sounds ....................................................................................................... 15
Revision history ...................................................................................... 153Rules for password .............................................................................. 124
SSafety .................................................................................................................1Scan interval ..................................................................................................4Schema
delete .......................................................................................................... 65draw ............................................................................................................ 56permissions .......................................................................................... 128update ........................................................................................................ 65view ............................................................................................................. 64
Screen capture .......................................................................................... 79Security tab ................................................................................................. 13Silence alarm .......................................................................................25, 87Site name ..................................................................................................... 19SMTP mail server ...................................................................................... 16Software
install remote client .......................................................................... 140license ..................................................................................................... 150transfer license ................................................................................... 150uninstall .................................................................................................. 151upgrade .................................................................................................. 149version .................................................................................................... 149
Sort event records ................................................................................... 92
Soundalarms and alerts ..................................................................................88mute ............................................................................................................25settings ......................................................................................................15
Startup Screen tab ..................................................................................14Status
LEDs explained .......................................................................................24LEDs in One-Line Viewer ....................................................................80
Stop alarm or alert ..................................................................................87Support, technical ...................................................................................... 1Supported devices ...................................................................................45Symbols, custom ......................................................................................67System tray icon .......................................................................................19
TTechnical support ...................................................................................... 1Terminal Services ..................................................................................131Third-party device ...................................................................................46Third-party waveforms not supported .....................................107Toolbar
Annunciator .............................................................................................88Events .........................................................................................................94One-Line Editor ......................................................................................68One-Line Viewer ....................................................................................79Trending Reports ................................................................................105Waveforms ............................................................................................120
Transfer software license .................................................................150Trending Reports
add ...............................................................................................................96archive .....................................................................................................102backup and purge .............................................................................103delete .......................................................................................................103export ......................................................................................................101permission for users .........................................................................128print ..........................................................................................................101tab in Preferences .................................................................................20toolbar and buttons ..........................................................................105view .............................................................................................................99
Trial version .................................................................................................10Troubleshooting
exit ................................................................................................................19login ..........................................................................................................127remote computers .............................................................................131remote viewing ......................................................................................64
Turn off sound ............................................................................................25
UUninstall software .................................................................................151Uninstall ViewNode support ...........................................................139Units of measurement ..........................................................................67
160 ENERVISTA VIEWPOINT MONITORING – INSTRUCTION MANUAL
INDEX
Updatedevice .........................................................................................................53formula ......................................................................................................35group ....................................................................................................... 131schema diagram ...................................................................................65user account ........................................................................................ 129
Upgradessoftware ................................................................................................. 149what is new ................................................................................................3
User accountadd ............................................................................................................ 127default ..................................................................................................... 124delete ....................................................................................................... 130password ............................................................................................... 126password lost ...................................................................................... 127update ..................................................................................................... 129
User groupadd ............................................................................................................ 130delete ....................................................................................................... 131update ..................................................................................................... 131
VVersion, software .................................................................................. 149View
alarm or alert ..........................................................................................87chart ............................................................................................................99COMTRADE file ..................................................................................... 109data in One-Line Viewer ....................................................................77data with One Shot button ...............................................................64diagram .....................................................................................................64event records ..........................................................................................92harmonics diagrams ........................................................................ 114phasor diagrams ................................................................................ 113report ..........................................................................................................99schema ......................................................................................................64version number ................................................................................... 149waveforms ............................................................................................ 109
ViewNodeaccess Viewpoint Monitoring ....................................................... 141cannot open file .....................................................................................64configure Viewpoint Monitoring ................................................. 133install client software ....................................................................... 140interface ................................................................................................. 146license not required .......................................................................... 133reset access ......................................................................................... 139stop access ........................................................................................... 139trial version ........................................................................................... 133troubleshooting remotely .............................................................. 131Windows XP troubleshooting ....................................................... 145
WWatchdog tab ............................................................................................19Waveform & Events tab .......................................................................17
WaveformsCOMTRADE file explained ...............................................................108convert to COMTRADE .....................................................................115event records ..........................................................................................92harmonics diagrams ........................................................................114interface .................................................................................................121keep monitoring .....................................................................................17merge COMTRADE files ....................................................................117phasor diagrams ......................................................................113, 122preferences ................................................................................... 17, 111resample COMTRADE file ................................................................119third-party not supported ..............................................................107view COMTRADE file ..........................................................................109
Windows Remote Desktop Services ...........................................131Windows XP troubleshooting for remote viewing .............145
YYellow LED indicator ....................................................................... 24, 80


