178
NVO-140 VOLUME I ENEWETAK RADIOLOGICAL SURVEY OCTOBER 1973 UNITED STATES ATOMIC ENERGY COMMISSION NEVADA OPERATIONS OFFICE LAS VEGAS, NEVADA

NVO-140
VOLUME I
ENEWETAK
RADIOLOGICAL SURVEY
OCTOBER 1973
UNITED STATES ATOMIC ENERGY COMMISSION
NEVADA OPERATIONS OFFICE
LAS VEGAS, NEVADA


Contents
\[‘s;l‘;>.ci . . . . . . . . . , . . . . .
I. Introduciio:: (If.. Uervik, Lan-rence Livermore Laboratory) . . .
Il. ~nen~c:tak (R. Ray, Nevada Operations Office, US_qEC; J. Koranda and
I;. x;trsh, Ian-rence Livermore Laboratory-; and ~7. Nelson, t-niversity of
\\.ashingtonj . . . . . . . . . . . . . .
1:. 5urvey EsezLltion . . . . . . . . . . . . .
Survey Plan W. Nervik, Lawrence Livermore Laboratory) . . .
-Aerial Radiological and Photographic Survey (T. P. Stuart and R. 1Ieibaum, EG&G, Inc. ) . . . . . . . . .
Terrestrial Soil Survey (0. D. T. Lynch Jr., Nevada Operations Office, USAEC, and P. H. Gudiksen, ian.rence Livermore Laboratory) . . . . . . . . . . . . .
External Dose Estimate (H. L. Beck and J. E. McLaughlin, Health and Safety- Laboratory, USAEC; P. II. Guciiksen and D. E. Jones, Lawrence Livermore Laboratory; 0. D. T. Lynch, Jr., Nevada Operations Office, USAEC; and T. P. Stuart, EG&G, Inc. ) . .
Marine Program (V. Nelson, Laboratory of Radiation Ecology, University of Washington, and TI’. E. Xoshkin, Lawrence Livermore Laboratory) . . . . . . . . . .
Terrestrial Biota Survey (J. J. Koranda, J. R. Martin, S. E. Thompson, Jr., M. L. Stuart, and D. R. McIntyre, Lawrence Livermore Laboratory; G. Potter, Environmental Protection Agency) . . . . . . . . . . . . . .
Air-Sampling Program (B. Clegg and D, 15’ilson, Lawrence Livermore Laboratory) . . . . . . . . . . . . .
Engineering Survey - Radiological Aspects (0. D. T. Lynch, Jr., Nevada Operations Office, USAEC) . . . . . . . .
-4nalytical Program (R. W. Hoff, J. W. IIeadows, H. D. Wilson, A. L. Prindle, R. Gunnink, and K. 0. Hamby, Lawrence Livermore Laboratory) . . . . . . . . . . . . .
Enewetak Survey Radiological Controls (0. D. T. Lynch, Jr., Nevada
Operations Office, USAEC) . . . . . . . . .
Dose Assessment and Evaluation . . . . . . . . .
Dietary and Living Patterns (W. L. Robison, Lawrence Livermore Laboratory) . . . . . . . . . . . .
External Dose Determination (H. L. Beck and J. E. McLaughlin,
Health and Safety Laboratory, USAEC; P. H. Gudiksen and D. E. <Jones, Lawrence Livermore Laboratory) . . . .
Evaluation of the Inhalation Pathway (D. W. Wilson, Lawrence Livermore Laboratory) . . . . . .
Appendix A - Relationship Between desus’pended Plutonium . .
in Air and Plutonium in Soil (L. R. Anspaugh, Lawrence Livermore Laboratory) . . . . . . . . . .
iii
\-i
1
3
4’; 47
49
81
117
131
225
349
372
426
486 491
492
498
507
515
-i-

Contents (conrlnued)
Dose Estimates for the Marine Food Chain (1.1.. L. Robison. Lawrence Livermore Laboratory) . . . . . . . 326
Evaluation of the Dosage from Terrestrial Foods (1.. C. Xg, B. J. Berger, D. J. Pederson, Y. E. nicker, and S. E. Thompson, Jr., Lawrence Livermore Laboratory) . . . 542
Summary of Dose _4ssessment (\Y, L. Robison, I-z>:.-rence Livermore Laboratory) . . . . . . . . . 612
IV. Summary of Findings (W. Nervik, Lawrence Livermore Laboratory . 626
_Xppendix I - Planning and Operations Directive (NVO-121) - 1972 Enewetak Atoll Precleanup Radiological Survey . . . . . . . . 696
Appendix II - Survey Results by Island . . . . . . . . 1’01s. II-III
-ii_

Abstract
The AEC has conducted a survey of
the total radiological environment of Ene-
..vetak Atoll in order to prol:ide data for
judgments as to lvhether or not all or any
part of the Atoll can be safely reinhabited.
Xlore than 3300 samples from all parts of
the marine, terrestrial, and atmospheric
components of the Xtoll environment were
analyzed by instrumental and radiochemi-
cal methods. In addition, an aerial sur-
vey for gamma-radiation levels was con-
ducted over all land areas.
“Sr, 137Cs, 6oCo, and 3-3gPu are the
predominant radioactive isotopes now
present, but their distribution is far from
uniform. Islands on the southern half of
the Atoll from ALVIN to KEITH have lev-
els oi contamination comparable to or
less than those due to lvorld-wide fallout
in the l-nited States. On the northern
half, islands ALICE to IRENE are most
heavily contaminated, KATE to 1sIILMA
are least contaminated, and JANET is at
an intermediate levei.
These radiological data have been com-
bined with the best information currently
available on the expected diet of the Ene-
wetak people to estimate potential whole-
body and bone doses to the population for
six living patterns at 5-, lo-, 30-, and
‘70-yr intervals after return. Thirty-
year integral dose estimates for unmodi-
fied (i.e., current) conditions are shown
in Table A.
Table A. The 30-yr integral dose for six living patterns, assuming unmodified condi- tions.
30-year integral dose, rem Unmodified conditions
External Living Inhalation Bone, Terrestrial Marine Total pattern Bone Lung Liver W.B. W.B. Bone W. B. Bone W. B. ‘Bone
I 7(-41 9(-4) 4(-41 0.83 0.14 2.1 0.053 0.84 1.0 3.8
II 0.029 0.036 0.016 1.6 2.7 33 0.053 0.84 4.4 35
III 0.10 0.13 0.056 4.0 6.1 75 0.053 0.84 11 80
IV 0.47 0.59 0.24 10 21 210 0.053 0.84 31 220
V 0.11 0.13 0.058 2.9 2.7 33 0.053 0.84 5.7 37
VI 0.090 0.11 0.049 4.4 9.8 130 0.053 0.84 14 135
Living pattern Village island Agriculture Visitation
I FRED/ELMER/DAVID ALVIN through KEITH Southern islands
II FRED/ELMER/DAVID KATE through WILMA Northern islands plus LEROY
III JANET
IV BELLE
V JANET
VI JANET
JANET
BELLE
KATE through WILMA plus LEROY
ALICE through IRENE
Northern islands
Northern islands
Northern islands
Northern islands
-iii_
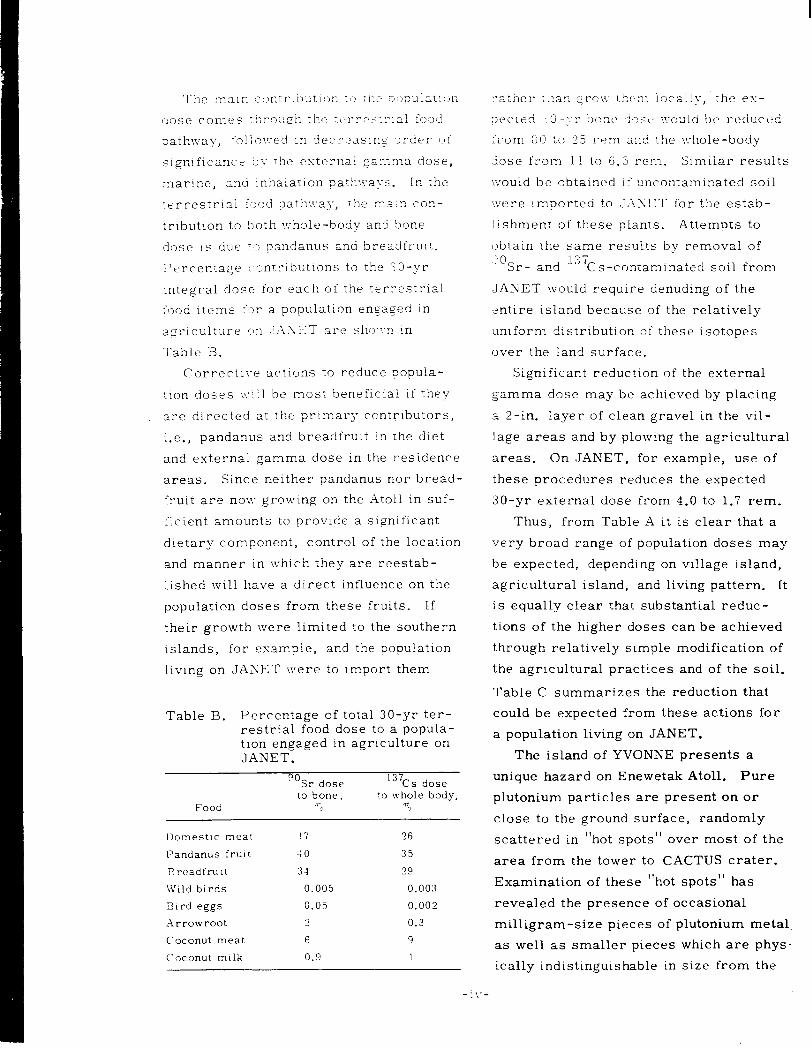
/ ose comes ri-iroi:gh -1 :he tcrrc.+rr:ai food
Fathway, follo\x:ed in decreasi122 order 0T‘
Significance :,>- The external gamma dose,
.marine, and inhalation path\va>-z. In the
terrestrial iaod pathway, Ihe --sin con-
trlbutlon to both x-hole-body an5 !,one
dose 1s due T,J :,andanus and hreadfrult.
Percentag,re cqntributlons to the X0-yr
integral dose for each of the terrestrial
food itfrns for a population engaged in
a~~~~cul:ure ‘):I .T_LSET are .sl~~~.~:r. In
Table li.
CorrectiT:e actions to reduce popula-
:lon doses w:ll be most heneficlal if they
are directed at the primary contributors,
i.e., pandanus and breadfruit in the diet
and external gamma dose in the residence
areas. Since neither pandanus nor bread-
fruit are nov: growing on the Atoll in suf-
ficient amounts to provide a significant
dietary component, control of the location
and manner in which they are reestab-
lished will have a direct influence on the
population doses from these fruits. If
their growth were limited to the southern
islands, for example, and the population
living on .JASET were to import them
Table B. Percentage of total 30-yr ter- restrial food dose to a popula- tion engaged in agriculture on JANET.
00 Sr dose 137Cs dose
to bone, to whole body, Food ‘6 mo
IIomestlc mear !7 76
Pandanus fruit 10 35
IY readfru it 31 29
Wild birds 0.005 0.003
Bard eggs 0.05 0.002
Arrowroot 2 0.3
Coconut meat 6 9
Coconut mtlk 0.9 1
:Tather :!:a:i croa tk~:?l iocai!>-, the es-
;,ecred .; 0 -:;r bone r:->~r’ Ir:oxld be reduced
‘rem I s,i) 10 :35 rem and the l:;hole-body
(Jose from l! to ii.5 rem. Similar results
?vould be obtained I? uncontaminated soil
\vere Imported to .JXSET for the estab-
lishmenr of these piants. Attempts to
obtain The same results by removal of
“Sr- and 13’Cs-contaminated soil from
JANET Ivould require denuding of the
entire island because of the relatively
urnform distribution of these isotopes
over the land surface.
Significant reduction of the external
gamma dose may be achieved by placing
a Z-in. layer of clean gravel in the vil-
lage areas and by plowing the agricultural
areas. On JANET, for example, use of
these procedures reduces the expected
30-yr external dose from 4.0 to 1.7 rem.
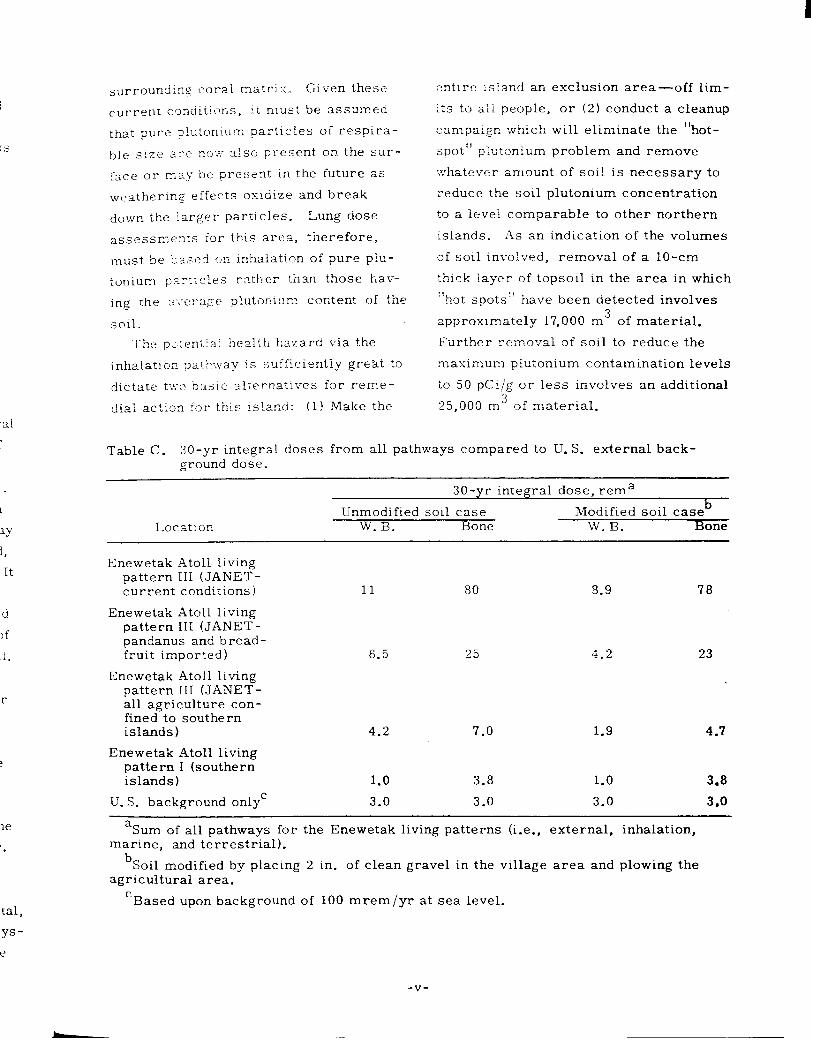
Thus, from Table A it is clear that a
very broad range of population doses may
be expected, depending on village island,
agricultural island, and living pattern. It
is equally clear that substantial reduc-
tions of the higher doses can be achieved
through relatively simple modification of
the agricultural practices and of the soil.
Table C summarizes the reduction that
could be expected from these actions for
a population living on JANET.
The island of YVONNE presents a
unique hazard on Enewetak Atoll. Pure
plutonium particles are present on or
close to the ground surface, randomly
scattered in “hot spots” over most of the
area from the tower to CACTUS crater.
Examination of these “hot spots” has
revealed the presence of occasional
milligram-size pieces of plutonium metal
as well as smaller pieces which are phys-
ically indistinguishable in size from the
-.
lY
1,
It
d
If
1.
r
le
tal,
YS-
t?
surround:ng coral matri:r, Cis-en these
current condit:ons, it must be assumed
that pure ~!utonlllm particles Of respira-
ble Size 21-e no:.? also present on. the sur-
face or may be present in the future as
weathering effects oxidize and break
down the iarger particles. Lung dose
assessn:ents for this area, therefore,
must be ‘based r;n inhalation of pure piu-
tonium nzrtlcles rather than those hav-
ing the :i-.-erage plutonium content of the
sn11.
entire isiand an exclusion area-off lim-
its to ail people, or (2) conduct a cleanup
campaign which will eliminate the “hot-
spot” plutonium problem and remove
whatever amount of soil is necessary to
reduce the soil plutonium concentration
to a level comparable to other northern
islands. As an indication of the volumes
of soil involved, removal of a lo-cm
thick layer of topsoil in the area in which
“hot spots” have been detected involves
approximately 17,000 m3 of material.
The p,:eniial health hazard via the Further removal of soil to reduce the
inhalation ;,ath.way is sufficientiy great to maximum plutonium contamination levels
dictate t:::c b:isic alternativcs for reme- to 50 pCi/g or less involves an additional
dial action for this island: (11 Make the 25,000 m3 of material.
Table C. SO-yr integral doses from all pathways compared to U.S. external back- ground dose.
Location
30-yr integral dose, rema
Unmodified soil case Modified soil case b
W. B. Bone W. B. Bone
Enewetak Atoll living pattern III (JANET- current conditions) 11 80 8.9 78
Enewetak Atoll living pattern III (JANET- pandanus and bread- fruit imported 1 6.5 25 4.2 23
Enewetak Atoll living pattern III (JANET- all agriculture con- fined to southern islands) 4.2 7.0 1.9 4.7
Enewetak Atoll living pattern I (southern islands 1 1.0 3.8 1.0 3.8
U. S. background onlyC 3.0 3.0 3.0 3.0
aSum of all pathways for the Enewetak living patterns (i.e., external, inhalation., marine, and terrestrial).
b Soil modified by placing 2 in. of clean gravel in the village area and plowing the
agricultural area.
‘Based upon background of 100 mrem/yr at sea level.
-v-
Acknowledgments
Successful completion of the Enewetak Radiological Survey was the result of the
effort and cooperation of many organizations. However, organizations are composed
of individuals, and it really has been the attitudes and abilities of these people upon
which so much has depended. We wish to acknowledge most heartily the efforts of all
participants - those who worked in the field, those who worked in the laboratories at
home, and those who provided support services so important to an efficient operation.
The list is long, but that is indicative only of the size and complexity of the oper-
ation. X’ery likely, in spite of our most diligent efforts, the names of some who par-
ticipated have been omitted. To them we extend our apologies and our appreciation.
All of the foilowing organizations and individuals have made significant contribu-
tions to the success of the AEC Enewetak Radiological Survey. To them, collectively
and individually, we express deepest thanks for a difficult job done well. This report
is long, and it contains an enormous amount of information, but it does not come close
to telling the whole story of what happened to all the individuals concerned from Sep-
tember 1972 to October 1973. That is the stuff of which reminiscences are made.
For simplicity, and to avoid even the appearance of a pecking order, organiza-
tions -and individuals within each organization -are listed in alphabetical order.
Walter E. Nervik Lawrence Livermore Laboratory Technical Director
Roger Ray AEC -Nevada Operations Office Program Manager
-vi-
AEC Headquarters
N. Barr E. Held F. Camm R. ?.Iaxwell J. Deal T. 3IcC raw W. Gay F. iVolff
Scvada Operations Office
F. Cluff .J. Pate M. Gates B. Rostankowski R. Lease .J. Stewart 0. Lynch L. Perrin P. Mudra
Pacific Area Support Office
1. Hetkowski W. Hills R. Marchand W. Streenan F. Van Rensselaer
Brookhaven National Laboratory (BNL)
R. Conard
l)efense Nuclear Agency (DNA)
G. Brown C. Dunn A. Futral R. Leachman W. Ogle
Eberline Instrument Corporation, Santa Fe, N. Mex.
R. Aguilar G. Phillips E. Geiger J. Price C. Gonzales J. Rodriquez K. Gustafson L. Romero M. Morgan E. Sanchez M. Ortiz K. Tyler W. Parker G. Young
Ia:G&G, Inc., Las Vegas, Nev.
J. Cleland J. Doyle T. Hendricks J. Hess F. Judd
M. Knighten R. Mazurkewiz R. Meibaum T. Stuart
l#:newetak Marine Biological Laboratory, University of Hawaii
I’. Helfrich et al.
-vii-
C‘nx-lronmental Protection Agency, Las \‘egas, Nev.
W. Bliss C. Costa G. Doran C. Fitzimmons D. James T. Lawson J. LIartin
L. RIiller W. Moore <J. Price L. Rozell J. Thrall J. ‘i7andervort
Environmental Protection Agency, Washington, D. C.
C. Weaxrer
Holmes and Narver, Inc.
J. Abrew H. Kami 0. Sammons F. Bertram E. Labogen C. Smith .J. Chambers G. Lara E. Tanaka E. Gilmore W. iLlorrison D. Testa R. Grewe H. Mutchler R. Woltz R. Harbert S. Xakamura S. Yamamoto .J. Johnson S. Robertson G. Yokono
LFE Environmental (Analysis Laboratories Division), Richmond, Calif.
L. Anderson M. Corsi G. Hankins C. Heitz N. Kahler K. Lee
L. Leventhal W. Major S. Martinez R. Melgard H. Moore V. Quan
Lawrence Livermore Laboratory (LLL)
A. Abbott J. Evans W. Abernathy E. Fletcher R. Anderson J. Fontanilla L. Anspaugh V. Fowler S. Avilla W. Goishi G. Barton P. Gudiksen B. Berger R. Gunnink R. Bishop C. Hanson N. Bonner J. Harder S. Brajkovich W. Hayes J. Breshears H. Hebard J. Brownlee H. Hicks M. Buchler T. Hoeger J. Bullock R. Hoff J. Button G. Holladay R. Carver K. Hulet J. Cate W. Hutchin M. Chew L. Jackson B. Clegg W. Jenkins D. Clifton P. Johnson D. Coles D. Jones A. Conover G. Jones E. Crank J. Koranda J. Dawson K. Lamson J. Dellis J. Landrum R. Dupzyk R. Lanier R. Eagle H. Lentzner
M. Tallman M. Thorne A. Towry R. Trenton R. Wessman
M. Lindner R. Lougheed 0. Lowe J. Lum L. Mann K. Marsh J. Martin W. Martin L. Maynard V. McIntosh D. McIntyre J. McNabb J. Meadows B. Mendoza F. Milanovich D. Myers L. Nelson F. Newbold R. Newbury Y. Ng J. Niday V. Noshkin W. Phillips G. Potter A. Prindle J. Pyper B. Qualheim
J. Rego B. Rich W. Robison N. Sawley J. Schweiger G. Seibel E. Snyder R. Stone M. Stuart C. Sundbeck R. Tandy R. Taylor S. Thompson T. Todaschiene L. Tolman E. Van Sant C. Veith J. Walton F. Warren E. Westkamper J. Wharton J. Wild E. Willes D. Wilson K Wilson K Wong R. Yoder
-viii-

1‘0s Alamos Scientific Laboratory (LASL)
c. Richmond
McClellan Central Laborarorp
R. Aduddell D. Fletcher C. Anderson R. Forehand J. Baca L. Foster D. Beach R. Gause W. Bingston F. Gross0 M. Bransfield L. Hammond M. Chambers TV. Hanna J. Cifelli R. Harrison M. Clark T. Hass D. Cleverige r H. Hawkins R. Davis E. Henry W. Delacy N. Hopkins D. Dittmer C. Hosier R. Draper I i. Hume W. Dunlap R. .Jefferies S. Ellingson R. Johnson H. Endebrock W. Kinch H. Erdman R. Kovach J. Eveland J. Kreer D. Fischer B. Lane
R. Lantz L. Lewis R. Lewis J. Lucas R. Lyman M. Macinnes J. McKethen G. Merrill G. Merrill W. Myers T. Niberger G. Nowark R. Osborne W. Partridge C. Passini D. Price J. Rebstock C. Rehault J. Renfrow N. Reybrock
W. Richey J. Riggs D. Roach G. Robinson S. Rober D. Runyon W. Rush R. San Miguel N. Savage B. School R. Smith P. Sparman D. Thomas J. Thomason P. Tudor K. Von Rodenstein R. Wagoner M. Watkins J. Wright
Micronesian Legal Services
T. Mitchell H. Barry
0 regon State University
W. Pearson
Pan American World Airways
L. Garner R. Reed F. Tyner
Reynolds Electrical Engineering Company, Communications Department -.
C. Fancher L. Miller M. Steinback
REECO-Environmental Science
G. Calvird I. Hensley
Scripps Institution of Oceanography
R. Nolan
The Administration of the Trust Territory of the Pacific Islands
0. DeBrum J. Tobin Ujilang Council (S. Gideon, Magistrate)
-ix-

LT. S. Air Force
Site Contractor at Enewetak-MATSCo Corp.
J. Stevenson et al.
SAMTEC Vandenberg
D. verble R. Wetzel
U. S. Army
Kwajalein Missile Range and Site Contractor, Global Associates
Tripler ?vIedical Facility
‘~5;. Babaian D. Frerichs .J. Pierce
Sixth Ordnance Detachment
D. Cambell C. Felts
U. S. Ccast Guard Loran Stations, Enewetak and Kwajalein
U. S. Marines, 462nd Heavy Marine Helicopter, Enewetak Detachment
T. Schmidt et al.
U. S. Navy Amphibious Base, Coronado, Calif.
Chief Alvarez et al. Chief J. Broyles et al.
U. S. Public Health Service, Health and Safety Laboratory
H. Beck J. McLaughlin
U. S. Public Health Service, Washington, D. C.
B. Shleien
University of Washington
A. Johnson R. Lusk V. Nelson W. Schell A. Seymour
-x-
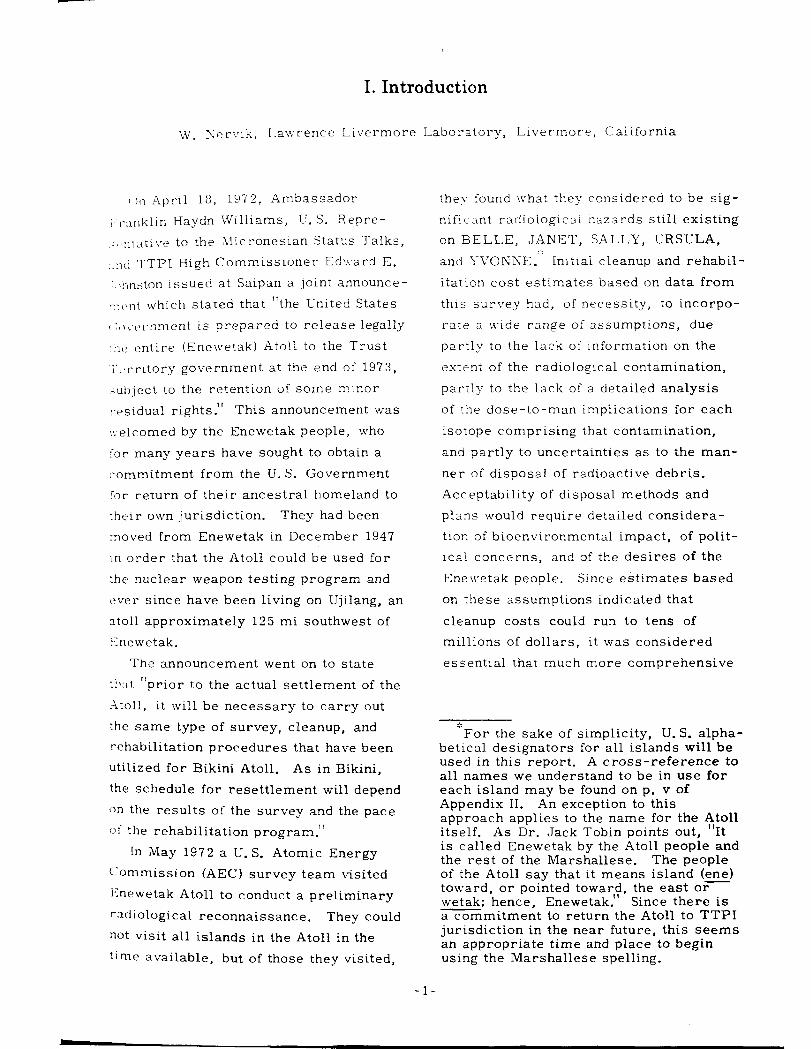
I. Introduction
w_ s\;rvik, Lawrence Livermore Laboratory, Livermore, California
(111 April 18, 1972, Ambassador
+anklin Haydn LVilliams, U. S. Repre-
;, illati~~e to the LIicronesian Status Talks,
_.:,(I ‘TTPI fIigh Commissioner EdT.vard E.
:,,hnston issued at Saipan a joint announce-
rc,nt which stated that “the United States
c :,,~c~r-nn~ent is prepared to release legally
-;lc entire (Enelvetak) Atoll to the Trust
.rtB[-rltory government at the end of 1973,
.<ubject to the retention of some minor
:-esidual rights.” This announcement was
..:.elcomed by the Enewetak people, who
for many years have sought to obtain a
commitment from the U. S. Government
for return of their ancestral homeland to
Their own jurisdiction. They had been
moved from Enewetak in December 1947
in order that the Atoll could be used for
:he nuclear weapon testing program and
ever since have been living on Ujilang, an
atoll approximately 125 mi southwest of
!Inewetak.
The announcement went on to state
:!1:1i “prior to the actual settlement of the
-itoll, it mill be necessary to carry out
the same type of survey, cleanup, and
rehabilitation procedures that have been
utilized for Bikini Atoll. As in Bikini,
the schedule for resettlement will depend
on the results of the survey and the pace
of the rehabilitation program.‘!
In May 1972 a U. S. Atomic Energy
Commission (AEC) survey team visited
Enewetak Atoll to conduct a preliminary
r.adiological reconnaissance. They could
not visit all islands in the Atoll in the
time available, but of those they visited,
they found what they considered to be sig-
nificrint radiological hazards still existing
on BELLE, JANET, SALLY, URSULA, .,:
and YVONKE . Initiai cleanup and rehabil-
itation cost estimates based on data from
this survey had, of necessity, to incorpo-
rate a wide range oi assumptions, due
parr!y to the lack of information on the
extent of the radiological contamination,
parrly to the lack of a detailed analysis
of the dose-to-man implications for each
isotope comprising that contamination,
and partly to uncertainties as to the man-
ner of disposal of radioactive debris.
Acceptability of disposal methods and
plans would require detailed considera-
tion of bioenvironmental impact, of polit-
ical concerns, and of the desires of the
Enewetak people. Since estimates based
on these assumptions indicated that
cleanup costs could run to tens of
millions of dollars, it was considered
essential that much more comprehensive
i’:
For the sake of simplicity, U.S. alpha- betical designators for all islands will be used in this report. A cross-reference to all names we understand to be in use for each island may be found on p. v of Appendix II. An exception to this approach applies to the name for the Atoll itself. As Dr. Jack Tobin points out, “It is called Enewetak by the Atoll people and the rest of the Marshallese. The people of the Atoll say that it means island (ene) toward, or pointed toward, the east or- wetak; hence, Enewetak.” Since there is a commitment to return the Atoll to TTPE jurisdiction in the near future, this seems an appropriate time and place to begin using the Marshallese spelling.
-l-
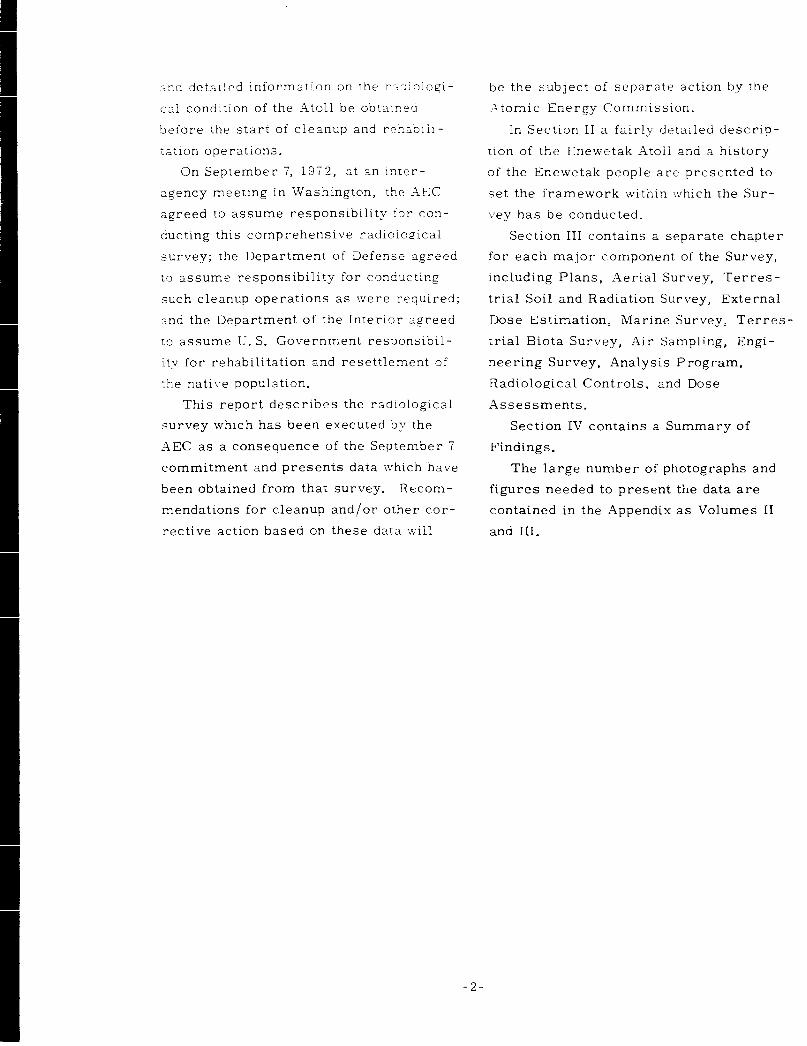
2nd detailed information on the r::,;ologi-
cal condition of the Atoll be obtainer
before the start of cleanup and rehabiii-
tarion operations.
On September 7, 19’i2, at an Inter-
agency meeting in Washington, the _AEC
agreed to assume responsibility for con-
ducting this comprehensive radioiogical
survey; the Department of Defense agreed
to assume responsibility for conducting
such cleanup operations as were required;
and the Department of the Interior agreed
to assume U. S. Government responsibil-
itv for rehabilitation and resettlement of
rhe native population.
This report describes the radiological
survey which has been executed by the
AEC as a consequence of the September 7
commitment and presents data which have
been obtained from that survey. Recom-
mendations for cleanup and/or other cor-
rective action based on these data will
be the subject of separate action by the
Atomic Energy Commission.
In Section II a fairly detailed descrip-
lion of the Enewetak Atoll and a history
of the Enewetak people are presented to
set the framework within which the Sur-
vey has be conducted.
Section III contains a separate chapter
for each major component of the Survey,
including Plans, Aerial Survey, Terres-
trial Soil and Radiation Survey, External
Dose Estimation, Marine Survey, Terres-
trial Biota Survey, Air Sampling, Engi-
neering Survey, Analysis Program,
Radiological Controls, and Dose
Assessments.
Section IV contains a Summary of
Findings.
The large number of photographs and
figures needed to present the data are
contained in the Appendix as Volumes II
and III.
-2-

II. Enewetak
R. Ray, Nevada Operations Office, Le. S. _ltomlc Energy Commission, Las Vegas, Nevada
J. Koranda and K. Marsh, Lawrence Livermore Laboratory, Livermore, California v. Nelson, University of Washington, Seattle, Washington
l’ortions of this chapter are largely
:~~.:~\vn from a working draft of the manu-
sc:rlpt which is to become the Draft
l.;ilvl ronmental Impact Statement for
i.;ne\vetak cleanup. This statement is
\,cing prepared by Holmes and Narver,
inc. under contract to the Department Of
Ijefense. We are indebted to the Defense
Nuclear Agency for permitting use of the
statement and to Dr. Stanley Kaplan of
llolmes and Narver for his assistance
toward its timely availability. Dr. Jack
‘robin, a major contributor to the Kaplan
effort, was also consulted extensively on
history and anthropology in relation to
other sections of this report. The last
s;cbction of this chapter is drawn from
field trip reports of Kenneth Marsh and
\‘ictl~t- Nelson.
I*:NEWETAK ATOLL-HISTORY AND STATUS
Enewetak Atoll Island Names
Recause the native names of most of
the islands in the Enewetak Atoll are
difficult for English-speaking people to
pronounce and spell, male and female
first names were assigned to the islands
(luring the U. S. occupancy. Site names
w(‘r(’ also given to several points in the
lagoon and on the reef where scientific
structures had been erected. Nearly
all documents and maps made subsequent
to 1952 include these site names, and in
some cases the native names are also
shown in parentheses.
Table 1 presents a correlation of
these site names with the native names
obtained from the Enewetak people during
the Ujilang field trip in August 1973,
and from the U.S. Hydrographic Office
Charts. It is interesting to note the
influence of the Japanese romanization
on the names given in the hydrographic
charts.
Physical Description of Enewetak Area
Geography
Enewetak Atoll is the northwestern-
most atoll in the Western (Ralik) Chain of
the Marshall Islands, forming the north-
ern part of Micronesia in the central
Pacific Ocean (regional map, Fig. 1).
The location is 11” 21’N, 162” 21’E,
approximately 550 naut mi southwest of
Wake Island, 189 naut mi west of Bikini
Atoll, and 2380 naut mi southwest of
Honolulu.
The Atoll consists of 40 islands on an
elliptical reef approximately 23 by
17 naut mi, with the long axis running
northwest to southeast. The total land
area is 2.75 mi2, with the land height
generally averaging 10 ft above mean sea
-3-
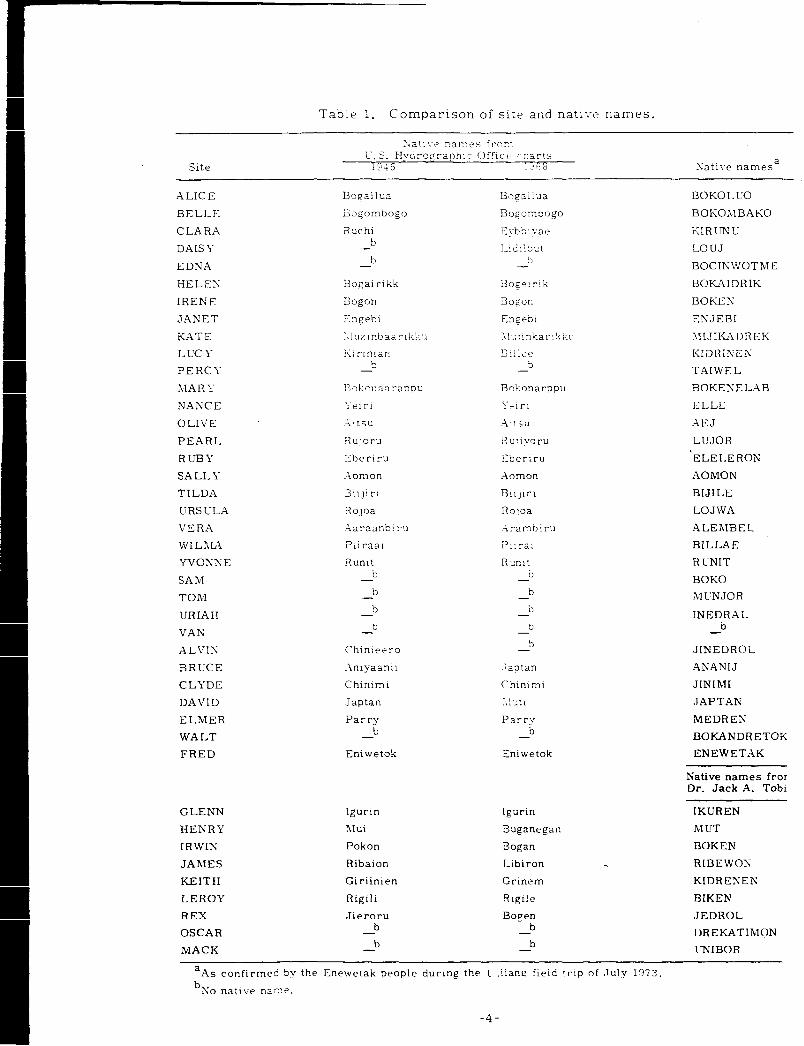
Table 1. Comparison of site and nati:-e names.
Site Satire namesa
XLIC E
BELLE
CLARA
DAISY
EDNA
HELES
IRENE
JANET
KATE
1, UC f
PERCT
LIAR I-
NANCE
0 LIVE
PEARL
RUBY
SALLY
TILDA
URS CLA
VERA
WILALA
YVOXN E
SAM
TOM
URIAH
VAN
ALVI?;
BRUCE
CLYDE
DAVID
ELhlER
WALT
FRED
Boqallua
Esgombogo
Ruchl b -
h -
Rogalrikk
Uogon
!7ngebi
:\luzinbaar-lkk:i
tilrlnian h -
Bokonaaranou
‘:-e1 r-l
.i1tsu
RuJoru
Eberiru
4omon
Biljiri
Ko.loa
.iaraanb! ru
Pli raal
Rumt b -
h - b -
b -
Chin:eero
_imyaanli
Chinlml
Japtan
Parry b -
Ro!:onarppu
\-Zlrl
_A!ISU
RU:lJTrU
Eberiru
.\omon
BllJirl
Roloa
.+iramb!ru
I’!: ral
R-2nit b -
b -
0 -
b -
b -
Tagran
<‘hlnlrnl
‘*l.zri
Parry b -
Eniwetok Eniwetok
Boeaiiua
Boeom?oo,go
Eybo:yae
1_:3:!Sut :, -
Boee:r1k
Ropon
Engeb1
1l.;:!nkar!‘kk~:
B y 1 i * p :, -
BOKOLUO
BOKOXIBAKO
KIRUNU
LOIJJ
BOCIlXiWOTME
BOKAIDRIK
UOtiEN
ENJEBI
SltJIK-4DREK
KIDRINEX
TAIWEL
BOKENELAB
ELLE
AEJ
LUJOR
‘ELELEROX
AOMON
BIJILE
LOJWA
ALERIBEL
BILLAE
R UNIT
BOKO
.&I;IUNJOR
INEDRAi b -
JINEDROL
ANANIJ
JINIMI
JAPTAPi
MEDREiX
BOKANDRETOK
ENEWETAK
GLENN
HENRY
IRWIN
JAhlES
KEITH
LEROY
REX
OSCAR
MACK
Igurin
Xlui
Pokon
Ribaion
Giriinien
Rigili
Jieroru b -
b -
tgurin
Buganegan
Bogan
Libiron
Grinem
Rigiie
Bogen b -
b -
Native names fror Dr. Jack A. Tobi
IKUREN
MUT
BOKEN
RIBEWOX
KIDRENEX
BIKEN
JEDROL
I)REKATIMON
I’NIBOR
aAs confirmed by the Enewetak people during the Clilan~ field trip of .Tuly 1073. b
So native naze.
-4-

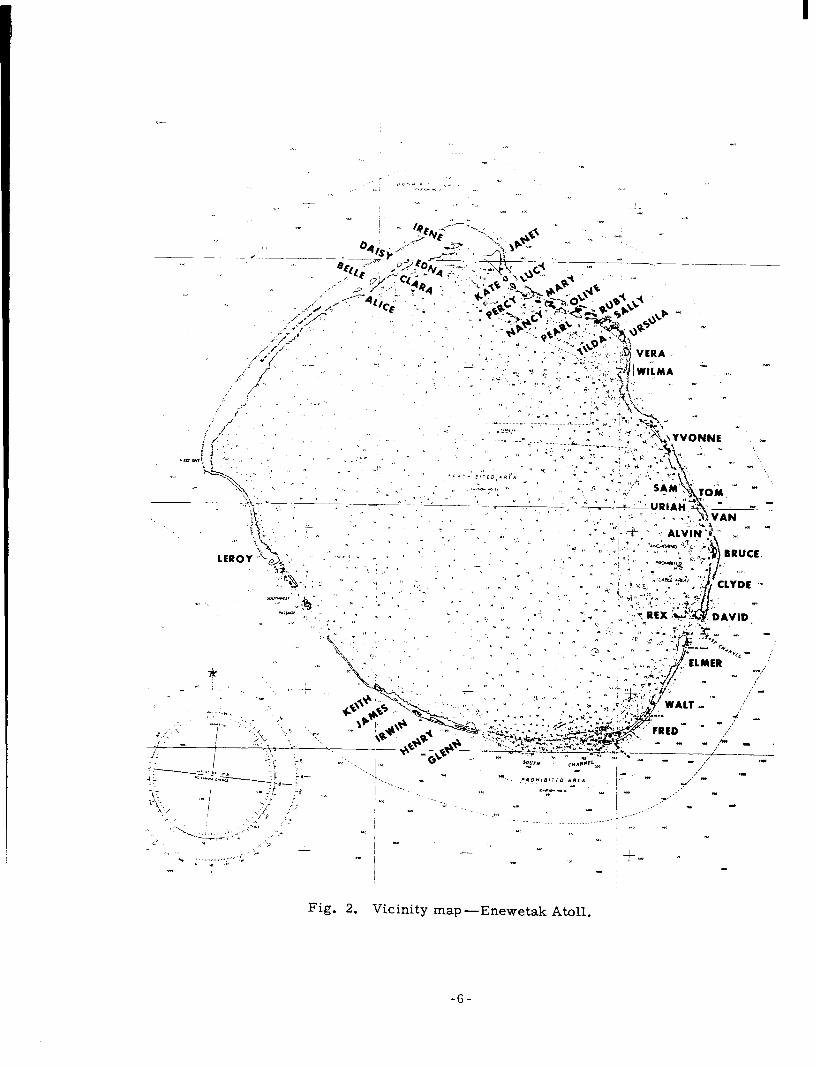
level. The vicinity map (Fig. 2) shows
the Atoll configuration.
The lagoon, which is about 388 mi2 in
area, has three entrances: an east chan-
nel approximately 180 ft deep, between
DAVID and ELMER; a 6-ml wide channel
to the south; and a shallow (approximately
4 fathoms maximum depth) channel to the
southwest. Tidal currents vary from up
to 2 knots in the deep channel to 1 knot in
the south channel.
Geology
Enewetak Atoll is 15,000 ft above the
ocean floor, while the top of the eroded
volcano forming the island base is approx-
imately 4200 ft below the surface. Steep
coralline reefs reaching to the surface
form a flat oval ring of reef and low-
lying islands, within which is a shallow
Enewetak is a classic example of the
Darwinian concept of atoll formation in
T.vhich an atoll is born when an oceanic
voicano surrounded by a fringe coral reef
begins to slowly subside below the ocean
lel.-el. As the coral and coralline algae
(which require shallow, clear, warm,
oxygenated marine waters) maintain an
upward growth commensurate with the
subsidence, a fringe reef flourishes,
particularly on the ocean side. AS the
\-olcano continues to subside, the fringe
reef gives way to a barrier reef, and
Then to an atoll.
Since the northeast trade winds vary
little in their direction, the reefs on the
windward and leeward sides of the atoll
are distinctly different. A greater vol-
ume of ocean water, carrying nutrients
necessary for coral growth, flows over
lagoon with a maximum depth of about the windward side due to the fvind-
200 ft. generated ocean currents. Therefore,
140° 160° 180” l&I0 -- l c/Y
300 0 300 600
Graphic scale in nautical miles Midway
* . . .
t . .
. . “’ \.
Marianas :. l Wake
Hawaiian
Islands 0
Islands 1. * Johnston .
Guarrp’ *. Enewetak Atoll
\ -Bikini Atoll * . . *. , - Truk * *:
* . . . w 0.. . . : - .* . . ’ * Marshall
. , , Kwajalein ‘- ‘S * . b *&lands .
Caroline Islands , 8 Gilbert . Canton ’ Christmas
\(ew Guinea, . ‘islands Island ‘Island
Solomon Islands ‘.., .
: . . :.
,. I . . I
9
-2
-0O”
!O"
Fig. 1. Regional map - Central Pacific Ocean.
-j_
.,
WiMA -
Fig. 2. Vicinity map -Enewetak Atoll.
-6-
,,,ore rapid gron-rh occurs on the wind-
ward side, which nas a slightly elevated
ridge at the reef edge, -.r-hile there is
none on the leeward side. The leeward
side drops sharply to ocean depths up to
360 ft, whereas the windward reef slopes
seaward at about a 45-deg angle.
Four near-surface geologic regions
can be distinguished at Enewetak Atoll:
island, interisland, ocean reef, and
lagoon. Descriptions of the island and
ocean reef geology can be given, based on
core samples from 50 holes drilled dur-
ing the nuclear testing program (Cooper
and Pratt, 19681. So records are avail-
able of the interisland and lagoon geo-
logics; hence, these can only be inferred.
The island geologic profile consists of
unconsolidated coral sands and gravels,
saturated below the water table and ex-
tending from the surface to a maximum
depth of 150 ft. The water table varies
with the tide; its amplitude decreases
rapidly with distance from shore. Typi-
cal water depths (elevation of island
above mean tide) are 5 to 8 ft. At the
intertidal level, a l- to 5-ft layer of
beach rock (calcium-carbonate-cemented
coral sands and gravels) is usually found;
the exposed portions of the rock form
most of the shore line. The rock
strength ranges from hand-crushable to
high-strength sandstone, decreasing in
strength as well as thickness from ocean
to lagoon. Below the unconsolidated
coral sands and gravels, there is an
reef horizon going from the ocean to
lagoon side at depths of 50 to 150 ft.
This reef horizon is gradational and
old
porous, consisting of large detrital and
in situ coral fragments, with fine sands
and muds occupying the voids.
The ocean reei proiile shon-5 2 Sinl-
ilarlty to the island profile, esce?: that
the upper surface layer consists oi a
wave-planeated, dense, algal-ll;nestone
reef flat composed of detrital and in situ
coral. The thickness of the upper reef
horizon l-aries from 0 to 15 ft, :,rogress-
ing outward from the island, and :S com-
posed of a dense algal limestone. Of two
holes drilled into the S-ALLY reef ?roper,
one penetrated a 35-ft sand and grax-el
horizon between the upper and lov:er
reefs; the other did not. It is inferred,
based upon limited drilling and general
atoll physiography, that the ocean reef
geology is more heterogeneous than the
island geology, containing numerous
large coral heads, caverns, etc.
The interisland geologic profile can be
presumed to be similar to the island geo-
logic profile, except for the possibility
that the top 10 to 40 Et of rock and sand
has been eroded away by the sea.
The lagoon geologic profile probably
consists of soft, fine sediments to a
depth of a few hundred feet, with inter-
mixed and sporadic lagoonal coral heads.
The depth of the lower reef horizon, if it
exists, is probably greater than a few
hundred feet.
Climatology
Enewetak’s climate is the tropical
marine type, with temperatures ranging
from 7 1 to 94°F and relative humidity in
the 73 to 80% range. There is much
cumulus cloud cover, moderate rainfall
(57 in. mean annual rainfall), and, to a
lesser extent, constant northeasterly
trade winds (0 to 30 knots). Most depres-
sions or tropical storms occur during the
months of September through December,
-7-

although they are possible at any time of
the year. A climatological summary
of Enewetak Atoll for a 12-yr period, as
prepared by the U.S. ,4ir Force Environ-
mental Technical Xpplications Center, is
shown in Table 2.
Hydrology
Enewetak Atoll relies on rainfall for
its supply of fresh water. Since the soil
is extremely porous, drainage of rainfall
by downward percolation through the
ground is rapid. This “groundwater”
makes contact at its lower face with
marine water that has infiltrated through
the porous rock from the sea and lagoon.
Fresh water poured on an open body of
salt water will quickly spread over the
surface of the salt, and through currents
and waves will become thoroughly mixed
with the salt water, Porous rock, how-
ever, interposes an obstacle to this rapid
spread and restricts the mixing of the
light fresh y.vater with the denser salt
water. The fresh water is only about
40141 as hea\ as salt seawater and
floats on the salt water, displacing 40
parts of seawater for each part of fresh
water floating above the normal saltwater
level. That is, fresh water seeping to
basal groundwater level on coral atolls
and other porous islands has a depth that
is about 40 times the head or elevation of
its lvater table above sea level (Fig. 3).
This head or hydraulic gradient of water
tends to seek sea level by lateral flow
through the restricting rock. This prin-
ciple of freshwater displacement of salt
water in islands and coastal areas is
known as the Ghyben-Herzberg law, after
its discoverers. As the head of water
Table 2. Meteorological observations for Enewetak Atoll over a 12-yr period.
Parameter description Jan Feb Mar Apr May Jun Jul Aug Sep Ott Nov Dee Annual
Absolute max temp, “F
Mean max temp. “F
Mean min temp. “F
Absolute min temp, “F
Mean relative humidity, “/‘o.
Mean precip., in.
Mean No. days precip. 2 0.1 in.
Mean No. days of thun- derstorms
P freq. wind spd 2 17 knots
P freq. wind spd 2 28 knots
88 88 89
85 85 86
78 78 78
71 73 73
73 73 75
1.03 0.85 1.73
3.4 2.5 4.3
0.0 0.0 0.0
47.4 56.2 49.4
0.2 0.3 0.5
so 91 20 Of! 01 0 3 91 94 88
86 86 67 a7 87 88 87 86 86
78 78 7S 79 70 79 79 79 78
72 73 73 71 72 72 71 72 71
76 78 79 80 80 79 79 78 76
2.47 5.65 -1.06 7.12 6.67 6.76 9.76 7.26 3.6
5.3 9.2 0.6 13.0 13.1 13.1 14.0 13.0 7.2
0.0 0.2 0.4 1.3 0.9 1.4 1.9 0.5 0.2
47.9 36.7 27.6 11.4 9.3 7.0 9.1 34.7 47.5
0.1 0.1 0.1 0.1 0.1 0.1 0.2 0.7 1.5
94
86
79
71
77
1 57.0
108.3
6.0
32.2
0.3
8-
W-
apid
1
sh
ater
0
1s
:hat
n of
I).
ter
*in-
3.1t
fter
nnual
1,4
86
79
71
77
57.0
08.3
6.0
32.2
0.3
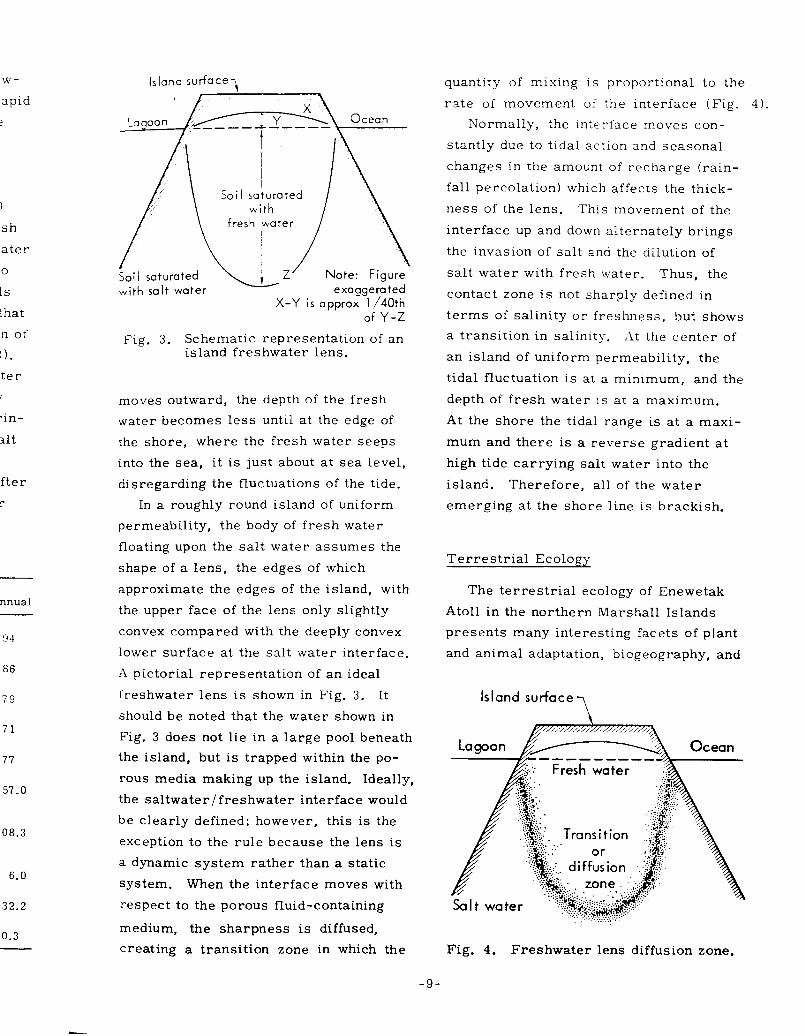
Island surface ? *
Soil saturated
with salt water X-Y is approx 1/40th
of Y-Z
Fig. 3. Schematic representation of an island freshwater lens.
moves outward, the depth of the fresh
water becomes less until at the edge of
the shore, where the fresh water seeps
into the sea, it is just about at sea level,
disregarding the fluctuations of the tide.
In a roughly round island of uniform
permeability, the body of fresh water
floating upon the salt water assumes the
shape of a lens, the edges of which
approximate the edges of the island, with
the upper face of the lens only slightly
convex compared with the deeply convex
lower surface at the salt water interface.
A pictorial representation of an ideal
ireshwater lens is shown in Fig. 3. It
should be noted that the water shown in
Fig. 3 does not lie in a large pool beneath
the island, but is trapped within the po-
rous media making up the island. Ideally,
the saltwater/freshwater interface would
be clearly defined; however, this is the
exception to the rule because the lens is
a dynamic system rather than a static
system. When the interface moves with
respect to the porous fluid-containing
medium, the sharpness is diffused,
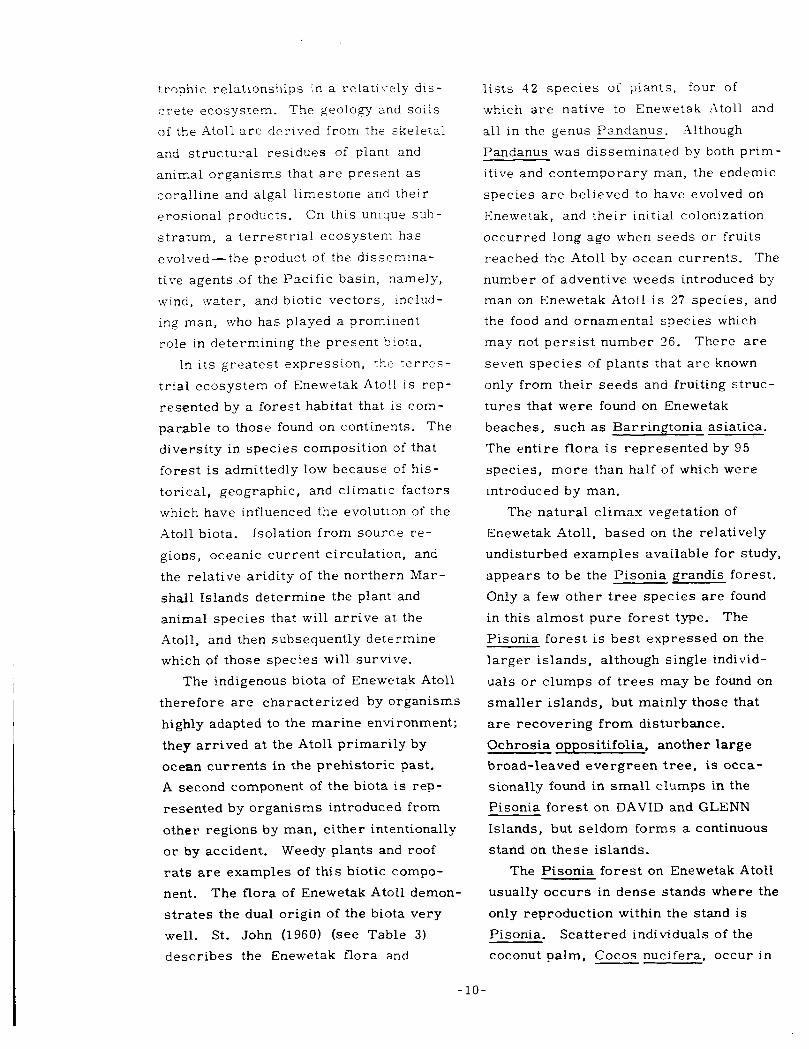
creating a transition zone in which the
quantity of mising is proportional to the
rate of movement of the interface (Fig. 1).
Normally, the mterface moves con-
stantly due to tidal acrlon and seasonal
changes in the amount of recharge (rain-
fall percolation) which affects the thick-
ness of the lens. This movement of the
interface up and down alternately brings
the invasion of salt and the dilution of
salt water with fresh water. Thus, the
contact zone is not sharply defined in
terms of salinity or freshness, but shows
a transition in salinity. At the center of
an island of uniform permeability, the
tidal fluctuation is at a minimum, and the
depth of fresh water is at a maximum.
At the shore the tidal range is at a maxi-
mum and there is a reverse gradient at
high tide carrying salt water into the
island. Therefore, all of the water
emerging at the shore line is brackish.
Terrestrial Ecology
The terrestrial ecology of Enewetak
Atoll in the northern Marshall Islands
presents many interesting facets of plant
and animal adaptation, bicgeography, and
Fig. 4. Freshwater lens diffusion zone.
9-
trophic relationships in a retatix-ely dis-
crete ecosystem. The geolom and soils
of the Atoll are derived from the skeletal
and structural residues of plant and
animal organisms that are present as
coralline and algal limestone and their
erosional products. On this unique suh-
stratum, a terrestrial ecosystem has
evolved -the product of the dissemina-
tive agents of the Pacific basin, namely,
wind, water, and biotic vectors, lnclud-
ing man, who has played a prominent
role in determining the present biota.
In its greatest expression, the terres-
trial ecosystem of Enewetak Atoll is rep-
resented by a forest habitat that is com-
parable to those found on continents. The
diversity in species composition of that
forest is admittedly low because of his-
torical, geographic, and climatic factors
which have influenced the evolution of the
Atoll biota. Isolation from source re-
gions, oceanic current circulation, and
the relative aridity of the northern Mar-
shall Islands determine the plant and
animal species that will arrive at the
Atoll, and then subsequently determine
which of those species will survive.
The indigenous biota of Enewetak Atoll
therefore are characterized by organisms
highly adapted to the marine environment;
they arrived at the Atoll primarily by
ocean currents in the prehistoric past.
A second component of the biota is rep-
resented by organisms introduced from
other regions by man, either intentionally
or by accident. Weedy plants and roof
rats are examples of this biotic compo-
nent . The flora of Enewetak Atoll demon-
strates the dual origin of the biota very
well. St. John (1960) (see Table 3)
describes the Enewetak flora and
lists 42 species of plants, four of
which are native to Enewetak -1toll and
all in the genus Pa.ndanus. Although
Pandanus was disseminated by both prim-
itive and contemporary man, the endemic
species are believed to have evolved on
Enewetak, and their initial colonization
occurred long ago when seeds or fruits
reached the Atoll by ocean currents. The
number of adventive weeds introduced by
man on Enewetak Atoll is 27 species, and
the food and ornamental species which
may not persist number 26. There are
seven species of plants that are known
only from their seeds and fruiting struc-
tures that were found on Enewetak
beaches, such as Barringtonia asiatica.
The entire flora is represented by 95
species, more than half of which were
introduced by man.
The natural climax vegetation of
Enewetak Atoll, based on the relatively
undisturbed examples available for study,
appears to be the Pisonia grandis forest.
Only a few other tree species are found
in this almost pure forest type. The
Pisonia forest is best expressed on the
larger islands, although single individ-
uals or clumps of trees may be found on
smaller islands, but mainly those that
are recovering from disturbance.
Ochrosia oppositifolia, another large
broad-leaved evergreen tree, is occa-
sionally found in small clumps in the
Pisonia forest on DAVID and GLENN
Islands, but seldom forms a continuous
stand on these islands.
The Pisonia forest on Enewetak Atoll
usually occurs in dense stands where the
only reproduction within the stand is
Pisonia. Scattered individuals of the
coconut palm, Cocos nucifera, occur in
-lO-

Table 3. The i!ora of Enewetak Atoll (as reported by St. John, 1960).
d
,-
C
Scientific name
Species
Common name
Vernacular name Remarks
Trees
Pandanus brachypodus
Pandanus enchablensis
Pandanus korrorensis
P andanus odoratissimus var. novocaledonicus
Pandanus odoratissimus var. novoguineensls
P andanus pulposus
Pandanus rectangulatus
Pandanus rhombocarpus
Pandanus utiyamai
Cocos nucifera
Artocarous incisus
Pisonia grandis
Hernandia Sonora
Aleurites moluccana
Sapindus saponaria
Carica papaya
Rhizophora mangle
Terminalia samoensis
Ochrosia oppositifolia
Pandanus Punmusi
Maok
Pandanus leaves are used for weaving plaited goods and thatch.
Bop
Bop
Bop
Jilebar
Coconut palm
Anilip
Papparawa
Bop
Breadfruit Me
Kangae
Bingbing
Papaya Keinapu
Kugung
Kijebar Tissues poisonous.
Used for food and copra production.
Of aboriginal cultivation. Tree 8 m tall observed on Japtan, 1944.
Abundant, forming for- ests on better habitats.
Fruits found on beaches, 1958.
Found only as seed on sea drift.
Found as seeds on beaches.
Recently introduced fruit tree. Observed 1958.
Introduced tree, re- stricted to tidal salty shores.
-ll-
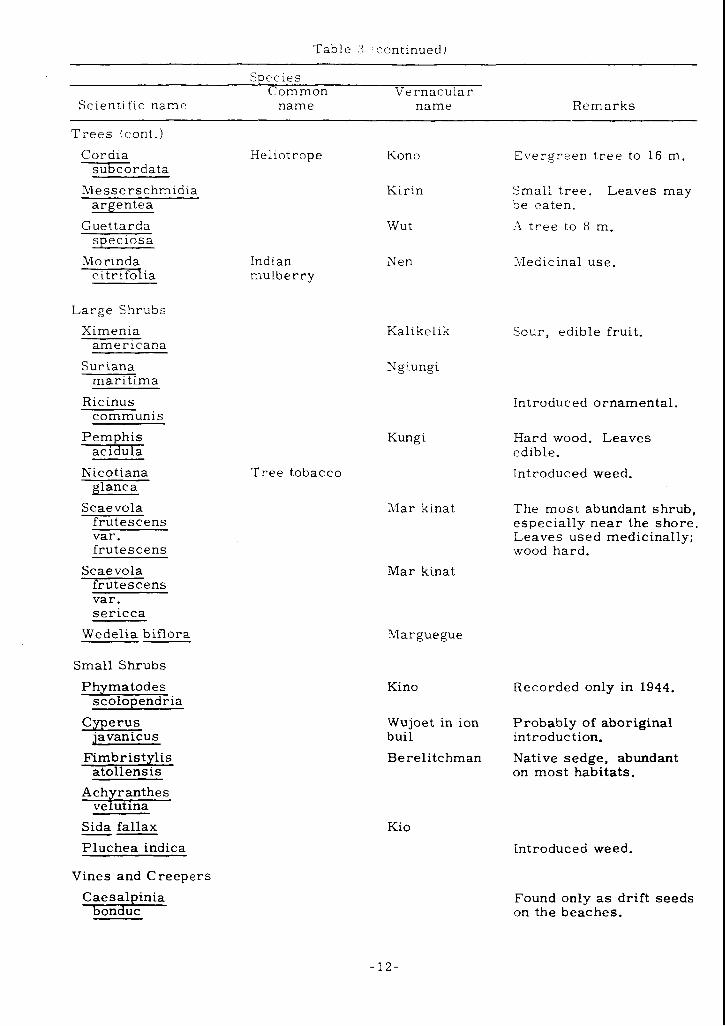
Table :3 continued)
SDecies
Scientific name Common
name Vernacular
name Remarks
Trees (cont.)
Cordia xrdata
Heliotrope Kono E\,ergreen tree to 16 m.
Messerschmidia argentea
Guettarda speciosa
Morinda citrifolia
Indian mulberry
Kirin
Wut
Small tree. Leaves may be eaten.
-4 tree to 8 m.
Nen YIedicinal use.
Large Shrubs
Ximenia americana
Suriana maritima
Ricinus communis
Pemphis acidula
Nicotiana glanca
Scaevola frutescens var. frutescens
Scaevola frutescens var. sericca
Wedelia biflora
Small Shrubs
Phymatodes scolopendria
Cyperus
A$[i;i.hes
Sida fallax -- Pluchea indica
Vines and Creepers
C;z;;tpcinia
Kalikelik Sour, edible fruit.
Ngiungi
Kungi
Tree tobacco
Alar kinat
Mar kinat
;Llarguegue
Introduced ornamental.
Hard wood. Leaves edible.
Introduced weed.
The most abundant shrub, especially near the shore. Leaves used medicinally; wood hard.
Kino Recorded only in 1944.
Wujoet in ion buil
Berelitchman
Probably of aboriginal introduction.
Native sedge, abundant on most habitats.
Kio
Introduced weed.
Found only as drift seeds on the beaches.
-12-

Table 3 (continued)
Species Common 1;ernacular
scientific name name name Remarks
\-ines and Creepers (cont.)
Canavalia mic rocarpa
Dioclea reflexa
Entada phaseoloides
urens AIaguna
Marlap
Phaseolus lulgaris
Vigna marina
Triumfetta Drocumbens
Ipomoea pes-caprae
Ipomoea purpurea
Ipomoea tuba
Citrullus v-ulgaris
Cucumis me10
Cucurbita maxima
Grasses
C enchrus brownii
Cenchrus echinatus
Chloris inflata Introduced weed.
Cynodon dactylon
Bermuda grass
Deliberately introduced as lawn grass and as sand binder.
Dactyloctenium aegyptium
Digitaria pruriens
Eleusine indica
E;z;os;s
Lepturus repens var. repens
Setaria verticillata
String beans
hlarkine!ojo
Adat
Marginejojo
Common morning glory
Watermelon
Marbele
Cantaloupe
Sandbur
Crab grass
Goose grass
Love grass
Legalek
Wujoich
Ujos aitok
Bristly foxtail
Known here only as seeds in the sea drift.
Drift seeds on beach of Engebi.
In gardens.
A trailing r.lne used in weaving.
Cultivated ornamental.
Once grown in gardens.
Once grown in gardens.
Observed in gardens, 1944.
Introduced weed.
Introduced weed, abun- dant and troublesome in disturbed soils.
Introduced weed.
Introduced weed.
Introduced weed.
Common, but apparently an introduced weed.
The commonest native grass.
Introduced weed, abun- dant in disturbed soil near settlements.
-13-
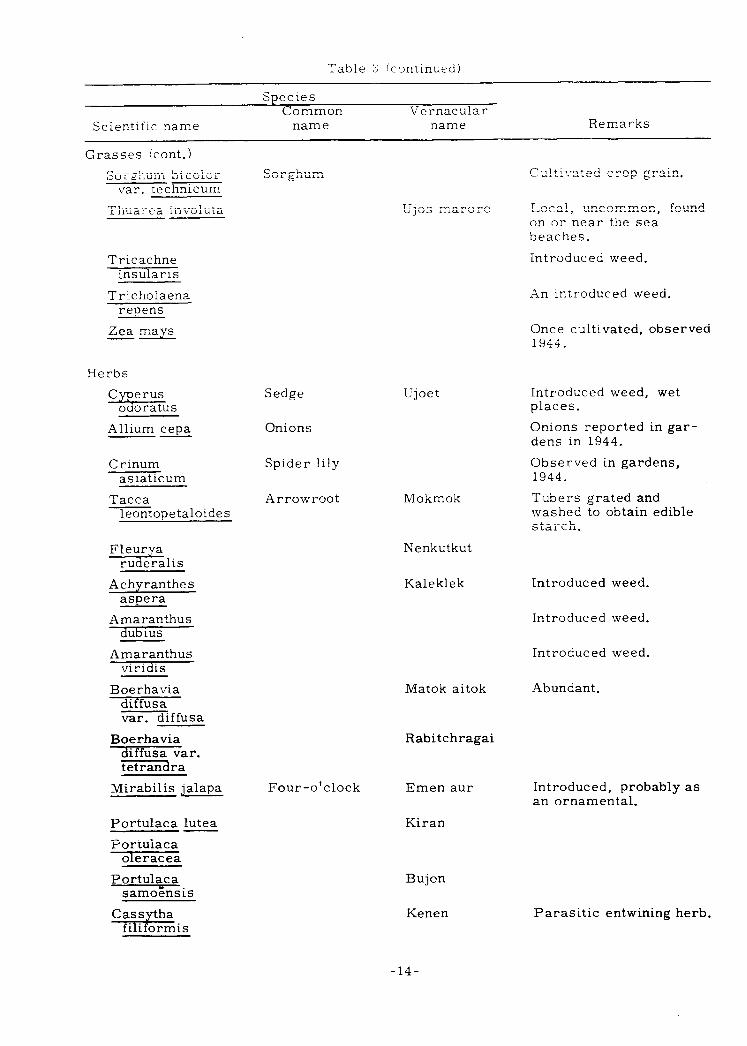
Table :! (continued)
Species Common Vernacular
Scientific name name name Remarks
Grasses (cont.)
SorEhum bicolor var. technicum
Thuarea involuta
Tricachne insularis
Tricholaena repens -
Zea mays
Herbs
??Ei_lS
Allium cepa
C rinum asiaticum
Tacca leontopetaloides
Fleurya ruderalis
Achyranthes aspera
Amaranthus dub ius
Amaranthus viridis
Boerhavia aiffusa
mffusa
Boerhavia diffusa var. tetrandra
Mirabilis jalapa
Portulaca lutea
Portulaca oleracea
Portulaca samo&sis
Sorghum Cultivated crop grain.
Ujos maroro
Ujoet
Arrowroot Mokmok
Local, uncommon, found on or near the sea beaches.
Introduced weed.
An introduced weed.
Once cultivated, observed 1944.
Sedge
Onions
Introduced weed, wet places.
Onions reported in gar- dens in 1944.
Spider lily Observed in gardens, 1944.
Tubers grated and
Nenkutkut
washed to obtain starch.
edible
Kaleklek Introduced weed.
Introduced weed.
Introduced weed.
Matok aitok
Rabitchragai
Abundant.
Four-o’clock Emen aur
Kiran
Introduced, probably as an ornamental.
Bujon
Kenen Parasitic entwining herb.
-14-
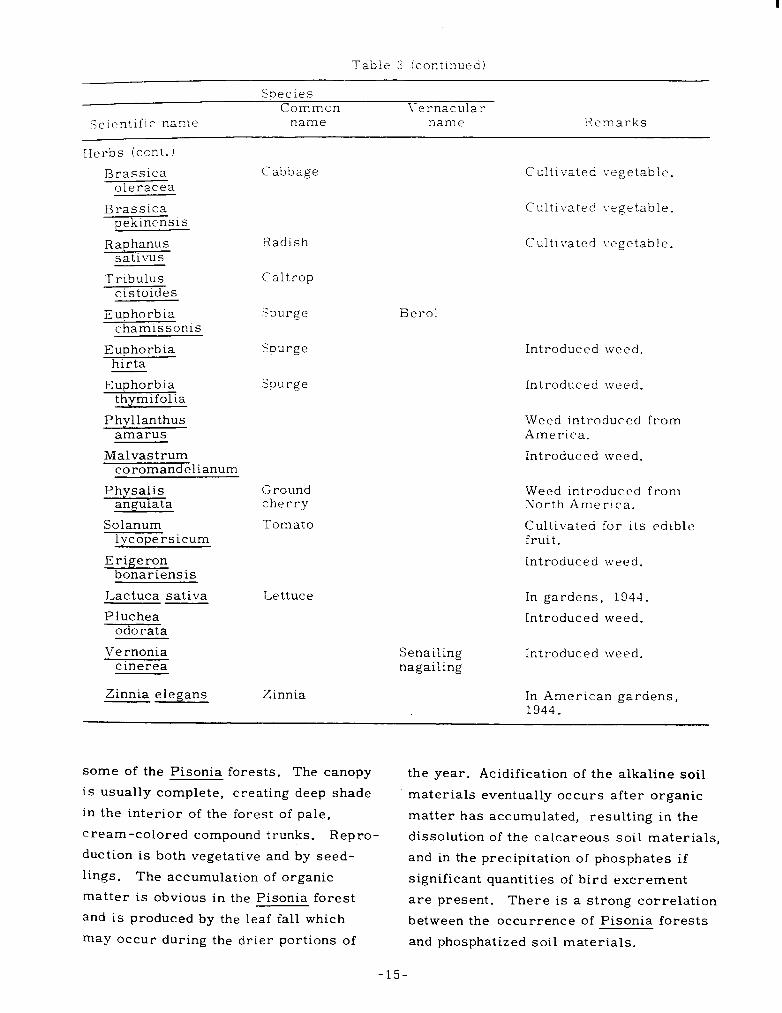
Table 2 (continued)
Scientific name
species Common
name \-ernacular
name Remarks
Ilcrbs (cont.)
Brassica oleracea
Brassica pekinensis
Raphanus sativus
T ribulus cistoides
Euphorbia chamissonis
Euphorb ia hirta
Euphorbia thymifolia
Phyllanthus amarus
Malvastrum coromandelianum
%$%?a
Solanum lycopersicum
Erigeron bonariensis
Lactuca sativa
Pluchea odorata
ire rnonia cinerea
Zinnia elegans
Radish Cultivated l.egetable.
Caltrop
5nurge
Spurge
Spurge
Berol
Introduced weed.
Introduced weed.
Cabbage Cultivated vegetable.
Cultivated vegetable.
Ground cherry
Tomato
Lettuce
Weed introduced from America.
Introduced weed.
Weed introduced from North America.
Cultivated for its edible fruit.
Introduced weed.
In gardens, 1944.
Introduced weed.
Senailing nagailing
Introduced weed.
Zinnia In American gardens, 1944.
some of the Pisonia forests. The canopy
is usually complete, creating deep shade
in the interior of the forest of pale,
cream-colored compound trunks. Repro-
duction is both vegetative and by seed-
lings. The accumulation of organic
matter is obvious in the Pisonia forest
and is produced by the leaf fall which
may occur during the drier portions of
the year. Acidification of the alkaline soil
materials eventually occurs after organic
matter has accumulated, resulting in the
dissolution of the calcareous soil materials,
and in the precipitation of phosphates if
significant quantities of bird excrement
are present. There is a strong correlation
between the occurrence of Pisonia forests
and phosphatized soil materials.
-15-
Occasionally a large specimen of
2lesserschmidia argentla may persist in
the Pisonia forest stand, usually at the
outer edge. The other ubiquitous tree
species, Scaevola frutescens, is seldom
found in the Pisonia forest.
Two halophytic tree species are wide-
spread on Enewetak Atoll and are found
on most land surfaces, creating dense
scrubby stands on islands recovering
from test-period activities. The scat-
tered to continuous stands of Messer-
schmidia argentea and Scaevola frutes-
tens very likely represent a subclimax
stage of the Atoll vegetation which will
eventually develop into the Pisonia forest.
Two other woody species occur occasion-
ally in the vegetation types found on the
Atoll, either in the Messerschmidia-
Scaevola stands or at the edges of the
Pisonia forest. These trees are Morinda
citrifolia and Guettarda speciosa. Scat-
tered individuals of these species are
found on most of the islands, even those
recently disturbed, which seems to indi-
cate an effective means of seed dispersal.
Another tree, Cordia subcordata. occurs
on islands with well-developed forest
types on them, but stands of any great
extent have not been seen. Four other
species of woody plants may be found
occasionally, mixed in with Messer-
schmidia and Scaevola or at the edges of
the Pisonia forest. These are Ximenia
americana, Suriana maritima, Pemphis -- acidula, and Terminalia litoralis. Most
of the woody plant biomass of the islands
on Enewetak Atoll is formed by the four
species, Messerschmidia argentea,
Scaevola frutescens, Pisonia grandis,
and Cocos nucifera.
The following simplified vegetation
tJQeS are suggested and provide a useful
framework of habitats upon which the
rest of the biota depends, either for food
or
l
l
l
l
shelter and nesting sites:
Pisonia grandis forest with coconut
palms.
Messerschmidia-Scaevola scrub for-
est: scattered to dense stands, with
young coconut palms.
Sedge-grass-morning glory meadows:
often with the parasite Cassytha, scat-
tered shrubs such as Pluchea and m.
Grassy flats and beaches: usually
near bird rookeries on small, recently
formed islands.
Obvious relationships between plant
species distribution and the low-relief
topography are not apparent, although the
general pattern of Messerschmidia-
Scaevola scrub vegetation surrounding a
central forested area occurs on most of
the larger, undisturbed islands. The
unobservable factor of substratum water
conditions is very likely a strong determi-
nant in the plant ecological characteris-
tics of a given site. The vascular plants
depend either upon rainwater held in the
interstitial space of the coral sand or
deeper groundwater for their water re-
quirements. The presence of Ghyben-
Herzberg lenses of fresh or brackish .I
water at shallow depths in lenses beneath
the central portions of the larger islands
undoubtedly affects and promotes the
lusher growth of these habitats.
The position of the island on the reef
and exposure to storm waves may create
conditions that favor the growth of the
more halophytic species in the flora. Of
16-
I-I
eful
food
Lit
‘or-
ith
ows :
scat-
-.
t2ntly
nt
?f
h the
lg a of
iter
ermi-
,is-
ants
the
‘e-
l-
.eath
mds
eef
eate
e
Of
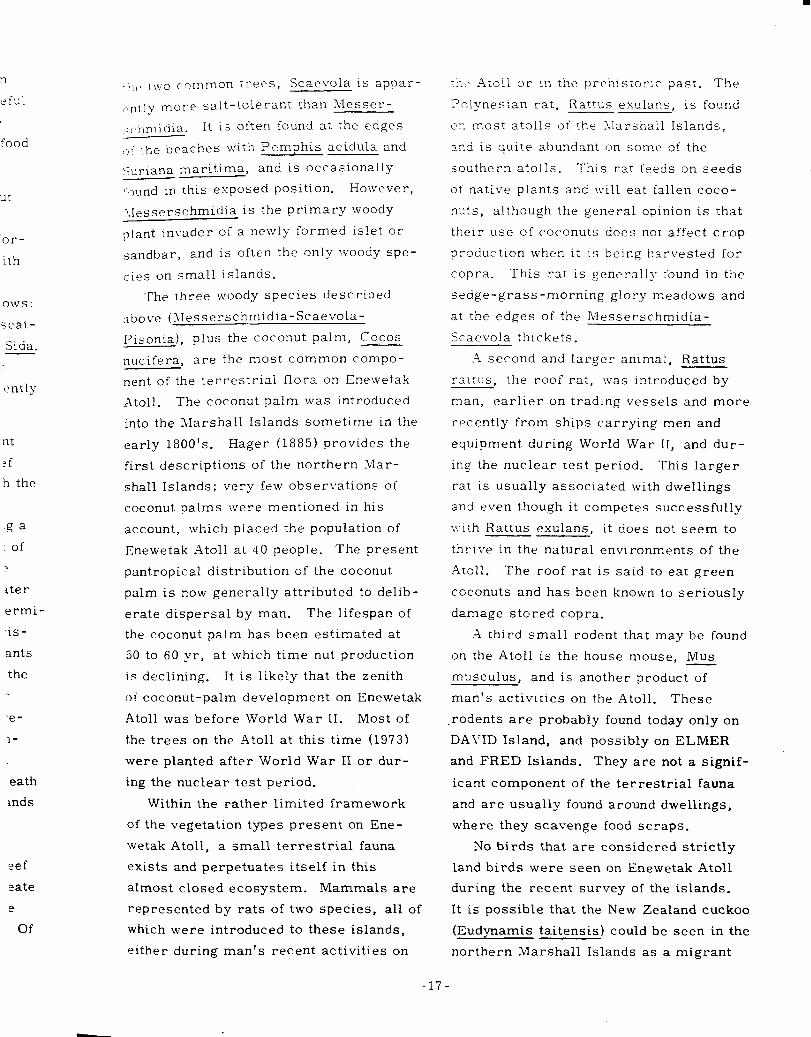
.!!(> tIVo common trees, Scaevola is appar-
,,ntly more salt-tolerant than Messer-
;chmidia. It is often found at the edges
!,f the beaches with Pemphis acidula and
Suriana maritima, and is occasionally
l,)und in this exposed position. However,
;!.lesserschmidia is the primary woody
plant inxvader of a newly formed islet or
sandbar, and is often the only lvoody spe-
cies on small islands.
The three woody species described
above (SIesserschmidia-Scaevola-
I’isonia), plus the coconut palm, COCOS
nucifera, are the most common compo-
nent of the terrestrial flora on Enewetak
Atoll. The coconut palm was introduced
into the Marshall Islands sometime in the
early 1800’s. Hager (1885) provides the
first descriptions of the northern il’lar-
shall Islands; very few observations of
coconut palms were mentioned in his
account, which placed the population of
Enewetak Atoll at 40 people. The present
pantropical distribution of the coconut
palm is now generally attributed to delib-
erate dispersal by man. The lifespan of
the coconut palm has been estimated at
50 to 60 yr, at which time nut production
is declining. It is likely that the zenith
Oi coconut-palm development on Enewetak
Atoll was before World War II. Most of
the trees on the Atoll at this time (1973)
were planted after World War II or dur-
ing the nuclear test period.
Within the rather limited framework
of the vegetation types present on Ene-
wetak Atoll, a small terrestrial fauna
exists and perpetuates itself in this
almost closed ecosystem. Mammals are
represented by rats of two species, all of
which were introduced to these islands,
either during man’s recent activities on
:kg Atoll or In the prehistor:c past. The
Polynesian rat, Rattus esulars, is found
c?n most atolls of the llarshail Islands,
and is quite abundant on some of the
southern atolls. This rat feeds on seeds
of native plants and xi11 eat fallen coco-
nuts, although the general opinion is that
their use of coconuts does not affect crop
production when it is being harvested for
copra. This rat is generally found in the
sedge-grass-morning glory meadows and
at ?he edges of the Messerschmidia-
Scaevola thickets_
-1 second and larger animal, Rattus
rattus, the roof rat, was introduced by
man, earlier on trading vessels and more
recently from ships carrying men and
equipment during World War II, and dur-
ing the nuclear test period. This larger
rat is usually associated with dwellings
and even though it competes successfuliy
with Rattus exulans, it does not seem to
thrive in the natural environments of the
Atoll. The roof rat is said to eat green
coconuts and has been known to seriously
damage stored copra.
-1 third small rodent that may be found
on the Atoll is the house mouse, Mus
musculus, and is another product of
man’s activities on the Atoll. These
-rodents are probably found today only on
DA1’ID Island, and possibly on ELMER
and FRED Islands. They are not a signif-
icant component of the terrestrial fauna
and are usually found around dwellings,
where they scavenge food scraps.
No birds that are considered strictly
land birds were seen on Enewetak Atoll
during the recent survey of the islands.
It is possible that the New Zealand cuckoo
(Eudynamis taitensis) could be seen in the
northern Marshall Islands as a migrant
-17-
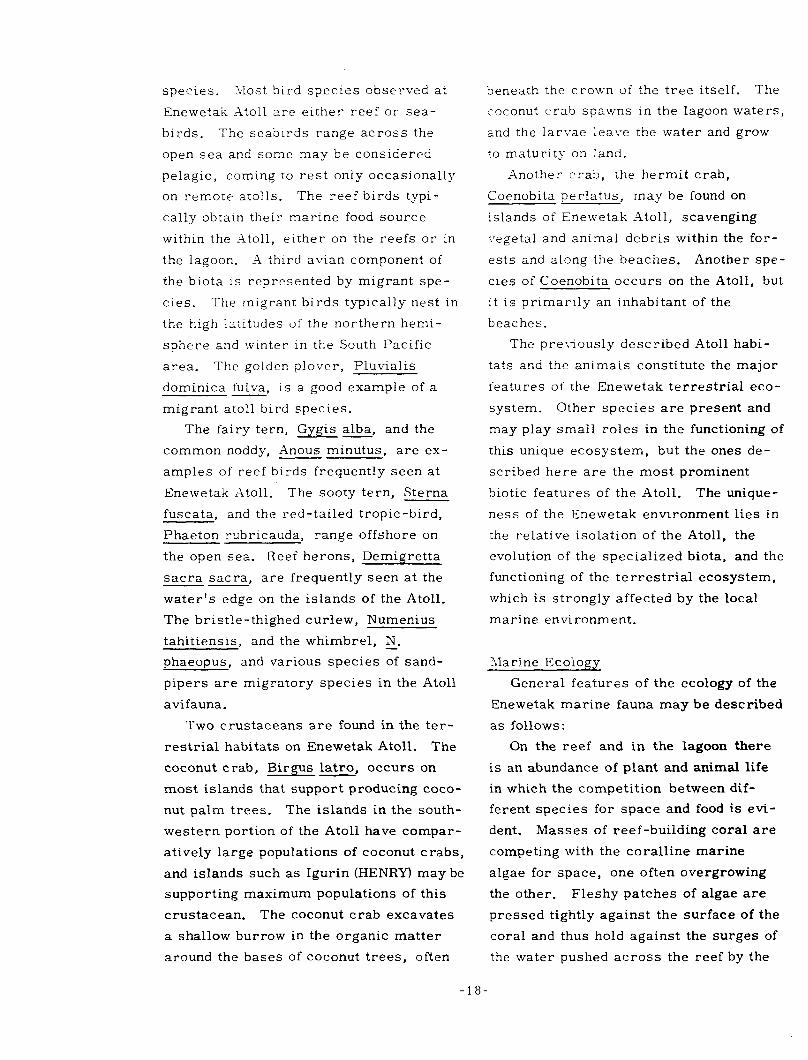
species. 4Iost bird species observed at
Enewetak -Atoll are either reef or sea-
birds. The seablrds range across the
open sea and some may be considered
pelagic, coming to rest only occasionally
on remote atolls. The reef birds typi-
cally obtain their marine food source
within the Xtoll, either on the reefs or in
the lagoon. X third avian component of
the biota is represented by migrant spe-
cies. The migrant birds typically nest in
the high latitudes of the northern hemi-
sphere and winter in the South Pacific
area. The golden plover, Pluvialis
dominica fulva, is a good example of a
migrant atoll bird species.
The fairy tern, Gygis alba, and the
common noddy, Anous minutus, are ex-
amples of reef birds frequently seen at
Enewetak Xtoll. The sooty tern, Sterna
fuscata, and the red-tailed tropic-bird,
Phaeton rubricauda, range offshore on
the open sea. Reef herons, Demigretta
sacra sacra, are frequently seen at the
water’s edge on the islands of the Atoll.
The bristle-thighed curlew, Numenius
tahitiensis, and the whimbrel, N -- phaeopus, and various species of sand-
pipers are migratory species in the Atoll
avifauna.
Two crustaceans are found in the ter-
restrial habitats on Enewetak Atoll. The
coconut crab, Birgus latro, occurs on
most islands that support producing coco-
nut palm trees. The islands in the south-
western portion of the Atoll have compar-
atively large populations of coconut crabs,
and islands such as Igurin (HENRY) may be
supporting maximum populations of this
crustacean. The coconut crab excavates
a shallow burrow in the organic matter
around the bases of coconut trees, often
beneath the crown of the tree itself. The
coconut crab spawns in the lagoon waters,
and the larvae leave the water and grow
to maturity on land.
Another crab, the hermit crab,
Coenobita perlatus, may be found on
islands of Enewetak Atoll, scavenging
IFegetal and animal debris within the for-
ests and along the beaches. Another spe-
cies of Coenobita occurs on the Atoll, but
it is primarily an inhabitant of the
beaches.
The preliously described Atoll habi-
tats and the animals constitute the major
features of the Enewetak terrestrial eco-
system. Other species are present and
may play small roles in the functioning of
this unique ecosystem, but the ones de-
scribed here are the most prominent
biotic features of the Atoll. The unique-
ness of the Enewetak environment lies in
the relative isolation of the Atoll, the
evolution of the specialized biota, and the
functioning of the terrestrial ecosystem,
which is strongly affected by the local
marine environment.
Llarine Ecology
General features of the ecology of the
Enewetak marine fauna may be described
as follows:
On the reef and in the lagoon there
is an abundance of plant and animal life
in which the competition between dif-
ferent species for space and food is evi-
dent. Masses of reef-building coral are
competing with the coralline marine
algae for space, one often overgrowing
the other. Fleshy patches of algae are
pressed tightly against the surface of the
coral and thus hold against the surges of
the water pushed across the reef by the
-18-
1e
‘S I
P-
ut
d
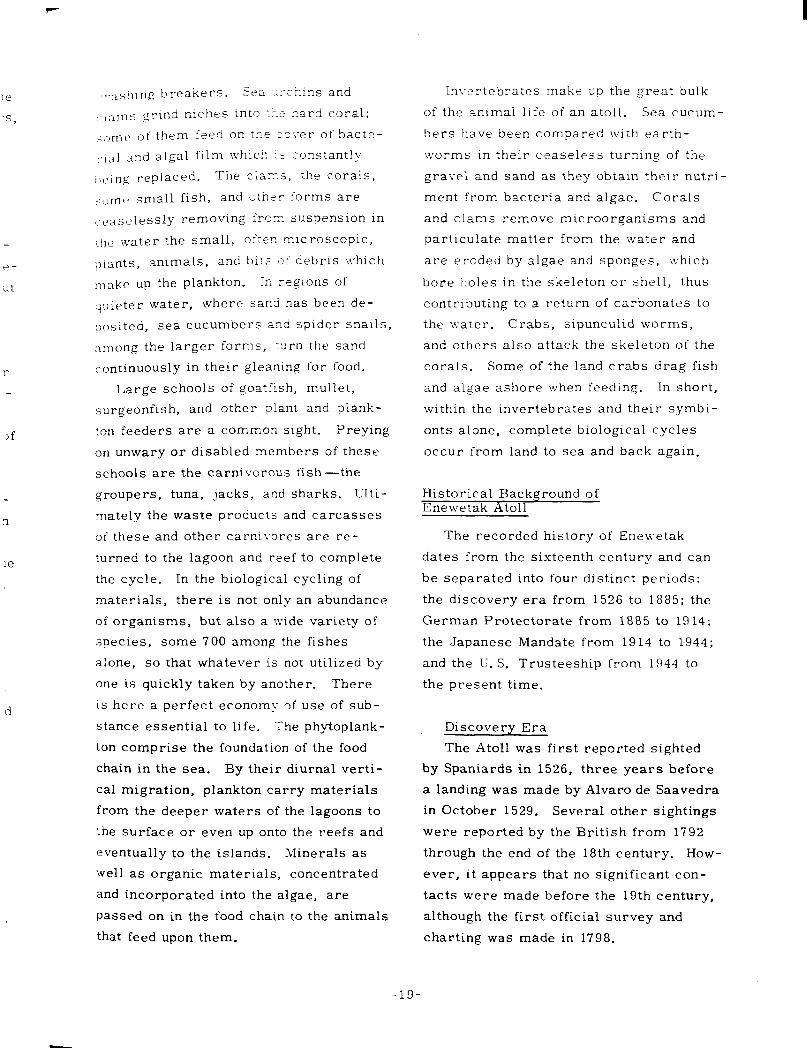
~.~ls~lin~ breakers. Sea -I:-chins and
‘,3,11s grind ntches into :::e hard coral;
;<,mc, of them feed on tke :o-.-er of bacte-
:.ILil and algal film whici: :S constantl!
:;t,lng replaced. The clarr.5, the corals,
-,,m,. small fish, and other corms are
c,LXasclessly removing :‘rcrr. suspension in
r~lc, lvater the small, of:er, microscopic,
piants, animals, and biTs ,:I debris which
make up the plankton. In regions of
,iuieter water, where sand has been de-
110s ited, sea cucumbers and spider snails,
:lmong the larger forms, r.Lrn the sand
continuously in their glearung for food.
Large schools of goatfish, mullet,
surgeonfish, and other plant and plank-
ton feeders are a common sight. Preying
on unwary or disabled members of these
schools are the carnivorous fish-the
groupers, tuna, jacks, and sharks. LIti-
mately the waste products and carcasses
of these and other carnivores are re-
turned to the lagoon and reef to complete
the cycle. In the biological cycling of
materials, there is not only an abundance
of organisms, but also a wide variety of
species, some 700 among the fishes
alone, so that whatever is not utilized by
one is quickly taken by another. There
is hcrc a perfect economy of use of sub-
stance essential to life. The phytoplank-
ton comprise the foundation of the food
chain in the sea. By their diurnal verti-
cal migration, plankton carry materials
from the deeper waters of the lagoons to
the surface or even up onto the reefs and
eventually to the islands. Minerals as
well as organic materials, concentrated
and incorporated into the algae, are
passed on in the food chain to the animals
that feed upon them.
In\-ertebrates make up the great bulk
of the animal life of an atoll. Sea cucum-
bers have been compared with earth-
worms in their ceaseless turning of the
gravel and sand as they obtain their nutri-
ment from bacteria and algae. Corals
and clams remove microorganisms and
particulate matter from the water and
are eroded by algae and sponges, which
bore holes in the skeleton or shell, thus
contributing to a return of carbonates to
the \\-ater. Crabs, sipunculid worms,
and others also attack the skeleton of the
corals. Some of the land crabs drag fish
and algae ashore when feeding. ln short,
within the invertebrates and their symbi-
onts alone, complete biological cycles
occur from land to sea and back again.
Historical Background of Enewetak Atoll
The recorded history of Eneivetak
dates from the sixteenth century and can
be separated into four distinct periods:
the discovery era from 1526 to 1885; the
German Protectorate from 1885 to 1914;
the Japanese Mandate from 1914 to 1944;
and the U.S. Trusteeship from 1944 to
the present time.
Discovery Era
The Atoll was first reported sighted
by Spaniards in 1526, three years before
a landing was made by Alvaro de Saavedra
in October 1529. Several other sightings
were reported by the British from 1792
through the end of the 18th century. How-
ever, it appears that no significant con-
tacts were made before the 19th century,
although the first official survey and
charting was made in 1798.
-19-
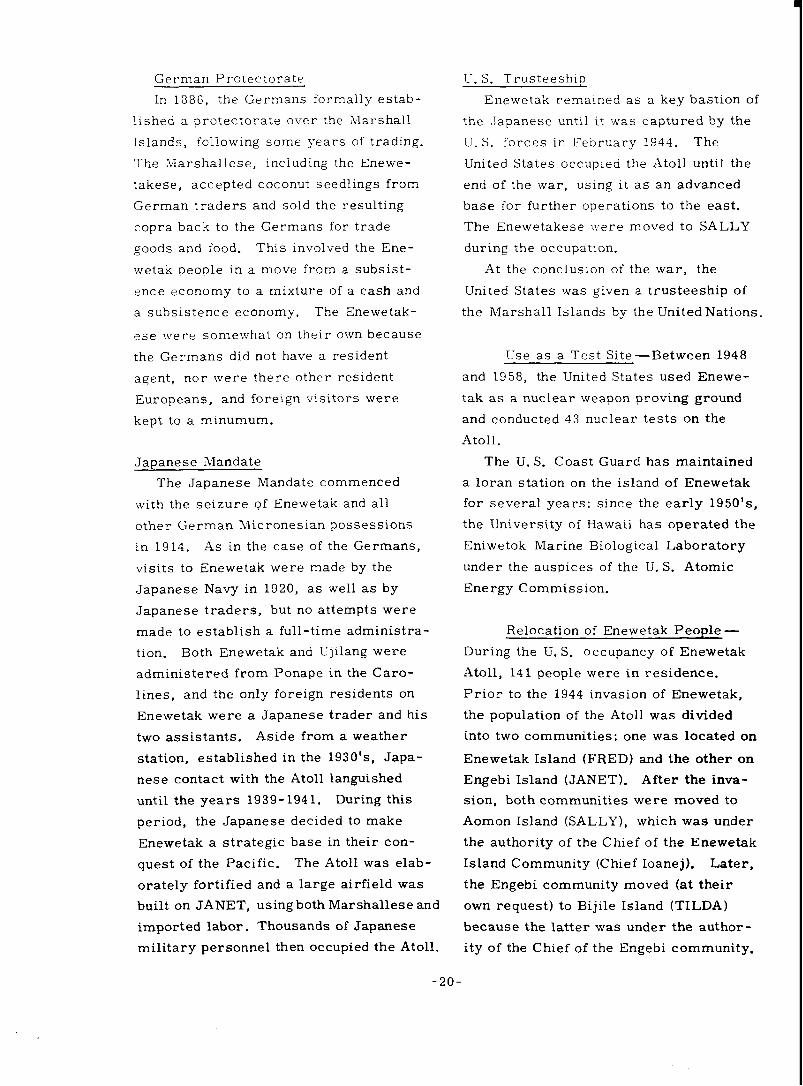
German Protectorate
In 1886, the Germans formally estab-
lished a protectorate over the Xlarshall
Islands, following some years of trading.
The 1,Iarshallese, including the Enewe-
takese, accepted coconut seedlings from
German traders and sold the resulting
copra back to the Germans for trade
goods and food. This involved the Ene-
wetak people in a move from a subsist-
ence economy to a mixture of a cash and
a subsistence economy. The Enewetak-
ese were somewhat on their own because
the Germans did not have a resident
agent, nor were there other resident
Europeans, and foreign visitors were
kept to a minumum.
Japanese Mandate
The Japanese Mandate commenced
with the seizure of Enewetak and all
other German Micronesian possessions
in 1914. As in the case of the Germans,
visits to Enewetak were made by the
Japanese Navy in 1920, as well as by
Japanese traders, but no attempts were
made to establish a full-time administra-
tion. Both Enewetak and Ujilang were
administered from Ponape in the Caro-
lines, and the only foreign residents on
Enewetak were a Japanese trader and his
two assistants. Aside from a weather
station, established in the 1930’s, Japa-
nese contact with the Atoll languished
until the years 1939- 194 1. During this
period, the Japanese decided to make
Enewetak a strategic base in their con-
quest of the Pacific. The Atoll was elab-
orately fortified and a large airfield was
built on JANET, using both Marshallese and
imported labor. Thousands of Japanese
military personnel then occupied the Atoll.
U. S. Trusteeshin
Enewetak remained as a key bastion of
the Japanese until it was captured by the
U.S. forces in February 1944. The
United States occupied the Atoll until the
end of the war, using it as an advanced
base for further operations to the east.
The Enewetakese were moved to SALLY
during the occupation.
At the conclusion of the war, the
United States was given a trusteeship of
the hIarshal1 Islands by the United Nations.
Use as a Test Site-Between 1948
and 1958, the United States used Enewe-
tak as a nuclear weapon proving ground
and conducted 43 nuclear tests on the
,4to11.
The U. S. Coast Guard has maintained
a loran station on the island of Enewetak
for several years; since the early 1950’s,
the University of Kawaii has operated the
Eniwetok Marine Biological Laboratory
under the auspices of the U. S. Atomic
Energy Commission.
Relocation of Enewetak People -
During the U.S. occupancy of Enewetak
Atoll, 141 people were in residence.
Prior to the 1944 invasion of Enewetak,
the population of the Atoll was divided
into two communities; one was located on
Enewetak Island (FRED) and the other on
Engebi Island (JANET). After the inva-
sion, both communities were moved to
Aomon Island (SALLY), which was under
the authority of the Chief of the Enewetak
Island Community (Chief Ioanej). Later,
the Engebi community moved (at their
own request) to Bijile Island (TILDA)
because the latter was under the author-
ity of the Chief of the Engebi community.
-2o-
i‘llUS, {lie I<ngebi peopir ix.-ere mo;-ed
:~~,~icc prior :o relocs::cn :o Ujilang
, ~.:~~,~~b, to _Aomon to S;,Ille 1, whereas the
I.:ilewetak people were mox:ed once (Ene-
.,vctalc tc, &Aomon) pr!cr to relocation to
I’lilang. In December 1547 > the people
,vcre transferred 124 ml to the southwest
ic, then uninhabited i.-Ilang, where they
Iiave remained.
.inthropologv-Ene?l:etak People
VIost anthropolog!sts are of the opin-
ion that the lIarshalls and other islands
of n,Iicronesia were settled by peoples
who migrated from the area of Indonesia
and into the insular Pacific centuries ago.
Reflecting the ancient migration patterns
in Oceania, the Marshallese language
belongs to the large XIalayo-Polynesian
language family which is spread from
Madagascar, through the Indonesian area,
and across 1Iicronesia, Polynesia, and
some regions of Xlelanesia. With regard
to physical type, the 1Iarshallese are
relatively short in stature and of slender
build. They have brown skin, brown
eyes, broad flat noses, straight to curly
black hair, and sparse body hair.
According to their on-n oral traditions,
the people of Enewetak had always lived
on Enewetak Atoll prior to their reloca-
tion to Ujilang; in their own words: “We
were there from the beginning.” Because
of Enewetak Atoll’s isolated location in
the northwestern region of the western of
the two island chains which comprise the
Marshallese archipelago, the people had
relatively little contact with others prior
to the European era. As a consequence,
the language and culture of the Enewetak-
ese became differentiated from those of
other Marshall Islanders, and the people
-Iid :?OT icientify themselves with the others.
Rather, rhey thought cf themselves as a
-eople \i-ho were separate and unique, “the
Teople o:‘ Enewetak” as opposed to the
:slanders to the east and south.
The past and current accomplishments
si the Enewetakese reelect intelligence
and qualities of ingenuity, self-reliance,
and hardiness which have allowed them to
meet the challenge of the atoll environ-
ment which is quite restrictive in com-
parlson :n the high \-olcanic islands of
Oceania. Long before the advent of Euro-
peans, They had de\-eloped a culture which
represented a sophisticated adaptation to
their ecological setting. They were
skilled navigators (an art which has been
lost with the availability of travel on the
vessels of foreigners); they remain ex-
pert builders of sailing canoes and are
among the world’s best fishermen. In
response to traders, missionaries, and
the successive colonial governments
which have dominated the islands over
the past century, they have been quick to
learn and adjust to the different catego-
ries of outsiders. Today, they have
achieved a good understanding of the be-
havior and values of Americans, and
several have distinguished themselves in
government and mission schools.
Economic and Cultural Resources
Throughout the Marshall Islands, the
traditional forms of settlement pattern
and exploitation of the natural resources
are characterized by several general
features. First, the people of an atoll
reside on one or more of its largest
islands. Secondly, the people are quite
mobile as a nonintensive type of agricul-
ture and various fishing and collecting
-21-
activities are e::rended to embrace every
niche of the enT::ronment. Regular expe-
ditions are macr to all islands in an
atoll to make cc?ra and collect coconuts,
breadfruit, pandanus, arrowroot, and
other vegetable foods in season. The
brush is cleared and crops are planted
during these ~9~::s. The marine re-
sources are also exploited and a wide
variety of marire animals are utilized.
Routine expeditions are made to catch
fish, collect shellfish, and capture tur-
tles and gather Their eggs. Several spe-
cies of birds are also captured as a food
source. The Enewetak people may be
expected to conflnue this way of life to
some degree when they return to their
home atoll, as influenced by their con-
tacts with Western culture.
Sociopolitical Pattern
Before their relocation to Lljilang, the
Enewetakese were divided into two sepa-
rate and distinct communities (community
is defined as the maximal group of per-
sons who normally reside together in
face-to-face association) which were
located on the two largest islands of the
Atoll. One was situated on Engebi Island
on the northern rim, and the other was
located on Enewetak Island, across the
lagoon in the southeast quadrant of the
Atoll. The traditional settlement pattern
of both communities was dispersed; resi-
dences were located on separate land
parcels and were scattered along the
length of the lagoon beach.
Members of the two communities inter-
married and cooperated in certain eco-
nomic activities. Each functioned, how-
ever, as a separate sociopolitical unit,
and its members had their bwn identity.
In contrast to the identity of “the people
of Enewetak,” as they defined themselves
in reference to all other populations, the
people of the Engebi community were
identified as driEngebi, “the people of
Enjebi Island,” and those of the Enewetak
community were driEnewetak, “the
people of Enewetak Island.”
The sociopolitical structure of the two
communities was identical. Each was
headed by an hereditary iroij or chief,
and succession to the office was patri-
lineal. Chiefs directed the affairs of
their respective communities, arbitrated
disputes, and consulted one another with
regard to concerns of the entire Atoll and
the total population’s relations with out-
siders. Each of the chiefs had authority
over one of the two domains into which
the Atoll was divided. The domain of the
Enewetak chief began with the Islands of
Kidrenen, Ribewon, Boken, Mut, and
Ikuren in the Atoll’s southwest quadrant,
extended counterclockwise around the
Atoll’s south and western rims up to and
including Runit Island, and also included
Aomon on the northeast rim. With the
exception of Aomon, the Engebi chief’s
domain began north of Runit with Billae
Island and extended counterclockwise
around the Atoll’s northern and western
rims, up to and including Biken Island.
Relations between the two communities
and the traditional dispersed pattern of
residence were altered with the invasion
of Enewetak Atoll. Because Enewetak
and Engebi Islands were devastated by
warfare, the U.S. Navy resettled all of
the people in a compact village on Aomon
Island which, as indicated above, fell
within the domain of the Enewetak Island
chief. After several months, the Enjebi
-22-
I,,,lli,lC, mo\.ed to the nearby and adjacent
!:I \llC, Lsland which was within the domaln
:; lhcll r own chief. \Vith these reiocatlons
,,t,,,th,n I:ne\vetak Atoll, the Engebl and
!Incwetak peoples were no longer sepa-
..ated by the Atoll’s large lagoon, and
T7%.n,le rtBlaining their dual political struc-
‘:lre, they In fact became a single
i-i,nlmunity.
The consolidation of the pOpUlatiOn
::]tO One community and the new compact
5cattlement pattern were perpetuated with
:!lc islanders’ resettlement on I;jilang
:1to11. It has only one sizable island,
: 1 i lang Island, and the entire population
was resettled there. Navy officials es-
tablished a dividing line at the midpoint
of the island and allotted the western half
to the Engebi people and the eastern half
to the Enewetak people. A compact vil-
lage was constructed in the middle of the
tsland, with the Engebi and Enewetak
peoples occupying houses on their re-
spective sides of the dividing line. Later,
each group divided the land on its portion
of the island. At a still later date, other
islands in the atoll were divided among
members of the two groups.
During the initial years on cjilang,
the traditional political structure re-
mained intact. The chiefs functioned in
their accustomed roles, and they resisted
American efforts to introduce democratic
institutions. (According to American
designs, each atoll population was to be
governed by an elected council of elders
headed by an elected magistrate.) By the
early 1960’s, however, some change was
observable. Both chiefs were by then
aged men, and because they were men
who had matured in a former era, some
contemporary problems required that the
declslon-making process be opened to
include ?-ounger men v:ho had attended
schools and ‘or had some other experi-
ences \vlth the American administration.
LLleetlngs of all males were occasionally
held, and some decisions about commu-
nity affairs were decided by a majority
I-ote. The authority and status of the
chiefs further declined in the late 1960’s,
when the old Engebi chief died and was
succeeded in office by his younger
brother, :vho was also aged and suffered
from frequent poor health.
The combination of the above events
precipitated a major transformation in
the political structure. The chiefs
yielded to younger men who desired and
had been gaining a greater voice in com-
munity affairs. Then, in 1968, a magis-
trate and a council of 12 men were
elected; reflecting the traditional division
of the population, the Engebi people
elected six councilmen from among their
ranks, and the Enewetak people elected
six. The magistrate became the head of
the entire community, and the council
became the legislative body governing the
people’s affairs. In a very recent elec-
tion, however, the 12 councilmen were
elected from the population at large and
not from the two groups. Thus, the
current council reflects a demise of the
traditional system and indicates that
the old division between the Engebi and
Enewetak peoples has lost much of its
meaning. The council is now a
representative body drawn from the
entire population and reflects
community with acknowledged
goals. The chiefs, however,
important figures as advisors
of influence.
a unified
common
remain
and men
-23-
I
Church and Religion
The church is the focal point for many
community social activities of the Ene-
wetak people. The prevailing religious
system is a conservative type of Protes-
tantism in which church services, Bible
classes, church group meetings, and
hymn singing have replaced traditional
intertribal wars, sports, games, and
dancing.
The minister is the spiritual leader of
the community and is supported and
assisted by the chiefs of the clans. The
church functions are time-consuming and
require a considerable effort from the
membership. Sundays in particular are
devoted almost entirely to church ser-
vices and related activities. Thus, it is
apparent that the church influences the
life ot the Enewetakese to a great degree.
Land Ownership
The Enewetak Atoll soil is poor, and
thus agriculture is limited. For cen-
turies, subsistence has been marginal
and precarious for the island inhabitants,
despite hard work. Nevertheless, the
residents have always maintained a deep
emotional attachment to their home
islands and ancestral land.
The land parcels, or wato, at Enewe-
tak Atoll were like those found elsewhere
in the Marshalls. Most commonly, each
was a strip of land stretching across an
island from lagoon beach to ocean reef
and varying in area from about 1 to
5 acres. The resources of all ecological
zones were thus available to the individ-
uals who held right to the land. Less
commonly, a parcel was divided into two
or more portions with transverse bound-
aries. This usually occurred when an
island (e.g., Engebi) was very wide.
Boundaries were usually marked by
slashes on the trunks of coconut trees,
or less commonly, ornamental plants.
Also, other features of the natural topog-
raphy (e.g., large boulders on the ocean
reef and the very configuration of an
island) were used to fix the position of
landholdings. The latter type of markers
were employed by the Bikini people, for
example, after all other markings had
been obliterated.
One facet of Enewetak Atoll culture
that differed from that of the rest of the
Marshalls was the system of land tenure
and inheritance. In contrast to the rest
of the Marshalls, where matrilineal
descent groups known as bx or lineage
constitute landholding corporations, the
land tenure system at Enewetak was in
ideal and practice a bilateral one. In
most cases, a married couple divided
the land they had each inherited among
their children, and a child usually re-
ceived some land from both his father
and mother. As younger islanders
matured, they worked the land with their
parents. As the parental generation died
and as members of the next generation
married and produced children, the proc-
ess was repeated with parents allocating
land among their offspring.
The islanders resided on their land-
holdings on Engebi and Enewetak Islands.
Households were either extended or
nuclear family groupings. In most cases,
households were headed by males and
were situated on land held by them.
Ideally, residence was patrilocal; i.e.,
upon marriage, females moved to their
husbands’ households, although excep-
tions to the rule did occur.
-24-

~.;vcry indix.,idual possessed rights to
s<jlne land on tslands away from the set-
tlc,ments on Enelretak and Engebi. Xl1
land in the Atoll was held by someone,
c,.xcept for one parcel on Enewetak Island
\vhich was donated to the mission.
PRESENT STATUS OF THE l<NI?WETAK PEOPLE ON I-.JIl,AT’;G
Comparison of rjilang and Enewetak
1’Jilang lies 121 mi southwest of
Enewetak (see Fig. 5). In pre-European
times, L‘jilang was inhabited by a IZIar-
shailese population. In the 1800’s a
typhoon decimated the atoll, and killed
all but a handful of people who were
moved to the southern Marshalls. The
atoll was then developed as a commercial
copra plantation during the German and
Japanese colonial eras. During the plan-
tatlon period, a small group of islanders
from the Eastern Carolines served as
wage laborers on the atoll. However, it
was abandoned during World War II and
was thus uninhabited and available for the
relocation of the Enewetakese.
160” 165” 17 '0
15” -
10” -
5” -
0 Enewetak
Bikini
a Ujilang
&Kusaie
0
Taong i
0 Rongelap
tic7 ORongerik _a
Ailinginae Taka
Jem? (
Lib’ Q
Namu <3”
Ail inglapalap
Jaluit
8 Namorik l Koi,i
OEbon
0
15”
Bikar
Jtirik
iiIU\ Mejit
10” Wotje
‘Erikub
Q Ma I’
OAur
Majuro
oelap
Arno
Mili c3.
Narik
5”
160” 165’ 170”
Fig. 5. Marshall Islands.
-25-
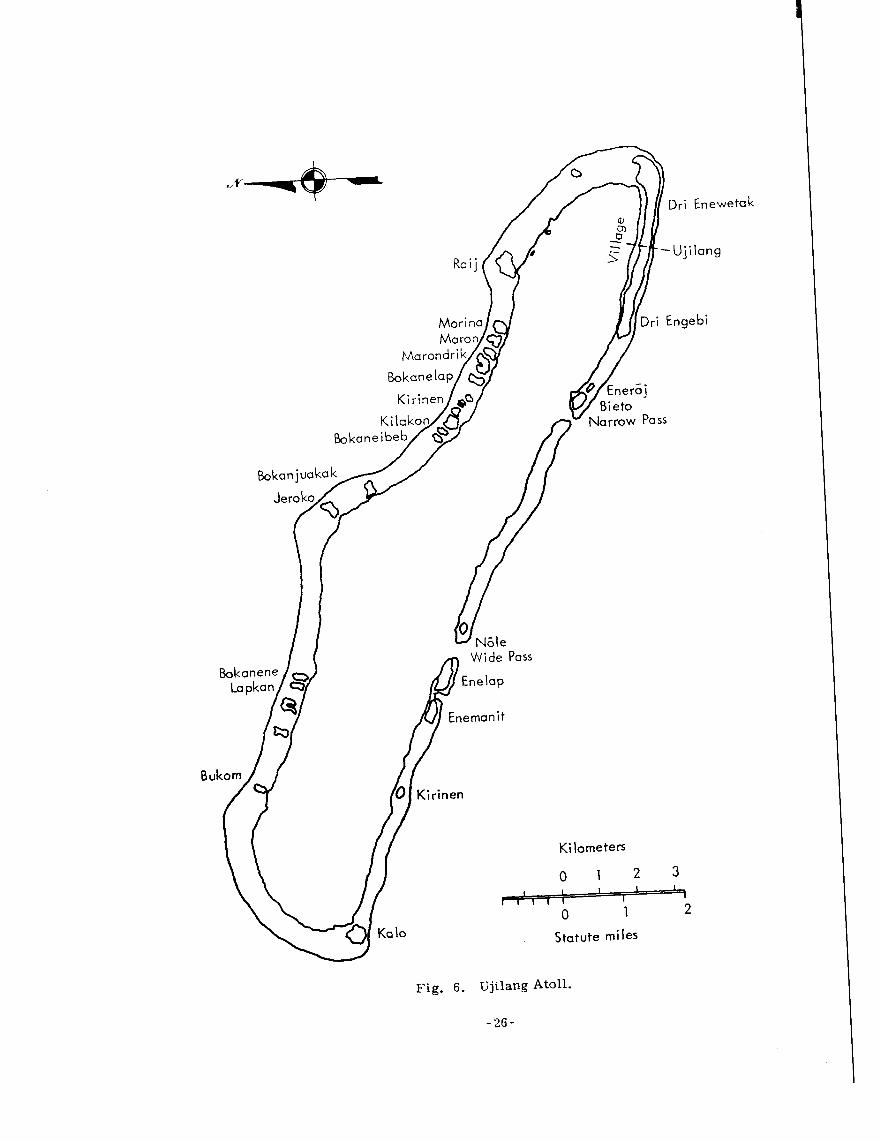
Raij
Kilometers
0 1 2 3
Statute miles
Fig. 6. Ujilang AtaH.
-26-
! ,ianc IS also smaller than Eneiverak,
~,,~l!~ ,n size of the lagoon and :r, the total
,!I,\, i:ind area (see Fig. 6). Ai <Jmparlson
,,I’ 1 iicLs 3r~aa~ of both atolls shop.:-s:
Area, mi2 Lagoon Dry land
t ,iilaIlg Atoll 25.47 0.67
357.99 2.26
!-ram this comparison, it is apparent
that the potential for production of food
I‘!-om the reefs and lagoon is considerably
less on Ujilang than it is on Enewetak.
The limited food potential on I-jilang has
made it necessary to import more com-
modities than would normally be required
on Enewetak. This has been reported to
have presented some difficulty because
lijilang is located further from the
sources of the needed commodities than
Enewetak.
Living Conditions on Ujilang
The U. S. Navy constructed a village
on the main island of Ujilang for the dis-
placed Enewetakese, and a brush-
clearing program was in progress when
they arrived on the atoll. Coconut trees
planted during German and Japanese
administrations were still standing and
bearing. Seedlings of breadfruit and
pandanus were brought ashore and
planted. After the Enewetak people had
settled in, the Navy departed. There
was no U. S. official remaining on the
atoll, nor was there any radio communi-
cation with the outside world.
The former Enewetak inhabitants
attempted to adjust to their new location.
They had, and still have, several formi-
dable problems with which to cope. The
most obvious, and one which they have
uppermost in their minds, is the great
disparity in the sizes oi ‘i-iilang and
Enewetak, as previousI>- mentioned. The
traditional 1Iarshallese pattern of habita-
tion is for family units to live on their
land parceis, not in a l-lllage cluster.
While it is common for community build-
ings, church, school, dispensary, and
warehouse to be centralized for conven-
ience and access to all, dwellings are
usually dispersed over the length of the
lagoon beach of an island, This pattern
is obviously desirable from the point of
view of environmental sanitation and
public health. AS described, the tradi-
tional settlement pattern of the Enewe-
takese was disrupted because of their
relocations.
Natural Resources
The people practice a nonintensive
type of agriculture but utilize the environ-
ment to the maximum, using the plants
that can survive and produce in the atoll
environment. Coconut is converted to
copra for cash sale to the visiting Trust
Territory supply ship. Consumer goods
are purchased from the ship with the
proceeds of the copra sales. The inter-
est payments from the trust funds pro-
.vided by the TTPI administration also
help buy needed commodities. Rice,
flour, sugar, canned meats, and other
canned goods are staple items of the diet
and have been for many years. Fish,
clams, lobster, turtles (flesh and eggs),
sea birds (flesh and eggs), chickens, and
pigs provide protein in the diet. The
marine resources are extremely impor-
tant in the diet of these people.
Coconuts, pandanus, breadfruit, and
arrowroot are the main lregetable
-27-
products used. Bananas, papayas, and
squash are used to a lesser extent, prob-
ably due to the relative scarcity of the
banana and papaya which do not seem to
grow well on Ujilang.
The Enewetak population shares the
upward trend of the rest of the LIarshall
Islands and Micronesia. Records show
an increase from 104 in 1925 to 432 in
1972. This tendency toward increased
population among the Enewetak people is
resulting in a further drain on the inade-
quate resources of Ujilang. A census
made in early November 1972 produced
the following data on the location of
Enewetak people:
Ujilang Atoll
Majuro Atoll (DUD)
Majuro Atoll, Rongron Is.
Maloelap Atoll, Marshall Is.
Kili Island, Marshall Is.
Ponape, Eastern Caroline Is.
Crew members on Trust Territory ships
Residing in the United States
Total Enewetak people
Married to Enewetak people and living on Ujilang (integral part of the community)
Grand total
Males
Females
Sex not reported
Grand total
(Tobin, 1973 1
Economic Status
The TTPI administration has
340
31
18
3
7
5
4
3
411
21
432
226
204
2
432
attempted to upgrade copra production
and subsistence agriculture for the past
several years with some noticeable im-
provement. However, the Enewetak
people are not as economically well off
as they would have been if they had not
been uprooted from the larger Atoll.
The unfavorable economic situation
and the persistent desire to return to
Enewetak finally stimulated aggressive
action by the people. They threatened to
evacuate the atoll in 1967, and in 1968
the leaders petitioned the United Nations
for assistance in returning to Enewetak.
In 1968, they again threatened to evacu-
ate the atoll and come to Majuro. Eco-
nomic help was given them by the admin-
istration, and relief shipments of food
were sent to the community. An ex - gratis payment of $1,020,000 was made to
them in 1969 and placed in a trust fund;
the interest from the fund has helped.
Funds were also allocated for a construc-
tion program to improve the housing on
Ujilang and for the construction of badly
needed public facilities on the atoll. The
Ujilang community assumed the respon-
sibility for doing the actual labor
involved.
Preferences of the Enewetak People for their Future
Efforts to ameliorate living conditions
on Ujilang, while welcome, did not
lessen the desire of the people to return
to their ancestral homeland. They con-
tinued to press for this goal. Discus-
sions and meetings were held with gov-
ernment officials. Finally, on April 18,
1972, the High Commissioner informed
the District Administrator that Enewetak
Atoll would be returned to the jurisdiction
of the TTPI by the end of 1973.
It is expected that all of the 432 Ene-
wetakese will return to their Atoll. How-
ever, it is not known whether those who
-28-

3ff
ot
)n
1-e
d to
8
ons
ak.
:u-
O-
nin-
1
ie to
d:
rut -
In
31Y
The
m-
x-is
-n
l-
8,
,
ak
ion
1w-
,,ave interests elsewhere will remain
i”‘ rmanen:lY, or leave after \-isiting their
rc,latives and old land claims. It is
assumed that these people will eventually
I.c’~I t-e on Enewetak.
(1 planning council has been formed,
consisting of Enemetakese, who are em-
poxvered by the people to make decisions
\vithin specified limits On matters per-
taining to short-term, intermediate, and
long-range planning. The council will be
augmented by technical advisors to assist
them in translating the desires of the
Enewetak people into workable plans.
The advisors will work closely with the
planning group and other Enewetakese in
their particular fields, e.g., architecture,
short- and long-range economic develop-
ment, and agriculture.
and desires of the modern Enewetakese,
a field team spent the period of July 21-31,
1973, on I‘jilang. The team was com-
posed of Carlton Hawpe (Holmes and
Carver architect), Howard Schoss (Peace
Corps architect), John Stewart (AEC/
NVOO), ‘Kenneth Alarsh (LLL), and
Thomas illakiphie (interpreter from
Micronesian Legal Ser\Tices). Hawpe and
Schoss were to meet with the Enewetak
planning council to determine where and
how the people intended to 1iL.e on Enewe-
tak, what types of houses they preferred,
and what they wanted in the way of cook-
ing and sanitary facilities. Stewart and
Marsh were to collect specific informa-
tion on the people’s daily activities and
their diet, with particular regard for the
implications to radiological dose-
assessment calculations.
EXPECTED LIVING PATTERNS AFTER RESETTLEMENT
Introduction
The successful resettlement of the
people of Enewetak will depend strongly
on the interaction of their current life
style with the provisions made for them
by the U. S. Government. While the
present life style is a result of over a
hundred years of first German, then
Japanese, and finally American influence,
the greatest impact has occurred since
the end of World War II. The creation,
under U.N. charter, of the Trust Terri-
tory of the Pacific Islands, and the subse-
quent military development of strategic
defense areas in the Marshall Islands,
has brought the simple food-gathering
culture of the Marshallese into close
contact with twentieth-century technology.
Victor Nelson, University of Washing-
ton marine biologist, was to be a member
of the team, but transportation difficul-
ties resulted in a two-week delay on Ene-
wetak and, because of other commitments,
Nelson had to return to Seattle. During
the two weeks on Entwetak, however, he
spent considerable time with Smith Gideon,
a native of Enewetak who was then Magis-
trate of Ujilang, collecting data on the
fish preferences of the Marshallese. In
his report (see p.46 ) Nelson recommends
that a composite of the Ujilang, Bikini,
and Rongelap diets be used to estimate the
average diet of the Enewetakese.
Originally, the present residents of
Ujilang lived as two tribes (dri) on sepa-
rate islands around the Enewetak lagoon,
the driEngebi on Engebi in the northern
In order to gather some first-hand
information on the living habits, attitudes,
:I:
See Chakravarti and Held, J. Food Sci. 28 (2) (1963). -
-29-
half of the atoll, :he drtEnewetak on
Enewetak in the sou:hern half. The
r,iilang Atoll, by contrast, has only one
island large enougn for permanent habi-
tation; hence, today everyone lives on the
main island of L-;:lang. This island,
roughly the same size as Enewetak, is
about 2.5 mi long by 0.1-0.2 mi wide.
The “town square” divides the island in
half and consists of the meeting hall,
dispensary, church, and school. The
half of the island east of the town square
belongs to the EneT.vetak people, while the
western half belongs to the Engebi people.
Even though the two tribes have inter-
married to such an extent that, as Magis-
trate Smith Gideon says, “we are one big
family,” the old division is maintained.
Almost everyone lives in the village,
which extends a fe7.v hundred feet to
either side of the town square. There
are a few houses scattered over the rest
of the island, but these are used only a
few days at a time, mostly by older
people on food-gathering trips. Houses
are constructed of plywood and corru-
gated sheet metal, with the floors usually
about 0.7 -1 m above ground. The space
under the houses is used for relaxing in
the shade, and the pigs generally rest
there as well.
An increase in the birthrate has re-
sulted in a very young population. Ninety
percent of the people are under 40 years
of age, and almost 50% are under ten.
During the field team visit, a population
anomaly existed in that there were no
children of high school age on the island,
even though they comprise about 10% of
the population. This is explained by the
fact that the high school is located 800 mi
away at Majuro and, while school had
been out over a month for summer vaca-
tion, no ship had been available to return
the students to L:jilang.
There were many opportunities for
misunderstandings to occur. Makiphie
spoke Marshallese and English fluently,
but had no knowledge of radioecology.
Hawpe and Schoss spoke good Marshallese,
but also had no knowledge of the radiolog-
ical aspects of Enewetak. On the other
hand, neither Stewart nor Marsh, the
radiological experts, spoke any Mar-
shallese. The tendency of the people to
want to be polite and to please their visi-
tors by giving what they believed to be the
desired answer, a problem mentioned by
other investigators, was evident and prob-
ably had some effect, but much of the
data in this report is based on personal
observations. These problems do, how-
ever, lend weight to Nelson’s suggestion
that a composite of data would best fore-
cast living habits after resettlement.
This section was reviewed in draft
form by Jack Tobin, Trust Territory
Community Development Advisor, and
many of his comments have been incor-
porated into the final version.
Development of Island Communities
The islands of Medren (ELMER) and
Engebi (JANET) are preferred for perma-
nent dwellings, with possibly some people
living on Enewetak (FRED), depending on
facilities remaining after the rehabilita-
tion. Japtan (DAVID) has been suggested
as a temporary location for a work force
during the cleanup, but might develop into
a semipermanent settlement. If too many
restrictions remain on and around Engebi
for comfortable permanent habitation, the
-3o-

P
n
le
b-
%-
.e
1
:o
‘Y
Ii
e
,,,,i,i,il, n,ay divide 1Iedren In half and live
::I’!‘<‘, probably as they do now on i-::lang.
.,,/~ ,,nd-home houses on Engebi wouid still
‘)I’ c!lzsired by some people, and couid be
:kI!it <,ither as part of the rehabilitation
II. by the people themselves at a la:er
I1mf. If the plan suggested by Carlton
IIawpe is adopted bg the Enewetakese,
I!ICrt ~~111 be three to six houses per
, iuster on each wato. The houses xi11 be
located about 100 ft or so inland from the
;aC()on beach, behind a “green belt” of
..0conut trees. 3 wato is a strip of land
cstending from the lagoon side to the
ocean side, occupied by a single family
group (lo-40 people). On wide islands,
such as Engebi, the wato may not include
both beaches, but access to both sides of
the island will be provided.
Houses will be constructed with the
iloors about 0.7 m above grade, the inter-
:rening space filled with concrete and
coral aggregate. The floors themselves
will be either concrete or plywood, and
rhe walls will be either poured concrete
or concrete block. Roofs will be corru-
gated sheet metal, provided with troughs
for collecting and transporting rainwater
to cisterns. A high degree of resistance
to typhoons is desired.
There is no furniture in a typical
Ujilang house, and no decorations on the
walls. Some food may be stored inside
and a few possessions like mirrors,
hand-cranked sewing machines, kerosene
lanterns, or anything subject to rain or
Pig damage are kept there, too. These
items are usually on the floor and very
rarely are there any shelves or definite
storage facilities.
Areas around the houses will be cov-
ered with coral gravel. The Ljilang
people r anew and add :o This covering
from r:xe I0 time !,y 5zattering gravel
collected from the ocean beach. This
area is kept free 01‘ Prass and trash.
Rain?s-ater, collected from the roofs of
buildings, will be the prlnclpal source of
fresh lvater. C-,ji!ang 9as several con-
crete cisterns, but most people have two
or three is-gal drums, fed from the
roofs of their homes. One of the con-
crete cisterns has a 10,000-gal capacity
and uses the roof of the rhurch as a
catchment. It is used by the general
community, and probably a similar cis-
tern would be built on Enewetak. The
proposed plan for the Enewetak houses .
calls for a built-in cistern in each house,
with a storage capacity sufficient for
several weeks. Well water is brackish
and not used at all when rainwater is
plentiful; however, as rainwater stocks
decline, well water will be used first to
wash clothes, then for the daily bath, and
only as a last resort for drinking or cook-
ing. It should be noted that Enewetak
receives somewhat less rainfall than
Ljilang, and therefore well water might
have to be used to a larger extent. How-
ever, this same lack of rainfall also is
responsible for a more brackish well
water on Enewetak, making it even less
palatable. Well depths on Vjilang varied
from 2.5 to 6 or 7 m, but several people
who lived on Enewetak remembered the
wells there as deeper than any on Ujilang
(therefore estimate about 10 m). Medren
Island presently has considerable area in
the form of concrete slabs and metal
roofing which could be used for catch-
ment purposes. The airfield alone on
Enewetak could probably supply the entire
population with water, given a collection
-31-
and distribution system. It should be
possible to make up in area what is lack-
ing in ramfall, at least for the southern
islands of the Atoll.
Routine for Daily Activities”’
A few activities are common to all
members of the household. Families re-
tire for the night between 10 and 11 p.m.
Everyone sleeps inside the house on a
woven pandanus-leaf sleeping mat spread
on the floor. A typical mat is made up of
a double thickness of leaves, about 75-
100 cm wide by 150-180 cm long, and
weighs about 1 kg. Double mats are also
used, with the width and weight increased
about a factor of two. Almost everyone
arises between 6:30 and 7~30 a.m.
Two or three days a year the entire
family will go on a one- or two-day picnic
to one of the other islands. However,
transportation is a real problem, and
there was one girl, 14, who had never
been off the main island of Ujilang.
Married women (essentially all women
over 16- 17 years of age) spend the whole
Tobin feels that the presence of the survey party had a strong influence on the daily habits of the people, especially the men. He says the Marshallese are naturally curious and tend to stay close to visitors. Also, the action and excite- ment were a welcome change from their usual routine. For these reasons, copra production and outer-island trips were probably curtailed. This points up the difficulty of gathering reliable informa- tion. The presence of the observers tends to affect that which is observed, but on the other hand, too much reliance on interviews runs the risk of bias from “cooperative answers.” Again, the best picture is a composite from several sources. With regard to the survey party’s effect on the people’s routine, however, it should be mentioned that for at least several years after the resettle- ment of Enewetak, frequent and numerous visitors may be expected.
day in or around the house attending
small children, cleaning, washing clothe:
and cooking. The Marshallese are very
concerned with personal cleanliness.
Everyone bathes every day and washing
clothes is a daily activity. Houses are
swept several times a day, and the cus-
tom is to remove shoes or zories (if any)
before entering the house. Clothes are
washed outside, usually by teenage girls
or older women. Many people have set
aside a particular area for laundry by
making a raised bed consisting of a
framework of coconut logs filled with
coral gravel. These beds are typically
2-3 m on a side and 1/2-l m high.
Clothes are washed in a pan (-50 cm
diam) with soap powder, if available, by
a combination of wringing, rubbing on
flat rocks or plywood, and pounding
with a stick. They are then rinsed
and hung on a line to dry. This treat-
ment is a little rough on the fabrics,
but they are clean. Cooking and food
preparation will be discussed in another
s ection.
Men spend the morning hours in and
around the houses, cleaning up outside
the house, smoking, visiting with each
other, and generally taking it easy.
Afternoons are spent much the same way,
although these days considerable time is
spent in meetings regarding the return to
Enewetak. If a breadfruit- or coconut-
gathering trip is made away from the
village, it will usually be early in the
morning before the heat of the day. Sim-
ilarly, a fishing trip near the village
might be planned to take advantage of
known fish movements. The only signifi-
cant deviation from this routine occurs
on Saturday, when the cooperative fishing
-32-

-les,
Y
lY)
:S
It-
i
ler
w S
to
n-
fi-
ng
(‘hildren LID :a the age of about 3-
,; x-1‘3rs spend most of their time around
,hc \-illage close to or l-r-side their houses,
under. the super-x.-:ston of their mother and
oIder children. Children from about
(5 years up to about IO-13 years spend
their time in school and ?laying around
Ihe \rillage betlveen the ocean and lagoon.
.At Ieast half of the children’s free
ttme is spent pIa>-ing on the lagoon beach
and in shallon Txater; the remainder is
about e\renly dli-;ded among the I-illage,
surrounding forest, and ocean beach.
Girls from about 12 to i3 perform many
of the arduous household tasks, such as
grating coconut or preparing breadfruit.
Boys of this same age climb the coconut
and breadfruit trees to harvest green
“drinking coconuts” or ripe breadfruit.
School was not in session in July; they
observe a June-to-September recess.
Children start first grade at about
6 years and are required to attend
through the eighth grade. School hours
are 8-12 a.m. and l-3 p.m. The school
! 5 .: ne-room struciui‘r’. 2nd student.; si;
i: !2 T : I i_ iloor-. Subiects :aueht arc l:npIlsll,
!I-.&::-.?rnatlcs-, social studies, science,
ax~c ?h>-slcal education. 1Iost rlqhth
grade graduates can read and \vrite AIar-
shallese. If students wish to attend high
schooi, they go to the district center at
AIaiL:ro, and the official language is Eng-
l!Sh. .At about age 15, if they do not
:;:ienti high school, children begin to
assu_me more of the duties of adults.
Table 4 provides a rough estimate of
:he amount of time spent by men, womcxn,
and children in various locations. I’or
do.qe-assessment calculations, hours per
l:*-ecli is probably the best unit. Hours
per day would carry a large standard
deviation (-20-50%), while hours per
month would be unnecessarily Coarse,
except for time spent off the main island.
HOK these estimates would change for
Enex-etak is very difficult to predict.
\Vith the much larger and less protected
lagoon there, transportation will have a
strong influence. If reliable boats arc
available, the total time spent by men on
the lagoon water and other islands would
probably about double or triple, at the
Table 4. Time spent in various areas of the l_.jilang Atoll.
Time, hr/wk Women
(children Children Location Men to age -5) (-5 to -15)
Inside houses 60 60 60
Interior of island -outside 80 95 43
Lagoon beach 10 10 50
Lagoon water (boat) 5 0 7
Other islands 5 1 1
Ocean beach 3 2 7
Open sea 5 0 0
-33-

expense of time on the home island,
Women’s and children’s time distribution
would probably not change more than
10-200/0, because their lives are more
centered around the home and community.
The table gives the time distribution of
the residents of Ujilang who have lived
there 26 years. It is probably typical of
a completely rehabilitated Cnewetak.
After the cleanup, if the houses are com-
pleted, even the first year would be about
as described.
Diet
At the time of the trip to IJjilang, no
Trust Territory ship had called there for
over two months. The people were sub-
sisting on the local products, consisting
of breadfruit, coconut, and fish. The
survey party took 350 lb of flour, 150 lb
of rice, 50 lb of sugar, and assorted
canned goods to Ujilang; thus it was pos-
sible to observe the impact of imported
food on the native diet, It could only be
described as profound. There is little
doubt that, given the opportunity, Mar-
shallese consumption of imported foods
would constitute at least 80% of their diet.
The favorite imports, unanimously re-
ported, are rice, flour, sugar, canned
corned beef, and assorted canned fish,
usually tuna, salmon, and mackerel.
Marshallese who live on Majuro and Ebye
(Kwajalein Atoll) and who, therefore,
have money and access to “American”
food, live almost entirely on imports,
including such accessories as soft (and
hard) drinks, beer, candy, cigarettes,
and convenience foods, limited only by
their ability to afford them. However,
these people become hungry for the
native diet (breadfruit, coconut, and fish),
and a once-a-week Llarshallese meal is
traditional. However, the Marshallese
foods are of limited availability due to
population pressures. Thus an interest-
ing picture emerges of the outer-island
people desiring unavailable imported
foods, while those in the population cen-
ters desire equally unavailable traditional
foods. The lack of reliable inter-island
transportation contributes greatly to this
problem. Dose calculations based on the
diet observed at Ujilang should provide
good upper limits on ingestion of radio-
nuclides at Enewetak, modified, of
course, by a few factors such as the
greater availability at Enewetak of some
food sources (e.g., sea birds).
Cooking and eating are not big social
events in Marshallese life. Food is usu-
ally cooked in the evening, some eaten
then, and the rest during the next day.
Families will sometimes eat together,
but usually everyone eats whatever is
available whenever he is hungry. When
more cooked food is required, it is pre-
pared then; thus cooking and general food
preparation may take place at almost any
time of the day, and usually is going on
somewhere in the village all the time.
On special occasions large meals will be
prepared, and everyone, often the whole
village, will eat together. This is about
as close as the Marshallese come to the
“American family dinner.” A typical
day’s food consumption would be a light
meal in the morning, usually a handful or
two of food left over from the previous
evening meal, perhaps a drinking coconut
and some copra around the middle of the
day, and then a larger meal of freshly
cooked food in the evening. There were
no plates or flatware in use on Ujilang;
-34-

7 i. I
,_.,. i,nt 3~~ ..t.-it!: his fingers iron: lez-.-es ,‘ ‘. I of ?:._,, brcD3df-uit or cocontii. In the cEse
(>f isrg-e risk_ nr :neat, people 1.:.ould BET
tiLr,2,.;ly fror: :he carcass, often pas5:ng
II ;y.Tm persrn to person. Eating takes ,. L
plac_ ,,utsicje the houses, and el’eryone
.-;,ts ,m the g:-ound.
_A ;ypical :,Iarshallese !‘ltiitchen” has
:In area set zjide for raw food prepara-
tion, a single-burner kerosene stove, an
underground oven or G (rhymes with
;I 00 :1: ), a fire pit :vith a grate for broiling
oI. general cooking if there is no kero-
sene stove, and sometimes a pit for food
storage. Again, ever-)-thing is on the
ground, and the cook sits or squats on
the ground while cooking. Large pieces
of coral serve to support pans and food
baskets. Food is commonly gathered, as
well as stored, in these baskets woven of
coconut fronds, The kitchen is usually
attached to the house by extending two
walls and sometimes the roof; in other
cases, the kitchen has its own roof. The
fourth side is usually at least partially
closed in, but rarely has a hinged door.
The proposed houses to be built on Ene-
wetak will have similar areas.
The urn exists in two styles, shallow
and deep. A shallow urn is excavated in
the coral to a depth of lo-20 cm, but is
often not excavated at all. A fire is built
on the rocks, and when only glowing coals
remain, the food is wrapped in breadfruit
leaves and laid on the coals. Everything
iS covered with more breadfruit leaves,
then with sand and gravel, and finally
with coconut fronds or burlap. Cooking
time is about an hour. The deep urn is
excavated to 50-60 cm and is used in the
same way, mostly for baking bread,
which requires a higher temperature and
!OnEP‘:. i-akiln,c rime. ::1i><- 3copll; :,L’C’tt~!‘
a Col?xan o\-en set (‘3 a -?rosene SttO\.e,
but t!:ese are rar‘e. .!‘he :‘Qod storage pit
is esc;‘:ared to a depth c,< ahout SO-75 cr.1
(but not o\-er an arm’s length), These
pits are used mostly to s-ore preserlred
breadfruit, b:it ma\- be used to store
cooked lefto\Ters. All foocl to be stored
is 1%.rapped in breadfruit I?a~-es, and the
pit is lined \vith either b:-iadfrult or
pandanus lea[-es.
Ob\-iousl>- the Marshali~sr kitc!len is
considerably more par-tabie than thr
American \-ersion. hIan)- fire pits and
urns are located outside; :n fact, they
may be constructed and used at the l’ood-
gathering site. Kerosene stoves are
lraluable possessions which are kept
under cover, although seldom in the
house itself. There was one four-burner
model occupying a place of honor in one
Marshallese house. For broiling in an
um, a fire is started with dry coconut
frond; then either Messerschmidia wood,
coconut shells or husk, or pandanus
wood is added. Most other woods may
be used, but coconut shell is prcfcrrc\d
for the urn because it produces good
coals.
The important native foods on I:Jilang,
and presumably on Enewetak, are fish,
coconut, breadfruit, and arrowroot.
Pork and chicken are consumed in vary-
ing amounts, and water comsumption is
highly dependent on the availability of tea
and coffee. Fish, coconut, and bread-
fruit are eaten both raw and cooked in a
variety of ways. Only cooked arrowroot
is eaten. Table 5 represents an attempt
to quantify the Marshallese diet on a daily
basis and is based on information sup-
plied by Dr. L’Iary iLIurai of the Ilniversity
-35-

- I
Table 5. Summary of Marshallese daily diet.a
At time of return, g/day Children 10 yr
Food item Men Women (older than
3-4 yr) post return,
g/day
Fish
Domestic meatb (pork, chicken)
Pandanus fruit
Wild birds 100 100 60
Bird eggs 20 20 15
Arrowroot 0 0 0
Coconut 20 20 20
Green coconut milk 20 20 20(?)
Ripe coconut milk
Coconut crabs
Clams (and other shellfish)
Garden vegetables
Breadfruit
600 600 400 600
60 60 35
0 0 0
20 20 15
25 25 15
10 0 0 25
100 100 80 200
0 0 0 200
60
100 (200-400
for children)
10
5
40
100
300 (O-1500)
100
o-5
ImportsC 400- 1000 200- 1000 150-800 O-1600
Total -1600 -1600 L1300 -1800
aEvery entry in this table is subject to qualifications and should not be used without reading the accompanying text.
b Ranges from 0 to 250 g/day due to individual possession of swine and fowl.
‘Flour, rice, sugar, tea, canned meats, and canned fish are by far the favorites. These will comprise from 0 to 80% of the diet, depending on availability.
of California (Berkeley), and on observa-
tions gathered during the 10 days on
Ujilang. It should be emphasized that
imported foods are highly favored by the
Marshallese and will constitute anywhere
from 0 to 80% (perhaps even 100% for
short periods) of the daily diet. The
critical factor influencing the quantity of
imported food consumed is availability,
which for the Ujilangese means trans-
portation. The breakdown into men,
women, and children is perhaps more
misleading than informative, particularly
for the women and children, because they
are constantly exposed to food during the
daily preparation and their intake is
highly variable.
Pregnant women eat the regular diet,
sometimes reducing their intake for
weight-control purposes. Infants are
nursed up to about l- lf years of age,
when they are weaned onto the current
diet with only a modification in food prep-
aration. Certain foods may be mashed
36-
P
rn,
‘0
n)
,),- (.ooked .some!f.har longer to make rhem
n,ore suitable for :nfants. The meat of
the green COCOtlUt, I\-hich is naturally soft,
and arro\vrOOt paste are popular- infant
foods.
Pandanus is the lollipop of the Alar-
shall Islands, much favored by children
and to a certain extent by adults. Fried
breadfruit is a favorite snack food, espe-
cially of older \vomen who may spend
many afternoons eating fried breadfruit,
smoking, visiting, and playing bongo,
Averaged over a monthly basis, the num-
bers in Table 5 are probably good to
k50%, the “lo-year postreturn” column
is strictly a guess; much depends on what
becomes of Enewetak. The diet will
depend greatly on the extent of American
(or Japanese) influence.
Because it is very difficult to express
the Marshallese diet in grams per day,
the following discussion of the various
food items and their uses is given.
Seafood
Fish is certainly a favorite item in the
Marshallese diet. Even if imported food
is available, local fish remains high on
the list of variety foods. If imported
food is not available, fish probably SUP-
:‘:
‘According to Tobin, pandanus is prob- ably more important in the diet than this report indicates. The fact that it was out of season during the visit may have con- tributed to the impression that it is not widely consumed. Tobin states that it is a very nutritious food, and that its con- sumption should be encouraged by plant- ing it in abundance on Enewetak. Perhaps the amounts given in Table 2 should be doubled or tripled for the lo-year post- return consumption. Murai originally estimated 200 g/day without regard to age or sex.
DIT t!-!c? r-r.:ire protein I.. ‘7 t 3 k c . Tilt> 1‘3\-or.-
ite !‘lsn 87 Tillane, and those nbserx-eti
caught a,r,d <Jaten, ap~ror~m~:el~ In order
of abunzance are: rabbitfish cS\ganus),
grouper (Epinephelus), con\‘:c: sur.geon
(Hepatus), goatfish (Jlullotdicthys), pOrtl-
pano (H::nnis), surgeonfich (l\;aso), bonito
(Sarda?), squirrelfish (se~~eral ;-arietieF),
ulua (Caranx), and yello\\~Ein tuna (Xeo-
thunnus I. Bonito, ulua, and tuna must I~(,
caught by trolling; thewfore thctr impor-
tance in the diet dcpcnds stroncl?- upon
mot.orboat availability. :I11 :!lrcxc art’ 3
favorite Fish, particularly for sasllimi
(raw).
Almost any fish whirh is caught and
cooked will also be eaten ra\v. The head
of the smaller fish is considered a deli-
cacy, and the heart and liver are also
occasionally consumed. Iq’ish which arc
to be cooked within a few minutes of
being caught are seldom tvisceratcd.
Fish eaten raw, and those which ~111 be
kept even an hour or so are evlsccratcd.
Large fish, such as the tuna and lacks,
are usually cleaned back at the village
because the heart and liver are practi-
cally always cooked and eaten. The
smaller reef fish are cleaned on the spot,
often just with fingers and teeth. Fish
are usually cooked with the skin and
scales left on; the scales peel off easily
after cooking, and most of the skin is
usually discarded. However, whether or
not the skin is eaten depends on both the
fish and the diner. Sashimi is always
skinned first.
The Marshallese are opportunists and
will tend to eat what they catch; however,
they know where and when their favorite
fish are likely to be found and plan their
trips accordingly. Their techniques are
,
-37-
I
also directed toward certain types of fish.
The two principal factors which discrim-
inate against certain fish in the diet are
flavor and the occurrence of ciguatera or
other forms of poison. Sharks are good
examples of the flavor factor. The meat
contains large quantities of urea, requir-
ing laborious preparation which, when
combined with the generally unpleasant
disposition of these fish, serve to elimi-
nate them from the diet. Moray eels,
barracuda with three gill rakers, and one
species of mullet are examples of fish
which frequently contain ciguatera. The
puffer fish and such obvious species as
the stonefish and scorpion fish are also
excluded from the diet.
Frying in oil or lard and broiling over
coals are the principal methods of cook-
ing fish, although boiling and baking in
the urn (particularly for large fish) are
sometimes used. Cooked fish may be
kept for several days by wrapping it in
breadfruit leaves and covering it with
coconut or pandanus fronds. It is re-
ported that fish can be stored over longer
periods by salting it raw and drying it in
the sun. The Ujilangese make their own
salt by evaporating ocean-side water in
kettles over a fire. The preserved fish
are rinsed in fresh water before they are
eaten. Since fish are abundant, the daily
intake depends mostly on personal prefer-
ence. Many interviews indicated that the
600 g/day, wet weight, estimated by
Murai and included in Table 5, is prob-
ably accurate to within 10-200/o.
Tridacna and hippopus clams are about
the only other seafood eaten in any signif-
icant quantity. Clams of edible size are
not common at Ujilang (or Enewetak, for
that matter), and most are consumed on
the spot by the fisherman. The large
adductor muscle is eaten raw, as well as
the mantle, but dark parts are discarded.
It is possible that some clam meat, par-
ticularly the mantle, finds its way into
the diet of the women and children, but
certainly not much. Sea turtles, spider
snails, and helmet shell snails are also
sometimes consumed, but again are only
a small portion of the diet. Sea cucum-
ber (Holothuria) and small crabs are not
eaten. A variety of small snail
(Littorina) is a delicacy, but the quanti-
ties consumed are insignificant.
Coconut
Until one has lived awhile with the
Marshallese, it is impossible to realize
what a useful tree the coconut palm is to
these people. Essentially every part of
it is used in at least one way. The leaves
are used to make baskets, to thatch roofs,
and for various handicrafts. The trunks
are used for firewood and as logs for
general building purposes. Coconut
husks make good fire-building material,
while the shells make good charcoal and
are also used as cups and bowls. The
sap from the blossom of a tree 4-5 years
old is gathered and used as a syrup; it
gives a pleasant coconut sweetness to
several foods. This same sap may be
fermented to produce an alcoholic drink;
however, drinking is against the law for
the Ujilang people. Small roots of the
tree (-1-2 mm diam) can be bleached in
the sun, dyed with the water extract of
colored crepe paper, and woven into a
variety of baskets. Hearts of palm are
rarely eaten. The tree must be
4-5 years old before the top is cut off
and the growing core is harvested. This
-38-
P
i as
jed.
ir-
,
it
2r
50
nly
.- -
.‘
:ot
;-
:e
to
If
ves
ofs,
iS
1 L,
d
rS
i;
r
S
1: : elds about b-5 kg of material and kills
:he tree.
The coconut itself iS a dietary main-
s:ay. X drinking nut, ni (pronounced -
“kneel’), is full grown but totally green,
and contains about 250-350 ml (grams) of
1 Iquid. The meat at this stage is only
about 4-5 mm thick and, while firm, is
covered with a gelatinous coating on the
Inside. Consumption of drinking nuts is
highly variable. They are traditional at
festive occasions and make an excellent
“coffee-break” drink. Usually they are
not used to quench thirst because water
is preferred, but they are used more as
the Marshallese version of soda pop.
However, if water is not available, a
working man might consume up to a dozen
nuts or so a day. On Ujilang they are
plentiful and there for the taking, which
makes an accurate estimate of the con-
sumption impossible. The meat of the
drinking nuts, a popular baby food, is
consumed only in small quantities by
older children and adults.
Ripe coconuts, similar to those for
sale in American stores, are consumed
in a variety of ways, but mostly raw.
Some of the liquid is used in cooking, and
the meat, called “copra” by the Mar-
shallese, may be eaten in pieces with
fish, or grated and added to other foods.
Favorite recipes include a mixture of
grated coconut, wheat flour, water, and
a little sugar which is baked in the urn; a
similar mixture containing baking powder
which is deep-fried (“doughnut” in Mar-
shallese); a mixture of breadfruit and
grated coconut baked in the urn; and
grated coconut and coconut sap, mixed
with steamed rice. All of the people
interviewed said they ate about half a
coconut per day. - i,ince a~. ax-erage coco-
nut yields about 200 g of copra, the figure
of 100 g/day listed In Table 5 is fairly
accurate. This also agrees \i,ell with
Llurai’s estimate.
Commercial copra is prepared by
spreading pieces of coconut meat on a
grate about 2 m above an open fire. Coco-
nut husks and shells are the favorite fuel,
and complete drying requires about 24 hr.
After drying, the copra is stored in bur-
lap sacks to await a Trust Territory field
ship. Copra-making was not in evidence
on L’jilang because, the people said, it
often spoiled before a ship ..vould arrive.
However, while the survey party was
there, Smith Gideon built a copra-drying
shed which he said would dry several
hundred pounds at a time.’
There is a stage of the coconut be-
tween ripe and sprouted when it is not
consumed. Once sprouted, the layer of
meat is gone and the inside is filled with
a pithy, yellowish mass called iu (pro- - nounced (“you”), which is highly prized
by the Marshallese. Iu may be eaten raw
:I: ‘According to Tobin, most copra is
dried in the sun rather than over a fire, and official Trust Territory figures list the copra production of Vjilang as 51.6 tons ($5000) in fiscal 1971 and 110 tons ($11,000) in fiscal 1972. If these figures are reliable, it would seem that much more copra-making goes on than was evident during the survey party’s visit. It is possible that copra is made on other islands, but the people generally said they did not make much copra. Certainly on the main island there did not appear to be an area large enough to sun-dry more than 100 tons of copra, even in a year. Current copra production is of little importance to dose- assessment calculations, but if copra is to be an important cash crop in the future, careful attention should be given to poten- tial radionuclide levels.
-39-
h

or used like copra. In what is probably
the favorite recipe for iu, iL is grated
together with copra and perhaps a little
sugar, then slurried with ni to make a
thick drink, a sort of Marshallese milk-
shake. On Majuro this mixture is frozen
on sticks and sold like Popsicles.
Breadfruit is the third main component
of the hIarshallese native diet and was in
season during the visit there. Three
varieties exist, two of which must be
cooked, and the third, somewhat less
plentiful, can be eaten either cooked or
raw. A typical breadfruit will be about
15 cm long, 10 cm in diameter, slightly
ovoid, with a rough, light-green skin and
orange flesh. The general appearance is
that of a very large avocado. Average
weight is 1100 g, with about 10% as peel
and core. The variety eaten raw is
smaller, weighs perhaps 700-800 g and
contains about 100 g of seeds which look
like small chestnuts. These seeds can be
roasted and eaten. Breadfruit is cooked
in several ways, much as we would cook
potatoes. However, the skin is never
eaten. The breadfruit may be peeled and
cored, then cut up and boiled, or it may
be baked whole with the skin on, either
over coals or in the urn. A favorite way,
especially of older women, is to peel and
core the breadfruit, then slice it perpen-
dicularly to the long axis, salt lightly,
and deep-fry. This produces a product
resembling fried pineapple rings, but
somewhat larger, and is a good snack
food, a sort of Marshallese equivalent of
potato chips. Once cooked, breadfruit
can be covered and kept for several days.
Another method of preparing bread-
fruit is to peel and core about a dozen
fruits and let them soak about 24 hr in a
-4o-
coconut-frond basket in the lagoon. They
are then rinsed in fresh water and
kneaded together on a rock or board until
the product resembles orange-colored
bread dough. This is then divided into
“loaves” of a kilogram or so apiece,
wrapped in breadfruit leaves, and stored
underground in a pit as already described.
It is said to keep several months
this way, and may be used like fresh
breadfruit after another rinse in
fresh water. This product is usually
mixed with grated coconut and baked
in the urn.
Arrowroot grows all over Ujilang and
is the principal undergrowth in the coco-
nut forest. In July, the tubers were
small because the harvest season begins
around November. The preparation of
arrowroot has been described by Tobin
and consists of digging, then washing and
grating the tubers, and placing the pulp
in a burlap sack or one woven of coconut
roots. The sack is immersed in salt
water, squeezed out by hand, and the
milky extract, consisting of a fine sus-
pension of starch, is collected. In an
hour or so the starch coagulates and is
washed several times by decantation with
salt water, then fresh water. The starch
is then spread in the sun to dry, ground
lightly to break up lumps, and stored
away where it will keep indefinitely.
Arrowroot starch is not at all like wheat
flour and is only used as a thickening
agent in soups or stews. It resembles
our familiar cornstarch. When ques-
tioned, the Ujilangese all stated a pref-
erence for wheat flour over arrowroot
starch. Flour can be used as a thickener,
as well as for other purposes. They said
that given both, they would use up the
I’j(luL. first and then fall back on the arrow
,‘( lot. 1:ram starl 10 finish, arrowroor
i,,.~,~~uctLOn is a long, ted:ous process,
,.(..c;,ilting in a product nhlch has no flavor
,,ntl limited usefulness.
]‘3ndanus was lust Coming into season
dur.,ng the July trip. When questioned,
Inost adults said that the>- eat hardly any
pandanus. It is corxumed mostly by the
(\hildren. Tobin reports a method of sun.
(trying pandanus on coconut fronds; the
1 ,lilangese acknowledged this, but
c~laimed that they do not make it often.
[‘andanus is not abundant on Ujilang and
probably will not be on Enewetak either.
About the only other native food con-
sumed in any quantity on cjilang was
pork and, in even lesser amounts,
chicken. The quantity of Pork consumed
varies greatly from family to family,
because pigs are private property, and
there is no obligation to share them.
Some families have many pigs and may
eat pork two or three times per week,
replacing fish on a gram-for-gram basis,
while other people have few or no pigs
and hence eat little or no pork. Chickens
are in the same category but are very
scarce. The reason for this seems to be
that the cats, originally imported to con-
trol the rats, did such a good job that
they had to move on to the chickens. All
animals are free-roaming and forage
anywhere on the island.
Little need be said for other native
foods. Coconut crabs and wild birds
have been essentially wiped out on Uji-
lang but may be important at Enewetak,
especially for the first year or two. The
coconut crabs are highly prized for food.
I Their legs and claws are broken off and
cooked immediately; then the crab is
force-fed until the tail doubles in size,
when 11 is used for soup. &Almost all of
the sea birds are eaten escept the golden
plover, which is believed to contain
spirits of departed souls. The young
birds just getting feathers are a favorite
food item. Again, the Marshallese
I*ecipe is simple: catch the bird,
wring its neck: and cook it over an
open Fire, entrails, feathers, and all.
The liver and heart are eaten. 13ird
eggs are eaten but are nr\t a favorite
food item.
The only garden vegetables growing on
Iljilang were two pumpkin vines, neither
of which had any pumpkins, but one was
in blossom. The lack of agriculture is
explained first by the fact that there is
practically no soil, just rocks, and sec-
ond, that the pigs are free-roaming and
fond of anything edible. The latter fact,
when combined with the cat-chicken situ-
ation, provides a real insight into the
Marshallese philosophy of life, “play it
where it lies.”
Methods of cooking imported foods
have been described as they accompanied
the native diet. Flour, in addition to the
products mentioned, is also made into
bread, baked in the urn. Rice is exclu-
sively boiled with the standard propor-
tions of two parts of water to one of rice.
Tea is drunk hot and is much preferred
to coffee. In fact, the order of prefer-
ence in beverages is tea, coffee, water,
soft drinks, and ni. Sugar is added to
several foods, and almost everyone uses
sugar in tea and coffee. Canned meats
such as corned beef, tuna, salmon, and
mackerel are eaten with no more prepar-
ation than heating, and they replace fresh
fish on a gram-for-gram basis.
bledicines and Remedies
This was the only area where there
seemed to be a definite desire for
secrecy. Apparently the Marshallese
medicine, like the folk medicine in
parts of the United States, is a family
secret and not shared extensively,
especially with outsiders. Part of
this reticence may be due to the fact
that the Marshallese realize the
sophistication of American medicine
and are afraid of ridicule. It was
inferred that many of the Marshallese
themselves did not have much faith in
their medicine, but it was worth a try,
particularly if the American version did
not work or was unavailable. Held’s
article (0p.cit.j contains some information
regarding the local remedies of Rongelap.
The reported uses of Messerschmidia
and Scaevola were confirmed on Ujilang.
The use of Messerschmidia is particu-
larly important with regard to dose
assessment, because leaves are used as
a first-aid bandage and as a poultice to
cover open wounds.
.A few general remarks regarding
health care should be made. Ujilang is
the most remote of the Marshall Islands
and as such, suffers even more than the
others from a lack of readily available
first aid, much less real medical care.
The dispensary stock consisted of aspirin,
tetracycline capsules, penicillin, dex-
trose solution, normal saline solution,
and miscellaneous odds and ends of patent
medicines. A Marshallese medical
attendant was in charge. A kerosene
refrigerator was operable but out of fuel,
and there was no other medical equip-
ment or furniture of any kind. In case of
a medical emergency, the usual proce-
dure is to divert a Trust Territory ship
and take the victim to Majuro. Usually
this means a minimum of three days’
delay. The people all appeared very
healthy and vigorous, and there seemed
to be no evidence of malnutrition or ill-
ness. However, it was reported that all
through the Marshall Islands a baby’s
first birthday is a big event and a cause
for celebration.
Agricultural Considerations
Just what the level of agriculture will
be in Enewetak is very difficult to say.
Certainly the two staples, coconut and
breadfruit, will be grown, especially on
the islands of Medren, Japtan, and
Engebi. Some pandanus and arrowroot
will also be raised. The fact that no
agriculture is practiced on Ujilang and
the reasons why have already been men-
tioned. Whether things will be different
at Enewetak remains to be seen. Many
Ujilangese interviewed remembered that
the Japanese raised a variety of vege-
tables as row crops on Engebi and Ene-
wetak. These were irrigated with either
cistern or well water containing human
waste. No one knew whether vegetables
could be grown on any other islands
(probably Japtan) but, since irrigation is
necessary, the availability of fresh water
would be a crucial factor. The implica-
tion is that, given some effort and per-
haps some fertilizer, a variety of crops
could be grown. One Ujilangese, Balik
by name, worked as a Trust Territory
agriculturalist on Majuro for a year. He
also lived on Enewetak at the time of the
Japanese occupation and recalls their
growing pumpkins, cucumbers, water-
melons, potatoes, sweet potatoes, green
-42-.
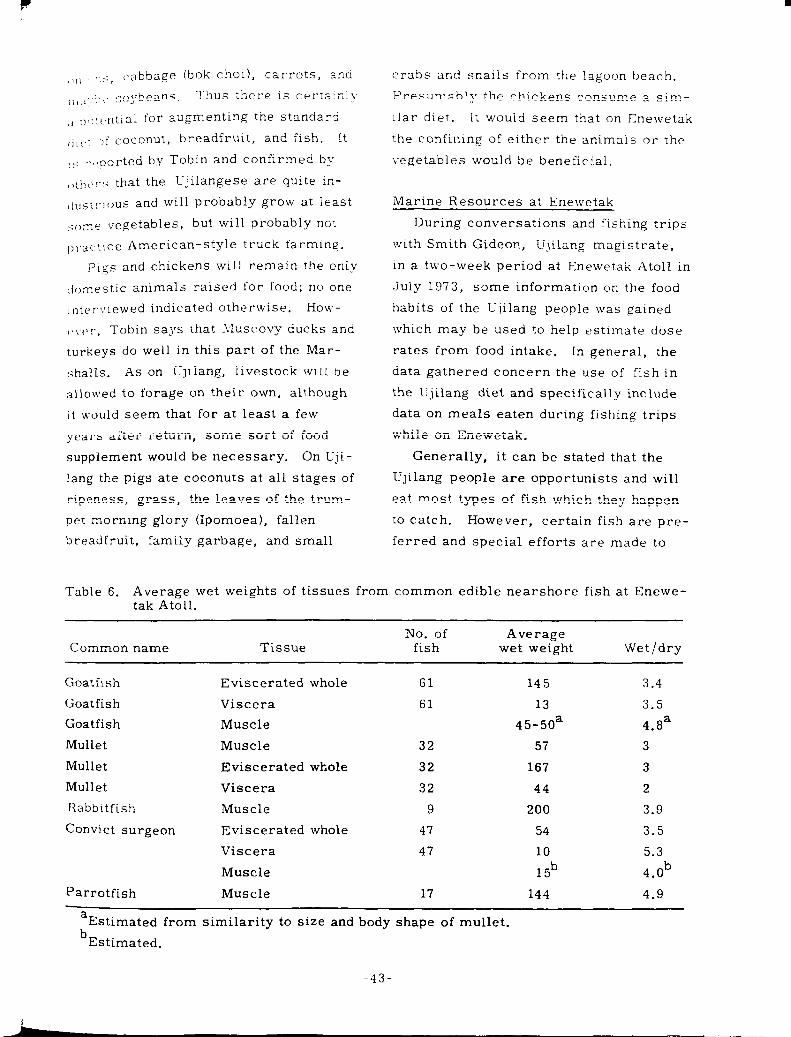
F a
,,,,I ‘1.5, c-abbage (bok chol), carrots, and
I,i.L...:YLt soybeans. Thus there is cerra:nl;
;, p,:rCIntial for augmenting the standari
ij,C.: ,-,f coconut, breadfrult, and fish. It
,? :-._,ported by Tobin and confirmed by
,,thL’!“; that the rjilangese are quite in-
cluS:!.lu~s and will probably grow at ieast
sc,r.e vegetables, but will probably no:
pl.3ctlce American-style truck farming.
Pigs and chickens will remain the only
ti()mestic animals raised for food; no one
,nter~,iewed indicated otherwise. How -
,‘\.(‘r, Tobin says that _YIuscovy ducks and
turkeys do well in this part of the Mar-
shalls. As on Ujilang, livestock will be
allowed to forage on their own, although
it \vould seem that for at least a few
years after return, some sort of food
supplement would be necessary. On Uji-
lang the pigs ate coconuts at all stages of
ripeness, grass, the leaves of the trum-
pet morning glory (Ipomoea), fallen
breadfruit, family garbage, and small
crabs and snails from the lagoon beach.
Presumably the chickens consume a sim-
liar diet. It would seem that on Enewetak
the confining of either the animals or the
vegetables would be benefici.al.
Marine Resources at Enewetak
During conversations and fishing trips
with Smith Gideon, Ujilang magistrate,
in a two-week period at Enewetak Atoll in
July 1973, some information on the food
habits of the ‘Ujilang people was gained
which may be used to help estimate dose
rates from food intake. In general, the
data gathered concern the use of fish in
the IYjilang diet and specifically include
data on meals eaten during fishing trips
while on Enewetak.
Generally, it can be stated that the
Ujilang people are opportunists and will
eat most types of fish which they happen
to catch. However, certain fish are pre-
ferred and special efforts are made to
Table 6. Average wet weights of tissues from common edible nearshore fish at Enewe- tak Atoll.
Common name Tissue No. of Average
fish wet weight Wet/dry
Goatflsh
Goatfish
Goatfish
Mullet
Mullet
Mullet
fiabbitfish
Convict Surgeon
Parrotfish
Eviscerated whole
Viscera
Muscle
Muscle
Eviscerated whole
Viscera
Muscle
Eviscerated whole
Viscera
Muscle
Muscle
61
61
32
32
32
9
47
47
17
145 3.4
13 3.5
45-5oa 4.8a
57 3
167 3
44 2
200 3.9
54 3.5
10 5.3
15b 4.0b
144 4.9
aEstimated from similarity to size and body shape of mullet. b
Estimated.
-43-
capture the preferred species. Also,
certain fish are avoided either because
they are known to be poisonous (cigua-
tera), difficult to prepare, or simply
because they are not as flavorable as
other species.
One apparently favorite fish is the
goatfish, either “Jo” (1Iulloidichthys) or
“.Jome” (LI. auriflamma). The whole fish
is laid on a grill (if available) and roasted
over a bed of hot coals for about 10 min-
utes. The skin is then peeled off and the
flesh eaten. The head of the goatfish is
considered a delicacy and is often offered
to a guest as a courtesy. The soft parts
(brain, eyes) of the head are eaten, but
the bones and viscera are discarded. All
organic waste from a meal is placed in
the fire and burned. This is a garbage
disposal method and serves to keep the
fly population down. One goatfish or
mullet (see Table 6 for average weight of
fish) is a reasonable intake at one meal;
however, some people may eat three goat-
fish. The remainder of the meal usually
consists of one-third of a copra coconut
and a drinking coconut.
Another apparent favorite is the rab-
bitfish, “bejrok” (Siganus). Rabbitfish of
other species are also known as “mole”
or “molle” and are referred to several
times in Tobin’s 1955 journal as a favor-
ite fish of the Ujilang people. The rab-
bitfish are cooked in the same manner as
the goatfish. In fact, it appears that
most fish are cooked in this manner, ex-
cept for occasions when the urn is used.
Only the flesh of the rabbitfish is eaten,
and one fish is the usual intake for a
meal. One-fourth of a copra-type coco-
nut (the kind usually sold in the U.S.,
with the meat dry), coconut crab legs
(100 g, wet), and a drinking coconut
completed this meal as prepared at
Enewetak.
Other fish which were captured on
fishing trips and which are said to be
eaten are mullet, convict surgeon, par-
rotfish, grouper, su rgeonfish, and
damselfish. These fish, along with the
goatfish and rabbitfish, probably com-
prise the most common fish found in the
nearshore water around the island of
Enewetak, and hence will probably be the
most common fish in the diet. Seven or
eight convict surgeon, some copra, and
a drinking coconut, or two to three con-
vict surgeon, copra, rice, and a drink-
ing coconut are typical meals.
There seems to be some conflicting
opinion as to whether or not the Ujilang
people eat mullet and parrotfish. Tobin,
in one conversation, stated that the Uji-
lang people do not eat either mullet or
parrotfish. However, Smith Gideon,
when shown specimens of mullet and par-
rotfish, indicated that at least three dif-
ferent species of the smaller (~12 in.)
mullet, both “ikare” (Chelon vaigiensis
or Neomyxus chaptalii) and “jomou”
(Mugil sp.), and three species of parrot-
fish are eaten on occasion. The conflict-
ing opinions may be due to the fact that
one genus of mullet, “iol” (Crenimugel
=.I, is considered to be poisonous and
therefore is not eaten. Furthermore,
parrotfish from the northern end of the
Enewetak Atoll are also considered to be
poisonous and are not eaten. Parrotfish
from the David to James area of the Atoll
are eaten. In addition, the fact that other
species of fish (goatfish and rabbitfish)
are preferred may have led to the con-
fusion on this point. However, it seems
-44-
t

i.lc31- that Tie I lilans p~>o?le, on occa-
slon, 1~~11 ear both mullet and parrotflsz.
of the fish actuall)- captured and shox::n
to Smith, i::s preference in descending
order seemed to be goatfish, rabbitfish,
mullet, convict surgeon, and parrotfish,
\vith grouper, surgeon and damselfish
occupying indefinite intermediate posi-
tions bet\%,een rabbitfish and parrotfish.
These nearshore fish are captured by
several melhods, including use of throw-
nets, gillnets, and a surround technique
by which the fish are driven into shallow
water where they are hand-captured or
dip-netted. Additional thrownets and
gillnets, along with appropriate mending
materials, might be considered as a part
of the rehabilitation program for the
Enewetak people.
A fish not actually captured but indi-
cated to be very good to eat is the flying
fish, “jojo” (Exocoetidae). These fish
are captured at night by building a fire in
a boat and attracting them to within a
range where they may be netted. Some
flying fish also fall into the boat during
their flight toward the attracting light.
Small hooks on a line are also used in a
manner similar to the jigging of herring
or smelt which bite on the bare hooks
that simulate the planktonic organisms
they feed on.
Other fish which reportedly are eaten
are barracuda with four gill rakers,
“nidwa,” tunas, and other similar lagoon
fish such as jacks, mackerel, and dol-
phin. Although larger sharks (probably
gray sharks but not thresher or nurse
sharks) are eaten, they probably are a
minor portion of the diet due to the length
of time required in the preparation of the
flesh to make it edible. This lengthy
T-eoaration is due to the urea in the flesh c
_ )- :.enders the fresh fish unpalatable: . ..\ I.
E shark has a big smell.”
In the preparation oi shark flesh, the
I 1 5 r, is boiled in hot water for about
15 minutes, after which the skin is re-
rn7.,.ed. The flesh is then boiled for sev-
eral hours, presumably until the smell
~2~s a-s::av “. Nest, the boiled meat is
fr:ed or steamed (urn) and then placed in
IL? sun until it is dry. This process
rakes n:ost of a day, but the finished
?:-oduc: is considered good.
The capture of large lagoon fish re-
oulres boats and fairly heavy fishing I .- L .,,es, feathered jigs, and large hooks.
Hence, the use of these fish in the diet
hlehly dependent on these items and is
probably less than the utilization of the
nearshore fish because of the present
is
scarcity of adequate fishing gear and be-
ca.Jse r!le nearshore fish are so abundant
and easily captured at most times. In
general, at the present time, deepwater
lagoon fish are probably not as abundant
in the diet as they would be if more fish-
ing gear were available to the people.
Other martne organisms which may be
eaten include porpoise, tridacna clams,
l” kabwu r” ), shore crabs, and large gastro-
pods (en). Other smaller gastropods are
also called en, but they are not eaten.
These include spider snails and smaller
Strombus species.
Porpoise are captured by surrounding
them as they enter the wide pass or deep
channel and herding them into shallow
water. Herding is accomplished by bang-
ing rocks together underwater and splash-
ing on the surface.
Three types of Tridacna are distin-
guished by the Enewetak people: (1) the
large killer clam, ‘I’ridacnagigas; (2) a
white-mantle, medium-sized clam; and
(3) small clams jr-ith colored mantles
which are embedded in the reef. All
types are called kabwar. NO informa-
tion was obtained on how these clams are
prepared, but it is known that other Mar-
shallese people do not eat the kidney, due
to its very bitter ilavor, and it may be
presumed that this is the case for the
Enewetak people until different informa-
tion is obtained.
Another organism which will certainly
be eaten by the returning Enewetak people,
unless advised to the contrary, is the
coconut crab, “baru lip” (Birgus latro).
The first step in preparing this crab is to
knock the pincer legs and the largest
walking legs off with a machete. The legs
appear to break off near the body at a nat-
ural breaking point, which quickly heals
over. By doing this the crabs can be
easily contained without causing damage
to themselves or to their captors. Also,
crabs can be held alive like this for sev-
eral weeks. The legs and the bodies of
crabs not to be saved are then roasted
over a bed of coals.
From discussions with Smith Gideon,
I would conclude that the diet of the Uji-
lang people is very similar to diets of the
Bikini people, the Rongelap people, and
other northern island groups in the Mar-
shall Islands. This is true because the
basic foods are the same in all these
areas. Breadfruit, pandanus, arrowroot,
and coconut are the chief natural terres-
trially grown Lregetative foods, with im-
ported rice and flour supplementing this
portion of the diet to a degree which is
very dependent upon the length of
time from the visit of the last field-
trip ship.
Fish, clams, and langousta from the
lagoon and reef; birds and bird eggs from
bird-nesting islands; domestic pigs and
chickens raised on the village island; and
imported meats (corned beef, sardines)
provide the animal protein in the diet.
Again, the proportions vary greatly with
the availability of specific items; how-
ever, fish are indicated as being an im-
portant part of the diet at Ujilang and
will probably be more important at Ene-
wetak Atoll where the fish supply is
greater.
It should be remembered that a diet
determined for the Ujilang people over
one short time period may differ greatly
from a diet determined over another time
period in a different season or at a differ-
ent length of time from the last visit of a
trade ship. I feel, therefore, that a com-
posite diet, based on all available diet
information for the Ujilang, Bikini, and
Rongelap people, is the best information
to be used in the calculation of dose rates
from food intake.
-46-
III. Survey Execution rot,
j-
Id
le
r-
a
n-
Iv!‘. Ser\-ik, Lawrence 1-i:.ermore
:\fter agreeing tie conduct the radiolog-
li~al survey, the AEC assigned responsi-
l,Llity for the program coordination to its
l)lvLsion 0f Military Applications (DMA).
hlajor General F. A. Camm, Asst. Gen.
ylgr. for Military Applications, then
directed the AEC Nevada Operations
Office (NV001 to esecute the program,
using the following specific instructions:
“As a result of commitments made by
Ambassador Williams and initial agree-
ments reached during an interagency
meeting held on September 7, 197 2, it is
the overall AEC purpose to gain a suffi-
cient understanding of the total radiolog-
ical environment of Enewetak Atoll to
permit judgements as to whether all or
any part of the Atoll can safety be rein-
habited and, if so, what steps toward
cleanup should be taken beforehand and
what postrehabilitation constraints must
be imposed. It is necessary to thor-
oughly examine and evaluate radiological
conditions on all islands of the Atoll and
in the local marine environment prior to
commencement of cleanup activities in
order to obtain sufficient radiological
intelligence to develop an appropriate
cleanup program. Specifically, it is
necessary:
1. TO locate and identify contaminated
and activated test debris,
2. To locate and evaluate any significant
radiological hazards which may com-
plicate cleanup activities, and
-47-
Laboratory, Li\.ermore, C‘aliiornis
:3 . To identify sources of direct radia-
tion and food-chain-to-man paths
having radiological implications.
You are directed to plan, organize,
and conduct a radiological field survey to
develop sufficient data on the total radio-
logical environment of Enewetak Atoll to
permit the assessments on which the
judgements described above can be
made.”
A number of factors strongly influ-
enced the planning of the survey:
Although a number of studies of Me-
wetak had been conducted previously,
none provided either current or com-
plete information on the radiological
state of the Atoll. The Survey would
therefore have to obtain data on all
islands and all human dose pathways
in sufficient detail and accuracy to
permit reliable population dose esti-
mates to be made for the future
inhabitants.
In September, 1972, the only field sup-
port facilities available at Enewetak
were those operated by the U. S. Air
Force, which then had custody of the
Atoll. The base support resources
were committed to certain military
activities, but an open period in those
activities permitted the scheduling of
support to the AEC survey from mid
October thru December 1972.
Although Ambassador Williams had not
promised the return of the Enewetak
people to the Atoll at the end of 1973.,
his speech was widely interpreted to
mean lust that, land therefore there
was considerable pressure for the
XEC radiological survey and dose
assessment effort to be completed as
quickly as possible.
l Given the size of the sampling pro-
gram, the time constraints imposed
by limited field support facilities, the
large amount of radiochemical analyt-
ical work required, the complex dose
assessments that were needed, and the
growing hopes and expectations of an
early resettlement, it was clear that
no single technical organization was
big enough to conduct this program by
itself, nor were there many who could
or would divert sizable numbers of
highly qualified technical people from
previous commitments on less than
one month’s notice.
With these factors influencing deci-
sions, the Radiological Survey was orga-
nized in the following way:
A Program Manager (Roger Ray) was
assigned by NV00 to provide overall
program responsibility, liaison and
coordination among organizations
operating in the field, and fiscal con-
trols at the NV00 level.
The Lawrence Livermore Laboratory
(LLL) agreed to provide a Technical
Director (Dr. Walter Nervik) for the
program and to act as the focal point
for technical activities associated
with the program.
Technical leadership for the various
components of the program was
assigned as follows:
Aerial Photography and Radiation
Survey (J. Doyle, EGG)
Terrestrial Soil and Radiation
Survey (P. Gudiksen, LLL, and
0. D. T. Lynch, XVOO)
External Dose Estimates
(J. McLaughlin, HAS L,
P. Gudiksen, LLL, and D. Jones,
LLL)
Marine Survey (V. Noshkin, LLL,
and V. Nelson, U. Wash.)
Terrestrial Biota Survey
(G. Potter and J. Koranda, LLL)
Air Sampling (D. Wilson and
B. Clegg, LLL)
Radiological Support to the DOD
Engineering Survey (0. D. T.
Lynch, NV001
Analysis Program (R. Hoff, LLL)
Radiological Controls (0. D. T.
Lynch, NV00 1
Dose Assessments (D. Wilson,
Y. Ng, and W. Robison, LLL)
l These leaders then completed plans
for the field sampling, analysis, and
interpretation portions of their compo-
nent and identified individuals who
would be doing the work. Because of
the scope and unusual nature of this
program, individuals from an excep-
tionally large number of organizations
have been involved, including NVOO,
LLL, National Environmental Research
Center (EPA, Las Vegas), Laboratory
for Radiation Ecology (LRE) (Univer-
sity of Washington), University of
Hawaii Enewetak Marine Biological
Laboratory (EMBL), Trust Territory
of The Pacific Islands (TTPI),
McClellan Central Laboratory (MCL),
Laboratory for Environmental Studies
(LFE), Eberline Instrument Co. (EIC):
AEC Division of Operational Safety,
AEC Division of Biomedical and Envi-
ronmental Research, EG&G, Inc.
-48-

,l.;GG), _iEC Health and Safety Labora-
:ory (HASL), the Defense Zuciear
.Agency (3sA), Holmes and Sarver
iH and 31, the L-‘. S. Savy, C.S. Marine
Corps, ar,d the r. S. Air Force field
support contractors.
Given the directive to proceed 011
September 7, 1972, the Survey plan was
completed, reviewed, and approved on
September 13. (A copy of the final Sur-
\.ey plan appears in Appendix I.) The
[TieId Survey party departed COSUS in
two contingents, one on October 13 and
the second on October 15, and field oper-
ations were begun on October 16 with the
Soil, Marine, Terrestrial Biota, _Air
Sampling, and Engineering Sut-I-ey Com-
ponents all conducting their activities
simultaneously. This put a very definite
strain on the marine transport equipment
(four boats), but all operations were
proceeding smoothly until October 21,
when the Survey party received its first
alert warning of the approach of Typhoon
Olga, predicted to pass directly over
Enewetak on October 24 with winds of
125 knots and gusts to 165 knots. Survey
activities ceased with that alert, all
equipment was made secure, and every-
one on the Atoll was evacuated to Kwaja-
lein on the evening of October 23. Upon
return to Enewetak on October 25, the
Power plant was found inoperative, and
we were advised that the island could not
support the Survey Party. All Survey
Personnel were sent home until support
facilities could be provided once again.
Operations were resumed on Novem-
ber 8 with the initiation of the aerial
survey. In the interim period from Octo-
ber 25 to November 8, changes in the
scheduling of the military programs at
-49-
Enelr-etak provided further relief in the
form of an extension oi available ileld
support. The AEC radlologlcal ileld
survey schedule was thus extended to m:d
February. The field effort actually ter-
minated on February 13, 1073. In the
following sections each component of the
Survey is discussed in detail by those
who were responsible for the effort.
AERIAL RADIOLOGIC_\L -4111 PHOTOGRAPHIC SLiRVE\
T. P. Stuart and R. ;IIeibaum EG&G, Inc., Las Vegas, Sevada
Introduction
An aerial radiological and photo-
graphic survey of Enewetak Atoll was
performed by EG&G during a 16-day
period between November 8 and 23, 1972.
This work was done in order to charac-
terize the terrain, including the entire
reef, and to determine the gamma-
radiation levels and the spatial distribu-
tion of radioactive isotopes which are
residues from earlier nuclear explosive
experiments. Much of the fission-
product and activation residues from the
nuclear explosives experiments during
the period 1948 through 1958 have re-
mained to contaminate many of the
islands and sections of the adjoining reef.
In addition to fission and activation prod-
ucts, there is plutonium metal scattered
at some locations as a result of explosive
experiments which did not achieve a fis-
s ion yield. Primary contaminants ob-
served from the aerial radiological
measurements are 6oCo, 137Cs, and
23gPu.
The aerial radiological and photo-
graphic survey was carried out from a
helicopter and covered all 39 islands of
the Atoll, The photography covered four
wavelength bands in the visible and near-
infrared spectrum, and served to docu-
ment the geographical features of the
Atoll and serve as a basis for navigation
in carrying out the radiological survey.
The aerial radiological survey involved
only gamma-ray measurements and in-
cluded both gross gamma counts and
energy spectral information in the 50-keV
to 3-MeV range. The radiological meas -
urements resulted in a determination of
the spatial distribution of gamma-
radiation exposure rate in pR/hr at one
meter above the ground, as well as iso-
topic concentration for 6oCo, 137Cs, and
plutonium-related 241Am. These meas-
urements are presented as isopleth plots
superimposed on aerial photographs of
the islands. Correlations with ground-
based radiation measurements and soil
sample analysis are discussed in the
subsection on Nuclear Lnstrumentation
Systems and Methods.
The photographic data, together with
the radiological survey results for the
gamma-exposure rates and isotopic con-
centration for 6oco, 137Cs, and
plutonium-related 241Am, are presented
in Appendix II. The next subsection of
this report gives a description of the
photographic instrumentation and meth-
ods, while the last subsection describes
the nuclear instrumentation systems and
methods.
Photographic Instrumentation and Methods
Camera Mounting - The four
Hasselblad cameras were mounted on a
rigid plate which subsequently was
mounted to the floor of a CH-53 Sea
Stallion helicopter, allowing the cameras
to view the terrain through a large port
in the floor. Since gyrostabilization or
shock mounting of the cameras was not
used, the system optical axis moved in
concert with the aircraft attitude and
pitch. The optical axis of the camera
system was perpendicular to the floor of
the aircraft, which was maintained
reasonably level during photographic
missions.
Multispectral Camera System Onerational Considerations -
Photographic missions were flown at Hasselblad Camera System - The
aerial photographs of the islands compris- altitudes selected to image a single island
-5o-
ing the Enewetak Atoll were taken with a
four-camera system consisting of 70-mm
500 EL Hasselblad cameras, equipped
with 80-mm lenses. The four cameras
were arranged along parallel optical paths
and imaged identical ground images on
the four image planes. The frame size
was 55 X 55 mm.
Each of the four cameras recorded a
different portion of the visible and near-
infrared spectrum. The wavelength
region recorded was controlled by the
choice of film sensitivity and optical
filter combinations. The four film and
filter combinations used are shown in
Figs. 7 through 10. The four wavelength
regions recorded were:
Normal color 4000 -7000 A
Infrared color 5000- 9000 i
Panchromatic / red filter
Infrared black and white
6000-7000 A
7000- 9000 i
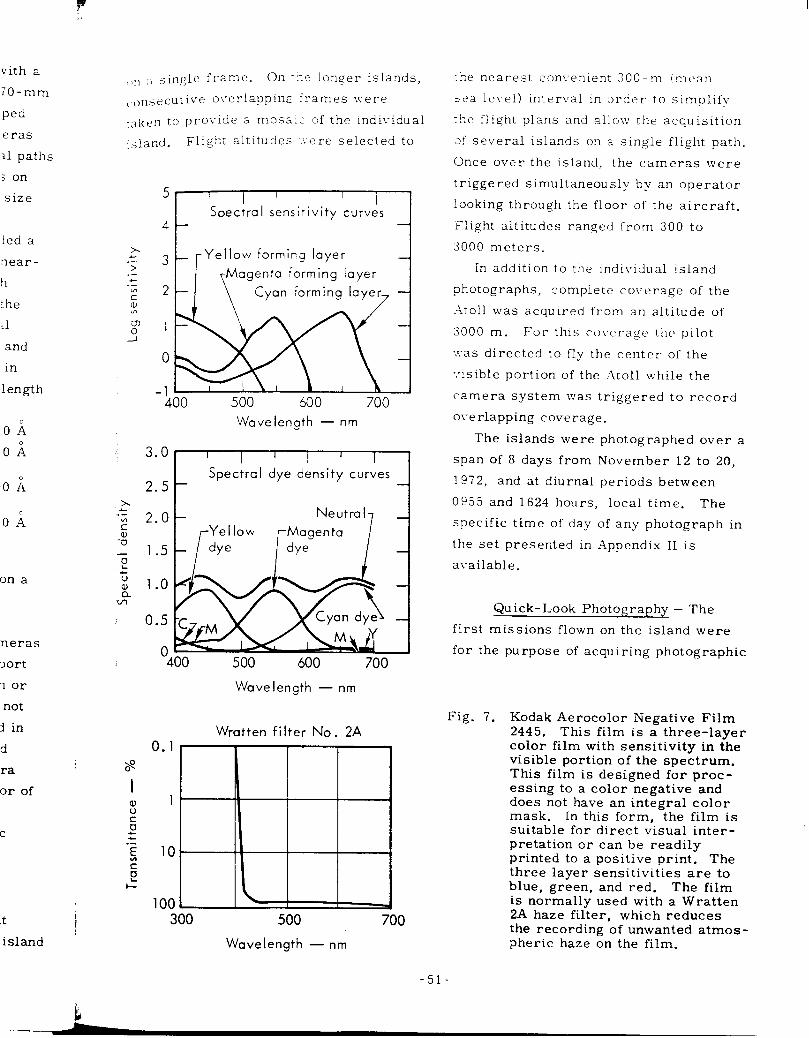
P
vith a
iO-mm
ped
eras
11 paths
; on
size
,,,] :: single frame. On Tc? longer islands,
i onsecutive o\rerlappine frames xvere
:aken to provide a mos;i:: of the individual
Island. Flight altitudes -.:ere selected to
rke nearest conl.enien: 300-m imean
Sea level) interval in order to simplify
rhe flight plans and allow the acquisition
31 several islands on a single flight path.
Once over the island, the cameras were
Triggered simultaneously by an operator
looking through the floor of the aircraft.
flight altitudes ranged from 300 to
3000 meters.
In addition to the lndi\-idual island
I I I I 1
Speciral sensitivity curves
3 Yellow forming layer
Magenta farming layer
2 \ Cyan forming layer7
ied a
near -
h
:he
Ll
and
in
length
photographs, complete co\‘erage of the
-Atoll was acquired from an altitude of
3000 m. For this co\yeragc the pilot
xas directed to fly the center of the
:.isible portion of the _4toll while the
camera system was triggered to record
o\-erlapping coverage. 500 600 700
Wavelength - nm
3.0 I I I I
2.5 - Spectral dye density curves
Oii
Oi The islands were photographed over a
span of 8 days from November 12 to 20,
1972, and at diurnal periods between
0955 and 1624 hours, local time. The Ofi
.; 2.0
G 1.5 t
Neutral
r
Ye I low
r
Magenta
- dye dye
OA specific time of day of any photograph in
the set presented in Appendix II is
available. on a
Quick-Look Photography - The
first missions flown on the island were neras
3ort
1 or
not
ZI in
d
ra
or of
for the purpose of acquiring photographic
Wavelength - nm
Fig. 7. Kodak Aerocolor Negative Film 2445. This film is a three-layer color film with sensitivity in the visible portion of the spectrum. This film is designed for proc- essing to a color negative and does not have an integral color mask. In this form, the film is suitable for direct visual inter- pretation or can be readily printed to a positive print. The three layer sensitivities are to blue, green, and red. The film is normally used with a Wratten 2A haze filter, which reduces the recording of unwanted atmos- pheric haze on the film.
Wratten filter No. 2A
0.1
9 CJ
’
I
a, 1,
? 0 z ._ E 10 - ul s c'
1001
C
300 500 700 .t i
island Wavelength - nm
-51-

Spectral sensitivity curves
::j
kO0 500 600 700 800 900
Wavelength - nm
Spectral dye density curves
: 2.0 3 a 1 .5
‘3 1.0
k v, 0.5
0 400 500 600 700
Wavelength - nm
8 Wra tten Wratten
I filter No. 12 cc 30 blue 0.1
1
10
100 FBI 400 600
EizEEl 300 500 700
Wavelength - nm
Fig. 8. Kodak Aerochrome Infrared Film 2443. This film is a false- color reversal film designed for use in aerial photography. It differs from ordinary color film in that the three layers are sen- sitive to green, red, and infrared radiation instead of the usual blue, green, and red. A Wratten 12 yellow filter is always used with this film to absorb blue light, to which all three layers are sensitive. The Wratten CC30 blue filter was used to cor- rect the color balance of this particular emulsion batch and is not normally used with this film.
maps for use by the radiation monitoring
personnel. This was accomplished by
using the four-camera system equipped
with a different film and filter combina-
tion than for the multispectral coverage.
Kodak Plus-X Aerographic with a Wratter
12 filter was used to provide a photo-
graphic record in black and white that
closely simulated the tonal relationship
Spectral sensitivity curve
31
200 500 600 700
Wavelength - nm
Wratten filter No. 25 0.1
1
10 - I
loo* 400 500 600 ; IO
Wavelength - nm
Fig. 9. Kodak Plux-X Aerographic Film 2402. This film is a panchro- matic negative material that has extended red sensitivity. When used with a Wratten 25 filter which absorbs blue and green light, only those objects that have reflections in the red por- tion of the spectrum will be recorded.
-52-

> -.
Yen
Spectral sensirivity curve
!z!zzxI 400 600 800 1000
Wavelength - nm
Wratten fi I ter No. 89B
Fig.
Wavelength -nm
10. Kodak Infrared Xerographic Film 2424. This film is a neg- ative material which is sensi- tive to infrared radiation, as well as to the blue light of the visible spectrum. When used with a Wratten 89B filter, which absorbs all visible radiation, only the infrared radiation from the subject is recorded on the film.
that the human eye sees. The missions
were flown similarly to the multispectral 1
i
missions.
Photographic Processing and
.n Printing
:S On-Island Processing and Printing-
1 The imagery acquired during the quick- I
look photogranhic missions was processed
and printed on the island, using the
Eniwetok Marine Biology Laboratory.
Conventional black-and-white developing
and nr:ntinp v:ere accomplished to pro-
vide a 40 X 50-cm phorozraphic map of
each Island.
Laboratory Processing and
Printing - Exposed film from the
multispectral camera system leas pro-
cessed in Las L-egas, Nevada. The two
black-and-white films were processed by
EG&G in a 1-ersamat 5N. Roth color-
film records were processed commer-
cially in a Kodak Color 1-ersamat.
Photographic enlargements \vere made
by EG&G from all records. The degree
of enlargement varied for each island
photograph because the island size was
imaged to fit the print format with some
water surrounding it.
Report Reproductions - The color
lithographs in Appendix II were made from
the normal color photographic record
using four-color separation negatives pre-
pared by EG8;G. The color printing was
done by EG&G on a model 1250 L&W Multi-
lith press. Overprinting of titles and data
was accomplished on the same press.
Interpretation and Utility of the Photoaradhs
Multispectral Imagery Interpreta-
tion - The imagery acquired of each island
consists of the four wavelength regions
previously described, examples of which
are shown in Figs. 11-14. These are
film records recorded simultaneously
over Japtan Island (DAVID). Each figure
shows imagery from a different portion of
the spectrum. Figure 11 shows normal
wavelengths similar to those seen by the
human eye, covering 4000 to 7000 i. In
Fig. 12 all of the colors seen are “false”

with regard to human vision. In this pic-
ture, wavelengths between 5000 and 6000 i
(green wavelengths) are recorded as blue,
wavelengths between 6000 and 7000 i (red
wavelengths) are recorded as green, and
wavelengths between 7000 and 9000 i
(infraredwavelengths) are recorded as red.
Figure 13 is the black-and-white record
on panchromatic film and exposed through
a it’ratten 25 red filter. On this imagery,
only wavelengths between 6000 and 7000 _L
are recorded. Figure 14 is the black-
and-white record recorded on infrared
film with a visible absorbing filter, On
this imagery only infrared wavelengths
between 7000 and 9000 Aare recorded.
While there are many facets to con-
sider when interpreting multispectral
photographs, a few general guidelines
may be helpful. It is best to spread the
four photographs for any one island out
on a table when examining them so that
the differences can be easily and quickly
observed. The normal color record and
the black-and-white (red filter) record
both penetrate water depths well and show
underwater terrain well. However, from
the normal color record, it is difficult to
determine where the water’s edge is
located. This can be easily determined
by looking at the black-and-white (infrared
film) record which shows all water areas
as black. The differences between the
appearance of the water areas on the nor-
mal color and the infrared color record
are significant. The normal color record
shows colors on the print as they would
be seen by the eye. However, on the
infrared color record, all the colors are
“false.” On this record the water still
shows as a blue color, even though the
film, when used with a yellow filter, has no
sensitivity to blue wavelengths. The blue
areas on the print are the direct result
of green wavelengths reflected to the
camera. In this “false-color” imagery,
healthy vegetation and coral areas show
as red. This indicates high reflectivity
in the near-infrared region of the spec-
trum. The black-and-white (red filter)
record shows green trees very dark and
generally causes man-made objects such
as concrete, asphalt, and buildings to
stand out against the dark background.
On the black-and-white (infrared film)
record, green healthy trees which have a
high reflectance in the infrared region
appear very light, indicating again a high
reflectance in the infrared region.
Other Interpretations of the Photog-
raphy - A wealth of information is con-
tained in the photographs. Using a
detailed study of one or of a series of
photographs and aided by suitable analysis
techniques, the photographs could be used
for the following:
Determine the percentage of tree
cover for any island.
Establish vegetation types.
Determine the waterline at the time
of the photograph.
Locate major areas of debris.
Determine suitable boat landing
areas.
Determine relative water depths
around the islands.
Additionally, because some islands were
photographed with overlapping coverage,
a stereo presentation is possible. This
results in considerably more information
about the terrain, surface cover, and man-
made structures than is possible with a
single photograph.
- 54-
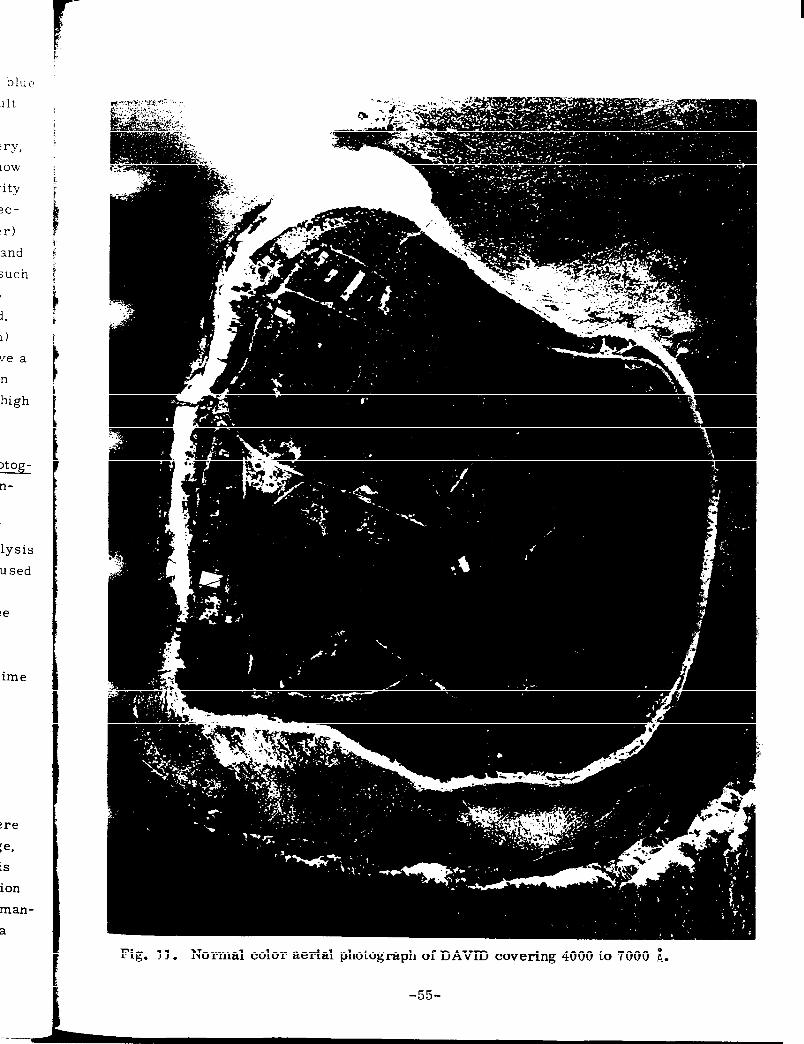
blue
.l1t
try,
LOW
.ity
?C-
ar)
and
;Uch
1.
1)
ve a
n
high
lysis
used
!e
ime
rre
:e,
.S
ion
man-
a
Fig. Il. Normal color aerial photograph of DAVID covering 4000 to 7000 i.
-55-

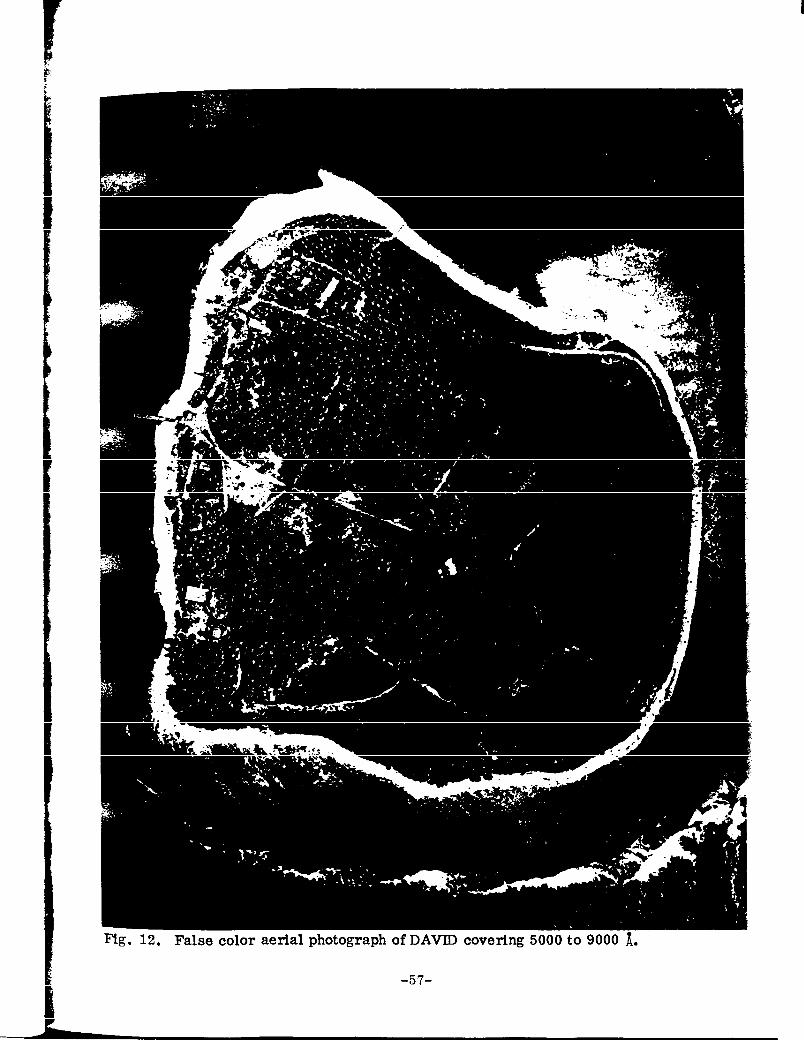
Fig. 12. False color aerial photograph of DAVID covering 5000 to 9000
-57-

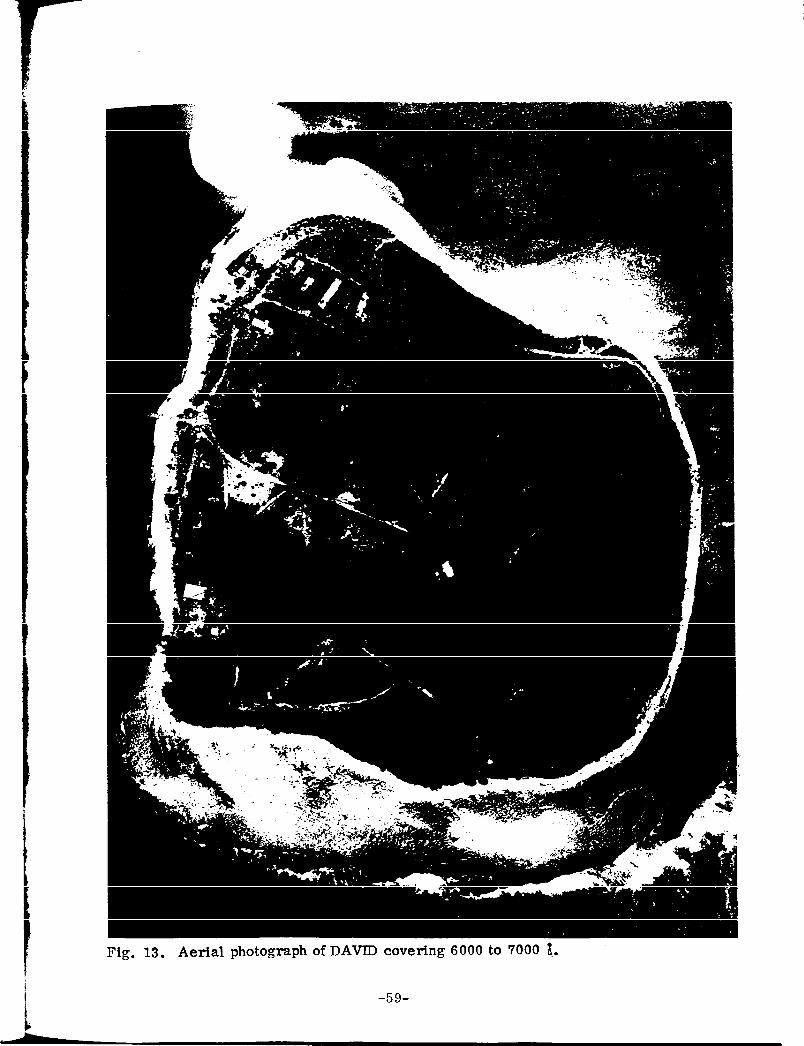
Y
Fig. 13. Aerial photograph of DAVID covering 6000 to 7000 8..
-59-


Fig. 14. Aerial photograph of DAVID covering 7000 to 9000 1.
-61-


Fig. 15, Single frame of high-altitude photographic coverage.
-63-

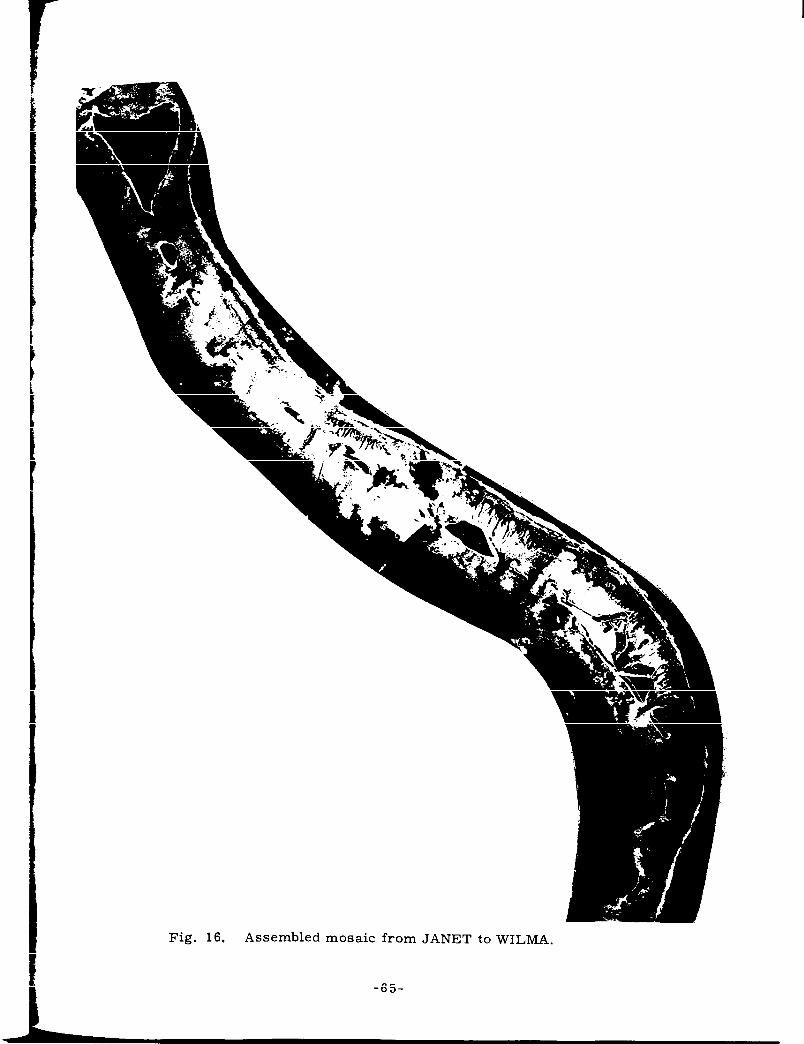
Fig. 16. Assembled mosaic from JANET to WILMA.
-65-


-67-

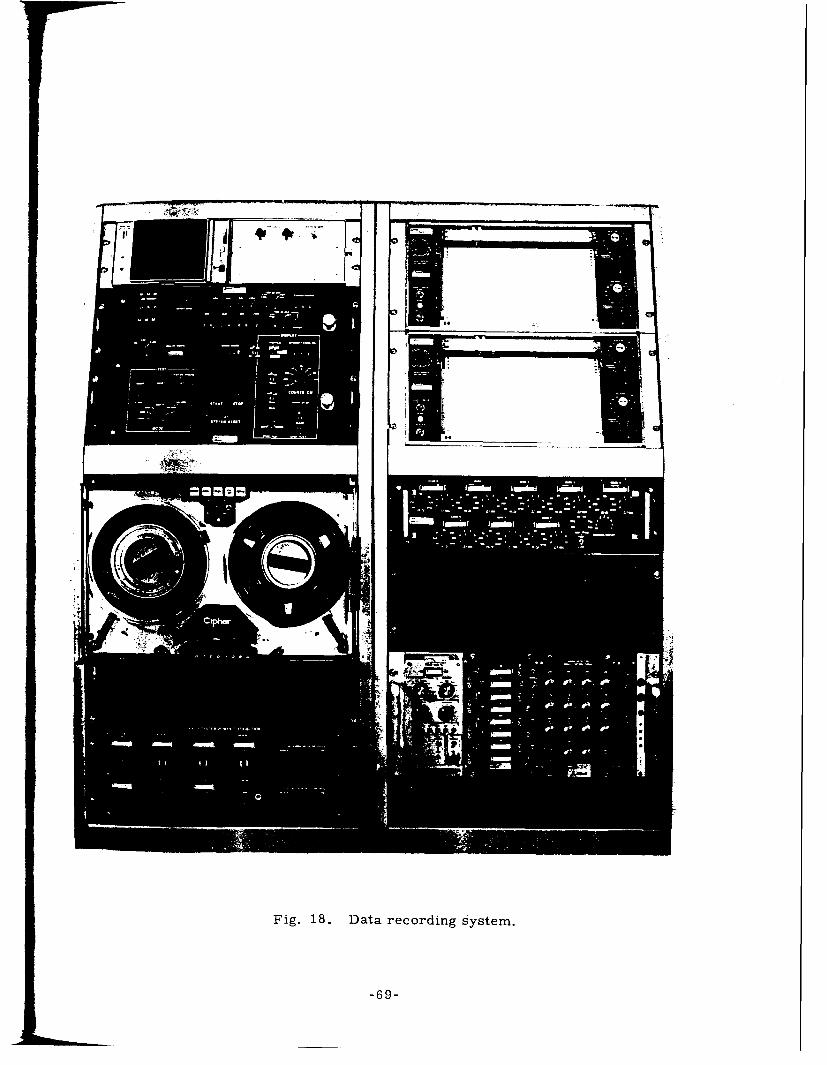
,
frill f---* -i-
Fig. 18. Data recording system.
-69-

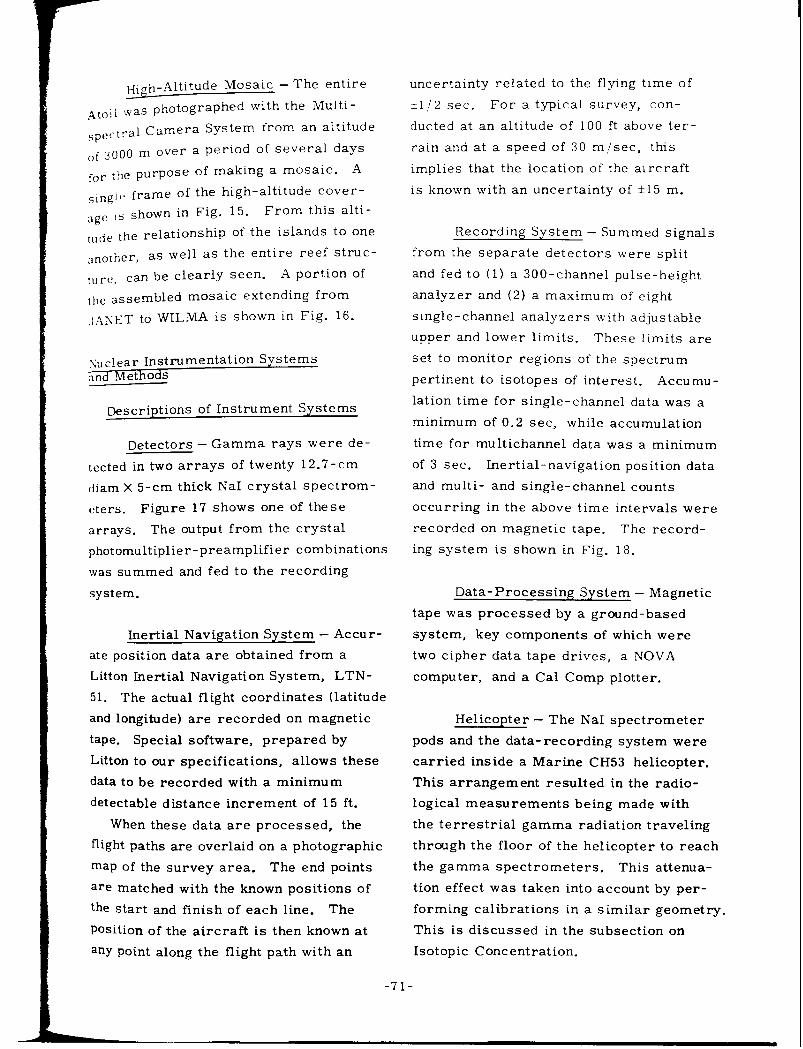
High-Altitude Mosaic - The entire
Atoll was photographed with the Multi-
,prcrral Camera System from an altitude
(,I 3000 m over a period of several days
for the purpose of making a mosaic. A
sing]<‘ frame of the high-altitude cover-
age !s shown in Fig. 15. From this alti-
rllde the relationship of the islands to one
another, as well as the entire reef strut-
ture, can be clearly seen. A portion of
tl,c assembled mosaic extending from
.IA>ET to WILIvlA is shown in Fig. 16.
Qclear Instrumentation Systems and hlethods
@scriptions of Instrument Systems
Detectors -Gamma rays were de-
tected in two arrays of twenty 12.7-cm
diam x 5-cm thick NaI crystal spectrom-
eters. Figure 17 shows one of these
arrays. The output from the crystal
photomultiplier-preamplifier combinations
was summed and fed to the recording
system.
Inertial Navigation System - Accur-
ate position data are obtained from a
Litton Inertial Navigation System, LTN-
51. The actual flight coordinates (latitude
and longitude) are recorded on magnetic
tape. Special software, prepared by
Litton to our specifications, allows these
data to be recorded with a minimum
detectable distance increment of 15 ft.
When these data are processed, the
flight paths are overlaid on a photographic
map of the survey area. The end points
are matched with the known positions of
the start and finish of each line. The
Position of the aircraft is then known at
any point along the flight path with an
-71-
uncertainty related to the flying time of
~112 sec. For a typical survey, con-
ducted at an altitude of 100 ft above ter-
rain and at a speed of 30 m/set, this
implies that the location of the aircraft
is known with an uncertainty of 115 m.
Recording System - Summed signals
from the separate detectors were split
and fed to (1) a 300-channel pulse-height
analyzer and (2) a maximum of eight
single-channel analyzers with adjustable
upper and lower limits. These limits are
set to monitor regions of the spectrum
pertinent to isotopes of interest. Accumu-
lation time for single-channel data was a
minimum of 0.2 set, while accumulation
time for multichannel data was a minimum
of 3 sec. Inertial-navigation position data
and multi- and single-channel counts
occurring in the above time intervals were
recorded on magnetic tape. The record-
ing system is shown in Fig. 18.
Data-Processing System - Magnetic
tape was processed by a ground-based
system, key components of which were
two cipher data tape drives, a NOVA
computer, and a Cal Comp plotter.
Helicopter - The NaI spectrometer
pods and the data-recording system were
carried inside a Marine CH53 helicopter.
This arrangement resulted in the radio-
logical measurements being made with
the terrestrial gamma radiation traveling
through the floor of the helicopter to reach
the gamma spectrometers. This attenua-
tion effect was taken into account by per-
forming calibrations in a similar geometry.
This is discussed in the subsection on
Isotopic Concentration.
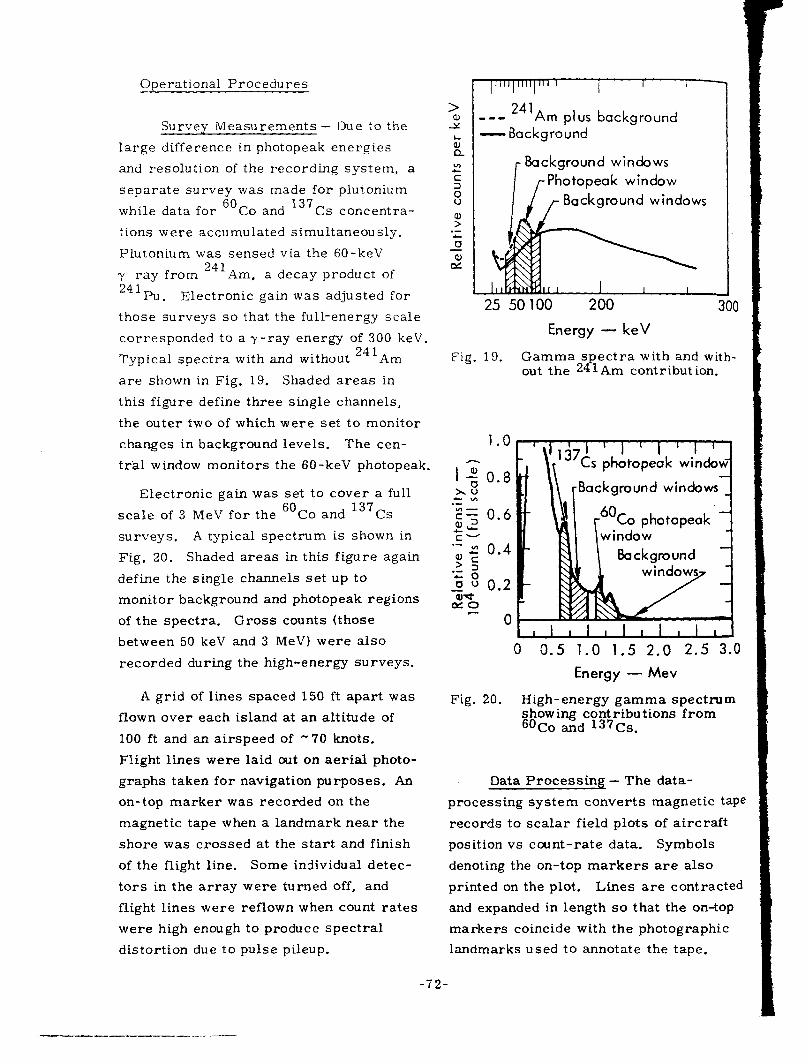
Operational Procedures
Survey NIeasurements - Due to the
large difference in photopeak energies
and resolution of the recording system, a
separate survey was made for plutonium
while data for 60 Co and 137 Cs concentra-
tions were accumulated simultaneously.
Plutonium was sensed via the 60-keV
y ray from 241 Am, a decay product of
241Pu. Electronic gain was adjusted for
those surveys so that the full-energy scale
corresponded to a y-ray energy of 300 keV.
Typical spectra with and without 241Am
are shown in Fig. 19. Shaded areas in
this figure define three single channels,
the outer two of which were set to monitor
changes in background levels. The cen-
tral window monitors the 60-keV photopeak.
Electronic gain was set to cover a full
scale of 3 MeV for the 6oCo and 137Cs
surveys. A typical spectrum is shown in
Fig. 20. Shaded areas in this figure again
define the single channels set up to
monitor background and photopeak regions
of the spectra. Gross counts (those
between 50 keV and 3 MeV) were also
recorded during the high-energy surveys.
A grid of lines spaced 150 ft apart was
flown over each island at an altitude of
100 ft and an airspeed of e 70 knots.
Flight lines were laid out on aerial photo-
graphs taken for navigation purposes. An
on-top marker was recorded on the
magnetic tape when a landmark near the
shore was crossed at the start and finish
of the flight line. Some individual detec-
tors in the array were turned off, and
flight lines were reflown when count rates
were high enough to produce spectral
distortion due to pulse pileup.
IIII ml III 1 I I
241 ___ Am plus background -Background
Background windows
il
Photopea k window
/- Background windows
25 50100 200 300
Fig. 19.
1.0
i X0.8 xs LV1 ._ z!- Zf 0.6
._ ;; 0.4
>
5 s 0.2
SF& 0
Energy - keV
Gamma spectra with and with- out the 241Am contribution.
Cs photopeak winda<
\\ rBackground windows ]
0 0.5 1.0 1.5 2.0 2.5 3.0
Energy - Mev
Fig. 20. High-energy gamma spectrum showing contributions from 6oCo and 137Cs.
Data Processing - The data-
processing system converts magnetic tap
records to scalar field plots of aircraft
position vs count-rate data. Symbols
denoting the on-top markers are also
printed on the plot. Lines are contractec
and expanded in length so that the on-top
markers coincide with the photographic
landmarks used to annotate the tape.
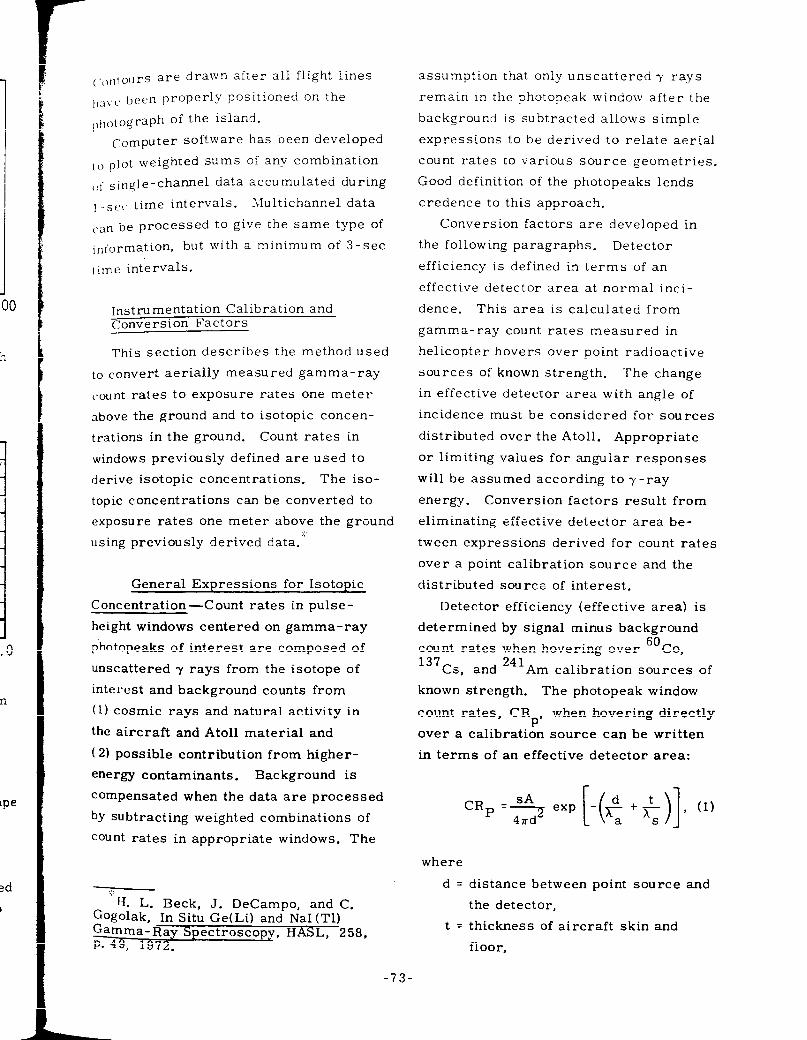
(‘c,rItours are drawn after all flight lines
I,:,\.~~ been properly Positioned on the
i,i,otograph of the island.
Computer software has been developed
to plot weighted sums of any combination
,)f single-channel data accumulated during
1 -s~(’ time intervals. Llultichannel data
“an be processed to give the same type of
information, but with a minimum of 3-Set
1 ime intervals.
Instrumentation Calibration and Conversion Factors
This section describes the method used
to convert aerially measured gamma-ray
count rates to exposure rates one meter
above the ground and to isotopic concen-
trations in the ground. Count rates in
windows previously defined are used to
derive isotopic concentrations. The iso-
topic concentrations can be converted to
exposure rates one meter above the ground
using previously derived data.:”
General Expressions for Isotopic
Concentration-Count rates in pulse-
height windows centered on gamma-ray
photopeaks of interest are composed of
unscattered y rays from the isotope of
interest and background counts from
(1) cosmic rays and natural activity in
the aircraft and Atoll material and
( 2) possible contribution from higher-
energy contaminants. Background is
compensated when the data are processed
by subtracting weighted combinations of
count rates in appropriate windows. The
r:
H. L. Beck, J. DeCampo, and C. Gogolak, In Situ Ge(Li) and NaI(W Gamma-Ray Spectroscopy, HASL, 258, P. 49, 1972.
assumption that only unscattered y rays
remain In the photopeak window after the
background is subtracted allows simple
expressions to be derived to relate aerial
count rates to various source geometries.
Good definition of the photopeaks lends
credence to this approach.
Conversion factors are developed in
the following paragraphs. Detector
efficiency is defined in terms of an
effective detector area at normal inci-
dence. This area is calculated from
gamma-ray count rates measured in
helicopter hovers over point radioactive
sources of known strength. The change
in effective detector area with angle of
incidence must be considered for sources
distributed over the Atoll. Appropriate
or limiting values for angular responses
will be assumed according to y-ray
energy. Conversion factors result from
eliminating effective detector area be-
tween expressions derived for count rates
over a point calibration source and the
distributed source of interest.
Detector efficiency (effective area) is
determined by signal minus background
count rates when hovering over 6oco, 137
Cs, and 241 Am calibration sources of
known strength. The photopeak window
count rates, CR P’
when hovering directly
over a calibration source can be written
in terms of an effective detector area:
CRP =.2 exp [-(< + i,] (1)
where
d=
t=
distance between point source and
the detector,
thickness of aircraft skin and
floor,
73-
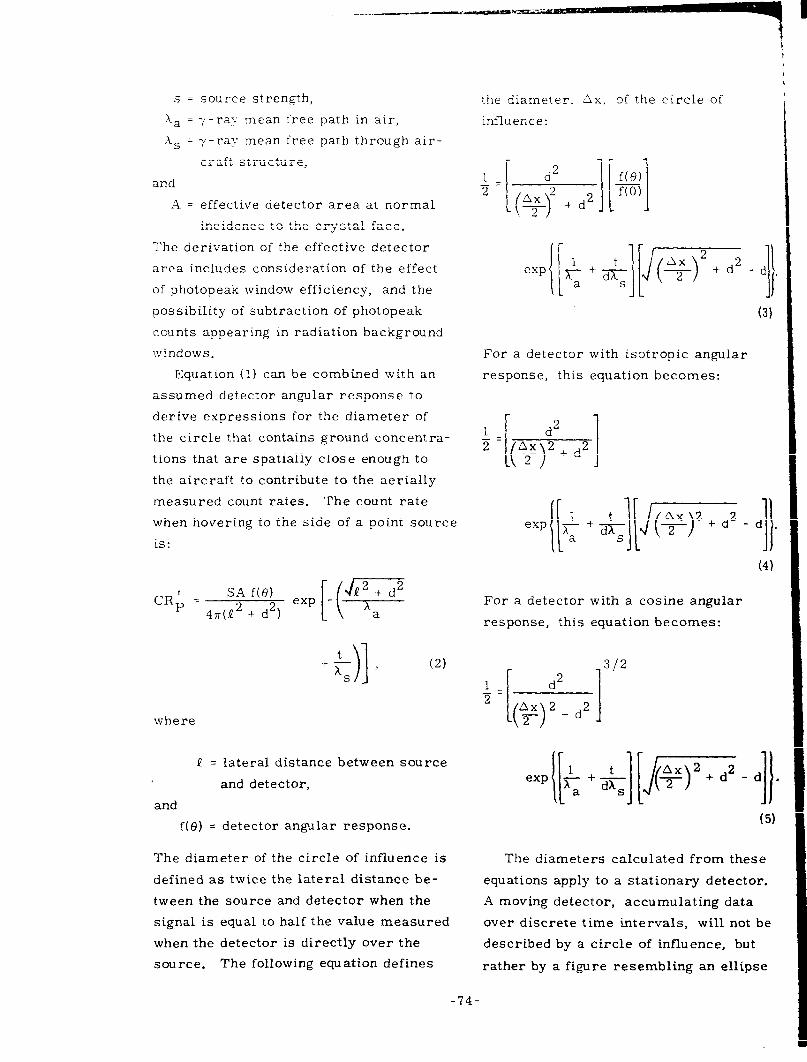
s = source strength,
xa = ~-ray mean free path in air,
X, = y-ray mean free path through air-
craft structure,
and
A = effective detector area at normal
incidence to the crystal face.
The derivation of the effective detector
area includes consideration of the effect
of photopeak window efficiency, and the
possibility of subtraction of photopeak
counts appearing in radiation background
windows.
Equation (1) can be combined with an
assumed detector angular response to
derive expressions for the diameter of
the circle that contains ground concentra-
tions that are spatially close enough to
the aircraft to contribute to the aerially
measured count rates. The count rate
when hovering to the side of a point source
is:
CR; = SA f(e)
C(
@z
47r(P2 + d2) exp -
-%--
where
J (2)
B = lateral distance between source
and detector,
and
f(e) = detector angular response.
The diameter of the circle of influence is
defined as twice the lateral distance be-
tween the source and detector when the
signal is equal to half the value measured
when the detector is directly over the
source. The following equation defines
74-
the diameter, Ax, of the circle of i influence:
1 -= 2
w 1 For a detector with isotropic angular
response, this equation becomes:
d2 1
For a detector with a cosine angular
response, this equation becomes:
1 -= 2
f-
1 312
d2
(3)
The diameters calculated from these
equations apply to a stationary detector.
A moving detector, accumulating data
over discrete time intervals, will not be
described by a circle of influence, but
rather by a figure resembling an ellipse
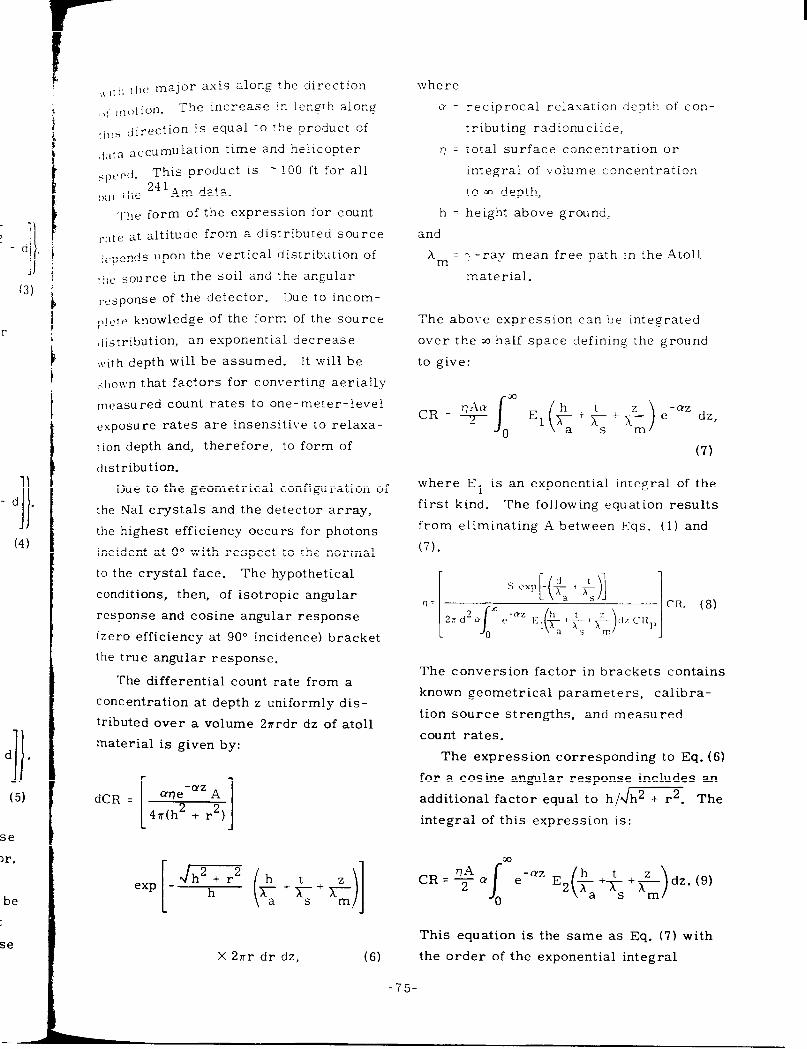
JJ
(3)
(4)
se
>r.
be
se
,~,t ,, ihc major axis along the direction
,,j ,notion. The increase in length along
‘,,,5 direction is equal to the product of
,!:,,a accumulation time and helicopter
.S;‘~Wl. This product is - 100 ft for all
t,u t ’ Ile 241Am data.
‘l’lie form of the expression for count
r.ate at altitude from a distributed source
:lcpends upon the vertical distribution of
,lic source in the soil and the angular
,.csponse of the detector. Due to incom-
l,lcte knowledge of the form of the source
,iistribution, an exponential decrease
\vith depth will be assumed. It will be
shown that factors for converting aerially
Ineasured count rates to one-meter-level
exposure rates are insensitive to relaxa-
tion depth and, therefore, to form of
distribution.
me to the geometrical configuration of
the NaI crystals and the detector array,
the highest efficiency occurs for photons
incident at 0” with respect to the normal
to the crystal face. The hypothetical
conditions, then, of isotropic angular
response and cosine angular response
(zero efficiency at 90” incidence) bracket
the true angular response.
The differential count rate from a
concentration at depth z uniformly dis-
tributed over a volume Pnrdr dz of atoll
material is given by:
where
3 = reciprocal relaxation depth of con-
:ributing radionuclide,
n = total surface concentration or
integral of volume concentration
to 30 depth,
h = height above ground,
and
hm= -: -ray mean free path in the Atoll
material.
The abo\-e expression can be integrated
over the x) half space defining the ground
to give:
CR = q & 7; r ;) e-nz dz,
a S m
(7)
where El is an exponential integral of the
first kind. The following equation results
from eliminating A between Eqs. (1) and
(7).
The conversion factor in brackets contains
known geometrical parameters, calibra-
tion source strengths, and measured
count rates.
The expression corresponding to Eq. (6)
dCR = ar)e -CYz
A
4n(h2 + r2) 1 L
e xP
for a cosine angular response includes an
additional factor equal to h/m The
integral of this expression is:
CR = $ ~1 emQz E2($+fi<)dz. (9)
X 2nr dr dz, (6)
This equation is the same as Eq. (7) with
the order of the exponential integral
-75-
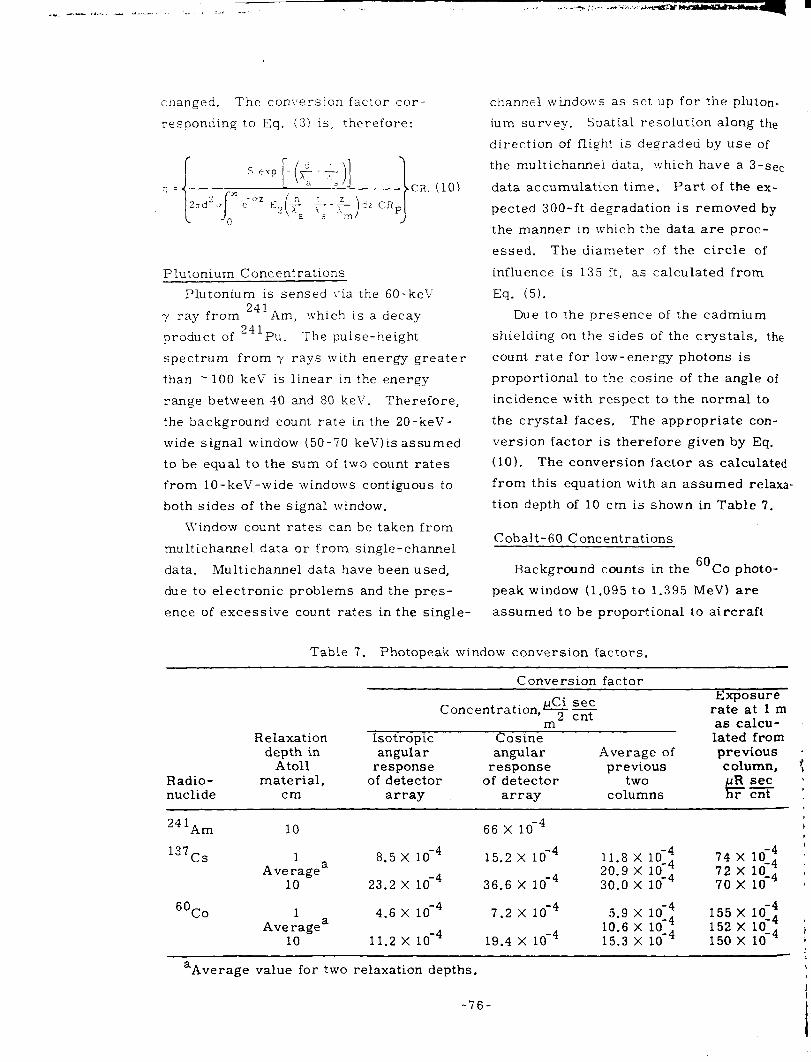
. , ‘“_ _ -L. ‘a._ _.L-__ _ ._I ._I
changed. The conversion fac:or cor-
responding to Eq. (8) is: therefore:
Plutonium Concentrations
Plutonium is sensed \-ia the 60-keV
y ray from 241 Am, which is a decay
product of 241Pu. The pulse- height
spectrum from Y rays with energy greater
than - 100 keV is linear in the energy
range between 40 and 80 keV. Therefore,
the background count rate in the 20-keV-
wide signal window (50 - 70 keV) is assumed
to be equal to the sum of two count rates
from lo-keV-wide windows contiguous to
both sides of the signal window.
[Yindow count rates can be taken from
multichannel data or from single-channel
data. Multichannel data have been used,
due to electronic problems and the pres-
ence of excessive count rates in the single-
channel windows as set up for the pluton-
ium survey. Spatial resolution along the
direction of flight is degraded by use of
the multichannel data, which have a 3-set
data accumulation time. Part of the ex-
pected 300-ft degradation is removed by
the manner in which the data are proc-
essed. The diameter of the circle of
influence is 135 ft, as calculated from
Eq. (5).
Due to the presence of the cadmium
shielding on the sides of the crystals, the
count rate for low-energy photons is
proportional to the cosine of the angle of
incidence with respect to the normal to
the crystal faces. The appropriate con-
version factor is therefore given by Eq.
(10). The conversion factor as calculated
from this equation with an assumed relaxa-
tion depth of 10 cm is shown in Table 7.
Cobalt-60 Concentrations
Background counts in the 60 Co photo-
peak window (1.095 to 1.395 MeV) are
assumed to be proportional to aircraft
Table 7. Photopeak window conversion factors.
Conversion factor
Relaxation
Concentration,? s Exposure
rate at 1 m as calcu-
tsotropic Cosine lated from
Radio- nuclide
depth in angular angular Average of previous . Atoll response response previous column, 1
material, of detector of detector two pR set ’ cm array array columns hrcnt :
24 ‘Am
137cs
10
1 Averagea
10
66 x lo-4
8.5 X ld4 15.2 X ld4 11.8 X 1O-4
23.2 X lO-4 X lO-4 20.9 X 1O-4
36.6 30.0 x 1o-4
, 74x1o-4 : 72X1O-4 t 70 x ld4 2
6oco 1 4.6 X ld4 7.2 X lO-4 5.9 x lo-4 155 x 1o-4 Ave ragea
1o-4 1o-4 10.6 X 1O-4 152 X 1O-4 ;
10 11.2 x 19.4 x 15.3 x ld4 150 x lo-4 ’ -8
aAverage value for two relaxation depths. ,
-76-

Ton-
the
of
-set
ex-
bY
3-
1f
n
n
the
’ of
0
In-
9.
:laxa-
7.
o-
~,;,,.‘~$pund, cosmic rays, and contribu -
r,o,lS from natural background emitters,
:ul ,,, the energy interval between 1.305
.IIlti 3.00 3leL-e The ratio is determined
i,~ fii~~ts at 100 ft over water, which
._lloul,~ contain negligible amounts of 6O co.
,)ata 3re processed to continuously sub-
:i.,?ct this background from the photopeak
,\’ jndou’ count rate.
Table 7 compares the factors [ (calcu-
latcd from Eqs. (8) and (IO)] for con-
l.,_rting the resulting count rate t0 ground
,.,,,lcentratiOn for two relaxation depths.
~~~l,c conversion factor shown in the fifth
c.Olumn 1s the average of \.alues from the
I\I’O previous columns. This a\.erage
represents the best value presently avail- 137
able. Experiments with Cs sources
have shown the average to be accurate to
\vithin a few percent.
The diameter of the circle of influence
lies between 145 and 180 ft, as calculated
from Eqs. (4) and (5).
Cesium- 137 Concentrations
The background count rate in the 137cs
photopeak window (0.6 to 0.75 MeV) is
assumed to be composed of two parts. One
0f tht>se is proportional to aircraft back-
ground, cosmic rays, and contributions
from natural background emitters in the
energy interval between 1.395 and 3 MeV.
The second background component, which
is Proportional to the 60
CO contribution t0 the 137 CS window, was determined from
spectral shape when 60 Co was present
with negligible amounts of 137cs . Back-
grounds of both types were subtracted
during data processing by summing
apProPriately weighted single-channel
count rates. Table 7 compares the factors
I(calculated from Eqs. (8) and (lo)] for
-77-
conver::ng the resulting count rate to
ground concentration for two relaxation
depths. Cther experiments have shown
That the true detector angular response
is such that the average conversion
factors in the fifth column are accurate to
within a few percent.
The diameter of the circle of influence
lies between 145 and 180 ft, as calculated
from Eqs. (4) and (5).
Exposure Rates - Factors for con-
verting 50
Co and 137 Cs photopeak count
rates to l-meter-level dose rates have
been calculated by combining data in the
fifth column of Table 7 with data from
H. L. Beck et al. The result of this
combination is given in the last column of
the same table. The average value be-
tween extremes in angular response is
used because experiments show that this
average is good to a few percent, at least
for 137
Cs sources. The same averaging
process is used for 60 Co sources, although
similar measurements have not been made.
Note that the factor for converting
aerially measured count rates to dose
rate is insensitive to large variations in
relaxation depth. In most cases the two
assumed relaxation depths bracket those
measured in soil-sample analyses.
Comparison with Ground Data
Aerial data were processed to give
200/O increments between contour levels
for the islands of JANET, ALICE, BELLE,
and DAISY. The sum of Co and Cs con-
tributions to dose rates (using the con-
version factors listed in the last column
of Tabie 7) is compared with LiF thermo-
luminescent dosimetry (TLD) measure-
ments at 37 locations in the chapter on

ext e rn al 2ose estimates. Dose rates
averaged over these locations were 11%
lower for The aerial measurements than
for the s;andard TLD measurements. TWO
special TLD badges, shielded against
3 rays, gave a 10% lower exposure rate
than the standard unshielded badges at the
same location. The aerial measurements
do not sense $ rays because of the mass
of air and structure betweenthe source and
NaI. Therefore, the aerial measurements
for -f rays only are in excellent agreement
with the -: - ray contribution to the TLD meas-
urements. The aerial data have not been
normalized to the unshielded TLD data.
It should be mentioned that the escellent
agreement between the aerial data and the
TLD data is well within the uncertainties
in the aerial measurements. In particular,
an error of a few feet in the 50-ft hover
altitude over the calibration sources would
introduce a 10% error in the conversion
factor. Oscillations about the point directly
over the source effectively increase the
average slant range. Use of an excessively
small slant range falsely increases quoted
concentrations.
The total mass of aircraft structure
between the detectors and sources was not
known. In particular, the mass of rein-
forcing material between the two outside
plates of the aircraft floor was not known
and was excluded in the attenuation calcu-
lations. The presence of additional mass
lowers the distributed source count rate
relative to the count rate from the point
calibration source. Neglect of this addi-
tional mass has the effect of falsely de-
creasing quoted concentrations. The two
types of errors described above occur in
opposite directions and are expected to be
partially self-compensating.
Explanation of Contour Xlaps
6o Co and 137Cs Separately -
Contour maps were generated for e
island on the basis of photopeak wir
count rates for 6oCo and 137Cs sep
All other types of background were
tracted so that the only counts rem:
were due to the separate isotopes.
were processed so that letter symb
denoted a range of values for count
in the photopeak windows. The fiftl
seventh columns in Table 8 relate t
contour letter symbols (correspond
window count rates) to the dose rate
delivered by each isotope. This re
ship is established from values in t
last column of Table 7. Table 8 al:
lates letter symbols to soil concent
averaged over the two extremes asr
for relaxation depths. The two exti
and the average conversion factor a
given in the fifth column of Table 7.
contours are superimposed on gray
of the islands (the “m” series of fig
in Appendix II); 137 Cs contours are
imposed on green prints of the islar
(the “k” series of figures in Append
These contours were used to tab\
an estimated average dose rate ove
is land. Results are shown in Table
-4verage Dose Rates From Gr
Counts - Contours superimposed on
greenish-gold prints (the “b” series
figures in Appendix II) were constm
from counts in the energy interval t
50 keV and 3 MeV. An average con
factor must be established to relate
counts to concentration, since this 1
interval senses both 60
Co and 137C:
This average conversion factor is a
-78-

I-
“g
ta
es
d
to
3n-
e-
on
ed
es
co
nts
S
ser-
I).
e
ch
j
een
;ion
se
‘gY
ned
Table 8. Contour map key for use with figures in Appendix II.
“4 l_Am <‘13n(‘<‘n;ratlon ,- cn
Total s~‘.‘c‘raeed for : m c rr - Lsposurr For 1 cm c re- I:sposure exposure
‘\ I’! - 2 !‘:c r rap :a~:i: ‘In drpth rate, laxation depth r3:e, rate,
!IOl pCllm LO cm < :rJ (‘II? u f3 ,‘h r c 10 cm uR hr UR ‘hr.
: I~/ [I ! o-o.:+4
\- ;, ~, .-0.” 0 . :i 4 - 0. G H o-o.01 0-0.39
.I L'l-30 - I ‘; ) - _“,_: ii.6:$- 1. >li 0.04-0.02 0.5’~-1.11 o- 1.11
:’ ,) 50-15 ; .: - I!' ,~ -:.I_0 1. ‘(i-2.0 o.o::-0.1” 1. 14-1.; 1.0-1.5
1 (’ 45-66 ‘a_.?;; ,’ -il. ; .!.O-” -. 7 0.1”-0.16 !.YO-2.:: 1.5-2.0
!) 66- 100 A::-1” ~1 -i.!) -. 7-5.4 J o.l&o.:i:! ‘.3--1.i; 2.0-A
loo-145 ;Z-Gl . - :. 1 1.1- I1 0.:+9-0.6-i I.ii-!!.:! 4 -8 ,
! i15-210 5; ] -;,(i ..-,>.A 11-L'? O.iil-1.:; !a.‘-l:: :i - 1 (i
(; 2 10-300 81- 130 .,.2-l.’ ““-4-i 11.::-2.5 13-36 l(i-:i:i
II 300450 1:io-l!‘O : 1 - 1 .-I 4-i -ii:; 2.5-5.0 .:6-T" :;:i-(ici
I _ - -10 ii::- 170 ,-I0 72-l-10 ii 6 - 1 :i 0
.I -‘I-! 00 i;o- 41) IO-20 110-11’0 i:;O-260
I\ ,“I-~“0 :40--700 20-40 2!!0- 5110 ztio-520
I, 200-100 TOO- l-l00 40-80 >:io-1200 r,“o- 1050
to be half the sum of the separate con-
version factors for 137 Cs and 6oC~. The
two separate factors are calculated by
multiplying photopeak conversion factors
in the sixth column of Table 7 by the ratio
of photopeak counts to gross counts in
spectra taken at 100 ft over islands that
contain predominantly one or the other
isotope. Uncertainty as to whether the
contaminant is 6oCo or 137 Cs introduces
errors of SO% in the exposure rates de-
rived from gross counts.
The seventh column of Table 8 relates
the contour letter symbols to exposure
rates for these figures.
Count rates produced by aircraft back-
ground and cosmic rays have not been
subtracted before application of the con-
version factor. The contours, therefore,
assume that the conversion factor multi-
Plied by gross count rates over uncontam-
inated Atoll material equals the dose rate
-79-
at the 3-ft level at the same location. The
primary contributor in these areas,
cosmic rays, are estimated to produce
-3 pR/hr at the 3 ft level. The product of
gross counts and conversion factor is
0.9 pR/hr. Therefore, the fractional error
is small for dose rates greater than
20 PRlhr and consistent with errors in-
herent in the average conversion factor
concept.
241 Am Concentration - The island
of YVONNE has been contoured for 24 ‘Am
concentration. Data were processed so
that contour letter symbols denoted a
range of counts remaining in the photo-
peak window after the two contiguous
background windows had been subtracted.
This letter symbol and range of count
rates was related to concentration accord-
ing to Eq. (10). A lo-cm relaxation depth
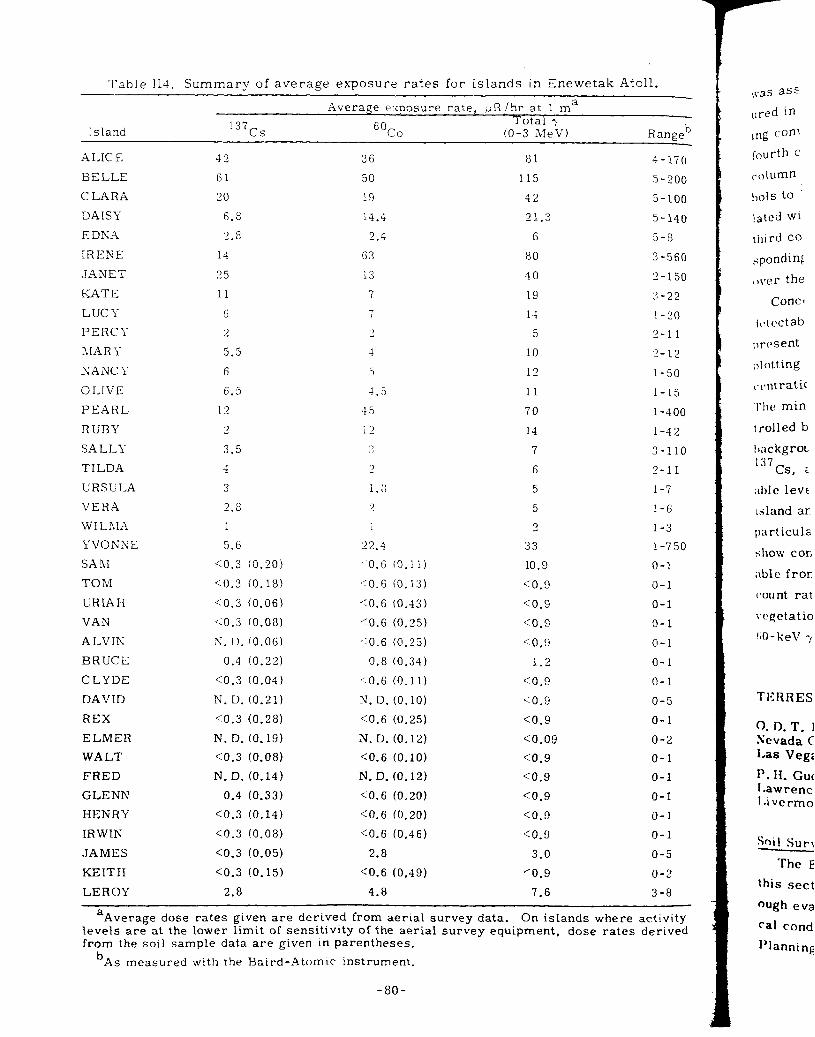
Table 114. Summary of average exposure rates for islands in Enewetak Atoll.
Island !37Cs
Average exposure rate, ;tR /hr at 1 ma Total 1
@%o (O-3 AIeV) Rangeb
XLIC E 4’
BELLE 61
CLARA 20
DAISY 6.8
EDNA 2.3
IRENE 14
JANET ‘7 5
KATE 11
LUCY 6
PERCI 2
lIARI- 5.5
SANC Y 6
OLIVE 6.5
PEARL 12
RUBY 2
SA LLT 3.5
TILDA 4
URSULA 3
VERA 2.8
WILLIA 1
YVONNE 5.6
SAM co.3 (0.20)
TOM CO.3 (0.18)
URIAII <0.3 (0.06)
VAN <0.3 (0.081
ALVIN N. D. (0.06)
BRUCE 0.4 (0.221
CLYDE co.3 (0.04 1
DAVID N. D. (0.21)
REX CO.3 (0.281
ELMER N. D. (0.19)
WALT co.3 (0.08)
FRED N. D. (0.14)
GLENN 0.4 (0.33)
HENRY co.3 (0.14)
IRWIN co.3 (0.08)
JAMES co.3 (0.05)
KEITH co.3 (0.15)
LEROY 2.8
36
50
19
14.4
2.4
63
13
7
7 ‘1
4
5
4.5
45
12
.3
‘7
1 H ,
‘7
!
‘2.4
<‘0.6 CO.! i
,-0.6 (0.13
CO.6 (0.43
/0.6 (0.35
-‘0.6 (0.25
0.8 (0.34)
‘-0.6 (0.11)
N. D. (0.10)
CO.6 (0.25)
N. D. (0.12)
CO.6 (0.10)
N. D. (0.12)
CO.6 (0.20)
CO.6 (0.20)
CO.6 (0.46)
2.8
CO.6 (0.49)
4.8
81 ‘l-170
115 5-200
42 5-100
21.3 5-149
6 5-8
80 3-560
40 ‘-150
19 3-22
14 l-20
5 ‘-11
10 ‘-12
12 I-50
11 1-15
70 l-400
I4 l-42
7 3-110
6 2-11
5 1-7
5 1-6
2 1-3
33 l-750
10.9 o-1
co.9 o-1
CO.9 o-1
co.9 O-l
CO.9 o-1
1.2 o-1
co.9 o-1
CO.9 o-5
co.9 o-1
co.09 o-2
co.9 o-1
co.9 o-1
co.9 o-1
co.9 o-1
co.9 o-1
3.0 o-5
co.9 o-2
7.6 3-8
aAverage dose rates given are derived from aerial survey data. On islands where activity levels are at the lower limit of sensitivity of the aerial survey equipment, dose rates derived from the soil sample data are given in parentheses.
b As measured with the Baird-Atomic instrument.
,<.a~ ass
ured in
mg conI
fourth c
column
t,ols to
lated wi
third co
spondin&
,,\er the
Cone f
!,Btcctab
I,rcsent
:,lotting
I-i*ntratic
1.1~ min
trolled b
hnckgroL 1 :i7
cs, :
;~hlc leve
Island ar
1K~rticuls
show con
:rble fror
(‘011 nt rat
vogetatic
GO-keV y
TI’RRES
0. I). T. Nevada ( Las Vegi
p. II. Gu, I.awrenc I.ivermc
Soil Surs
‘The I
this set’
augh ev:
Cal cond
~‘lanning
-8O-
,vas assumed as an average of those meas-
ured in soil sample analyses. The result-
ing conversion iactor is given in the
fourth column cf Table 7. The second
column of Table 8 relates contour sym-
bols t0 241 -Am concentrations as calcu-
lated with this conversion factor. The
third column of Table 8 lists the corre-
sponding voiume concentrations averaged
Over the top 10 cm.
Concentrations above our minimum
detectable level in 241
?im were not
present in sufficient quantity to justify
plotting ,exposure rate or material con-
centration distributions for other islands.
The minimum detectable level is con-
trolled by statistical variations in the
background count rate from cosmic rays, 137
Cs, and 6oCo. The minimum detect-
able level, thus, changes from island to
island and from point to point within a
particular island. Soil samples may,
show concentrations that are not detect-
able from the air due to high background
count rates or to the presence of dense
vegetation, which severely attenuates the
60-keV y rays from 241Am.
TERRESTRIAL SOIL SURVEY
0. D. T. Lynch, Jr. Nevada Operations Office, USAEC Las Vegas, Nevada
I’. H. Gudiksen Lawrence Livermore Laboratory Livermore, California
Soil Survey Plan
The Enewetak soil survey, described in
this section, had as its objective a thor-
ough evaluation of the present radiologi-
cal conditions of all islands of the Atoll.
planning of the soil survey was based
-81-
upon extensive investigations of the his-
torical aspects of the weapons-testing
program, the most recent Information
gathered during previous radiological
surveys of Bikini Atoll, and preliminary
surveys of Enewetak Atoll in July 1971
and May 1972.
Laboratories which conducted the ex-
periments provided reports containing
data on the original nuclear devices.
Actual test information, fallout patterns,
radiological safety reports, etc., came
from AEC sources. Construction draw-
ings and information on modifications to
the topography were made available by
the testing support contractor, Holmes
and Narl-er, Inc. (H&N). Other organiza-
tions, including those which conducted
environmental studies during and after
the testing program, supplied their find-
ings. In addition, a wealth of information
was available in old reports, records,
documents, etc., stored in archives.
Examination of reports from the Law-
rence Livermore Laboratory (LLL) and
Los Alamos Scientific Laboratory (LASL)
enabled us to identify radionuclides most
likely to be present, based upon the com-
position of the nuclear devices and asso-
ciated experiments. These radionuclides
are listed on Table 10. The quantities of
of “environmental” materials such as
structural steel, concrete, wiring, pipe,
etc., were also determined for purposes
of estimating the types of contaminated
debris that should have remained after a
shot.
The Test Manager’s operations re-
ports contained fallout patterns for nearly
every event. From these reports, in a
crude effort to estimate residual condi-
tions, the Atoll’s islands were graded as
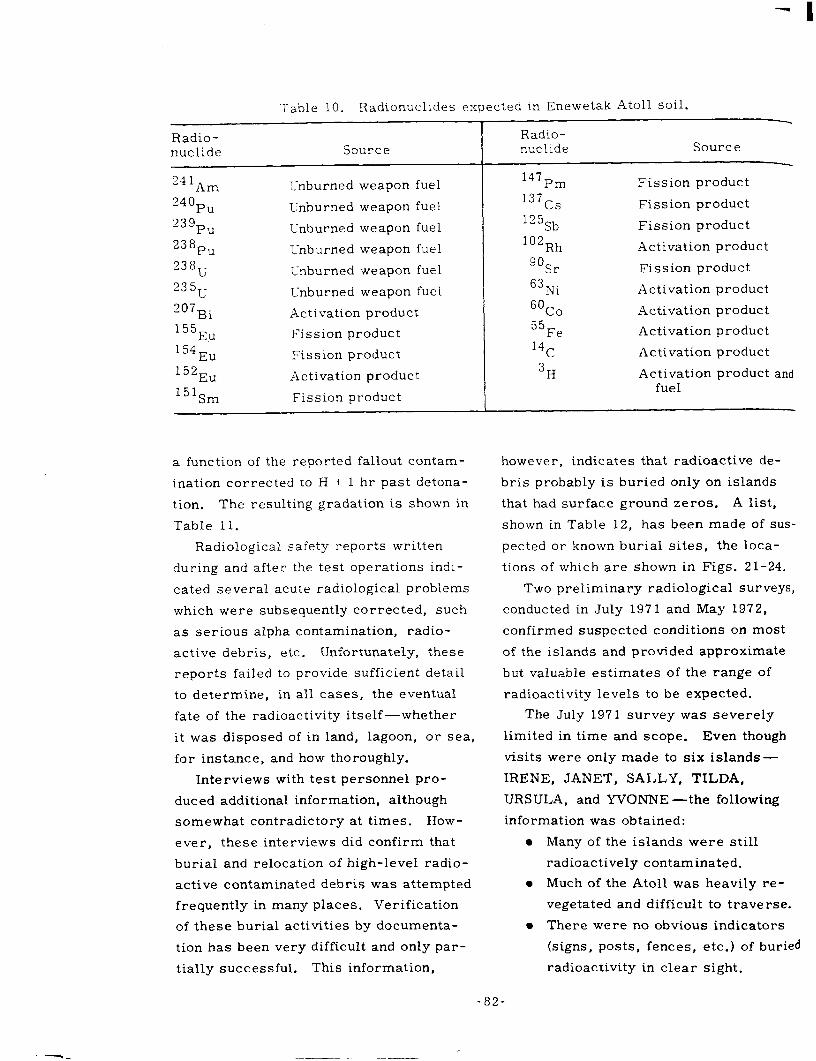
- I
Radio- nuclide
Table 10. Radionuclides expected in Enewetak Atoll soil.
Radio- Source nuclide Source
241A* 340Pu
23gPu
238Pu 238
U 235U
207Hi
155Eu
154Eu
152Eu
15%m
T_-nburned weapon fuel
Unburned weapon fuel
Unburned weapon fuel
rnburned weapon fuel
Cnburned weapon fuel
Cnburned weapon fuel
Activation product
Fission product
Fission product
Activation product
Fission product
Fission product
Fission product
Fission product
Activation product
Fission product
Activation product
Activation product
Activation product
Activation product
Activation product and fuel
a function of the reported fallout contam-
ination corrected to H + 1 hr past detona-
tion. The resulting gradation is shown in
Table 11.
Radiological safety reports written
during and after the test operations indi-
cated several acute radiological problems
which were subsequently corrected, such
as serious alpha contamination, radio-
active debris, etc. Unfortunately, these
reports failed to provide sufficient detail
to determine, in all cases, the eventual
fate of the radioactivity itself -whether
it was disposed of in land, lagoon, or sea,
for instance, and how thoroughly.
Interviews with test personnel pro-
duced additional information, although
somewhat contradictory at times. How-
ever, these interviews did confirm that
burial and relocation of high-level radio-
active contaminated debris was attempted
frequently in many places. Verification
of these burial activities by documenta-
tion has been very difficult and only par-
tially successful. This information,
however, indicates that radioactive de-
bris probably is buried only on islands
that had surface ground zeros. A list,
shown in Table 12, has been made of sus-
pected or known burial sites, the loca-
tions of which are shown in Figs. 21-24.
Two preliminary radiological surveys,
conducted in July 1971 and May 1972,
confirmed suspected conditions on most
of the islands and provided approximate
but valuable estimates of the range of
radioactivity levels to be expected.
The July 1971 survey was severely
limited in time and scope. Even though
visits were only made to six islands-
IRENE, JANET, SALLY, TLLDA,
URSULA, and YVONNE -the following
information was obtained:
Many of the islands were still
radioactively contaminated.
Much of the Atoll was heavily re-
vegetated and difficult to traverse.
There were no obvious indicators
(signs, posts, fences, etc.) of buried
radioactivity in clear sight.
--_
-82-
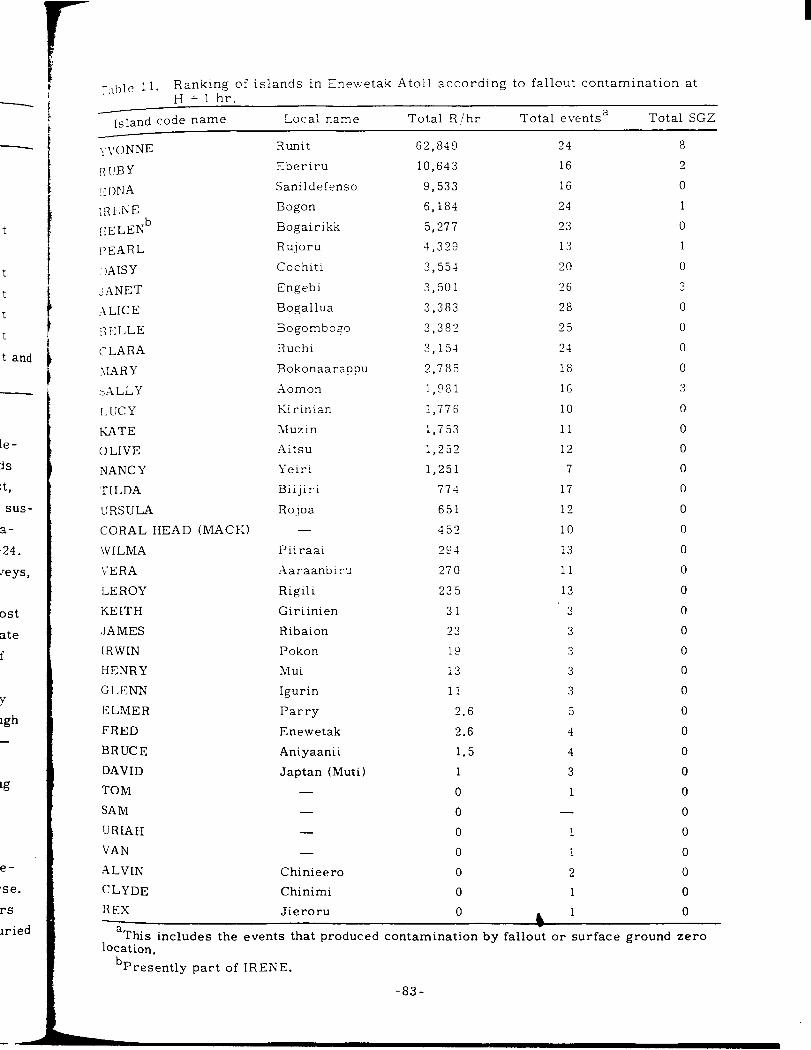
t
t
t
t
t
t and
le-
3s
it,
sus-
a-
24.
reys,
ost
ate
i
Y
10 -
‘g
e-
*se.
rs
lried
y_ible 1 1. Ranking of islands in Enewetak Atoll according to fallout contamination at H 2 1 hr.
Island code name Local name Total R ihr Total eventsa Total SGZ
~ToNNE
RUBY
1: DNA
:RI,:NE
IIBLENb
!>EARL
;jAISY
JANET
:iLICE
IiI:LLE
c‘ LA RA
!,IARY
5.A LLY
I.UCY
KATE
0 LIVE
NANCY
TILDA
I!RSULA
CORAL HEAD (MACK)
WILMA
VERA
LEROY
KEITH
-JAMES
IRWIN
HENRY
G I (17NN
ELMER
FRED
BRUCE
DAVID
TOM
SAM
URIAH
VAN
ALVIN
CLYDE
REX
Runit
Eberiru
Sanildefenso
Bogon
Bogairikk
Rujoru
Cochiti
Engebi
Bogallua
Bogombogo
Ruchl
Bokonaarappu
Xomon
Kirinian
1luzin
Xitsu
Yeiri
Biijiri
Rojoa
-
Piiraal
Aaraanbiru
Rigili
Giriinien
Ribaion
Pokon
Mui
Igurin
Parry
Enewetak
Aniyaanii
Japtan (Muti)
-
62,849
10,643
9,533
6,184
5,277
4,329
3,554
3,501
3,383
3,382
3,151
2,785
1,981
1,776
1,753
1,252
1.251
774
651
452
29-1
270
235
31
23
10
13
11
2.6
2.6
1.5
1
0
0
0
0
0
0
0
24
16
16
24
23
13
20
26
28
25
24
18
16
10
11
12
7
17
12
10
13
11
13
3
3
3
3
.3
5
4
4
3
8
2
0
1
0
1
0
3
0
0
0
0
3
0
0
0
0
0
1
-
-
-
Chinieero
Chinimi
Jieroru
0
0
0
0
0
0
0
0
0
0
0
0
0
0
0
0
0
0
0
0
L 1 0
aThis includes the events that produced contamination by fallout or surface ground zero location.
bPresently part of IRENE.
-83-
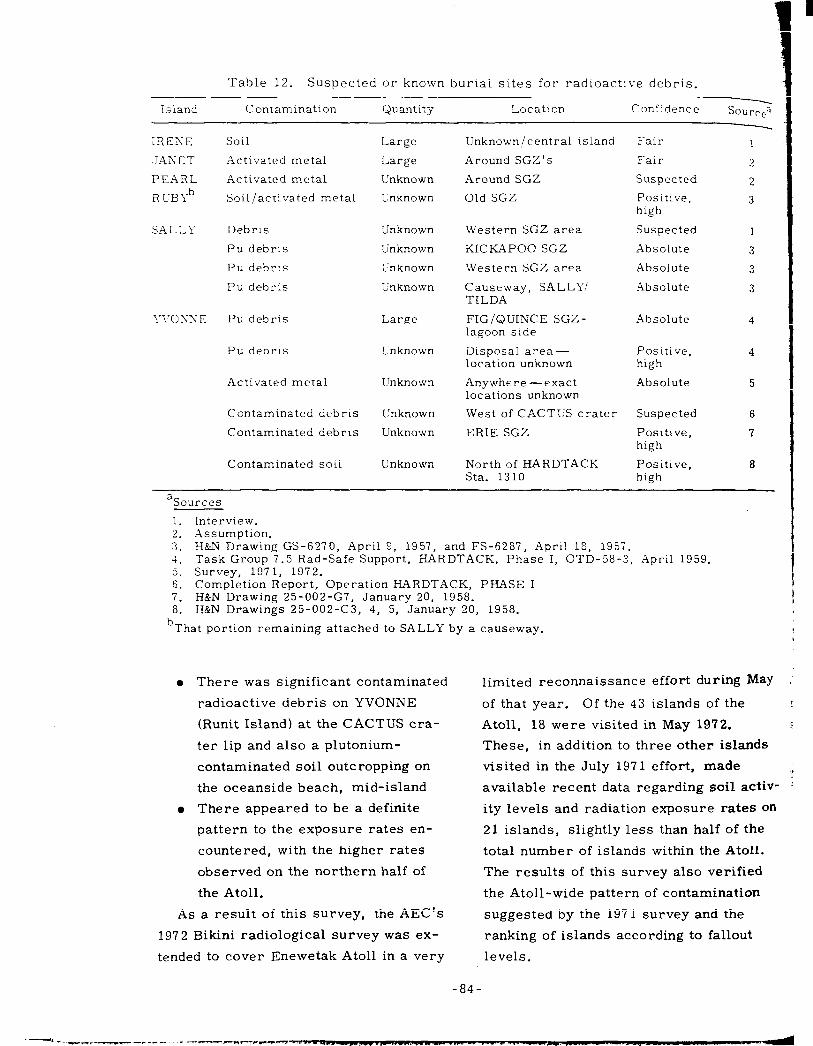
Table 12. Suspected or known burial sites for radioactive debris.
island Contamination Quantity Locatlon .
Confidence Sour-cc”
:RESE Soil
JAXET Activated metal
PEARL Activated metal
RCBYb Soil/activated metal
Debris
Pu debris
Pu debris
Pu debris
Pu debris
Pu debris
Activated metal
Contaminated debris
Contaminated debris
Contaminated sotl
Large
Large
Cnknown
Unknown
Unknown
Unknown
LTnknown
Unknown
Large
Cnknown
Unknown
Unknown
Unknown
Unknown
Unknown/central island
Around SGZ’s
Around SGZ
Old SGZ
Western SGZ area
KICKAPOO SGZ
ivestern SGZ area
Causeway, SALLY/ TILDA
FIG/QUINCE SGZ- lagoon side
Disposal area- location unknown
Anywhere -exact locations unknown
West of CACTUS crater
ERIE SGZ
North of HARDTACK Sta. 1310
Fair
Fair
Suspected
Positive, high
Suspected
Absolute
Absolute
Absolute
Absolute
Positive, high
Absolute
Suspected
Positive, high
Positive, high
4
4
5
6
7
8
aSources
1. 2. 3. -f. 3. 6. 7. 8.
Interview. Assumption. H&N Drawing GS-6270, Apt-11 3, 1957, and FS-6287, April 18, 1957. Task Group 7.5 Rad-Safe Support, HARDTACK, Phase I, OTD-58-3, April 1959. Survey, 1971, 1972. Completion Report, Operation HARDTACK, PHASE I H&N Drawing 25-002-G7, January 20, 1958. H&N Drawings 25-002-C3, 4. 5, January 20, 1958.
b That portion remaining attached to SALLY by a causeway.
l There was significant contaminated
radioactive debris on YVONNE
(Runit Island) at the CACTUS cra-
ter lip and also a plutonium-
contaminated soil outcropping on
the oceanside beach, mid-island
l There appeared to be a definite
pattern to the exposure rates en-
countered, with the higher rates
observed on the northern half of
the Atoll.
As a result of this survey, the AEC’s
1972 Bikini radiological survey was ex-
tended to cover Enewetak Atoll in a very
limited reconnaissance effort during May
of that year. Of the 43 islands of the
Atoll, 18 were visited in May 1972.
These, in addition to three other islands
visited in the July 1971 effort, made
available recent data regarding soil activ-
ity levels and radiation exposure rates on
21 islands, slightly less than half of the
total number of islands within the Atoll.
The results of this survey also verified
the Atoll-wide pattern of contamination
suggested by the 197 1 survey and the
ranking of islands according to fallout
levels.
-84-
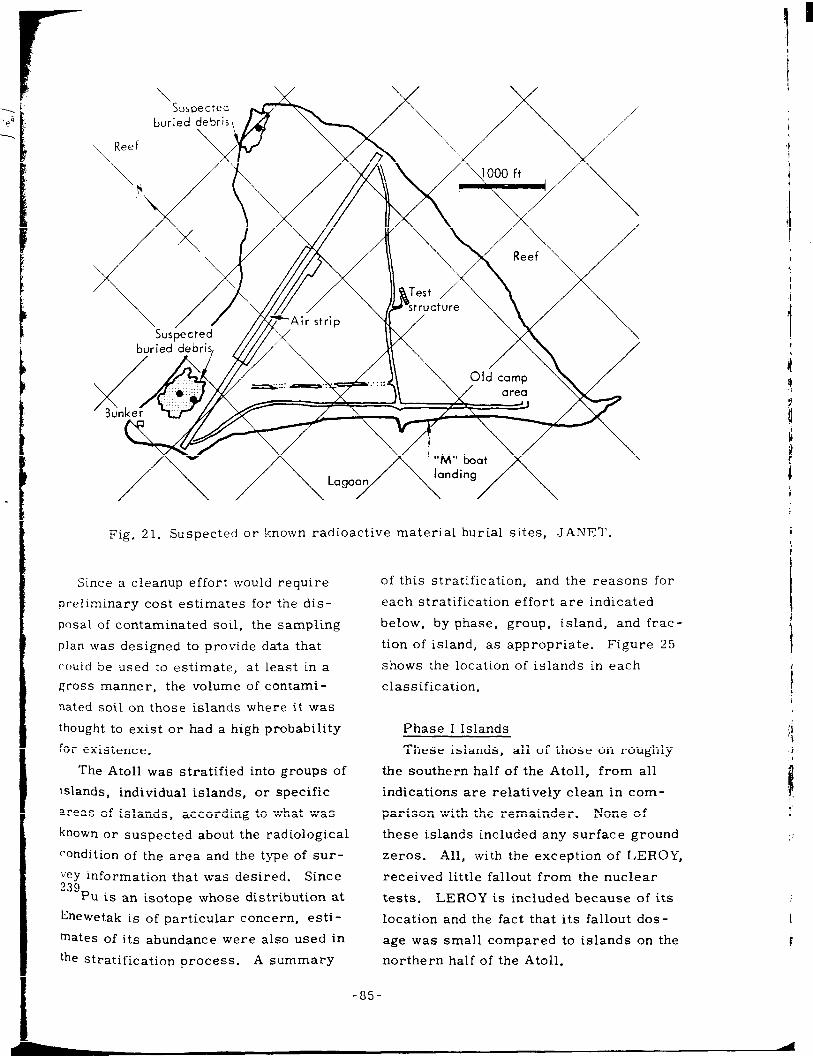
\ Suspectea
buried debris,
\/ 1
Susbected //X/
//v//v \ !K
Fig. 21. Suspected or known radioactive material burial sites, JANET.
Since a cleanup effort would require
preliminary cost estimates for the dis-
posal of contaminated soil, the sampling
plan was designed to provide data that
c70uld be used to estimate, at least in a
gross manner, the volume of contami-
nated soil on those islands where it was
thought to exist or had a high probability
for existence.
The Atoll was stratified into groups of
islands, individual islands, or specific
areas of islands, according to what was
known or suspected about the radiological
condition of the area and the type of sur-
vey information that was desired. Since 239
Pu is an isotope whose distribution at
Enewetak is of particular concern, esti-
mates of its abundance were also used in
the stratification process. A summary
-85-
of this stratification, and the reasons for
each stratification effort are indicated
below, by phase, group, island, and frac-
tion of island, as appropriate. Figure 25
shows the location of islands in each
classification.
Phase I Islands
These islands, all of those on roughly
the southern half of the Atoll, from all
indications are relatively clean in com-
parison with the remainder. None of
these islands included any surface ground
zeros. All, with the exception of LEROY,
received little fallout from the nuclear
tests. LEROY is included because of its
location and the fact that its fallout dos-
age was small compared to islands on the
northern half of the Atoll.
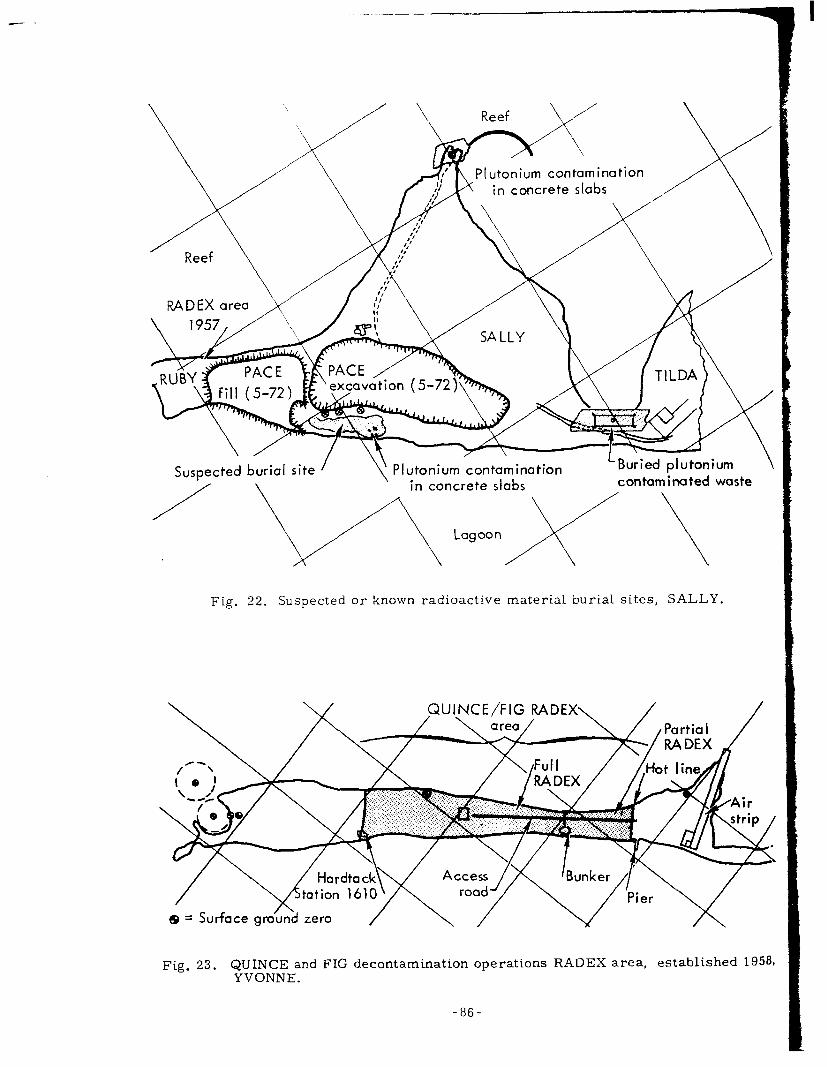
Reef v \
Plutonium contamination in concrete slabs
y- 95 ‘I k’- SALLY
Suspected burial site Plutonium contamination
Fig. 22. Snspected or known radioactive material burial sites, SALLY.
Fig. 23. QUINCE and FIG decontamination operations RADEX area, established 1958 YVONNE.
-86-
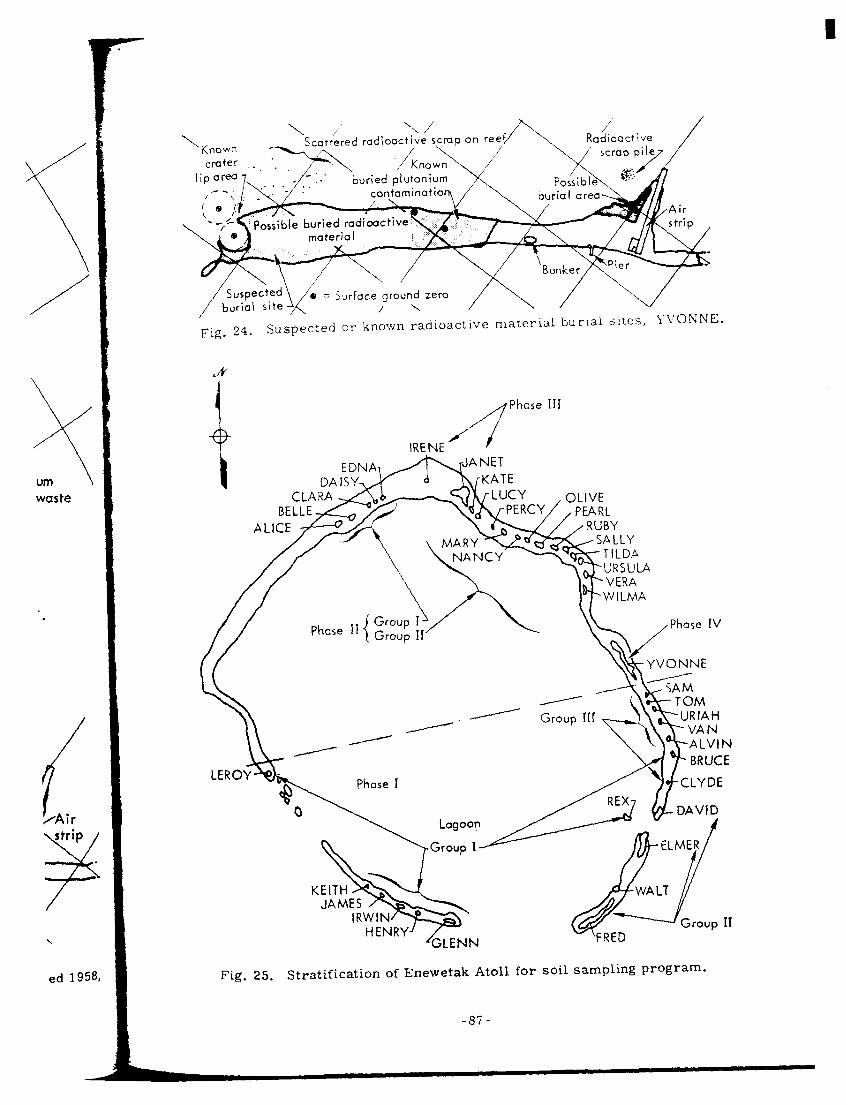
-Y urn waste
.
4 /Air
strip
;li
\
ed 195%
Fig. 24. Suspected or- known radioactive material burlal sites,
Phase III
Fig. 25. Stratification of Enewetak Atoll for soil sampling program.
-8i-

The average contamination of the
Phase I islands was about 10 R/hr at
H + 1 hr (see Table 11). FRED and
ELAIER were the sites of the main camps
and airfields, and DAVID was used as a
rest area.
The islands of Phase I were divided
into the following three groups for soil-
sampling purposes:
Phase I -Group I
BRUCE (Aniyaanii) IRWIN (Pokon)
REX (Jieroru) JAMES (Ribaion)
GLENN (Igurin) KEITH (Giriinien)
HENRY (Mui) LEROY (Rigili)
Phase I -Group II
DAVID (Japtan) FRED (Enewetak)
ELMER (Parry)
SAhI
TOM
URLAH
Phase I -Group III
WALT ALVIN (Chinicero)
VAN CLYDE (Chinimi)
Those in Group I are relatively large
islands with fairly heavy vegetation; those
in Group 11 are southern islands which
are very likely to be inhabited continu-
ously by the Enewetak people after they
return; and those in Group III are sand-
bars or very small islands with relatively
little vegetation or likelihood of heavy use.
Phase II Islands
The Phase II islands were termed to
be “lightly contaminated,” based upon the
historical background, ranking of islands
by fallout levels, and previous surveys.
The term “lightly contaminated” is, of
course, only a relative one. The islands
were expected to be significantly more
contaminated than any of the Phase I
islands. Using the gamma exposure
rates measured on ALICE through EDNA
during previous surveys, and the posi-
tions of these islands relative to the
islands with ground zeros, two groups of
islands were developed: Phase II,
Group I, those islands which had been
visited and for which some radiological
information was available, and Phase II,
Group II, islands which have not been vis-
ited recently (except for limited sampling
on TILDA and URSULA), but from all
indications were likely to be similar in
fallout level and exposure rate to the
Phase II, Group I islands. These two
Phase 11 groups consisted of the following
islands :
Phase II -Group I (visited during previous surveys)
ALICE (Bogallua)
BELLE (Bogombogo)
CLARA (Eybbiyae)
DAISY (Lidilbut)
EDNA (San- ildefonso)
Phase II -Group II (not visited during previous surveys)
KATE (Muzin) TILDA (Biijirija
MARY (Bokonaarappu) WILMA (Piiraai)
PEARL (Rujoru) PERCY
VERA (Aaraanbiru) OLIVE (Aitsu)
LUCY (Kirinian) URSULA (Rojoala
NANCY (Yeiri)
aVisited July 1971.
Soil samples were available from the
May 1972 survey for the islands of
ALICE, BELLE, CLARA, DAISY, and
EDNA. These samples were very lim-
ited in number, and, unfortunately, were
combined for each island during collec-
tion. However, they did indicate that the
-88-
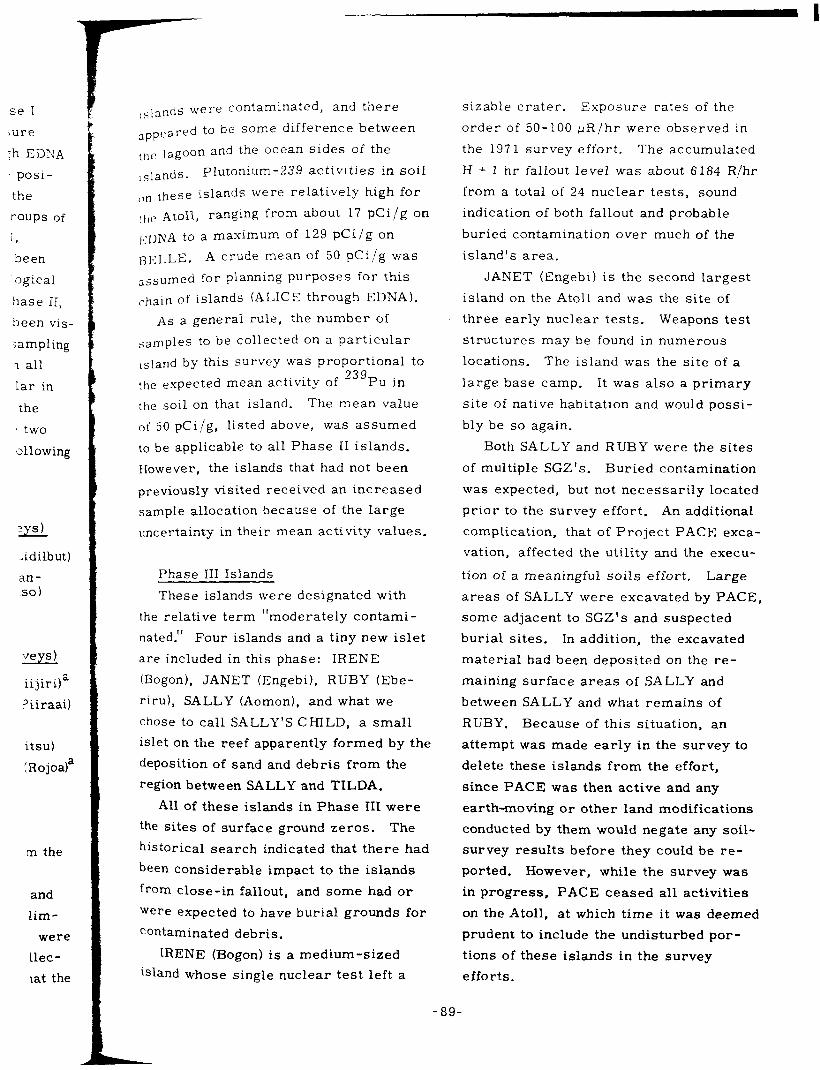
se I
iure
:h EDNA
posi-
the
roups of
1,
been
ogical
hase II,
been vis-
iampling
1 all
lar in
the
3 two
ollowing
?ys)
>idilbut)
an- so)
veys)
‘iijiri) a
‘iiraai)
itsu)
(Rojoala
m the
and
lim-
were
llec-
iat the
I
,s,ands were contaminated, and there
,ppeared to be some difference between
the lagoon and the ocean sides of the
Islands- Plutonium-239 activities in soil
~,” these islands were relatively high for
!,,e Atoll, ranging from about 17 pCi/g on
[<DNA to a maximum of 129 pCi/g on
BELLE. A crude mean of 50 pCi/g was
assumed for planning purposes for this
,-hain of islands (ALICE through EDNA).
As a general rule, the nUmber of
samples to be collected on a particular
,siand by this survey was proportional to
the expected mean activity of 239
Pu in
the soil on that island. The mean value
of 50 pCi/g, listed above, was assumed
t0 be applicable to all Phase II islands.
However, the islands that had not been
previously visited received an increased
sample allocation because of the large
uncertainty in their mean activity values.
Phase III Islands
These islands were designated with
the relative term “moderately contami-
nated.” Four islands and a tiny new islet
are included in this phase: IRENE
(Bogon), JANET (Engebi), RUBY (Ebe-
riru), SALLY (Aomon), and what we
chose to call SALLY’S CHILD, a small
islet on the reef apparently formed by the
deposition of sand and debris from the
region between SALLY and TILDA.
All of these islands in Phase III were
the sites of surface ground zeros. The
historical search indicated that there had
been considerable impact to the islands
from close-in fallout, and some had or
were expected to have burial grounds for
Contaminated debris.
IRENE (Bogon) is a medium-sized
island whose single nuclear test left a
sizable crater. Exposure rates of the
order of 50-100 ,uR/hr were observed in
the 1971 survey effort. The accumulated
H + 1 hr fallout level was about 6184 R/hr
from a total of 24 nuclear tests, sound
indication of both fallout and probable
buried contamination over much of the
island’s area.
JANET (Engebi) is the second largest
island on the Atoll and was the site of
three early nuclear tests. Weapons test
structures may be found in numerous
locations. The island was the site of a
large base camp. It was also a primary
site of native habitation and would possi-
bly be so again.
Both SALLY and RUBY were the sites
of multiple SGZ’s. Buried contamination
was expected, but not necessarily located
prior to the survey effort. An additional
complication, that of Project PACE exca-
vation, affected the utility and the execu-
tion of a meaningful soils effort. Large
areas of SALLY were excavated by PACE,
some adjacent to SGZ’s and suspected
burial sites. In addition, the excavated
material had been deposited on the re-
maining surface areas of SALLY and
between SALLY and what remains of
RUBY. Because of this situation, an
attempt was made early in the survey
delete these islands from the effort,
since PACE was then active and any
to
earth-moving or other land modifications
conducted by them would negate any soil-
survey results before they could be re-
ported. However, while the survey was
in progress, PACE ceased all activities
on the Atoll, at which time it was deemed
prudent to include the undisturbed por-
tions of these islands in the survey
efforts.
89-
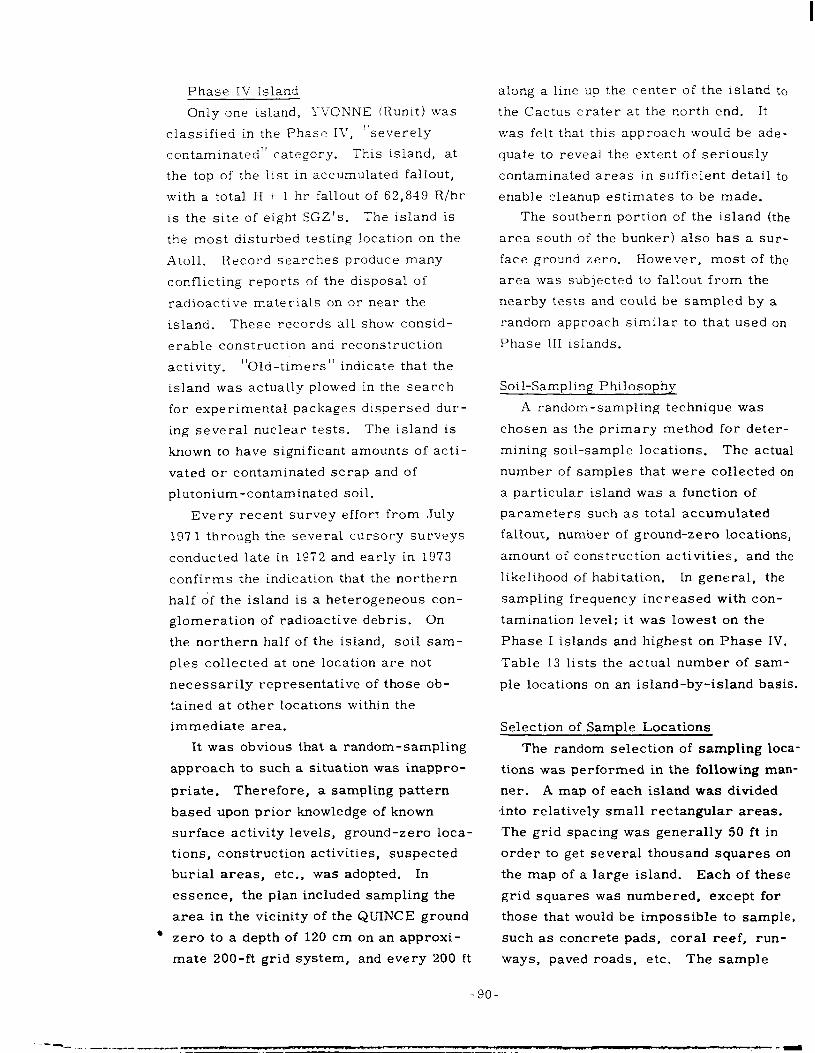
Phase IV Island
Only one island, 1VONNE (Runit) was
classified in the Phase Il7, “severely
contaminated” category. This island, at
the top of the list in accumulated fallout,
with a total H + 1 hr fallout of 62,849 R/hr
is the site of eight SGZ’S. The island is
the most disturbed testing location on the
Atoll. Record searches produce many
conflicting reports of the disposal of
radioactive materials on or near the
island. These records all show consid-
erable construction and reconstruction
activity. “Old -timers ” indicate that the
island was actually plowed in the search
for experimental packages dispersed dur-
ing several nuclear tests. The island is
known to have significant amounts of acti-
vated or contaminated scrap and of
plutonium-contaminated soil.
Every recent survey effort from July
197 1 through the several cursory surveys
conducted late in 1972 and early in 1973
confirms the indication that the northern
half of the island is a heterogeneous con-
glomeration of radioactive debris. On
the northern half of the island, soil sam-
ples collected at one location are not
necessarily representative of those ob-
tained at other locations within the
immediate area.
It was obvious that a random-sampling
approach to such a situation was inappro-
priate. Therefore, a sampling pattern
based upon prior knowledge of known
surface activity levels, ground-zero loca-
tions, construction activities, suspected
burial areas, etc., was adopted. In
essence, the plan included sampling the
area in the vicinity of the QUINCE ground
’ zero to a depth of 120 cm on an approxi-
mate 200-ft grid system, and every 200 ft
-9o-
along a line up the center of the island to
the Cactus crater at the north end. It
was felt that this approach would be ade-
quate to reveal the extent of seriously
contaminated areas in sufficient detail to
enable cleanup estimates to be made.
The southern portion of the island (the
area south of the bunker) also has a sur-
face ground zero. However, most of the
area was subjected to fallout from the
nearby tests and could be sampled by a
random approach similar to that used on
Phase III islands.
Soil-Sampling Philosophy
A random-sampling technique was
chosen as the primary method for deter-
mining soil-sample locations. The actual
number of samples that were collected on
a particular island was a function of
parameters such as total accumulated
fallout, number of ground-zero locations,
amount of construction activities, and the
likelihood of habitation. In general, the
sampling frequency increased with con-
tamination level; it was lowest on the
Phase I islands and highest on Phase IV.
Table 13 lists the actual number of sam-
ple locations on an island-by-island basis.
Selection of Sample Locations
The random selection of sampling loca-
tions was performed in the following man-
ner. A map of each island was divided
into relatively small rectangular areas.
The grid spacing was generally 50 ft in
order to get several thousand squares on
the map of a large island. Each of these
grid squares was numbered, except for
those that would be impossible to sample,
such as concrete pads, coral reef, run-
ways, paved roads, etc. The sample
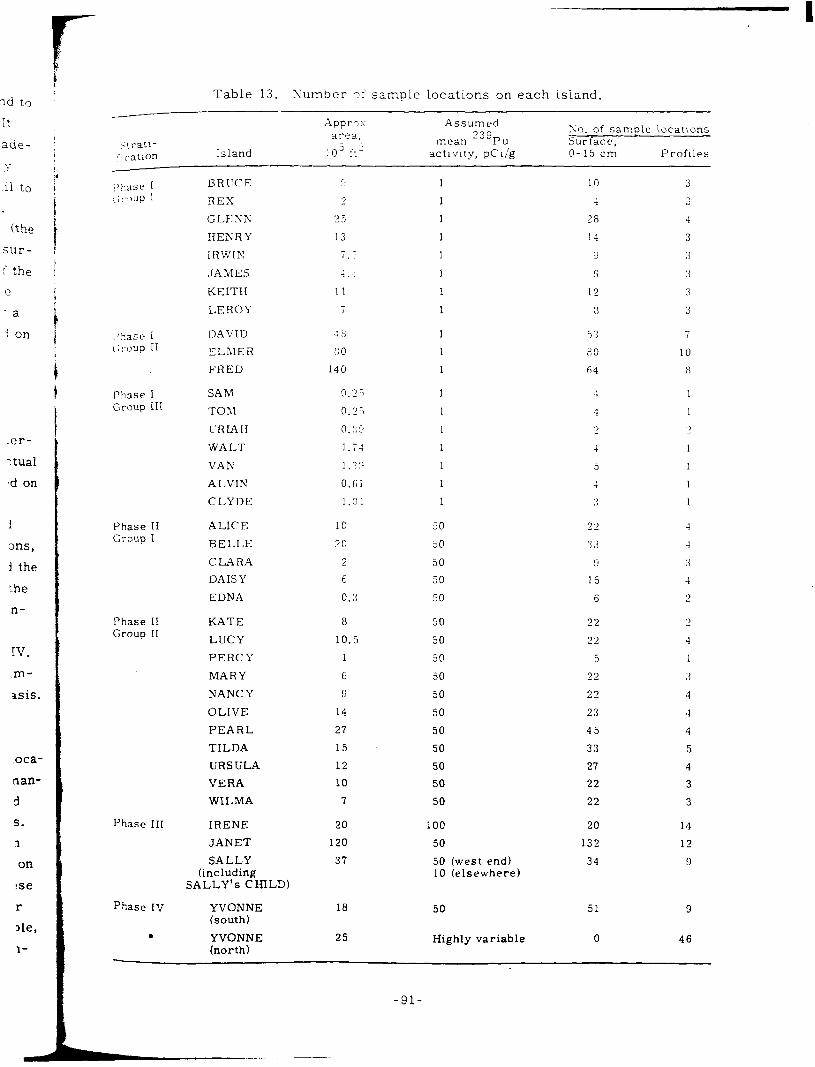
ld to
It
ade-
Y
.ii to
(the
sur-
:‘ the
e
. a
-i on
:er-
ztual
bd on
1
3ns,
i the
the
n-
IV.
.m-
asis.
.oca-
nan-
d
5.
n
on
!se
r
)le,
l-
I
Table 13. Xumber qf sample locations on each isiand.
itratl- ;:catlon Island
Approx area,
j -:- 10
Assumed ‘7 7 cl
mean -“-Pu activity, pCi/g
X0. of sample locations Surface, O-15 cm Proilles
i’hase 1 / ;:. ,i1p I
P!?ase I Group II!
Phase II Group I
Phase II Group 11
Phase III
Phase IV
.
BRUCE
REX
GLENS
HENRY
IRWIN
JAMES
KEITH
LEROY
11
7
10
4
2 8
14
9
6
12
8
DAVID ; ::
ELiGER i:0
FRED 140
5 3 7
HO 10
64 :1
SAM
TOnl
L-RIAH
WALT
VAN
ALVIN
CLYDE
0.3
O.?i
0 . i, ?
1.7:
l.??
O.Fi
1.01
ALICE 10
BELLE 20
CLARA 2
DAISY 6
EDNA 0.3
50
50
50
50
50
2’ 1
:i 3 -1
L’ :i
15 4
6 2
KATE 8 50 22 L’
LUCY 10.5 50 22 4
PERCY 1 50 5 1
MARY 6 50 22 3
NANCY 9 50 22 4
OLIVE 14 50 23 4
PEARL 27 50 45 4
TILDA 15 50 33 5
URSULA 12 50 27 4
VERA 10 50 22 3
WILMA I 50 22 3
IRENE
JANET
SALLY (including
SALLY’s CHILD)
20
120
37
100
50
50 (west end) 10 (elsewhere)
20
132
34
14
12
9
YVONNE (south)
18 50 9
YVONNE (north)
25 Highly variable
51
0 46
-91-
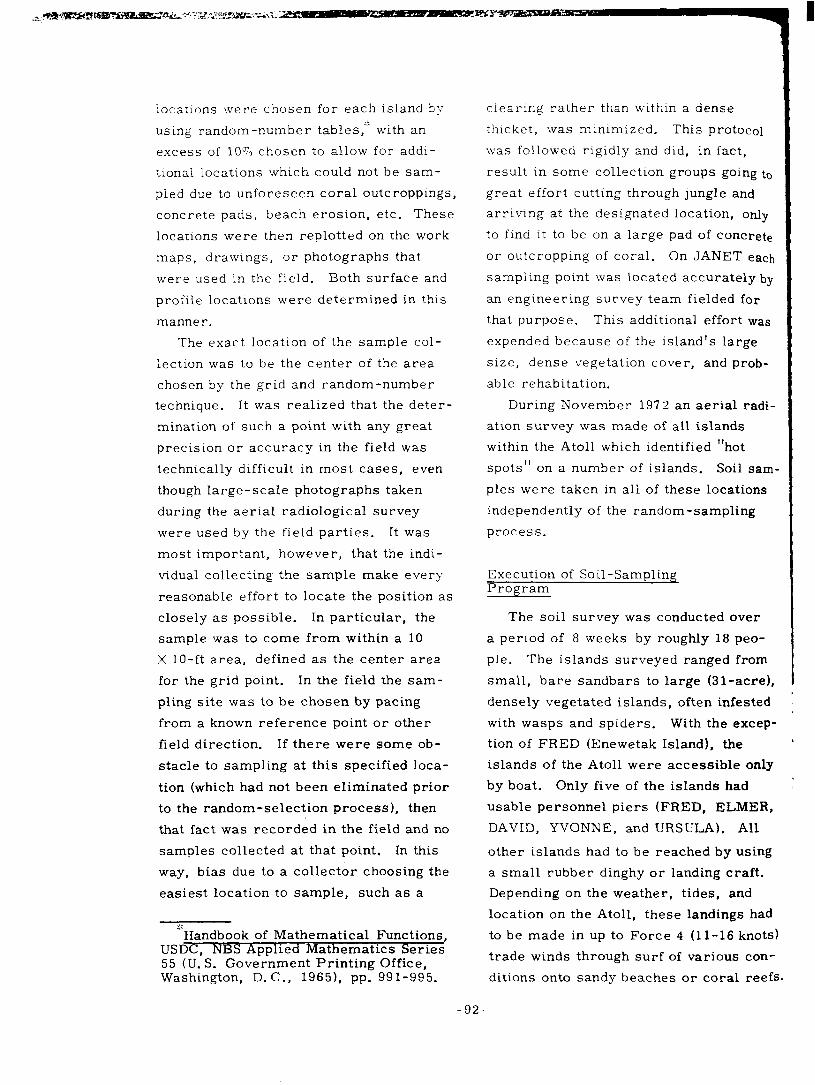
locations were chosen for each island by
using random-number tables,” with an
excess of 10% chosen to allow for addi-
tional locations which could not be sam-
pled due to unforeseen coral outcroppings,
concrete pads, beach erosion, etc. These
locations were then replotted on the work
maps, drawings, or photographs that
were used in the field. Both surface and
profile locations were determined in this
manner.
The exact location of the sample col-
lection was to be the center of the area
chosen by the grid and random-number
technique. It was realized that the deter-
mination of such a point with any great
precision or accuracy in the field was
technically difficult in most cases, even
though large-scale photographs taken
during the aerial radiological survey
were used by the field parties. It was
most important, however, that the indi-
vidual collecting the sample make every
reasonable effort to locate the position as
closely as possible. In particular, the
sample was to come from within a 10
X lo-ft area, defined as the center area
for the grid point. In the field the sam-
pling site was to be chosen by pacing
from a known reference point or other
field direction. If there were some ob-
stacle to sampling at this specified loca-
tion (which had not been eliminated prior
to the random-selection process), then
that fact was recorded in the field and no
samples collected at that point. In this
way, bias due to a collector choosing the
easiest location to sample, such as a
Q Handbook of Mathematical Functions,
USDC. NHS Applied Mathematics Series 55 (U.-S. Government Printing Office, Washington, D. C . , 19651, pp. 991-995.
clearing rather than within a dense
thicket, was minimized. This protocol
was followed rigidly and did, in fact,
result in some collection groups going to
great effort cutting through jungle and
arriving at the designated location, only
to find it to be on a large pad of concrete
or outcropping of coral. On JANET each
sampling point was located accurately by
an engineering survey team fielded for
that purpose. This additional effort was
expended because of the island’s large
size, dense vegetation cover, and prob-
able rehabitation.
During November 1972 an aerial radi-
ation survey was made of all islands
within the Atoll which identified “hot
spots” on a number of islands. Soil sam-
ples were taken in all of these locations
independently of the random-sampling
process.
Execution of Soil-Sampling Program
The soil survey was conducted over
a period of 8 weeks by roughly 18 peo-
ple. The islands surveyed ranged from
small, bare sandbars to large (31-acre),
densely vegetated islands, often infested
with wasps and spiders. With the excep-
tion of FRED (Enewetak Island), the
islands of the Atoll were accessible only
by boat. Only five of the islands had
usable personnel piers (FRED, ELMER,
DAVID, YVONNE, and URSULA). All
other islands had to be reached by using
a small rubber dinghy or landing craft.
Depending on the weather, tides, and
location on the Atoll, these landings had
to be made in up to Force 4 (11-16 knots)
trade winds through surf of various con-
ditions onto sandy beaches or coral reefs.
-92-
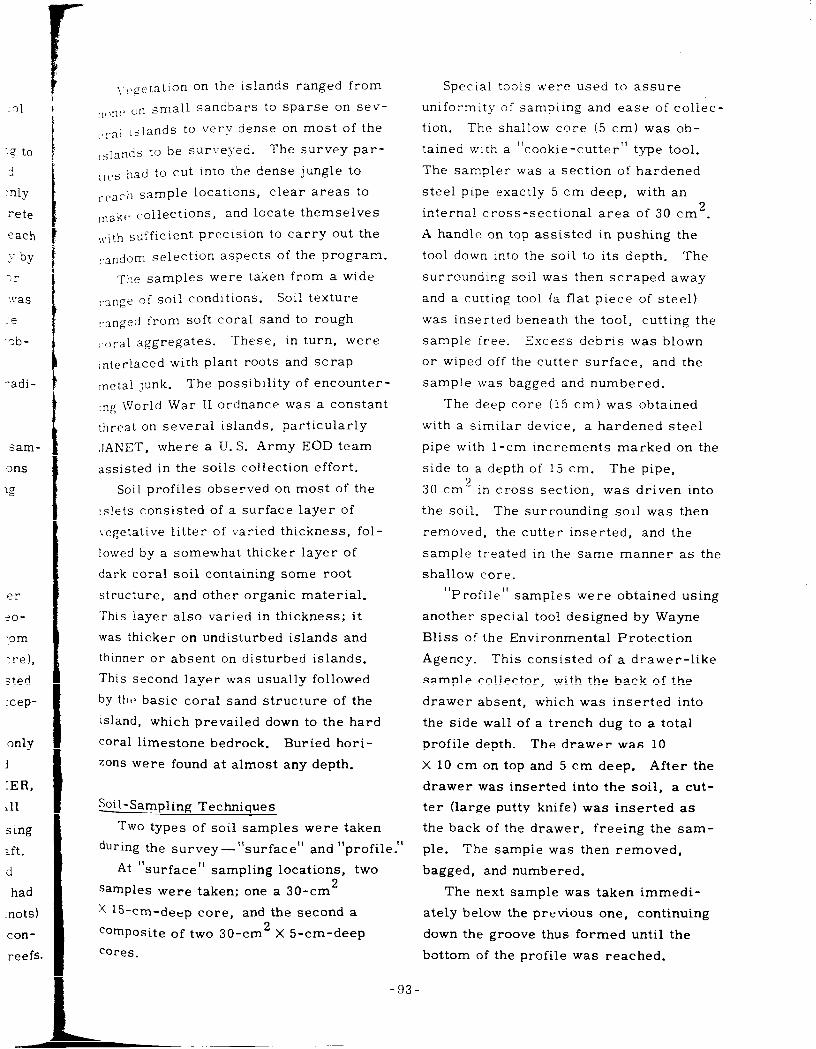
01
‘2 to
ci.
:>ly
rete
each
y by
3r
‘6’as
re
,ob-
-adi-
sam-
ons
:g
er
20-
*om
:re),
sted
:cep-
only
f
IER,
Lll
sing
ift.
d
had
riots))
con-
reefs.
\r,cctation on the islands ranged from
,,,,nc, on small sandbars to sparse on sev-
,,:.al islands to very dense on most of the
_.iands to be surveyed. The survey par-
L,,,s had to cut into the dense jungle to
rc>ach sample locations, clear areas to
mak(. COlleCtions, and locate themselves
,>{,ith sufficient precision to Carry Out the
:.andom selection aspects of the program.
The samples were taken from a wide
I.3nge of soil conditions. Soil texture
,.anged from soft coral sand to rough
,.oral aggregates. These, in turn, were
,nterlaced with plant roots and scrap
lnctal junk. The possibility of encounter-
,“g World War II ordnance was a constant
threat on several islands, particularly
JANET, where a U.S. Army EOD team
assisted in the soils collection effort.
Soil profiles observed on most of the
islets consisted of a surface layer of
vegetative litter of varied thickness, fol-
lowed by a somewhat thicker layer of
dark coral soil containing some root
structure, and other organic material.
‘This layer also varied in thickness; it
was thicker on undisturbed islands and
thinner or absent on disturbed islands.
This second layer was usually followed
by thfl basic coral sand structure of the
Island, which prevailed down to the hard
coral limestone bedrock. Buried hori-
zons were found at almost any depth.
Soil-Sampling Techniques
Two types of soil samples were taken
during the survey-“surface” and “profile.”
At “surface” sampling locations, two
samPles were taken; one a 30-cm 2
X l5-cm-deep core, and the second a
comPosite of two 30-cm2 x 5-cm-deep
cores.
-93-
Special tools were used to assure
uniformity of samplmg and ease of coliec-
tion. The shallow core (5 cm) was ob-
tained with a “cookie-cutter” type tool.
The sampler was a section of hardened
steel pipe exactly 5 cm deep, with an 2 internal cross-sectional area of 30 cm .
A handle on top assisted in pushing the
tool down tnto the soil to its depth. The
surrounding soil was then scraped away
and a cutting tool (a flat piece of steel)
was inserted beneath the tool, cutting the
sample free. Excess debris was blown
or wiped off the cutter surface, and the
sample was bagged and numbered.
The deep core (15 cm) was obtained
with a similar device, a hardened steel
pipe with l-cm increments marked on the
side to a depth of 15 cm. The pipe,
30 cm2 in cross section, was driven into
the soil. The surrounding soil was then
removed, the cutter inserted, and the
sample treated in the same manner as the
shallow core.
“Profile” samples were obtained using
another special tool designed by Wayne
Bliss of the Environmental Protection
Agency. This consisted of a drawer-like
sample collector, with the back of the
drawer absent, which was inserted into
the side wall of a trench dug to a total
profile depth. The drawer was 10
X 10 cm on top and 5 cm deep. After the
drawer was inserted into the soil, a cut-
ter (large putty knife) was inserted as
the back of the drawer, freeing the sam-
ple. The sample was then removed,
bagged, and numbered.
The next sample was taken immedi-
ately below the previous one, continuing
down the groove thus formed until the
bottom of the profile was reached.
The trenches used to collect the pro-
files were ‘dug by hand on most islands.
On those islands where deep (greater
than 120 cm) profiles ‘.vere required, a
backhoe was landed and used to dig the
trenches.
Profile samples were taken at nominal
depth increments of: 0 to 2, 2 to 5, 5 to
10, 10 to 15, 15 to 25, and 25 to 35 cm
and at lo-cm increments to total depth.
If soil horizons were encountered, an
attempt was made to choose the interface
lines as additional increments.
Each soil sample collected was placed
in a plastic bag; the bag was numbered
and placed inside of another plastic bag.
The double-bagged sample was then
placed in a field pack with other samples
and transported to the shore, where all
samples were placed in large plastic
bags for transport back to FRED via
rubber boat and larger craft.
Upon arrival at FRED, the samples
were taken to a sample-processing area
for short-term storage, sample-control
processes, and bag checks to assure
rebagging of those samples whose bags
had been damaged in transport. Each
sample was then gamma-scanned in the
field counting laboratory, and placed in
storage until it could be shipped to the
continental U. S. laboratory.
Results and Discussion
The soil-sampling locations on each
island are shown in the “f” overlay fig-
ures of Appendix II. Each location has
an identifying number for reference pur-
poses. These locations were chosen
primarily by a random-selection tech-
nique with a few sites chosen to study
specific areas of interest such as hot
spots, decontamination areas, surfact
ground zeros, etc. The average activ
ties of 239Fu, “St-, 137Cs, and 6oC0 ,
exhibited by the core samples collecte,
to a depth ,2,f 15 cm, are shown in the ’
“j,” “1,” and “n” overlays of Appendix 1
These activities, expressed in picocur
per gram of dry soil, are displayed at
the geographical locations where the rc
spective samples were collected. For
those who desire to convert these data
into activ:ties per unit area, one may t
an approximate dry soil density of 1.5 l 3
cm . attempt was made to measurf
in situ densities. The meaning of the r
sulting deposition values, however, is
subject to some interpretation since one
must realize that an appreciable fractic
of the total activity may be situated belt
the sampling depth, as shown in the pro
file figures for each island. In these
figures the activities of 23gPu, “Sr,
137Cs, and 6o Co are plotted as a functic
of depth for the corresponding profile
locations. Additionally, the complete
records of all radionuclides are repro-
duced on microfiche at the end of Appen,
dix II.
In general, the activities shown in the
figures, when properly grouped, approx
mate lognormal distributions. This ma:
be illustrated by grouping the actiky
levels measured in the 15-cm deep core
samples collected on JANET into equal
class intervals and plotting the resulting
frequency distribution curve shown in
Fig. 26. Instead of being symmetric
about the maximum as a normal distribu
tion, one observes a long “tail” which
includes a significant proportion of rela-
tively high activity levels. This distribu
tion can be transformed into the more
-94-
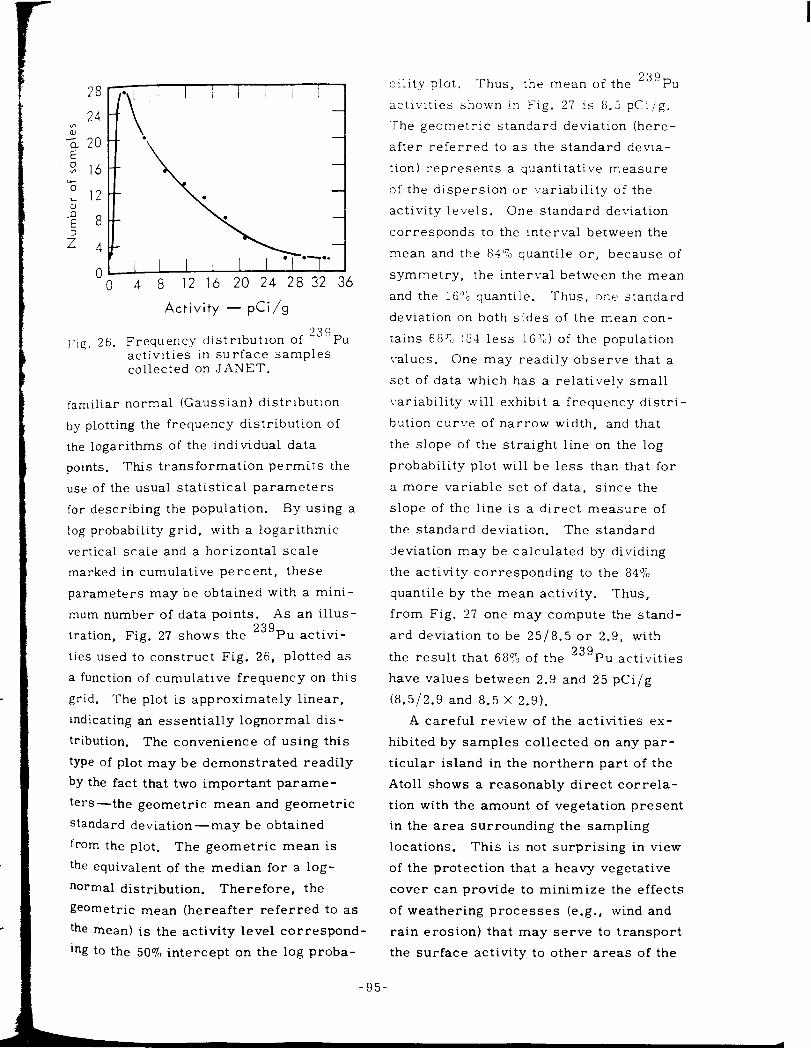

\” (5
Q
I x
.- > .-
2
10
1
Cumulative percent of samples
Fig. 27. Distribution of 23g Pu activities in surface samples collected on JANET.
-96-
-.---.- __ - r..--n~.wPv-.---- __-_--.__ - .
.~

*Atoll. This correlation of activity IVith
,.,getative cover was also observed at
Bikini. Thus, a particular island may
show the following distinct areas having
significantly different radiological condi-
tions : Densely vegetated areas exhibiting
the highest activities; sparsely vegetated
areas showing intermedIate activity lev-
els; and beach areas displaying the low-
est activities. This pattern is occasion-
ally perturbed in “hot-spot” areas where
ground-zero locations existed, as well as
in areas that have been subjected to ex-
tensive construction actl:i:ies.
The 23gP~, ‘*Sr, 137Cs, and 6oCo
activities shown in the figures in Appen-
dix II were plotted separately on log prob-
ability paper on an island-by-island basis.
Islands situated in the southern part of
the Atoll were combined into groups be-
cause to their radiological similarities
and low activity levels. T1S.henever appro-
priate, an island was divided into “dense
Vegetation,” light Vegetation,” and “beach”
categories, and if significant radiological
differences were noted, a mean value and
the standard deviation were obtained for
each distinct area on the island. In those
cases where the differences in the mean
Values were less than a factor of two, all
of the measurements for a particular
radionuclide were combined, and the
mean and standard deviations were ob-
tained for the entire island, excluding the
beach areas. In most situations, the
standard deviations were fairly constant,
ranging largely between 1.5 and 2.5, indi-
cating that the degree of variability of the
measurements from one island to the
next was small.
The distributions of activity with soil
depth obta .i ned for the profile samples
sholi many -.-ariations. Ilowever, in
spite of these l-ariat:ons, some general
comments ,may be made. Excluding
beaches anti areas subjected to extensive
construction activity, the radioactivity
generally decreases with depth in some
highly I-artable and nonlinear fashion.
Frequently, The acti:-lty decreases rap-
idly within the first fe!V centimeters and
then more slowly with increasing depth.
A relaxation length of 3-5 cm (the depth
at which the activity is e -1
or 37% of the
surface activity) is commonly observed
within the top 5-8 cm. Below this depth
the relaxation length frequently increases
to 10 cm or more. Profile samples co1 -
lected on or near the beaches display a
different depth distribution. Surface
activities are usually considerably lower
than island interior Values, and the dis-
tributions are essentially uniform or may
even increase with depth.
Radionuclides other than 23gPu, “Sr,
137Cs , and ” Co appeared in the gamma-
ray spectra. A convenient way to evalu-
ate these actiVity levels is presented in
Table 14, which gives the median activity
ratios of 241Am/23gPu, 238Pu/23gPu,
125Sb/‘37Cs, and 155Eu/137Cs for each
island situated within the northern por-
tion of the Atoll. Inspection of the data
indicates that the median activity ratios,
of 241Am/23gPu, 238Pu/23gPu, and
125Sb/137Cs are essentially constant,
with approximate values of 0.40, 0.10,
and 0.07, respectively. 155Eu/137Cs
values exhibit a reasonably constant
value of 0.20, except for DAISY, EDNA,
and IRENE, where the values rise to a
maximum of 2.5.
The following is a description of the
current radiological conditions of the
-97 -

Table 14. LIedian actilrity ratios of pertLnent radionuclides measured in soil samples -
Island 241
-AmI 239Pu 23SP,: ‘)x$ua 1 xi;__ 131C _
,s 1 25Sb,137Cs
ALICE 0.39 0.10 0.12 0.05
BELLE 0.33 0.11 0.13 0.07
CLARA 0.26 0.14 0.15 0.04
DAISY 0.36 - 0.72 0.09
EDNA 0.35 0.06 0.81 0.03
IRENE 0.19 - 2.5 0.15
<JANET 0.38 - 0.11 0.03
KATE 0.42 0 .-- 33 0.06
LU CT 0.43 0.3; 0.07
PERC\ 0.41 - 0.17
MARY 0.38 - 0.22 0.06
NANCY 0.49 - 0.23 0.08
OLIVE 0.38 - 0.30 0.08
PEARL 0.25 - 0.48 0.08
RUBY 0.11 - 2.6 0.31
SALLY 0.28 0.18 0.07
TILDA 0.51 - 0.20 0.08
URSULA 0.41 0.1-l 0.07
VERA 0.44 - 0.17 0.05
WILMA 0.40 - 0.11 0.09
a238Pu activitie s were measured only in a few samples.
islands within the Atoll. For discussion
purposes each island situated within the
northern part of the Atoll is treated sep-
arately, while those within the southern
part of the Atoll are treated in groups
because of their radiological similarities.
In addition, the mean values and range of
observed activities listed for the north-
ern islands do not include the activities
of samples collected on the beaches,
since it was felt that these low values
might unduly distort the description of
the islands’ radiological condition. This
was not considered to be true of islands
within the southern part of the Atoll. The
activities listed in the discussions were
obtained from the surface samples col-
lected to a depth of 15 cm.
For ease of comparison, the data for
the northern islands are summarized in
Table 15 and for the southern islands in
Table 16.
Northern Portion of Atoll (ALICE- YVONNE)
ALICE-This island is densely
vegetated over its entire surface. The
mean and range of observed activities
exhibited by the surface samples for the
following radionuclides are:
-98-
----L.__ ---- __~_ .- ~
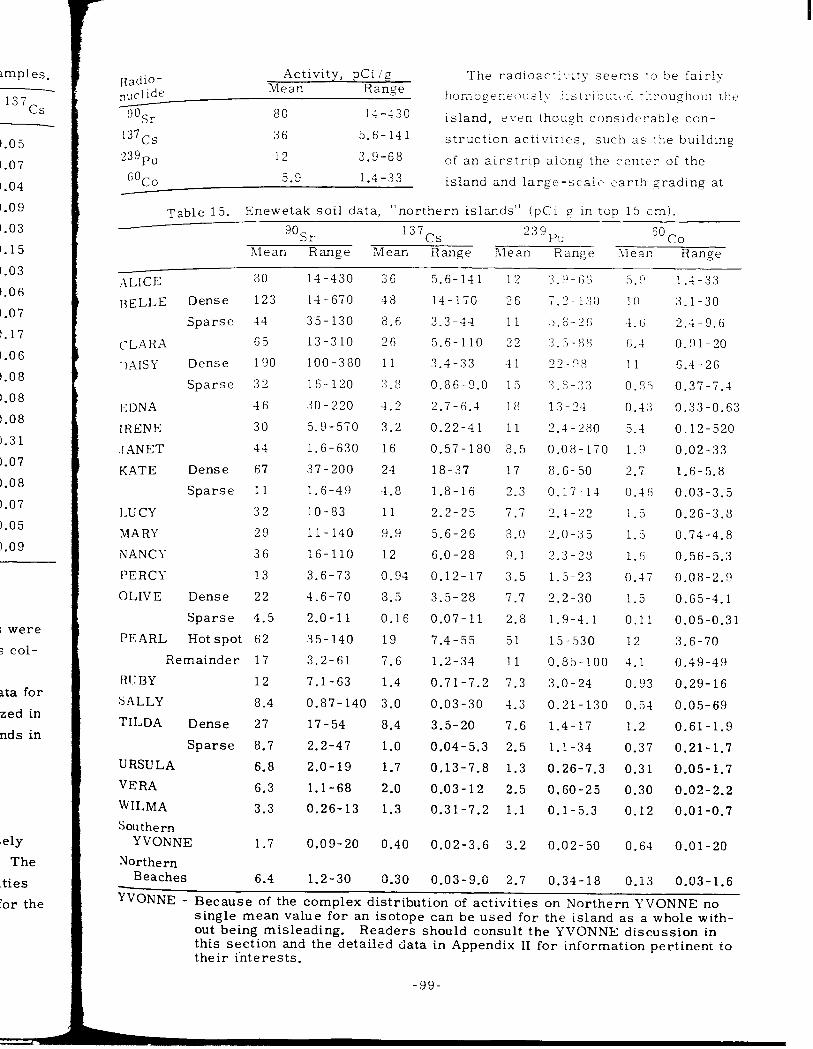
imples.
137 CS
I.05
I.07
I.04
1.09
1.03
I.15
1.03
I.06
1.07
J. 17
1.06
1.08
1.08
1.08
J.3 1
1.07
J.08
J.07
J.05
1.09
; were
5 COl-
ita for
zed in
nds in
.ely
The
.ties
‘or the
Radio- *uclide
!)Op
137C.
“39pu
6OCo
Activity, pCi ig The radioact::-ity seems to be fair11 Mean Range
homogeneously ::str!butc’d -F.YOU~~IOU; the
80 14-130 island, e\en though considerable con-
36 5.6-141 struction acti\,lr:es, such as :he building
12 3.9-68 of an airstrip along the centcir of the
5.9 1.4 -33 island and large-scale earth grading at
Table 15. Enewetak soil data, “northern islands” (pCi g in top 15 cm).
goSr 137cs 239pu 6Oco Rlean Range Mean Range 1lean Range lIean Range
:I LICE
BELLE
CLARA
I ,AISS
I-DNA
IRENE
.J ANET
KATE
LU CY
MARY
NANCY
PERCY
OLIVE
PEARL
30
Dense 123
Sparse 44
65
Dense 190
Sparse 32
-16
30
44
Dense 67
Sparse 11
32
29
36
13
Dense 22
Sparse 4.5
Hot spot 62
Remainder
RJUBY
SALLY
TILDA Dense
17
12
8.4
27
8.7
6.8
6.3
3.3
14-430
14-670
35- 130
13-310
loo-380
16-120
30-220
5.9-570
l-6-630
37-200
1.6-49
lo-83
11-140
16-110
3.6-73
4.6-70
2.0-l 1
35- 140
36
48
8.6
26
11
3.8
1.2
3.2
16
24
4.8
11
9.9
12
0.94
3.5
0.16
19
5.6-141 12
14-170 36
3.3-4-I 11
5.6-110 ‘2
3.4-33 -11
0.86-9.0 15
2.7-6.4 1 8
0.22-41 11
0.57-180 8.5
18-37 17
1.8-16 2.3
2.2-25 7.7
5.6-26 8.0
6.0-28 9.1
0.12-17 3.5
3.5-28 7.7
0.07-11 2.8
7.4-55 51
3 . 9 - i; ii :i . P
7-z 130 10
5.%-2r; t . 6
:3.,7-i::; fi .4
73-q,y -- 11
3.:-33 0 0: .o 1
!%?-I 0.43
“.-i-280 5.4
0.08-170 1.9
8.6-50 2.7
0.17-13 0.46
2.4-22 I.5
2.0-35 1.5
2.3-28 1.6
1.5-23 0.47
2.2-30 1.5
1.9-4.1 0.11
15-530 12
1 .A-33
3.1-30
2.4-9.6
0.91-20
6.4-26
0.37-7.4
0.33-0.63
0.12-520
0.02-33
1.6-5.8
0.03-3.5
0.26-3.8
0.74-4.8
0.56-5.3
0.08-2.9
0.65-4.1
0.05-0.31
3.6-70
Sparse
URSULA
VERA
WILMA
Southern YVONNE
Northern Beaches
1.7
6.4
3.2-61
7.1-63
0.87-140
17-54
2.2-47
2.0-19
1.1-68
0.26-13
0.09-20
1.2-30
7.6
1.4
3.0
8.4
1.0
1.7
2.0
1.3
0.40
0.30
1.2-34 11
0.71-7.2 7.3
0.03-30 4.3
3.5-20 7.6
0.04-5.3 2.5
0.13-7.8 1.3
0.03-12 2.5
0.31-7.2 1.1
0.02-3.6 3.2
0.03-9.0 2.7
0.85-100 4.1
3.0-24 0.93
0.21-130 0.54
1.4-17 1.2
1.1-34 0.37
0.26-7.3 0.31
0.60-25 0.30
o-1-5.3 0.12
0.02-50 0.64
0.34-18 0.13
0.49-49
0.29-16
0.05-69
0.61-1.9
0.21-l-7
0.05-1.7
0.02-2.2
0.01-0.7
0.01-20
0.03-1.6
YVONNE - Because of the complex distribution of activities on Northern YVONNE no single mean value for an isotope can be used for the island as a whole with- out being misleading. Readers should consult the YVONNE discussion in this section and the detailed data in Appendix II for information pertinent to their interests.
-99-
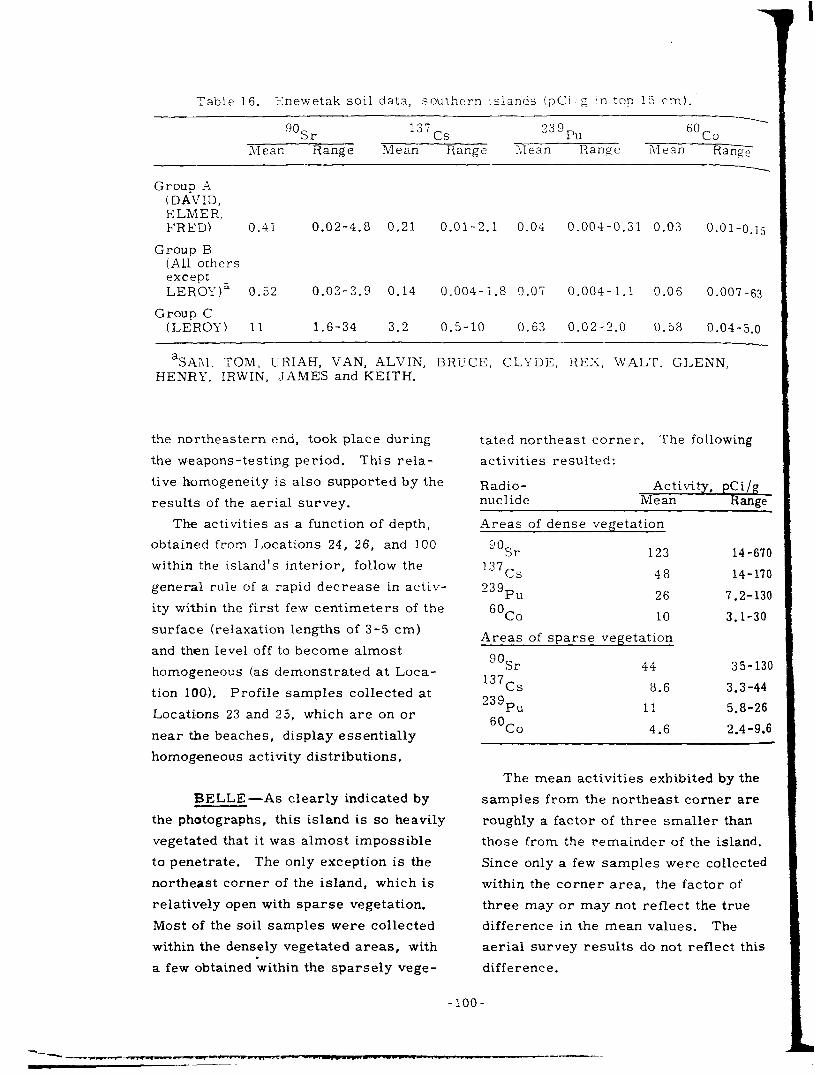
Table 16. Znewetak soil data, southern Islands (pCi g !n top 15 cm).
9OSr Mean Range
137 CS
239Pu 6oCo
Mean Range LIean Range Mean Range
Group A (DAVID, ELMER, FRED) 0.41 0.02-4.8 0.2
Group B (All others except ^
1 0.01-2.1 0.04 0.004-0.31 0.03 0.01-O.
LEROY )” 0.52 0.03-3.9 0.14 0.004-1.8 0.07 0.004-1.1 0.06 0.007-6
Group C (LEROY) 11 1.6-34 3.2 0.5-10 0.63 0.02-2.0 0.58 0.04-5.1
aSAhl, TOM, URIAH, VAN, ALVIN. BRUCE, CLYDE, REX, WALT, GLENN, HENRY, IRWIN, JAMES and KEITH.
the northeastern end, took place during
the weapons-testing period. This rela-
tive homogeneity is also supported by the
results of the aerial survey.
The activities as a function of depth,
obtained from Locations 24, 26, and 100
within the island’s interior, follow the
general rule of a rapid decrease in activ-
ity within the first few centimeters of the
surface (relaxation lengths of 3-5 cm)
and then level off to become almost
homogeneous (as demonstrated at Loca-
tion 100). Profile samples collected at
Locations 23 and 25, which are on or
near the beaches, display essentially
homogeneous activity distributions,
BELLE -As clearly indicated by
the photographs, this island is so heavily
vegetated that it was almost impossible
to penetrate. The only exception is the
northeast corner of the island, which is
relatively open with sparse vegetation.
Most of the soil samples were collected
within the densely vegetated areas, with .
a few obtained within the sparsely vege-
tated northeast corner. The following
activities resulted:
Radio- nuclide
Activity, Qci/{
Mean Ran
Areas of dense vegetation
90 Sr 123
137cs 48
23gPu 26
6oco 10
Areas of sparse vegetation
“Sr 44
137cs 8.6
23gPu 11
6oco 4.6
14-f
14-’
?.2-:
3.1-:
35-
3.3-1
5.8-:
2.4-i
The mean activities exhibited by the
samples from the northeast corner arc
roughly a factor of three smaller than
those from the remainder of the island
Since only a few samples were collect6
within the corner area, the factor of
three may or may not reflect the true
difference in the mean values. The
aerial survey results do not reflect thi
difference.
-lOO-
-- ------w-l- -----a-- --
-~
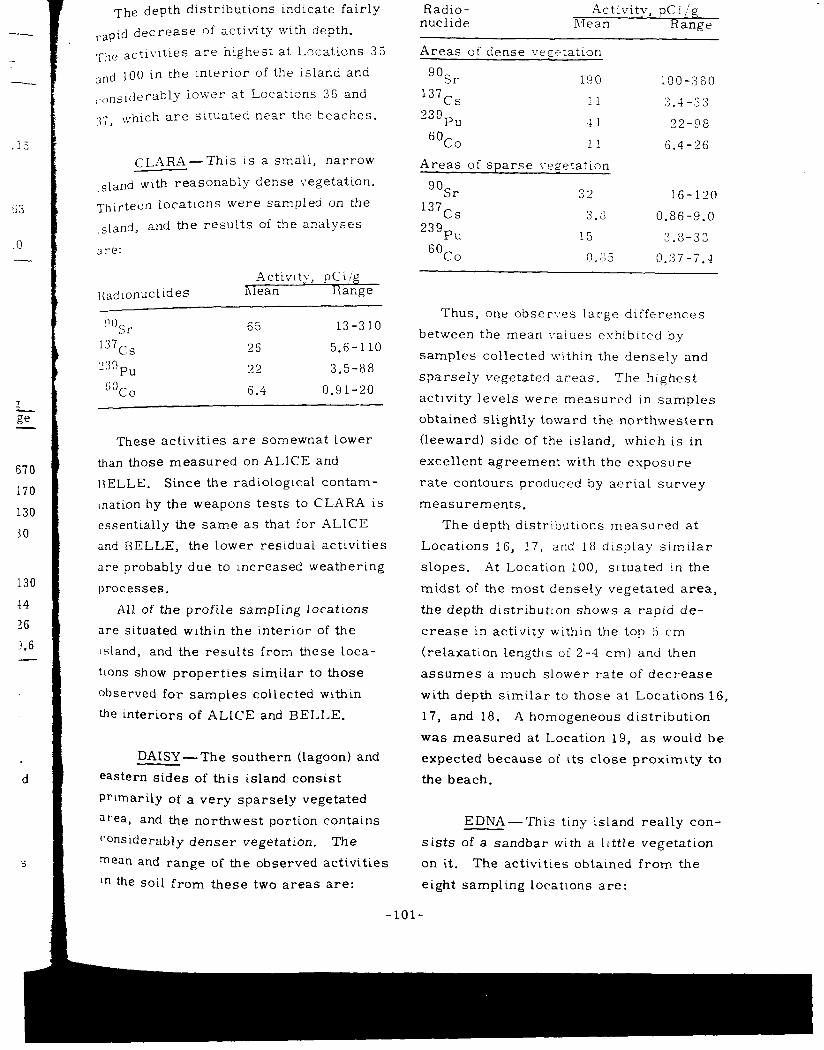
5
ge -
670
170
130
30
130
14
26
2.6 -
The depth distributions indicate fairly
rapid decrease Of activity with depth.
~~~ activities are highest at Locations 35
3nd 100 in the interior of the island and
,nnslderably lower at Locations 36 and
I>” .) 1 I which are situated near the beaches.
CLARA- This ts a small, narrow
,sland with reasonably dense vegetation.
ThLrtecn Iocattons were sampled on the
Island, and the results of the analyses
xre:
liadtonuclides
Activity, pCi /g Mean Hange
!‘OSr 65 13-3 10
137Cs 26 5.6-110
“:X$u 22 3.5-88
6Oco 6.4 0.9 l-20
These activities are somewhat lower
than those measured on ALICE and
l%ELLE. Since the radiological contam-
ination by the weapons tests to CLARA is
essentially the same as that for ALICE
and BELLE, the Lower restdual activities
are probably due to mcreased weathering
processes.
All of the profile sampling locations
are situated within the interior of the
island, and the results from these Loca-
tions show properties similar to those
observed for samples collected within
the interiors of ALICE and BELLE.
DA&Y-The southern (Lagoon) and
eastern sides of this island consist
prtmarily of a very sparsely vegetated
area, and the northwest portion contains
considerably denser vegetation. The
mean and range of the observed activities
In the soil from these two areas are:
Radio- nuclide
Activitl., pCii/g Mean Range
Areas of dense vegetation
g”Sr 190
137cs 11
23gp, -11
6oco 11
Areas of s arse I-egetation
!OO-380
3.4 -33
22-9s
6.4-26
32 16-120
3.3 0.86-9.0
15 3.8-33
0.83 0.37-7.4
Thus, one obserl:es large differences
between the mean values exhibited by
samples collected within the densely and
sparsely vegetated areas. The highest
activity levels were measured in samples
obtained slightly toward the northwestern
(leeward) side of the island, which is in
excellent agreement with the exposure
rate contours produced by aerial survey
measurements.
The depth distributions measured at
Locations 16, 17, and 18 dtsplay similar
slopes. At Location 100, situated m the
midst of the most densely vegetated area,
the depth distrlbutlon shows a rapid de-
crease in activity within the top 5 cm
(retaxatton Lengths of 2-4 cm) and then
assumes a much slower rate of decrease
with depth similar to those at Locations 16,
17, and 18. A homogeneous distribution
was measured at Location 19, as would be
expected because of its close proximity to
the beach.
EDNA -This ttny island really con-
sists of a sandbar wtth a little vegetation
on it. The activities obtained from the
eight sampling locattons are:
10 l-

Radionuclide Act::-ltv, pCiig
Mean Range
noSI- 46 30-220
239Pu 18 13-24
137Cs 4.2 2.7 -6.4
6oco 0.43 0.33 -0.63
These mean activities are lower than
those measured on ALICE, BELLE,
CLARA, or DAISY, even though the
radiological contamination of EDNA from
the weapons tests is a factor of three
greater than those given to the other
islands in the group. This ts, of course,
most probably due to the enhanced wind
and wave action operating on this tiny
island which has diluted and transported
the activity. The homogeneous depth
distribution at Locations 7 and 8 tends to
bear this out.
IRENE -This island played a
central role in the weapons-testing pro-
gram. Highlights of its role include the
detonation of the SEMINOLE event, which
created a large water-filled crater within
the island’s central region; its proximity
to the MIKE and KOA thermonuclear
events, which significantly altered its
physical characteristics; and extensive
construction activities which involved the
erection of test structures and the move-
ment of large amounts of earth. Thus,
one would expect the radiological situa-
tion on this island to be exceedingly com-
plex and this was certainly borne out by
the survey. The geographical distributions
of the surface activities are relatively
heterogeneous. Elevated 23gPu, “Sr,
and 6o Co activities appear immediately
east and north of the crater; however,
137Cs seems to be most abundant within
the central portions of the present land
mass. Because of the complex situation,
no attempt was made to divide the iStand
into areas of dtstinct radiological con-
ditions. The activities of various radio-
nuclides distributed over the island to a
depth of 15 cm (including the beaches) are:
Radionuctide Activity, pCi/g
Mean Range
“Sr 30 5.9-570
239Pu 11 2.4 -280
6oco 5.4 0.12-520
137cs 3.2 0.22-41
Profile samples were collected at
numerous places throughout the island.
The resulting depth distributions of
activity also reveal the complexity of,the
situation. After a careful review of the
distributions, one may identify several
areas that show 239 Pu activities of about
100 pCi/g to depths as much as one meter
beneath the surface. The approximate
geographical distribution of these areas
is shown in Fig. 28.
JANET- This is the largest island
within the northern part of the Atoll.
Three nuclear devices were detonated on
the island. An enormous amount of con-
struction activity associated with the
weapons program and World War II
operations took place, as indicated by the
significant quantities of radioactive and
nonradioactive scrap scattered around
the island (refer to Engineering Survey
data), the bunkers, test structures, and
mounds of soil. In addition, an airstrip
was constructed along the northern side
-102-

n, d
I-
i
ire:
te
1t
er
Id
n
.-
I,~,K. 28. The shading denotes areas that show elevated levels of subsurface 239~~ contamination, IRENE.
,)(‘ the island. -4 major fraction Of the
is;Landfs surface is covered with dense
,.egetation; however, other areas,
especially along the northern side, are
more sparsely vegetated. Even these
are covered with some sort of ground
c.over.
The island was sampled extenstvely
ciuring this survey, partly because of its
past history, but principally because it
IS the most likely site in the northern
[Iart of the Atoll for habitation by the
returning native population. Surprisingly,
iii vtew of man’s past activities on the
Island, the soil radioactivities measured
in all of the lj-cm-deep surface samples
(excluding beach samples) closely follow
a lognormal distribution (as demonstrated
In Fig. 27), even though they were
collected throughout the island from areas
of widely differing vegetation densities.
The standard geometric deviations, on the
other hand, were somewhat greater than
“sual (2.8-3.0), indicating increased
variability in the measurements in relation
to similar measurements made on the
Other islands. The pertinent activities
exhibited by these surface samples are:
Radionucl!de Actlvtty, pet g)
ilIean Range
goS, 44 1.6-630
137Cs 16 0.57-180 23gpu 8.5 0.08- 170
6oco 1.0 0.02-33
. 90 The geographical distrtbutton oi Sr,
137 Cs, and 239 Pu do not show any
parttcular systematic pattern, but elevated 60 Co levels are observed preferentlall>
within the northeast corner of the Island.
The area Ls primarily north of the alrstrlp,
with a long finger extending south across
the alrstrlp and halfway across the island.
The mean activity within this area Ls about
a factor of 2-3 greater than that shown
above. These elevated actlvltles are
probably due to a surface ground zero
situated within the open area near the
beach, on the northeast corner of the
island.
The depth distributions of activity
were measured at 12 Locations on the
island to depths as great as 180 cm. AS
one would expect, considerable varlabillty
exists between the individual dlstrlbutlons.
However, some common features do exist.
Most of the distributions display a rel-
atively rapid decrease m activity wlthm
the top few centimeters (relaxation
lengths typically 3-10 cm) and subsequent
leveling off in activity with increasing
depth. Significant deviations from this
behavior, however, are observed at
several sites. At Location 147, the dis-
tributions reveal a layer of contaminated
material situated between 50 and 90 cm
below the surface. A similar feature, on
a smaller scale, was also noted at
Location 140. In addition, the depth
-103-

distrtbution at Location 143 LS essentially
homogeneous to a depth of 50 cm below
the surface.
KATE- This tsland contains rel-
atively open, sparsely vegetated areas
over a cons!derable portion of its tntertor
and along the lagoon and north sides. The
remainder of the tsland is covered with a
dense Lregetation cover. The activities
of interest with respect to these areas
are:
Radio - Activity, pCi /G nuclide Mean Range
Areas of dense vegetation
g0St- 67
137cs 24
23gPu 17
6oco 2.7
Areas of sparse vegetation
9OSr 11
137cs 4.8
23gPl_l 2.3
6oco 0.46
3.7-200
18-37
8.6-50
1.6-5.8
1.6-49
1.8-16
0.17-14
0.03-3.5
Aga Ln, considerable differences are
noted in the mean values corresponding to
the sparse and dense vegetated areas.
The depth distributions of activity do not
show grossly dissimilar characteristics
from those obtained from more pristine
areas, but they may not be entirely due to
environmental factors since earth grading
and building construction took place on
this island durtng the weapons-testing
program.
Its southern end. Since only a few SOit
samples were obtatned from this ltghtly
,;egetated area, it was necessary to treat
thus island as a single enttty. The tso-
exposure contours developed from the
aertal survey measurements, however,
reitect lower exposure rates over the
lightly vegetated area. The mean and
range of activities observed in soil
samples collected on this island are:
Radionuct ide Activity, pCi/g
Mean Range
9oSr 137Cs
23gpu
32 10-83
11 2.2-25
7.7 2.4-22
6oco 1.5 0.26-3.8
The profile samples generally reflect
a sharp decrease in activity within the
top 10 cm (relaxation lengths of about
5 cm) and a leveling off below this depth.
MARY- The distribution of radio-
activity seems fairly homogeneously
distributed throughout the island, with no
significant correlation between activity
levels and the degree of vegetation in the
vicinity of the sampling locations. The
mean and range of activities observed
over the entire island, excluding the
beaches, are:
Radionuclide Activity, pCi/g
Mean HaW
“Sr 29 1 l-140
137cs 9.9 5.6-26
23gPU 8.0 2.0-35
6oco 1.5 0.74-4.8
LUCY-This island is heavily
vegetated over most of its surface, with
somewhat lighter vegetation occurring on
Relatively minor construction activity
did take place on this island during the
- 104-

,il
tlY
rest
3-
rr
- :e -
83
25
22
3.8
ct
h.
)-
no
le
10
i
i
8
tcstlng perLod. The effects ci mis may
be reflected m the somewhat nomogeneous
dep~ distributions observed.
NANCY - This island is essentially
covered with dense vegetation over its
entIre surface. The radioact:vity seems
to be fairly homogeneously distributed
throughout the island. The activities of
the pertinent radionuclides are:
i{adlonuclide
“OSr
137Cs
‘X$u
GO CO
Activitv, pci/g Mean Range
36 16-110
12 6.0-28
9.1 2.3-28
1.6 0.56-5.3
The depth distributions display the
familiar rapid decrease of activity
immediately below the surface (relaxa-
tion lengths of 3-5 cm) at Locations 23,
24, and 25 situated within the island’s
interior. The distribution at Location 22
IS essentially homogeneous, as would be
expected because of its location on the
beach.
PERCY - This island is a small
sandbar with no vegetation on tt. Samples
obtained from six sampling locations show
the following activities:
Radionuclide
9OSr
137Cs 239
Pu
6oC0
Activity, pCi/g Mean Range
13 3.6-73
0.94 0.12-17
3.5 1.5-23
0.47 0.08-2.9
The depth distribution obtained from a
*ingle profile indicates that the maximum
activity ts situated 3-8 cm below the
- 105-
surface. This may have resulted from
weathering processes that have dtluted
the surface activity levels.
OLIVE - This tsland contatns dense
vegetation over most of its surface, with
the exception of a relatively sparsely
vegetated area toward the south end. The
sampling locations were divided tnto two
groups: (1) those within the sparsely
vegetated area on the south end and several
locations situated on the edge between the
vegetated area and the beach, and (2) those
wlthin the remainder of the island, where
the vegetative cover is reasonably dense.
The activities of interest in regard to these
areas are:
Radio- nuclide
Activity, pC i/g Mean Range
Areas of dense vegetation
“Sr 22 4.6-70
137cs 8.5 3.5-28
23gPu 7.7 2.2-30
6oco 1.5 0.65-4.1
Areas of sparse vegetation
“Sr 4.5 2.0-11
137cs 0.16 0.07-11
23gPu 2.8 1.9-4.1
6oco 0.11 0.05-0.3 1
The unusually large difference in the
mean values of the two groups of data
is probably due to the fact that (1)
samples collected on or near the edge of
the sparsely vegetated area to some
degree reflect the low activities on the
beach, and that (2) a significant portion
of the samples representing the densely
vegetated interior were collected in an

area somewhat toward the ocean side. show relaxation lengths, of the order,
According to the aertal survey measure- 5 cm, except at iocatlon -IS (near the
ments, the latter area had a slightly southeast end), where the soil activitl,
higher radiatton level than the rest of seem to be much more homogeneous H
the island. depth.
The depth distributions obtained within
the interior of the island, Locations 24,
25, and 26, are quite stmilar. Relaxation
lengths of about 5 cm are typical. The
distribution measured at Location 27 IS
essentially homogeneous as expected.
RUBY -This is a tiny island
situated tmmediately north of SALLY.
The activittes obtamed from five samp
lbcations are:
Activity, pCi/g mean Range Radionucltde
PEARL-Since this island contains
a surface ground zero, the radiological
analysks was based entirely upon the
measured soil activities wtthout regard
to the degree of vegetation. A review of
the data reveals a “hot spot” centered
around Locations 5, 6, 9, 10, and 11.
This is in reasonable agreement with the
aerial survey measurements, except for
the exact geographical location of the hot
spot. The mean and range of observed
activities for the hot spot and the re-
mainder of the island are:
Radio- nuclide
Activity, pCi/g Mean Range
Hot spot
g”Sr 62
l37cs 19
23gPu 51
6oco 12
Remainder of island
35-140
7.4-55
15-530
3.6-70
g”Sr 17 3.2-61
137c s 7.6 1.2-34
23gPu 11 0.85- 100
6oco 4.1 0.49-49
The depth distributions measured at
various locations throughout the island
12 7.1-f
1.4 0.7 1-T
7.3 3.0-5
0.93 0.29-I
The profile samples collected at
Location 2 indicate a homogeneous dis-
tribution of activity with depth.
SALLY - This island was the site
of several surface detonations. In add-
ition, the PACE Project had excavated
extensive areas throughout the island
during the past year. Since some of
these excavations centered around the
surface ground zeros and possible buriz
sites, it was difficult to devise a
meaningful and realistic soil survey.
Therefore, a decision was made to in-
clude only the undisturbed areas in the
sampling plan. The results of this effol
should not be regarded as a definitive
statement of the radiological conditions
this island, but only as an indication of
the activity levels that may be encountel
The pertinent activities obtained from tl
samples collected within the undisturbec
areas on SALLY and SALLY’S CHILD
are:
- 106-
--
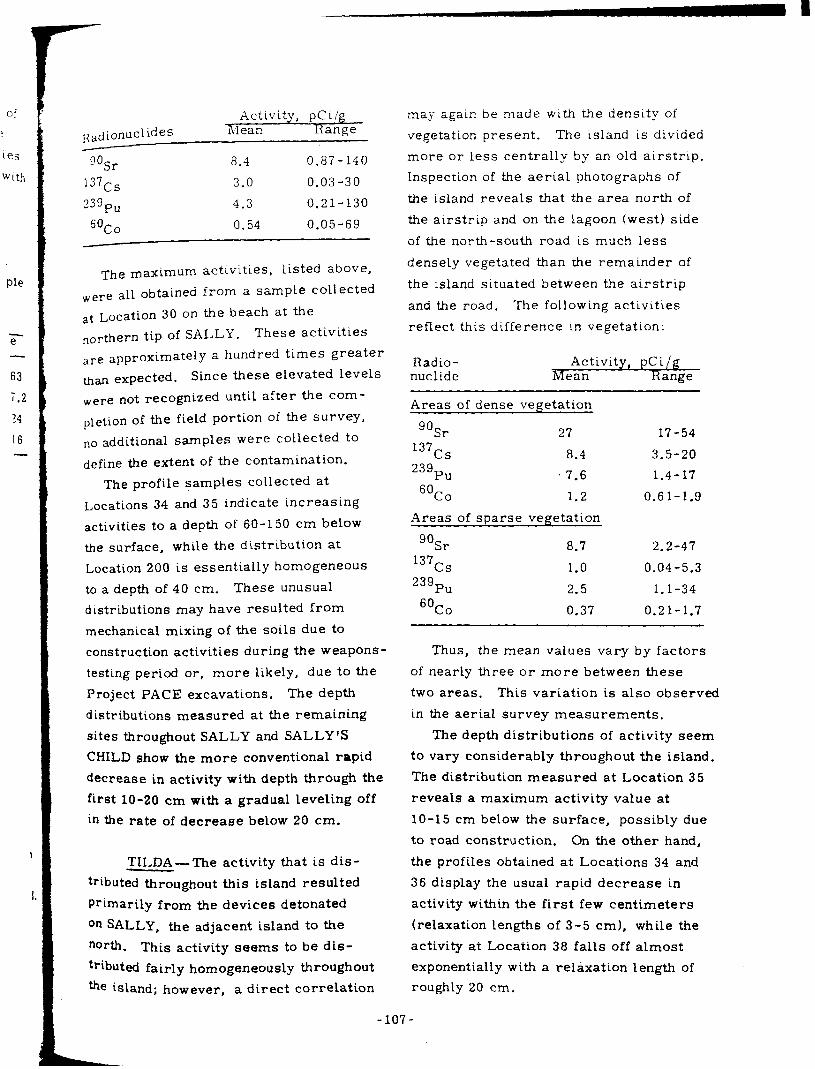
of 1
(es
with
Pie
z-
63
7.2
!4
16
[{ad ionucl ides
Activity, pCi/g -Mean Range
?OSr 8.4 0.87- 140
*%s 3.0 0.03-30
z39pu 4.3 0.21-130
6Oco 0.54 0.05-69
The maximum activities, listed above,
Were all obtained from a sample collected
at Location 30 on the beach at the
northern tip Of SALLY. These activities
are approximately a hundred times greater
thaws expected. Since these elevated levels
,,,ere not recognized until after the com-
pletion of the field portion of the survey,
no additional samples were collected to
define the extent of the COntaminatiOn.
The profile samples collected at
Locations 34 and 35 indicate increasing
activities to a depth of 60-150 cm below
t_he surface, while the distribution at
Location 200 is essentially homogeneous
to a depth of 40 cm. These unusual
distributions may have resulted from
mechanical mixing of the soils due to
construction activities during the weapons-
testing period or, more likely, due to the
Project PACE excavations. The depth
distributions measured at the remaining
sites throughout SALLY and SALLY’S
CHILD show the more conventional rapid
decrease in activity with depth through the
first lo-20 cm with a gradual Leveling off
in the rate of decrease below 20 cm.
TILDA-The activity that is dis-
tributed throughout this island resulted
Primarily from the devices detonated
On SALLY, the adjacent island to the
north. This activity seems to be dis-
tributed fairly homogeneously throughout
the island; however, a direct correlation
may again be made with the density of
vegetation present. The tsland is divided
more or less centrally by an old airstrip.
Inspection of the aerial photographs of
the island reveals that the area north of
the airstrip and on the lagoon (west) side
of the north-south road is much less
densely vegetated than the remainder of
the island situated between the airstrip
and the road. The following activities
reflect this difference in vegetation:
Radio- Activity, pCi/g nuclide Mean Range
Areas of dense vegetation
“Sr 27
137CS 8.4
23gPU 7.6
6oco 1.2
Areas of sparse vegetation
“5, 8.7
137cs 1.0
23gPll 2.5
6oco 0.37
17-54
3.5-20
1.4-17
0.61-1.9
2.2-47
0.04-5.3
1.1-34
0.21-1.7
Thus, the mean values vary by factors
of nearly three or more between these
two areas. This variation is also observed
in the aerial survey measurements.
The depth distributions of activity seem
to vary considerably throughout the island.
The distribution measured at Location 35
reveals a maximum activity value at
lo-15 cm below the surface, possibly due
to road construction. On the other hand,
the profiles obtained at Locations 34 and
36 display the usual rapid decrease in
activity within the first few centimeters
(relaxation lengths of 3-5 cm), while the
activity at Location 38 falls off almost
exponentially with a relaxation length of
roughly 20 cm.
-107-
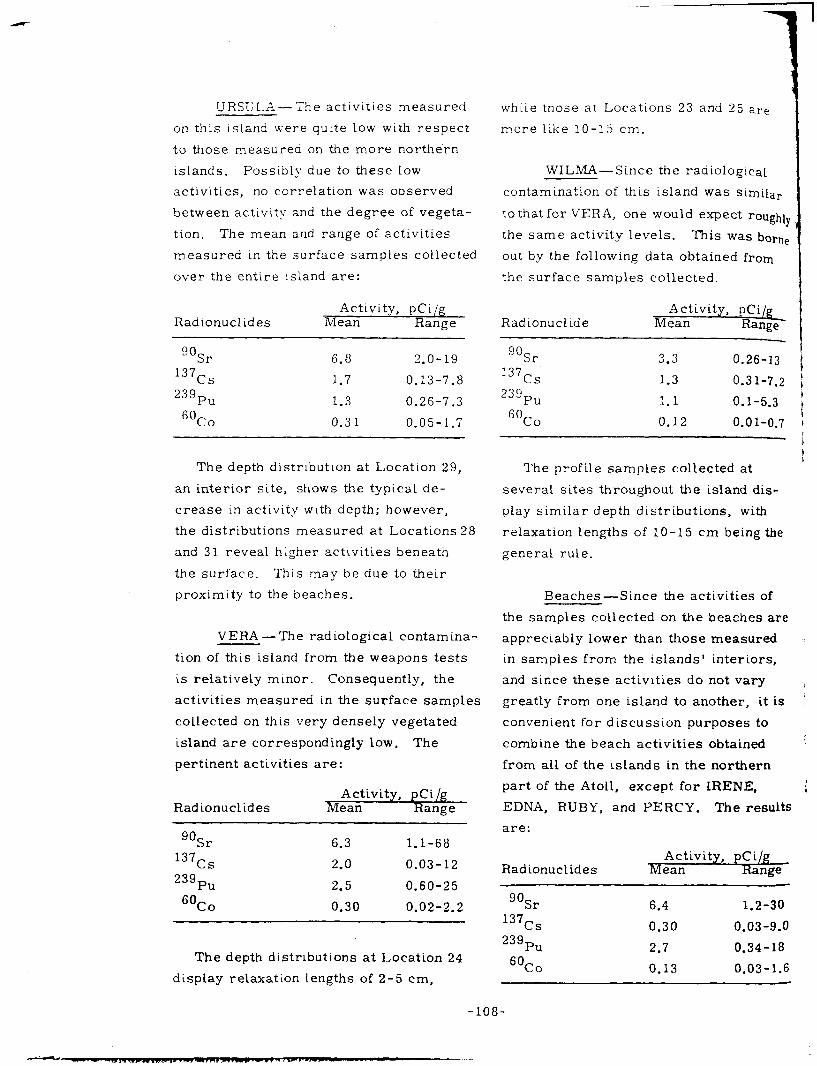
URSULA-The activities measured
on this island were quite low with respect
to those measured on the more northern
islands. Posstbly due to these low
activities, no correlation was observed
between activity and the degree of vegeta-
tion. The mean and range of activities
measured in the surface samples collected
over the entire island are:
Radionuclides Activity, pCi/g
Mean Range
9OSr 6.8 2.0-19
137CS 1.7 0.13-7.8
239Pu 1.3 0.26-7.3
6oco 0.3 1 o-05-1.7
The depth distribution at Location 29,
an interior site, shows the typical de-
crease in activity with depth; however,
the distributions measured at Locations 28
and 31 reveal higher acttvities beneath
the surface. This may be due to their
proximity to the beaches.
VERA -The radiological contamina-
tion of this island from the weapons tests
is relatively minor. Consequently, the
activities measured in the surface samples
collected on this very densely vegetated
island are correspondingly low. The
pertinent activities are:
Rad ionucl id es Activity, pCi/g
Mean Range
g”S, 6.3 1.1-68
137cs 2.0 0.03-12
23gPu 2.5 0.60-25
6oco 0.30 0.02-2.2
The depth distributions at Location 24
display relaxation lengths of 2-5 cm,
while those at Locations 23 and 25 are
more Like lo-15 cm.
WILMA-Since the radiologtcal
contamination of this island was similar
to that for VERA, one would expect roughl]
the same activity levels. This was borne
out by the following data obtained from
the surface samples collected.
Radionuclide Activity, pCi
Mean Ran&F
"Sr 3.3 0.26-13
137cs 1.3 0.3 l-7.2
239Pu 1.1 0.1-5.3
6oco 0.12 0.01-0.7 t )
1 t
The profile samples collected at
several sites throughout the island dis-
play similar depth distributions, with
relaxation lengths of 10-l 5 cm being the
general rule.
Beaches -Since the activities of
the samples collected on the beaches are
appreciably lower than those measured
in samples from the islands’ interiors,
and since these activities do not vary
greatly from one island to another, it is ’
convenient for discussion purposes to
combine the beach activities obtained
from all of the islands in the northern
part of the Atoll, except for IRENE,
EDNA, RUBY, and PERCY. The results
are:
i
Radionuclides Activity, pCi/g
Mean Range
-‘OSr 6.4 1.2-30
137cs 0.30 0.03-9.0
23gPu 2.7 0.34-18
6oco 0.13 0.03-1.6
-108-

I
re
11
.ilar
xghly
borne
3m
-13
-7.2
.5.3
-0.7
is-
:h
the
of
; are
.ed
rs,
Y
It is
0
j
n
‘g -
-30
-9.9
-18
-1.6 -
yVoNNE- Yvonne received the
,,,O.t severe radiologtcat dose of any ,1 ,<,ai,d within the Atoll. Eight nuclear
tcsts were conducted on the island, and
the close -in fallout patterns from an
,&jitlc)flaI 16 events intersected various
parts of the island. This fallout history,
;,li,s construction and decontamination
,,tivities conducted during and after the
testing period, have produced a rather
i,eterogeneous and unusual radiological
sltuation on the tsland.
To facilitate the sot1 survey, the
!sland was divided into two sections:
(1) the southern section consisting of the
area south of the bunker complex
(approximate center of YVONNE C
photograph), and (2) the area situated
north of the bunker (YVONNE A and I3
photographs). This division was based
upon a review of historical records, data
obtained from the aerial survey, and
data from previous ground surveys.
Indications were that these two sections
were quite distinct in their radiological
characteristics; it was expected that the
southern section would be only slightly
contaminated, while the northern section
would probably reveal elevated activity
levels with high geographical variability.
Southern YVONNE-A review of the
activities measured in the soil samples
collected on this section of the island
Indicates that the geographical distribu-
tion of activity within the top 15 cm is
rather uniform; however, somewhat higher
values appear preferentially within the
area immediately north of the runway
(see YVONNE figures in Appendix II).
The geometric mean and the range of
activities of selected radionuclides
measured within the top Is-cm layer are:
Radionuclides Activity, pCi/g
h?ean Range
“Sr 1.7 0.09-20
137cs 0.40 0.02-3.6
23gPu 3.2 0.02-50
6oco 0.64 0.01-20
The distributions of activity with depth
at Locations 33 and 34 show some ir-
regular variations with depth but generally
indicate reasonably homogeneous
characteristics. The distributions at
Locations 35 and 37, on the other hand,
indicate fairly rapid decreases in
activities with depth. This may be con-
trasted with those at Location 61, where
the activities actually increase with depth
by about a factor of five over those
measured at the surface.
Northern YVONNE - The complexity
of the radiological conditions on this
section of the island was produced by
several nuclear events. Most notable of
these is the QUINCE event (see Fig. 23
for approximate SGZ location), which
failed to produce a fission yield, with the
result that the plutonium within the device
was merely dispersed by the high explo-
sives. Some effort was expended shortly
after the event to decontaminate the area
by soil removal and the placement of
clean soil over the decontaminated area.
In spite of this decontamination effort,
considerable plutonium was still left
behind. Subsequently, a second nuclear
device was detonated over the same area.
Recent radiation surveys reveal that the
area is heterogeneously contaminated
-109-
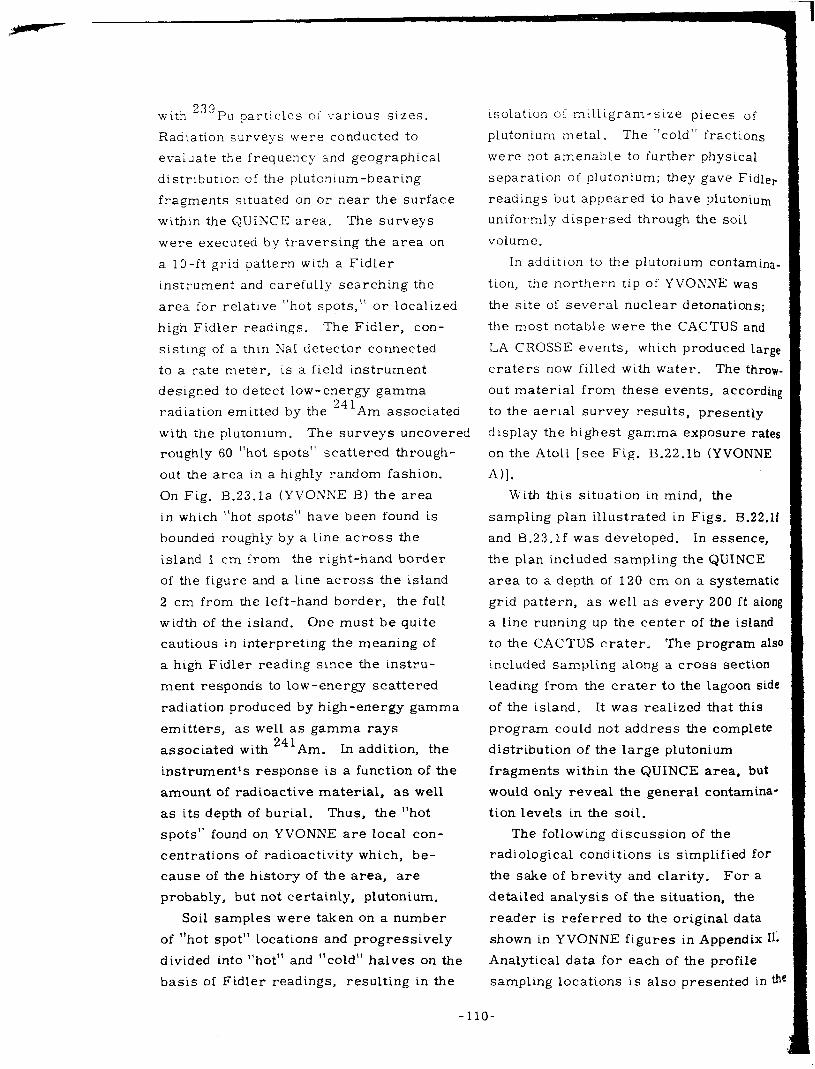
wick 239 Pu particles 0 i i-arious sizes.
RadLation surveys were conducted to
evaluate the frequency an d geographical
distrlbutton of the plutonLum-bearing
fragments situated on or near the surface
within the QUINCE area. The surveys
were executed by traversing the area on
a lo-ft grid pattern wtth a Fidler
instrument and carefully searching the
area for relative “hot spots,” or localized
high Fidler readings. The Fidler, con-
sistmg of a thin Nat detector connected
to a rate meter, is a field instrument
designed to detect low-energy gamma
radiation emitted by the 241 Am associated
with the plutonium. The surveys uncovered
roughly 60 “hot spots” scattered through-
out the area in a highly random fashion.
On Fig. B.23.la (YVOIWE B) the area
in which “hot spots” have been found is
bounded roughly by a line across the
island 1 cm from the right-hand border
of the figure and a line across the island
2 cm from the left-hand border, the full
width of the island. One must be quite
cautious in interpreting the meaning of
a high Fidler reading since the instru-
ment responds to low-energy scattered
radiation produced by high-energy gamma
emitters, as well as gamma rays
associated with 241Am. In addition, the
instrument’s response is a function of the
amount of radioactive material, as well
as its depth of burial. Thus, the “hot
spots” found on YVONNE are local con-
centrations of radioactivity which, be-
cause of the history of the area, are
probably, but not certainly, plutonium.
In addition to the plutonium contam&_
tion, the northern tip of YVONNE was
the site of several nuclear detonations;
the most notable were the CACTUS and
LA CROSSE events, which produced large
craters now filled with water. The throw.
out material from these events, according
to the aerial survey results, presently
display the highest gamma exposure rates
on the Atoll [see Fig. B.22.lb (YVONNE
A)].
With this situation in mind, the
sampling plan illustrated in Figs. B.22.lf
and B.23.lf was developed. In essence,
the plan included sampling the QUINCE
area to a depth of 120 cm on a systematic
grid pattern, as well as every 200 ft along
a line running up the center of the island
to the CACTUS crater. The program also
included sampling along a cross section
leading from the crater to the Lagoon side
of the island. It was realized that this
program could not address the complete
distribution of the large plutonium
fragments within the QUINCE area, but
would only reveal the general contamina-
tion levels in the soil.
Soil samples were taken on a number
of “hot spot” locations and progressively
divided into “hot” and “cold” halves on the
basis of Fidler readings, resulting in the
The following discussion of the
radiological conditions is simplified for
the sake of brevity and clarity. For a
detailed analysis of the situation, the
reader is referred to the original data
shown in YVONNE figures in Appendix 11.
Analytical data for each of the profile
sampling locations is also presented in the
110-
isolation of milltgram-sLze pieces of
plutonium metal. The “cold” fractions
were not amenable to further physical
separation of plutonium; they gave Fidler
readings but appeared to have plutonium
uniformly dispersed through the soil
volume.
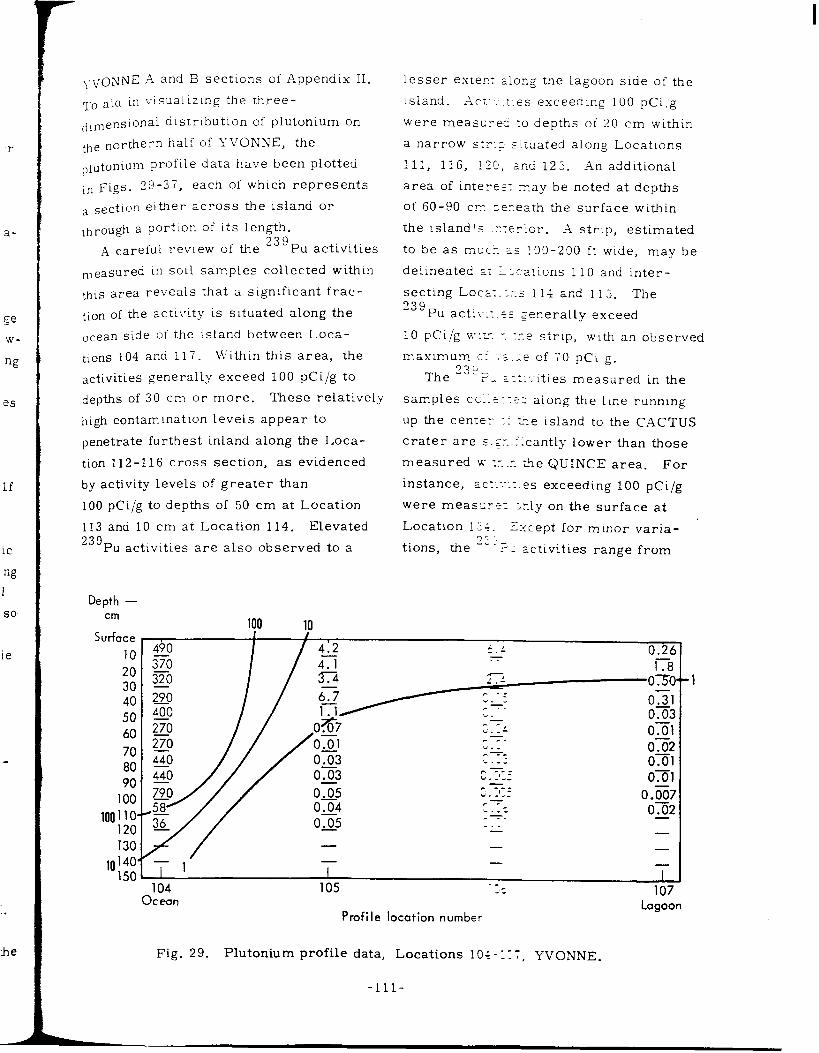
‘r
iC
ng
i
so
ie
. .
tie
),voNNE -4 and B secttons of Appendix 11.
~~ aid in l-lsualizmg the three-
,ilmensional dtstrtbution of plutonium on
be northern half of YVONNE, the
plutonium profile data have been plotted
,n Figs. 29-37, each of which represents
a section etther across the island or
through a portion Of its length.
_4 careful review of the 239
Pu activities
,,easured tn soil samples collected within
his area reveals that a stgnificant frac-
tlon of the activity is situated along the
ocean side of the island between Loca-
tlons 104 and 117. Ivithin this area, the
activities generally exceed 100 pCi/g to
depths of 30 cm or more. These relatively
high contamtnation levels appear to
penetrate furthest inland along the Loca-
tion 112-116 cross section, as evidenced
by activity levels of greater than
100 pCi/g to depths of 50 cm at Location
113 and 10 cm at Location 114. Elevated 239 PU activities are also observed to a
Depth -
cm
Surface
10
20
30
40
50
60
70
80
90
100
100 110, 120 130
10140' 150
lesser exrez: ;Lo~g the iagoon side of the
island. -Act:-.-.:-es exceeding 100 pCi,g
were meascre- 70 depths of 20 cm within
a narrow sir.2 s :ruated along Locations
111, 116, 170, ar:d 125. _An additional
area of interes; :ay be noted at depths
of 60-90 CI= ;eceath the surface within
the island’s .r.;er:or. _q strtp, estimated
to be as mccr. 2s :OO-200 ft wide, may be
deltneated ET L >cations 110 and inter-
secting Loc;:.:r.s 114 and 115. The 239 Pu activ!r.?s generally exceed
10 pCi/g w:-,T..Y. ?.e strip, with an observed
maximum ci -:Z.;e of 70 pCi,g.
The 239
?: k:::-.-Ities measured in the
samples ccl:?::t: along the ltne runnmg
up the center 1: r^.e island to the CACTUS
crater are s.,r.i:cantly lower than those
measured u‘.x._T. tie QUINCE area. For
instance, acr::.:.es exceeding 100 pCi/g
were meas:rf- ;?.ly on the surface at
Location ! ZL. Z:<cept for minor varia- 32;
tions, the - S_ zctlvities range from
- .-_ 1.8
-0XI - . ^.
IU4 IUD .z Ocean
107
Profile location number Lagoon
Fig. 29. Plutonium profile data, Locations lo&-::;, YVONNE.
-ill-
-1

‘. -
Depth -
cm
Surface
10
20
100 30.
10 40* 50
63
70
80 90
100
110
120
130
140
150
450
108
Ocean
Fig. 30. Plutonium profile data, Locations
Depth,
cm
100 10 10 100 ._ , _ . //i .I83 \ 2b \ 1An1
- - - I I I
110 111 109
Profile locstion number L ClgoOCl
108-111, YVONNE.
.
isi 3.8
0.95
0.75 0 16 -
--
0 .I%2 0.3 0 .&I3 0.01 - /
‘“” 112 113 114 115 116
Ocean Profile location number lagoon
Fig. 31. Plutonium profile data, Locations 112-116, YVONNE.
.
5 to 30 pCi/g within the top 30 cm between where activities range typically between
Locations 132 and 142. Slightly higher 10 and 150 pCi/g.
activities, however, were measured at With the exception of the CACTUS crater
Locations 143, 144, and 146, along the area, the activities of ‘O’S,, 137Cs, and
CACTUS crater-to-lagoon cross section, 60 CO seem to be fairly evenly distributed
-112-

-agoon
we*
rater
x-d
huted
140 -
1506 I 117
Ocean
- - - -
- - - -
I I I I 2
118 119 120 121
Lagoon
Profile location number
Fig. 32. Plutonium profile data, Locations 117 - 121, YVONNE.
Depth -
130 - - - - -
140 - - - - -
150 ’ I I I I \ 122 123 124 125 126
Ocean Protile location number Lagoon
Fig. 33. Plutonium profile data, Locations 122-126, YVONNE.
‘hroughout northern YVONNE. Generally, tude and usually range between 0.1 and the go Sr activities range between 1 and 2 pCi/g.
5 PCi/g within the top 50 cm and less than Within the CACTUS crater area, the
’ Pci/fZ beneath this depth. The activities mean surface activities of 9oSr, 13’Cs, of l37 Cs and 6o Co are similar in magni- and ” Co are generally an order of
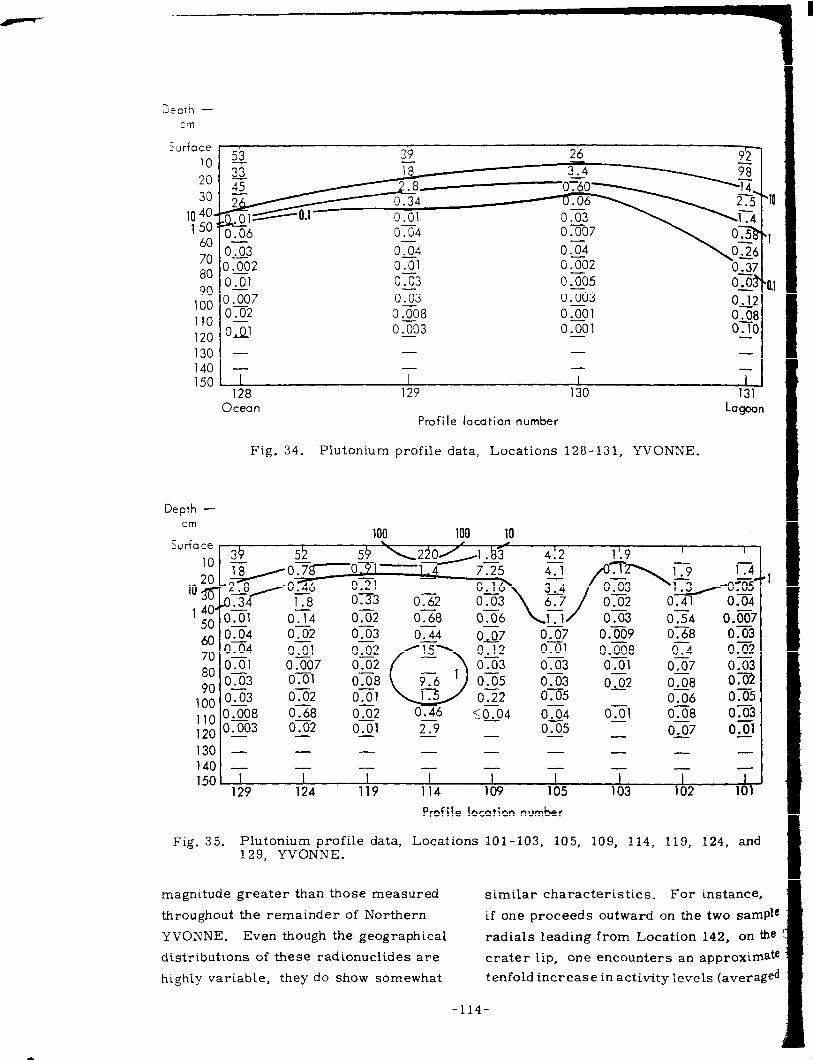
Surfa
‘00
1’0
‘20
‘30 140 ‘50
I OAQ’
0.03
0.03
0.008
o-663 -
I - - - - - - - -
I 1 I I 128 ‘29 ‘30 131
J
“0
‘1
0.1
Ocean Lagoon Profile location number
Fig. 34. Plutonium profile data, Locations 128-131, YVONNE.
Depth -
Cffl
; 0x4 7. 0.04 8. 0x1
90 OS 100 OS l1o 0.008 120 @??3
ox.1
0x2
0x8
032 -
0x3 074 o-37 0.07 0 xi69 OXI 0.03 I
0.03 o.J2 0.08 0.02
0x5 026 0.05
, 50.04 OX4 OX1 038 0.03 OX
0-C’ - 23 - --L - CI5 o-67 L 0.011
KG1 0.008
0.03 0.01
0.4 0.02 007 - 02
130- - - - - - - _ _
140_ - - - - - - - -
150- l I I I I I I I 1 129 124 119 114 109 105 103 102 101
Fig. 35. Plutonium profile data, 129, YVONNE.
Profile location number
Locations 101-103, 105, 109, 114, 119, 124, and
magnitude greater than those measured similar characteristics. For instance,
throughout the remainder of Northern if one proceeds outward on the two sample
YVONNE. Even though the geographical radials leading from Location 142, on the
distributions of these radionuclides are crater lip, one encounters an approximate
highly variable, they do show somewhat tenfold increase in activity levels (averaged
114-

5 10
i
b 1 9 ‘7
0.1
2
:
3n
Pie
he
ate
;ed
Depth -
cm 10 10 10 10 10 \ 1 l \
Profile location number
Fig. 36. Plutonium profile data, Locations 132-142, YVONNE.
Depth,
cm
130 - -
- - - -
CACTUS Crclter Profi ie locat ion number Lagoon
Fig. 37. Plutonium profile data, Locations 142-146, YVONNE.
over 120 cm depth) in the vicinity of Southern Portion of Atoll (SAM-LEROY)
Locations 141-140 and Locations 143- For discussion purposes, the islands 144. These activities fall off, however, within this portion of the Atoll have been
as one proceeds to Locations 139 divided into three groups. Group A
and 145. includes DAVID, ELMER, and FRED
-115-
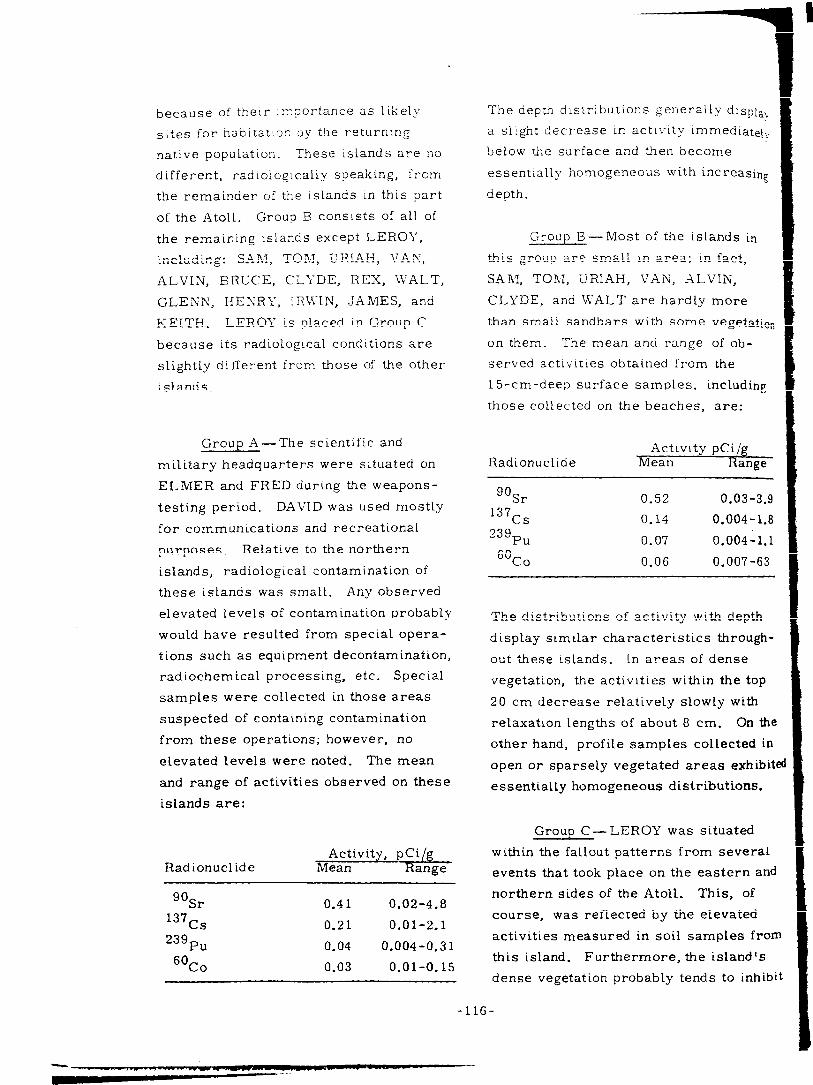
because of their :rr?ortance as like11
sites for habitat.or, oy the returning
native population. These islands are no
different, radtoioglcally speaking, from
the remainder of the tslands in this part
of the Atoll. Group B cons tsts of all of
the remaining tslands except LEROY,
including: SAXI, TOM, URIAH, VAN,
ALVIN, BRUCE, CLYDE, REX, iVALT,
GLENN, HEKRY, !RWIN, JAMES, and
KEITH. LEROY is placed in Group C
because its radiologtcal conditions are
slightly different from those of the other
islands.
Group A- The scientific and
military headquarters were s ttuated on
ELMER and FRED during the weapons-
testing period. DAVID was used mostly
for communications and recreational
purposes. Relative to the northern
islands, radiologLca1 contamination of
these islands was small. Any observed
elevated levels of contamination probably
would have resulted from special opera-
tions such as equipment decontamination,
radiochemical processing, etc. Special
samples were collected in those areas
suspected of containing contamination
from these operations; however, no
elevated levels were noted. The mean
and range of activities observed on these
islands are:
Radionuclide
“Sr 0.4 1 0.02-4.8
137CS 0.21 0.01-2.1
23gPU 0.04 0.004-0.31
6oco 0.03 0.01-O. 15
The depth distributions generally displa,,,
a sllghr decrease in actlvlty immediate\.,.
below *he surface and then become
essentially homogeneous with increasine
depth.
Group B-Most of the islands in
this group are small tn area; tn fact,
SAM, TOAI, URIAH, VAN, -ALVIN,
CLYDE, and KALT are hardly more
than small sandbars with some vegetation
on them. The mean and range of ob-
served activities obtained from the
15-cm-deep surface samples, including
those collected on the beaches, are:
Radionuclide Activity pCi/g
Mean Range
goS, 0.52 0.03-3.9
137Cs 0.14 0.004-1.8
23gpu 0.07 0.004-1.1
6oco 0.06 0.007-63
The distributions of activity with depth
display .sLm dar characteristics through-
out these islands. In areas of dense
vegetatton, the activtties within the top
20 cm decrease relatively slowly with
relaxation lengths of about 8 cm. On the
other hand, profile samples collected in
open or sparsely vegetated areas exhibit
essentially homogeneous distributions.
Group C- LEROY was situated
within the fallout patterns from several
events that took place on the eastern and
northern sides of the Atoll. This, of
course, was reflected by the elevated
activities measured in soil samples fror!
this island. Furthermore, the island’s
dense vegetation probably tends to inhibi
-116-
- -.

display
ed lately
e
reasing
ds in
ict,
v:,
ore
getation
ob-
e
luding
e:
,03-3.9
104-1.8
104-1.1
07-63
epth
-oughs
se
3 top
Jith
Onth
ted ir
xhibi
)ns.
ed
.eral
n ar
of
ed
L fr
Id’E
nh
Ci,lutLOn of the activities by envtronmental
pr0cesses. The activities obtained from
the i5-cm -deep surface samples are:
IxI1tiionuclide -
90Sr
1j7Cs
?39Pu
6Oco
Activtty pCi/g Mean Range
11 1.6-34
3.2 0.5-10
0.63 0.02-2.0
0.58 0.04-5.0
These mean activities are roughly ten
times greater than those observed on the
other islands in the southern part of the
Atoll. The depth distributions of activity
measured at three locations within the
Interior of the island exhibit very gradual
decreases in activity with depth. Relaxa-
tion lengths of 10 cm or greater are
typical.
EXTERNAL DOSE ESTIMATES
II. L. Beck and J. E. McLaughlin Health and Safety Laboratory USAEC, New York, New York
P. H. Gudiksen and D. E. Jones Lawrence Livermore Laboratory Livermore, California
0. 0. T. Lynch, Jr. Nevada Operations Office USAEC, Las Vegas, Nevada
T. P. Stuart EC&G, Inc. Las Vegas, Nevada
Introduction
Our objective was to quantitatively
assess the total external dose that the
returning native population might receive
as a result of the radiological contamin-
ants distributed in the environs Of the
Enewetak Atoll. Since the external dose
is almost entirely due to the gamma-
emirting radionuc!:des. .:.-lth onl\- minor
contrtbutions from alpha and beta emitters,
it was essential to obtain the best possible
description of the geographical i,ariability
of the gamma exposure rates in air on
each island of the _L?toll. These data, in
conjunction with pertinent population
statistics and expected life style, will
enable us to make realistic estimates of
the external dose to the future inhabitants.
Several independent techniques were
used to measure these esposure rates,
since each technique has its own set of
1imi:ations (i. e. nonlinear energy response,
portability of equipment, and estent of
geographical coverage). \5ie used results
from the following techniques to satisfy
the objective: ground measurements made
with the use of a portable, hand-held
Baird-Atomic NaI scintillation detector,
two types of thermoluminescent dosimeters
(TLD), and a helicopter-borne NaI de-
tector array (aerial survey). The first
two techniques are discussed below, while
the details and results of the aerial survey
are discussed m a separate chapter of
this report. A comparison of the results
obtained by these techniques and the use
of the results in the population dose compu-
tation is included in the following
discussions.
Measurement Techniques
Ground Measurements Made With Baird-Atomic NaI Detector
This instrument is a transistorized,
hand-held portable ratemeter sensitive to
gamma radiation. It consists of a photo-
multiplier tube optically coupled with a
NaI crystal, electronic circuits, meter,
associated range selector, and two “D”
117-
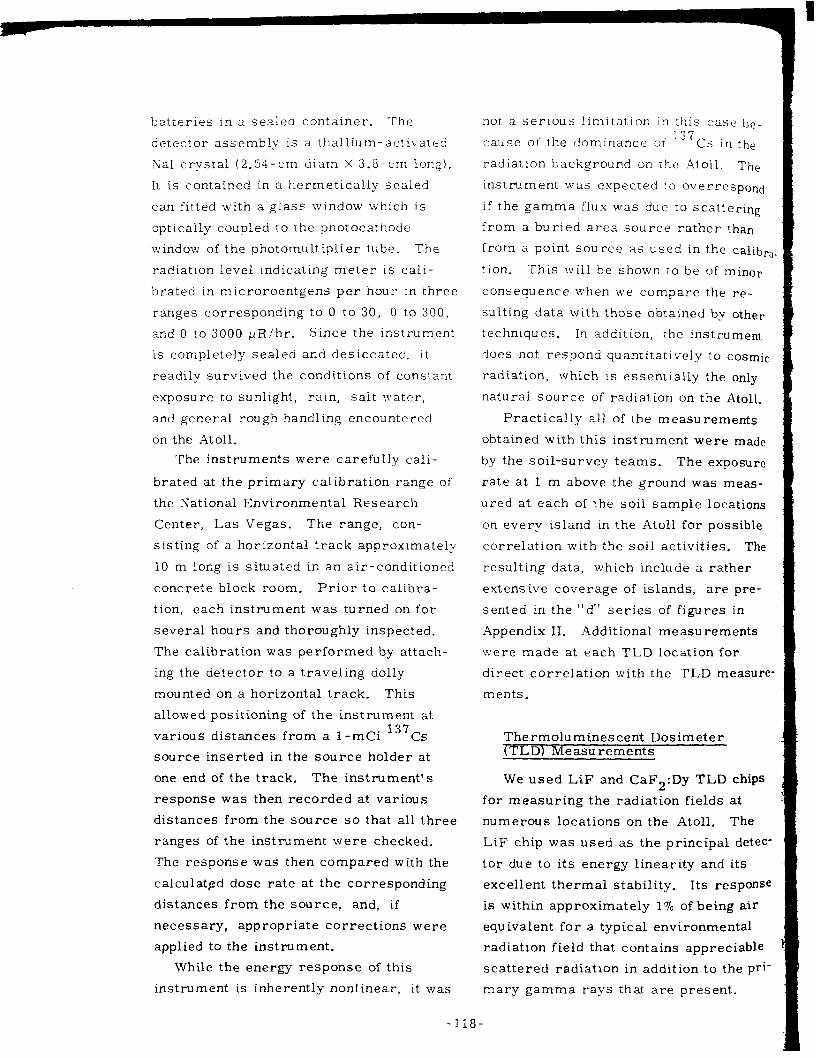
batteries in a sealed container. The
detector assembly is a thallium-activated
NaI crystal (2.51-cm diam X 3.3-cm long).
It is contained in a hermetically sealed
can fitted with a glass window which is
optically coupled to the photocathode
window of the photomultiplier tube. The
radiation level indicating meter is cali-
brated in microroentgens per hour in three
ranges corresponding to 0 to 30, 0 to 300,
and 0 to 3000 pR/hr. Since the instrument
is completely sealed and desiccated, it
readily survived the conditions of constant
exposure to sunlight, rain, salt water,
and general rough handling encountered
on the Atoll.
not a serious limitation in :his case be_
cause of the dominance 01’ ls7Cs in the
radiation background on rhe -4toll. The
instrument was espected :o overrespond
if the gamma flux was due ro scattering
from a buried area source rather than
from a point source as used in the calihr,.
t ion. This will be shown to be of minor
consequence when we compare the re-
sulting data with those obtained by other
techniques. In addition, the instrument
does not respond quantitatively to cosmic
radiation, which is essentially the only
natural source of radiation on the Atoll.
The instruments were carefully cali-
brated at the primary calibration range of
the xational Environmental Research
Center, Las Vegas. The range, con-
sisting of a horizontal track approximately
10 m long is situated in an air-conditioned
concrete block room. Prior to calibra-
tion, each instrument was turned on for
several hours and thoroughly inspected.
The calibration was performed by attach-
ing the detector to a traveling dolly
mounted on a horizontal track. This
allowed positioning of the instrument at
various distances from a 1-mCi 137Cs
source inserted in the source holder at
one end of the track. The instrument’s
response was then recorded at various
distances from the source so that all three
ranges of the instrument were checked.
The response was then compared with the
calculated dose rate at the corresponding
distances from the source, and, if
necessary, appropriate corrections were
applied to the instrument.
Practically all of the measurements
obtained with this instrument were made
by the soil-survey teams. The exposure
rate at 1 m above the ground was meas-
ured at each of the soil sample locations
on every island in the Atoll for possible
correlation with the soil activities. The
resulting data, which include a rather
extensive coverage of islands, are pre-
sented in the ‘Id” series of figures in
Appendix II. Additional measurements
mere made at each TLD location for
direct correlation with the TLD measure-
ments.
Thermoluminescent Dosimeter (TLD) Measurements
While the energy response of this
instrument is inherently nonlinear, it was
We used LiF and CaF2:Dy TLD chips
for measuring the radiation fields at
numerous locations on the Atoll. The
LiF chip was used as the principal detec-
tor due to its energy linearity and its
excellent thermal stability. Its response
is within approximately 1% of being air
equivalent for a typical environmental
radiation field that contains appreciable
scattered radiation in addition to the pri-
mary gamma rays that are present.
-1 18-

.)C -
he
‘he
and
“g
n
libra.
or
ier
:nt
tnic
Y
Il.
5
de
re
3-
ns
le
he
re-
;e
i-
.i.~,urefore, the resul7s deri\ved from the
i,ik. rrLD~ were chosen as a reference to
,vt,ic]l measurements obtained by zhe other
tccllniques could be compared, The CaF2
,r~,l)s have an enhanced energy response
nt 10~4~ energies and were used to detect
possible low-energy radiation fields. A
,.omparison of their signals with those
from the LiF TLDs may provide an indi-
,~ntion of the presence of an unsuspected
concentration of low-energy radiation.
i.‘or a typical radiation field, the CaF2
~~~~,l)s were expected to overestimate the
i)ose rate to air by approsimately 30 to
10”:~.
The LiF and CaF2 chips (1 /E-in.
square X 0.035-in. and 0.040-in. thick,
respectively) were carefully selected by
thermoluminescent
Fig. 38. Field placement of TLD’s with enlarged view of TLD packet.
-119-
I
a process of annealing, followed by
irradiation to a common total esposure.
Subsequent readout then allowed the
extraction of defective chips. The TLDs
were transported to Enewetak and annealed
on the Atoll immediately prior to being
placed on the seven outlying islands that
were selected for the TLD program. Two
LLL plastic personnel badges containing
three LiF and three CaF2 chips were
placed at each field location. The TLD
packets were attached by two nails and a
nylon strap to small tree limbs at a
height of 1 m above the ground (Fig. 38).
Each location was marked with copious
quantities of fluorescent tape and paint
to facilitate retrieval of the TLDs after
the 3-l/2-mo exposure period. The
locations were carefully chosen to obtain
a representative sampling of the terrain
(i. e., densely and sparsely vegetated
areas and areas adjacent to sandy beaches).
Upon retrieval each TLD packet was
immediately placed in a lead container
and handcarried to LLL where it was
stored in a lead container in an under-
ground, radiation-counting facility. Each
chip was individually read on the LLL,
hot-nitrogen, automatic TLD chip reader”’
which was interfaced to a PDP-11 compu-
ter. In this way a catastrophic reader
failure would only reduce the precision of
the answer and would not result in the
total loss of data from any badge. This
technique also eliminated undetected
errors due to drift in reader sensitivity.
xK. F. Petrock and D. E. Jones “Hot Nitrogen Gas for Heating Thermolu’mi- nescent Dosimeters,” in Proceedings of the Second International Conference on Luminescent Dosimetry (Gatlinburg, Tenn., 1968).
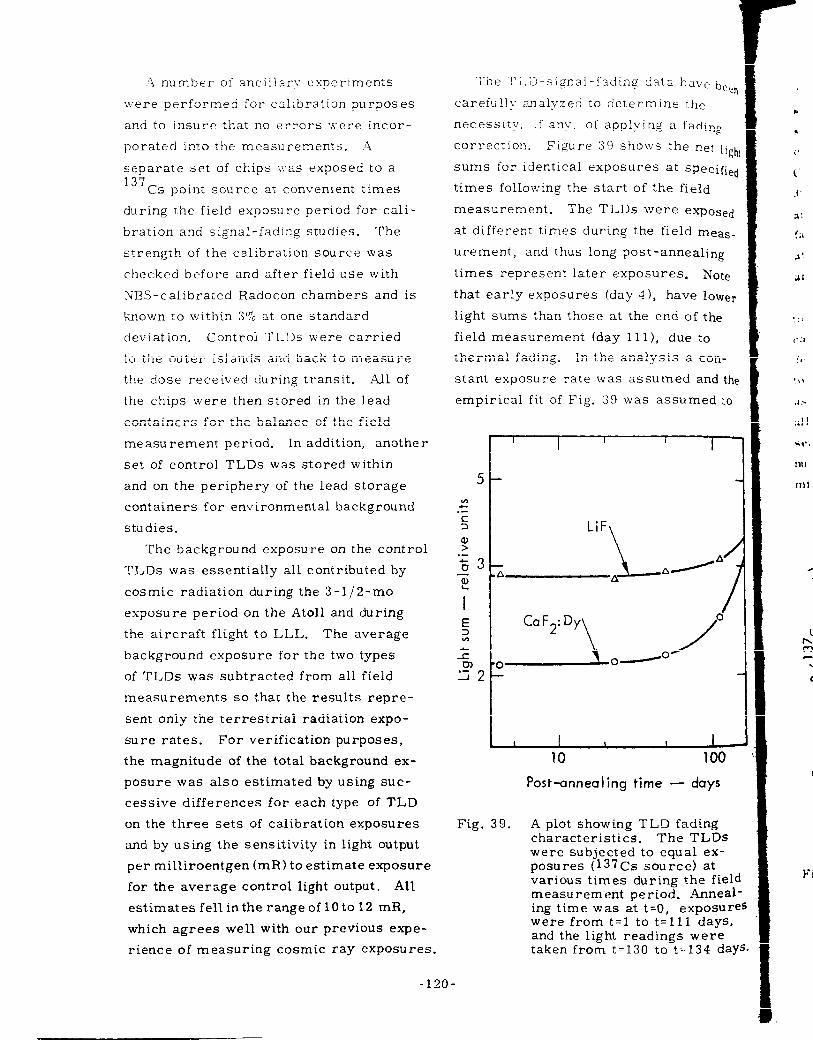
!I number of ancillary cspet-lments
were performed for calibration purposes
and to insure that no errors were incor-
porated into the measurements. _A
separate set of chips \I:as exposed to a 137
Cs point source at convenient times
during the field exposure period for cali-
bration and signal-fading studies. The
strength of the calibration source was
checked before and after field use with
NBS-calibrated Radocon chambers and is
known to within 3% at one standard
deviation. Control TLDs were carried
to the outer islands and back to measure
the dose received during transit, All of
the chips were then stored in the lead
containers for the balance of the field
measurement period. In add it ion, anot he r
set of control TLDs was stored within
and on the periphery of the lead storage
containers for environmental background
studies.
The background exposure on the control
TLDs was essentially all contributed by
cosmic radiation during the 3-l/2-mo
exposure period on the Atoll and during
the aircraft flight to LLL. The average
background exposure for the two types
of TLDs was subtracted from all field
measurements SO that the results repre-
sent only the terrestrial radiation expo-
sure rates. For verification purposes,
the magnitude of the total background ex-
posure was also estimated by using suc-
cessive differences for each type of TLD
on the three sets of calibration exposures
and by using the sensitivity in light output
per milliroentgen (mR 1 to estimate exposure
for the average control light output. All
estimates fell in the range of 10 to 12 mR,
which agrees well with our previous expe-
rience of measuring cosmic ray exposures.
-120-
The TLD-signal-fading data have h
carefully analyzed to determine the
necessity, if any, of applying a fading
correction. Figure 39 shows the net 1
sums for identical exposures at specif
times following the start of the field
measurement. The TLDs were expos
at different times during the field mea
urement, and thus long post-annealing
times represent later exposures. Not
that early exposures (day 41, have low
light sums than those at the end of the
field measurement (day 11 l), due to
thermal fading. In the analysis a con
stant exposure rate was assumed and
empirical fit of Fig. 39 was assumed:
LiF
\
a I AlA A
-4----h Post-annealing time - days
Fig. 39. A plot showing TLD fading characteristics. The TLD; were subjected to equal ex- posures (137Cs source) at various times during the fil measurement period. Anne ing time was at t=O, exp0St were from t=l to t=lll day and the light readings were taken from t=130 to t:134 d
eld Lal- 1 res S,
lays.
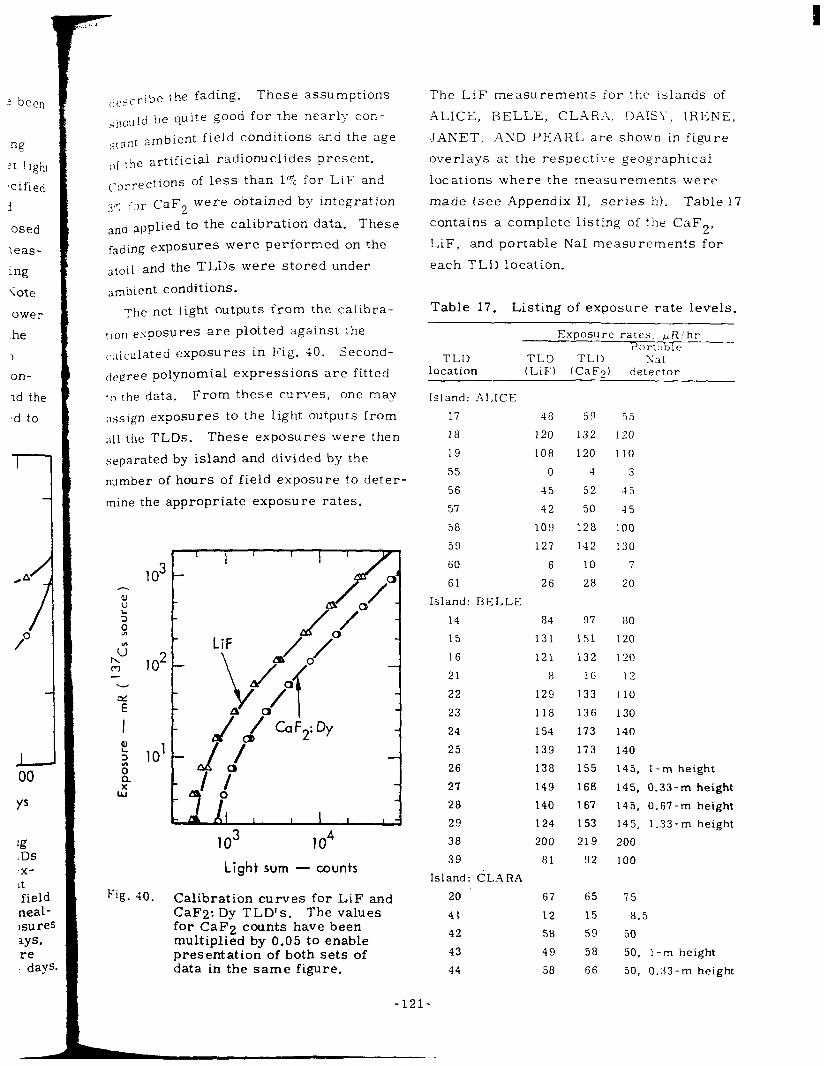
“g
?t light
,cified
1
osed
leas-
;ng
Kate
ower
.he
1
on-
Id the
‘d to
,A’
/
/”
YS
uz .Ds ,X-
It
field neal- 1su I-e 3ys,
.7say!
,icscribe the fading. These assumptions
5i10uld be quite good for the nearly con-
srnr,t ambient field conditions and the age
‘,f the artificial radionuclides present.
Corrections of less than 1% for LiF and
.~{l’ .1 ior CaFZ were obtained by integration
and applied to the calibration data. These
fading exposures were performed on the
atoll and the TLDs were stored under
ambient conditions.
The net light outputs from the calibra-
tloll exposures are plotted against the
c.;iiculated exposures in Fig. 40. Second-
if(>,pree polynomial expressions are fitted
IO the data. From these curves, one may
;lssign exposures to the light outputs from
~11 the TLDs. These exposures were then
separated by island and divided by the
number of hours of field exposure to deter-
mine the appropriate exposure rates.
aJ u
;
4
IO3 104
Light sum - counts
Fig. 40. Calibration curves for LiF and CaF2: Dy TLD’s. The values for CaF2 counts have been multiplied by 0.05 to enable presentation of both sets of data in the same figure.
-121-
The LiF measurements for the islands of
ALICE, BELLE, CLAR.A. DAISY, IRENE,
JANET, AKD PEARL are shown in figure
overlays at the respective geographical
locations where the measurements were
made (see iZppendix II, series h). Table l’i
contains a complete listing of the CaF2,
LiF, and portable Nal measurements for
each TLD location.
Table 17. Listing of exposure rate levels.
Exposure rates, pli’hr Porrlibltt
TLD TLD TLI) Tat location (LiF) (CaF2) detector
Island: ALICE
: I3ELLE
17
18
19
55
56
57
58
59
60
61
Island
14
15
16
21
22
23
24
25
26
27
28
29
38
39
Island: CL-4 RA
20
41
42
43
44
67
12
58
49
58
48 59
120 132
108 120
0 1
45 52
42 50
109 128
127 142
6 10
26 28
a4 97
131 151
121 132
8 16
129 133
118 136
154 173
139 173
138 155
149 168
140 167
124 153
200 219
81 92
65 75
15 8.5
59 50
58 50, l-m height
66 50, 0.33-m height
55
120
110
35
45
100
130
7
20
110
130
140
140
145, l-m height
145, 0.33-m height
145, 0.67-m height
145, 1.33-m height
200
100
I
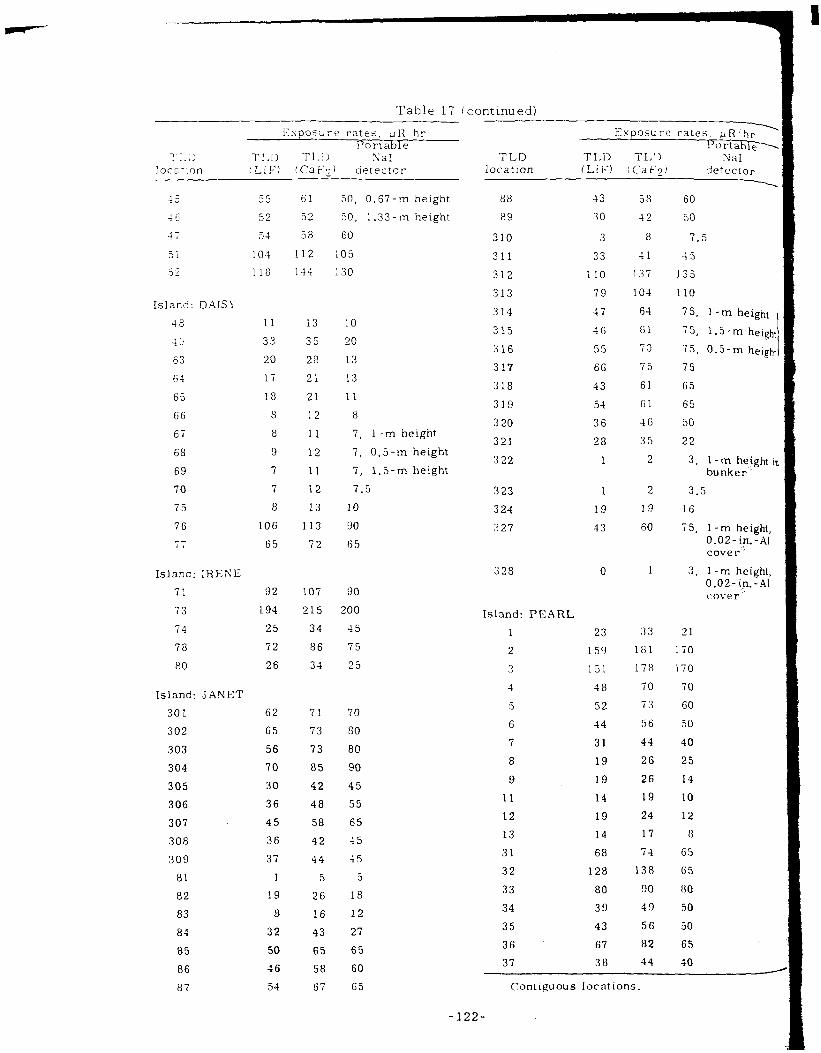
Table 17 (continued)
Espos,~;re rates, UK hr Portable
Exposure rates. pR,hr ’ P~~x-tabl>
T I,11 TLii NaI TLD TLIJ TLI) NaI ~_ (LlF‘l IC3I.‘21 detector location (LiF) (CaF21 detector
\ . _
1; 55
45 52
-1; 54
51 104
r .- 3L 118
61 50, 0.67-m height 88 -13
52 50, 1.33-m height 89 30
5a GO 310 3
112 105 311 33
l-ll : 30 312 110
58
42
a
41
137
104
64
61
70
75
61
Gl
16
35
2
60
50
7.5
45
135
110
75, l-m height
75, 1.5-m height
75, 0.5-m heigb
75
65
G5
50
22
3, 1 - m hqight id. bunker’
3.5
16
75, l-m height, 0.02-in-Al cover ‘.
3, l-m height, 0.02-in.-AI cover
Islard: DAIS\
-&a
11
63
64
65
66
67
68
69
70
75
76
77
Island: IRENE
7:
73
74
78
80
Island: .JANET
301
302
303
304
305
306
307
308
309
81
a2
83
84
85
86
87
11
33
20
17
18
a
a
9
I
7
a
106
65
92
194
25
72
26
62
65
56
70
30
36
45
36
37
1
19
8
32
50
46
54
13
35
28
21
21
12
11
12
11
12
13
113
72
107
215
34
86
34
71
73
73
a5
42
48
58
42
44
5
26
16
43
65
58
67
10
20
13
13
11
a
7, l-m height
7, 0.5-m height
7, 1.5-m height
7.5
10
90
65
90
200
45
75
25
70
80
80
90
45
55
65
-l5
45
5
18
12
27
65
313
314
315
316
317
318
319
320
321
322
79
37
-16
55
66
43
54
36
28
323 1
324 19
327 33
328 0
Island: PEARL
1 23
2 159
3 151
4 48
5 52
6 44
7 31
a 19
9 19
11 14
12 19
13 14
31 68
32 128
33 80
34 39
35 43
36 67
cn 37 3a
2
19
60
1
3 3
1 a 1
178
70
7 3
56
44
26
26
19
24
17
7-l
13R
SO
49
56
a2
44
21
170
170
70
60
50
40
25
14
10
12
a
G5
ti 5
ii0
50
50
65
40 “Y
65 Contiguous locations.
-122-
-m height
.5-m height
.5-m height
-1-n height in lnker
-m height, .02-in.-Al >vei
-m height, 02- in.-Al )ve r
-
1
tI ,tatistical analysis was performed
,i, ,),termine the accuracy of the TLD re-
<l~iiS. lvithin the range of 30 to 50 pR/hr,
!,,(, accuracy of the exposure rates is con-
,G,>r.,,,atively estimated to be 4% for CaF2
,,!,ti 6”~ for LiF at one standard deviation.
i ~)I‘ the CaF2 results, this estimate
does not include the nonrandom error
due to the nonlinear energy response.
j..or very low exposure rates the error
i,t,comes much larger, especially in re-
,,;ird to the LiF data. This is due to the
,G,li,traction of the relatively large back-
Ground, the increased variability of the
ii:lta at low exposure rates, and the
,.mnirical fitting technique that forces the
i,t:st fit at the higher exposure rates. For
Instance, at an exposure rate of 4 pR/hr
the LiF results are considered to be
;tccurate to approximately 40%; the rela-
tive precision is considerably better.
Aerial Radiological Survey
The details of this survey, including
results, are provided in a separate
chapter of this report. In essence, gamma
rays were detected by a helicopter-borne
;Irray of 40 NaI detectors flown over each
island on a 150-ft grid spacing. An
Irll’rtial navigation system provided position
coordinates. The output from the detectors
was analyzed according to pulse height and
recorded along with the position data on
magnetic tape. The tape was processed
On a ground-based computer to produce a
“erY detailed mapping of the iso-exposure
rate ContOUrS at 1 m above the ground for
(!ach island in the Atoll.
<3omparison of Results
Recause the LiF TLD has excellent
thermal stability and its response is
1
essential!\7 air equiva.lent, the LiF meas-
urements are considered to be the most
accurate measure of the gamma exposure
rates at the limited number of sites where
TLDs were placed. and, therefore are
used as the reference to which all the other
measurements are compared. How ever,
when making comparisons between re-
sults obtained with various techniques,
one must be careful to avoid comparing
measurements that are entirely different
in nature. For instance, the radiation
field measured by the TLDs and portable
NaI detector is very local in nature (the
order of a few square meters), while that
measured by the aerial system is of the
order of hundreds of square meters. Thus,
local radiation gradients are averaged
over large areas by the aerial system,and
the results obtained from specific areas
may be quite different from those obtained
by the TLDs and portable survey meters.
The comparison, shown in Table 18,
specifically excludes areas exhibiting
steep radiation gradients so that the TLD
and portable-survey-meter measurements
may be considered representative of an
area of several hundred square meters.
With this in mind the TLD locations in
Table 18 were selected from areas of
uniform exposure rates in the interiors of
ALICE, BELLE, DAISY, and JANET.
Inspection of the data in Table 18 reveals
that the LiF measurements are approxi-
mately 17% less than those of CaF2. This
is reasonable in view of the enhanced
energy response of CaF2 at low energies.
This expected relative difference between
the results of the two types of TLDs also
gives added credence to the LiF measure-
ments. The table also reveals that the
aerial survey measurements and the
23-

Table 15. Cornpa:-:son of the gamma-ra?- esposure _ rates (pR hri obtained at selected :ocatlo:x bv the x-arlous techniques.
Exposure rate, UR /hr TLD (I_iF)
Exposure rate, piR .‘hr Portable Portable TLD T L D T L D TLU (LtF) SaI NaI rlerlal TLD (LiF)
Island location 1 L:F) (CaFp) TLD (CaF2) detector detector su r\rev .&erial SU rvey
DAISY 19
63
64
65
77
.I AnTET S5
86
87
88
89
301
302
303
304
305
306
307
308
309
312
313
317
318
319
320
321
Average ratios
59 0.81 55 0.8-i 56 0.85
132 0.91 120 1.0 81 1.48
52 0.87 45 1.0 3s 1.21
128 0.85 100 1.09 121 0.89
l-12 0.89 130 0.98 121 1.04
0.97 110 1.17 101 1.28
0.87 130 0.91 121 ‘0.97
o.s9 140 1.10 149 1.04
0.80 l-10 0.99 119 0.93
0.91 ‘00 1 ,oo 122 1.64
0 . 8 :I 100 0 * 8 1 81 1.00
0.94 20 1.65 2 s 1.30
0.71 13 1.54 25 0.79
0.81 13 1.31 17 0.99
0.86 11 1.64 17 1.04
0.90 65 1 .oo 5G l.lG
65 0 .7-i 65 0.77 1 3 1.17
5 8 0.79 GO 0.77 -13 1.07
67 0.81 65 0.83 43 1.26
s 8 0.74 60 0.72 3G 1.21
12 0.71 50 O.GO 3 8 0.79
71 0.87 70 0.89 13 1.45
72 0.89 30 0.81 46 1.41
73 0.77 80 0.70 54 1.04
85 0.82 90 0.78 52 1.34
42 0.71 -15 0.6’i 40 0.75
48 0.75 55 0.65 55 0.66
58 0.78 65 0.69 52 0.87
42 0.86 45 0.80 35 1.04
44 0.84 45 0.82 28 1.34
137 0.80 135 0.81 87 1.27
104 0.76 110 0.76 70 1.13
75 0.88 75 0.88 43 1.54
61 0.70 65 0.66 43 1.00
61 0.89 65 0.88 43 1.26
46 0.78 50 0.72 40 0.90
35 0.80 22 1.27 32 0.88
0.83 f 0.07 0.93 zk 0.26 1.10 i 0.28
-124-
!
‘t Eii
. -1 G
-
-
./ ,..::li)l(X ya1 detector results agree, on
. I .I ,,\ cI-;lge, v.fithin about 10’5 with the LIF
::.,,l,i5il wmf=ts. This is within The accu-
:,,i‘,~ of the measurements and the agree-
_,,hi is considered excellent. On the
i,;i5,:: (,f this comparison and because of
i,c ,,htensive geographical coverage, we
;,,?I that the aerial measurements provide
,, elost complete and accurate description “1,’
cl: -he gamma exposure rates throughout
Zj:e entire _AtOll. Therefore, we feel
,;:,:lfied in using these data as a basis for
I, .ermi~~ing the external dose to the re-
‘!: rning population.
i;sternal Dose Determination
in addition to the gamma-ray exposure
rat es, one needs to consider the expected
living patterns of the future inhabitants in
order to evaluate the external dose
Problem. Due to the uncertainties in-
herent in predicting future living patterns,
seseral cases were chosen for analysis.
‘I‘hese are presented in Table 19. The
selection of these cases was based upon
:Ile most recent information available
regarding present population figures, age
clistributions, and expected life styles
(see The Enewetak Atoll People, p. 25).
f+rthcrmore, the cases were chosen in
such a manner as to bracket the most
likely range of doses which could be re-
ceived by any sizable segment of the
PoPulatlon. This will allow any other
reasonable pattern to be inferred by proper
interPolation of the results obtained for
the cases shown in Table 19.
The first four cases are based upon
the assumption that some fraction of the
Population may choose to reside primarily
O~JANET (the largest island within the
“orthern part of the Atoll), with the re-
mainder residing on FRED, EL;\lER, or
DAVID in the southern group of islands.
Each case under consideration allows for
visits to other islands. Case Ib differs
from case Ia in that more time is allotted
to temporary occupation of islands other
than JANET at the expense of less time
being spent in the JANET village area.
These cases, or combinations thereof,
are considered to represent the most
likely living patterns.
Case V. on the other hand, represents
a “worst credible” type of living pattern.
The village is situated on BELLE, the
island with the highest mean gamma-ray
exposure rates (excluding YVONNE), and
visits are only allowed to the other
northern islands. Thus, Case V would
most probably lead to upper-limit doses
if some reasonable fraction of the popula-
tion should decide to reside permanently
on BELLE. However, such a plan is not
being considered at this time. No
attempt was made to subdivide the time
spent on other islands into specific areas,
since it was felt that such a breakdown
would unnecessarily complicate the
calculations.
Even though wide variations in gamma-
ray exposure rates were measured
throughout the northern islands, it was
necessary, for the purpose of the dose
calculation, to derive the most reason-
able values of the current mean exposure
rates for each specific geographical area
under consideration. These values are
shown in Table 20. The mean exposure
rates for specific areas of JANET were
obtained by examination of the 13?Cs and 60
Co iso-exposure-rate contour maps
provided by the aerial survey. The village
area was assumed to lie along the lagoon
-125-

l‘ill;cse on J.‘IZET. \.1Slts I:) other northern islands only.
l‘illa,oe on .J.iXET, \.isiis ‘i) other northern
a
islan::j oni\-.
[-illage on FRED, ELiLIER, 0r r)$T-m. \Tisits ;c, liorthern
3 :slands
only 1 excl. .J _4SET).
l’illage on .J_lSET, visits :o southern b islanus only.
lyillage on FRED, ELblER, or DAT-ID, visits to southernb islands only.
Village on BELLE, visits to other northern islands only.
Infan;s Children 1Ien 1!‘omen
Infants Childrer! 1Ien \\-orn en
Infants Children 1Ien 1i omen
Infant 3 Chi1dre.n 1Ien 1i omen
Infants Children XIen Women
Infants Children firen 11’omen
70 50 40 30
5 0 0 10 15 3
5 15 10 10 10 0
5 5 0 3 15 10 5 20 10 5 15 5
Same as Case t,,
Same as Case I a
Same as Case lb
Same as Case Ib
20 20 25 25
aNorthern islands include ALICE, BELLE, CLARA, DAISY, IRENE, <JANET, KATE, LUCY, DIARY, NANCY, OLIVE, PEARL. SALLY. TILDA, URSULA, \‘ERA, and WILMA.
bSouthern islands include all islands from TORl wise around the Atoll.
through LEROY, proceeding clock-
‘These values represent the percentage of time spent in the various areas.
side of the island. The mean values gil-en
for all of the northern islands were ob-
tained by weighting the mean exposure
rates for each individual island with the
area of each island. Since the minor con-
tamination of the southern islands is
relatively uniform, the mean 13’Cs and 6C Co exposure rates were chosen by in-
spection of the individual aerial-survey
contour maps. The cosmic-ray contribu-
tion was estimated to be 3.3 ~R’hr at this
latitude and the naturally occurring
radionuclides in the soil and sea water
were expected to contribute an additional
0.2 clR/hr.
The relative gamma-ray exposure
rate contributions from6’Co and 137Cs
obtained from the aerial survey agrees
well with values independently inferred
from the soil activity-depth profile meas-
urements. Although the soil measure-
ments indicate trace amounts of other
gamma emitters, such as 125Sb. 1551S~,
and 241 Am, calculations of exposure
126-
l -
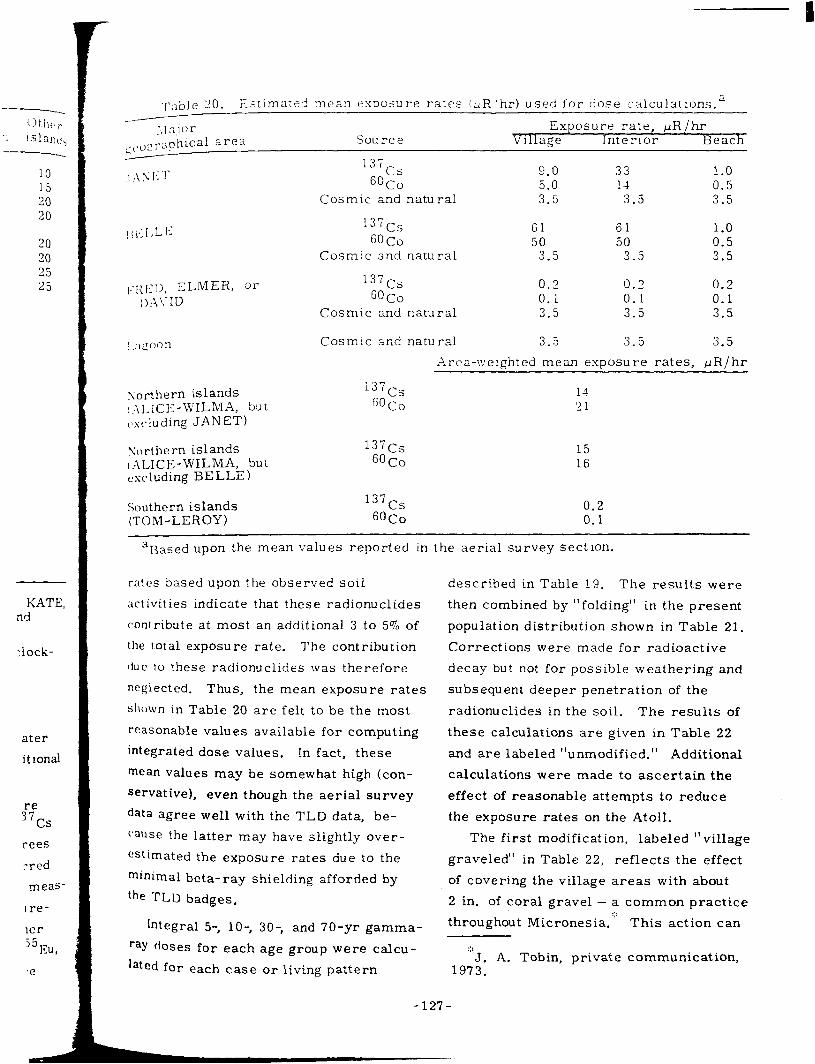
I
. Olill~,
1 !Slan+ .
20 20 25 25
KATE, nd
:iock-
ater
it tonal
GCs
rees
rred
meas-
Ire-
icr J5 Ku,
se
.r:lble 30. E:s?imated mean esnojure rate-: IuR hr) used for dose calculations. a
/ :$I ajar Exposure rate, yR /hr
L,,,,cr3nhical area Source Village Intertor Beach . __
[ ,a~oon Cosmic and natural 3.5 3.5 3.5
Area-v:eighted mean exposure rates, pR/hr
rorthern islands r,.\l.lc~-WILMA, but ,Sscluding JANET)
137Cs 11 6OCo ‘21
sorthern islands (..11,ICE-WILMA, but excluding BELLE 1
137Cs 15 6Oco 16
Southern islands (TOM-LEROY)
137cs 60~0
0.2 0.1
aBased upon the mean values reported in the aerial survey section.
rates based upon the observed soil
activities indicate that these radionuclides
contribute at most an additional 3 to 5% of
the total exposure rate. The contribution
due to these radionuclides was therefore
neglected. Thus, the mean exposure rates
shown in Table 20 are felt to be the most
reasonable values available for computing
integrated dose values. In fact, these
mean values may be somewhat high (con-
servative), even though the aerial survey
data agree well with the TLD data, be-
cause the latter may have slightly over-
estimated the exposure rates due to the
minimal beta-ray shielding afforded by
the TLD badges,
Integral 5; lo-, 30; and 70-yr gamma-
raY doses for each age group were calcu-
lated for each case or living pattern
described in Table 19. The results were
then combined by “folding” in the present
population distribution shown in Table 21.
Corrections were made for radioactive
decay but not for possible weathering and
subsequent deeper penetration of the
radionuclides in the soil. The results of
these calculations are given in Table 22
and are labeled “unmodified.” Additional
calculations were made to ascertain the
effect of reasonable attempts to reduce
the exposure rates on the Atoll.
The first modification, labeled “village
graveled” in Table 22, reflects the effect
of covering the village areas with about
2 in. of coral gravel - a common practice
throughout Micronesia.:” This action can
::: J. A. Tobin, private communication,
1973.
-127-
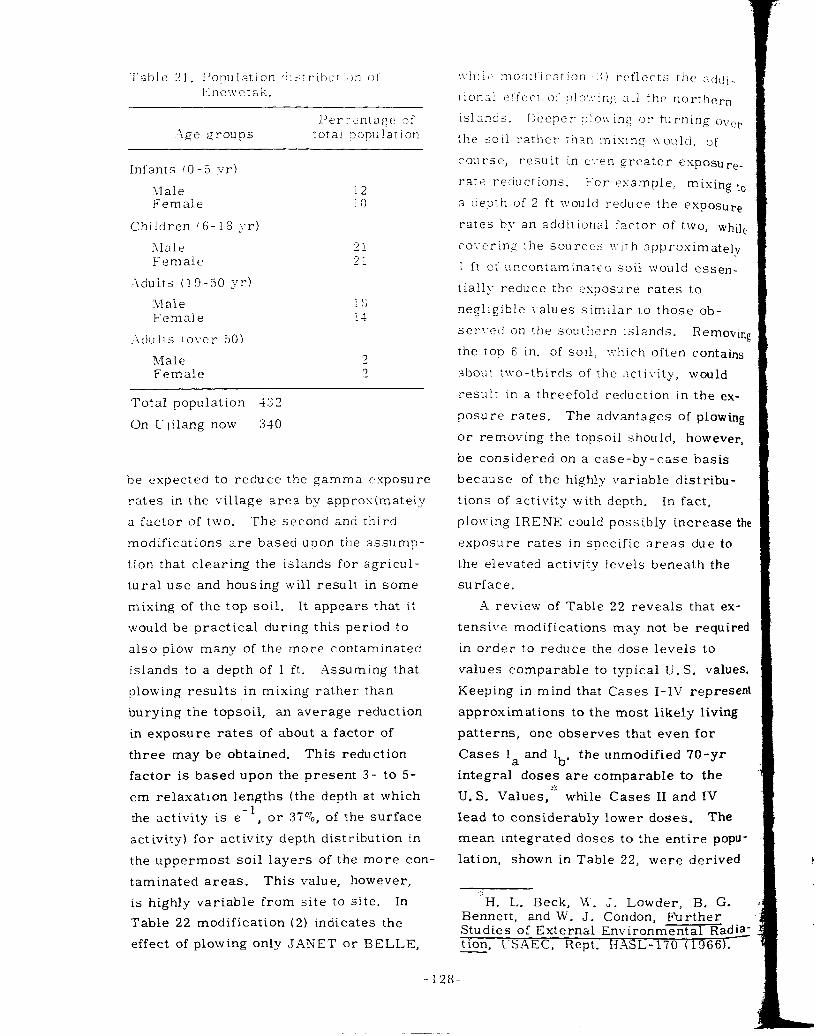
Age croups
Infants CO-3 yr1
XIale Female
Children ‘6- 18 s.r)
Alale Female
:ldults (19-50 3’r)
Alale Female
:1tlults 1 over 50)
Wale Female
Total population 432
On L.,jilang now 310
be expected to reduce the gamma esposure
rates in the village area by approximately
a factor of two. The second and third
modifications are based upon the assump-
tion that clearing the islands for agricul-
tural use and housing will result in some
mixing of the top soil. It appears that it
would be practical during this period to
also plow many of the more contaminated
islands to a depth of 1 ft. ilssuming that
plowing results in mixing rather than
burying the topsoil, an average reduction
in exposure rates of about a factor of
three may be obtained. This reduction
factor is based upon the present 3- to 5-
cm relaxation lengths (the depth at which
the activity is e -1
, or 37%, of the surface
activity) for activity depth distribution in
the uppermost soil layers of the more con-
taminated areas. This value, however,
is highly variable from site to site. In
Table 22 modification (2) indicates the
effect of plowing only ,JANET or BELLE,
rior,zi el‘fect of plo~.:~lnrr all the northern
iSlZ.nCIS. Deeper ?lo\r~inp or turning oIrCil’
the soil rather than mirlnq 11 oulti, of
course, result in f:<.-en ,grcater exposure_
rare reductions. ,L‘or example, mixing to
a depth of 2 ft wouid reduce the exposure
rates by an additional factor of two, whilr.
covering the Sourco5 v:iTh 3pprosimatelv
1 ft OC uncontaminated soil would essen-
tially reduce the exposure r3tes to
negligible i,alues similar to those ob-
ser-:ed on the southern Islands. Removing
the top 6 in. of soil, v:hich often contains
about Two-thirds of the kjctivity, would
resulr in a threefold reduction in the ex-
posu re rates. The advantages of plowing
or removing the topsoil should, however,
be considered on a case-by-case basis
because of the highly variable distribu-
tions of activity with depth. In fact,
plowing IRENE could possibly increase the
exposure rates in specific areas due to
the elevated activity levels beneath the
surface.
A review of Table 22 reveals that ex-
tensive modifications may not be required
in order to reduce the dose levels to
values comparable to typical U.S. values.
Keeping in mind that Cases I-IV represent
approximations to the most likely living
patterns, one observes that even for
Cases Ia and Ib, the unmodified 70-yr
integral doses are comparable to the
U. S. Values,“’ while Cases II and IV
lead to considerably lower doses. The
mean integrated doses to the entire popu-
lation, shown in Table 22, were derived
H. L. Beck, W. J. Lowder, B. G. Bennett, and W. J. Condon, Further Studies of External Environmental Radia- tion, I-SAEC, Rept. H=2SL-170 (1966).
-128-
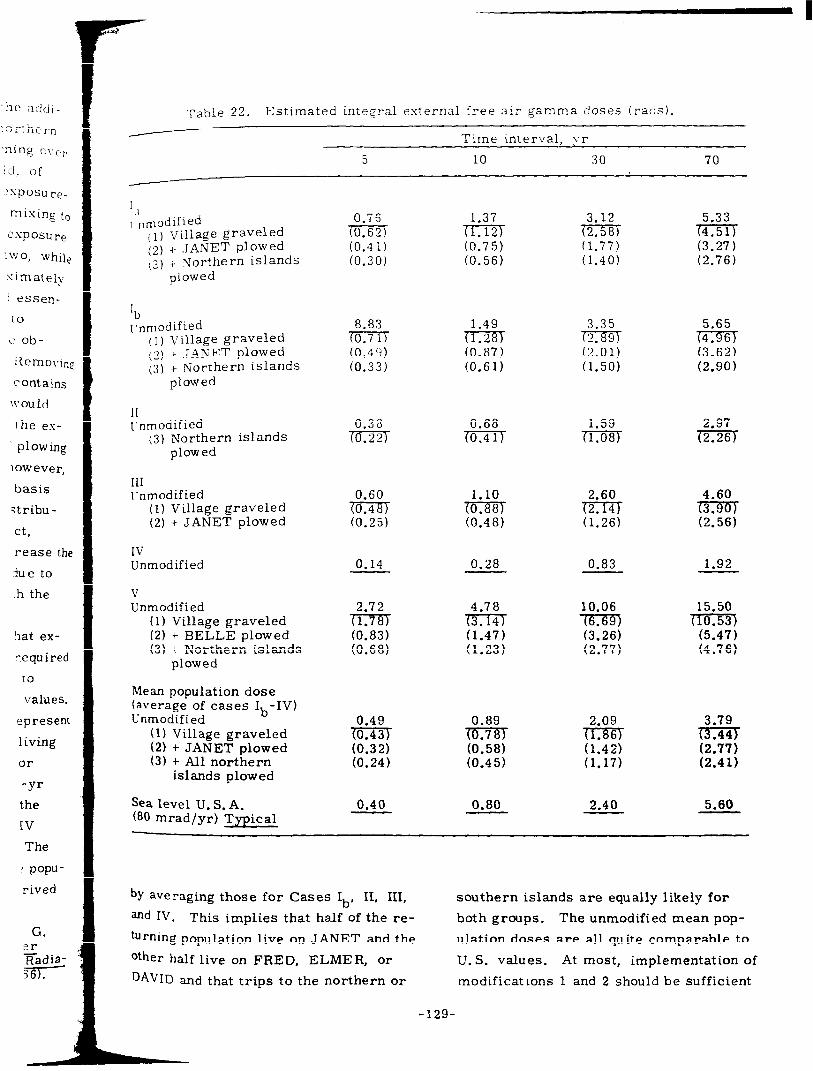
I
‘he addi-
:orthern
,ning o\‘er
13, 0 f
?SPOSU re_
mixing to
CXpOSUre
TIVO, while
simatelv
! essen-
to
c? ob-
Remoi.inc
contains
WOUld
the es-
plowing
lowever,
basis
jtribu-
ct,
rease the
due to
h the
hat ex-
required
to
values.
epresent
1 iving
or
-Yr
the
IV
The
? popu-
rived
G. lr Fadia- ;6).
Table 22. Estimated integral external free air gamma doses (I-ads).
Time interval, yr
5 10 30 70
I .I
1 ,,modified (1) Village graveled (2) + JANET plowed (3) + Northern islands
0.76 1.37 3.12 5.33 (0.627 7-iX.z m Km (0.4 1) (0.75) (1.77) (3.27) (0.30) (0.56) (1.40) (2.76)
8.83 (0.71) (0.49) (0.33)
1.49 0 (0.87) (0.61)
3.35 (2.89) (2.01) (1.50)
5.65 (4.96J (3.62) (2.90)
0.38 0.68 (0.227 (0.41)
1.59 (1.08)
2.97 (2.26J
0.60 1.10 2.60 (0.48) 0 0 (0.25) (0.48) (1.26)
0.14 0.28 0.83
4.60
E .
1.92
2.72 4.78 10.06 (1.787 mm (0.83) (3.26) (0.68) (2.77)
15.50
% (4:76)
0.49 (0.43) io132j (0.24)
2.09
mm (1.42) (1.17)
3.79
K (2:4 1)
0.40 0.80 2.40 5.60
plowed
‘I, I’nmodified
(1) Village graveled i2) 7 J_&KET plowed (3) + Northern islands
plowed
II I‘nmodified
(3) Northern islands plowed
III [‘nmodified
(1) Village graveled (2) + JANET plowed
IV Unmodified
V Unmodified
(1) Village graveled (2) + BELLE plowed (3) + Northern islands
plowed
Mean population dose (average of cases Ib-IV) Unmodified
(1) Village graveled (2) + JANET plowed (3) + All northern
islands plowed
Sea level U. S. A. (80 mrad/yr) Typical
bY averaging those for Cases Ib’ II, III,
and IV. This implies that half of the re-
turning population live on JANET and the
other half live on FRED, ELMER, or
DAVID and that trips to the northern or
southern islands are equally likely for
both groups. The unmodified mean pop-
ulation doses are all quite comparable to
U. S. values. At most, implementation of
modifications 1 and 2 should be sufficient
-129-

Group 5 vr
Infants 0.6-1
Children 0.7O <
YIen 0.82
\I:omen 0.70
To;al integrated dose, rad
10 yr 30 J-r
1.15 2.66
1.43 3.24
1.37 3.32
1.42 3.20
-
70 vr
4.53
5.52
5.61
5.42
to assure mean population exposures well
below the I. 5. lel-els. Case 1’ repre-
sents 3 “..:‘orst credible” ‘ype of living
pattern \vhich, of course, leads to
appreciably higher doses. Howec-er, even
in this situation, the modifications can
bring the levels down to the range of U.S.
values.
Because of the low amount of natural
radioactivity normally present in the coral
atolls, the external dose levels calculated
for Cases I-III and V are still appreciably
higher than corresponding levels found
elsewhere in the Marshall Islands (essen-
tially Case IV). The results for Cases II
and IV indicate that restricting the perma-
nent villages to “clean” southern islands
at least temporarily would result in lower
exposures. Pu’ote that for Case Ib almost
as much exposure is accumulated in the
.%s illustrated in Table 23 for Case Ia, th?
differences in radiation exposure of the
i-arious population groups are minor,
particularly for the longer time periods.
Similar results were obtained for the othe
cases, indicating that the exact breakdown
among age groups is not highly important.
The fact that the doses for Cases Ia and
Ib do not differ substantially indicates
that the exact time breakdown among
geographical areas is also not critical.
Table 24 illustrates the distribution of
dose with respect to geographical area fol
Cases I-IV. The large fraction received
while working in the interior or on other
islands reflects, of course, the higher
exposure rates present in these areas.
All of the doses discussed so far are
due to free-air gamma plus cosmic-ray
exposures The effect of shielding by
first 10 years as in the succeeding 20 years. structures or the body itself on gonadal
Table 24. Percentage of unmodified exposure received from various locales.a
Case Village Beach Interior Lagoon Other islands
Ia 47 2 27 1 23
Ib 36 1 33 2 28
II 22 2 8 4 64
III 58 2 33 1 5
IV 50 5 17 8 20
aFor 30-yr intervals averaged over population distribution. Percentages for other time periods are similar.
-130-
70 vr
4.53
5.32
5.61
5.42
1st I a’ the
3 of the
inor,
oeriods,
r the othel
reakdown
nportant,
Ia and
:ates
ong
tical.
on of
area for
?ceived
1 other
gher
‘eas.
r are
z-ray
by
ladal
a
Ids
.er
or hone doses has been !pnored. To con-
,,C,r, from free- air dose 1 rads) to gonadal
(jose (rem), a body-shielding factor of
o 8 may be used.
The free-air dose will be additionally
(,i,Iianced by the presence Of beta rays,
,;*.iginating primarily from 9*Sr_g*Y
in the soil. In radiation fields produced
t,y global fallout, where the g”Sr/137Cs
activity ratio in the soil 1~ normally about
0.67, the free-air beta dose at 1 m above
[be ground is expected to be about four
,imcs that due to the 137
CS gamma rays.
,jt Enewetak, however, the g”Sr/137Cs
activity ratios in the soil samples showed
;I wide range of values with an average
ratio of about three. Thus, the free-air
beta dose rates may average about
600 prad/hr in the interior of JANET and
about 200 prad/hr in the village area. The
resulting beta-ray doses to the skin, eye
lenses, and gonads will be about 50, 25
and l%, respectively, of the free-air
valu es. t Thus, appreciable increases in
skin and eye-lens doses due to the beta
contribution could be expected. The
gonadal dose, on the other hand, would
be insignificant.
Very little informatlon is available to
“erifY these calculated beta-ray air doses,
but indications are
realistically high.
data obtained from
that were equipped
that they may be un-
This is based upon
two LiF TLD badges
with aluminum shields,
one of which was situated within the
Report of the United Natlons Scientific Committee on The Effects of Atomic Radiation, 27th Session, Vol. 1, Supple- ment No. 25 (1975).
t K. O’Brien, Health and Safety Labora- tory. USAEC, New York, private Communication (1973 ).
-131-
interior of ,J_ANET. These shielded badges
only showed an approximate lO?o reduction
in exposure rates from those measured by
the unshielded badges at the same loca-
tion, thus leading one to suspect that the
beta air doses are considerably less than
the calculated values.
MARINE PROGRALI
V. Nelson Laboratory of Radiation Ecology University of Washington Seattle, Washington
V. E. Noshkin Lawrence Livermore Laboratory Livermore, California
Purpose
The mission of the aquatic survey was
to collect enough sufficiently representa-
tive samples to define and’quantify the
contributing radioactivities in the lagoon
and reef areas of the Atoll. The radio-
logical data are needed to assess both the
exposure pathways to persons utilizing
the aquatic environment and to determine
the distribution of selected radionuclides
in the Enewetak marine environment.
Fish, invertebrates, plankton, and water
and marine sediment were collected and
other marine observations conducted
during October, November, and December,
1972. This section of the report describes
the kinds and quantities of samples ob-
tained, the methods of collecting and proc-
essing, and the details pertinent to each
kind of sample or program.
General Program Description
Ships and Capabilities
A 17-ft Boston Whaler was flown from
LLL to Enewetak for the survey of the
Lagoon. It was powered by a 65-h? out-
hoard engine and carried a 7.5-hp out-
board for emergency use. It was equipped
with a depth sounder and davit with a hand-
operated winch and 500 ft of 3/32-in. steel
cable, sufficient to reach any depth in the
lagoon.
This boat was used chiefly for samp-
ling near the shore: its range was
limIted because it was necessary to re-
main within sight of land to fix the station
locations, which was done with a sighting
compass. \Ve sampled the lagoon be-
tween FRED and PEARL, no more than
6 km from shore; additional collections
were made between LEROY and FRED,
including stations in the Wide Passage.
Sampling by the Whaler crew included
water collection, sediment collection,
plankton-tow and mid-lagoon trolling with
rod and reel. This small boat proved
very satisfactory for these collections.
In all, 43 of the 126 sediment grabs, 21
water samples, many open lagoon fish,
and several plankton samples were col-
lected by the whaler during the survey
in spite of bad weather which seriously
hampered its operation in the lagoon. On
a number of days, operations were cur-
tailed because of wind and sea conditions.
A landing craft utility (LCU) was pro-
vided for the survey and used to support
all survey programs. Its use for the
marine program was on an availability
basis, but the time allotted was sufficient
to complete the program. A portable
winch powered by a gasoline engine was
mounted on the stern of the vehicle deck.
The winch contained 1000 ft of 3/32-in.
stainless steel hydrographic cable which
passed through a metering sheave
secured to the port-side davit of the ves-
s-cl. All sampling operations Lvere con_
ducted from the port s;lde with equipment
aTtached to the hydrowire.
The bridge-height of the LCU was
sufficient to sight on land from any
location in the lagoon and the Navy crew
provided all fixes necessary for locat-
ing station positions. Sample depths
were determined from the wire-out
readings recorded on the sheave. Water
samples, sediment samples, and fish
and plankton samples were obtained.
Bad weather limited many operations
from the LCU.
A 24-ft launch belonging to the
USAEC has been stored and used at
Enewetak since May 1972. It is powered
by two 120-hp inboard-outboard engines
and is equipped with a depth sounder.
This boat was used for transportation
between sampling locations during all
portions of the Enewetak Survey and for
the in situ gamma probe work. The boat -- was adequate for both purposes, since it
was large enough to handle the normal
wind and wave conditions found in the
lagoon, yet maneuverable enough to work
in the shallow near-shore waters.
Equipment and Other Facilities
Both the Whaler and the LCU had
complete pumping systems aboard. Sur-
face and subsurface water samples were
collected with battery-operated pumps
through a weighted hose-line which was
lowered to the desired depth. Each
sampling operation was preceded by pump-
ing for at least 10 min to flush out the
entire system. The 55 liter black (Deldflc
polyethylene collection barrels were first
rinsed with the sample water and then
filled at the rate of 8 liters per min.
-132-

15 [vet-c con
th equ lpme,
_C C was
‘ram any
Navy CreH
- for locat.
1 depths
.Ire -out
ive. Watel
and fish
tained,
rations
the
?d at
i powered
i engines
mder.
portation
ing all
and for
The boat
since it
ormal
n the
1 to work
5 - lad
Ll. Sur-
s were
mps
h was
oh
‘y pump-
the
( DeldrPfl
‘e first
len
1.
I
b,,L!!l,lent grab samples x’ere collecled
,,.),I, , lrhcr Shipek. Ponar, or Ekman
,+Ltlllj)ict-~. Plankton were collected in
\;,,. (; ilr No. 10 nets, 1 m in diam. Fish
,,.,‘rc i-ollected by trolling with rod and
,.,\(,l ,h the lagoon or with nets in the shal-
lo,,’ hear-shore areas. Invertebrates were
I,~,~~J collected. Crater sediments in
\IlliI- .;nd KOA craters were sampled \vith
IRENE*
a ” nenthos” model 3 -in. - r!iam gral-ity
corer.
Every precaution was taken to ensure
against contamination of the samples. All
samples were placed in plastic bags, jars,
or barrels, immediately after collection.
After each day’s cruise, all decks and equip-
ment were washed to remove any sediment
debris accidentally spilled and overlooked,.
North
OSCAR
/
Coral Head 0 (MACK)
l”if-5 4 I. Major collection locations (starred) Atoll, October to December, 1972.
-133-
Pacific Ocean
Wide Passage
of marine biological samples at Enewetak

Fish
Introduction
There are more than 700 species of
fish at Enewetak .Atoll, but only a few
species of reef, benthic, and pelagic
fishes were selected for use in this study.
The common anglicized names of the
fishes are used in the text, but the scien-
tific names and the Enewetakese common
names, when known, are listed in
Table 25. The Enewetakese names were
those used by Smith Gideon, Enewetak
magistrate, in his conversations with
Victor Nelson at Enewetak in July 1973,
and from Goo and Banner (1963).
The species selected were chosen for
one or more of the following reasons:
(1) they are commonly eaten by the
Marshallese; (2) they are relatively
aboundant at most of the collection sites;
(3) they are representative of a feeding
habit; or (4) there is previous relevant
radiometric information about the species.
The species of reef fishes selected as
being representative of feeding habits in-
clude the mullet (a plankton and detritus
feeder), convict surgeon (a grazing
herbivore), goatfish (a bottom-feeding
carnivore) and parrot-fish (a coral eater).
The tunas, jacks, and dolphins - pelagic
fish - and the snappers and groupers -
benthic fish - are carnivores of high order
in the food chain leading to man. Informa-
tion about the radioactivity in Enewetak
fish,during the last 25 yr, including the
species selected for this study, can be
found in the reports of the University of
Washington, Laboratory of Radiation
Ecology, which include the following:
Held, 1973a; Beasley and Held, 1972b;
Held, 1971’; Welander, 1967d; Welander
et al., 1967e 5
; Held,
Sample Collections
Reef Fishes-The nine major collectioo
stations are shown in Fig. 41. They are
listed in clockwise order around theAtall,
and beginning with the most northern
station are as follows: BELLE, IRENE,
JANET, TILDA-URSULA, YVONNE,
aE. E. Held “Fallout Radionuclides Pacific Ocean Tuna,” in Proc. Third
in
National Symposium on Radioecology lo-12 May 1971 (Oak Ridge, Tennessee) CONF 710501, p. 689.
bT. M. Beasley and E. E. Held, “Silver-108m in Biota and Sediments at Bikini and Eniwetok Atolls,” Nature 230(5294), 450 (1971).
‘E. E. Held, Radiological Resurvey of Animals, Soils and Groundwater at Bikini Atoll 1969-1970, U. S. Atomic Energy Commission, Rept. NVO-269-8 (1971).
d A. D. Welander, “Distribution of
Radionuclides in the Environment of Eniwetok and Bikini Atolls, August 1964,” in Symposium on Radioecology Proc. Second National Symposium, lb-17 May 1967 (Ann Arbor, Michigan) CONF-670503, p. 346 (1969).
eA. D. Welander et al., Bikini-Eniwetok Studies, 1964: Part II. Radiobiological Studies, U S Atomic Energy Commission, Rept. UWFL’-93 (Pt. II) (1967).
f A. H. Seymour “Radioactivity of
Marine Organisms from Guam, Palau, and the Gulf of Siam, 1958-1959,” in Radioecology, V. Schultz and A. W. Klement Jr., Eds. (Reinhold, New York, and Amer. Inst. Biol. Sci., Washington, D.C., 1963) p. 151.
gE. E. Held “Qualitative Distribution of Radionuclides at Rongelap Atoll,” in Radioecology, V. Schultz and A. W. Klement, Jr. Eds, (Reinhold, New York, 1963) p. 167.
h F. G. Low man, “Marine Biological
Investigations at the Eniwetok Test Site,” in Proc. Conference on Disposal of Radio- active Wastes, Monaco, Nov. 16-21, 1959 (IAEA, Vienna, 1960) p. 105.
-134-
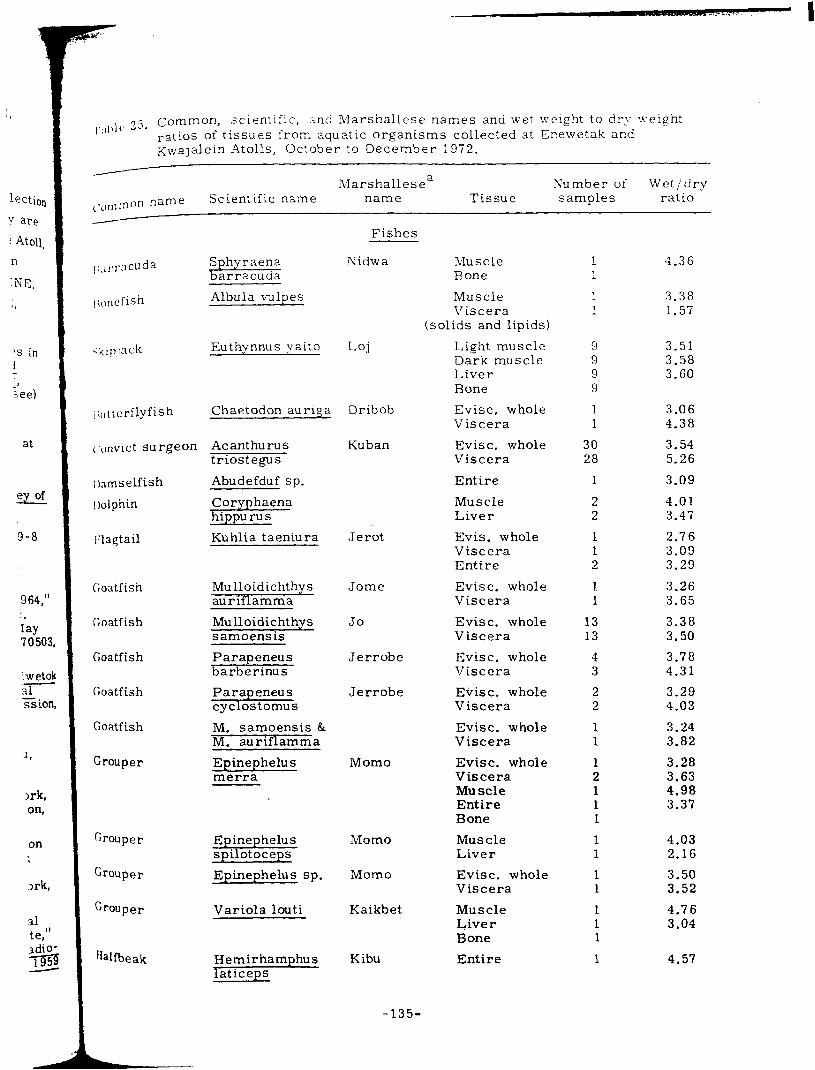
lection
Y are
: Atoll,
n
XE,
‘>
?s in i
_’ See)
at
9-8
964,” :. lay 7050:
iwetc al ssio
1,
on 1
Jrk,
31 te,’ adi( z
,.;,I,)(’ 25. common, scientific > 2nd Marshallese names and wet weight to dry weight ratios of tissues from aquatic organisms collected at Enewetak and Kwajalein Atolls, 0c:ober to December 1972.
Marshallesea Number of Wet/dry
(.~r,,lr~lOn name Scientific name name Tissue samples ratio
Fishes
Nidw a
Albula vulpes
>ic,l),iack Euthynnus vaito Loj
i;,,ttcrflyfish Chaetodon auriga Dribob
(‘0nvict surgeon Acanthurus triostegus
Abudefduf sp.
Coryphaena hippu ru s
Kuhlia taeniura
Kuban
I)nmselfish
I)olphin
I%q$ail Jerot
Goatfish Jome
Goatfish Mulloidichthys samoens is
Jo
Goatfish Parapeneus barberinus
Jerrobe
Goatfish Jerrobe
Goatfish
$Z%%
M. samoensis 8; M. auriflamma
Grouper Epinephelus merra
Momo
Grouper
Grouper
Crouper
Epinephelus spilotoceps
Epinephelus sp.
Momo
Momo
Variola louti Kaikbe
Ufbeak Hemirhamphus laticens
K ibu
>Iuscle Bone
Muscle Viscera
(solids and lipids1
Light muscle Dark muscle Liver Bone
4.36 1
1 3.38 1 1.57
9 3.51 9 3.58 9 3.60 9
-135-
Evisc. whole Viscera
Evisc. whole Viscera
Entire
Muscle Liver
Evis. whole Viscera Entire
Evisc. whole Viscera
Evisc. whole Viscera
Evisc. whole Viscera
Eirisc. whole Viscera
Evisc. whole Viscera
Evisc. whole Viscera Muscle Entire Bone
Muscle Liver
Evisc. whole Viscera
Muscle Liver Bone
Entire
1 1
30 28
1
2 2
1 1 2
1 1
13 13
4 3
2 2
1 1
1 2 1 1 1
1 1
1 1
1 1 1
1
3.06 4.38
3.54 5.26
3.09
4.01 3.47
2.76 3.09 3.29
3.26 3.65
3.38 3.50
3.78 4.31
3.29 4.03
3.24 3.82
3.28 3.63 4.90 3.37
4.03 2.16
3.50 3.52
4.76 3.04
4.57

Table 25 (continued).
Marshallesea Number of Common name Scientific name name Tissue samples
Wet ‘dry ratio .
Fishes (continued) -
Jack
.Tack
Mackerel
hlu Ret
Mullet
Mullett
Mullet
Needlefish
Parrotfish
Rabbitfish
Rudderfish
Skipjack tuna
Snapper
Snapper
Snapper
Caranx melampygus
Caranx sexfasciatus
Grammatorcynus bilineatus
Crenimugil crenilabis
Plicomugil labiosu s
sp. Mugil
Neomyxus chaptalii
Strongylu ra incisa
Scarus sordidus
Siganus rostratus
Kyphosu s cinerascens
Euthvnnus pelamis
Aphaerus furcatus
Apr ion virescens
Lethrinus kallonterus
Deltokrok
151
Ikari
Jomou
Ikari
Tak
Mao
Elik
Bagrok
Chilu
Eowae
Jalia
Snapper Lutjanus monostigmus
-136-
Muscle Viscera Bone
Evisc. whole T’iscera
Muscle Viscera Bone
Evisc. whole Viscera Muscle Remainder
Evisc. whole Viscera
Evisc. whole Viscera
Evisc. whole Viscera Muscle
Muscle Viscera
Evisc. whole Viscera Muscle Bone
Evisc. whole
Muscle Viscera Remainder
Light muscle Dark muscle Liver Bone
Muscle Viscera
Muscle Viscera
Muscle Liver Viscera Bone
Muscle Viscera Liver Skin Remainder Bone
4 4 2
1 1
3 2 1
1 1
3 3
13 13 6
1 1
2 10 9 9
1
1 1 1
2 2 2 1
1 1
1 1
2 1 1 1
2 2 1 1 1 1
4.36 3.73
3.86 4.26
4.10 3.72
2.85 2.68 3.9-1 2.40
3.25 3.06
3.76 2.32
2.97 2.83 3.86
4.41 3.67
3.85 2.95 4.92
3.91
4.95 5.69 3.15
3.51 3,55 3.52
4.62 3.69
4.34 4.18
4.78 3.38 3.71
4.34 3.20 3.09 1.91 2.90

-I.36 3.73
3.88 1.26
1.10 3.72
2.2,;; 2.68 3.94 2.40
3.25 3.06
3.76 2.32
2.97 2.83 3.86
-1.41 3.67
3.85 2.95 4.92
3.91
-1.95 5.69 3.15
3.51 3,55 3.52
4.62 3.69
4.34 4.18
4.78 3.38 3.71
4.34 3.20 3.09 1.91 2.90
I
Table 25 (continued).
Marshallesea Number of Wet .‘dry Scientific name name Tissue samples ratio
Fishes (continued)
;mpper
,,, ,-ceonfish
yli ,.geonfish
\\ .ihOO
\!‘r:lsse
Ycxllowfin tuna
IJ,nncil urchin
SC;~ cucumber
sea cucumber
+a cucumber
51*a cucumber
S(,:I cucumber
Spincy lobster
‘Fop snail
Tridacna
Luqanus vaigiensis
L. monostoemus & L. vaigiensis
Ctenochaetuj striatus
Saso lituratus
_Acanthocvbium Muscle solanderi Liver
Goris sp.
Thunnus albacares
Actinopygia mauritiana
Holothuria atra
Holothuria leucospilota
Holothuria sp.
Unidentified Entire
Panulirus nenicillatus
Trochus sp.
Tridacna gigas
Ban Evisc. whole
1Iuscle Remainder
Evisc. whole \.iscera
Balak Muscle l’iscera Remainder
1Iuscle Viscera Bone
Pwepwe Light muscle Dark muscle Liver Bone
Invertebrates
Soft parts Hard parts
Evisc. whole Viscera
Evisc. whole Viscera
Evisc. whole Viscera
Evisc. whole Viscera
Muscle Hepatopancreas Exoskeleton
Kabwur
Soft parts
Muscle Mantle Muscle & mantle Kidney Viscera Kidney &
viscera Gills
-137-
1
1 1
1 1
1 1 1
3 3
1 1 1
5 4 5 3
1 1
2 2
2 2
3 3
5 5
1
1 1 1
1
2 2 4 5 5
1 1
3.41
4.71 3.05
3.97 3.16
4.70 5.97 2.42
3.88 2.97
4.83 3.22
3.78 3.75 3.80
2.92
6.49 5.51
8.21 2.92
9.02 3.32
7.56 5.31
2.26
4.32 2.94 7.61
4.57
4.29 7.43 6.44 3.36 6.79
4.78 7.82
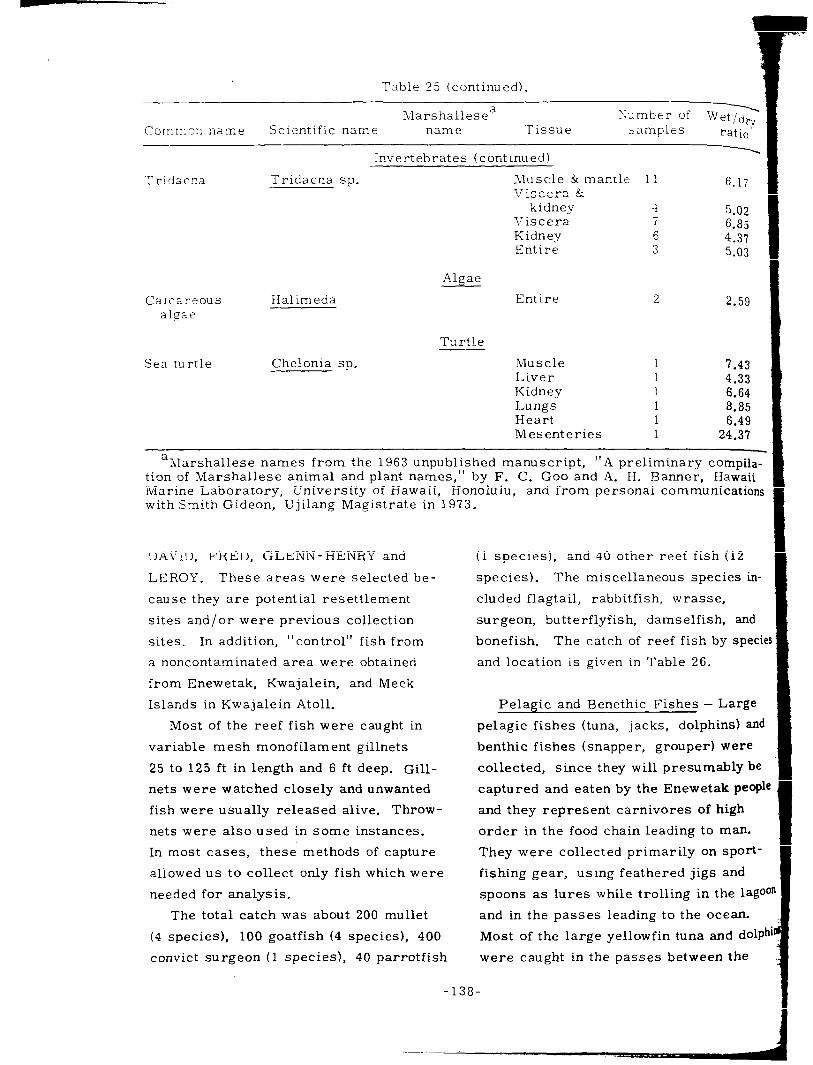
Table 25 (continued).
lIarshallesea Scientific name Tissue
Zumbrr of Wet,/2 Comrr.an name name sampies ratio‘
Invertebrates (continued) \
Tridacxa Tridacna sp. hluscle 6r mantle 11 Viscera &
kidney i Viscera ‘7 Kidney 6 Entire 3
6.17
5.02 6.85 4.37 5.03
Calcareous algae
Halimeda
Sea turtle Chelonia sp.
Algae
Entire 2 2.59
Turtle
Muscle 1 7.43 Liver 1 4.33 Kidney 1 6.64 Lungs 1 8.85 Heart 1 6.49 Mesenteries 1 24.37
aMarshallese names from the 1963 unpublished manuscript, “A preliminary compila- tion of Marshallese animal and plant names,” by F. C. Goo and A. H. Banner, Hawaii Marine Laboratory, University of Hawaii, Honolulu, and from personal communications with Smith Gideon, Ujilang Magistrate in 1973.
DAVID, FRED, GLENN-HENRY and
LEROY. These areas were selected be-
cause they are potential resettlement
sites and/or were previous collection
sites. In addition, “control” fish from
a noncontaminated area were obtained
from Enewetak, Kwajalein, and Meek
Islands in Kwajalein Atoll.
Most of the reef fish were caught in
variable mesh monofilament gillnets
25 to 125 ft in length and 6 ft deep. Gill-
nets were watched closely and unwanted
fish were usually released alive. Throw-
nets were also used in some instances.
In most cases, these methods of capture
aliowed us to collect only fish which were
needed for analysis.
The total catch was about 200 mullet
(4 species), 100 goatfish (4 species), 400
convict surgeon (1 species), 40 parrotfish
(1 species), and 40 other reef fish (12
species). The miscellaneous species in-
cluded flagtail, rabbitfish, wrasse,
surgeon, butterflyfish, damselfish, and
bonefish. The catch of reef fish by speci
and location is given in Table 26.
Pelagic and Benethic Fishes - Large
pelagic fishes (tuna, jacks, dolphins) and
benthic fishes (snapper, grouper) were
collected, since they will presumably be
captured and eaten by the Enewetak peopl
and they represent carnivores of high
order in the food chain leading to man.
They were collected primarily on sport-
fishing gear, using feathered jigs and
spoons as lures while trolling in the la@
and in the passes leading to the ocean.
Most of the large yellowfin tuna and dolP
were caught in the passes between the
-138-

[ilet ‘dr.. .’ ratio
.
6.17
5.02 6.85 4.37 5.03
2.59
7.43 4.33 6.64 8.85 6.49
24.37
compila- Hawaii nications
h (12
ties in-
e,
h, and
)y specie
Large
ns) and
were
lbly be
k people
!igh
nan.
iport-
and
\e lag@
? an.
d do@
the
!~>,},l(~ “fi. lumber of organisms c:ollected z.: Enewetak Atoll and Kwajalein -Atoll near- -snore sites, October to December 1272.
l<leoon and the ocean, while the smaller
skipjack, mackerel, and ulua were caught
,n the lagoon proper. The snappers and
troupers were caught in both the shalIow
~~:~ter of the reef and the deep lagoon
K;Iters. The number of large carnivorous
fl.sh caught is given in Table 27.
Sample Analyses
Field Processing - After capture,
fish were segregated by type (e. g., goat-
fish, mullet, etc.), placed in plastic bags,
and transferred to ice chests containing
cjry ice as soon as practical (1 to 4 hr
sifter collection). At the main camp,
most fish were frozen, either in dry ice
()r In freezer units. Occasionally, fish
\v(‘rc dissected fresh, the tissue dried,
;Ind then frozen,
C)riginally, it was planned that most
Of the marine biological samples would
be processed at Enewetak by people from
the Laboratory of Radiation Ecology.
However, the disruption to the program
caused by Typhoon Olga made sample
processing at Enewetak impractical;
therefore, the majority of the samples
were processed at the home laboratory
in Seattle, Washington.
Laboratory Preparati.on - The samples
were frozen at Enewetak and remained
frozen until processed at the Seattle
laboratory. To begin preparation of the
samples for analyses, the fish were
partially thawed and dissected into the
tissue types shown in Table 25. Tissue
types chosen were those most useful for
estimation of the radiation dose and were
of sufficient size to yield a dried sample
of adequate size for gamma spectros-
copy or radiochemical analyses. After
139-
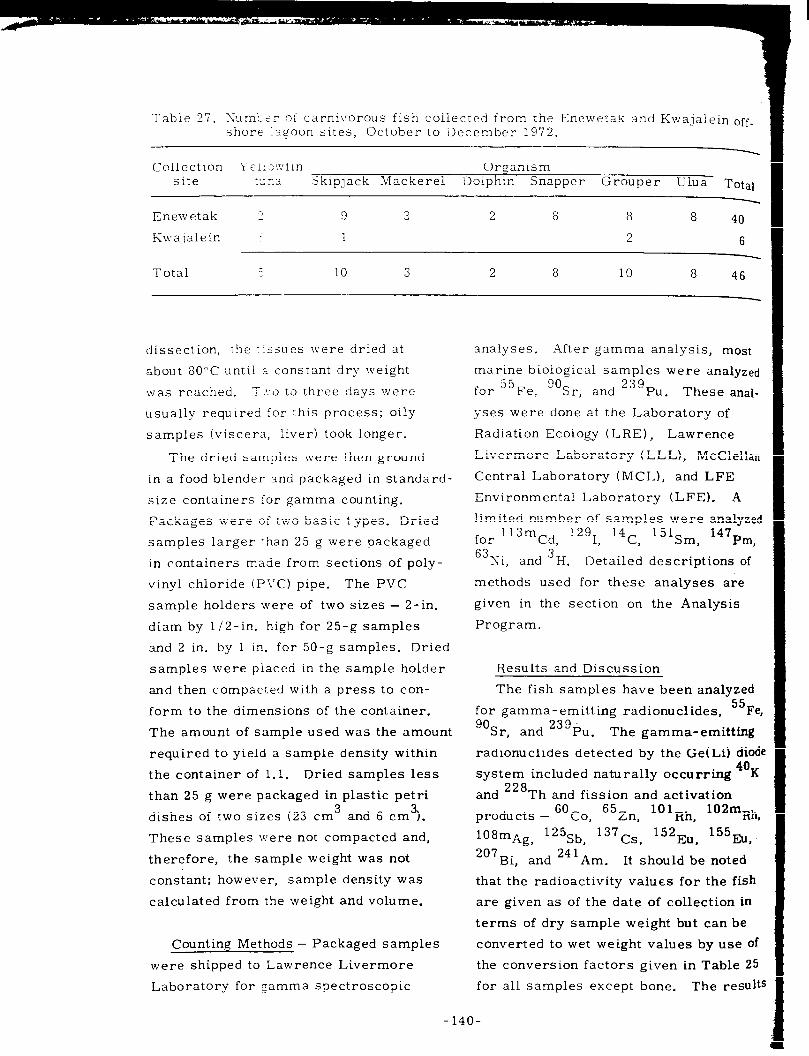
Table 27. Sum’:er of carnivorous fish collecTed from the Enewetak and Kwajalein off_ shore :zgoon sites, October to December 1972.
Collection YellLivfin Organism site ::: na skipjack Mackerel Dolphin Snapper Grouper Ulua Total
-
Enewetak I: I) 3 2 8 8 8 40
Kwalalein i 1 2 6 -
Total r. 10 3 2 8 10 8 46
dissection, the rissues were dried at
about 80°C until 2 constant dry weight
was reached. T..;:o to three days were
usually required for this process; oily
samples (viscera, liver) took longer.
The dried samples were then ground
in a food blender and packaged in standard-
size containers for gamma counting.
Packages were of two basic types. Dried
samples larger rhan 25 g were packaged
in containers made from sections of poly-
vinyl chloride (PVC) pipe. The PVC
sample holders were of two sizes - 2-in.
diam by 1 l2-in. high for 25-g samples
and 2 in. by 1 in. for 50-g samples. Dried
samples were placed in the sample holder
and then compacted with a press to con-
form to the dimensions of the container.
The amount of sample used was the amount
required to yield a sample density within
the container of 1.1. Dried samples less
than 25 g were packaged in plastic petri
dishes of two sizes (23 cm3 and 6 cm31.
These samples were not compacted and,
therefore, the sample weight was not
constant; however, sample density was
calculated from the weight and volume.
Counting Methods - Packaged samples
were shipped to Lawrence Livermore
Laboratory for gamma spectroscopic
I
analyses. _%fter gamma analysis, most
marine biological samples were analyzed 55
for Fe, 90 Sr, and 23gPu. These anal-
yses were done at the Laboratory of
Radiation Ecology (LRE), Lawrence
Livermore Laboratory (LLL), McClellan
Central Laboratory (MCL), and LFE
Environmental Laboratory (LFE). A
limited number of samples were analyzed for 113mCd 12g1
I 14C
9 151S,
> 147p,
63Ni, and 3H. Detailed descriptions of
methods used for these analyses are
given in the section on the Analysis
Program.
Results and Discussion
The fish samples have been analyzed
for gamma-emitting radionuclides, 55Fe , 90 Sr, and 23g~u. The gamma-emitting
radionuclides detected by the Ge(Li) diodr
system included naturally occurring 4oK
and 228 Th and fission and activation
products - , , 60co 65Zn 10IRh 102mRh
108mAg, 125Sb, 137Cs, 152Eu, ’ 1553, (’ ,
207Bi > and 241Am . It should be noted
that the radioactivity values for the fish
are given as of the date of collection in
terms of dry sample weight but can be
converted to wet weight values by use Of
the conversion factors given in Table 25
for all samples except bone. The result!
140-

zin off_
-
Total
40
6
46
most
nalyz ed
;e anal-
of
‘1~ e
,Clellan
FE
A
analyzed
47PIll,
Jns of
are
Jsis
ilyzed
;> 55Fe,
1 itt ing
,i) diode
ng 4oK
On
)2mRh,
55Eu,.
:oted
.e fish
on in
.n be
use of
.ble 25
results
)r !I,,’ ,mlvse- 2 are usually- in terms of
,,:,.oc,lIf~~~ per g ram of dry tissue because
: !,(’ I I-II c ?r;et lr,elght of some samples is
i,Tf,c.,,
Table 28. Radionuclides in reef fish and tridacna clams collected at I<wajalein Atoll, l>ocember 1972.
Sample number Island Organism Tissue 4OK
I 2FJs,
8007 Enewetak Convict 11. whole’) 8006 Enewetak surgeon Viscera
8008 Enewetak Damselfish 1:nt ire 8011 Enewetak Parrotfish E. whole 8010 Enew etak Parrotfish Viscern
0485 Kwajalein 0487 Kwajalein 0486 Kwajalein
8013 8012
0763
Kwajalein Convict E. whole Kwajalein surgeon Visctxra
Kwajalein
0766 Kwajalein
2 07 64 W I 8003
8004
0765
0767
0768
Kwajalein
Kwajalein Kwajalein
Kwajalein
Kwajalein
Kwajalein
Convict surgeon
E. whole E. whole Viscera
Grouper (E. merra) Snapper (L. vaigiensis)
Icntirc
1:. whole
IIalfheak Is:ntirc:
Kuhlia Ku hlia
Rabbitfish
Tridacna
Tridacna
Entire Entire
E. wholed
Muscle and mantle Viscera and kidney
9.0 t 1.1 52 t 6.U
15 1 1.8 15 f 1.3 NC”
7.7 1 1.3 13 1 1.0 16 1 1.4
16 f 2.6 NC
7.3 t 1 .o
11 I 1.1
!I.2 I 1.1
9.8 i 1.1 NC
13 i 1.6
12 f 2.3
13 t 1.6
0.18 t 0.011 I.!) I 0.5
O.fiU f 0.1-1 0.16 f 0.08 0.86 t 0.30
0.12 zt 0.03 1.4 f 0.2 0.511 i 0.09
- I :j ! 0.5
0.3(i I O.O!)
1.!1 I 0.3
-
- 0.50 k 0.31
-
-
1.3 i 0.1
co.17 < 0.05
--0.14 CO.18 ‘: 0.40
< 0.14 <0.1:1 c 0.20
co.19 ,’ 0.17
._ 0.0.4
.’ 0.07
‘. 0.0 !-)
CO.16 < 0.03
< 0.07
0.22 f O.O!)
2.x i 0.20
0.21 I 0.1n 1.5
().:$!I
‘X 0.23 0.79
< 0.26 co.15 < 0.30
c: 0 .4 8 0.7:)
0.11
,’ 0. I :;
0. I:!
0.25 ! 0.10 = 0.09
,: 0.13
0.17
(’ 0 3 2 .
0.0 :3 I 0.0 1 O.,lI I 0.1:1
0.117 I 0.0.1 ‘. 0.02
0.01
s’ 0.05 0.0.1 I o.o:< 0.25 t 0.01i
_ o.of; t o.o:i
0.0 I
0.02
0.0 I
0.0 2 I 0.0 1 ‘.: 0.0 1
< 0.01
0.00 I o.::i I O.OI
0.0 ‘1 0 I .J I CJ.(ll
aError values are one-sigma, counting errors. bEviscerated whole is the entire fish, less the viscera. cNC = not computed. dThis sample also contained 137Cs (0.11 k 0.05 pCi/g, dry).
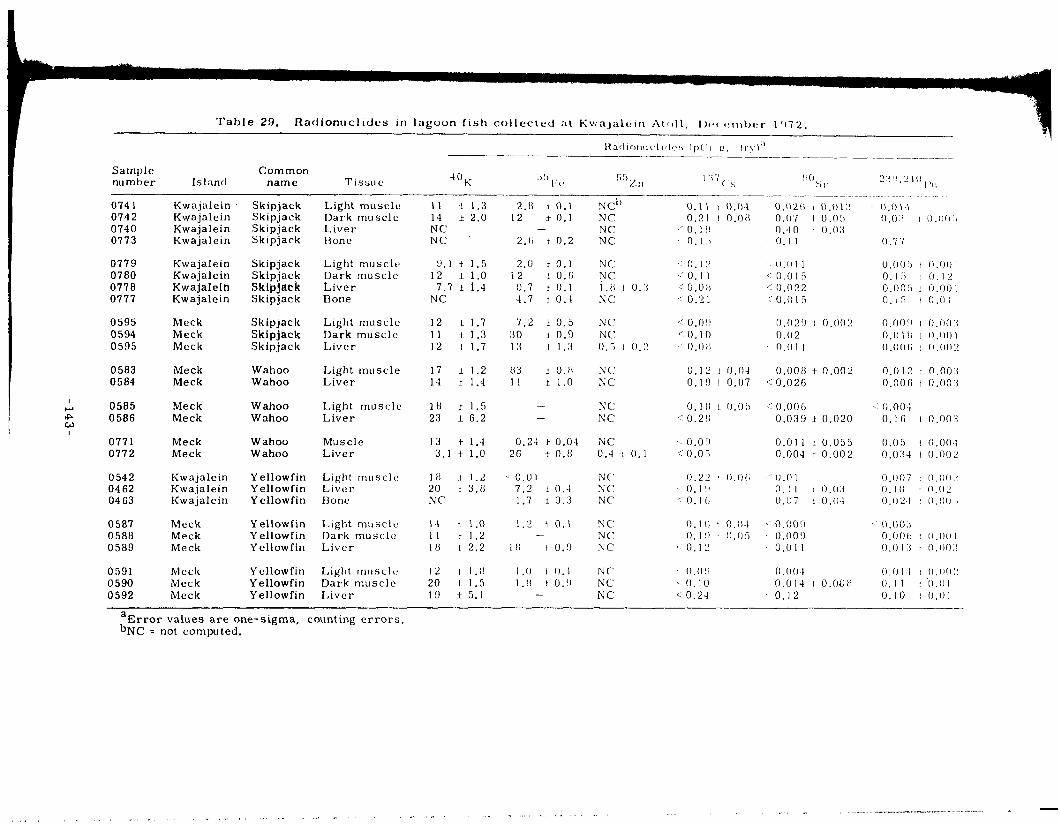
Sample number Island
Common name
074 1 0742 0740 0773
Kwajalein KwaJalein Kwajalein Kwajalein
Skipjack Skipjack Skipjack Skipjark
L,ight muscle Dark muscle Liver Hone
0779 0780 0778 0777
Kwajalein Kwajalein Kwajaleln Kwajalein
Skipjack Skipjack Sklpj& Skipjack
L,ight muscle Dark muscle Liver Bone
0595 0594 0595
Meek Meek Meek
Skipjack Skipjack Skipjack
Light muscle Dark muscle Liver
0583 0584
Meek Meek
Wahoo Wahoo
Light muscle Liver
I
z 0585 0586
w I
0771 0772
Meek Meek
wahoo Wahoo
Light muscle Liver
Meek Wahoo Muscle Meek Wahoo Liver
0542 Kwajalein Y ellowfin Light muscle 0462 Kwajalein Y ellowfin Liver 0463 Kwajalein Y ellowfin Bone
0587 Meek Y ellowfin Light muscles 0588 Meek Y ellowfin Dark muscle 0589 Meek Y ellowfin Liver
0591 Meek Y cllowfin L,igllt m11sc1~~ 0590 Meek Y ellowfin Dark muscle 0592 Meek Yellowfin Liver
11 1 1.3 14 i 2.0 NC NC
‘I.1 t 1.5 12 * 1.0
7.7 i I.4 NC
12 t 1.7 11 t 1.3 12 I 1.7
17 i 1.2 14 f 1.4
18 f 1.5 23 i 6.2
13 * 1.4 3.1 i 1.0
1 I$ 1 1.2 20 I 3.U NC
1.4 I I.0 11 t 1.2 18 I 2.2
12 t I.11 20 I 1.5 19 f 5.1
2.11 i 0.1 12 t 0.1
- 2.1; t 0.2
2.0 t 0.1 12 t 0.6
0. 7 f 0.1 4.7 f O.-l
7.2 i 0.5 30 f 0.9 1 3 I 1.:i
8 3 f 0.a 11 * 1.0
- -
0.24 i 0.04 26 t 0.11
0.01 7.2 I 0.4 1.7 i 0.3
1.2 ! 0.1
1 II I O.!)
I.0 IO.1 NC‘ 1 .II t O.!J NC
- NC
NC” NC NC NC
NC NC i .I( t 0.3
NC
NC NC 0.5 I 0.2
N c NC
NC NC
NC 0.4 I 0.1
IN c . N C: NC
NC NC NC
,.’ I). I 2
,:’ 0 . I 1 h. (J.oii
,' 0.21
(0.09 CO.10
().()I:
0.12 f 0.0-l 0.19 ! 0.07
0.111 F 0.05 I’ 0 .2 tl
‘. 0.0;) c 0.05
0.22 O.Ofi ~ ().I!1 c 0. I f,
0. I (i ! n,o-I ‘- n.nn!~ 0. 1 !I ’ 0.05 O.OO!l
0.12 0.01 I
O.O!I 0.00~I
’ 0.10 0 . 0 I 4 ! 0.0011
i 0.2-1 0.12
0.02ti I n.o\:I 0.07 I 0.05 0.40 I 0.03 n.11
0.01 I ,- 0 . 0 I 5 c 0.022 co.015
0.02!, I 0.002 0.02 0.0 1 I
0.008 * 0.00 < 0.026
,c’ 0 . 0 0 G
0.039 * 0.020
0011 0:004
to055 I 0:002
0.01 0. I I I o.o:j 0. u 7 t 0.04
O.OOi, ! 0.00 I 0.15 , 0.12 o.no5 ! o.noi 0.15 ! Q.OI
O.OO’l I 0.00:~ 0.011: I i).l)Ol o.oof; I o.oo:!
0.012 I O.rJK? 0.001; 1 n.on:j
0.00-I 0.16 ! o.oo:i
0.05 ! 0.00 I 0.034 I 0.002
0.007 ! (1.011:! 0. IO / ll.ll:! 0.024 : 1).01).,
0.003 n.006 I 0.001 0.01:~ I ll.oo:i
O.Ol 1 I o.llll:! 0. I I ! ‘rr.ot
0. In I 0.0 I
aError values are one-sigma, counting errors. bNC = not computed.

one wahoo had 65 Zn concentrations in
their liver tissue of 1.8, 0.5, and 0.4
pCi/g, dry, respectively. Zinc-65 levels
were not computed in the other 23 samples
because the levels were below the limits
of detection_ As for the Kwaialein reef
fish, no 6oc~, 153~u, or 'O'Bi was
detected in any of the 26 lagoon fish
samples analyzed. The highest 239, 240pu
and go Sr levels in Kwajalein fish appear
to be similar to average levels found in
fish from the southern portion of Enewetak
Atoll.
Enewetak Atoll - The results of the
gamma-spectrum analyses grouped by
species - goatfish, convict surgeon, mul_
let, parrotfish, snapper, grouper, ulua
and tuna - are given in Tables 30 to 36.’
When some samples in a group of samples
which were averaged did not have detect.
able levels of a radionuclide, the limit 0t
detection value was used. For example,
in a group of four samples of eviscerated
goatfish from DAVID, three samples had
net ‘O Co values greater than the one
standard deviation propagated counting
error (0.98, 0.65, and 0.48 pCi/g, dry)
and the other sample had a limit of
detection of 0.16 pCi/g, dry. For this
group of four samples, the mean value
was 0.57 pCi/g.
10,000 -
5,000 -
3,000 -
1,000 -
500 -
300 -
100 -
50 -
30 -
10 -
5- 3-
1.0 -
0.5 -
0.3 -
.
0.1 ’ Bc BELLE
Column legend
A 55Fe - eviscemted whole fish
B 55Fe - viscera
c 6oco - viscem
D 6oCo - eviscemted whole fish
ENE
-<
t D
INNI
Mean 4o K concentration
AVID FRED GLENN
Collection site
NR L Y LEI
Fig. 42. Average 55
Fe and ” Co concentration in goatfish from Enewetak Atoll, Octc to December, 1972. The 40K v 1 a ue is the mean from all goatfish samples.
-144-
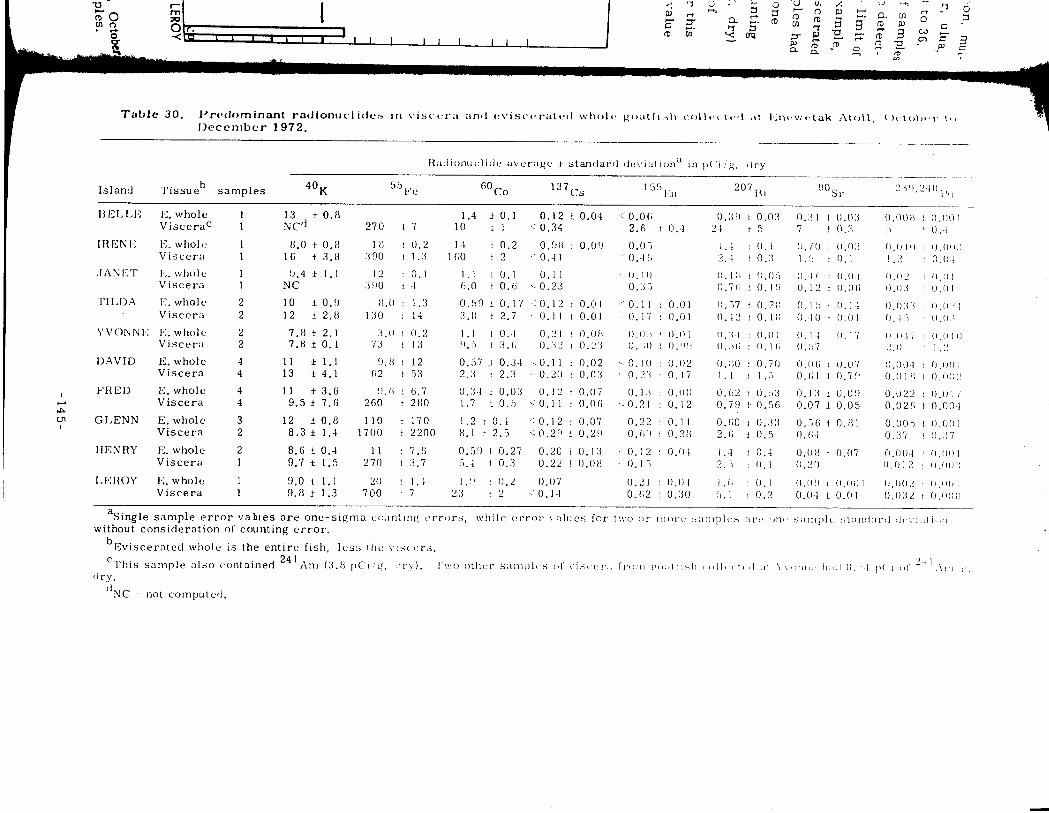
3le.s had
one
lntin
g
dry) ., of
r th
is
value
1 LEI
N
-
d 0,
2: --
-

Table 31. Predominant radi;nuclides in convict surgeon collected at Enewetak Atoll, October to December 1.972. -
Island No. of
Radionuclide average f deviationa in pCi/g, dry
Tissue samples 4oK 55Fe GOCo 137Cs 1 5 5 ,,‘,I 207T3i
DO Sr
230,240 I ‘II
J3ELLE E. whole ViSCcr:l
3 11 3b
f 3.1 14 f 11
1 13 f 1.1 1 14 f 2.0
2 9.6 t 0.7 2 10 f 0.8
3 8.9 f 1.2 3 14 It 4.8
3 8.2 * 0.7 3 10 f 3.3
4 10 f 3.4 4 17 f 3.4
3 11 f 2.9 3 12 f 3.8
1 11 f 1.2 1 16 f 0.7
3 8.9 f 0.7 2 11 f 1.3
3 10 t 3.5 2 13 >l
0. 1 I 1 0.0 5 I).!rl I o.o:i fl.11’7 I ~I.fll: 2.0 I 1.b I .!I I 0.7 I .:I I 0.4
0.15 1.2 1 O.OG 0.11 I 0.01 1.1 f 0.2 I7 i 1 I5 t I.5
0.03 to.01 0.31 i 0.01 0.03 I o.o:i 0.20 -F 0.01 0.17 f o.o‘l 0.3G i 0.25
‘-0.02 f 0.01 0.25 1 0.28 0.071 t O.Ofli 0.17 f 0.09 0.23 f 0.06 0.81 I 0.02”
,‘0.02 1 0.01 O.lII f 0.22 0.022 I 0.01 (i 0.33 1 0.24 0.17 1 0.01 O.GO f 0.4:i
,:o.ou * 0.05 0.08 f 0.10 0.21 f 0.04 0.42 f 0.23
-0.05 k 0.03 0.02 1 0.01 c 0.10 f 0.05 0.05 * 0.02
O.OG f 0.02 sx 0.01 0.74 f 0.04 ,‘0.20
,-0.15 IO.00 0.02 f- 0.01 0.96 f 0.02 0.02 -f 0.01
0.25 f 0.07 0.1.1 L 0.07 3.1 f1.7 0.24 f 0.03
0.02G ! 0.0111 0.031 t 0.010
0.08 k 0.09 0.031 t 0.0x.3
O.!IL) I O.OL’ 0.05 ! 0.01
0.074 t 0.12 0.0.15 t o.on-i
0.0011 I O.OOL’ 0.27 I 0.15
12 ( 0.6 150 I 50
10 f 0.1 160 -I 12
2.3 I 0.4 I 0 I 2.4
28 f 0.4 210 f3
0.22 i 0.02 0.96 f 0.20
1.1 I 0.2 1.0 f 0.U
,:I 0 .o !I 0.4!) I O.lJ!l
IRENE E. whole Viscera
JANET E. whole Viscera
URSULA E. whole Viscera
YVONNE E. whole Viscera
DAVID E. whole Viscera
G.7 f 0.2 6.0 f 0.4
< 0.14 5.8 t 0.3
5.4 L 2.0 28 f- 4.2
3.0 t 0.9 19 t 7.8
1.9 f 0.8 2.8 t 6.4
0.23 f 0.03 0.16 f 0.12
‘. 0.04 j 0.01 0.17 1 0.10
-:0.01 i 0.01 0.18 f 0.15
,-:0.04 f 0.01 0.20 1 0.0:)
0.22 f 0.08 0.98 f 0.37
1.2 f 0.6 5.7 f 1.6
0.17 f 0.07 0.19 * 0.10
0.58 f 0.2-1 0.72 f 0.25
1.6 f 0.7 17 f 4.3
0.21 f 0.09 2.1 f 2.1
0.13 i 0.05 0.14 k 0.08
‘CO.13 .t 0.08 <O.lG k 0.13
FRED E. whole Viscera
0.33 k 0.2 3.1 f 0.8
:0.10 f 0.05 0.57 * 0.19
0.11 t 0.04 0.09 f 0.04
<o.oo 1 0.05 co.10 1 0.05
s-o.17 < O.OG
co.09 * 0.07 < 0.13 t 0.02
<0.08 f O.Ofi kO.13
<
GLENN E. whole Viscera
0.4 1 0.40 3.3 f 0.08
0.18 t 0.03 0.15 f 0.04
- 12 -f 0.7
HENRY E. whole Viscera
8.2 f 0.5 78 * 3.5
0.47 I 0.32 2.0 f 2.6
0.10 k 0.05 0.15 f 0.09
LEROY E. whole Viscera
16 i 6.0 160 i 40
1.0 f 0.3 3.4 k 4.2
0.16 k 0.05 0.26 f 0.20
-
aSingle sample error values are one-sigma counting errors, without consideration of counting error.
while error values for two or more samples are one sample starxlarrl clt:vi:\tir)n
b Two samples of viscera from convict surgeon collected at l3l:I,J,J: harl an average 24 1
found in two samples of viscera from IJRSIILA (average, 0.34 pCi/g, Am l(:vc~J of 0.7.1 [‘(‘i/g, t1l.y. :~fn~~t~ic~llitr~-2~1 1 w;v_, ,SIL)O
dry) and one sample of visrcrn frorrl YVONn’i:: (3.7 pCi/q, (fry).
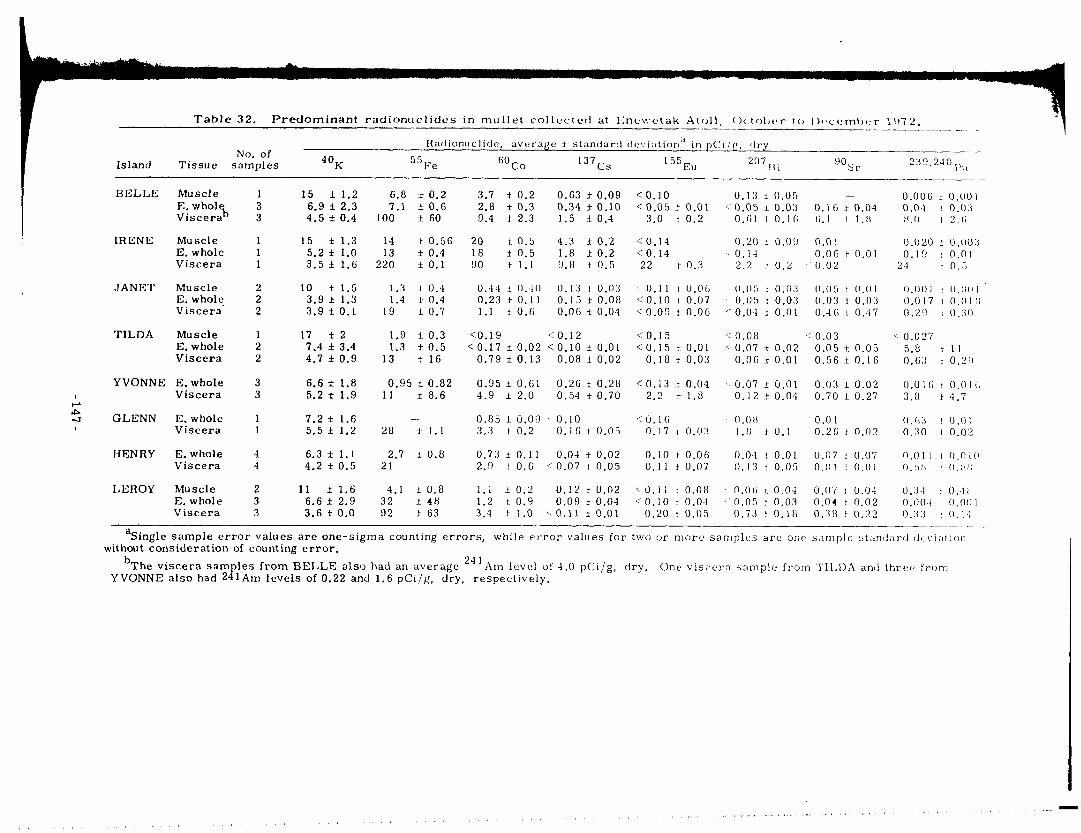
Table 32. Predominant radionuclidcs in mullet collcctecl at I,;nev.‘ctak Atoll, 0~ tol)cr to l)*accm\)+:r 1!)72. 4
‘. --___
Island
Radiontrrlide, average i standard clc~:iation No. of
” in p(Il/g, ‘Iry
Tissue samples 4oK 55Fe G°CO l3?Cs 155[:u 20713i OOSr ZLi’J,UO - 1’U
BELLE Muscle E. whols Viscera
IRENE Muscle E. whole Viscera
JANET Muscle E. whole Viscera’
TILDA Muscle E. whole Viscera
YVONNE E. whole 1 Viscera
2 4 GLENN E. whole 1 Viscera
HENRY E. whole Viscera
LEROY Muscle E. whole Viscera
1 15 f 1.2 3 6.9 f 2.3 3 4.5 f 0.4
1 15 * 1.3 1 5.2 f 1.0 1 3.5 f 1.6
2 10 f 1.5 2 3.9 f 1.3 2 3.9 f 0.1
1 17 *2 2 7.4 f 3.4 2 4.7 f 0.9
3 6.6 f 1.8 3 5.2 f 1.9
1 7.2 f 1.6 1 5.5 f 1.2
4 6.3 f 1.1 4 4.2 f 0.5
2 11 f 1.6 3 6.6 f 2.9 3 3.6 f 0.0
6.8 f 0.2 7.1 f 0.6
100 f fro
14 k 0.56 13 f 0.4
220 -t 0.1
3.7 & 0.2 0.63 f 0.09 2.8 f 0.3 0.34 -t 0.10 9.4 f 2.3 1.5 + 0.4
20 i 0.5 4.3 t 0.2 18 * 0.5 1.8 +z 0.2 90 f 1.1 D.fl t 0.5
< 0.10 10.05 1 0.01
3.0 t 0.2
< 0.14 < 0.14 22 t 0.3
0.13 f 0.05 - I. 0.05 f 0.03 0.16 1 0.04
O.Gl I 0.16 6.1 I 1.11
0.20 f 0.0:) 0.0 1 0.14 0.06 f 0.01 2.2 i 0.2 0.02
0.006 f 0.001 0 .n -1 t 0 :3 .o #.I) I “.(I
0.020 I O.OO:$ 0.19 4 0.01
24 t 0.5
1.3 I 0.4 1.4 I 0.4
19 i 0.7
0.4‘1 1 0.~10 0 . I :I ! 0 .03 0.23 f 0.1 I 0. I:, F 0.08 1.1 * 0.6 0.06 i 0.04
1.9 * 0.3 co.19 co.12 1.3 f 0.5 co.17 f 0.02 co.10 f 0.01
13 f 16 0.79 f 0.13 0.08 f 0.02
0. 1 I I 0.0 fi co.10 ! 0.07 c’O.03 ? O.OG
< 0.15 co.15 i 0.01
0.18 f 0.03
0.95 t 0.82 11 f 8.6
- 28 i 1.1
2.7 i 0.8 21
co.13 f 0.04 2.2 i 1.8
,: 0 6 . I 0.17 1 o.o:j
0.10 t 0.06 0.11 f 0.07
co.11 t o.otj ~-0.10 ! 0.04
0.20 t 0.05
O.O!i I 0.03 0.05 1 0.01
’ 0.05 t 0.03 0.0 3 I 0.0 3 ,c 0.04 t 0.01 0.46 I O:i7
,: 0.0 8 ~’ 0.03 ( 0.07 * 0.02 0.05 * 0.05
0.06 f 0.01 0.56 f 0.16
‘_ 0.07 * 0.01 0.03 f 0.02 0.12 t 0.04 0.70 f 0.27
o.n:c 0.01 1.U to.1 0.26 j 0.02
0.04 f 0.01 0.07 f 0.07 0.13 t 0.05 0.01 I 0.01
4.1 k 0.0 32 f 48 92 1 63
0.06 t 0.04 0.07 f 0.0-l 0.05 f 0.03 0.04 t 0.02 0.73 t 0.1)) 0.:111 I 0.22
0.00 I I O.llfl I
0.017 I O.OIli 0.2 !I I o.:((l
’ 0.027 5 .8 t II 0.63 t 0.29
0.0 1 (i f 0.0 I <i 3 . II f 4.7
(I.fi3 I O.OI 0.30 I 0.02
fl.Oll I O.OlO o.:iir I o.l;rl
0 :j -1 . t 0:lll O.r)Oi / O.Ofll o.:I:( t 0.1.1
aSingle sample error values are one-sigma counting errors, while error values for two UT more samples are oncx sample st:incl;lrll (lcvi;~t~on without consideration of counting error.
b The viscera sam les
24 1
YVONNE also had 2 g from BELLE also had an average Am level of 4.0 pCi/g, dry.
1Am levels of 0.22 and 1.6 pCi/g, dry, respectively. 0ne viscera sample from l’II,DA an(l three! from
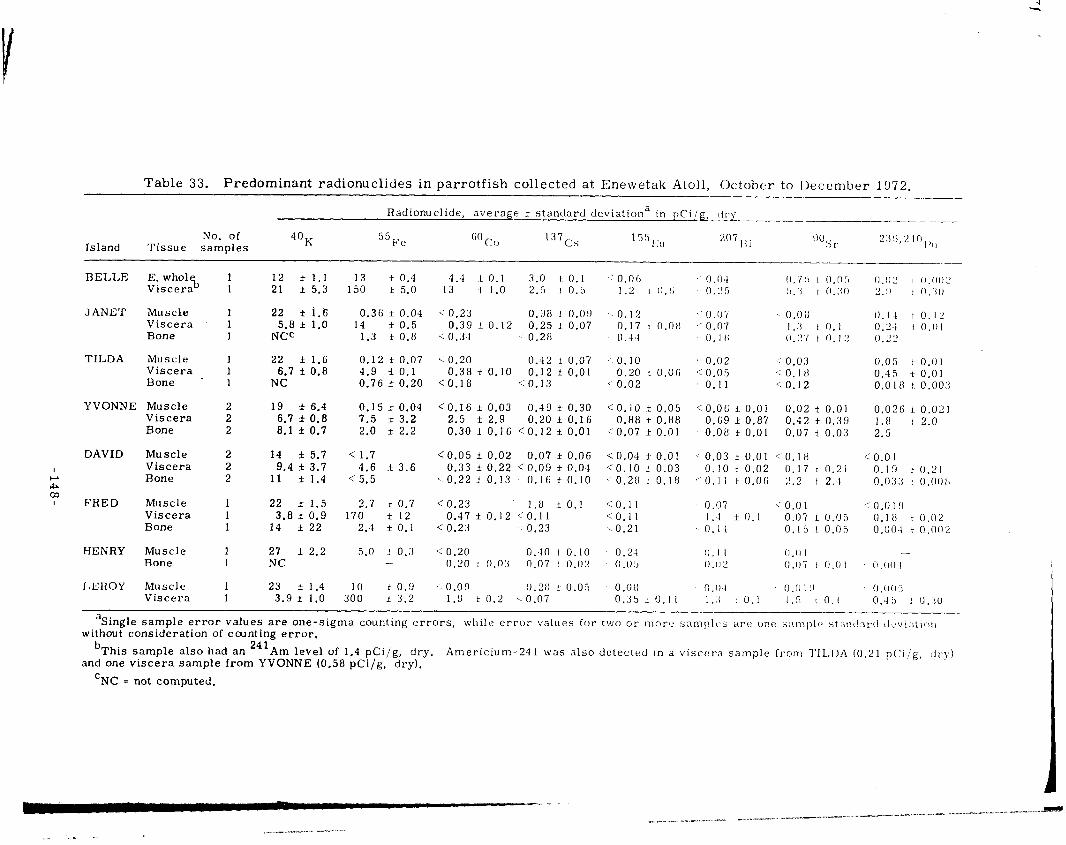
Table 33. Predominant radionuclides in parrotfish collected at Enewetak Atoll, October to I>eccmber 1072.
Radionuclide, a average k standard deviation III pCi/g, dry I__--
Island No. of
Tissue samples 4oK
BELLE E. whols Viscera
1 1
JANET Muscle Viscera Bone
1
TILDA Muscle Viscera Bone
YVONNE Muscle Viscera Bone
DAVID Muscle
I Viscera
z Bone
03 I FRED Muscle
Viscera Bone
HENRY Muscle 1 Bone 1
LEROY Muscle Viscera
1 1
12 k 1.1 21 f 5.3
22 f 1.6 5.6 f 1.0
NCc
22 f 1.6 6.7 k 0.8
NC
19 f 6.4 6.7 f 0.8 8.1 f 0.7
14 f 5.7 9.4 f 3.7
11 f 1.4
22 f 1.5 3.8 f 0.9
14 f 22
27 f 2.2 NC
23 * 1.4 3.9 f 1.0
13 f 0.4 150 t 5.0
0.3G zt 0.04 14 f 0.5
1.3 k 0.6
0.12 k 0.07 4.9 f 0.1 0.76 f 0.20
0.15 f 0.04 7.5 f 3.2 2.0 f 2.2
< 1.7 4.6 t 3.6
< 5.5
2.7 i 0.7 170 f 12
2.4 f 0.1
5.0 i 0.3 -
10 1 0.9 300 f 3.2
4.4 t 0.1 3.0 t 0.1 13 I 1.0 2.5 I 0.5
c 0.23 0.!16 i 0.00 0.39 k 0.12 0.25 f 0.07
x: 0.31 ~ 0.2fj
i 0.20 0.42 t 0.07 0.36 t 0.10 0.12 f 0.01
CO.16 <:0.13
CO.16 * 0.03 0.49 f 0.30 2.5 f 2.9 0.20 f 0.16 0.30 f 0.16 co.12 -f 0.01
co.05 f 0.02 0.07 * 0.06 0.33 f 0.22 co.09 f 0.04
~-0.22 f 0.13 0.16 k 0.10
< 0.23 I.8 f 0.1 0.47 f 0.12 ;0.11
< 0.23 0.23
< 0.20 O:lO i 0.10 0.20 I o.o:i 0 _ 0 7 ! 0.02
‘. 0.09 0.211 t 0.05 1.9 i 0.2 LO.07
c 0.06 1.2 I Il.(i
0.12 0.17 t O.Oti
0.44
-.O.lO 0.20 t O.OG
c 0.02
co.10 f 0.05 0.88 k 0.66
co.07 f 0.01
<0,04 f 0.01 co.10 k 0.03
0.26 t 0.16
co.11 c 0.11 I- 0.21
0.24 0 .05
O.Of1 0.35 IO.11
0.04 0.75 I o.o:, 0 ” ‘5 I . :,.:i 1 o.:<o
0.07 O.Oli I’ 0.07 I.9 10.1
0. I II o.“‘/ 1 0.12
0.02 ‘. 0.03 s: 0.05 s: 0. 1 f%
0.11 ~:0.12
< 0.06 k 0.01 0.02 t 0.01 O.GS f 0.87 0.42 t 0.30 0.08 f 0.01 0.07 j 0.03
0.03 f 0.01 CO.18 0.10 i 0.02 0.17 I 0.21
I. 0. I1 t 0.01i 2.2 12.4
0.07 ,‘O.OI I.4 i 0.1 0.07 t 0.05 0. I.1 0.15 ! 0.05
(1.1 1 0.0 I o.cr:! 0.07 I O.(II
0 .(I-! u.r1 I !I
1 .:i I 0.1 1.5 10.1
o.o:! I I).OOL’
Z.!) I n.:lo
0. I 4 IO.12 0.24 I n.01 () ‘2 ‘,
. . &,
0.05 1 0.01 0.45 t 0.01 0.018 t 0.003
0.02G 10.021 1 .fl i 2.0 2.5
:: 0.01 O.lS i 0.21 0.03:j I 0.0011
: 0,019 O.lfl I 0.02 0.00-l t o.on2
0.(1(1 I
rI.orI:,
0.45 : u.:ju
aSingle sample error values are one-sigma counting errors, without consideration of ccamting error.
while error values for two or more snmpl(,s are one s;~mplc stancinrcl (!czvi:itiori
b This sample also had an 241
Am level of 1.4 pCi/g, dry. and one viscera sample from YVONNE (0.58 pCi/g, dry).
Americium-241 was also detected in a viscera sample from TIL,I)A (0.21 pCiig, clry)
‘NC q not computed.
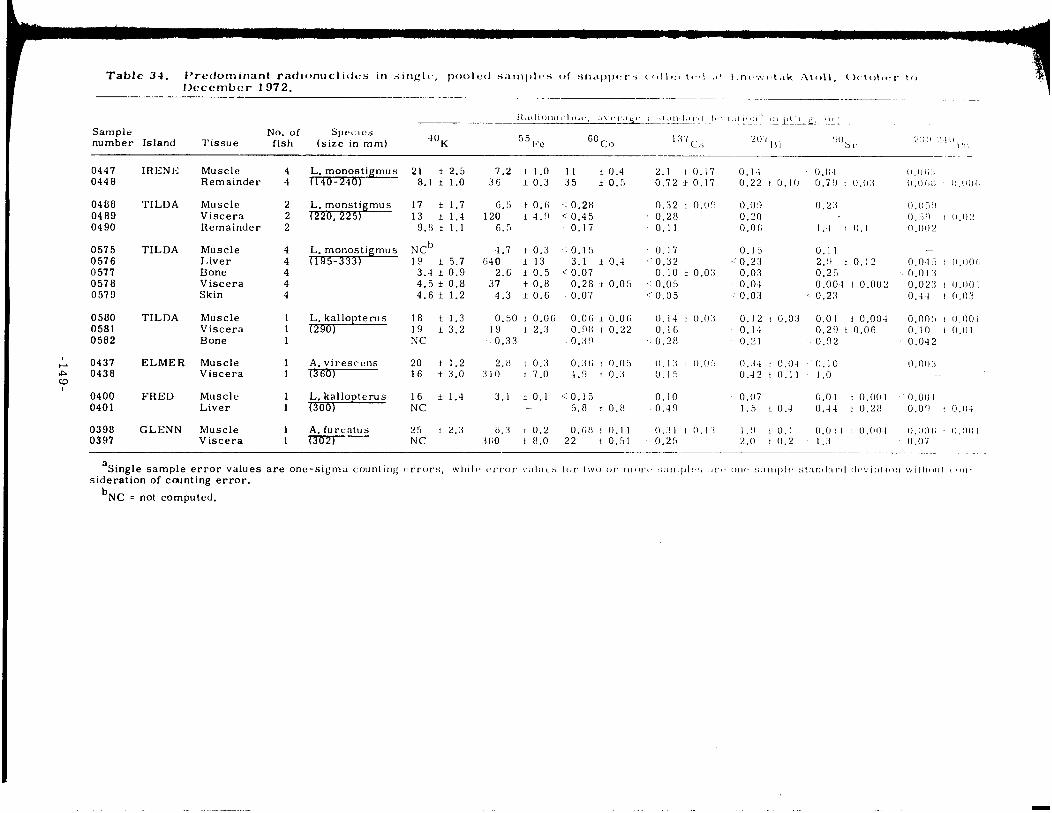
0447 0448
0488 0489 0490
0575 0576 0577 0578 0579
0580 0581 0582
g 0437 0438
CD I
0400 0401
0398 0397
IRENIS
TILDA
TILDA
TILDA
ELMER
FRED
GLENN
Muscle Remainder
Muscle Viscera Remainder
Muscle Liver Bone Viscera Skin
Muscle Viscera Bone
Muscle Viscera
Muscle Liver
Muscle Viscera
4 4
2 2 2
4 4 4 4 4
1 1 1
1 1
1 1
1 1
L. monostigmus ?140-240)
L. monostigmus X195-333)
$&llopterus
A. viresccns 7360)
k&llopterus
A. furcatus 7302)
21 i 2.5 8.1 f 1.0
17 i 1.7 13 f 1.4
9.8 i 1.1
NC” 19 i 5.7 3.4 * 0.9 4.5 f 0.8 4.6 + 1.2
18 i 1.3 19 13.2 NC
20 t 1.2 16 f 3.0
16 i 1.4 NC
25 I 2.3 NC
7.2 i 1.0 11 t 0.4 36 f 0.3 35 i 0.5
G.5 f 0.G .‘O.ZU 120 i -1.:) < 0.45
s.5 I 0.17
4.7 t 0.3 <:0.15 G4 0 i 13 3.1 f O.-i
2.G i 0.5 CO.07 37 t 0.8 0.28 IO.05
4.3 f 0.6 0.07
0.50 t O.OG O.OG f 0.01; 19 f 2.3 o.ncc : 0.22 .0.33 0.X!)
2.11 I 0.3 0. :I fi I 0.0 5 3 1 0 i 7.0 A.!1 f 0.3
3.1 i 0.1 ,:0.15 - 5.8 f 0.11
II.3 t 0.2 O.lili I 0.1 I :j GO I IS.0 22 t 0.51
2.1 I 0.17 0.72 f 0.17
0.32 I 0.0’1 0.28 0.11
0.17 (’ 0.32
0.10 to.03 0.05
,‘0.05
0.14 I 0.0:1 O.lG 0.28
0, I:< j O.(li~ 0.15
0.10 0.49
(I.31 I O.I’i
0.25
0.1-l 0.22 t 0.10
O.O!) 0.20 0.01;
0.15 ,‘0.23
0.03 0.04
” 0 0 3
0.12 t 0.03 0.14 0.21
0:i.i I 0.0-1 0.42 I 0.11
0.07 1.5 t 0.4
I ,!I I 0.1 2.0 I 0.2
0.114
0.7:) f o.o:i
0.23 -
1.4 I 0.1
0.11 2.:) t 0.12 0.25 o.ofl1 I 0.002 0.23
0.01 f 0.001 0.2!) t O.OG 0.92
0. IO I .o
0.01 I 0.01) 0.11 f 0.211
0.0 I I ! O.(ll) I .:j
- 0.04 3 1 l1.l101~
0.0 I 3 0.023 f O.OOl 0.4-l t 0.03
0.005 f 1).1lOi 0.10 ! 0.01 0.042
l1,no.i
1 0 . 00 I 0.0’) t O.(ll
I 0.111)0 / ll.1)0 I 0.07

Table 35. Predominant radionuclides in single, pooled samples of groupersa December 1972.
collected at Enewetak Atoll, October to
Radionuclide, average f standard deviation tl In pCi/g, dry
Sample No. of number Island Tissue fish
40 K
0543 TILDA E. whole 2 NCc 1.3 f 0.3 co.17 co.11 < Viscera 0.09 k’ 0544 2 14 CO.08 0,003 f 3.8 94 f 3.5 1.1 f 0.3 co.19 0.17 0.70 0.043
8022 YVONNE Muscle 1 18 f 1.4 5.ti IO.1 ~. 0.74 8023 f 0.12 0.33 t Viscera 0.09 2.5 i 0.1 0. 3 0 1 19 i- 2.7 430 f 1.3
0.001 36 8024 f 0.6 co.24 f Bone 4.6 L 1 0.2
NC 3.1 0.07
f 0.2 0.03!; t O.Ol!l s:
0.23 co.15 0.13 “ 0.10
0.04 0.50 t 0.04
0403 FRED Muscle 1 15 * 1.1 0.47 * 0.05 co.14 0.53 I 0.07 2.1 f 0.1 k, 0404 Liver 1 3.1
f 0.8 160
0.03 f 0.5
;0.01-1 2.1 f 0.1 < 0.05 1.1 f 0.1 0.14 1 0.01 0.11 I 0.O.l
0405 FRED Muscle 1 15 _t 1.5 13 0406 1 0.3 ~CO.43 f 0.11 Liver 0.51 j 0.09 k 1 NC
O.IXj 0.07 LO.01 4900 f 50
0.007 94
10.001 f2 c: 0.53 0407 < Bone 0.40 1
9.7 3.1 0.22
13 0.038 f 0.007
* 2.0 f 0.3 CO.18 co.13 0.09 zt 0.04 0.034 1 0.003
0369 FRED E. whole 3 8.4 f 1.2 1.1 f 0.1 ,:0.10 < 0.06 0.06 I, 0370 Viscera 3 NC
0.02 0.003 I 1.3
I 0.001 k 0.2 co.12 (\ 0.10 0.05 * 0.01 0.13 f 0.01
F u-l 0
aAll groupers were Epinephelus sp. except one grouper from FRED (0405-0407) vh ich was variola louti. I b
Error values are one-sigma, counting errors.
‘NC = not computed.

Radionucll(le, average t standsril tlr’vi;lrli,n I,
Sample number Island
No. of Tissue fish 4oK 55b‘e 60Co 137c’s ‘07 ISi
!)O s I’
2X!1,2 10 ,‘,,
0545 0546 0547
0032 6033 8034
0457 0456
0434 0435
0266
TILDA Muscle Viscera Bone
YVONNP: Muscle Viscera Bone
ELMER Muscle Viscera
FRED Muscle Viscera
HENRY E. whole
1 1
1 1
2
15 f 1.0 5.6 f 0.2 0.06 0.24 f 0.05 0.25 I 0.0-l CO.11 9.6 f 1.1 - 0.60 j 0.08 = 0.08 II t 0.2 0.11 I O.(ll 3.2 f 1.1 4.0 i 0.2 0.05 0. I3 1 0.05 ‘( .o ! 0.11 o.:j7 I 0.05
1 )I I 1.f; IO I 0.1 1 .:I I 0.12 0.4 I) IO.1 0. i’s ! 0. I I II.0 I 15 1 1.8 :150 1 1 I 3 I 2.1 0. 15 12. i, 1 ().I? 0.0’7 NCC 3.X * 0.2 ,.’ 0.20 0.20 O.G2 i O.l!I 0.10 I o.oi
19 f 1.2 25 i 0.3 1.5 k 0.15 0.54 -f 0.08 0.!12 t 0.06 0.11 NC 33 f 1.0 I.5 i 0.75 ‘ 0.27 2.11 1 0.27 1.5
21 i 1.4 150 i 0.F 2.2 f O.l!J 0.3 6 I 0.10 il.7 I 0.13 n.o:, I 0.01 NC 510 f3 8.9 k 0.52 ~~0.F-l 2 0 6 ? IT.0 0.24 t 0.05
16 f 2.6 20 1 0.G 3 . 0 1 0.3 9 1.0 1 0.29 2-Iii t 1.5 0.411 ! 0.02
0.001 0.0 I 1 0.5~1
o.ll.i:!
0.0 I (i
‘- 0.002 0.002
n.00:i
15
0.004
O.IIO I
(1 .o I
0 0011
0.00 I
0.00 1 O.‘i
O.f101
1
GI aAll ulua were Caranx melampygus except fish from IIENRY, which wvrc C. sexfasciatus. W b 1 Error values are one-sigma counting errors.
‘NC = not computed.
_ ^ ^ . _ , . . , . . . . . . . -

Goatfish - The results of the radio-
logical analyses of the goatfish tissues
are gilTen in Table 30. Each sample was
made up of the tissues from an average
pool of five fish. .Uthough four species
of goatfish of various size classes were
present in the samples, no apparent
species or size differences in radio-
nuclide content were noted and samples
from all species and sizes were pooled
to form the data in Table 30. Seventy-
five percent of the goatfish collected for
samples were Mulloidichthys samoensis.
The two most prevalent radionuclides
found in the goatfish were 55
Fe and 6oco ,
followed by <OK
, 207Bi 137Cs, and ,
10 -
\”
is, Q 5-
I
z ?I 3- .-
x -z C
.-
2
-‘e 1.0 -
2
s
g u - 4 0.5
._ 3
; 0.3 -
s
CS
-
1
0.1 BELLE
I
155Eu_ ~~mericcum-241 was found in 3 ,,f
19 viscera
2 from YV 239, 240Pu
samples, 1 from BELLE and
‘ONCE, while “Sr, 55Fe, sod
were found in most samples.
Potassium-40 levels showed little
variability between sampling locations or
between eviscerated whole fish and visce
samples. The ” K values for all areas
and the two tissue types averaged 9.8 pCi\
g, dry. These levels are similar to *OK ,
levels found in goatfish collected from
other areas and times in the Central i + 4
Pacific and indicate the natural levels of 40 K in goatfish from that area. a!
Iron- 55 and 60 Co were the predominant
man- produced radionuclides in the
Mean 40
J K concentmtion
,---- ----------
IRENE
n 4B(
Column legend
A ‘55Eu - eviscemted whole fish
B ‘55Eu - viscera
C 207Bi - viscem
D 207Bi _ eviscerated whole fish
I :D AE
JANET TILDA
1 : D i’ B C I
YVON NE DAVID FRED GLENN LEROY
Collection site
Fig. 43. Average 40K 155Eu and 207 .
Atoll, Octoblr to Dekember, BI concentration in goatfish from Enewetak 1972. The *OK value is the mean of all goat-
fish samples.
-152-
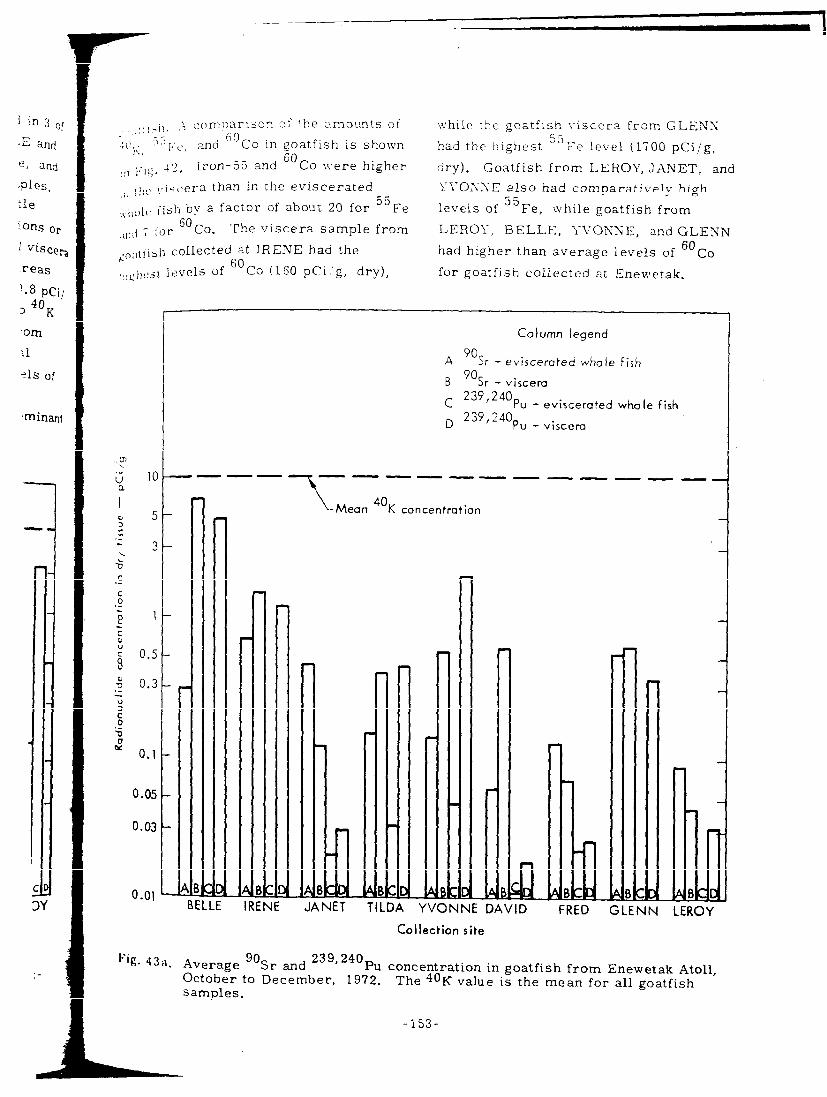
j :n3 ol
>E and
e J and
--plcs.
tle
ions or
i viscera
reas
j-8 pCi/
3 4OK ’
‘OFI
rl
?lS of
‘minant
‘_ 1 1
4
I:, -il. -4 iomparison ?f the amounts oi 3 L while :he goatfish x-isccra from GLENS
<ii,. I\ 1 r,:, b-;c, and 6 0
Co in goatfish is shown had the highest 55
60 Fe level (1700 pCi/g,
:I] j..IC. 12. Iron- 53 and CO were higher dry). Goatfish from LEROY, JANET, and
::, the L.iscera than in the eviscerated
,,$i,c,lt, fish by a factor of about 20 for j5Fe
YL’OSSE also had comparatively high
levels of 55 Fe, while goatfish from
.,l?;i 7 [or %o. The viscera sample from LEROY, BELLE, 17T70NNE, and GLENN
,.,,:,tfish collected at IRENE had the had higher than average levels of 6oco ,z!L’)I~~~t levels of 6oCo (160 pCi/g, dry), for goatfish collected at Enewetak.
10
5
3
1
0.5
0.3
0.1
0.05
0.03
0.01
r
Column legend
A 9oSr - eviscerated whole Fish
B “8, - viscera C 239,240pu
- eviscerated whole fish D 239,240pu
- viscera
-------m- -m- -- -m-.
_
7 I
\ Mean 4oK concentration
LE IRENE JANET TIL INNE DAVID .;1 B
FRED GLt hr B C
INN LEROY
Collection site
Fk. 43a. Average ‘OS, ad 23g’240 Pu concentration in goatfish from Enewetak Atoll, October to December, 19’72. The 4oK samples.
value is the mean for all goatfish
-153-

Bismuth- 207 v:as detected in most 137
_- samples, but Cs and 1” ELI were de-
tected in less than 50% of the samples. _L
comparison between 155 Eu and 207Bi
levels in the goatfish is shown in Fig. 43.
Levels of 207Bi, ‘j5Eu, and 137Cs were
generally less than 3, 0.8, and 0.4 pCi/g,
dry, respectively. The viscera samples
from goatfish collected at BELLE had the
highest levels of 207Bi (24 pCi/g, dry)
and 155 Eu (2.6 pCi.‘g, dry). Cesium-137
was highest in eviscerated whole goatfish
from 1RENE (0.98 pCi/g, dry). Europium-
155 and 207 Bi concentrations were higher
in the viscera of the goatfish than in the
eviscerated whole fish by factors of up
to 43 for 155 Eu and 62 for 207Bi but the ’ 155Eu average ratio was less than 5 for
and 5 for 207Bi. Cesium- 137 levels
were similar in the two tissue types
analyzed.
Strontium-90 and Pu data indicate
that higher levels are found in the viscera
than in the eviscerated whole fish. The
highest level of these radionuclides is
found in the viscera of goatfish from
BELLE (“Sr = 7.0 pCi/g), (23g’240Pu
q 5.0 pCi/g). Goatfish from the north-
east sector (BELLE to YVONNE) of the
Atoll generally had higher levels of these
two radionuclides than fish from the
southwest sector (DAVID to LEROY).
Strontium-90 and 23g’240Pu (viscera
samples) concentrations averaged less
than 0.5 and 0.05 pCi/g, dry, in the
northern and southern sectors of the atoll,
respectively.
Convict Surgeon - The results of
the radiological analyses of the convict
surgeon samples are given in Table 31.
Each sample was made up of the tissues
from an al-erage pool of 15 fish, and all
stations except IRENE and GLENN had
2 or more samples of both eviscerated
whole fish and viscera. All fish were one
species, Xcanthurus triostegus. No dif_
ferences due to size of fish pooled for a
sample were noted and samples from all
size classes were pooled to form the data
in Table 31.
Naturally occurring :0
55 K and man-made
Fe and 60 Co were the predominant
radionuclides in the convict surgeon,
Cesium-137, 155Eu, and 207Bi were also
present in the samples from 50070 or more
of the collection sites. Americium-241
was found in 5 of 24 viscera samples, 2
each from BELLE and YVONNE and 1
from IRENE, while 23gJ240Pu and “Sr
were found in most samples. Potassium-
40 levels showed little variability between
sampling sites. The viscera samples,
however, had a greater 40 K concentration
(13 pCi/g, dry) than did the eviscerated
whole fish sample (9.9 pCi/g, dry). Iron-
55 concentrations were about 10 times
higher in the viscera than in the eviscerate
whole fish and were highest in the viscera
of convict surgeon from LEROY and
IRENE (160 pCi/g, dry). Viscera samples
from convict surgeon collected from
YVONNE to GLENN averaged < 10 pCi/g,
dry. The viscera and eviscerated whole
fish samples from convict surgeon
collected from the Seminole Crater area
of IRENE had the highest 60 Co content
(210 and 28 pCi/g, dry, respectively) of
any of the convict surgeon samples. The
viscera of convict surgeon from BELLE
had 16 pCi of 60 Co/g, dry, and all other
samples had < 5.2 pCi/g, dry. The levels
of 6oCo > 55Fe, and 4oK in the convict
surgeon are compared in Fig. 44.
154-
30(
<
“, 10(
I ii 5( u-
.:
3( ? u C .-
zi 1( .-
i I
0,
; :
,o
4 .- u 2 l.( 0 .-
; 0.:
0 ’ . .
0 . * I
Fig. 44.
Ces:
centrat
in all s
1 PCi/g
13ks ;
su rgeoi 207
Ri 1
from L 155Eu
,
su rgeo:
Iron
levels
of the (
eviscel
tween t
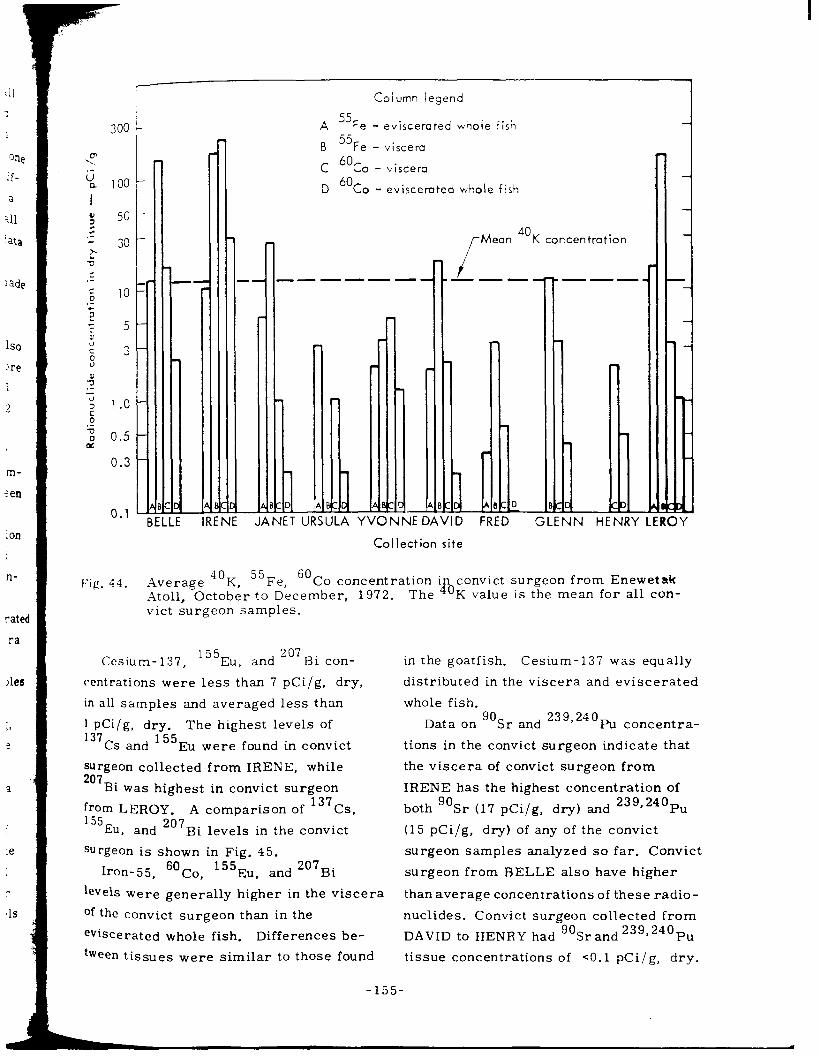
One
if-
a
41
‘ata
-a&
Is0
Ire
1
?
m-
‘en
ion
i
n-
ratec
ra
)les
ie
P .-
v,
100
I Y 50 :: .-
30
1
_ > + c .- C - 0 10 .-
i 7 5 - u 2 ,0
3-
4 .- u 2 1.0- 0
2 0.5- 0(
0.3 -
0.1 -
300
--
I E
_-
- JAN
Column legend
A 55 Fe - eviscerated whole fish
B 55Fe - viscera
c 6oco - viscera
D 6oco - eviscetuted whole fish
f ‘OK Mean concentration
YVONNEDAVID FRED C kl NN HE
Collection site
I’ic. 44. Average 4OK 55Fe 60 Co concentration in convict surgeon from Enewetak
Atoll, Octobir to Dkcember, 1972. The 4oK value is the mean for all con- vict surgeon samples.
Cesium-137, 155Eu, and 207Bi con-
centrations were less than 7 pCi/g, dry,
in all samples and averaged less than
1 PCi/g, dry. The highest levels of 137
Cs and 155 mu were found in convict
surgeon collected from IRENE, while 207
Bi was highest in convict surgeon
from LEROY _ A comnarison of 137cs . 155
EU, and 267 ’ Bi levels in the convict
surgeon is shown in Fig. 45.
Iron-55, , , 6oc~ 155~u and 207Bi
levels were generally higher in the viscera
of the convict surgeon than in the
eviscerated whole fish. Differences be-
tween tissues were similar to those found
-155-
in the goatfish. Cesium-137 was equally
distributed in the viscera and eviscerated
whole fish.
Data on 90
Sr and 23g’240Pu concentra-
tions in the convict surgeon indicate that
the viscera of convict surgeon from
IRENE has the highest concentration of
both go Sr (17 pCi/g, dry) and 23g’240Pu
(15 pCi/g, dry) of any of the convict
surgeon samples analyzed so far. Convict
surgeon from BELLE also have higher
than average concentrations of these radio-
nuclides. Convict surgeon collected from
DAVID to HENRY had “Sr and 23g1240Pu
tissue concentrations of ~0.1 pCi/g, dry.

10
\” u, 5
I 3
? z ._
x n” 1.0 C ._
.E 0.5 .G ,’ 0.3 b ”
;
2 0.1 J 2 0
0 0.05
s 0.03
0.01
Mean LO
f K concentration
---~~---~~~~-~_ ‘ss
Column legend
A 13’C5 - entire fish
B ‘55Eu - eviscerated whole fish
BELLE ~ ICDE
IRENE JANET
C ‘55Eu - viscera
D 2070i - viscera
E 207Bi - eviscerated whole fish
i ABCC 1 1 URSULA YVONNE DAVID
Collection site
h )E
FRED 1 A I
HENRY LEROY
3n7 Fig. 45. Average 137Cs, 155Eu, and &“’ Bi concentration in convict surgeon from
Enewetak Atoll, October to December, 1972. The 4oK value is the mean for all convict surgeon samples.
Mullet - The results of the radio-
logical analyses of the mullet tissues are
given in Table 32. Each sample was
made up of the tissues from an average
pool of 10 fish. Although four species of
mullet of various size classes were
present in the samples, no correlation of
radionuclide concentration with species
or size was noted and samples from all
species and sizes were pooled to form the
data in Table 32. Sixty percent of the
mullet collected for samples were
Neomyxus chaptalii.
Of the three commonest radionuclides
found in the mullet, 4oK and 55
Fe were
found in all samples, while 60 Co was four
in over 90% of the samples. Cesium-137, 155
Eu, and 207Bi were found in 44%, 26%
and 26% of the samples, respectively.
Americium-241 was found in all the
viscera samples from BELLE and
YVONNE and in one of two viscera sampl
from TILDA. Plutonium-239,240 and 90
Sr were found in most samples.
Variability of 40 K levels between
sampling locations was within the normal
range of expected values. Muscle tissue
had the highest average 40 K concentratio,
13 pCi/g, dry, of the three tissue types
analyzed. Eviscerated whole fish and
vise
rcq
=F,
Fig. c,OC
rad’
in t.
evir
had 155
the
in 1
-156-
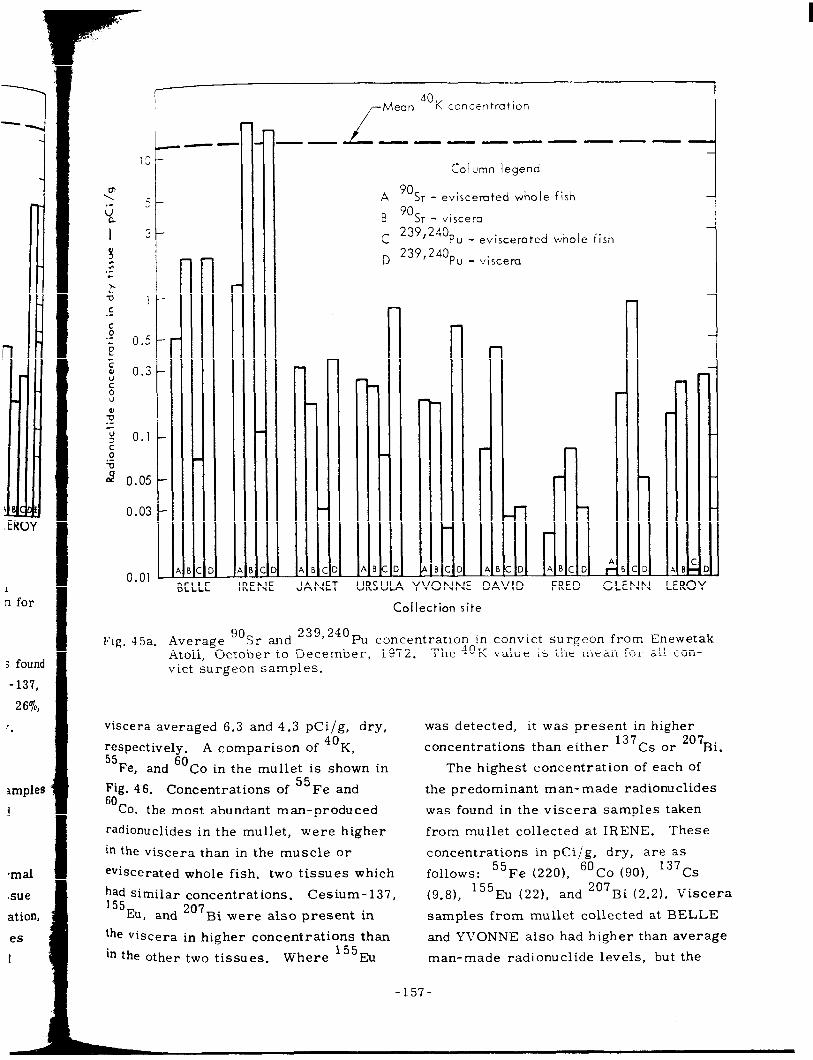
n for
j found
- 137,
26%, . .
imples
1
*ma1
#sue
ation,
es
I
i3
Mean 40
_L!-
K concentration
Col timn legend
9os, - eviscemted whole
9oS, - viscera
239,240PU _ eviscerated
239,240pu - viscera
fish
whole fish
b : D
IRENE JANET -URSULA -YVONNE- DAVID FRED
I:ip. 45a. Average 9os, and 239,240fi
Atoll, -October to December, vict surgeon samples.
GLENN LEROY
viscera averaged 6.3 and 4.3 pCi/g, dry,
respectively. A comparison of 4oK , 55
Fe, and 6o Co in the mullet is shown in
Fig. 46. Concentrations of 55 Fe and
60 Co, the most abundant man-produced
radionuclides in the mullet, were higher
in the viscera than in the muscle or
eviscerated whole fish, two tissues which
had similar concentrations. Cesium-137, 155&
, and 207 Bi were also present in
the viscera in higher concentrations than
in the other two tissues. Where 155Eu
Collection site
concentration in convict surgeon from Enewetak 1972. The -10~ value is the mean for all con-
was detected, it was present in higher
concentrations than either 137
Cs or 207Bi.
The highest concentration of each of
the predominant man- made radionuclides
was found in the viscera samples taken
from mullet collected at IRENE. These
concentrations in pCi/g, dry, are as
follows: 55Fe (2201, 6oCo (901, 137Cs
(9.81, 155Eu (221, and 207Bi (2 2) Viscera . .
samples from mullet collected at BELLE
and Y\‘ONNE also had higher than average
man-made radionuclide levels, but the
-157-
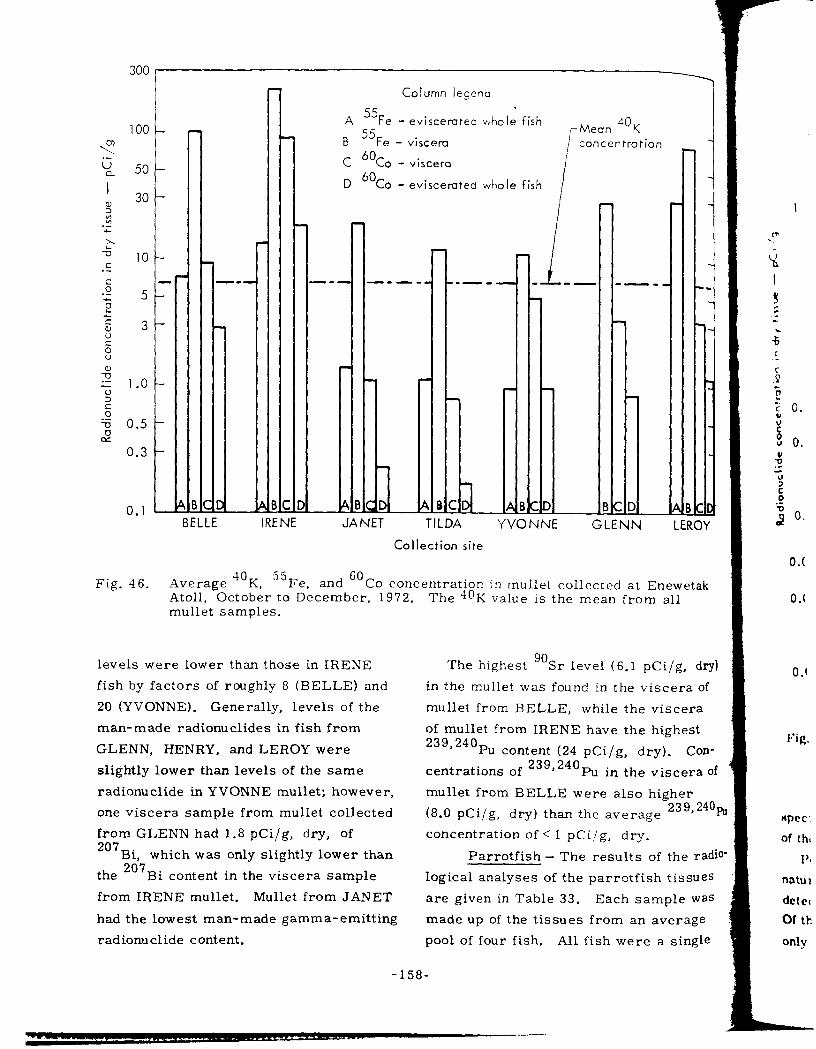
300
100
50
30
10
5
3
1 .o
0.5
0.3
0.1
Fig. 46.
BELLE .A! IRENE
Column leGend
A 55Fe - eviscemtec whole fish
B 55Fe
,-Mean &OK
- viscem i concertration
c 6oco /
- viscera
D 6oCo - eviscemtec whole fish
JA NET TILDA YVONNE GLENN LEROY
Collection site
-4verage 4OK 55 Fe and ” Co concentration in mullet collected at Enewetak
Atoll, October to December, 19’72. The 4oK value is the mean from all mullet samples.
levels were lower than those in IRENE
fish by factors of roughly 8 (BELLE) and
20 (YVONNE). Generally, levels of the
man-made radionuclides in fish from
GLENN, HENRY, and LEROY were
slightly lower than levels of the same
radionuclide in YVONNE mullet; however,
one viscera sample from mullet collected
from GLENN had 1.8 pCi/g, dry, of 207
Bi, which was only slightly lower than
the 207 Bi content in the viscera sample
from IRENE mullet. Mullet from JANET
had the lowest man-made gamma-emitting
radionuclide content.
The highest “Sr level (6.1 pCi/g, dry)
in the mullet was found in the viscera of
mullet from BELLE, while the viscera
of mullet from IRENE have the highest
23gJ240Pu content (24 pCi/g, dry). Con-
centrations of 239,240 Pu in the viscera of
mullet from BELLE were also higher
(8.0 pCi/g, dry) than the average 23 9, 240p
concentration of < 1 pCi/g, dry.
Parrotfish - The results of the radio
logical analyses of the parrotfish tissues
are given in Table 33. Each sample was
made up of the tissues from an average
pool of four fish. All fish were a single
1
0.c
0.f
I:ig.
ItpCC:
of th,
1’1
natul
dctec
ore
only
-158-

10
<
$ 5
’ 3 Y ‘c .- z + C
.- 1 C 0 .-
5
2 0.5 Z G 0 0.3 4 .- ‘; 2 0 .-
j 0.1
0.05
0.03
0.01 BELLE IRENE
Column legend
A 9oS, - eviscerated whole fish
B 9oSi- - viscera
c 239,240P,, _ eviscerated whole fish
D 239,240Pu - viscera
--mm-
t
mm----_
Mean 4o K concentration
Col lecfion site
c ABC HEN
I
bz. 46a. Average 90 Sr and 239,240 Pu concentration in mullet collected at Enewetak
Atoll, October to December, 1972. The 40K value is the mean for all mullet samples.
species, Scarus sordidus,
Of the same size class (24
and most were more than 50bc of the samples.
to 36 cm). Cobalt-60, 155Eu, and 207Bi were
Potassium-40 was the most abundant detected in 44%, 22oJ, and 15% of the
nahrrally occurring radionuclide and was samples, respectively. Americium-241
detected in all of the parrotfish samples. was detected in three viscera samples,
Of the man-produced radionuclides, one each from BELLE (1.4 pCi/g, dry),
only 55 Fe and 137 Cs were present in TILDA (0.21 pCi/g, dry), and YVONNE
-159-

300
100
50
-? Gj 30
I
4 z .-
2 -u 10
C ._
E ._
2 5.0
2
z 5 3.0 v
4 ._ _; 2
G I.0 CS
0.5
0.3
0.1
-_
JP rNET
Coiumn legend
A 55Fe - muscle
B 55Fe - viscera
c 6oco - viscera
D 6oCo - muscle
Meon 4o K concentration
---w
h, :D h, :D /
TILDA YVONNE
Cal lection site
Fig. 47. Average 4oK 55Fe and 6o Co concentration from arrotfish collected at Enewetak Atoll, The 48 K value is the mean for all parrotfish
h :D
ID FRED L
(0.58 pCi/g, dry). Plutonium-239,240
and go Sr were detected in most samples.
Potassium-40 levels showed little
variability between sampling locations,
except for one viscera sample from fish
collected at BELLE, which had a 4oK
in muscle and viscera samples October to December, 1972. muscle and viscera samples.
concentration of 21 pCi/g, dry, which was
about three times greater than the average
value for parrotfish viscera. All samples
had 4o K values within the expected range 4
of natural levels, with muscle and viscera i
averaging 18 and 6.5 pC i /g, dry, respectiveIF
-160-
1;
.p ! i-1
0
I c !! . . .-
e.
+ \.( c .-
5, .- > .! 0 . F “, 0.:
5 4 .- u i 0:
s 0.01
0.0:
0.0’
Fig. .
:I co1
Icvc~s
f:ig. 1
It-0
produ
parro
levels
fi. dr:
i,KRC

10
\” 5
i;l a
I 3 u ? .L-
i- 1.0 c .-
; .i 0.5
=t
z : 0.3
”
-0” .- u >
s 0.1 S
s
0.05
0.03
0.01
_---
/Mean 4oK concentration
-- -m-m
Column legend
90,_ JI - eviscerated whole fish
9osr - viscera
239,240pu - eviscerated whole fish
B_c_l rNE1
E IDA
239,240pu - viscera
FRED
A nBCD
HENRY LEROY
1
Collection site
1Qg. 47a. Average 90 sr and 239,240
Pu concentration in muscle and viscera samples from The 4 B
arrotfish collected at Enewetak Atoll, October to December, 1972. K value is the mean for all parrotfish muscle and viscera samples.
A comparison of , 40K 55 Fe, and 6oco
levels in the parrotfish is shown in
I’ig. 47.
Iron-55 was the most abundant man-
Produced radionuclide detected in the
Parrotfish samples. The highest 55Fe
levels were found in the viscera (300 pCi/
gn dry’) and muscle of parrotfish from
LEROY, while the average level was
2.6 pCi/g, dry, in muscle and 82 pCi/g,
dry, in viscera.
The other two common man-made
gamma-emitting radionuclides detected
in the parrotfish were 6oCo and 137Cs.
Cesium was detected in more samples
(55%) than 6o Co (44%), but the highest 60
Co level (13 pCi/g, dry) in viscera from
BELLE parrotfish was higher than the
-161-
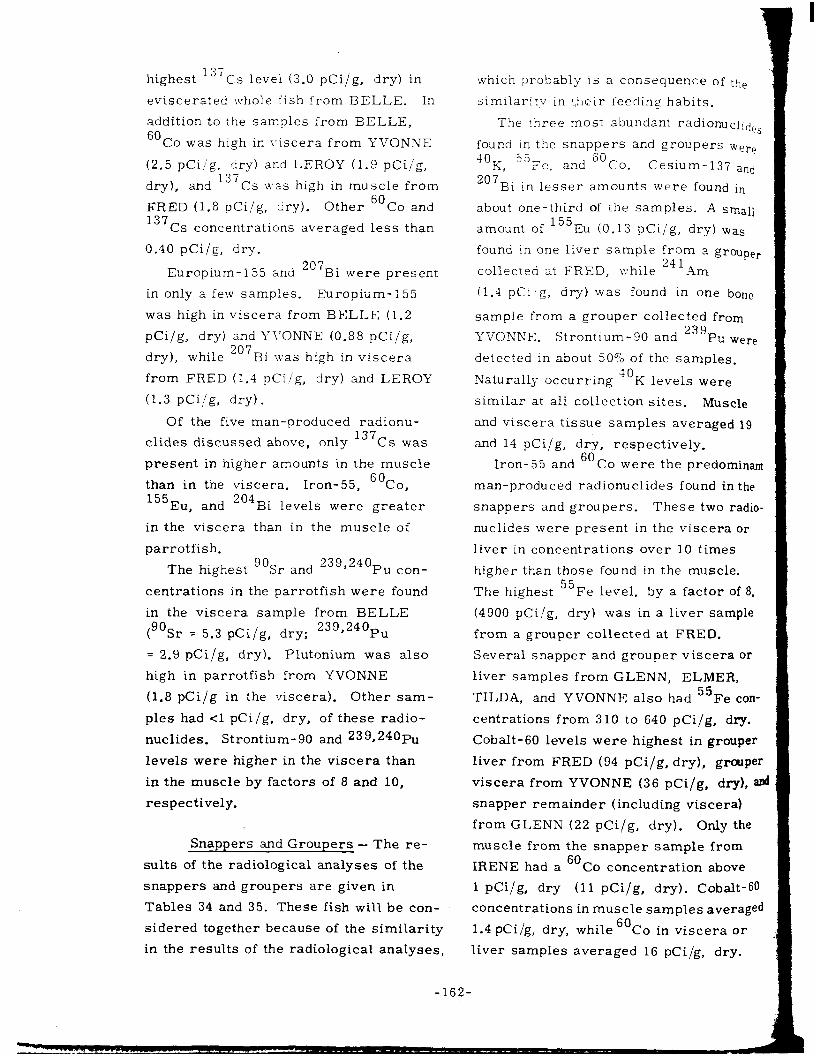
highest 1 37 Cs level (3.0 pCi/g, dry) in
eviscerated whole iish from BELLE. In
addition to the samples from BELLE,
6oCo was high in x-iscera from YVONNE
(2.5 pCi:g;3Fy) and LEROY (1.9 pCi/g,
dry). and Cs was high in muscle from
FRED (1.8 pCi/g, dry). Other 60
Co and 137
Cs concentrations averaged less than
0.40 pCi/g, dry.
Europium-155 and 207 Bi were present
in only a few samples. Europium-155
was high in viscera from BELLE (1.2
pCi/g, dry) and YT-ONNE (0.88 pCi/g,
dry), while 207
BL was high in viscera
from FRED (1.4 pCiig, dry) and LEROY
(1.3 pCi/g, dry).
Of the five man-produced radionu-
elides discussed above, only 137Cs was
present in higher amounts in the muscle
than in the viscera. Iron-55, 6oco, 155 Eu, and
204 BL levels were greater
in the viscera than in the muscle of
parrotfish.
The highest 90 Sr and 23g’240Pu con-
centrations in the parrotfish were found
in the viscera sample from BELLE
(“Sr = 5.3 pCi/g, dry; 23g’240Pu
= 2.9 pCi/g, dry). Plutonium was also
high in parrotfish from YVONNE
(1.8 pCi/g in the viscera). Other sam-
ples had ~1 pCi/g, dry, of these radio-
nuclides. Strontium-90 and 23ga240Pu
levels were higher in the viscera than
in the muscle by factors of 8 and 10,
respectively.
Snappers and Groupers - The re-
sults of the radiological analyses of the
snappers and groupers are given in
Tables 34 and 35. These fish will be con-
sidered together because of the similarity
in the results of the radiological analyses,
-162-
1 which probably is a consequence of the
similaritv in t,heir feeding habits.
The three most abundant radionuclid,,
found In the snappers and groupers Were ‘1OK 5”Fe and 60co
207*. ’
. Cesium-137 and
BI tn lesser amounts were found in
about one-third of the samples. A small
amount of 155 Eu (0.13 pCi/g, dry) was
found in one liver sample from a grouper
collected at FRED, xvhile 241Am
(1.4 pCilg, dry) was found in one bone
sample from a grouper collected from
YVOXEE. Strontium-90 and 239 Pu Were
detected in about 50% of the samples.
Naturally occurring 30
K levels were
similar at all collection sites. Muscle
and viscera tissue samples averaged 19
and 14 pCi/g, dry, respectively.
Iron-55 and 6o Co were the predominant
man-produced radionuclides found in the
snappers and groupers. These two radio-
nuclides were present in the viscera or
liver in concentrations over 10 times
higher than those found in the muscle.
The highest 55 Fe level, by a factor of 8,
(4900 pCi/g, dry) was in a liver sample
from a grouper collected at FRED.
Several snapper and grouper viscera or
liver samples from GLENN, ELMER,
TILDA, and YVONNE also had 55 Fe con-
centrations from 310 to 640 pCi/g, dry.
Cobalt-60 levels were highest in grouper
liver from FRED (94 pCi/g, dry), grouper
viscera from YVONNE (36 pCi/g, dry), and
snapper remainder (including viscera)
from GLENN (22 pCi/g, dry). Only the
muscle from the snapper sample from
IRENE had a 60 Co concentration above
1 pCi/g, dry (11 pCi/g, dry). Cobalt-60
concentrations in muscle samples averaged
1.4 pCi/g, dry, while 60
Co in viscera or
liver samples averaged 16 pCi/g, dry.
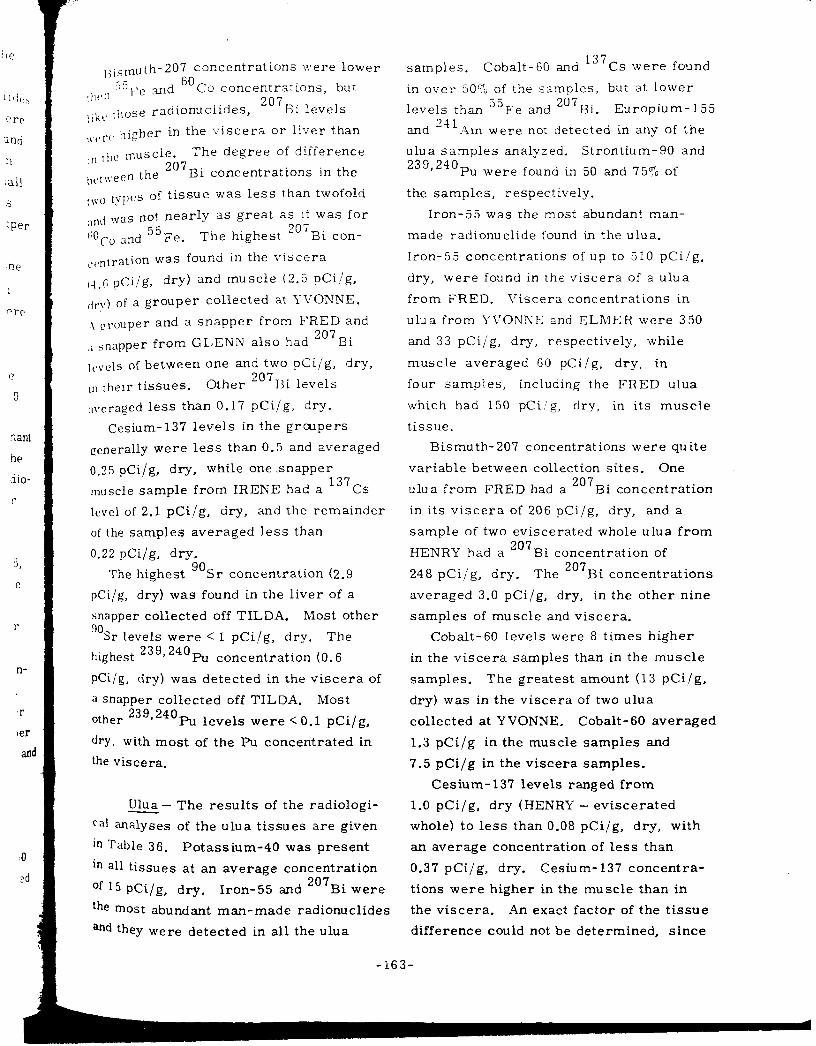
,ne
1
.>re
e
0
nant
he
die-
r
u
e
r
n-
‘r
)er
and
J_l
zd
l<isnluth_207__concentrations \Vere lower 35
:jl(‘il t’e and ““CO concentrations, but
,,kt. those radionuclides, 2oiBi levels
:~c,r(, higher in the viscera or liver than
!1] the muscle- The degree of difference
t,c.llrreen the 207 . Bi concentrations in the
,,~o tyi,i’s of tissue was less than twofold L I
L,nd WaS not nearly as great as it was for
“Ore and 55Fe. The highest 207
Bi con-
,.,,“tration was found in the viscera
,-l_(; pCi/g, dry) and muscle (2.5 pCi/g,
(jr!,) of a grouper collected at TVONNE.
1 Crouoer and a snapper from FRED and
,, snapper from GLENN also had 207Bi
lcaveis of between one and two pCi/g, dry,
,n their tissues. Other 207Bi levels
;Ivcraged less than 0.17 pCi/g, dry.
Cesium-137 levels in the grcxlpers
generally were less than 0.5 and averaged
0.25 pCi/g, dry, while one .snapper
muscle sample from IRENE had a 137Cs
level of 2.1 pCi/g, dry, and the remainder
of the samples averaged less than
0.22 pCi/g, dry.
The highest “Sr concentration (2.9
pCi/g, dry) was found in the liver of a
snapper collected off TILDA. Most other !,I)
Sr levels were < 1 pCi/g, dry. The
jiighest 239,240 Pu concentration (0.6
PCi/g, dry) was detected in the viscera of
;t SnaPPer collected off TILDA. Most other 239,240 Pu levels were < 0.1 pCi/g,
dry, with most of the Pu concentrated in
the viscera,
Ulua - The results of the radiologi-
cal analyses of the ulua tissues are given
in Table 36. Potassium-40 was present
in all tissues at an average concentration
of 15 pCi/g, dry. Iron-55 and 207 Bi were
the most abundant man-made radionuclides
and they were detected in all the ulua
samples. Cobalt-60 and 137 Cs were found
in over 50% of the samples, but at lower
levels than 55Fe and 207Bi. Europium-155 and 241 _Xtn were not detected in any of the
ulua samples analyzed. Strontium-90 and 239,240
Pu were found in 50 and 7570 of
the samples, respectively.
Iron-55 was the most abundant man-
made radionuclide found in the ulua.
Iron-55 concentrations of up to 510 pCi!g,
dry, were found in the viscera of a ulua
from FRED. T’iscera concentrations in
ulua from YT’ONNE and ELMER were 350
and 33 pCi/g, dry, respectively, while
muscle averaged 60 pCi/g, dry, in
four samples, including the FRED ulua
which had 150 pCi.‘g, dry, in its muscle
tissue.
Bismuth-207 concentrations were quite
variable between collection sites. One
ulua from FRED had a 207Bi concentration
in its viscera of 206 pCi/g, dry, and a
sample of two eviscerated whole ulua from
HENRY had a 207Bi concentration of
248 pCi/g, dry. The 207 Bi concentrations
averaged 3.0 pCi/g, dry, in the other nine
samples of muscle and viscera.
Cobalt-60 levels were 8 times higher
in the viscera samples than in the muscle
samples. The greatest amount (13 pCi/g,
dry) was in the viscera of two ulua
collected at YVONNE. Cobalt-60 averaged
1.3 pCi/g in the muscle samples and
7.5 pCi/g in the viscera samples.
Cesium-137 levels ranged from
1.0 pCi/g, dry (HENRY - eviscerated
whole) to less than 0.08 pCi/g, dry, with
an average concentration of less than
0.37 pCi/g, dry. Cesium-137 concentra-
tions were higher in the muscle than in
the viscera. An exact factor of the tissue
difference could not be determined, since
-163-
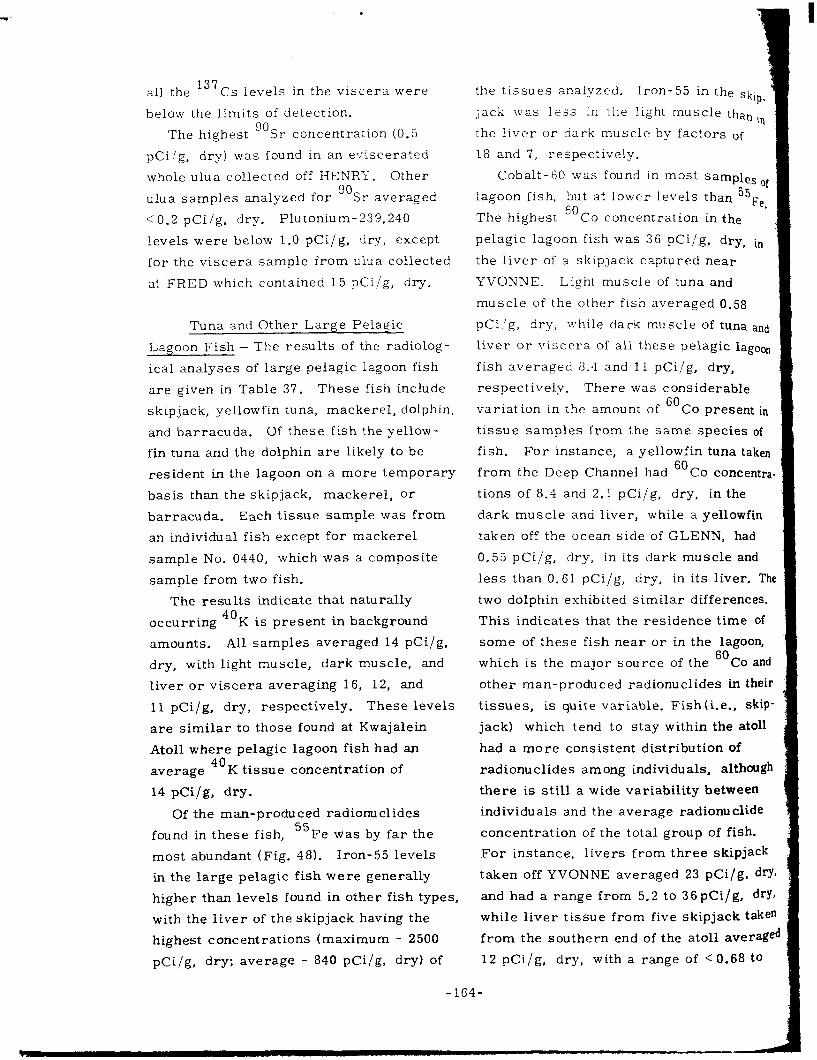
all the 13’ Cs levels in the viscera were
below the limits of detection.
The highest 90 Sr concentration (0.5
pCi.‘g, dry) was found in an eviscerated
whole ulua collected off HENRY. Other
ulua samples analyzed for 90
Sr averaged
CO.2 pCi/g, dry. Plutonium- 239,240
levels were below 1.0 pCi/g, dry, except
for the viscera sample from ulua collected
at FRED which contained 15 pCi/g, dry.
Tuna and Other Large Pelagic
Lagoon Fish - The results of the radiolog-
ical analyses of large pelagic lagoon fish
are given in Table 37. These fish include
skipjack, yellowfin tuna, mackerel, dolphin,
and barracuda. Of these fish the yellow-
fin tuna and the dolphin are likely to be
resident in the lagoon on a more temporary
basis than the skipjack, mackerel, or
barracuda. Each tissue sample was from
an individual fish except for mackerel
sample No. 0440, which was a composite
sample from two fish.
The results indicate that naturally
occurring 40 K is present in background
amounts. All samples averaged 14 pCi/g,
dry, with light muscle, dark muscle, and
liver or viscera averaging 16, 12, and
11 pCi/g, dry, respectively. These levels
are similar to those found at Kwajalein
Atoll where pelagic lagoon fish had an 40
average K tissue concentration of
14 pCi/g, dry.
Of the man-produced radionuclides
found in these fish, 55
Fe was by far the
most abundant (Fig. 48). Iron-55 levels
in the large pelagic fish were generally
higher than levels found in other fish types,
with the liver of the skipjack having the
highest concentrations (maximum - 2500
pCi/g, dry: average - 840 pCi/ g, dry) of
-164-
the tissues analyzed. Iron-55 in the skip_
jack was less in the light muscle than is
the liver or dark muscle by factors of
18 and 7, respectively.
Cobalt-60 was found in most samples oy
lagoon fish, but at lower levels than 55Fe
The highest 6oC~ concentration in the .
pelagic lagoon fish was 36 pCi/g, dry, in
the liver of a skipjack captured near
YVONNE. Light muscle of tuna and
muscle of the other fish averaged 0.58
pCi,‘g, dry, while dark muscle of tuna and
liver or viscera of all these pelagic lagoor
fish averaged 8.4 and 11 pCi/g, dry,
respectively. There was considerable
variation in the amount of 60 Co present in
tissue samples from the same species of
fish. For instance, a yellowfin tuna take!:
from the Deep Channel had 6o Co concentr;
tions of 8.4 and 2.1 pCi/g, dry, in the
dark muscle and liver, while a yellowfin
taken off the ocean side of GLENN, had
0.55 pCi/g, dry, in its dark muscle and
less than 0.61 pCi/g, dry, in its liver. Tl
two dolphin exhibited similar differences.
This indicates that the residence time Of
some of these fish near or in the lagoon,
which is the major source of the 60 Co and
other man-produced radionuclides in thei1
tissues, is quite variable. Fish(i.e., skip
jack) which tend to stay within the atoll
had a more consistent distribution of
radionuclides among individuals, although
there is still a wide variability between
individuals and the average radionuclide
concentration of the total group of fish.
For instance, livers from three skipjack
taken off YVONNE averaged 23 pCi/g, drJ
and had a range from 5.2 to 36 pCi/g, dry
while liver tissue from five skipjack take
from the southern end of the atoll averag’
12 pCi/g, dry, with a range of CO.68 to
I
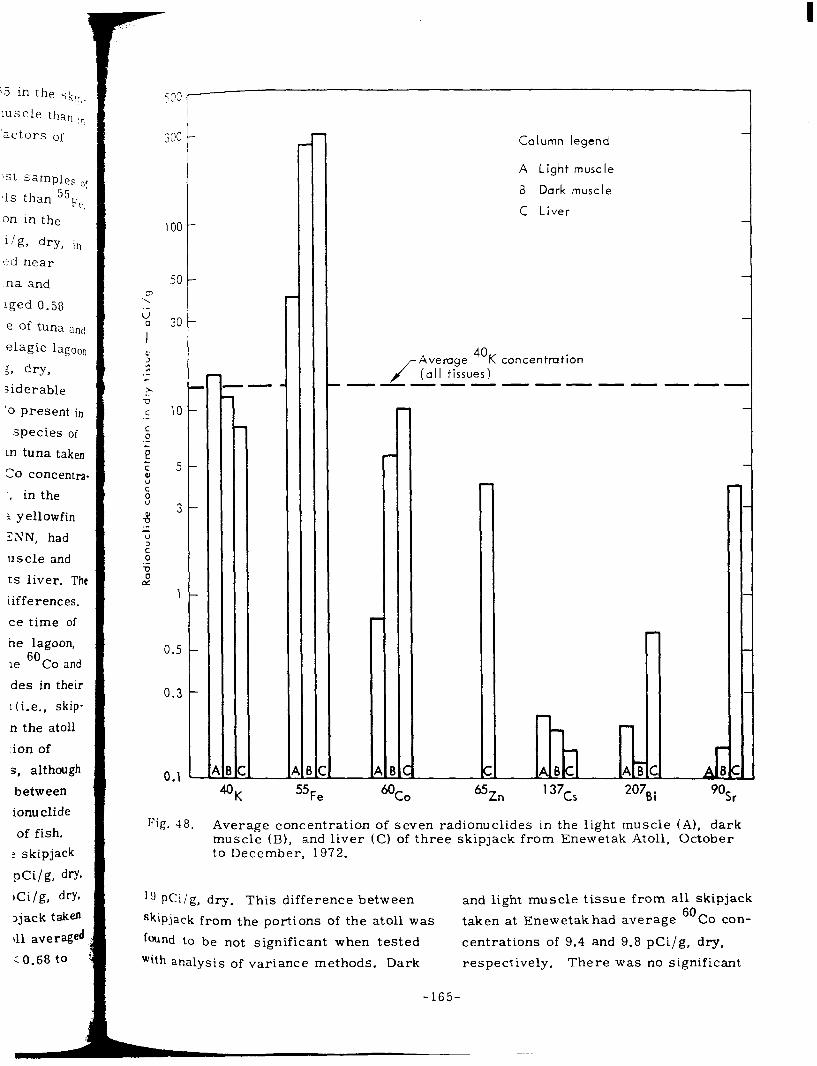
15 in the ski,.
luscle than ,r ,,I
‘actors of
'St samples o1
bls than j5pt
on in the
i/g, dry, in
ed near
na and
qed 0.58
e of tuna aat!
elagic lagoon
:, dry,
siderable
‘0 present in
species of
in tuna taken
20 concentra
‘, in the
1 yellowfin
SNN, had
uscle and
ts liver. The
lifferences.
ce time of
he lagoon,
le 6o Co and
des in their
1 (i.e., skip-
n the atoll
:ion of
s, although
between
ionu elide
of fish.
3 skipjack
pci/g, dry,
,ci/g, drYI
3jack taken
111 averaged
= 0.68 t0
.
Column legend
A Light muscle
6 Dark muscle
C Liver
Average 40
/
K concentmtion
(all tissues) I------------
[‘if& 48. Average concentration of seven radionuclides in the light muscle muscle (B), and liver (C) of three skipjack from Enewetak Atoll, to December, 1972.
BC
(A), dark October
I!) pCi/g, dry. This difference between and light muscle tissue from all skipjack
skipjack from the portions of the atoll was taken at Enewetak had average 60 Co con-
found to be not significant when tested
wtth analysis of variance methods. Dark
centrations of 9.4 and 9.8 pCi/g, dry,
respectively, There was no significant
- 165-
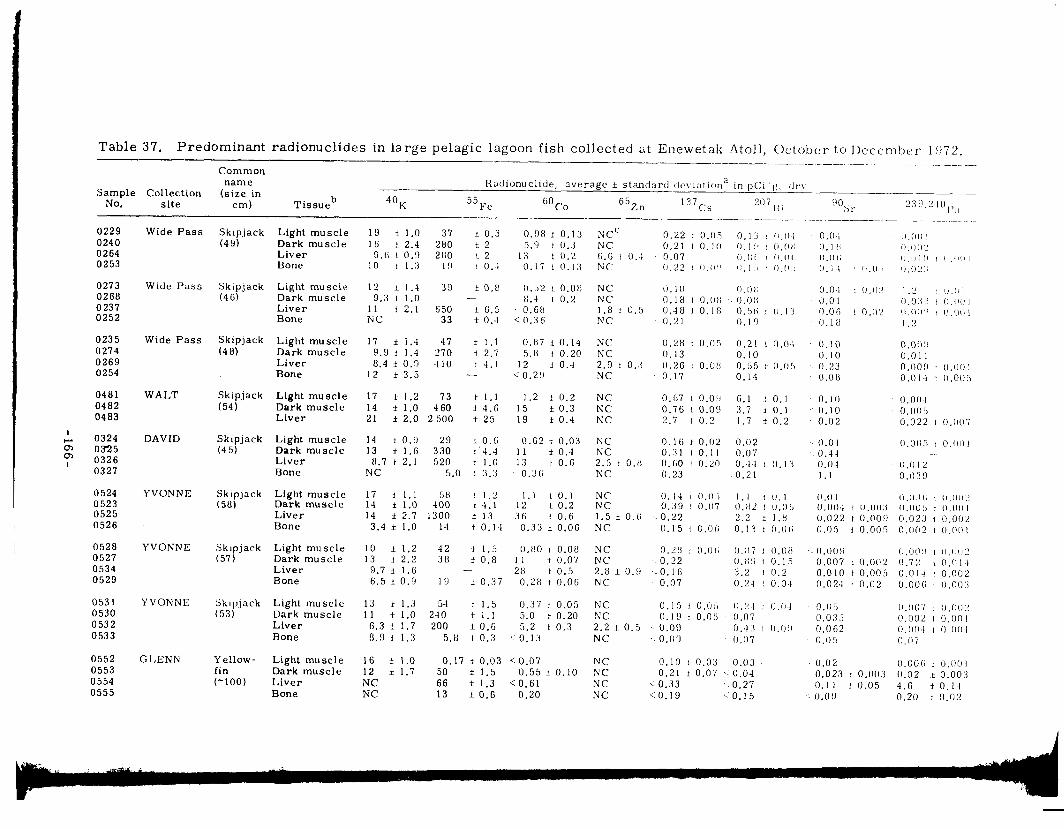
-_ -_=
s --c -.
-. 2
E
g
. _.
_.
- I’
cc S
C
: cc --
_
- I
c I-
=
=
- ..I
t==z -’
-’ 2=
__
--c
_^ - _ - 3-
d d
--k
O^cod
I--TN
=’ d d d
__. _
-rcl@J*
--cr.,-
=’ s d d
VVU
222
G
z I?
o-P?0 _-
m
-7
d N
N
d
m-0.T
.
. .
. --O
C
++I+- il-_
_
c. (3
0
. .
.
0-m
-3C-0
. .
- _
N’ 1
-166-


![Radiological Survey(ing) of Washington DC Area [2009 Presidential Inauguration]](https://static.documents.pub/doc/80x56/577d382f1a28ab3a6b973f01/radiological-surveying-of-washington-dc-area-2009-presidential-inauguration.jpg)
