48
FIESP Vice-President CONSIC President (Superior Council of the Construction Industry) Eng. José Carlos de Oliveira Lima

FIESP Vice-President
CONSIC President (Superior Council of the Construction Industry)
Eng. José Carlos de Oliveira Lima
2
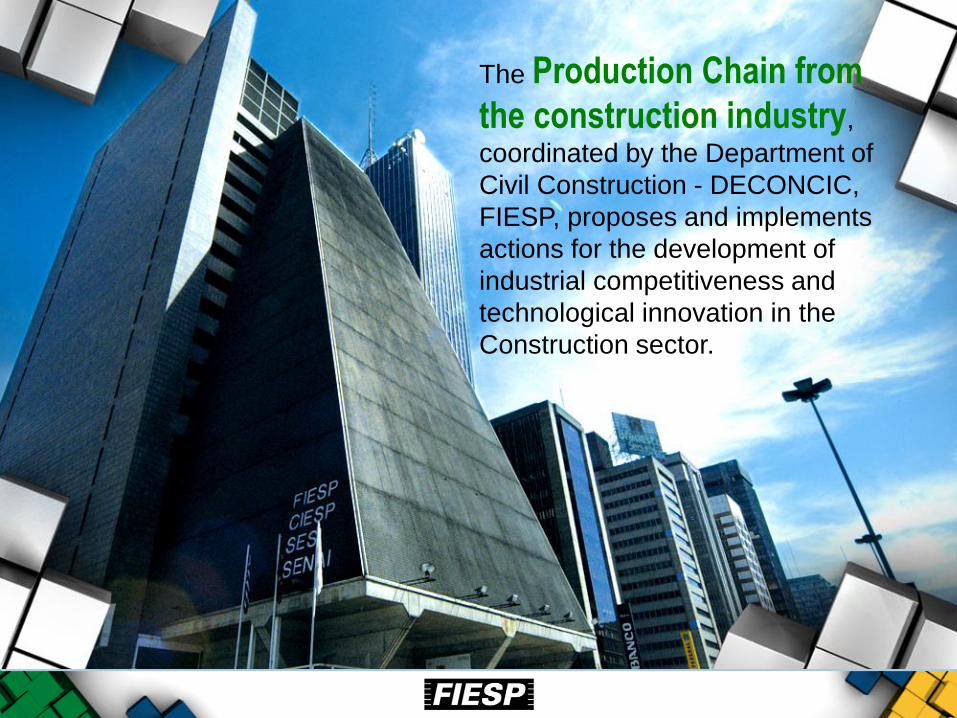
The Production Chain from
the construction industry,
coordinated by the Department of
Civil Construction - DECONCIC,
FIESP, proposes and implements
actions for the development of
industrial competitiveness and
technological innovation in the
Construction sector.

12.2% of the Brazilian GDP The Production Chain from the construction industry represents
Construction Material
2.9%
Other Material
0.2%
Machines and Equipment
0.3%
Services 0.5%
Projects (engineering and architecture)
Real Estate Activities Property maintenance
Construction
8.3%
Buildings Heavy construction
Source: LCA Consultores

CONSTRUBUSINESS 2010 – BRAZILIAN CONSTRUCTION CONFERENCE
State Plan – Sustainable Development of the Sector
Special Edition: with technical studies from Consultancies LCA e FGV – themes: Housing and Infrastructure
Date: November 29th, 2010 - for authorities, business leaders and journalists
Goal: Analyze current situation, identify barriers and investments propositions
Forecast until 2022 : position Brazil with the 5 largest economies worldwide
BRAZIL 2022 – Planning, Construction, Growth
Forum to debate socioeconomic development
Main Participating Authorities
Michel Temer
Brazil Vice-President
Guido Mantega
Minister of Finance
Miriam Belchior
Minister of Planning

MACROECONOMIC SITUATION
Asia and Russian crises contaminate emerging markets
Brazil: Fixed exchange rate system is unsustainable
Uncertainty
Investment environment
risky in Brazil
1999 10 YEARS AGO
2011 TODAY
2022 Future needs require
action today
High international liquidity International reserves
equivalent to total external debt
Government stimulates internal demand
Internal consumption is a factor in sustained growth
Large demand in housing and all infrastructure sectors
Transport
Sanitation and Solid Waste
Urban transport
Energy
Telecomunications
Fonte
: LC
A C
onsultore
s.
Conjuntura macroeconômica
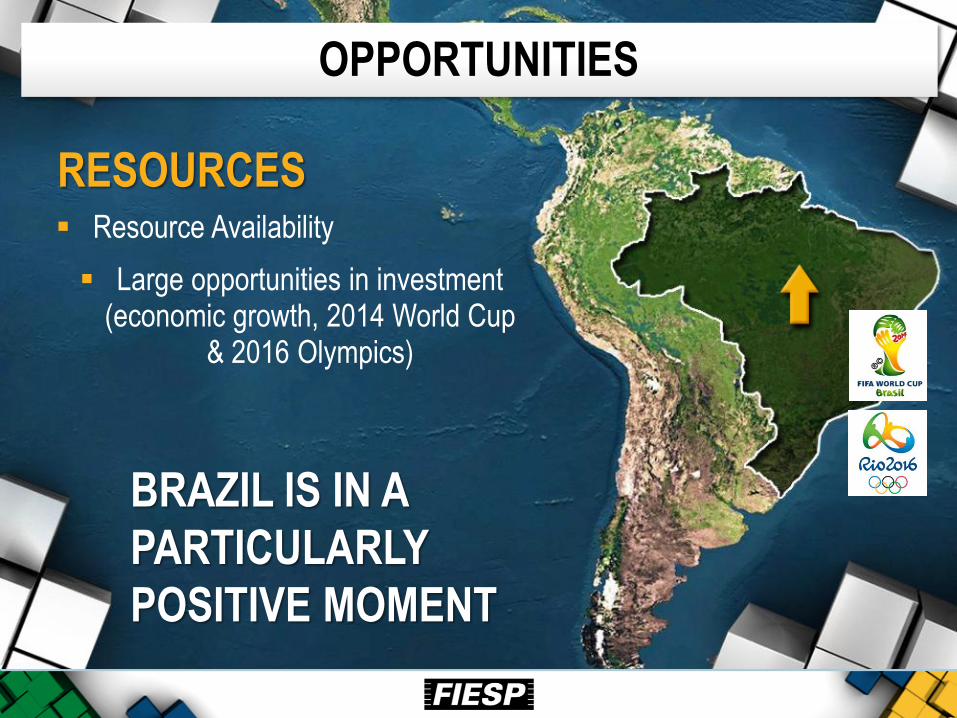
BRAZIL IS IN A
PARTICULARLY
POSITIVE MOMENT
Resource Availability
Large opportunities in investment (economic growth, 2014 World Cup
& 2016 Olympics)
RESOURCES
OPPORTUNITIES

HOUSING

HOUSING – DIAGNOSIS Brazil Age Group Pyramid, 2010 & 2022
Fonte: FGV Projetos
2.3%
4.0%
6.9%
11.2%
13.9%
16.8%
12.5%
10.2%
12.5%
9.7%
3.4%
5.8%
10.1%
12.6%
15.7%
15.7%
11.4%
9.1%
9.1%
7.2%
2010 2022
More
than 75
Source: Brazilian Central Bank / FGV * FGV Projection
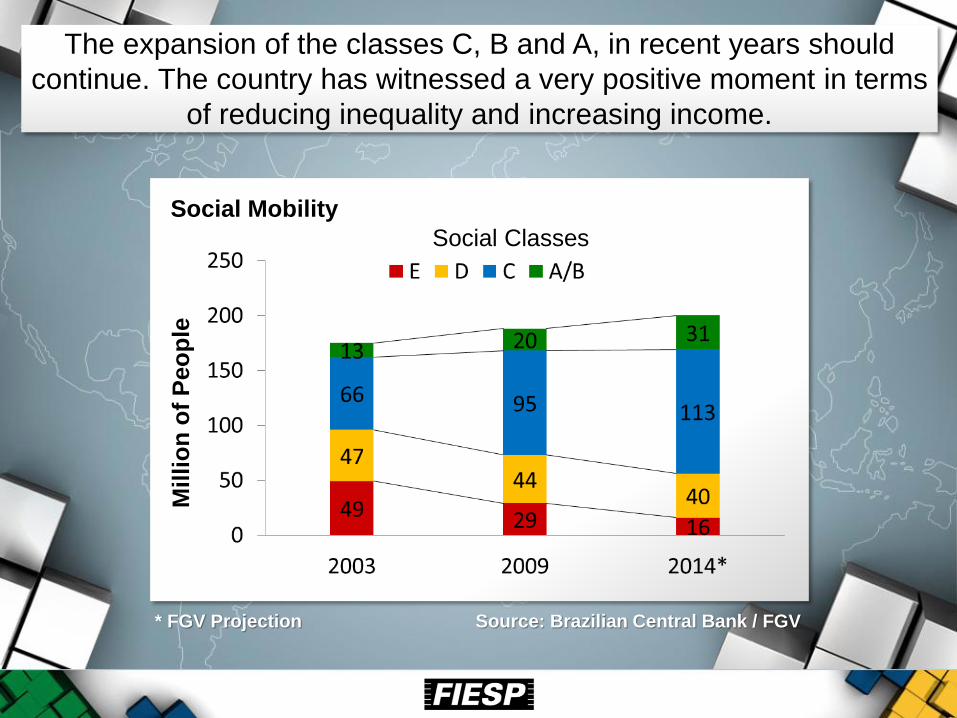
The expansion of the classes C, B and A, in recent years should
continue. The country has witnessed a very positive moment in terms
of reducing inequality and increasing income.
Social Mobility M
illi
on
of
Peo
ple
Social Classes

13.7% North
4.5% Center-West
9.2% South
37.7% South-West
34.9% Nord-East
Source: Ministério das Cidades. Data presented at the
4th National Monitoring Report. The
Millennium Development Goals - March/2010.
HOUSING DEFICIT = 5.8 MILLION DWELLINGS
Brazilian Population:
193 million people

Goal by 2022: Requires more than
23 million dwellings
2,640,000
3,627,284
17,222,469
HOUSING - GOALS Housing Needs
Sou
rce:
FG
V P
roje
tos
Dwellings to new families
Dwelling improvement
Cohabitation reduction

HOUSING - GOALS Housing Needs
Average of 5.80% of the GDP
* U$ 32,3 bln
* U$ 119,9 bln
Goal 2022: Requires more than
US$ 1,8 trillion in investments
Fon
te: F
GV
Pro
jeto
s
* Annual Average
In new dwellings
In renovations

HOUSING
Source: Caixa Econômica Federal & ABECIP
Total Resources (C=A+B)
)
Evolution of Housing Financing FGTS + SBPE / Savings (in R$ billions)
-
20
40
60
80
100
120
140
160
180
200
2005 2006 2007 2008 2009 2010 2011 2012 2013 2014 2015 2016 2017 2018 2019 2020 2021 2022
FGTS SBPE

CONSTRUCTION operating at BOVESPA
Geographic Extension of Activities

LABOUR

INFRASTRUCTURE

Brazil’s worldwide position from 139 countries
41º
76º
82º
87º
93º
105º
123º
Logistics
Cellular phones
Customs Regulations
Railway
Airports
Roads
Ports
Source: World Economic Forum
INFRASTRUCTURE

INFRASTRUCTURE- DIAGNOSIS General Infrastructure Quality
Sou
rce:
GC
R W
orld
Eco
nom
ic F
orum
– 2
010
- 20
11
5.1 4.5
ENERGY
1.9
3.2
RAILWAY
2.9
4.0
ROADS
2.9
4.3
PORTS
Brazil Average Worldwide
4.0
4.7
AIRPORTS

INFRASTRUCTURE - DIAGNOSIS General Infrastructure Quality
Source: GCR World Economic Forum – 2010 - 2011
Between 1 and 7.
Source: GCR 2010-2011 – World Economic Forum
Chi
le
5,7
Wor
ld A
vera
ge
4,3
Ave
rage
Mer
cosu
r
3,7
Arg
entin
a
3,5
Par
agua
y
2,4
Bol
ivia
3,3
Per
u
3,6
Uru
guay
4,5
Bra
zil
3,8
Ecu
ador
3,5
Col
ombi
a
3,6
Ven
ezue
la
3,1

562 BILLION
241 BILLION
226 BILLION
Transport Sanitation Telecommunication
INFRASTRUCTURE - GOALS
Oil & Gas Energy
121 BILLION 59
BILLION
US$

Transport Sanitation Telecommunication Oil & Gas Energy
Total investment
MORE THAN 1,176 TRILLION DOLLARS
INFRASTRUCTURE - GOALS
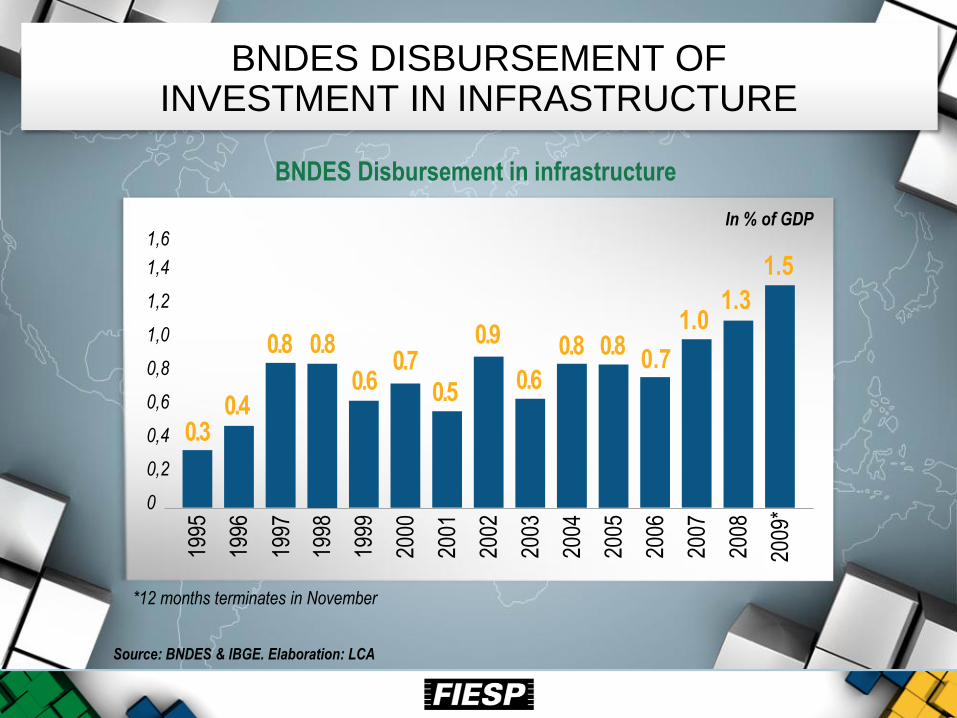
BNDES DISBURSEMENT OF INVESTMENT IN INFRASTRUCTURE
Source: BNDES & IBGE. Elaboration: LCA
2008
1.3
1995
1996
1997
1998
1999
2000
2001
2002
2003
2004
2005
2006
2007
2009
*
0.3 0.4
0.8 0.8
0.6 0.7
0.5
0.9
0.6
0.8 0.8 0.7
1.0
1.5
0
0,2
0,4
0,6
0,8
1,0
1,2
1,4
1,6
BNDES Disbursement in infrastructure
*12 months terminates in November
In % of GDP

OPORTUNITY LARGE SPORTING EVENTS

2014 WORLD CUP
OLYMPIC AND PARAOLYMPIC GAMES
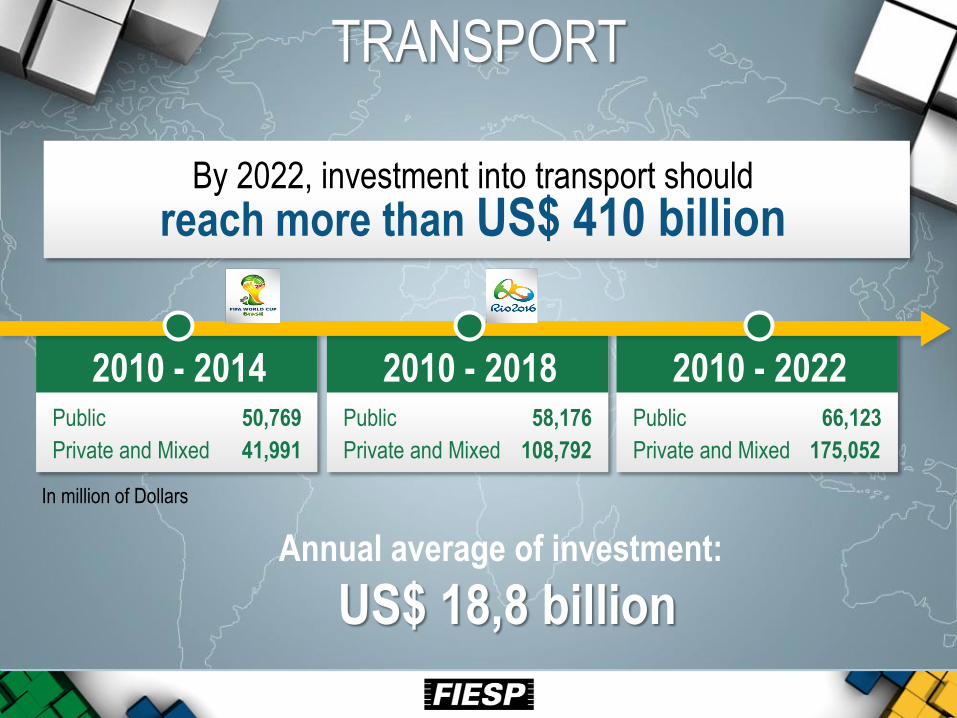
By 2022, investment into transport should
reach more than US$ 410 billion
Annual average of investment:
US$ 18,8 billion
Public 50,769 Private and Mixed 41,991
2010 - 2014 Public
58,176
Private and Mixed 108,792
2010 - 2018 Public 66,123
Private and Mixed 175,052
2010 - 2022
In million of Dollars
TRANSPORT

TRANSPORT
Today, for every US$ 1.00
of public investment, there
is US$ 0.28 of investment
from private and mixed
sources.
By 2022, this will reach: for every
US$ 1.00 public investment, there
is US$ 3.35 of investment from
private and mixed sources.
Private and mixed
Public
-
50
100
150
200
250
300
350
400
450
2010 2011 2012 2013 2014 2015 2016 2017 2018 2019 2020 2021 2022

Expansion through stimulation of energy efficiency
Average Annual Investment
US$ 18,9 billion
Total 87,104
2010 - 2014 Total 156,787
2010 - 2018 Total 226,470
2010 - 2022
In million of Dollars
POWER
Total accumulation 2010-2022
US$ 226 billion

The Brazilian energy is one of the most
expensive in the world,
when it has everyting to be the cheapest.
__________________________________
This can change. That must change. _________________________________________________________
Demand your rights. Subscribe to the
manifest at the website, demand, discuss
the problem on the internet.
If nobody does anything, everything will
continue as it is: few winning and Brazil
losing

Pre-salt requires large resources
Total accumulation 2010-2022
US$ 561,7 billion Average Annual Investment
US$ 44 billion
Total 216,038
2010 - 2014 Total 388,914
2010 - 2018 Total 561,764
2010 - 2022
In million of Dollars
OIL & GAS

Modernization and expansion of user services
TELECOMMUNICATION
Average Annual Investment
US$ 7,7 billion
Total 42,367
2010 - 2014 Total 50,015
2010 - 2018 Total 58,823
2010 - 2022
In million of Dollars
Total accumulation 2010-2022
US$ 100 billion

Universal access as a realistic goal
Total accumulation 2010-2022
US$ 121,1 billion
Average Annual Investment
US$ 10,1 billion
SANITATION In
mill
ion
of D
olla
rs
Own Funds Operators 13,2 Financing 13,2
2010 - 2014
Fed. Gov. Budget 11,6 Others 2,2
Own Funds Operators 26,5 Financing 26,5
2010 - 2018
Fed. Gov. Budget
23,3 Others 4,5
Own Funds Operators 39,7 Financing 39,7
2010 - 2022
Fed. Gov. Budget
34,9 Others 6,7

Economy will
produce additional
US$ 83,5 billion:
The World
Cup will
produce a
cascading
effect on
investment in
the country
WORLD CUP OPPORTUNITIES Mobility and urban infrastructure
CONSOLIDADED IMPACTS FROM THE WORLD CUP
a) Impact on total demand (Brazil spending related to the World Cup)
Investiment
b) Impact on domestic production of
goods and services
c) Impact on income (income generated from item A)
d) Impact on jobs
(occupation-year from item A)
e) Impact on tax collection
US$ 17,4 billion
US$ 13,21 billion
US$ 0,69 billion
US$ 3,49 billion
US$ 66,34 billion
US$ 37,34 billion
US$ 2,13 million
US$ 10,66 billion
Operational expenses
Visitor spending
SECTORS THAT WILL BENEFIT THE MOST (ECONOMIC ACTIVITIES WITH THE GREATEST INCREASE IN PRODUCTION)
Tourism
and
hotels
Information
services
Electricity, gas, water,
sewage &
urban cleanup
Business
Services
Food and
beverages
Civil
construction

OPORTUNIDADES COPA 2014:
MOBILIDADE E INFRAESTRUTURA URBANA WORLD CUP OPPORTUNITIES
Mobility and urban infrastructure
In million of Dollars
Media
3.829,41
Estates
2.720,26
Hotel Park
1.861,13
Reurbanization
1.669,00
Security
998,46
Roads
847,66
Airport
713,96
Information
Technology
181,76
Fan Parks
119,9
Energy
165,01
IMCs & IBC
108,53
World Cup
Investment

OPORTUNIDADES COPA 2014:
IMPACTO SOCIOECONÔMICOS
Source: Ernst & Young
Investment Map
& their impact
on regional
GDP
351 6,170
(5.7%)
356 78,050
(0.5%)
199 26,109
(0.8%)
425 249,886
(0.2%)
Valor
aproximado
581 108,982
(0.5%)
422 29,838
(1.4%)
368 20,871
(1.8%)
222 16,9
(1.4%)
258 19,112
(1.4%)
In millions
Direct Impact
on GDP
Municipal GDP
2010 Direct Impact
(% of GDP 2010)
Manaus
Vivaldão
Fortaleza
Castelão
Natal
Cidade das Dunas
Recife
Cidade Copa
Salvador
Fonte Nova
Brasília
Estádio Nacional
Cuiabá
Verdão
Belo
Horizonte
Mineirão
Rio de janeiro
Maracanã
São Paulo
Itaquera Curitiba
Arena da
Baixada
Porto Alegre
Beira-Rio
* Not yet defined between the phases
Mineirão, Independência and Arena do Jacaré
202 29,505
(0.7%)
446 6,265
(7.1%)
Current
Situation:
Restoration
Construction
391 26,866
(1.5%)
TOTAL
4.224 617,838
(0.7%)
WORLD CUP OPPORTUNITIES Mobility and urban infrastructure
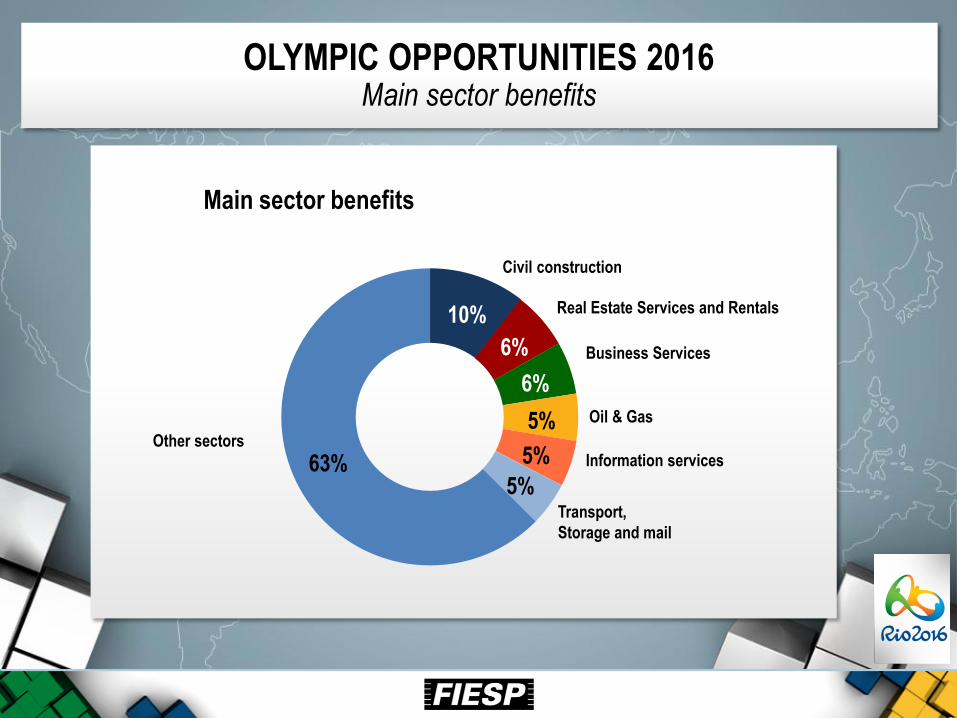
10%
6%
6%
5%
5%
5% 63%
Main sector benefits
Civil construction
Real Estate Services and Rentals
Business Services
Oil & Gas
Information services
Transport,
Storage and mail
Other sectors
OLYMPIC OPPORTUNITIES 2016 Main sector benefits

INTEGRATED PRODUCTION INVESTMENT

INTEGRATED PRODUCTION INVESTMENT
SHOPPING CENTER SPORTS CENTER
CONSTRUCTION SITE - USE OF PRE-MOLDED SYSTEMS

ROME / ITALY – JAN/11 Seminar organized by the Italian Institute for Foreign Trade (ICE)
Business Opportunities in Brazil - World Cup and Olympics
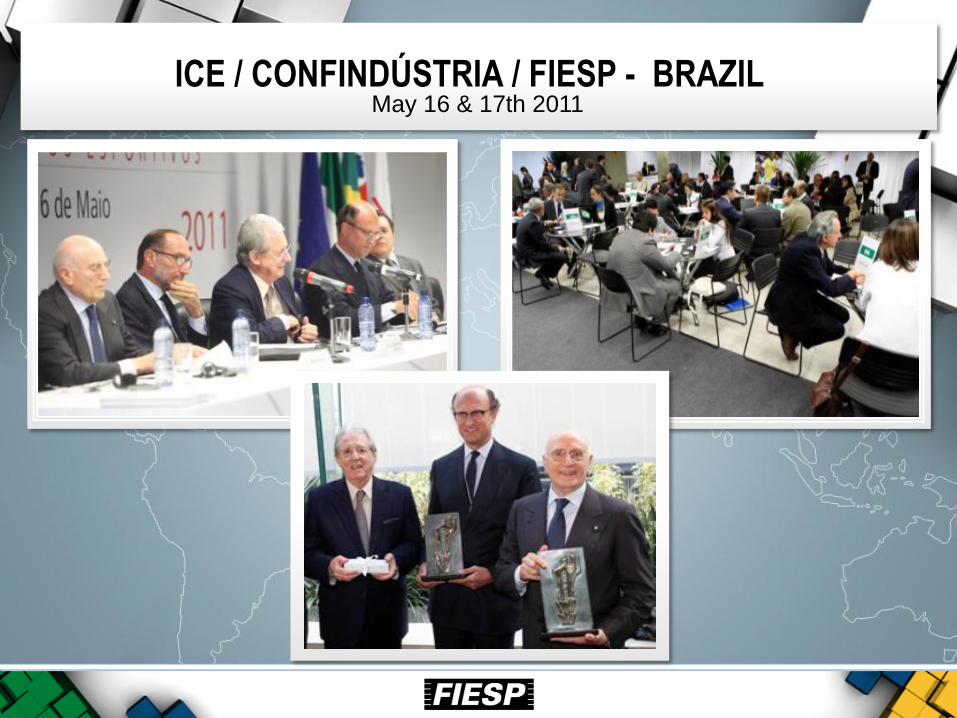
ICE / CONFINDÚSTRIA / FIESP - BRAZIL May 16 & 17th 2011

BATIMAT - PARIS International Construction Exhibition – November 7 & 12th 2011
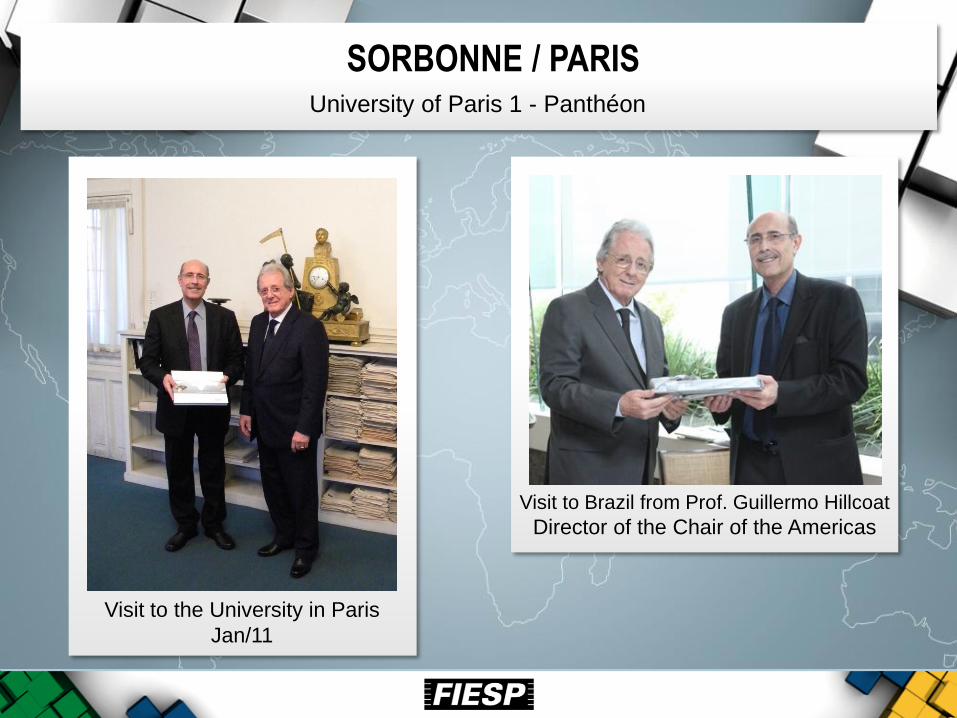
SORBONNE / PARIS
Visit to Brazil from Prof. Guillermo Hillcoat
Director of the Chair of the Americas
Visit to the University in Paris
Jan/11
University of Paris 1 - Panthéon

BERGAMO – MILAN – TORINO
Tom Dealessandri
Mayor of Torino
Giuliano Lengo Diretor General from the
Centro Estero per I’Internazionalizzazione
Delivery of official Brazilian football
jersey for Senator Gilberto Bonalumi and
Andrea Bonalumi
Mission Business – May 8-14th 2011

CONSTRUCTION MONITORING www.observatoriodaconstrucao.com.br

ACKNOWLEDGMENT
45
Paulo Skaf President of Fiesp, Ciesp, Sesi & Senai
Federation of Industries of the State of São Paulo
Center of Industries of the State of São Paulo
Industry Social Services
National Service of Industrial Learning

COMMITEE – DECONCIC/FIESP
46
Dr. Carlos Roberto Petrini Director of DECONCIC/FIESP
Executive President of the Sinaprocim / Sinprocim
Dr. Pedro Rinaldi Associate Director of Oliveira Lima Adv.
Official member of the Young Entrepreneurs Committee – CJE /
FIESP

COMMITEE – DECONCIC/FIESP
47
Claudinei Florencio
Manager of DECONCIC / FIESP
Karina Vieira Dias
Analist of the Industrial Construction Planning of the DECONCIC / FIESP

48
Considering this positive outlook in the
construction chain which we have the
honour of representing in Deconcic, Fiesp,
we reaffirm that government programs are
not enough for the sector.
Investment in construction is development for the country
Thank you!
www.fiesp.com.br/deconcic
www.observatoriodaconstrucao.com.br


