#TMwebinar The presentation will begin at the top of the hour. A dial in number will not be provided. Listen to today’s webinar using your computer’s speakers or headphones. Engagement is Overrated: Use Your Surveys to Drive Business Results
Transcript
#TMwebinar
The presentation will begin at the top of the hour.
A dial in number will not be provided.
Listen to today’s webinar using your computer’s speakers or headphones.
Engagement is Overrated: Use Your Surveys to Drive Business Results
#TMwebinar
Speaker: Scott Mondore, Ph.D. Co-Founder and Managing Partner SMD
Engagement is Overrated: Use Your Surveys to Drive Business Results
#TMwebinar
Tools You Can Use Audio Control
– A dial in number will not be provided.
– Adjust the volume by sliding the indicator in the Media Player box to the left.
– Also check your computer’s volume for external speakers or headsets.
#CLOwebinar
Tools You Can Use
Speaker Bios
Resources
Media Player
Q&A
Slides
Twitter
Help
Post Event Evaluation Share This
Group Chat
HRCI
TM Webinars
# #TMwebinar
#CLOwebinar
Tools You Can Use Q&A and Live Group Chat
– Enter your first name and initial and join the live discussion with other webinar attendees
– Enter technical or content-related questions into the Q&A box
– Type your question in the space at the bottom.
– Click “Submit.”
Q&A
Group Chat
#TMwebinar
#TMwebinar
Tools You Can Use
Twitter - Click “Post” in the Twitter widget.
#TMwebinar @TalentMgtMag
#TMwebinar
1. May I receive a copy of the slides? YES! Click on the resource list located on the top left
portion of your screen.
2. May I review the webinar recording at a later date? YES! You may log in again using today’s link to review the
presentation on-demand.
3. Is this webinar HRCI certified? YES! The HRCI certification code will appear in the box to
the right of the slides after the required watch-time has elapsed.
Frequently Asked Ques;ons
#TMwebinar
Sco& Mondore, Ph.D. Co-‐founder and Managing Partner SMD
Engagement is Overrated: Use Your Surveys to Drive Business Results
Employee Engagement is Overrated: How to Use Your Survey to
Drive Actual Business Outcomes
Presented by: Sco& Mondore, Ph.D.
www.smdhr.com
Learning Objec;ves
LEARN details of a comprehensive study around engagement and business outcomes
LINK employee aItudes directly to business outcomes (e.g., sales, producKvity)
PRIORITIZE intervenKons that have the greatest impact on business outcomes
FOCUS front-‐line managers on the areas that will improve performance
APPLY survey best-‐pracKces to your employee survey
PROVIDE pracKcal Kps for surveys for design, administraKon, reporKng, and acKon planning
INTEGRATE survey data into systemic-‐level and local acKon
About ScoG
ScoG Mondore has over 17 years of experience in the areas of strategy, talent management, measurement, customer experience and organizaKonal development. He has internal and consulKng experience across a variety of industries including transportaKon, healthcare, manufacturing, pharmaceuKcals, uKliKes, and hospitality. Sco& is currently a managing partner of Strategic Management Decisions (SMD). Before SMD, he served as East Region President for Morehead Associates, a healthcare HR company. Before joining Morehead, Sco& worked as a Corporate Strategy Director at Maersk, Inc. He also worked as an OrganizaKonal EffecKveness Leader at UPS, focusing on employee assessment and measurement as well working as a consultant to large and small organizaKons in both the private and public sector. He is the co-‐author of “Business-‐Focused HR” and “InvesKng in What Ma&ers: Linking Employees to Business Outcomes” and has published several arKcles on various topics, including employee turnover, employee safety, coaching, liKgaKon and leadership. Sco& holds a master's degree and doctorate in applied psychology from the University of Georgia.
About SMD: Driving Business Results Through Talent Management Our Technology
• Implement Talent Management processes based on analyKcs, linking people to criKcal business outcomes
• Partner with our clients to create and execute people strategies that drive business outcomes and maximize ROI
Our Results • Linkage of Talent Management (e.g., engagement survey
results, 360 assessments, personality, knowledge) to a variety of business outcomes: • OperaKons Metrics (e.g., operaKng margin) • Financial Metrics (e.g., sales dollars, producKvity) • Customer SaKsfacKon • Turnover/RetenKon • Employee Safety
• Significant bo&om-‐line improvements and return-‐on-‐investment for our clients.
Connecting Employees to Business Results
• HR Strategy & Planning • Human Capital Measurement • Talent Management • Leadership Development • Executive Assessment & Coaching • Organizational Effectiveness
SMD Publica;ons
Published by SHRM (2009)
Published by SHRM (2011)
Bestseller for 2011, 2012, 2013,
2014 & 2015
HR People & Strategy has awarded SMD The Walker Award for their article on Talent Management Analytics. “The Walker Award is given to the article that ‘best advances state-of-the-art thinking and practices in human resources.’"
Representa;ve Recent Clients
Applied Research and Trends
The Current State of Employee Engagement
Defining Employee Engagement
• “The extent to which employees feel passionate about their jobs, are commi<ed to the organiza@on, and put discre@onary effort into their work.”
• “…the degree of posi@ve or nega@ve emo@onal a<achment to their organiza@on, their job and their colleagues.”
• “A workplace approach designed to ensure that employees are commi<ed to their organiza@on’s goals and values, mo@vated to contribute to organiza@onal success, and are able at the same @me to enhance their own sense of well-‐being.”
Hundreds more defini;ons…
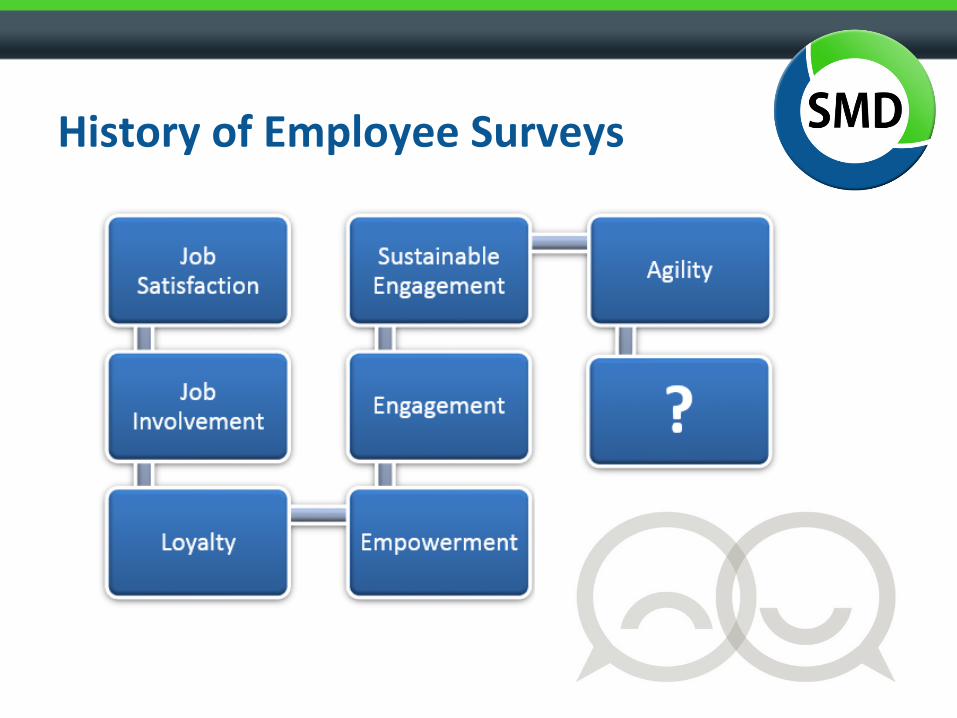
History of Employee Surveys
13 years, No Movement
What are we chasing?
The Problem with Engagement NO clear definiKon
NO magic target number exists (what’s a good number?)
NO definiKve study connecKng engagement to business outcomes
NO understanding -‐ Front-‐line managers don’t understand it and find li&le value in it
WHY not just focus on ac.onable areas that drive business results, instead of engagement scores?
Drivers of Business Outcomes
Customer Sa;sfac;on
Employee Performance Turnover
Financial Performance Produc;vity Safety
Accountability X X X X
Career Development X X v X
Compensa;on/Benefits
Customer Focus X X
Engagement
Leadership Skills X X X
Job Fit X
Mission/Vision/Values X X
Quality X X
Rounding (HC only) X X X X
Safety X X
Senior Management X X
Teamwork
Training X X X
Diversity X X
Work-‐Life Balance X X X
*2013-‐2014 Criterion ValidaKon Study includes 573,800 employees and 11,215 work units.
What Really Happens….
Engagement drives business results became accepted knowledge without any evidence! Reality: Engagement is a nice outgrowth of individual and organiza.onal performance.
A Unique Voice
An NFL player for the Sea&le Seahawks put this all in perspecKve:
"You’re really not trying to keep everyone happy— when we’re happy, it’s because we’ve won ...
That’s where the bo<om line is” —Doug Baldwin
22
Applied Research and Trends
An Opportunity for HR
Organiza;onal Impact
www.metrus.com
Typical Approach to HR Processes…
Is Plagued with Problems:
Focuses on execuKon/compliance of individual HR processes
Assumes that people investments drive business performance…but unable to demonstrate impact
HR is customer-‐driven based on leaders requests, but limited ability to influence leaders without a true business case
Limited resources and focus on execuKon limits ability to take acKons that drive business performance
Oten viewed as a barrier by front-‐line leaders
Changing the Image of Human Resources Starts With HR
“The problem and the trap that HR finds itself in is that there is a perceived lack of credibility within HR and an inability to deliver value. In an effort to rec@fy this problem, symptoma@c fixes are pursued, via the latest generic best prac@ce models.” “The net result is a diversion of a<en@on away from where the real value lies – in pursuing solu@ons tailored to the unique circumstances and requirements of any given business.” –Sharlyn Lauby h&p://www.hrbartender.com/2013/training/changing-‐the-‐image-‐of-‐human-‐resources-‐starts-‐with-‐hr
Stop chasing the silver bullet – it doesn’t exist IdenKfy what drives results at YOUR organizaKon
Stay away from the latest fad
The Opportunity
• Discover the aItudes, competencies, skills, experiences, etc. that drive business outcomes
• Build a business case based on ROI
• Become viewed as a strategic partner that drives business results
• Make people investments based on drivers of results
• Take the lead in making HR processes business-‐focused
How to Build a Business-‐Focused Survey
The Typical, Not-‐so-‐Good Approach to Employee Surveys
Vendor provides list of survey items (Not necessarily valid /reliable; Not customizable to your company)
ReporKng hierarchy is built into the system (Does not allow for changes or analysis broken down to local levels)
How-‐to survey training conducted
Survey launched
Survey reports available a few weeks later (Too Long!)
Reports sent to each manager (maybe)
Manager responsible for communicaKng results and creaKng acKon plans
Hope that plans are focused on the right areas (No way to know if focusing on an area will really have an impact) F
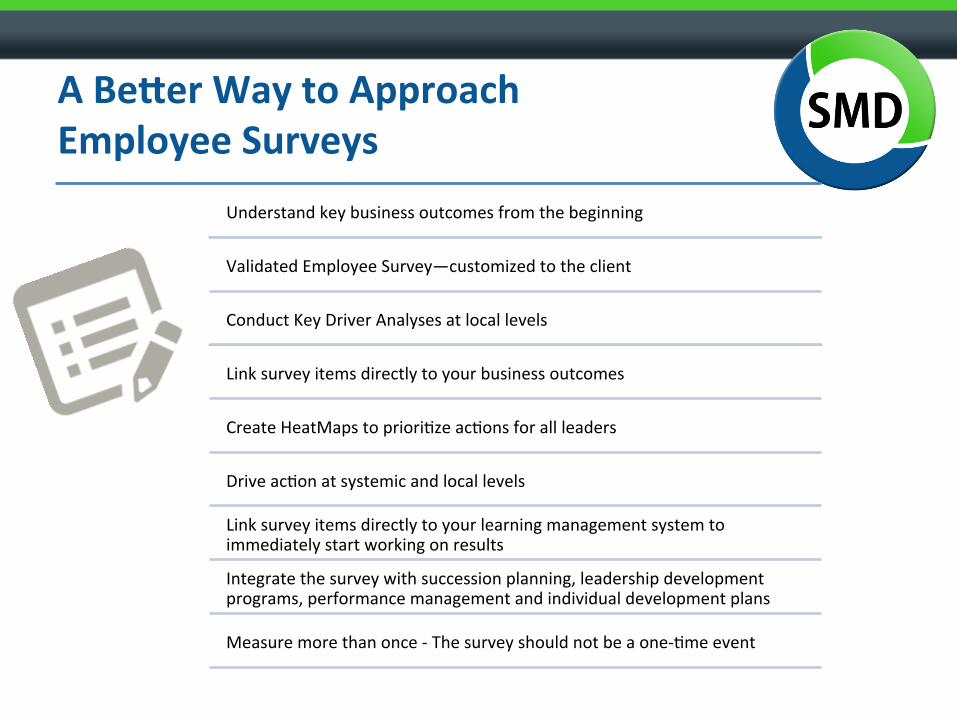
A BeGer Way to Approach Employee Surveys
Understand key business outcomes from the beginning
Validated Employee Survey—customized to the client
Conduct Key Driver Analyses at local levels
Link survey items directly to your business outcomes
Create HeatMaps to prioriKze acKons for all leaders
Drive acKon at systemic and local levels
Link survey items directly to your learning management system to immediately start working on results
Integrate the survey with succession planning, leadership development programs, performance management and individual development plans
Measure more than once -‐ The survey should not be a one-‐Kme event
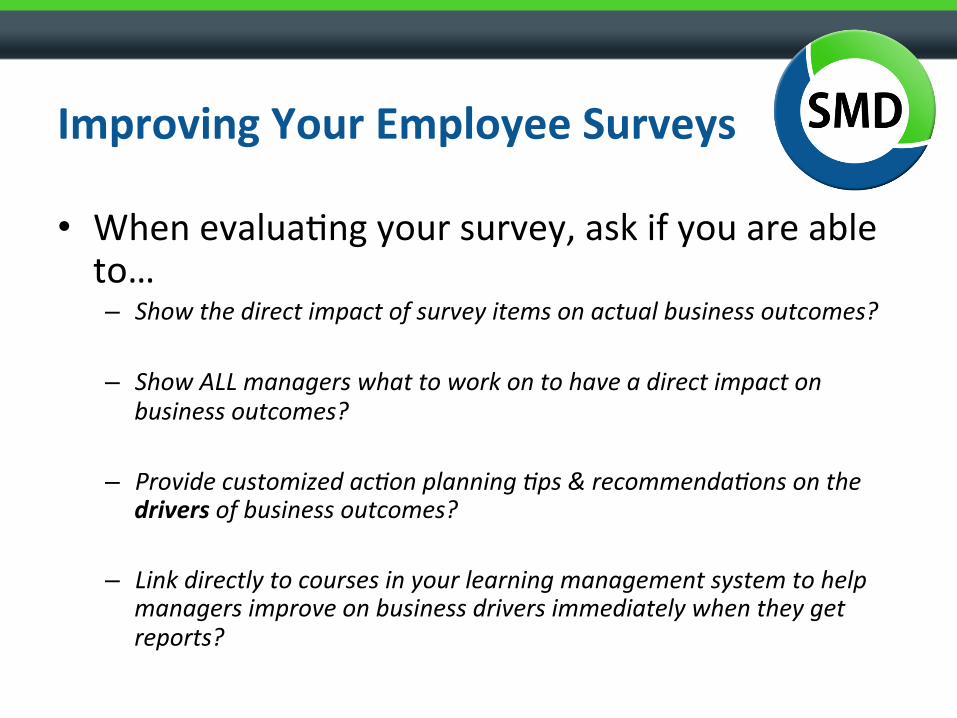
Improving Your Employee Surveys
• When evaluaKng your survey, ask if you are able to… – Show the direct impact of survey items on actual business outcomes? – Show ALL managers what to work on to have a direct impact on
business outcomes? – Provide customized ac@on planning @ps & recommenda@ons on the
drivers of business outcomes? – Link directly to courses in your learning management system to help
managers improve on business drivers immediately when they get reports?
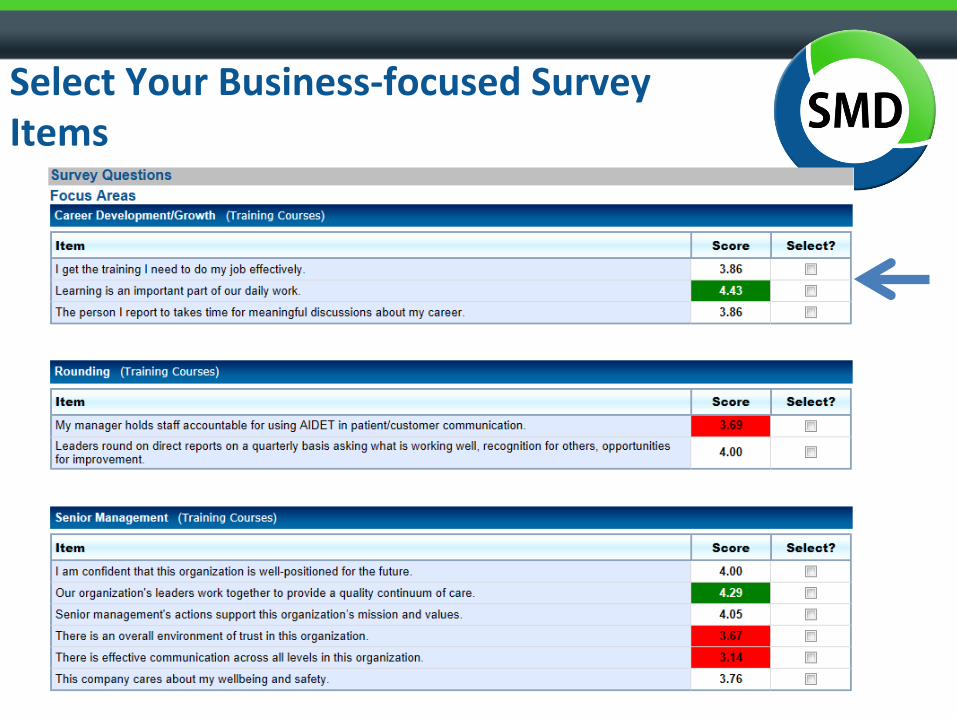
Survey Best Prac;ces: Building the Right Survey • Items:
– Start with a validated, core set of items – Customize /Delete as needed – Add items that are a focus for the organizaKon
• Survey Length: – Use 2 to 3 items covering the same topic – Use 2 to 3 open-‐ended items – 30-‐60 items maximum – Cover all ‘levels’: organizaKon, manager, and employee issues
• Anonymity: – Group minimum to receive a report (typically 5 or more)
Linking Your Survey to Business Outcomes
A Case Study
Company Specs
• 34,000 Employees • Long-‐term care • Home Health • Hospice • Community Care • For Profit • Annual Employee Survey
Our Analy;cs Approach Tradi;onal data analysis methods include:
• QualitaKve analysis or gap analysis (strengths/weaknesses) • CorrelaKon (not cause-‐effect, can lead us down the wrong path) • Regression (somewhat predicKve, does not account for
measurement error Advantages of Structural Equa;ons Modeling:
• Allows you to assess mulKple independent measures (e.g., competencies) & dependent measures (e.g., sales performance outcomes) simultaneously
• Implies causality and allows you to calculate the ROI SEM is commonly used in other industries (e.g., econometrics, market research)
What is a HeatMap? • A graphical plot that shows the impact of employees’ aItudes on a key
business outcome. • Allows leaders to idenKfy aItudes that are key drivers of business
results and prioriKze improvement efforts in these areas.
Performan
ce
(Average Ra;
ng)
Level of Impact
Maintain Promote
Monitor Focus
HeatMap InterpretaKon
1. Focus: Low Performing AND Key Driver
2. Monitor: Low Performing, Not Key Driver
3. Promote: High Performing, Key Driver
4. Maintain: High Performing, Not Key Driver
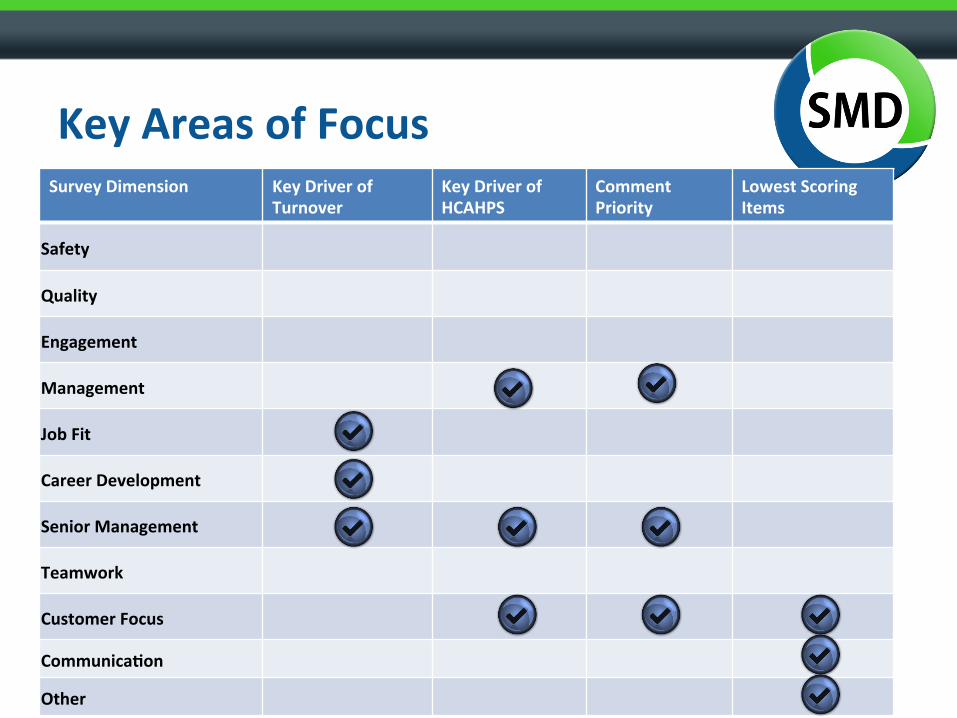
Analyzing Your Report: Key Drivers of Business Outcomes
Drivers of EBITDA, Performance & Turnover Risk
37
Accountability Career Development
Compensa;on
Engagement
Job Fit
Management/Leadership
Mission/Vision
Teamwork Customer Focus
Quality Safety
Sr. Mgmt. Rounding
3.2
3.4
3.6
3.8
4.0
4.2
4.4
4.6
0.0 0.1 0.2 0.3
Performan
ce
(Average Ra;
ng)
Level of Impact on EBITDA, LEM Performance, Turnover Risk & Reten;on (Higher numbers indicate a stronger impact based on a 0.0 to 1.0 scale)
Key Drivers of EBITDA, LEM Performance, Turnover Risk
Maintain Promote
Focus Monitor
Drivers of Business Outcomes
Quality
Career Development
Senior Management
EBITDA, Quality Indicators,
Reten;on
1
2
3
Circled numbers indicate the development priority based on the magnitude of the relaKonship with key healthcare outcomes.
Findings & Implica;ons: • Senior Management, Career Development and Quality are significant, causal drivers of EBITDAM, PaKent
SaKsfacKon and RetenKon. • PrioriKzing iniKaKves that target the key drivers listed above will lead to improvements in performance on the
healthcare outcomes.
Longitudinal Impact on Healthcare Outcomes
Quality
Career Development
Senior Management EBITDA 13% Margin Improvement
$8.8M
Quality Indicators 24% Indicator Improvement
Change in Mean from 2011 to 2013 of +.12
Change in Mean from 2011 to 2013 of +.14
Change in Mean from 2011 to 2013 of +.21
299Scripts à 371 Scripts 2009 2011
Healthcare Outcome Actual Improvement (2012 to 2013) Impact in Dollars
EBITDA +13% $8.8M
Turnover +13% $8.1M
Quality Indicators +24%
23% à 24% 2009 2011
By focusing on improving Senior Management, Career Development and Quality the OD team played a key role in improving healthcare outcomes.
Reten;on 13% Improvement
$8.1M
*Reten;on at an all-‐;me high in 2013
From analysis to ac@on
Linking to Business Outcomes for Front-‐line Leaders
1 2
3 4
Quickly PrioriKze Business Drivers (HeatMap)
Select Business Driver Items to Work On
Choose Recommended AcKons Submit Business-‐Focused AcKon Plan
Guiding Principles for Ac;on Planning
1. Focus on YOUR drivers of business outcomes 2. Keep it simple – focus on driving results and not siting
through reports 3. IdenKfy drivers at systemic level, all the way down to
front-‐line mangers 4. Move easily from prioriKzing drivers of business
outcomes to acKon planning 5. Provide customized Kps that you want to deploy in
your organizaKon 6. Monitor compliance and analyze focus of acKon plans 7. Measure and report the impact of acKons
What do you like best about working for this organiza;on?
Prac;cal Tips
Survey strategy should focus on driving business outcomes
Although the analysis is complicated – make the results pracKcal and acKon-‐oriented
Reach out to key stakeholders and gather outcome data early in the process
Demonstrate the linkage to all levels in the organizaKon
Show the value of engagement and communicate to all levels of the organizaKon
Link engagement data to more than one business outcome, if possible
Norms are fine, but linkage to business outcomes will have more impact and ROI in your organizaKon
What We Have Covered: • What employee engagement really is
• HR’s opportunity to make impact on the bo&om line • Designing the right survey for your organizaKon • Driving business outcomes with employee surveys • How to analyze survey data for maximum impact • How to present data to managers to create acKon and make
the process easy • Tell a compelling story with the data highlighKng the impact at