59
EngageNY.org Setting Performance Standards: Common Core Regents Exams in Algebra I and ELA NTI July, 2014
| Date post: | 16-Dec-2015 |
| Category: |
Documents |
| Upload: | molly-forman |
| View: | 217 times |
| Download: | 0 times |

EngageNY.org
Setting Performance Standards: Common Core
Regents Exams in Algebra I and ELA
NTI
July, 2014
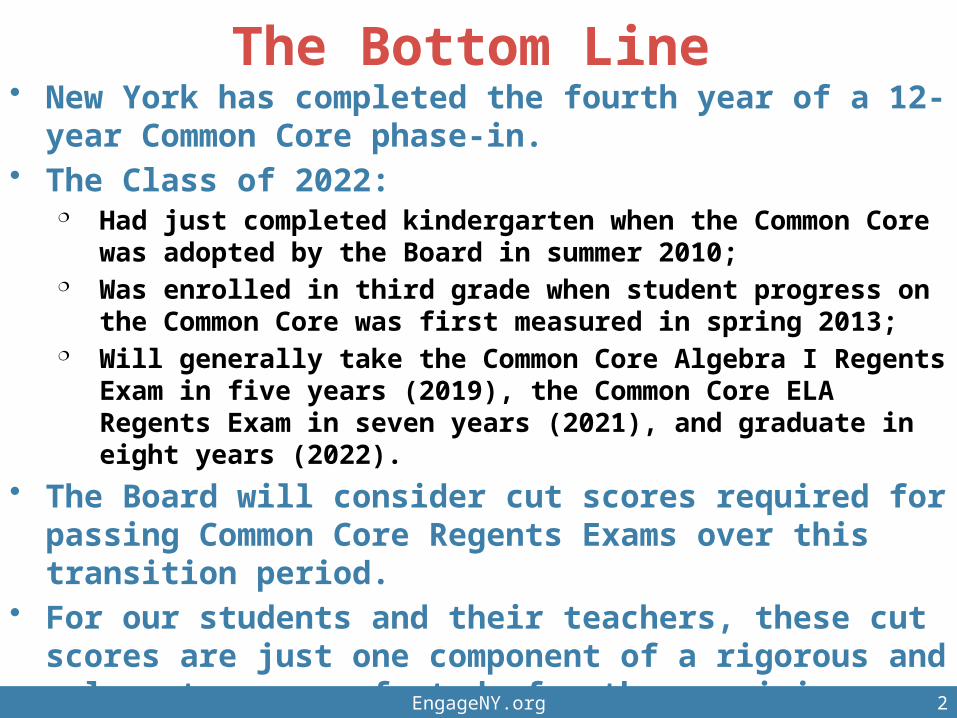
The Bottom Line• New York has completed the fourth year of a 12-year
Common Core phase-in.• The Class of 2022:
Had just completed kindergarten when the Common Core was adopted by the Board in summer 2010;
Was enrolled in third grade when student progress on the Common Core was first measured in spring 2013;
Will generally take the Common Core Algebra I Regents Exam in five years (2019), the Common Core ELA Regents Exam in seven years (2021), and graduate in eight years (2022).
• The Board will consider cut scores required for passing Common Core Regents Exams over this transition period.
• For our students and their teachers, these cut scores are just one component of a rigorous and relevant course of study for the remaining eight years of the phase-in.
EngageNY.org 2
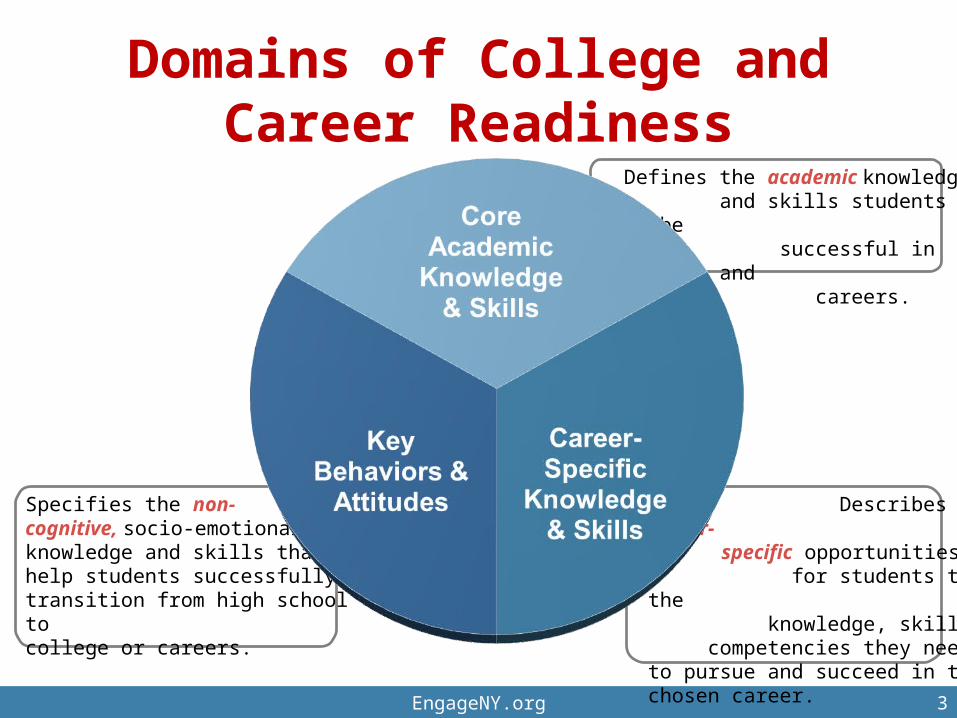
Domains of College and Career Readiness
EngageNY.org 3
Defines the academic knowledge and skills students need to be successful in college and careers.
Specifies the non-cognitive, socio-emotional knowledge and skills that help students successfully transition from high school to college or careers.
Describes the career- specific opportunities for students to gain the knowledge, skills, and competencies they need to pursue and succeed in their chosen career.

Completion vs. ReadinessDefining What Our Students Need for Success
New York's 4-year high school graduation rate is 74.9% for All Studentshowever, the gaps are disturbing.
June 2013 Graduation Rate
Graduation under Current Requirements(Completion)
Calculated College and Career Ready*(Readiness)
% Graduating % Graduating
All Students 74.9 All Students 37.2
American Indian 62.2 American Indian 21.3
Asian/Pacific Islander 80.6 Asian/Pacific Islander 57.2
Black 59.7 Black 14.2
Hispanic 59.2 Hispanic 18.0
White 86.5 White 50.4
English Language Learners 31.4 English Language Learners 5.9
Students with Disabilities 48.7 Students with Disabilities 5.4
*Students graduating with at least a score of 75 on Regents English and 80 on a Math Regents, which correlates with success in first-year college courses.
Source: NYSED Office of Information and Reporting Services
EngageNY.org 4

EngageNY.org 5
2013 National Grade 12 NAEP Results
Grade 12 Reading Grade 12 Math
38% 39%
2013
• These data reflect the percentage of students likely to possess the academic knowledge and skills necessary for college.
Source: http://nationsreportcard.gov/reading_math_g12_2013/#/preparedness

EngageNY.org
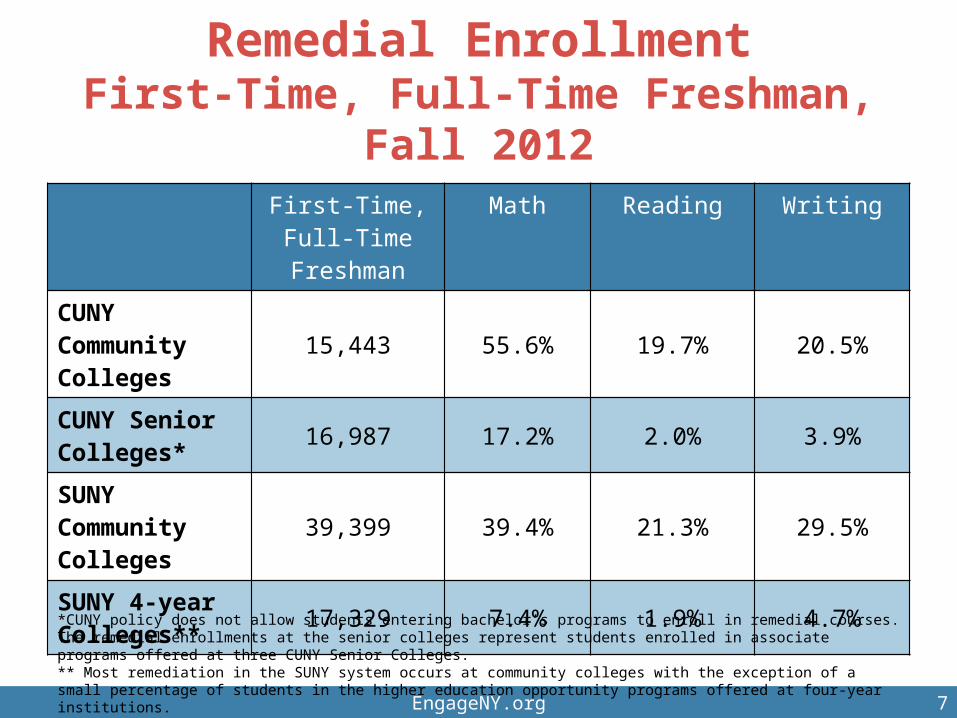
Remedial EnrollmentFirst-Time, Full-Time Freshman,
Fall 2012
EngageNY.org 7
First-Time, Full-Time Freshman
Math Reading Writing
CUNY Community Colleges
15,443 55.6% 19.7% 20.5%
CUNY Senior Colleges*
16,987 17.2% 2.0% 3.9%
SUNY Community Colleges
39,399 39.4% 21.3% 29.5%
SUNY 4-year Colleges**
17,329 7.4% 1.9% 4.7%
*CUNY policy does not allow students entering bachelor’s programs to enroll in remedial courses. The remedial enrollments at the senior colleges represent students enrolled in associate programs offered at three CUNY Senior Colleges. ** Most remediation in the SUNY system occurs at community colleges with the exception of a small percentage of students in the higher education opportunity programs offered at four-year institutions.

Higher Education Endorses Common Core
• SUNY Board of Trustees passed a resolution in May 2014 endorsing the Common Core, citing the need to better prepare the next generation of SUNY students and decrease the need for remediation.
• In June 2014, 61 SUNY Presidents, the SUNY
Chancellor, the CUNY Chancellor joined over 150 College Presidents from across the nation to commit their support to Common Core standards and assessments that measure the student progress on the Common Core.
EngageNY.org 8
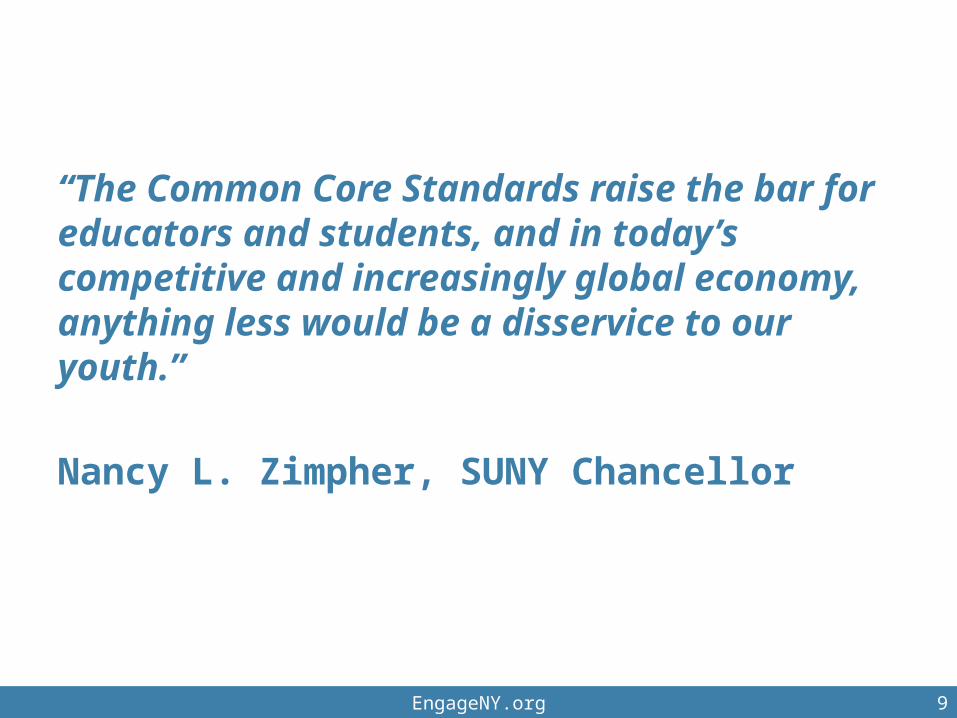
“The Common Core Standards raise the bar for educators and students, and in today’s competitive and increasingly global economy, anything less would be a disservice to our youth.”
Nancy L. Zimpher, SUNY Chancellor
EngageNY.org 9
Why Readiness Matters – Labor Market Is More Demanding
EngageNY.org
A post-secondary education is the“Passport to the American Dream”
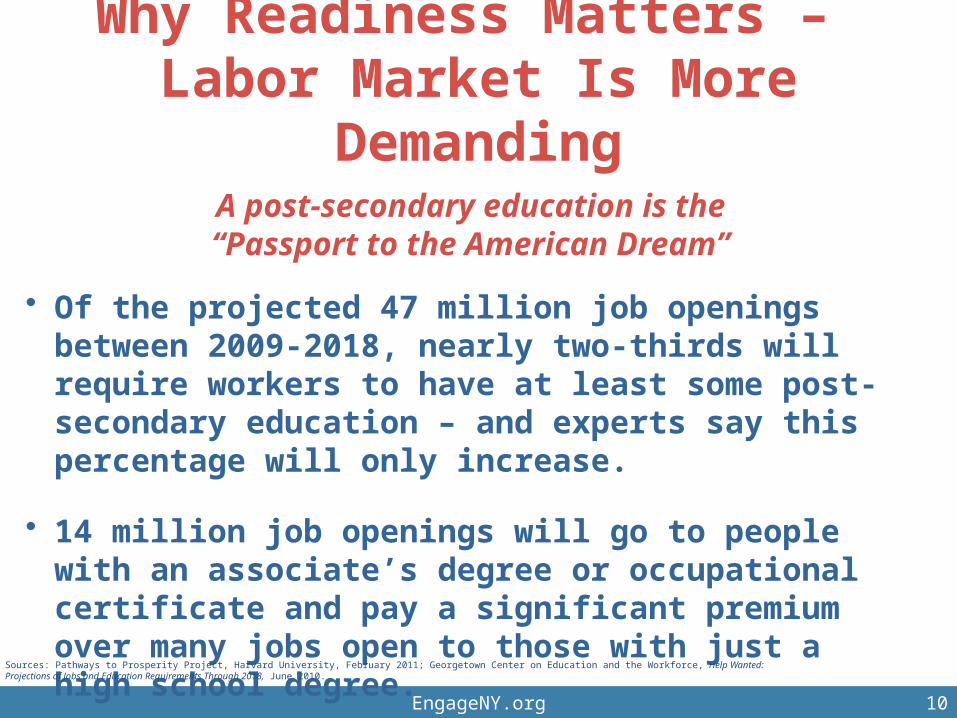
• Of the projected 47 million job openings between 2009-2018, nearly two-thirds will require workers to have at least some post-secondary education – and experts say this percentage will only increase.
• 14 million job openings will go to people with an associate’s degree or occupational certificate and pay a significant premium over many jobs open to those with just a high school degree.
Sources: Pathways to Prosperity Project, Harvard University, February 2011; Georgetown Center on Education and the Workforce, Help Wanted: Projections of Jobs and Education Requirements Through 2018, June 2010.
10

EngageNY.org
EngageNY.org
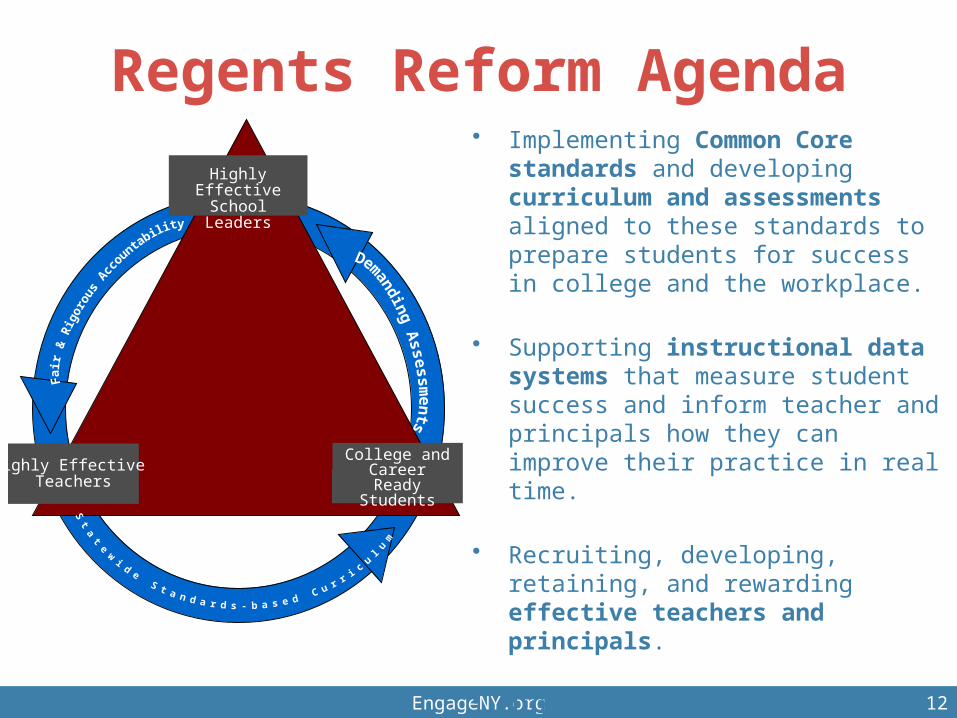
Regents Reform Agenda
College and Career Ready
Students
Highly EffectiveSchool Leaders
Highly Effective Teachers
• Implementing Common Core standards and developing curriculum and assessments aligned to these standards to prepare students for success in college and the workplace.
• Supporting instructional data systems that measure student success and inform teacher and principals how they can improve their practice in real time.
• Recruiting, developing, retaining, and rewarding effective teachers and principals.
• Turning around the lowest-achieving schools.
12
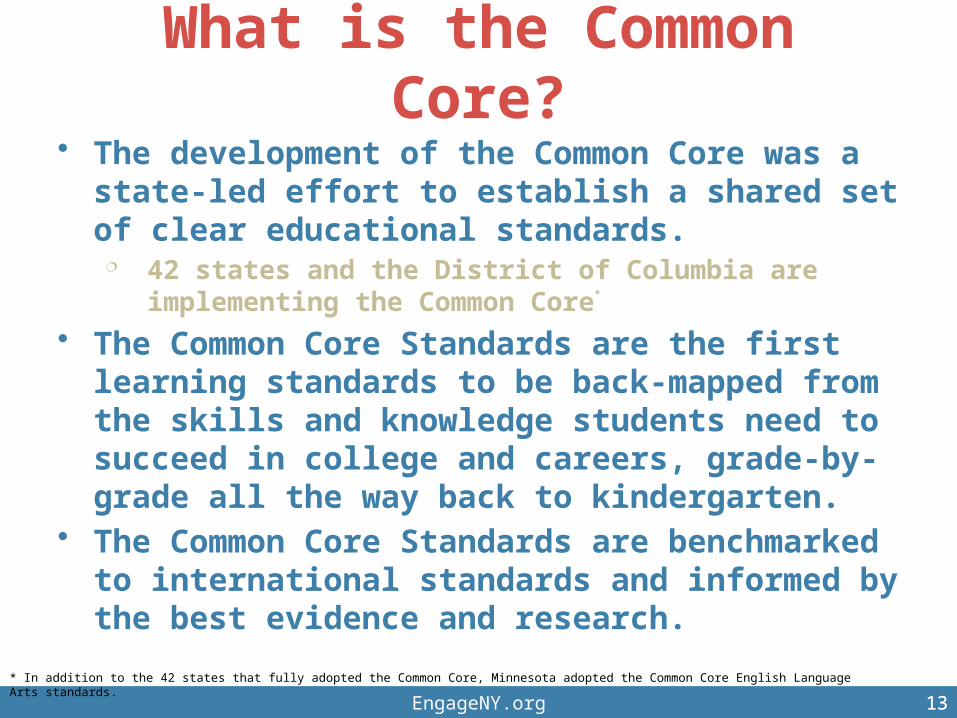
What is the Common Core?• The development of the Common Core was a state-
led effort to establish a shared set of clear educational standards.
42 states and the District of Columbia are implementing the Common Core*
• The Common Core Standards are the first learning standards to be back-mapped from the skills and knowledge students need to succeed in college and careers, grade-by-grade all the way back to kindergarten.
• The Common Core Standards are benchmarked to international standards and informed by the best evidence and research.
EngageNY.org 13
* In addition to the 42 states that fully adopted the Common Core, Minnesota adopted the Common Core English Language Arts standards.
13
Common Core Curriculum, Instruction, and Assessments
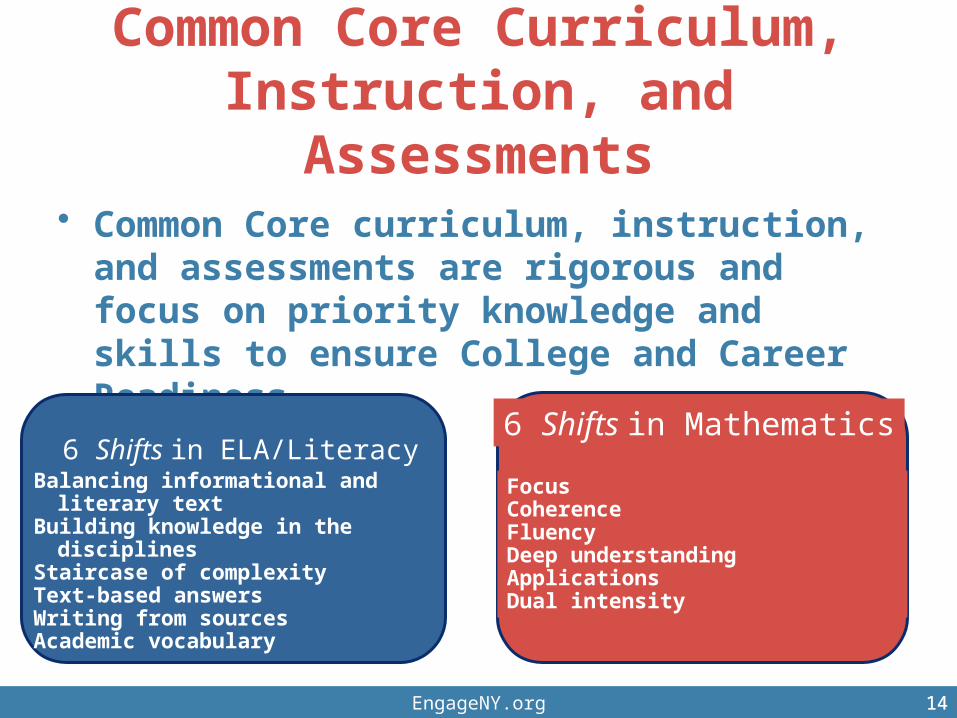
• Common Core curriculum, instruction, and assessments are rigorous and focus on priority knowledge and skills to ensure College and Career Readiness.
EngageNY.org
6 Shifts in Mathematics
Focus CoherenceFluencyDeep understandingApplicationsDual intensity
6 Shifts in ELA/LiteracyBalancing informational and literary textBuilding knowledge in the disciplinesStaircase of complexityText-based answersWriting from sourcesAcademic vocabulary
1414

NYS Educator Involvement in NYS Common Core Assessments
NYS Educators are represented on the following panels: New York State Content Advisory Panels
• Spans early childhood and P12 through CUNY, SUNY and CICU faculty Item Development, Item Review, Final Form Review Performance Standards (cut scores)
• Teachers, faculty and district-level
These panels are informing: College and Career Ready Determinations Test specifications, policies, and item development NYS policy-level and grade-level performance level
descriptions Setting performance standards
15EngageNY.org 15
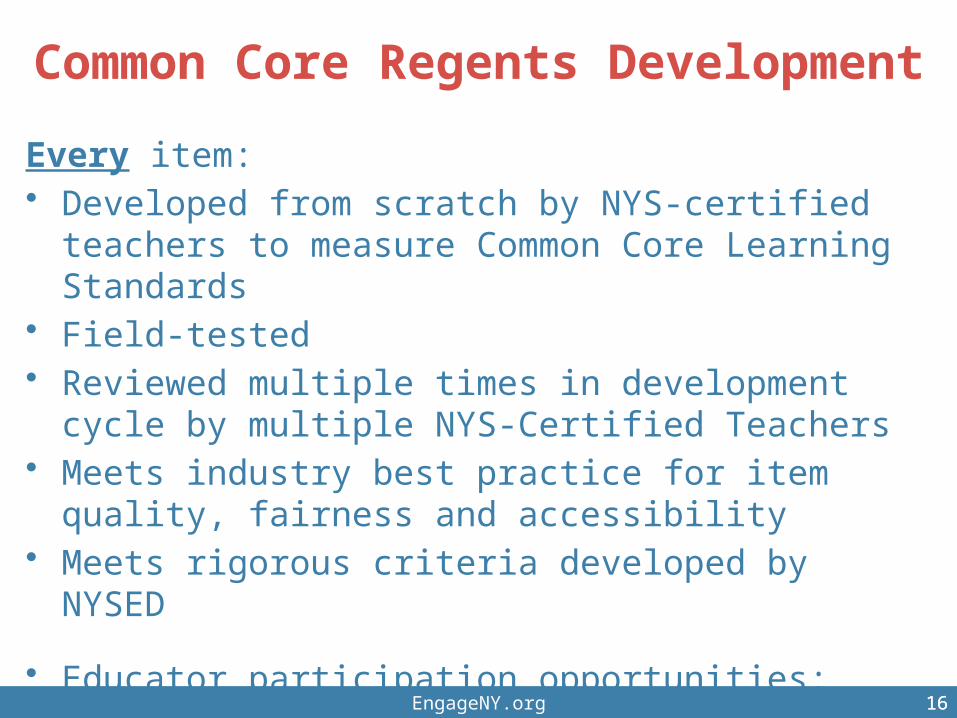
Common Core Regents Development
Every item: • Developed from scratch by NYS-certified teachers to
measure Common Core Learning Standards• Field-tested• Reviewed multiple times in development cycle by
multiple NYS-Certified Teachers• Meets industry best practice for item quality, fairness
and accessibility• Meets rigorous criteria developed by NYSED
• Educator participation opportunities: http://www.p12.nysed.gov/assessment/teacher/home.html#teacher-op
EngageNY.org 1616
EngageNY.org
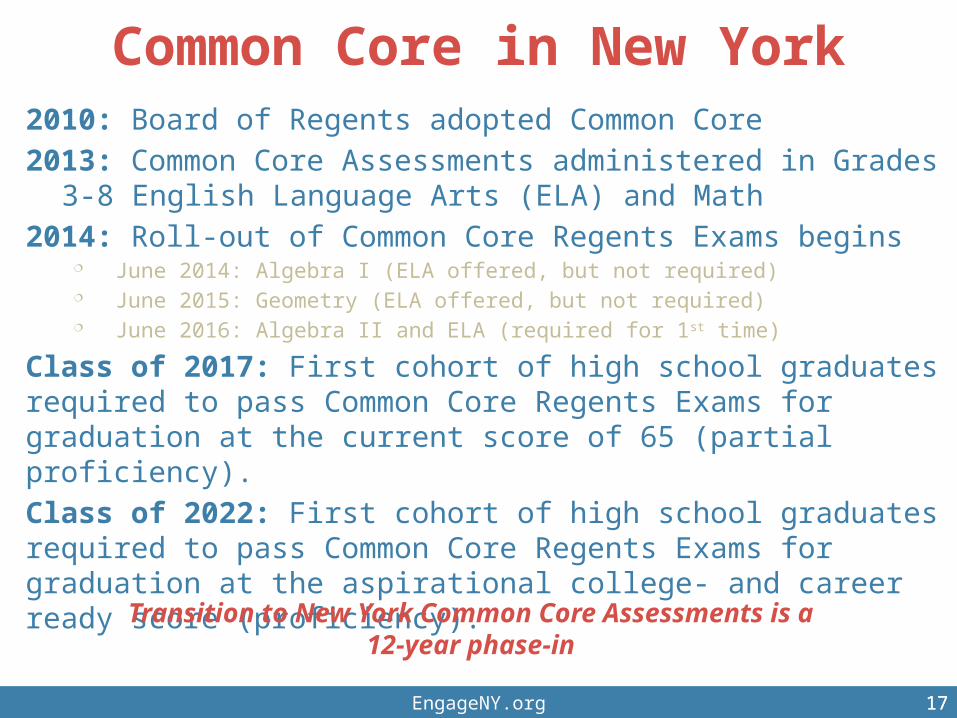
Common Core in New York2010: Board of Regents adopted Common Core
2013: Common Core Assessments administered in Grades 3-8 English Language Arts (ELA) and Math
2014: Roll-out of Common Core Regents Exams begins June 2014: Algebra I (ELA offered, but not required) June 2015: Geometry (ELA offered, but not required) June 2016: Algebra II and ELA (required for 1st time)
Class of 2017: First cohort of high school graduates required to pass Common Core Regents Exams for graduation at the current score of 65 (partial proficiency).
Class of 2022: First cohort of high school graduates required to pass Common Core Regents Exams for graduation at the aspirational college- and career ready score (proficiency).
Transition to New York Common Core Assessments is a 12-year phase-in
1717
Regents Common Core Transition Flexibility
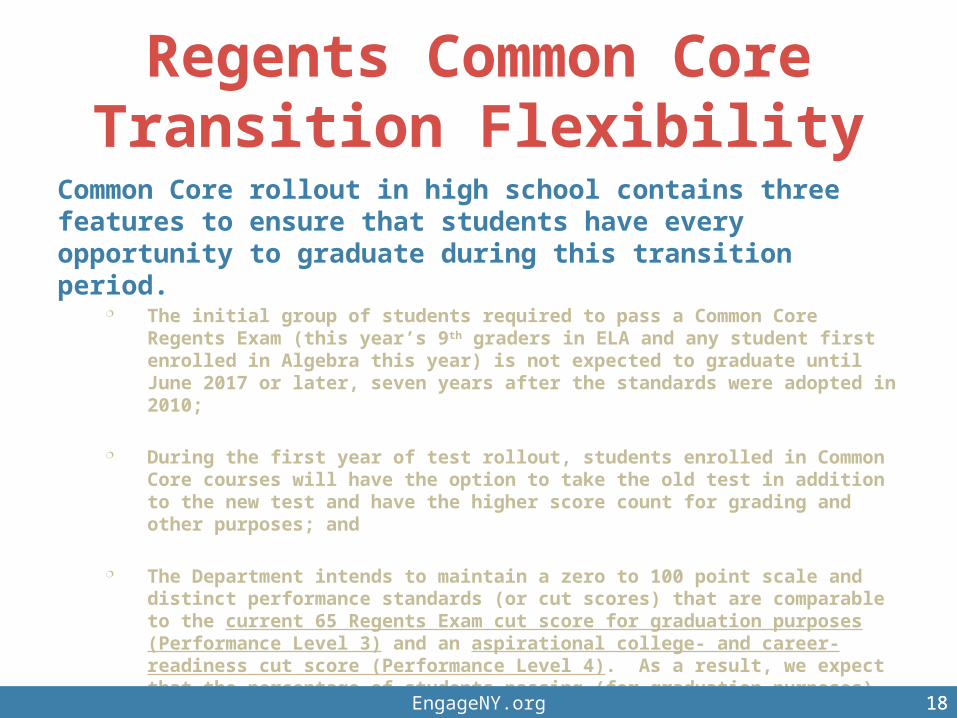
Common Core rollout in high school contains three features to ensure that students have every opportunity to graduate during this transition period.
The initial group of students required to pass a Common Core Regents Exam (this year’s 9th graders in ELA and any student first enrolled in Algebra this year) is not expected to graduate until June 2017 or later, seven years after the standards were adopted in 2010;
During the first year of test rollout, students enrolled in Common Core courses will
have the option to take the old test in addition to the new test and have the higher score count for grading and other purposes; and
The Department intends to maintain a zero to 100 point scale and distinct performance standards (or cut scores) that are comparable to the current 65 Regents Exam cut score for graduation purposes (Performance Level 3) and an aspirational college- and career-readiness cut score (Performance Level 4). As a result, we expect that the percentage of students passing (for graduation purposes) the new Common Core Regents Exams will likely be similar to the pass rates on existing Regents Exams at a score of 65.
EngageNY.org 1818

Full Implementation for the Class of 2022
• The Board’s intent is to phase in over time the graduation requirement to demonstrate proficiency on the Common Core standards in high school courses.
• Specifically, the class of 2022 would be the first group of students required to pass Common Core Regents Exams (ELA and one exam in math) at the level of meeting Common Core course-level expectations (i.e., Level 4 of five levels).
EngageNY.org 1919
Performance Levels
EngageNY.org 20
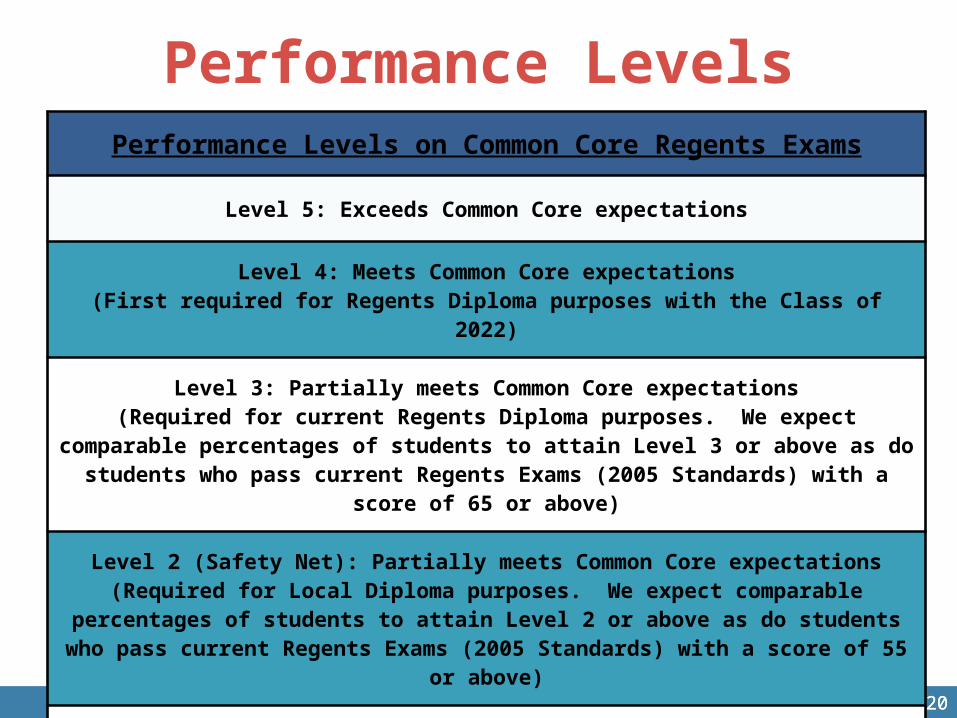
Performance Levels on Common Core Regents Exams
Level 5: Exceeds Common Core expectations
Level 4: Meets Common Core expectations(First required for Regents Diploma purposes with the Class of 2022)
Level 3: Partially meets Common Core expectations(Required for current Regents Diploma purposes. We expect comparable
percentages of students to attain Level 3 or above as do students who pass current Regents Exams (2005 Standards) with a score of 65 or above)
Level 2 (Safety Net): Partially meets Common Core expectations(Required for Local Diploma purposes. We expect comparable percentages of
students to attain Level 2 or above as do students who pass current Regents Exams (2005 Standards) with a score of 55 or above)
Level 1: Does not demonstrate Knowledge and Skills for Level 2
20
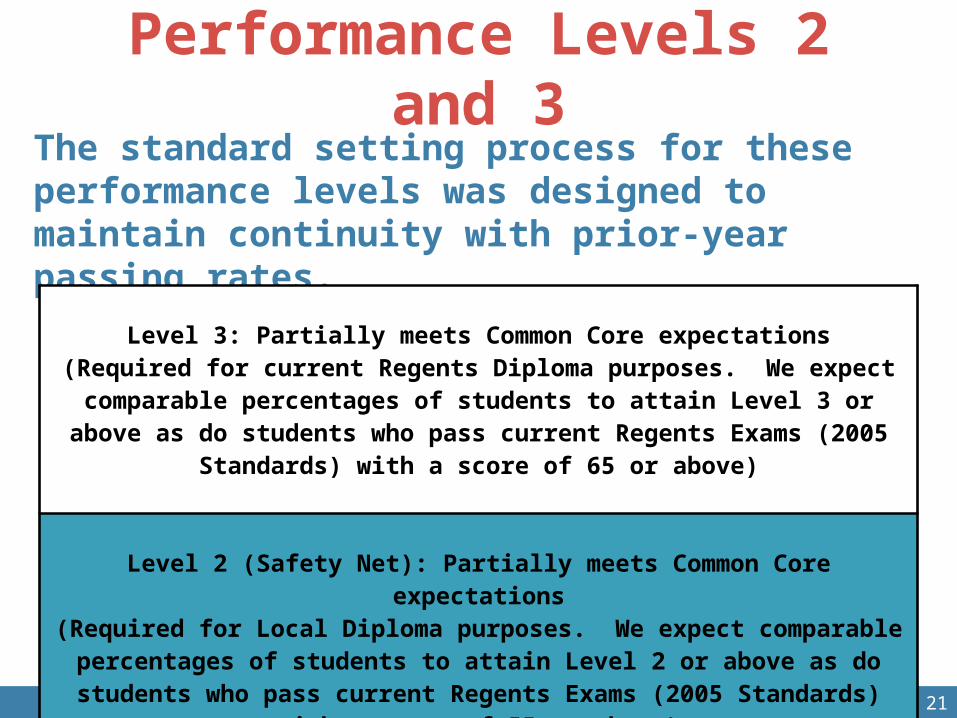
Performance Levels 2 and 3
The standard setting process for these performance levels was designed to maintain continuity with prior-year passing rates.
EngageNY.org 21
Level 3: Partially meets Common Core expectations(Required for current Regents Diploma purposes. We expect comparable
percentages of students to attain Level 3 or above as do students who pass current Regents Exams (2005 Standards) with a score of 65 or above)
Level 2 (Safety Net): Partially meets Common Core expectations(Required for Local Diploma purposes. We expect comparable percentages
of students to attain Level 2 or above as do students who pass current Regents Exams (2005 Standards) with a score of 55 or above)

Performance Levels 4 and 5
The standard setting process for these performance levels was based on educator judgment, the standards, and the performance-level descriptions.
EngageNY.org 22
Level 5: Exceeds Common Core expectations
Level 4: Meets Common Core expectations(First required for Regents Diploma purposes with the
Class of 2022)
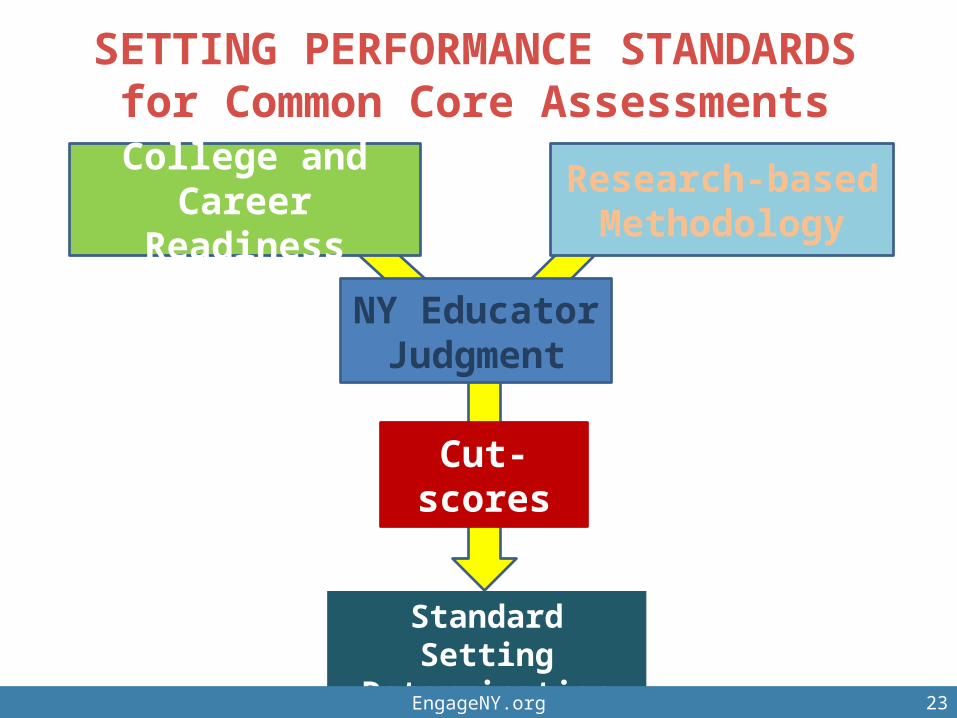
College and Career Readiness
Cut-scores
NY EducatorJudgment
SETTING PERFORMANCE STANDARDS for Common Core
Assessments
Standard Setting Determination
Research-based Methodology
23EngageNY.org 23

SETTING PERFORMANCE STANDARDS
• Required by USED and Standards for Educational and Psychological Testing to use research-based methodology
• National experts in standard setting monitored planning, materials and process
Research-based Methodology
EngageNY.org 24

EngageNY.org 25
Selection of PanelistsLetters sent to key New York educator organizations, BOCES and Big 5 seeking nominations of educators who:
have a deep knowledge of the Common Core standards have experience teaching different student populations represent the diversity of New York State include urban/rural/suburban schools include various geographic areas of the state
Resumes were reviewed carefully to ensure rich representation for each ELA and Math grade band

New York Educators are Essential to Setting
Standards• 69 New York educators served as panelists
34 panelists for ELA 35 panelists for Algebra I
• Variety of educators represented: K-12 ELA and Math Teachers BOCES ELL and SwD specialists Higher Education K-12 Administration
EngageNY.org 26

EngageNY.org
EngageNY.org

EngageNY.org

EngageNY.org

EngageNY.org

EngageNY.org

Capital District8%
Central8%
Long Island8%
Hudson Valley8%
NYC22%
North Country6%
Southern Tier6%
Western14%
Buffalo8%
Rochester3%
Syracuse3%
Yonkers6%
EngageNY.org 33
Algebra I Panelist Region

Male44%
Female56%
Algebra I Panelist Gender
EngageNY.org 34
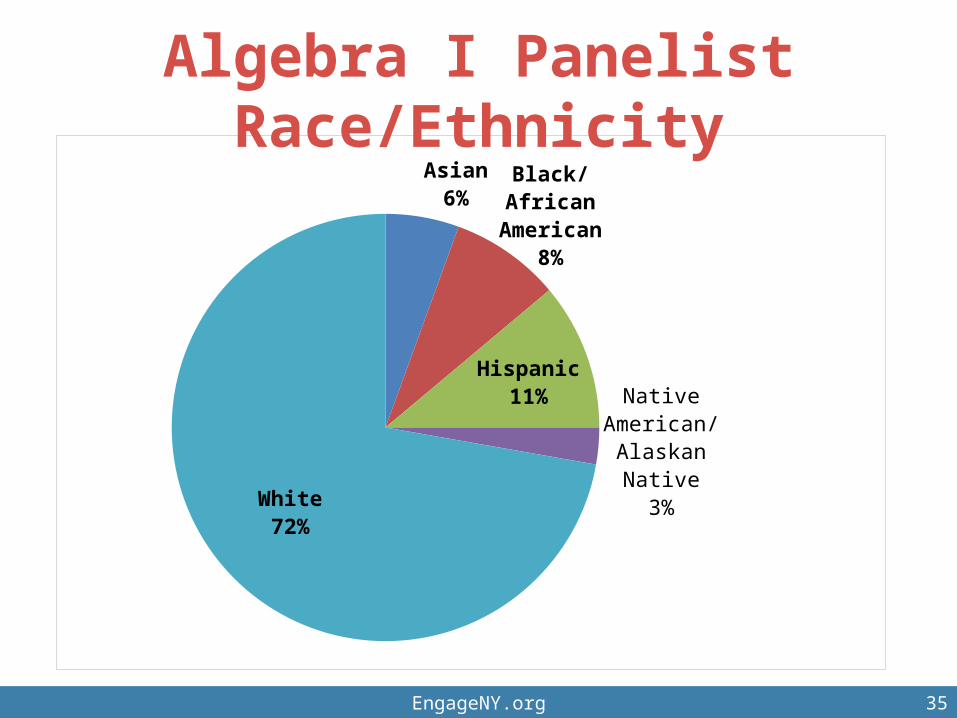
Asian6%
Black/African American
8%
Hispanic11%
Native Amer-ican/ Alaskan
Native3%
White72%
Algebra I Panelist Race/Ethnicity
EngageNY.org 35

Special Pop Certified Teachers
8%
Gen Ed Teachers92%
Algebra I Panelists Working with Special
Populations
EngageNY.org 36

EngageNY.org 37
Student Tests Selected for the Standard Setting
For the standard setting, a sample of student tests was selected to match the typical June test-taking population, including:
Need/Resource Group Gender Students with disabilities English language learners Poverty Race/ethnicity Achievement

ELA - Representativeness
Demographic Typical Test-Takers Standard Setting
Male 50.7 50.3
Female 49.3 49.7
SWD 11.9 11.4
ELL 7.7 5.8
Poverty 43.2 44.1
NRC 1 (NYC) 34.2 36.1NRC 2 (Big 4) 2.8 2.7NRC 3 (High need urban/suburban) 5.6 5.3NRC 4 (High need rural) 5.2 5.8NRC 5 (Average need) 28.4 31.7NRC 6 (Low need) 15.9 11.9NRC 7 (Charter Schools) 1.3 1.3NRC 8 (Nonpublic) 6.7 5.2
EngageNY.org 38

ELA - Representativeness
Demographic Typical Test-Takers Standard Setting
Asian 9.2 8.1Black 17.4 18.5Hispanic 21.2 20.0American Indian 0.5 0.4Multiracial 0.6 0.4Pacific Islander 0.2 0.1White 51.0 52.4
EngageNY.org 39

Algebra I - RepresentativenessDemographic Typical Test-Takers Standard Setting
Male 50.0 49.3
Female 50.0 50.7
SWD 12.7 11.9
ELL 7.9 5.4
Poverty 48.3 47.5
NRC 1 (NYC) 35.2 36.1NRC 2 (Big 4) 3.9 3.5NRC 3 (High need urban/suburban) 6.8 6.5NRC 4 (High need rural) 4.8 4.0NRC 5 (Average need) 26.3 28.3NRC 6 (Low need) 13.7 14.5NRC 7 (Charter Schools) 1.8 1.8NRC 8 (Nonpublic) 7.3 5.3
EngageNY.org 40
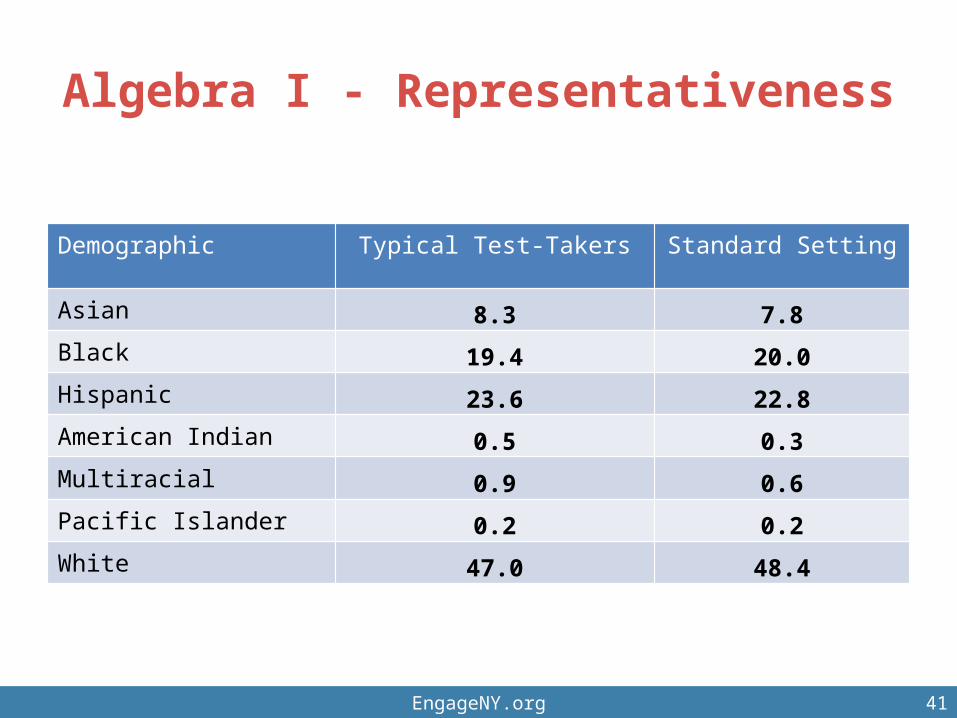
Algebra I - Representativeness
Demographic Typical Test-Takers Standard Setting
Asian 8.3 7.8Black 19.4 20.0Hispanic 23.6 22.8American Indian 0.5 0.3Multiracial 0.9 0.6Pacific Islander 0.2 0.2White 47.0 48.4
EngageNY.org 41
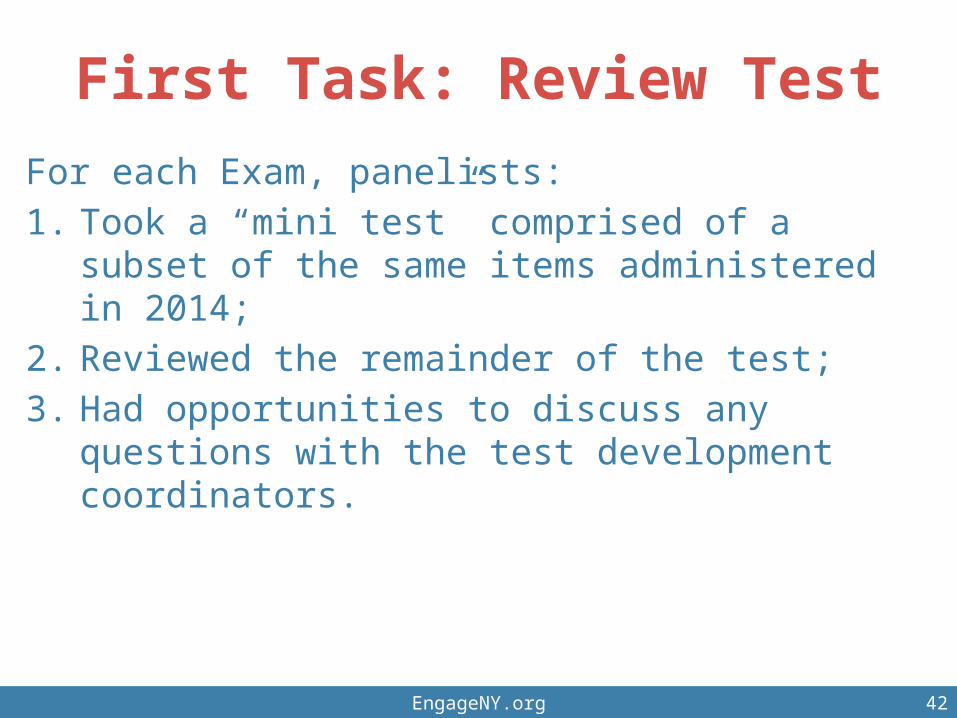
First Task: Review Test
For each Exam, panelists:
1. Took a “mini test” comprised of a subset of the same items administered in 2014;
2. Reviewed the remainder of the test;
3. Had opportunities to discuss any questions with the test development coordinators.
EngageNY.org 42

Second Task: Define Expectations
For each exam, panelists:
1. Reviewed detailed descriptions of the range of knowledge and skills that describe students at each performance level;
2. For Levels 4 and 5, discussed and came to consensus on the specific knowledge and skills that characterize a student who is “just barely” proficient. This is the threshold student.
EngageNY.org 43
Focus is on what students should be able to do in each course according to demands of the standards.
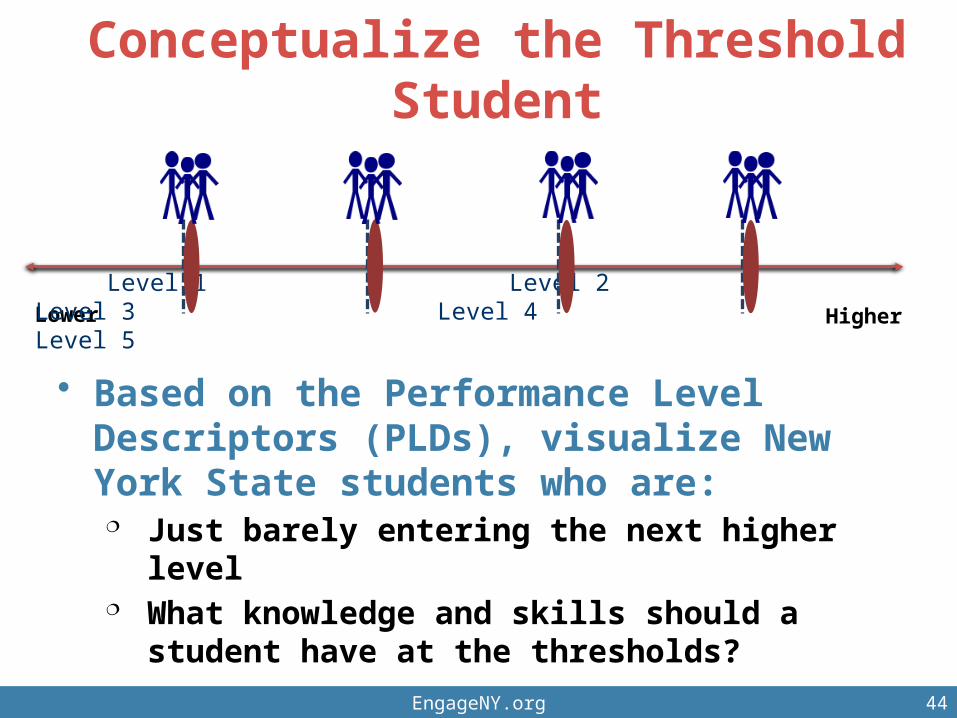
Conceptualize the Threshold Student
• Based on the Performance Level Descriptors (PLDs), visualize New York State students who are:
Just barely entering the next higher level What knowledge and skills should a student have
at the thresholds?
EngageNY.org 44
Lower
Level 1 Level 2 Level 3 Level 4 Level 5Higher
EngageNY.org
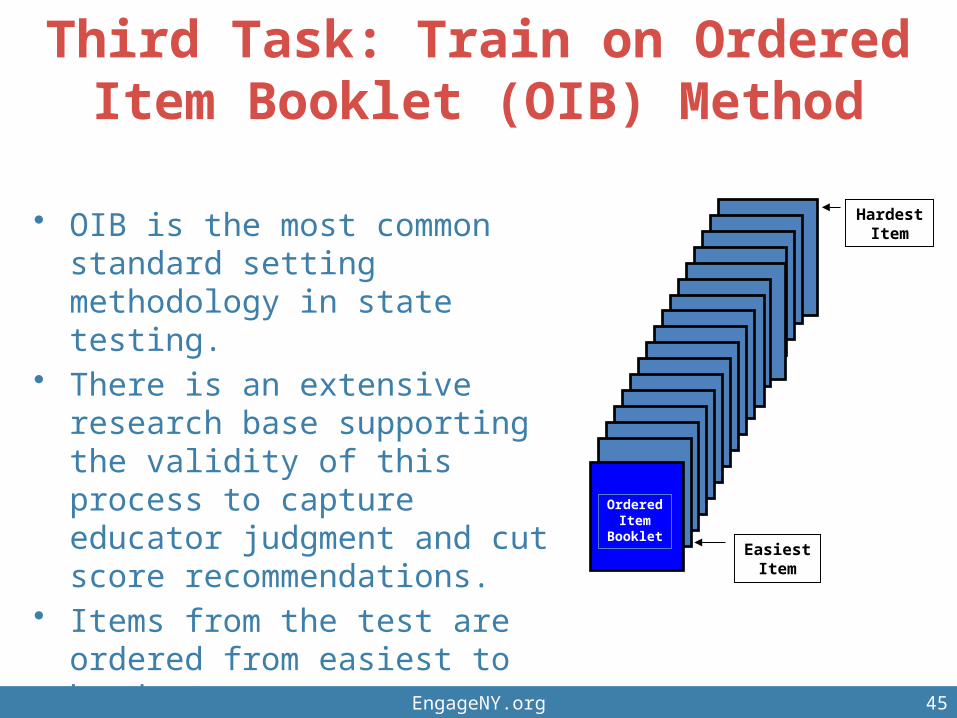
• OIB is the most common standard setting methodology in state testing.
• There is an extensive research base supporting the validity of this process to capture educator judgment and cut score recommendations.
• Items from the test are ordered from easiest to hardest.
45
OrderedItem
BookletEasiest
Item
Hardest Item
Third Task: Train on Ordered Item Booklet (OIB) Method
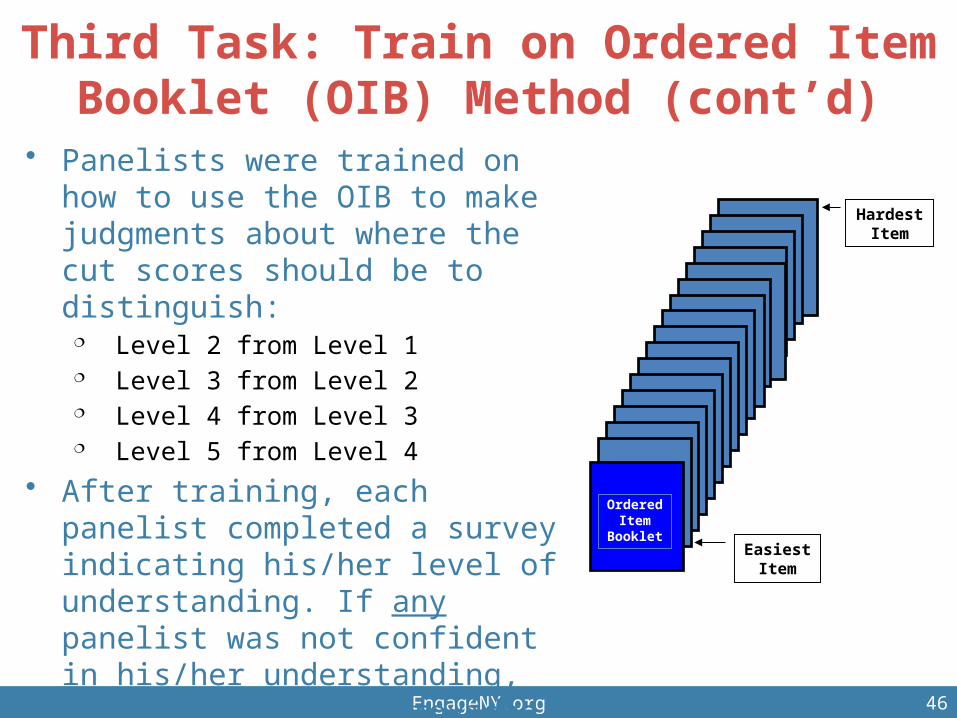
EngageNY.org
• Panelists were trained on how to use the OIB to make judgments about where the cut scores should be to distinguish:
Level 2 from Level 1 Level 3 from Level 2 Level 4 from Level 3 Level 5 from Level 4
• After training, each panelist completed a survey indicating his/her level of understanding. If any panelist was not confident in his/her understanding, more training was provided to all.
46
OrderedItem
BookletEasiest
Item
Hardest Item
Third Task: Train on Ordered Item Booklet (OIB) Method (cont’d)
EngageNY.org
Fourth Task: Make First Judgments about Cut Scores
• Panelists made judgments individually.• Individual judgments were handed to facilitators.• Facilitators aggregated data and shared with
panelists.• Panelists discussed rationales for their judgments.
Rationales must be based on threshold descriptions and expectations of the Common Core standards.
47

• For Levels 2 and 3, panelists could select only from bookmarks that maintained the passing rate policy.
• For Levels 4 and 5, panelists placed bookmarks based on their judgment, the standards, and performance level descriptions.
EngageNY.org 48
Level 1 Level 2 Level 3 Level 4 Level 5
Level 2 Cut
Score
Level 5 Cut
Score
Level 3 Cut
Score
Level 4 Cut
Score
Must be consistent with current passing rates
Three Rounds for Each Exam
• The process was repeated three times for each exam to ensure panelists had ample time to discuss the rationale for their judgments and change their judgments if their other panelists offered compelling rationales to do so.
• Panelists reviewed impact data after Rounds 2 and 3.• Panelists were not required to come to consensus as
individual judgment is valued. • The process took two full days for each exam.
EngageNY.org 49
Panelist Evaluation of Process
• 90% of Algebra I and 92% of ELA panelists agreed or strongly agreed that the process and methods used would produce appropriate results.
• 100% of Algebra I and 96% of ELA panelists agreed or strongly agreed that their bookmark placements accurately represented the knowledge and skills required for each performance level.
“I walked in very skeptical. VERY. I am much more confident in the findings and recommendations after having been through this process. I think the variety of perspectives is critically important to the success.”
EngageNY.org 50
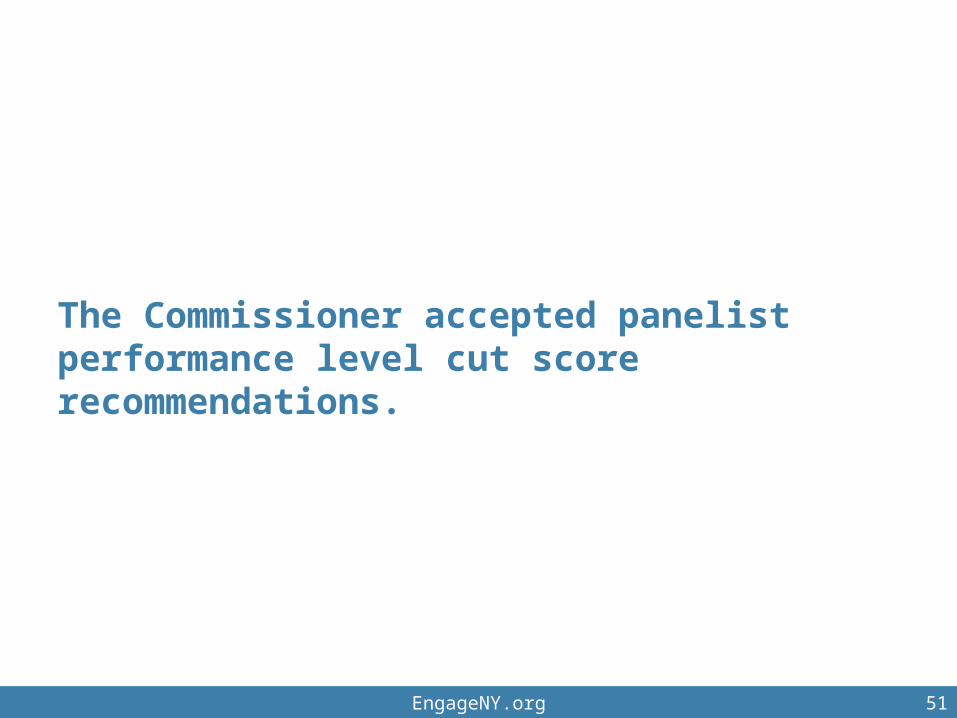
The Commissioner accepted panelist performance level cut score recommendations.
EngageNY.org 51

New Standards and Tests, Same Scale
EngageNY.org 52
New performance standards
Level 5: Exceeds Common Core expectations
Level 4: Meets Common Core expectations (first required for Regents Diploma purposes with the Class of 2022)
Level 3: Partially meets Common Core expectations (Required for current Regents Diploma purposes)
Level 2 (Safety Net): Partially meets Common Core Expectations (Required for Local Diploma purposes)
Level 1: Does not demonstrate knowledge and skills for Level 1
Same Scale
0 - 100

Common Core ELA Regents ExamPercent in each Performance Level for
Public Schools included in Standard Setting
Series1
0% 10% 20% 30% 40% 50% 60% 70% 80% 90% 100%
13.3% 10.1% 29.7% 22.6% 24.2%Level 1Level 2Level 3Level 4Level 5
Common Core Level 2 and above: 86.7%55 & above historical range: 83.3-87.5%
Common Core Level 3 and above: 76.6%65 & above historical range: 69.9-78.0%
EngageNY.org 53

Common Core ELA Regents ExamPercent in each Performance Level for
Public Schools included in Standard Setting(2008-13 Historical Medians & Ranges Displayed in Red)
Level 1 Level 2 Level 3 Level 4 Level 50
5
10
15
20
25
30
35
13.3 10.1 29.7 22.6 24.2
13.8
9.4
21.823.5
31.3
2014:
Prior to 2014: (0-54) (55-64) (65-79) (80-84) (85-100) 54
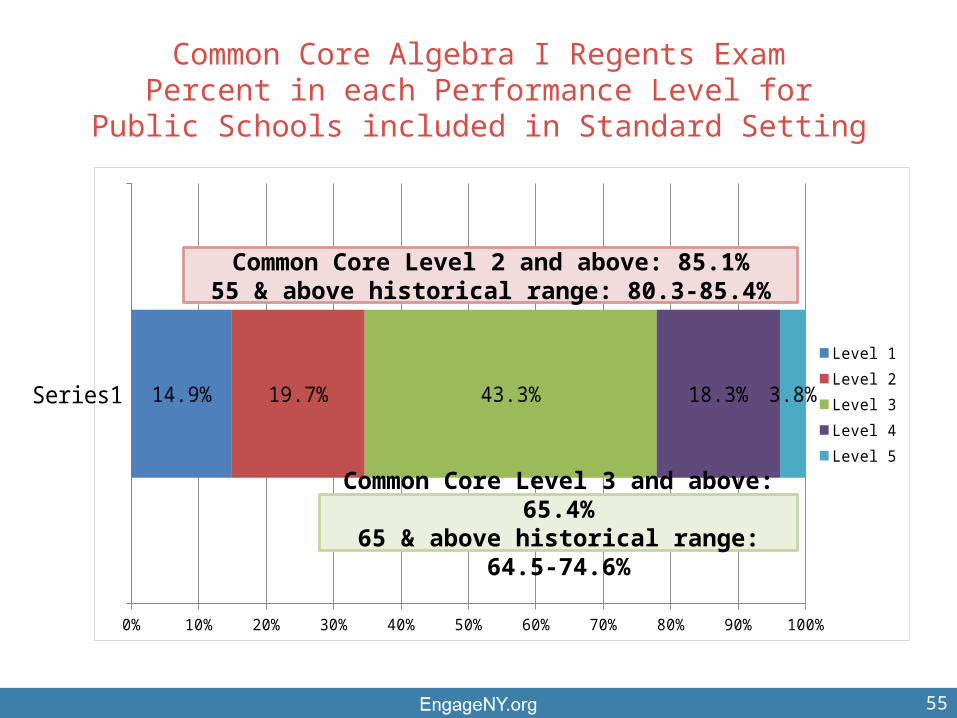
Common Core Algebra I Regents ExamPercent in each Performance Level for
Public Schools included in Standard Setting
Se-ries
1
0% 10% 20% 30% 40% 50% 60% 70% 80% 90% 100%
14.9% 19.7% 43.3% 18.3% 3.8%Level 1Level 2Level 3Level 4Level 5
Common Core Level 2 and above: 85.1%55 & above historical range: 80.3-85.4%
Common Core Level 3 and above: 65.4%65 & above historical range: 64.5-74.6%
55

Common Core Algebra I Regents ExamPercent in each Performance Level for
Public Schools included in Standard Setting(2008-13 Historical Medians & Ranges
Displayed in Red)
Level 1 Level 2 Level 3 Level 4 Level 50
5
10
15
20
25
30
35
40
45
50
14.9 19.7 43.3 18.3 3.8
17.215.1
37.5
15.3 15.2
2014:
Prior to 2014: (0-54) (55-64) (65-79) (80-84) (85-100) 56
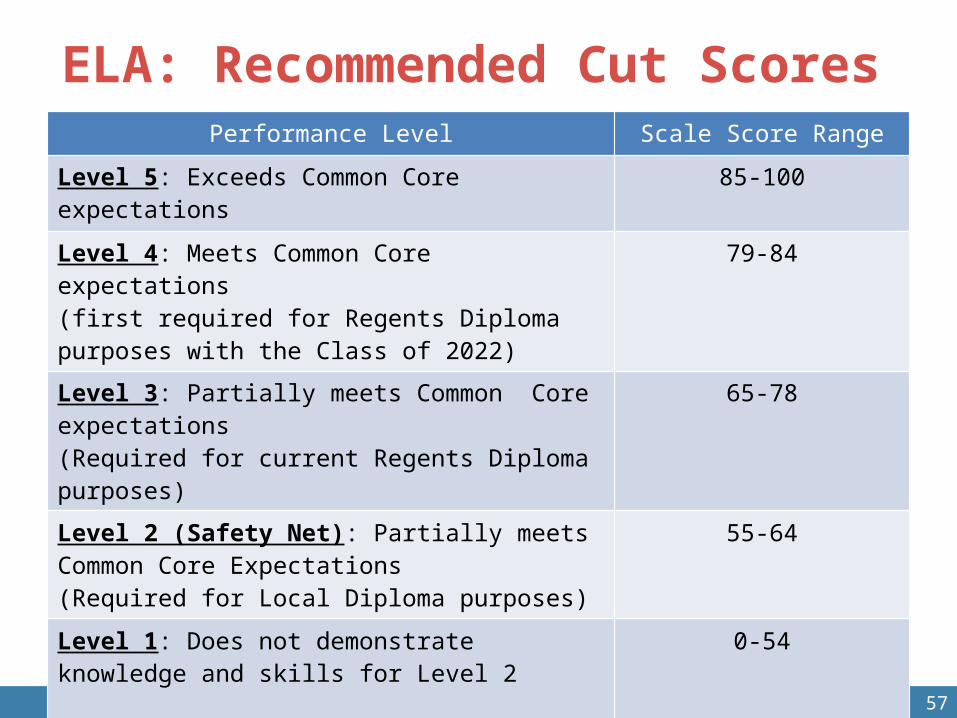
ELA: Recommended Cut Scores
EngageNY.org 57
Performance Level Scale Score Range
Level 5: Exceeds Common Core expectations 85-100
Level 4: Meets Common Core expectations (first required for Regents Diploma purposes with the Class of 2022)
79-84
Level 3: Partially meets Common Core expectations (Required for current Regents Diploma purposes)
65-78
Level 2 (Safety Net): Partially meets Common Core Expectations (Required for Local Diploma purposes)
55-64
Level 1: Does not demonstrate knowledge and skills for Level 2
0-54
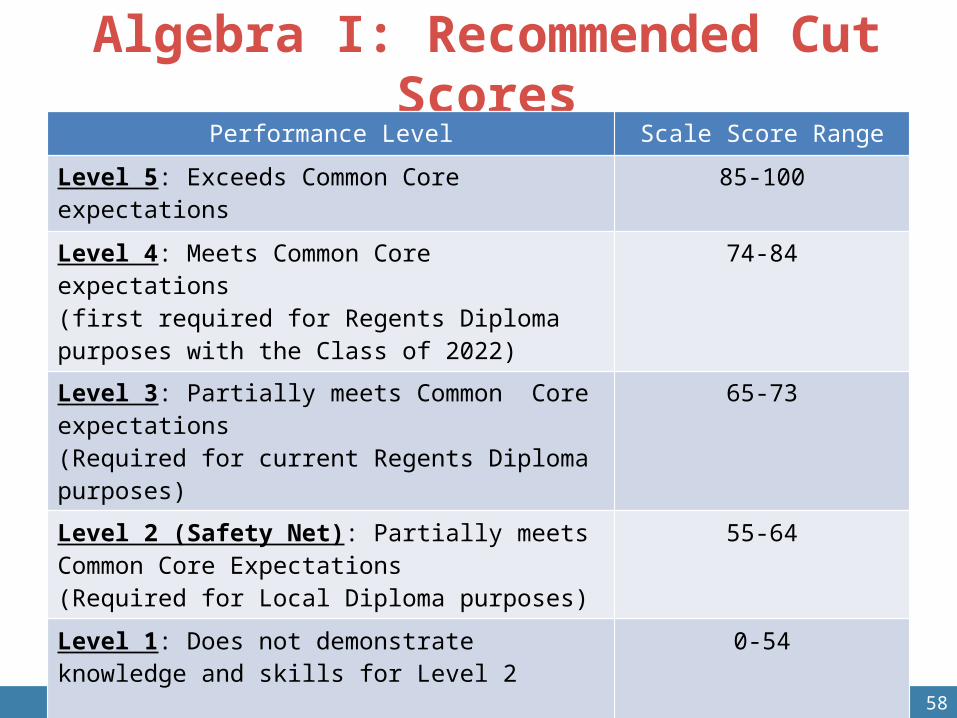
Algebra I: Recommended Cut Scores
EngageNY.org 58
Performance Level Scale Score Range
Level 5: Exceeds Common Core expectations 85-100
Level 4: Meets Common Core expectations (first required for Regents Diploma purposes with the Class of 2022)
74-84
Level 3: Partially meets Common Core expectations (Required for current Regents Diploma purposes)
65-73
Level 2 (Safety Net): Partially meets Common Core Expectations (Required for Local Diploma purposes)
55-64
Level 1: Does not demonstrate knowledge and skills for Level 2
0-54
EngageNY.org
Setting Performance Standards: Common Core
Regents Exams in Algebra I and ELA
NTI
July, 2014


