61
CONDITIONS OF WORK AND EMPLOYMENT SERIES No. 35 TRAVAIL Why have wage shares fallen? A panel analysis of the determinants of functional income distribution Engelbert Stockhammer
| Date post: | 15-Apr-2018 |
| Category: |
Documents |
| Upload: | vuonghuong |
| View: | 216 times |
| Download: | 1 times |
Conditions of Work and employment series no. 35
TRAVAIL
For information on the Conditions of Work and Employment Branch,please contact:
Phone: (+41 22) 799 67 54Fax: (+41 22) 799 84 51
International Labour Office,Conditions of Work and Employment Branch
4, route des MorillonsCH-1211 Geneva 22
Switzerland
www.ilo.org/travail
Why have wage shares fallen?A panel analysis of the determinants of functional income distribution
Engelbert Stockhammer
ISSN 2226-8944
INTERNATIONAL LABOUR OFFICE – GENEVA
Conditions of Work and Employment Series No. 35
Conditions of Work and Employment Branch
Why have wage shares fallen? A panel analysis of the determinants of functional income distribution
Engelbert Stockhammer Kingston University, UK

Copyright © International Labour Organization 2013 Publications of the International Labour Office enjoy copyright under Protocol 2 of the Universal Copyright Convention. Nevertheless, short excerpts from them may be reproduced without authorization, on condition that the source is indicated. For rights of reproduction or translation, application should be made to the Publications Bureau (Rights and Permissions), International Labour Office, CH-1211 Geneva 22, Switzerland. The International Labour Office welcomes such applications.
Libraries, institutions and other users registered in the United Kingdom with the Copyright Licensing Agency, 90 Tottenham Court Road, London W1T 4LP [Fax: (+44) (0)20 7631 5500; email: [email protected]], in the United States with the Copyright Clearance Center, 222 Rosewood Drive, Danvers, MA 01923 [Fax: (+1) (978) 750 4470; email: [email protected]] or in other countries with associated Reproduction Rights Organizations, may make photocopies in accordance with the licences issued to them for this purpose. ILO Cataloguing in Publication Data Stockhammer, Engelbert Why have wage shares fallen?: A panel analysis of the determinants of functional income distribution : for the International Labour Organisation (ILO) project "New Perspectives on Wages and Economic Growth" / Engelbert Stockhammer ; International Labour Office, Conditions of Work and Employment Branch. - Geneva: ILO, 2012
Conditions of work and employment series; No.35; ISSN 2226-8944 ; 2226-8952 (web pdf) International Labour Office; Conditions of Work and Employment Branch income distribution / wages / data collecting / methodology / developed countries / developing countries 03.03.1
The designations employed in ILO publications, which are in conformity with United Nations practice, and the presentation of material therein do not imply the expression of any opinion whatsoever on the part of the International Labour Office concerning the legal status of any country, area or territory or of its authorities, or concerning the delimitation of its frontiers.
The responsibility for opinions expressed in signed articles, studies and other contributions rests solely with their authors, and publication does not constitute an endorsement by the International Labour Office of the opinions expressed in them.
Reference to names of firms and commercial products and processes does not imply their endorsement by the International Labour Office,and any failure to mention a particular firm, commercial product or process is not a sign of disapproval. ILO publications can be obtained through major booksellers or ILO local offices in many countries, or direct from ILO Publications, International Labour Office, CH-1211 Geneva 22, Switzerland. Catalogues or lists of new publications are available free of charge from theabove address, or by email: [email protected] Visit our website: www.ilo.org/publns
Printed by the International Labour Office, Geneva, Switzerland
Conditions of Work and Employment Series No. 35 iii
Contents
Page
Preface .............................................................................................................................................................. v
Abstract ........................................................................................................................................................... vi
Acknowledgements ........................................................................................................................................ vii
Executive summary ...................................................................................................................................... viii
1 Introduction ...................................................................................................................................................... 1
2 Determinants of functional income distribution: key arguments in the recent debate ................................... 5
2.1 Technological change ........................................................................................................................... 5
2.2 Globalisation ......................................................................................................................................... 6
2.3 Financialisation ..................................................................................................................................... 7
2.4 Welfare state retrenchment and the bargaining power of labour ........................................................ 8
2.5 A missing factor: bargaining power and market power of firms ........................................................ 9
2.6 Conclusion: a simple distribution equation ......................................................................................... 9
3 The recent empirical (panel) literature on the determinants of functional income distribution .................. 12
3.1 Studies on the determinants of the wage share in OECD countries .................................................. 12
3.2 Studies on determinants of the wage share in advanced and developing countries ......................... 16
3.3 Other related studies ........................................................................................................................... 16
3.4 Some comments on the literature ....................................................................................................... 18
4 Variable definitions, data sources, and econometric methodology .............................................................. 19
4.1 Variable definitions and data sources ................................................................................................ 19
4.2 Some stylized facts on the core explanatory variables ...................................................................... 21
4.2.1 Developing economies ............................................................................................................ 21
4.2.2 Advanced economies .............................................................................................................. 22
4.3 Econometric method ........................................................................................................................... 23
5 Results for developing and advanced countries ............................................................................................ 25
5.1 Estimation equation for sample with all countries ............................................................................ 25
5.2 Results for the baseline specification and variations ......................................................................... 25
5.3 Results by income group .................................................................................................................... 27
5.4 Results by estimation method ............................................................................................................ 28
5.5 Results with different wage share variables ...................................................................................... 29
5.6 Results with financial reform variables ............................................................................................. 30
5.7 Results with labour market institutions variables .............................................................................. 31
5.8 Contributions to changes in the wage share....................................................................................... 32
5.9 Conclusion .......................................................................................................................................... 33
6 Results for advanced economies .................................................................................................................... 35
6.1 Estimation equation for sample with advanced economies ............................................................... 35
6.2 Results for the baseline specification and different estimation methods .......................................... 35
iv Conditions of Work and Employment Series No. 35
6.3 Results for labour market institutions variables ................................................................................ 36
6.4 Results for financial reform variables ................................................................................................ 38
6.5 Results for technological change variables ........................................................................................ 39
6.6 Results for globalisation variables ..................................................................................................... 40
6.7 Contributions to the change in the wage share in advanced countries .............................................. 41
7 Conclusion...................................................................................................................................................... 43
References.................................................................................................................................................................. 44
Datasets ...................................................................................................................................................................... 49
Conditions of Work and Employment Series ........................................................................................................... 51
List of boxes, charts, figures and tables
Figure 1. Adjusted wage shares in advanced countries, Germany, the USA and Japan, 1970-2010 1
Figure 2. Adjusted wage share in developing countries 3
Figure 3. Key determinants of functional income distribution 10
Figure 4. Baseline explanatory variables for developing countries 22
Figure 5. Baseline explanatory variables for advanced countries 23
Figure 6. Contributions to the change in the wage share for all countries, 1990/94 to 2000/04 32
Figure 7. Contribution to change in the wage share for developing countries, 1990/94 to 2000/04 33
Figure 8. Contributions to the change in the wage share for all countries, 1990/94-2000/04, by estimation method 33
Figure 9. Contributions to the change in the wage share for advanced countries, 1980/84 -2000/4 42
Figure 10. Contributions to the change in the wage share for advanced countries, 1980/84 -2000/04, by estimation method 42
Table 1. Explanatory variables in the baseline specification for all countries and for advanced countries 11
Table 2. Overview empirical literature 13
Table 3. Results for the baseline specification and variations 26
Table 4. Results by income group 27
Table 5. Results by estimation method 28
Table 6. Results with different wage share variables (all countries) 29
Table 7. Results with different wage share variables (developing countries) 29
Table 8. Results with financial reform variables 30
Table 9. Results with labour market institutions variables 31
Table 10. Results for baseline specification and different estimation methods – advanced countries 36
Table 11. Results with labour market institutions variables (Aleksynska and Schindler dataset), advanced countries 37
Table 12. Results with labour market institutions variables (Bassanini and Duval dataset), advanced countries 38
Table 13. Results with financial reform variables, advanced countries 39
Table 14. Results with technological change variables, advanced countries 40
Table 15. Results with globalisation variables, advanced countries 41
Conditions of Work and Employment Series No. 35 v
Preface
The Conditions of Work and Employment Research Series is aimed at presenting the findings of policy-oriented research in the area of working conditions from multidisciplinary perspectives such as laws, economics, statistics, sociology and industrial relations.
Decent work concerns both the quantity and quality of employment, and indeed, the conditions of work and employment have great impacts on workers’ well-being and enterprise performance. In recent years, conditions of work and employment have changed significantly in many countries, both advanced and developing, part due to globalization, technological changes, and regulatory shifts. At the same time there has been a growing recognition that improving the quality of work is also an important policy goal. Yet the challenge of what kinds of concrete policy actions need to be developed to improve the every-day reality for workers remains. With this challenge in mind, the Conditions of Work and Employment Series is intended to offer new ideas and insights on improving working conditions. It is also meant to stimulate debates among governments and social partners concerning how to better design and implement policies with the aim of ensuring decent working conditions for all workers.
ILO’s Conditions of Work and Employment Branch (http://www.ilo.org/travail) is devoted to developing knowledge and policies and to providing technical assistance in the area of working conditions such as wages, working time, work organization, maternity protection and arrangements to ensure an adequate work-life balance.
Philippe Marcadent Chief
Conditions of Work and Employment Branch Labour Protection Department
Social Protection Sector
vi Conditions of Work and Employment Series No. 35
Abstract
Wage shares have fallen substantially over the past 25 years. This is part of a trend towards increasing inequality. In the OECD countries the (adjusted) wage share declined by almost ten percentage points. While the development of income distribution in developing countries is more heterogeneous, wage shares have, on average, also declined there and personal income distribution has become more unequal. As a consequence, there has been a renewed interest in the determinants of functional income distribution. There are a number of empirical studies on the determinants of the wage share in OECD countries (IMF 2007a, EC 2007), but few studies on developing countries (Jayadev 2007, ILO 2011). This study uses a new ILO/IILS dataset on adjusted wage shares for a large group of developing and advanced economies to explain changes in wage shares and assess the relative contributions of technological change, financialisation, globalisation and welfare state retrenchment. We find strong negative effects of financialisation as well as negative effects of welfare state retrenchment and globalisation. Technological change has had a positive impact on wage shares in developing economies, but a (modestly) negative one in advanced economies. We find that globalisation (in production) has robust negative effects, even in developing economies.
Conditions of Work and Employment Series No. 35 vii
Acknowledgements
The author is grateful to Hubert Kohler for excellent research assistance and to Matthieu Charpe, Vince Daly, Marc Lavoie, Özlem Onaran, Simon Mohun, and Antonella Stirati for helpful comments and suggestions. Earlier versions of this paper were presented at the Regulating for Decent Work conference, ILO, Geneva and at Kingston University. All mistakes are, however, the author’s.
viii Conditions of Work and Employment Series No. 35
Executive summary
Functional income distribution has changed substantially in the course of the last three decades. Wage shares have declined in all OECD countries. This is part of a broader trend towards greater social inequality. While the picture is somewhat less homogenous in developing and emerging economies, it is clear that in most of these countries wage shares have also declined. This study investigates the relative impact of financialisation, globalisation, welfare state retrenchment and technological change on functional income distribution. This is done with an (unbalanced) panel analysis covering up to 71 countries (28 advanced and 43 developing and emerging economies) from 1970 to 2007.
Our results indicate that financialisation has been the main cause of the decline in the wage share. Globalisation and welfare state retrenchment have also had substantial negative effects. Notably, we find that globalisation has had negative effects on income distribution in developing as well as in advanced economies, which contradicts the Stolper-Samuelson theorem. Technological (and structural) change has had positive effects in developing countries.
We also present further results for advanced economies where data availability is better. This confirms our findings for the larger country group. Financialisation emerges as the single most important cause for the decline in the wage share. Welfare state retrenchment and globalisation have had negative effects on the wage share. For advanced economies we also find modest negative effects of technological change on the wage share.
The results of this study clearly refute two widely held views about income distribution. First, the view that changes in income distribution in advanced economies have mainly been driven by technological change. This is not correct. While technological change has had a negative effect on wage shares in developed economies, this effect is smaller than that of other factors and it is less robust. Second, the Stolper-Samuelson prediction that globalisation would benefit workers in developing and emerging economies does not hold. We fail to find statistically different effects in advanced and developing economies and we find an overall negative contribution of globalisation on wage shares in developing economies. The Stolper-Samuelson theorem does not hold empirically for the past thirty years.
These findings have important implications for economic and social policy. They suggest that income distribution is not primarily determined by technological progress, but rather depends on social institutions and on the structure of the financial system. Strengthening the welfare state, in particular changing union legislation to foster collective bargaining, and financial regulation could help increase the wage share with little if any osts in terms of economic efficiency.
Conditions of Work and Employment Series No. 35 1
1 Introduction
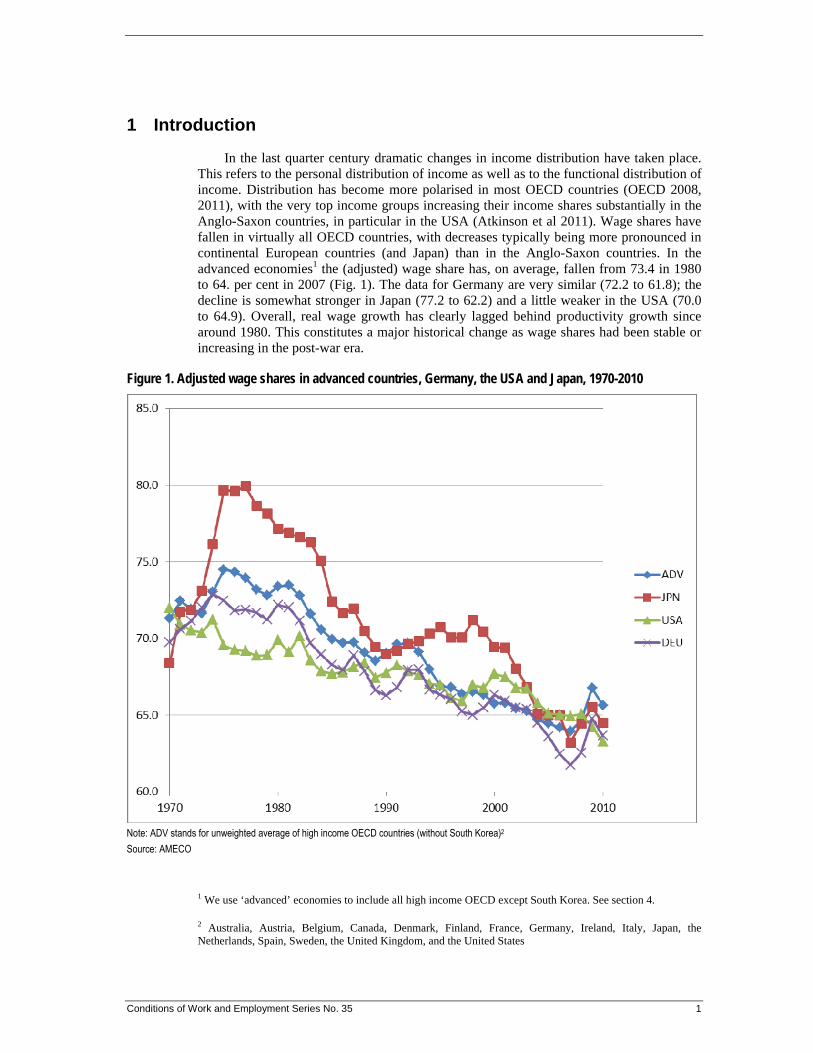
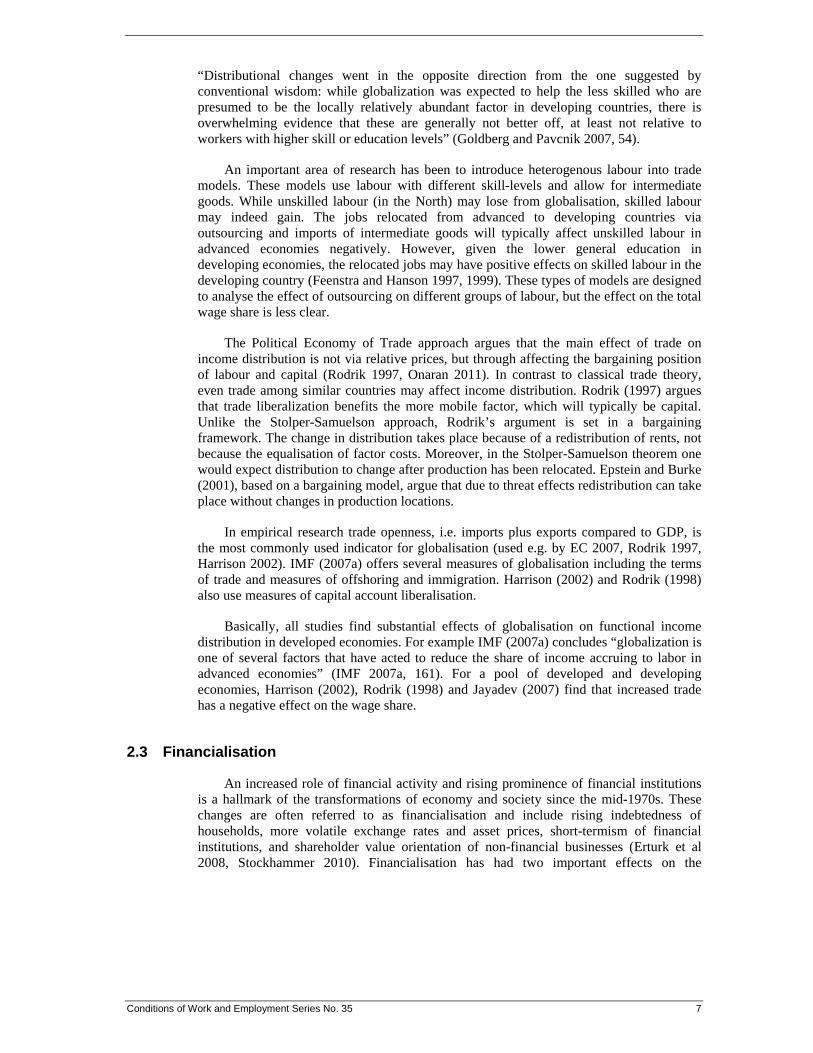
In the last quarter century dramatic changes in income distribution have taken place. This refers to the personal distribution of income as well as to the functional distribution of income. Distribution has become more polarised in most OECD countries (OECD 2008, 2011), with the very top income groups increasing their income shares substantially in the Anglo-Saxon countries, in particular in the USA (Atkinson et al 2011). Wage shares have fallen in virtually all OECD countries, with decreases typically being more pronounced in continental European countries (and Japan) than in the Anglo-Saxon countries. In the advanced economies1 the (adjusted) wage share has, on average, fallen from 73.4 in 1980 to 64. per cent in 2007 (Fig. 1). The data for Germany are very similar (72.2 to 61.8); the decline is somewhat stronger in Japan (77.2 to 62.2) and a little weaker in the USA (70.0 to 64.9). Overall, real wage growth has clearly lagged behind productivity growth since around 1980. This constitutes a major historical change as wage shares had been stable or increasing in the post-war era.
Figure 1. Adjusted wage shares in advanced countries, Germany, the USA and Japan, 1970-2010
Note: ADV stands for unweighted average of high income OECD countries (without South Korea)2
Source: AMECO
1 We use ‘advanced’ economies to include all high income OECD except South Korea. See section 4.
2 Australia, Austria, Belgium, Canada, Denmark, Finland, France, Germany, Ireland, Italy, Japan, the Netherlands, Spain, Sweden, the United Kingdom, and the United States

2 Conditions of Work and Employment Series No. 35
This shift in income distribution has taken somewhat different forms in different countries. In the Anglo-Saxon countries a sharp polarisation of personal income distribution has occurred, combined with a modest decline in the wage share. In particular top incomes (usually measured as the income share of the top 10 per cent, 5 per cent or 1per cent of the income distribution) have increased their income share dramatically (Piketty und Saez 2003, OECD 2008, Atkinson et al 2011). In the USA for example, the top 1per cent of the income distribution increased their share of national income by more than 10 percentage points. In continental European countries functional rather than personal income distribution has shifted dramatically. In the Euro area, wage shares have decreased by around 10 percentage points of GDP (Stockhammer 2009), but personal distribution has remained comparably stable and often has not changed in the same way as in the USA (OECD 2008, 2011). For example, in Germany personal income distribution was stable until the mid-1990s and thereafter the bottom of the distribution lost ground; in France personal income distribution among wage earners has become more equal. While these developments appear rather different at first sight, they share the common trend that the share of non-managerial wage earners in national income has decreased sharply. The increase in inequality in the USA is, to a significant extent, driven by changes in the remuneration of top managers, whose salaries and bonuses are counted as labour compensation, i.e. wages, in the National Accounts.3 If they were counted, in the spirit of 19th century Political Economy, as part of profits, trends in the USA and in continental Europe would look rather similar.
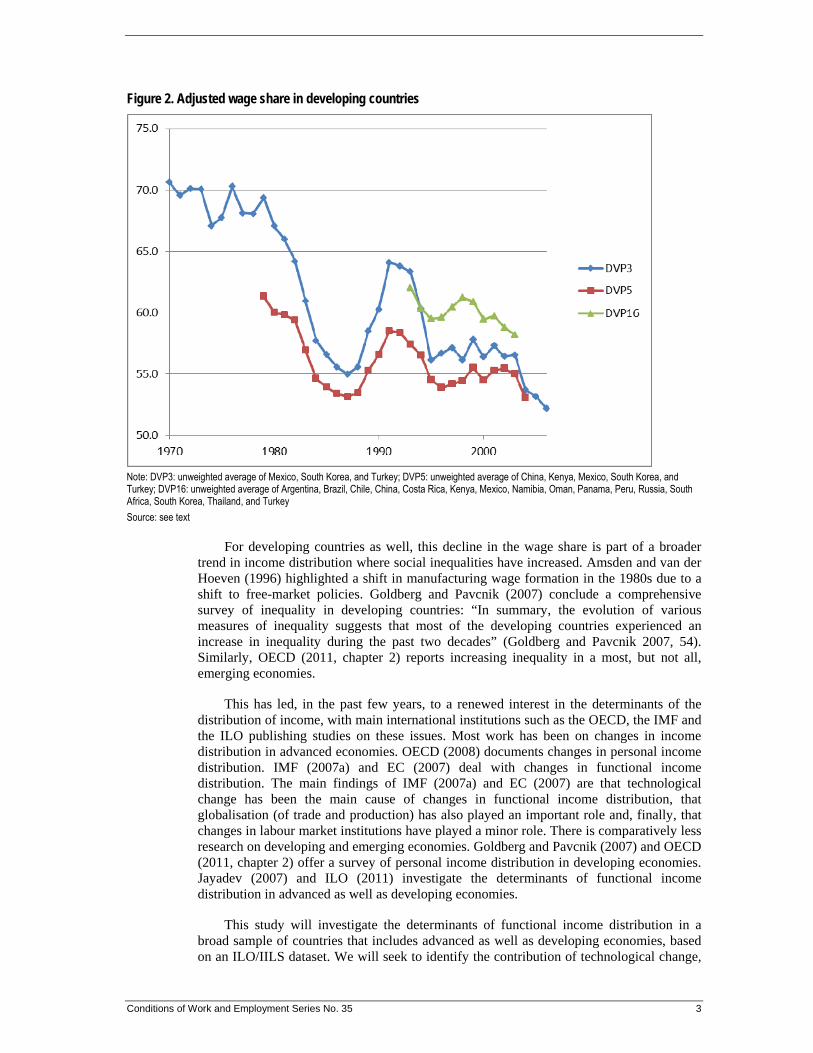
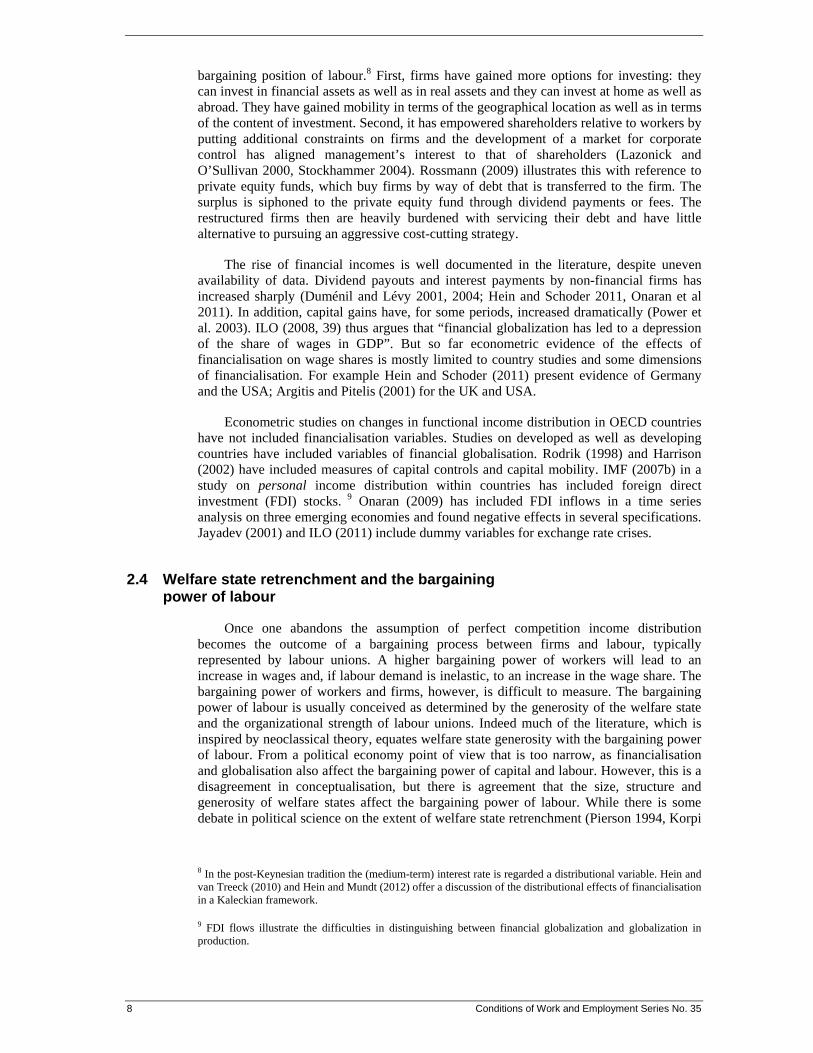
Data on the functional income distribution is not readily available for developing economies4 and where available they are typically less reliable. Figure 2 gives summary measures of the adjusted wage share for the groups of developing countries where comparatively long series are available. DVP3 summarizes the data for three countries where data are available since 1970; DVP5 for five countries where data are available from 1979; and DVP16 for a group of sixteen developing countries, where data are available from 1993. They all show a pronounced decline in (adjusted) wage shares since 1990. While there is more variation in terms of the development of the wage share in developing economies than in advanced economies,5 it is clear that on average there has been a pronounced decline in the wage share in developing and emerging economies, at least since 1990.
3 Mohun (2006) calculates adjusted profit shares based on the distinction between supervisory and non-supervisory workers. This shows a much sharper increase in profit shares than the raw data. However, availability of data only allows to perform these adjustments for the USA.
4 We use the term ‘developing countries’ as short hand for developing and emerging countries and include all countries that are not classified as high income countries by the World Bank. We include South Korea in this group as it has been a developing countries for much of the sample period and we cannot include it in our advanced country for econometric analysis because of data availability.
5 Among developing countries with at least ten years of adjusted wage share data there are 14 countries (Argentina, Botswana, Brazil, Bulgaria, China, Cote d'Ivoire, Mexico, Namibia, Oman, Panama, South Africa, South Korea, Thailand, Turkey) with declining wage share, three (Mauritius, Russia, Sri Lanka) with broadly stable wage shares and seven (Belarus, Chile, Colombia, Costa Rica, Hong Kong, Kenya, Peru) with increasing wage shares.
Conditions of Work and Employment Series No. 35 3
Figure 2. Adjusted wage share in developing countries
Note: DVP3: unweighted average of Mexico, South Korea, and Turkey; DVP5: unweighted average of China, Kenya, Mexico, South Korea, and Turkey; DVP16: unweighted average of Argentina, Brazil, Chile, China, Costa Rica, Kenya, Mexico, Namibia, Oman, Panama, Peru, Russia, South Africa, South Korea, Thailand, and Turkey
Source: see text
For developing countries as well, this decline in the wage share is part of a broader trend in income distribution where social inequalities have increased. Amsden and van der Hoeven (1996) highlighted a shift in manufacturing wage formation in the 1980s due to a shift to free-market policies. Goldberg and Pavcnik (2007) conclude a comprehensive survey of inequality in developing countries: “In summary, the evolution of various measures of inequality suggests that most of the developing countries experienced an increase in inequality during the past two decades” (Goldberg and Pavcnik 2007, 54). Similarly, OECD (2011, chapter 2) reports increasing inequality in a most, but not all, emerging economies.
This has led, in the past few years, to a renewed interest in the determinants of the distribution of income, with main international institutions such as the OECD, the IMF and the ILO publishing studies on these issues. Most work has been on changes in income distribution in advanced economies. OECD (2008) documents changes in personal income distribution. IMF (2007a) and EC (2007) deal with changes in functional income distribution. The main findings of IMF (2007a) and EC (2007) are that technological change has been the main cause of changes in functional income distribution, that globalisation (of trade and production) has also played an important role and, finally, that changes in labour market institutions have played a minor role. There is comparatively less research on developing and emerging economies. Goldberg and Pavcnik (2007) and OECD (2011, chapter 2) offer a survey of personal income distribution in developing economies. Jayadev (2007) and ILO (2011) investigate the determinants of functional income distribution in advanced as well as developing economies.
This study will investigate the determinants of functional income distribution in a broad sample of countries that includes advanced as well as developing economies, based on an ILO/IILS dataset. We will seek to identify the contribution of technological change,
4 Conditions of Work and Employment Series No. 35
globalisation, financial globalisation, and welfare state retrenchment. This is done with an (unbalanced) panel analysis covering up to 71 countries (28 advanced and 43 developing and emerging economies) from 1970 to 2007.
The paper is structured as follows. Section 2 presents the key arguments that have been identified in the literature as potential determinants of functional income distribution. Section 3 offers a review of the recent empirical literature on the issue (that uses panel analysis). Section 4 discusses data issues. Section 5 presents the empirical results for the full group of countries. Section 6 presents results for OECD economies using a richer set of variables. Section 7 concludes.
Conditions of Work and Employment Series No. 35 5
2 Determinants of functional income distribution: key arguments in the recent debate
The issue of increasing inequality has received a lot of attention recently, but unevenly. The larger part of the literature has been concerned with changes in personal income distribution. There have been debates on the development of earnings inequality and, in particular of the skill premium and of top incomes. Functional income distribution has received comparably less attention. However, very recently there have been several attempts to study the determinants of functional income distribution for advanced economies, but there are only few studies on functional income distribution in developing economies. The studies that investigate functional income distribution, taking into account variations across countries and over time, will be subject of the next section. This section will, more broadly, provide the theoretical background for the empirical analysis by summarizing the key arguments in the debate on income distribution, highlighting skill-biased technological change, globalisation, financialisation and welfare state retrenchment.
2.1 Technological change
In a world of complete markets, perfect competition, full employment and well behaved aggregate production functions, income shares are determined by technology. This is the core of the neoclassical theory of income distribution. However, none of these assumptions is likely to hold in the real world. Nonetheless, the basic neoclassical argument still carries a lot of weight in the present debate and many economists think of income distribution to be primarily determined by changes in technology. The presently popular incarnation of this argument is that since the early 1980s technological change has been skill biased. New capital goods, in particular those related to information and communication technology (ICT) are complementary to skilled labour and substitute unskilled labour. Thus, there has been a shift in income distribution towards skilled labour. This hypothesis has motivated a substantial number of empirical studies, in particular for the USA, where it was used to explain the sharp increase in personal income inequality (Autor et al 1999, Card and Di Nardo 2002).
Technological change is also used to explain changes in functional income distribution. Technological change, according to this story, has become capital augmenting rather than labour augmenting (which it used to be in the postwar era). Consequently, wage shares have fallen (IMF 2007a, EC 2007). As the use of ICT capital increased, the demand for high-skilled labour increased and that of low-skilled labour decreased, which came with rising wages for high-skilled workers and falling wages for low-skilled workers. It so happens that the wage share overall is falling.
Empirically, technological change has been proxied by time trends (Ellis and Smith 2007, Guscina 2006), 6 capital-labour ratios and ICT capital or combinations of these (Bentolila and Saint-Paul 2003, IMF 2007a and EC 2007).7 The use of ICT capital (or ICT
6 A time trend will only convince a believer of the effect of technological change: as we know that wage shares have a declining trend, it is hardly surprising that time trends do have an effect on the wage share.
7 However, while common in the literature, it is not straightforward to interpret the capital-labor ratio as a technologically determined variable. The argument presumes that the capital stock has changed because of changes in available technology or because of a change in relative prices of capital and labor. From a Keynesian point of view, the capital stock is the outcome of investment decisions driven by animal spirits. The

6 Conditions of Work and Employment Series No. 35
services) is a less ambiguous proxy for technological change as it reflects implemented technological change independent of the motives of its implementation.
The literature often reports strong effects of technological change on income distribution in advanced economies. For example IMF (2007a) finds that technological change has been the most important cause for the decline in wage shares. EC (2007) concludes that ”for the period for which the data is available (i.e. from the mid-1980s to early 2000s), the estimation results clearly indicate that technological progress made the largest contribution to the fall in the aggregate labour income share” (EC 2007, 260).
While there has been some effort to develop measures of technological change for advanced economies, in the context of developing economies GDP per capita is usually used as a proxy. In addition, variables measuring structural change such as the agricultural share have been used. While these were found to have a significant effect, it is fair to say that these variables have been used as control variable, with little genuine attention paid to their impact.
2.2 Globalisation
The role of globalisation features prominently in political debates as well as in economic analysis. There are two approaches in the literature, both of which come with many variations. Classical trade theory is built on the Stolper and Samuelson (1941) theorem, which states that the abundant factor will gain from international trade. For advanced countries this is capital whereas labour is abundant in developing countries such as China and India that have recently entered the global economy. Globalisation is thus supposed to benefit capital in the advanced and labour in the developing economies. The Political Economy approach to international trade highlights the changes in the bargaining position of labour and capital due to their relative mobility. According to this approach, labour can lose in the North as well as in the South.
The Stolper-Samuelson theorem assumes full employment and that neither capital nor labour is mobile. However, the recent period of globalisation has been marked by an increase in capital mobility. But “if capital can travel across borders, the implications of the theorem weaken substantially” (EC 2007, 45). It is therefore not clear whether the Stolper-Samuleson approach is a good guide to the present experience of globalisation. Moreover, there are well known problems of classical trade theory. On the theoretical level it does not allow for unemployment, which, rightly or wrongly, is at odds with popular perceptions of jobs being exported abroad. On the empirical level, the theory is unable to explain the actual pattern of international trade, which takes place mostly among developed countries rather than between rich and poor countries (as the theory would predict).
Despite these limitations the Stolper-Samuelson Theorem has a firm place in the mainstream economics canon and it is widely used to argue that globalisation will hurt workers in the developed economies and benefit workers in developing economies. While this may have become folk wisdom among economists, the evidence on this is thin. While workers in the North have been hurt, it is doubtful whether workers in the South have benefited. There is limited research on the effect of globalisation on functional income distribution in the South (more on this later), but there is a substantial body of evidence that inequality has increased in developing economies because of globalisation.
capital-labor ratio will thus not be caused by a change in technology, but by a change of investor sentiment. It will, however, embody technological change as entrepreneurs will typically use the latest technology available. Thus it is not a priori clear whether the changes in the capital-labor ratio can be interpreted as a proxy for (autonomous) changes in technology.
Conditions of Work and Employment Series No. 35 7
“Distributional changes went in the opposite direction from the one suggested by conventional wisdom: while globalization was expected to help the less skilled who are presumed to be the locally relatively abundant factor in developing countries, there is overwhelming evidence that these are generally not better off, at least not relative to workers with higher skill or education levels” (Goldberg and Pavcnik 2007, 54).
An important area of research has been to introduce heterogenous labour into trade models. These models use labour with different skill-levels and allow for intermediate goods. While unskilled labour (in the North) may lose from globalisation, skilled labour may indeed gain. The jobs relocated from advanced to developing countries via outsourcing and imports of intermediate goods will typically affect unskilled labour in advanced economies negatively. However, given the lower general education in developing economies, the relocated jobs may have positive effects on skilled labour in the developing country (Feenstra and Hanson 1997, 1999). These types of models are designed to analyse the effect of outsourcing on different groups of labour, but the effect on the total wage share is less clear.
The Political Economy of Trade approach argues that the main effect of trade on income distribution is not via relative prices, but through affecting the bargaining position of labour and capital (Rodrik 1997, Onaran 2011). In contrast to classical trade theory, even trade among similar countries may affect income distribution. Rodrik (1997) argues that trade liberalization benefits the more mobile factor, which will typically be capital. Unlike the Stolper-Samuelson approach, Rodrik’s argument is set in a bargaining framework. The change in distribution takes place because of a redistribution of rents, not because the equalisation of factor costs. Moreover, in the Stolper-Samuelson theorem one would expect distribution to change after production has been relocated. Epstein and Burke (2001), based on a bargaining model, argue that due to threat effects redistribution can take place without changes in production locations.
In empirical research trade openness, i.e. imports plus exports compared to GDP, is the most commonly used indicator for globalisation (used e.g. by EC 2007, Rodrik 1997, Harrison 2002). IMF (2007a) offers several measures of globalisation including the terms of trade and measures of offshoring and immigration. Harrison (2002) and Rodrik (1998) also use measures of capital account liberalisation.
Basically, all studies find substantial effects of globalisation on functional income distribution in developed economies. For example IMF (2007a) concludes “globalization is one of several factors that have acted to reduce the share of income accruing to labor in advanced economies” (IMF 2007a, 161). For a pool of developed and developing economies, Harrison (2002), Rodrik (1998) and Jayadev (2007) find that increased trade has a negative effect on the wage share.
2.3 Financialisation
An increased role of financial activity and rising prominence of financial institutions is a hallmark of the transformations of economy and society since the mid-1970s. These changes are often referred to as financialisation and include rising indebtedness of households, more volatile exchange rates and asset prices, short-termism of financial institutions, and shareholder value orientation of non-financial businesses (Erturk et al 2008, Stockhammer 2010). Financialisation has had two important effects on the
8 Conditions of Work and Employment Series No. 35
bargaining position of labour.8 First, firms have gained more options for investing: they can invest in financial assets as well as in real assets and they can invest at home as well as abroad. They have gained mobility in terms of the geographical location as well as in terms of the content of investment. Second, it has empowered shareholders relative to workers by putting additional constraints on firms and the development of a market for corporate control has aligned management’s interest to that of shareholders (Lazonick and O’Sullivan 2000, Stockhammer 2004). Rossmann (2009) illustrates this with reference to private equity funds, which buy firms by way of debt that is transferred to the firm. The surplus is siphoned to the private equity fund through dividend payments or fees. The restructured firms then are heavily burdened with servicing their debt and have little alternative to pursuing an aggressive cost-cutting strategy.
The rise of financial incomes is well documented in the literature, despite uneven availability of data. Dividend payouts and interest payments by non-financial firms has increased sharply (Duménil and Lévy 2001, 2004; Hein and Schoder 2011, Onaran et al 2011). In addition, capital gains have, for some periods, increased dramatically (Power et al. 2003). ILO (2008, 39) thus argues that “financial globalization has led to a depression of the share of wages in GDP”. But so far econometric evidence of the effects of financialisation on wage shares is mostly limited to country studies and some dimensions of financialisation. For example Hein and Schoder (2011) present evidence of Germany and the USA; Argitis and Pitelis (2001) for the UK and USA.
Econometric studies on changes in functional income distribution in OECD countries have not included financialisation variables. Studies on developed as well as developing countries have included variables of financial globalisation. Rodrik (1998) and Harrison (2002) have included measures of capital controls and capital mobility. IMF (2007b) in a study on personal income distribution within countries has included foreign direct investment (FDI) stocks. 9 Onaran (2009) has included FDI inflows in a time series analysis on three emerging economies and found negative effects in several specifications. Jayadev (2001) and ILO (2011) include dummy variables for exchange rate crises.
2.4 Welfare state retrenchment and the bargaining power of labour
Once one abandons the assumption of perfect competition income distribution becomes the outcome of a bargaining process between firms and labour, typically represented by labour unions. A higher bargaining power of workers will lead to an increase in wages and, if labour demand is inelastic, to an increase in the wage share. The bargaining power of workers and firms, however, is difficult to measure. The bargaining power of labour is usually conceived as determined by the generosity of the welfare state and the organizational strength of labour unions. Indeed much of the literature, which is inspired by neoclassical theory, equates welfare state generosity with the bargaining power of labour. From a political economy point of view that is too narrow, as financialisation and globalisation also affect the bargaining power of capital and labour. However, this is a disagreement in conceptualisation, but there is agreement that the size, structure and generosity of welfare states affect the bargaining power of labour. While there is some debate in political science on the extent of welfare state retrenchment (Pierson 1994, Korpi
8 In the post-Keynesian tradition the (medium-term) interest rate is regarded a distributional variable. Hein and van Treeck (2010) and Hein and Mundt (2012) offer a discussion of the distributional effects of financialisation in a Kaleckian framework.
9 FDI flows illustrate the difficulties in distinguishing between financial globalization and globalization in production.
Conditions of Work and Employment Series No. 35 9
and Palme 2003), there can be little doubt that a reduction in welfare state generosity has occurred since 1980.
For OECD countries recent empirical research tends to identify the bargaining power with labour market institutions (LMI). The background for these variables is a long debate on the determinants of unemployment that has led to the development of databases for LMI that have then also been used in the analysis of income distribution. Conceptually these variables are designed to measure labour market inflexibility rather than genuine bargaining power. IMF (2007a) and EC (2007) include union density, employment protection legislation, unemployment benefit generosity and the tax wedge as wage push variables that may also affect income distribution. Bentolila and Saint–Paul (2003) include only a variable measuring strike activity. EC (2007) and IMF (2007a) find surprisingly small, if any, effects of union density. IMF (2007a) includes union density and the tax wedge after having found no effect of other LMI variables.10 For developing economies, little comparative work exists on welfare state structures. Harrison (2002) and Jayadev (2007) include the government share in GDP.
2.5 A missing factor: bargaining power and market power of firms
The bargaining power, or more narrowly, the market power of firms is a curiously under researched topic. Globalisation ought to have decreased the market power by means of the entrance of new competitors. At the same time it has increased the bargaining power of firms vis-a-vis labour (as discussed above). Things are further complicated by the fact that globalisation is not a change that comes exogenously upon firms, but transnational corporations have been a driving force of globalisation by establishing international production networks (or value chains). However important the issue may be, there exist practically no data that would allow the integration of firms’ bargaining power in a panel setting. This is a serious omission in the literature (and in the present study).
Two studies have tried to analyse some of the dimensions of the power of firms. Azmat, Manning and van Reenen (2007) analyse the bargaining power of firms in network industries. In a sectoral analysis they investigate changes in income distribution in network industries by looking at deregulation measures and find distributional effects. Hutchinson and Persyn (2009) use a Lerner Index to measure concentration of firms on a (2 digit) sectoral basis based on the AMADEUS database for 1991-2005 and find that the concentration has an effect on income distribution. Because of lack of data we are unable to include similar measures in our analysis.
2.6 Conclusion: a simple distribution equation
We estimate a wage share equation that includes variables for technological change (tech), globalisation (glob), financialisation (fin) and welfare state retrenchment (wfst):
),,,( wfstfinglobtechfWS (1)
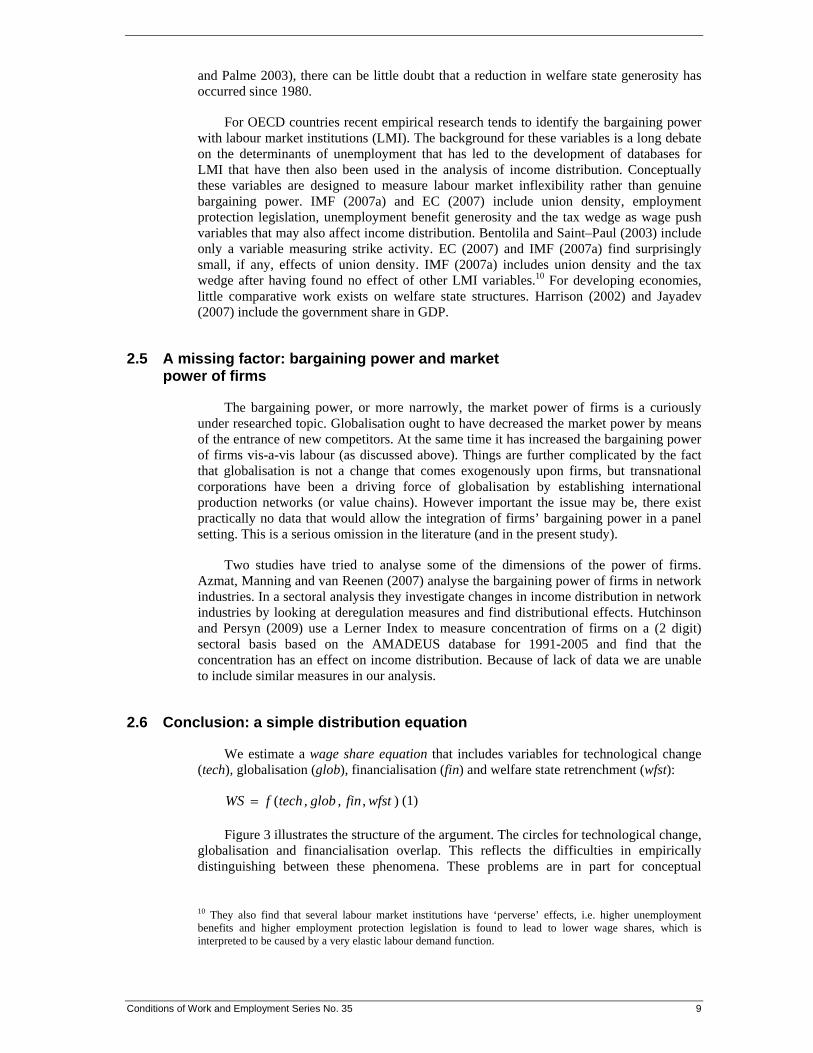
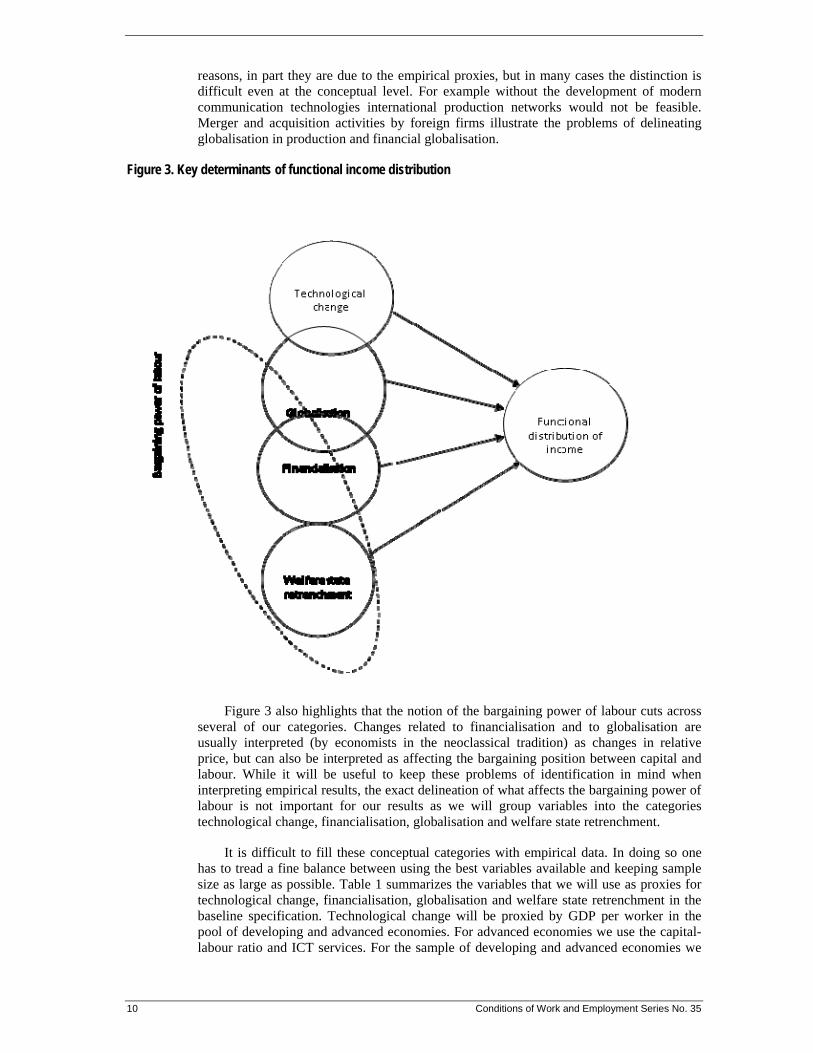
Figure 3 illustrates the structure of the argument. The circles for technological change, globalisation and financialisation overlap. This reflects the difficulties in empirically distinguishing between these phenomena. These problems are in part for conceptual
10 They also find that several labour market institutions have ‘perverse’ effects, i.e. higher unemployment benefits and higher employment protection legislation is found to lead to lower wage shares, which is interpreted to be caused by a very elastic labour demand function.
10 Conditions of Work and Employment Series No. 35
reasons, in part they are due to the empirical proxies, but in many cases the distinction is difficult even at the conceptual level. For example without the development of modern communication technologies international production networks would not be feasible. Merger and acquisition activities by foreign firms illustrate the problems of delineating globalisation in production and financial globalisation.
Figure 3. Key determinants of functional income distribution
Figure 3 also highlights that the notion of the bargaining power of labour cuts across several of our categories. Changes related to financialisation and to globalisation are usually interpreted (by economists in the neoclassical tradition) as changes in relative price, but can also be interpreted as affecting the bargaining position between capital and labour. While it will be useful to keep these problems of identification in mind when interpreting empirical results, the exact delineation of what affects the bargaining power of labour is not important for our results as we will group variables into the categories technological change, financialisation, globalisation and welfare state retrenchment.
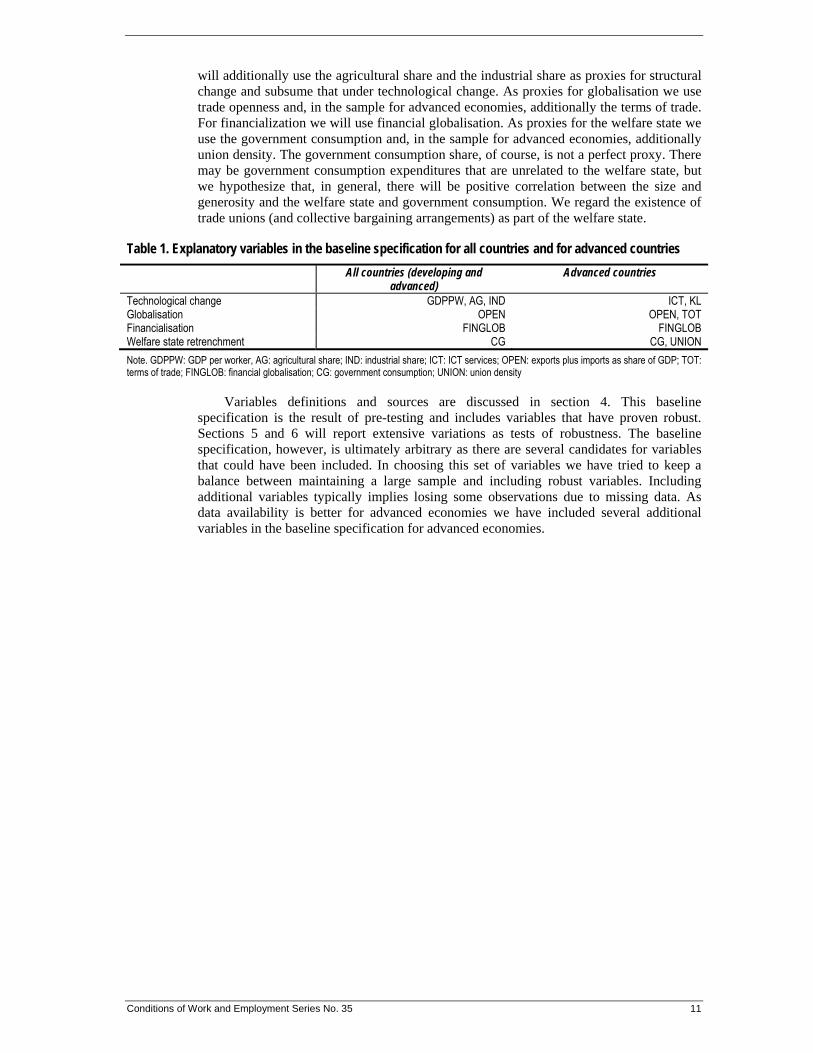
It is difficult to fill these conceptual categories with empirical data. In doing so one has to tread a fine balance between using the best variables available and keeping sample size as large as possible. Table 1 summarizes the variables that we will use as proxies for technological change, financialisation, globalisation and welfare state retrenchment in the baseline specification. Technological change will be proxied by GDP per worker in the pool of developing and advanced economies. For advanced economies we use the capital-labour ratio and ICT services. For the sample of developing and advanced economies we
Conditions of Work and Employment Series No. 35 11
will additionally use the agricultural share and the industrial share as proxies for structural change and subsume that under technological change. As proxies for globalisation we use trade openness and, in the sample for advanced economies, additionally the terms of trade. For financialization we will use financial globalisation. As proxies for the welfare state we use the government consumption and, in the sample for advanced economies, additionally union density. The government consumption share, of course, is not a perfect proxy. There may be government consumption expenditures that are unrelated to the welfare state, but we hypothesize that, in general, there will be positive correlation between the size and generosity and the welfare state and government consumption. We regard the existence of trade unions (and collective bargaining arrangements) as part of the welfare state.
Table 1. Explanatory variables in the baseline specification for all countries and for advanced countries
All countries (developing and advanced)
Advanced countries
Technological change GDPPW, AG, IND ICT, KL Globalisation OPEN OPEN, TOT Financialisation FINGLOB FINGLOB Welfare state retrenchment CG CG, UNION
Note. GDPPW: GDP per worker, AG: agricultural share; IND: industrial share; ICT: ICT services; OPEN: exports plus imports as share of GDP; TOT: terms of trade; FINGLOB: financial globalisation; CG: government consumption; UNION: union density
Variables definitions and sources are discussed in section 4. This baseline specification is the result of pre-testing and includes variables that have proven robust. Sections 5 and 6 will report extensive variations as tests of robustness. The baseline specification, however, is ultimately arbitrary as there are several candidates for variables that could have been included. In choosing this set of variables we have tried to keep a balance between maintaining a large sample and including robust variables. Including additional variables typically implies losing some observations due to missing data. As data availability is better for advanced economies we have included several additional variables in the baseline specification for advanced economies.
12 Conditions of Work and Employment Series No. 35
3 The recent empirical (panel) literature on the determinants of functional income distribution
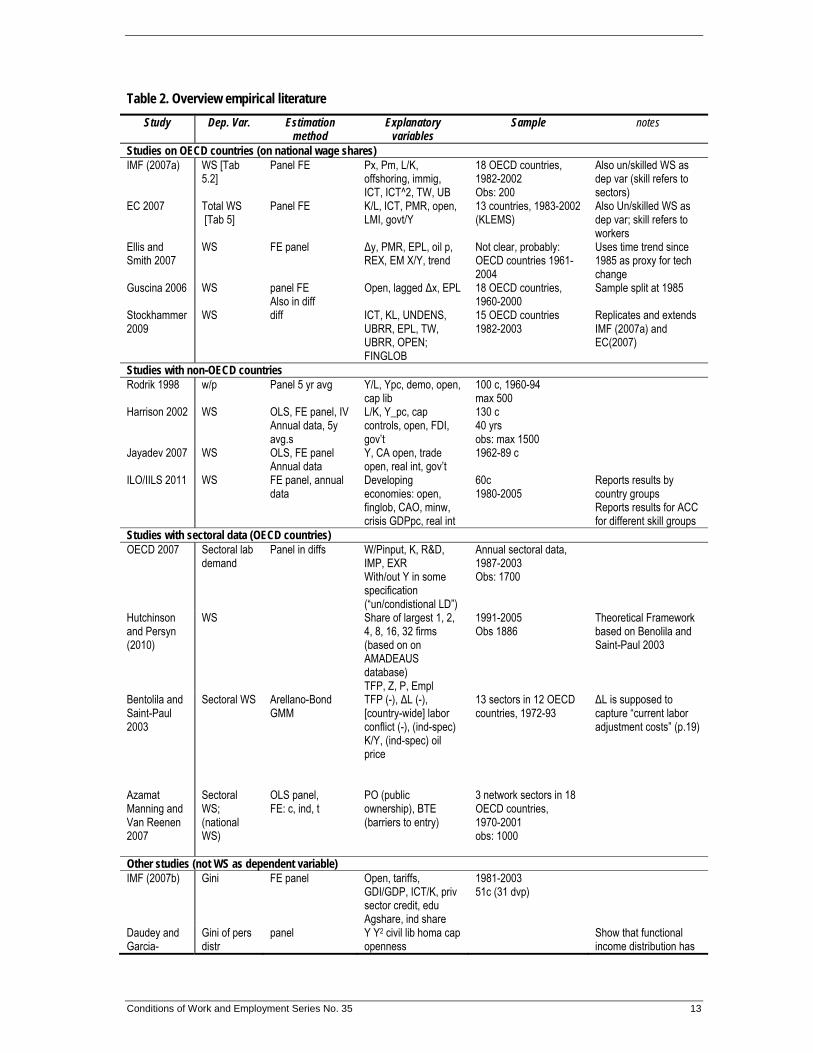
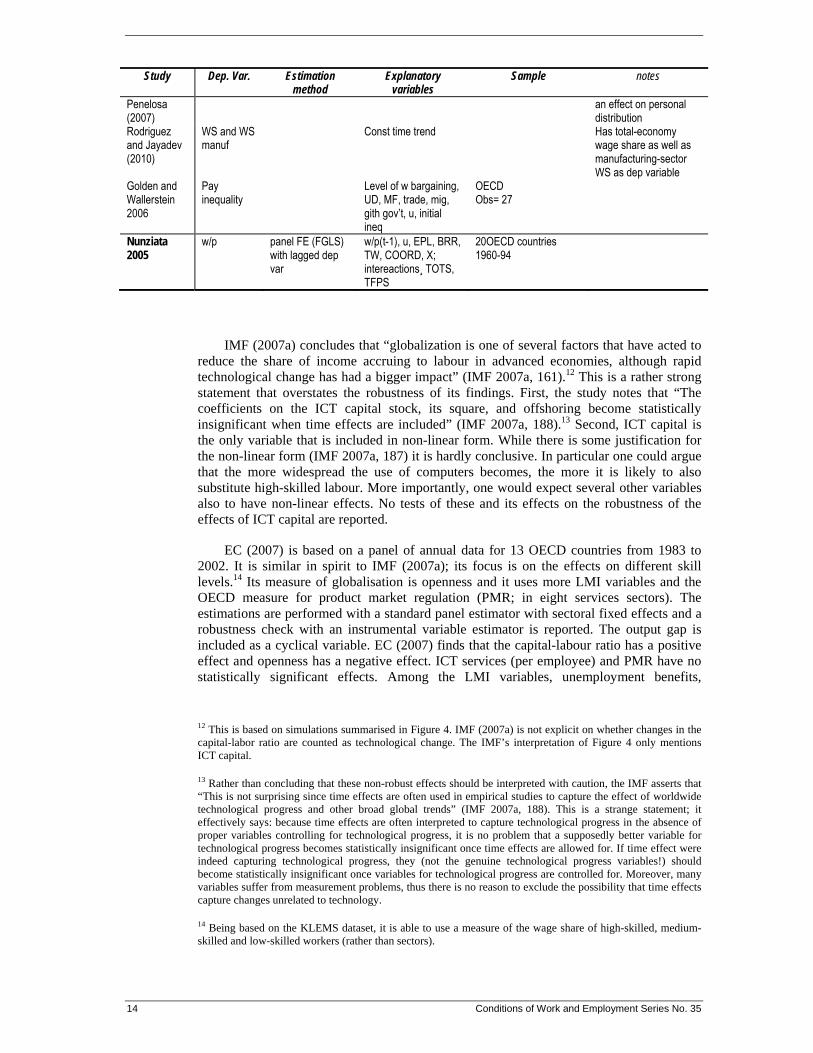
The previous section has introduced the main arguments of the debate on the determinants of functional income distribution. This section, more narrowly, surveys the literature that is closely related to our own research design, i.e. studies that explain changes in the wage share over time and across countries in a panel analysis. While income distribution has been a rather neglected research area by mainstream economic policy institutions, from 2007 onwards several high profile studies have appeared, for example IMF (2007a, 2007b) in the World Economic Outlook, EC (2007) in Employment in Europe and in ILO’s (2011) World of Work Report; the OECD has published related studies on the effects of globalisation (OECD 2007) and on personal income distribution (OECD 2008, 2011). Table 2 gives an overview of the existing literature.
3.1 Studies on the determinants of the wage share in OECD countries
IMF (2007a) is probably the most prominent mainstream analysis of the determinants of and changes in functional income distribution. It uses a panel of 18 OECD countries with annual data for the period 1983-2002 to analyze the effects of globalisation, changes in technology, and labour market institutions. The study is most careful in discussing the effects of globalisation, with indicators for offshoring, relative import and export prices and immigration. As far as technology is concerned the text highlights the role of ICT capital stock, but the econometric analysis also contains the capital-labour ratio. After first including a richer set of LMI variables, the study only includes union density and the tax wedge. The analysis is carried out mostly by a sectoral fixed effects panel estimation with one instrumental variable estimator reported as robustness check for the baseline specification.11
11 The text is not clear which variables were instrumented and how they were instrumented.
Conditions of Work and Employment Series No. 35 13
Table 2. Overview empirical literature
Study Dep. Var. Estimation method
Explanatory variables
Sample notes
Studies on OECD countries (on national wage shares) IMF (2007a) WS [Tab
5.2] Panel FE Px, Pm, L/K,
offshoring, immig, ICT, ICT^2, TW, UB
18 OECD countries, 1982-2002 Obs: 200
Also un/skilled WS as dep var (skill refers to sectors)
EC 2007 Total WS [Tab 5]
Panel FE K/L, ICT, PMR, open, LMI, govt/Y
13 countries, 1983-2002 (KLEMS)
Also Un/skilled WS as dep var; skill refers to workers
Ellis and Smith 2007
WS FE panel Δy, PMR, EPL, oil p, REX, EM X/Y, trend
Not clear, probably: OECD countries 1961-2004
Uses time trend since 1985 as proxy for tech change
Guscina 2006 WS panel FE Also in diff
Open, lagged Δx, EPL 18 OECD countries, 1960-2000
Sample split at 1985
Stockhammer 2009
WS diff ICT, KL, UNDENS, UBRR, EPL, TW, UBRR, OPEN; FINGLOB
15 OECD countries 1982-2003
Replicates and extends IMF (2007a) and EC(2007)
Studies with non-OECD countries Rodrik 1998 w/p Panel 5 yr avg Y/L, Ypc, demo, open,
cap lib 100 c, 1960-94 max 500
Harrison 2002 WS OLS, FE panel, IV Annual data, 5y avg.s
L/K, Y_pc, cap controls, open, FDI, gov’t
130 c 40 yrs obs: max 1500
Jayadev 2007 WS OLS, FE panel Annual data
Y, CA open, trade open, real int, gov’t
1962-89 c
ILO/IILS 2011 WS FE panel, annual data
Developing economies: open, finglob, CAO, minw, crisis GDPpc, real int
60c 1980-2005
Reports results by country groups Reports results for ACC for different skill groups
Studies with sectoral data (OECD countries) OECD 2007 Sectoral lab
demand Panel in diffs W/Pinput, K, R&D,
IMP, EXR With/out Y in some specification (“un/condistional LD”)
Annual sectoral data, 1987-2003 Obs: 1700
Hutchinson and Persyn (2010)
WS Share of largest 1, 2, 4, 8, 16, 32 firms (based on on AMADEAUS database) TFP, Z, P, Empl
1991-2005 Obs 1886
Theoretical Framework based on Benolila and Saint-Paul 2003
Bentolila and Saint-Paul 2003
Sectoral WS Arellano-Bond GMM
TFP (-), ΔL (-), [country-wide] labor conflict (-), (ind-spec) K/Y, (ind-spec) oil price
13 sectors in 12 OECD countries, 1972-93
ΔL is supposed to capture “current labor adjustment costs” (p.19)
Azamat Manning and Van Reenen 2007
Sectoral WS; (national WS)
OLS panel, FE: c, ind, t
PO (public ownership), BTE (barriers to entry)
3 network sectors in 18 OECD countries, 1970-2001 obs: 1000
Other studies (not WS as dependent variable) IMF (2007b) Gini FE panel Open, tariffs,
GDI/GDP, ICT/K, priv sector credit, edu Agshare, ind share
1981-2003 51c (31 dvp)
Daudey and Garcia-
Gini of pers distr
panel Y Y2 civil lib homa cap openness
Show that functional income distribution has
14 Conditions of Work and Employment Series No. 35
Study Dep. Var. Estimation method
Explanatory variables
Sample notes
Penelosa (2007)
an effect on personal distribution
Rodriguez and Jayadev (2010)
WS and WS manuf
Const time trend Has total-economy wage share as well as manufacturing-sector WS as dep variable
Golden and Wallerstein 2006
Pay inequality
Level of w bargaining, UD, MF, trade, mig, gith gov’t, u, initial ineq
OECD Obs= 27
Nunziata 2005
w/p panel FE (FGLS) with lagged dep var
w/p(t-1), u, EPL, BRR, TW, COORD, X; intereactions¸ TOTS, TFPS
20OECD countries 1960-94
IMF (2007a) concludes that “globalization is one of several factors that have acted to reduce the share of income accruing to labour in advanced economies, although rapid technological change has had a bigger impact” (IMF 2007a, 161).12 This is a rather strong statement that overstates the robustness of its findings. First, the study notes that “The coefficients on the ICT capital stock, its square, and offshoring become statistically insignificant when time effects are included” (IMF 2007a, 188).13 Second, ICT capital is the only variable that is included in non-linear form. While there is some justification for the non-linear form (IMF 2007a, 187) it is hardly conclusive. In particular one could argue that the more widespread the use of computers becomes, the more it is likely to also substitute high-skilled labour. More importantly, one would expect several other variables also to have non-linear effects. No tests of these and its effects on the robustness of the effects of ICT capital are reported.
EC (2007) is based on a panel of annual data for 13 OECD countries from 1983 to 2002. It is similar in spirit to IMF (2007a); its focus is on the effects on different skill levels.14 Its measure of globalisation is openness and it uses more LMI variables and the OECD measure for product market regulation (PMR; in eight services sectors). The estimations are performed with a standard panel estimator with sectoral fixed effects and a robustness check with an instrumental variable estimator is reported. The output gap is included as a cyclical variable. EC (2007) finds that the capital-labour ratio has a positive effect and openness has a negative effect. ICT services (per employee) and PMR have no statistically significant effects. Among the LMI variables, unemployment benefits,
12 This is based on simulations summarised in Figure 4. IMF (2007a) is not explicit on whether changes in the capital-labor ratio are counted as technological change. The IMF’s interpretation of Figure 4 only mentions ICT capital.
13 Rather than concluding that these non-robust effects should be interpreted with caution, the IMF asserts that “This is not surprising since time effects are often used in empirical studies to capture the effect of worldwide technological progress and other broad global trends” (IMF 2007a, 188). This is a strange statement; it effectively says: because time effects are often interpreted to capture technological progress in the absence of proper variables controlling for technological progress, it is no problem that a supposedly better variable for technological progress becomes statistically insignificant once time effects are allowed for. If time effect were indeed capturing technological progress, they (not the genuine technological progress variables!) should become statistically insignificant once variables for technological progress are controlled for. Moreover, many variables suffer from measurement problems, thus there is no reason to exclude the possibility that time effects capture changes unrelated to technology.
14 Being based on the KLEMS dataset, it is able to use a measure of the wage share of high-skilled, medium-skilled and low-skilled workers (rather than sectors).
Conditions of Work and Employment Series No. 35 15
employment protection legislation and the tax wedge have negative effects and minimum wages have a positive effect. Unemployment benefits, active labour market policies as well as ICT services have no statistically significant effect. Several of the variables that have no effect on the total wage share, however, do have effects on different skill groups. EC (2007) concludes that “technological progress made the largest contribution to the fall in the aggregate labour income share“ and “globalisation also had a negative impact on the aggregate labour income share but to a lesser extent” (EC 2007, 260). It also notes that the “loss was unevenly spread over the different skill types as the high-skilled workers were able to increase their share while the low-skilled workers lost income share as a result of technological progress“. (EC 2007, 260) And ”globalisation also had a negative impact (…) primarily on the medium-skilled workers” (EC 2007, 260). Regarding LMI, EC (2007) argues that labour demand from low-skilled workers is elastic whereas that of high and medium-skilled workers is inelastic. Therefore an increase in LMI and thus the bargaining power of low-skilled workers will decrease their wage share because the employment effect dominates the wage effect. Moreover, low-skilled workers are substitutes of capital and medium/high-skilled workers are complements of capital.
Ellis and Smith (2007) investigate the contribution of technological change, globalisation and bargaining power on the wage share. They estimate a wage share equation including product market regulation, employment protection legislation, the real exchange rate, oil prices, the exports to Emerging Economies and a time trend. The sample of estimation covers 1960 to 2004 for most OECD countries. Several variables are used with substantial extrapolation. For example PMR is assumed constant from 1961 to 1974 at 1974 levels. Similarly EPL data are back-casted from 1984, i.e. for most of the sample. The authors find persistent effects of the time trend and interpret this as evidence for the role of technological change. While this may be the authors’ preferred interpretation, there is nothing intrinsically technological about a time trend. The paper thus fails to provide evidence for its core argument.
Guscina (2006) aims at identifying the effects of technological change, globalisation and bargaining power. Openness is used as a proxy for globalisation, lagged productivity growth for technological change and EPL for bargaining power. The estimations are performed for the pre-1985 and post-1985 sample separately because 1985 is assumed as the beginning of the technological revolution. Estimations are also performed with the employment share and the Gini coefficient as dependent variables. The sample covers 18 OECD countries for the period 1960-2000. The estimation is performed by a standard fixed panel estimator with country fixed effects (but not time effects) and, as a robustness check in differences without any fixed effects. The authors find negative effects of openness (only statistically significant effects post 1985) and no statistically significant effects of employment protection legislation. There are statistically significant effects of productivity growth, namely positive ones prior to 1985 and negative ones thereafter. The author interprets this as evidence of change in technological progress.
Stockhammer (2009) estimates wage share equations for 15 OECD countries for the period 1982-2003. Firstly, he tries to replicate IMF (2007a) and EC (2007) and finds that their findings, in particular regarding the role of technology are not robust. Globalisation (in production), however, has a robust effect. Secondly, the estimated wage share equation is extended to allow for distributional effects of financial globalisation and for different effects of union density according to social security system. Results from the extended model suggest economically significant effects of financial globalisation and of union density of non-Ghent countries.
16 Conditions of Work and Employment Series No. 35
3.2 Studies on determinants of the wage share in advanced and developing countries
All the studies discussed so far have analyzed determinants of the changes in the wage share in OECD countries. Harrison (2002), Jayadev (2007), and ILO (2011) are studies that analyse the determinants of functional income distribution on developed as well as developing countries. Because of their number, developing countries are likely to dominate their results, which therefore are difficult to compare to the previously discussed studies.
Harrison (2002) investigates the effects of globalisation on wage shares in an analysis covering more than 100 countries over a period of up to 40 years. Openness, capital controls, the terms of trade and exchange rate crises are used as variables for globalisation. The estimations also control for the capital-labour ratio, relative per capita GDP and the government share in GDP. Harrison finds the capital-labour ratio has a strong (positive) impact and globalisation has indeed had negative effects on distribution. Capital controls, have a positive effect. Openness, exchange rate crises and FDI-inflows have negative effects on the wage share.
Jayadev (2007) analyses the effect of financial openness and trade openness on the wage share in an econometric analysis covering up to 80 countries for the period 1970-2001. The openness variables are legal measures on openness. The estimations are performed using standards fixed effects panel analysis. Control variables include (in various specifications) per capita GDP, interest rates, a crisis dummy, the government share and the budget deficit. Capital account openness and trade openness are found to have negative effects on the wage share.
ILO (2011) reports estimates for developing countries by regional group (Table 3C.4). Explanatory variables include trade openness, financial globalisation, capital account openness, replacement wage employment protection legislation, minimum wages, GDP per capital, real interest rates and a crisis dummy. The discussion of findings is based in part on stylized facts and in part on the regression results. It highlights that financialisation and trade openness has reduced the bargaining power of labour and that collective bargaining arrangements and well-designed minimum wages could have positive effects on the wage share.
3.3 Other related studies
There are numerous studies that are related but not directly comparable, i.e. that either do not investigate the determinants of the (national) wage share econometrically or that refer to very different groups of countries. Thus the following literature review has to be necessarily incomplete.
Bentolila and Saint-Paul (2003) present a strict neoclassical approach, They derive the wage share from a production function and discuss different types of technological change. Their aim is to “decompose changes in the wage share into movements along a technology-determined curve, namely the [wage] share-capital curve, shifts of its locus and deviations from it” (Bentolila and Saint-Paul 2003, 25). The equation eventually estimated includes total factor productivity (TFP), the change in employment, industrial conflict, the capital-output ratio and oil prices. The last two are allowed to have industry-specific effects. There is no control for business cycle fluctuations. Thus one can only speculate by which variable these movements off the technologically-determined distribution are captured (by TFP or by the change in employment?). TFP is included to capture capital-augmenting technological change and is supposed to shift the distribution curve. The change in employment is supposed to capture “current labor adjustment costs” (Bentolila and Saint-Paul 2003, 19) without further explanation. Together with industrial conflict it is
Conditions of Work and Employment Series No. 35 17
supposed to cause deviations from the distribution curve. Changes in oil prices are supposed to shift the distribution curve. The estimations are based on data from 13 sectors in 12 OECD countries from 1972 to 1993. Estimations are performed using a dynamic panel GMM (Arellano-Bond) estimator. The authors make no serious attempt to actually decompose the effects (as they claim to do). The economic interpretation of the results is restricted to comparisons with other estimates for the elasticity of substitution between labour and capital.
Azmat et al (2007) highlight the effects of privatization and barriers to entry to certain industries on the wage share. They do so by “exploit[ing] a number of policy experiments across several ‘network’ industries in many OECD countries to identify these effects” (Azmat et al. 2007, 29), i.e. deregulation and privatization in the telecom, gas and electricity, and transportation industries. They thus use data on three network industries in 18 OECD countries, for the period 1970-2001, i.e. their dependent variable is sectoral wage shares. Estimations are performed using standard fixed effects OLS panels. The fixed effects control for sectoral, country and time effects. Azmat et al (2007) find that privatisations have negative effects on the wage share and barriers to entry also have negative effects.
All the studies discussed so far offer an econometric analysis that has the wage share as the dependent variable. Rodrik (1997) is an important presentation of the Political Economy of Trade approach, which argues that if wages are determined by a bargaining process increases in globalisation will hurt workers as capital mobility increases the bargaining power of capital. Rodrik has also contributed to the empirical literature. Rodrik (1999) investigates the effects of democracy on manufacturing wages in an analysis covering some 90 countries. The estimations control for the manufacturing value added per worker, the output-capital ratio, the degree of openness and a measure of capital liberalization. The sample consists of (non-overlapping) 5-year averages and, in a variation, of a cross section analysis. Rodrik finds that democracy increases wages. In a companion paper Rodrik (1998) presents evidence that (with similar control variables) increased openness has a negative effect on manufacturing wages).
There are two interesting studies that demonstrate a link between personal and functional income distribution. Daudey and Garcia-Penalosa (2007) show that there is a correlation between changes in personal and functional income distribution. They estimate the Gini coefficient of a large group of countries as a function of the wage share and of various other control variables. They use the (unadjusted) manufacturing wage share as their wage share variable.
Wolff and Zacharias (2007) offer an innovative approach to personal income distribution based on a micro data analysis that takes aspects of functional income distribution into account. They use a class approach to decompose changes in the distribution of household income for the USA 1989 – 2001. They define the capitalist class with respect to ownership of non-home wealth and distinguish between various groups within the working class according to the skill level and whether employees have supervisory functions. They combine data from the US census with the SCF (Survey of Consumer Finance). They find that capitalist households receive more than 80 per cent from income from nonhome wealth, whereas this ratio is below 20 per cent for all other groups. They decompose the change in the Gini coefficient (of household income distribution) according to class, education and ethnicity and find that “the entire increase in inequality between 1989 and 2000 is attributable to the increase in inter-class inequality” (Wolff and Zacharias 2007, 24).

18 Conditions of Work and Employment Series No. 35
3.4 Some comments on the literature
There is a sizable, but uneven empirical literature on the determinants of change in functional income distribution. There is a natural grouping into studies that investigate advanced economies only and those that investigate panel with developing as well as advanced economies as the data availability differs. Several important variables are not available for developing economies. Among the larger number of studies that investigate advanced economies IMF (2007a) and EC (2007) are the most prominent representations of the mainstream view. They both explain the wage share in a flexible framework that allows to distinguish between effects from technological change, globalisation and labour market institutions/bargaining power. They both identify technological change as the single most important factor and admit that globalisation has had a negative impact on the wage share. Three remarks are in place. First, curiously, EC (2007) finds that ICT services, the preferred variable of technological change in IMF (2007a), has no statistically significant effect. In addition both report that the technology variables are not robust to the inclusion of time effects. Thus, one wonders whether the strong conclusion of IMF (2007a) and EC (2007) are warranted by their results. Second, the bargaining power variables used in both studies are from datasets designed to measure labour market rigidities rather than bargaining power. Third, financialisation is not considered as a possible explanatory factor in these studies. An important factor may thus be ignored.
The studies on panels with developing as well as advanced economies differ not only due to reasons of data availability, but also with respect to their theoretical approach. Most of them are less stringently based on neoclassical theory, but closer to what we called the Political Economy approach that highlights bargaining effects of globalisation and financialisation. The estimation equations are similar to the ones of the first group, but usually include some financialisation variables. These studies have not calculated the contributions to the changes in wage share and therefore do not allow to readily compare the size of the effects due to different variables. They do find negative effects of openness (even for developing economies) and of financialisation.
There is a potential confusion around the Stolper-Samuelson Theorem. Economists, being trained in deductive reasoning, have strong theoretical beliefs and most of them are only working on advanced economies. The Stolper-Samuelson Theorem is part of the conventional wisdom of mainstream economics, even though it is widely acknowledged that its assumptions are simplistic. The finding that for advanced economies there is a negative effect of globalisation on the wage share is then easily read as support for the Stolper-Samuelson Theorem. On the other hand, the panel analyses including developing and advanced countries almost unanimously find that globalisation has reduced wage shares in the developing as well as in advanced economies. This is supported by a broader literature on personal income distribution in developing economies that concludes that globalisation has hurt workers. As the Stolper-Samuelson Theorem predicts that globalisation benefits workers in developing (labour abundant) countries and hurts workers in advanced (capital abundant) countries, we conclude that the available evidence rejects the empirical relevance of the theorem.
Conditions of Work and Employment Series No. 35 19
4 Variable definitions, data sources, and econometric methodology
This section first gives variable definitions and data sources. Second, it indicates the development of key variables. Third, it discusses times series properties and clarifies the econometric methods employed.
4.1 Variable definitions and data sources
Our dependent variable is the private, adjusted wage share (WSAP). The wage share is the share of wages in national income. Two adjustments are made to the wage share. First, there is an adjustment that imputes wage payments for self-employed workers. This is particularly important for developing countries where a large part of the population is self employed. The adjusted wage share imputes wage payments for the self-employed to avoid counting all their income as profit income (Krueger 1999, Gollin 2002). This adjustment is standard in the literature and we directly use adjusted data from ILO/IILS and other sources.
The second adjustment transforms the wage share for the total economy into the private wage share. This is because our measure for the welfare state will be the size of government consumption. However, the wage share in government consumption is a hundred percent as the public sector does not generate profits. Government consumption is thus by definition related to the wage share and would lead to endogeneity problems in the regression analysis.
The wage share of the total economy is the sum of the private wage share (WSP) and the government wage share (WSG) weighted by their respective sizes. We use government consumption (CG) as percent of GDP as measure for the size of the government sector:
WS = (1- CG)*WSP + CG*WSG
As the wage share in the government sector is equal to 1, we can reconstruct the private wage share as
WSP = (WS-CG)/(1-CG)
We employ several sources for the adjusted wage share (WSA). Our primary source is the ILO/IILS database (compiled by Matthieu Charpe). As the AMECO database, the OECD, and some national statistics provide longer series for certain countries we complement the ILO/IILS series with data from these alternative sources. For the EU15 member states and Australia, Canada, Japan, and the United States we use series from the AMECO database. For Mexico, South Korea, and Turkey we employ data from the OECD. For China we use a national series. In an analysis of robustness, we also use wage share data from the UN (WS_UN) and from UNIDO for manufacturing wage shares (WS_UNIDO). These series are unadjusted.
The following variables are used in the baseline specification for developing and advanced economies: Growth (GROWTH) is real GDP growth (in national currency) taken from the World Bank WDI. Financial globalisation (FINGLOB) is the logarithm of external assets plus external liabilities divided by GDP, taken from Lane and Milesi-Ferretti (2007). Trade openness (OPEN) is measured as exports plus imports divided by GDP, taken from the World Bank WDI. Government consumption as percentage of GDP

20 Conditions of Work and Employment Series No. 35
(CG) is taken from the PENN World Tables. The logarithm of the PPP converted GDP per worker at constant prices (GDPPW), taken from the Penn World Tables 7.0, is used as a measure of technological change. Structural change in developing countries is operationalised with the variables for agricultural share (AG), that is the value added by forestry, hunting, fishing, the cultivation of crops, and livestock production as a percentage of GDP, and industry share (IND), which stands for value added in mining, manufacturing, construction, electricity, water, and gas as a percentage of GDP. AG and IND are taken from the World Bank WDI dataset.
For the baseline variables we get an unbalanced panel that includes up to 71 countries for a maximum period of 1970 to 2007. However, for most developing countries the series are much shorter than that. Table A.3 (in the Appendix) lists the countries included in the analysis.
In extensions of the baseline variables, the following variables will be included. These additional variables will, at times substantially, reduce the sample. TOT stands for terms of trade and has been put together from the AMECO database (for advanced countries and for developing countries according to availability the IMF IFS (export unit values/import unit values) or the World Bank WDI (net barter terms of trade index). These series are not strictly comparable across countries and TOT is therefore not included in the set of baseline variables. UNEMPL is the number of unemployed people as a share of the labour force. For the member states of the EU(15), Australia, Canada, Japan, Mexico, South Korea, Turkey and the United States data from the AMECO database is used. For other countries unemployment data from the ILO database on labour statistics, the IMF or the World Bank WDI dataset is employed, depending on which dataset has the longest time series. ICT_CB is the logarithm of ICT assets divided by GDP taken from the Conference Board Total Economy Database. Furthermore, the impact of economic crises is tested using dummy variables for crisis years (defined as a real GDP growth of less than 3 percent) and for exchange rate crisis (defined as a nominal devaluation of more than 20 per cent vis-a-vis the dollar).
The impact of financial reforms is investigated with a dataset from Abiad, Detragiache and Tressel (2008) which has measures for credit controls (FINREF_CC), interest rate controls (FINREF_IRC), entry barriers (FINREF_EB), privatisation (FINREF_PRIV), international capital flows (FINREF_ICF), and security markets (FINREF_SM). The financial reform index (FINREF_XN) is a summary index for financial reforms.
The impact of labour market institutions on the wage share is measured with variables from Aleksynska and Schindler (2011) which account for the ratio of minimum wage to mean wage (MW_MNW), the gross replacement rate (UB_GRR1), the unemployment benefits coverage (UB_COVERAGE), the advance notice period after 4 years (EPL_AN4Y), and the severance pay after 4 years (EPL_SP4Y). As labour supply variables we use the logarithm of the number of economically active people (LF), taken from the World Bank WDI dataset, and the logarithm of the population (POP), retrieved from the Penn World Tables 7.0
To measure the impact of globalisation we include the ratio of exports to GDP (OPEN_X) from the World Bank WDI dataset, the inward FDI/GDP stock (FDI_IN) and the outward FDI/GDP stock (FDI_OUT), both from Lane and Milesi-Ferretti (2007). Furthermore we use the KOF globalisation indices on the economic (KOF_GLOB_EC), social (KOF_GLOB_SOC) and political (KOF_GLOB_POL) measures of globalisation. The economic globalisation index consists half of measures of actual trade and financials flows and half of indicators for legal measures. The social globalisation indicator uses measures of migration flows and communication links. The political measure is about the international representation of a country (Dreher 2006).

Conditions of Work and Employment Series No. 35 21
For advanced economies data is more reliable and in some areas more data is available: The impact of technological change on the wage share in advanced economies is measured by the capital-labour ratio (KL_KLEMS), which is the logarithm of capital services divided by the number of persons engaged, and ICT services (ICT_KLEMS), which is the logarithm of ICT capital services divided by gross value added. Both variables are from the EU KLEMS dataset. Union density (UNION) is from Bassanini and Duval (2006) and has been chained with data from the BGHS dataset prior to 1982.
The sample for advanced economies is effectively determined by the countries which are covered by the KLEMS dataset. It covers the following 16 countries: Belgium, Denmark, Germany, Ireland, Spain, France, Italy, Netherlands, Austria, Portugal, Finland, Sweden, United Kingdom, United States, and Japan. Note that this sample of advanced economies that will be used in section 6, is somewhat smaller than the group of advanced economies in the sense of high-income OECD countries. For Germany macroeconomic variables have been chained with growth rates for West-Germany prior to 1991 where necessary. The sample period will usually be 1970 to 2003 (the sample ends in 2003 because of the availability of UNION).
The Bassanini and Duval (2006 dataset), which has also formed the basis for the OECD Employment Outlook 2006, will be used as an alternative source for labour market institutions variables. The following variables will be used: employment protection legislation (EPL_BD), duration of unemployment benefits (BENDU_BD), gross replacement rate (GRR_BD), product market regulation (PMR_BD), and the tax wedge between the cost of labour to the employer and the employee's take-home pay (TW_BD).
As alternative data for technological progress the following are used. The EU_KLEMS dataset provides a different measure for the capital-labour ratio, KL_HOURS_KLEMS, which is the logarithm of capital services divided by total hours worked by persons engaged. KL_AMECO is the logarithm of net capital stock divided by number of persons employed in domestic industries, and is taken from the AMECO database.
4.2 Some stylized facts on the core explanatory variables
4.2.1 Developing economies
Figure 4 gives an overview of the development of the key explanatory variables for developing countries. The figures reports averages of an unbalanced panel. The development of any variable depicted is thus not only influenced by the development within a group of countries, but also by data availability. The broad trends are clear enough. Financialisation has a clear and strong upward trend as does globalisation. Our variable for welfare states suggests a hump-shaped development over time: government expenditures as percent of GDP peaked in the early 1980s and have a declining trend thereafter. Among the variables of technological and structural change GDP per worker shows a clear upward trend and the agricultural share shows a downward trend. The industrial share has a modest upward trend until the late 1980s and declines thereafter, but seems to stabilize in the mid 1990s.

22 Conditions of Work and Employment Series No. 35
Figure 4. Baseline explanatory variables for developing countries
Financialisation Globalisation
Welfare state Technological change
Source: See text and Table A.1
4.2.2 Advanced economies
Figure 5 summarises the development of key explanatory variables for advanced economies. Financialisation has a steady upward trend. Financialisation seems to have been substantially stronger in advanced than in developing economies. Among the globalisation variables trade openness has stable upward trend, whereas the terms of trade declined from the early 1970s to the mid 1980s and stabilise thereafter. The welfare state variables show a structurally similar picture. Both are hump-shaped and indicate an increase until the late 1970s/early 1980s and a decline thereafter. Union density reaches its peak in the mid 1970s and declines below the initial levels; government consumption reaches its peak in the early 1980s. Both measures of technological change show a steady upward trend with ICT services experiencing a steeper rise than the capital-labour ratio.
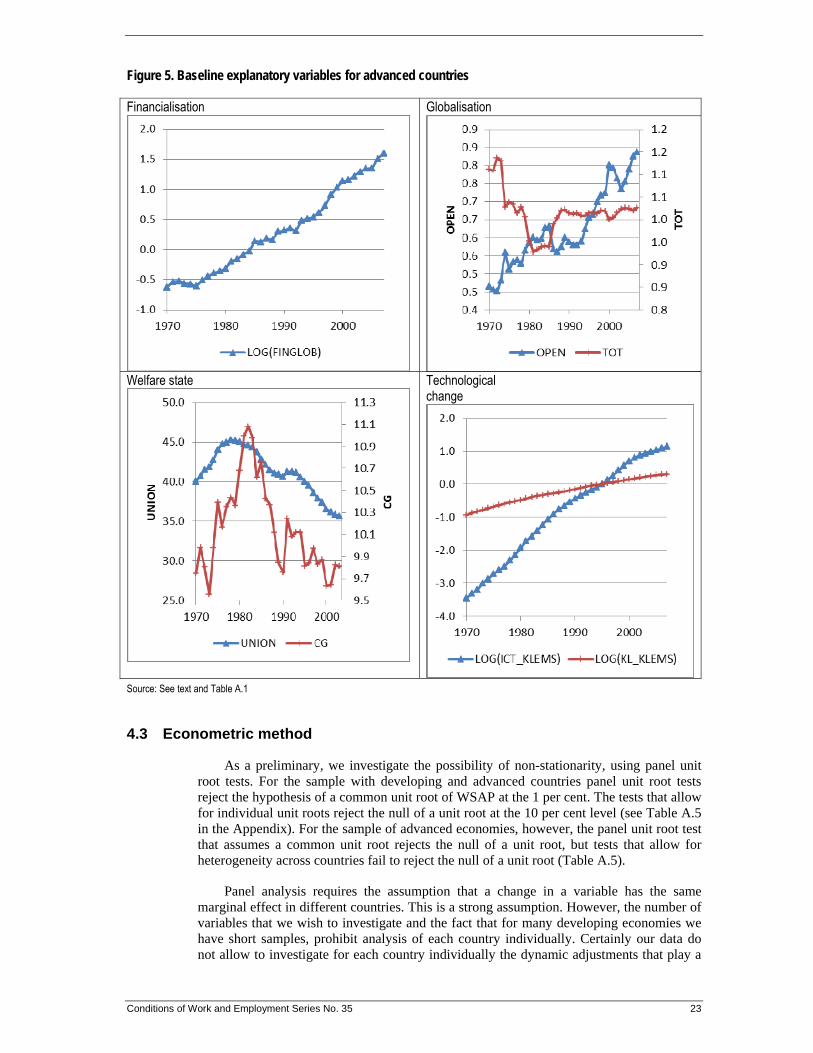
Conditions of Work and Employment Series No. 35 23
Figure 5. Baseline explanatory variables for advanced countries
Financialisation Globalisation
Welfare state
Technological change
Source: See text and Table A.1
4.3 Econometric method
As a preliminary, we investigate the possibility of non-stationarity, using panel unit root tests. For the sample with developing and advanced countries panel unit root tests reject the hypothesis of a common unit root of WSAP at the 1 per cent. The tests that allow for individual unit roots reject the null of a unit root at the 10 per cent level (see Table A.5 in the Appendix). For the sample of advanced economies, however, the panel unit root test that assumes a common unit root rejects the null of a unit root, but tests that allow for heterogeneity across countries fail to reject the null of a unit root (Table A.5).
Panel analysis requires the assumption that a change in a variable has the same marginal effect in different countries. This is a strong assumption. However, the number of variables that we wish to investigate and the fact that for many developing economies we have short samples, prohibit analysis of each country individually. Certainly our data do not allow to investigate for each country individually the dynamic adjustments that play a
24 Conditions of Work and Employment Series No. 35
prominent role in time series econometrics. Therefore panel analysis is used. The coefficient estimates of the panel analysis, however, have to be interpreted with caution as the pooling restriction (i.e. the assumption of identical coefficients across countries) is likely to hold only as an approximation in our sample. The coefficient estimates have to be interpreted as average effects across a group of possibly heterogeneous countries.
The first specification will be a standard fixed effects (FE) estimator most frequently used in the literature (e.g. IMF 2007a, EC 2007). We use cross section fixed effects, and autocorrelation correction and heteroscedasticity-consistent standard errors. This is also called the Parks estimator (Beck and Katz 1995, Wooldridge 2002). This will be our preferred specification and, unless otherwise noted, results will refer to this specification.
The second specification will be a first-difference estimator. This estimator should theoretically yield similar results to the fixed effects estimator and is preferable if the regression suffers from a high degree of autocorrelation in the residuals (Wooldridge 2002, 284). We report panel corrected standard errors that are consistent to heteroscedasticity. It turns out that the FE estimator and the difference estimator mostly yield very similar results. As we fail to reject the unit root hypothesis for advanced economies, the difference specification might be given preference to the fixed effects specification for advanced economies. Thirdly we will present medium-run results based on non-overlapping 5-year average data. This is often regarded as appropriate when institutional variables are involved that do not change on a year-to-year basis. However, this approach comes at the cost of losing some information. Fourthly, we estimate a GMM estimator based on Arellano and Bond (1991). This is a dynamic panel estimator that instruments the lagged dependent variable. While presently fashionable in the literature, the Arellano and Bond (1991) estimator and the Blundell and Bond (1998) estimator have been developed for panels that have much larger cross sections than ours. Instrumental variable estimators do not have good small sample properties and it turns out that in all specifications the GMM estimators have unsatisfactory Sargan tests. The GMM estimator therefore cannot be presumed to be superior in our context.
Conditions of Work and Employment Series No. 35 25
5 Results for developing and advanced countries
This section reports results for a broad sample of advanced and developing economies (we will refer to this sample as ‘all countries’). The sample contains an unbalanced panel with up to 71 countries of which 28 are OECD high-income economies. We first present the baseline specification and the econometric strategy. Then we present a series of robustness checks with a variety of different specifications, experimenting with different data sets, different estimation methods and subsamples. Finally we calculate the contributions of financialisation, globalisation, welfare state retrenchment and technological change to changes in the wage share.
5.1 Estimation equation for sample with all countries
The baseline specification for the sample with all countries is:
WSAP = f(GROWTH, FINGLOB, OPEN, CG, GDPpw, AG, IND)
Where WSAP is the adjusted private wage share, growth the real GDP growth, FINGLOB (the logarithm of) financial globalisation, OPEN trade openness, CG government consumption, GDPpw (the logarithm of) GDP per worker, AG the agricultural share, IND the industrial share. Variables definitions and sources are discussed in section 4.
For the calculation of medium-run contributions to changes in income distribution this set of variables will be grouped as follows: FINGLOB will measure the effect of financialisation, OPEN will measure the effect of globalisation, CG will measure the effect of welfare state retrenchment, GDPpw, AG and IND will measure technological and structural change.
This baseline specification is the result of pre-testing and includes variables that have proven robust, which will be demonstrated by reporting extensive experimentation with the baseline specification. However, the specification is ultimately arbitrary as there are several candidates for variables that could have been included. In choosing this set of variables we have tried to maintain a balance between maintaining a large sample and including robust variables. Including additional variables typically implies losing some observations due to missing data. We will discuss several variations in the specification, in the sample and in the estimation method.
5.2 Results for the baseline specification and
variations
Table 3 presents our baseline specification and some extensions. Specification 1 is the baseline specification. For our baseline variables the results are very similar in the different specifications. FINGLOB consistently has a statistically significant negative effect (at the 1 per cent level) in all specifications (except specification 9). OPEN has statistically significant negative effect in all specifications (at the 1 per cent or the 5 per cent level). CG has a positive effect (at the 5per cent level) in all specifications except for specifications 6 and 7. GDPpw only has a statistically significant negative effect (at the 10 per cent level) in specification 5. AG has a statistically significant negative effect (at the 1 per cent level) in all specifications except specification 4. IND has a statistically significant negative
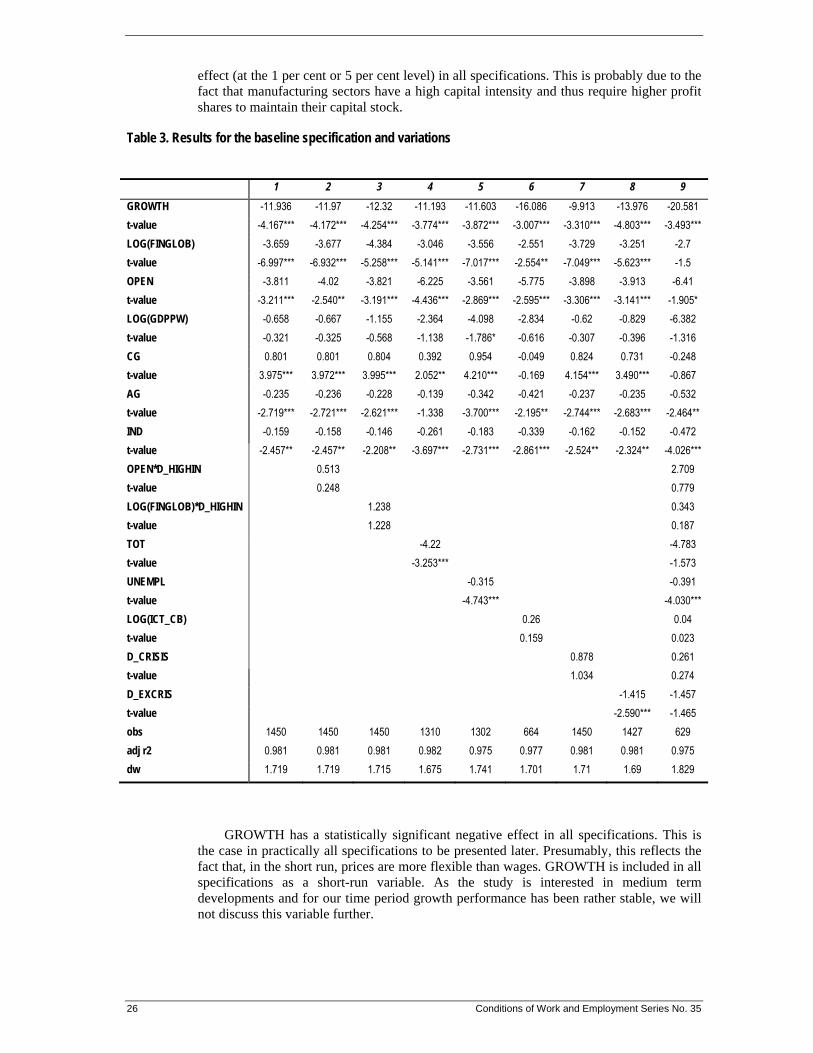
26 Conditions of Work and Employment Series No. 35
effect (at the 1 per cent or 5 per cent level) in all specifications. This is probably due to the fact that manufacturing sectors have a high capital intensity and thus require higher profit shares to maintain their capital stock.
Table 3. Results for the baseline specification and variations
GROWTH has a statistically significant negative effect in all specifications. This is the case in practically all specifications to be presented later. Presumably, this reflects the fact that, in the short run, prices are more flexible than wages. GROWTH is included in all specifications as a short-run variable. As the study is interested in medium term developments and for our time period growth performance has been rather stable, we will not discuss this variable further.
1 2 3 4 5 6 7 8 9
GROWTH -11.936 -11.97 -12.32 -11.193 -11.603 -16.086 -9.913 -13.976 -20.581
t-value -4.167*** -4.172*** -4.254*** -3.774*** -3.872*** -3.007*** -3.310*** -4.803*** -3.493***
LOG(FINGLOB) -3.659 -3.677 -4.384 -3.046 -3.556 -2.551 -3.729 -3.251 -2.7
t-value -6.997*** -6.932*** -5.258*** -5.141*** -7.017*** -2.554** -7.049*** -5.623*** -1.5
OPEN -3.811 -4.02 -3.821 -6.225 -3.561 -5.775 -3.898 -3.913 -6.41
t-value -3.211*** -2.540** -3.191*** -4.436*** -2.869*** -2.595*** -3.306*** -3.141*** -1.905*
LOG(GDPPW) -0.658 -0.667 -1.155 -2.364 -4.098 -2.834 -0.62 -0.829 -6.382
t-value -0.321 -0.325 -0.568 -1.138 -1.786* -0.616 -0.307 -0.396 -1.316
CG 0.801 0.801 0.804 0.392 0.954 -0.049 0.824 0.731 -0.248
t-value 3.975*** 3.972*** 3.995*** 2.052** 4.210*** -0.169 4.154*** 3.490*** -0.867
AG -0.235 -0.236 -0.228 -0.139 -0.342 -0.421 -0.237 -0.235 -0.532
t-value -2.719*** -2.721*** -2.621*** -1.338 -3.700*** -2.195** -2.744*** -2.683*** -2.464**
IND -0.159 -0.158 -0.146 -0.261 -0.183 -0.339 -0.162 -0.152 -0.472
t-value -2.457** -2.457** -2.208** -3.697*** -2.731*** -2.861*** -2.524** -2.324** -4.026***
OPEN*D_HIGHIN 0.513 2.709
t-value 0.248 0.779
LOG(FINGLOB)*D_HIGHIN 1.238 0.343
t-value 1.228 0.187
TOT -4.22 -4.783
t-value -3.253*** -1.573
UNEMPL -0.315 -0.391
t-value -4.743*** -4.030***
LOG(ICT_CB) 0.26 0.04
t-value 0.159 0.023
D_CRISIS 0.878 0.261
t-value 1.034 0.274
D_EXCRIS -1.415 -1.457
t-value -2.590*** -1.465
obs 1450 1450 1450 1310 1302 664 1450 1427 629
adj r2 0.981 0.981 0.981 0.982 0.975 0.977 0.981 0.981 0.975
dw 1.719 1.719 1.715 1.675 1.741 1.701 1.71 1.69 1.829
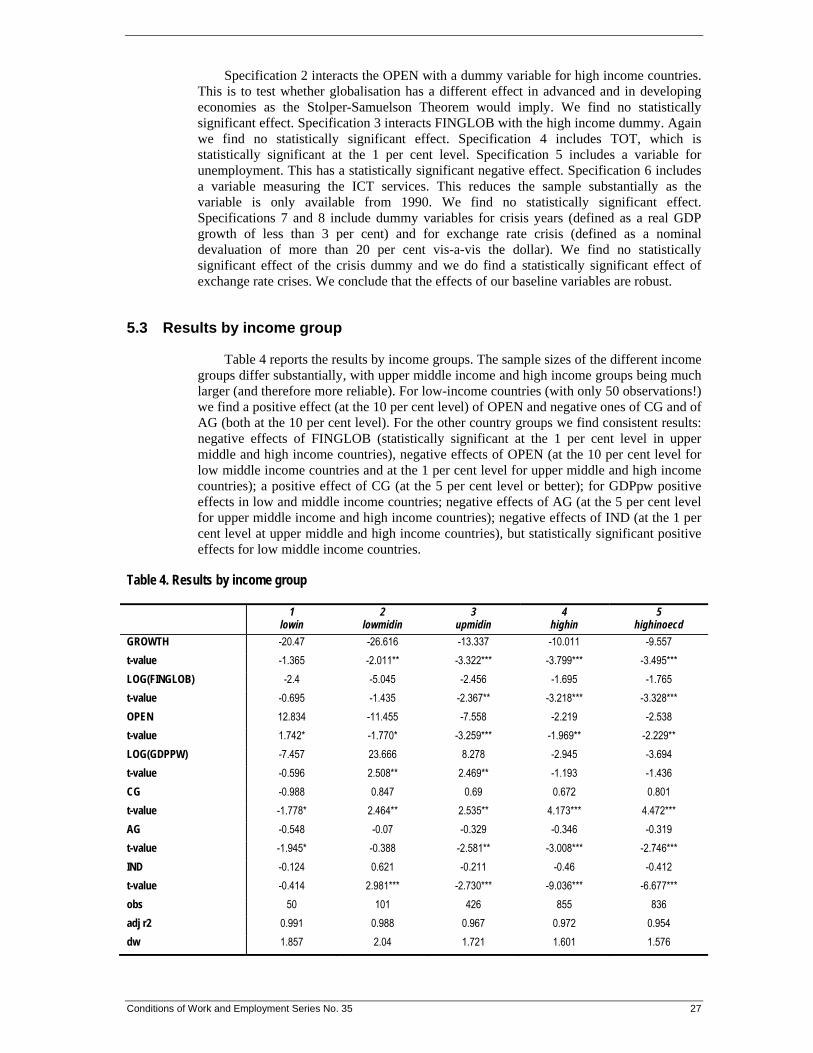
Conditions of Work and Employment Series No. 35 27
Specification 2 interacts the OPEN with a dummy variable for high income countries. This is to test whether globalisation has a different effect in advanced and in developing economies as the Stolper-Samuelson Theorem would imply. We find no statistically significant effect. Specification 3 interacts FINGLOB with the high income dummy. Again we find no statistically significant effect. Specification 4 includes TOT, which is statistically significant at the 1 per cent level. Specification 5 includes a variable for unemployment. This has a statistically significant negative effect. Specification 6 includes a variable measuring the ICT services. This reduces the sample substantially as the variable is only available from 1990. We find no statistically significant effect. Specifications 7 and 8 include dummy variables for crisis years (defined as a real GDP growth of less than 3 per cent) and for exchange rate crisis (defined as a nominal devaluation of more than 20 per cent vis-a-vis the dollar). We find no statistically significant effect of the crisis dummy and we do find a statistically significant effect of exchange rate crises. We conclude that the effects of our baseline variables are robust.
5.3 Results by income group
Table 4 reports the results by income groups. The sample sizes of the different income groups differ substantially, with upper middle income and high income groups being much larger (and therefore more reliable). For low-income countries (with only 50 observations!) we find a positive effect (at the 10 per cent level) of OPEN and negative ones of CG and of AG (both at the 10 per cent level). For the other country groups we find consistent results: negative effects of FINGLOB (statistically significant at the 1 per cent level in upper middle and high income countries), negative effects of OPEN (at the 10 per cent level for low middle income countries and at the 1 per cent level for upper middle and high income countries); a positive effect of CG (at the 5 per cent level or better); for GDPpw positive effects in low and middle income countries; negative effects of AG (at the 5 per cent level for upper middle income and high income countries); negative effects of IND (at the 1 per cent level at upper middle and high income countries), but statistically significant positive effects for low middle income countries.
Table 4. Results by income group
1 lowin
2 lowmidin
3 upmidin
4 highin
5 highinoecd
GROWTH -20.47 -26.616 -13.337 -10.011 -9.557
t-value -1.365 -2.011** -3.322*** -3.799*** -3.495***
LOG(FINGLOB) -2.4 -5.045 -2.456 -1.695 -1.765
t-value -0.695 -1.435 -2.367** -3.218*** -3.328***
OPEN 12.834 -11.455 -7.558 -2.219 -2.538
t-value 1.742* -1.770* -3.259*** -1.969** -2.229**
LOG(GDPPW) -7.457 23.666 8.278 -2.945 -3.694
t-value -0.596 2.508** 2.469** -1.193 -1.436
CG -0.988 0.847 0.69 0.672 0.801
t-value -1.778* 2.464** 2.535** 4.173*** 4.472***
AG -0.548 -0.07 -0.329 -0.346 -0.319
t-value -1.945* -0.388 -2.581** -3.008*** -2.746***
IND -0.124 0.621 -0.211 -0.46 -0.412
t-value -0.414 2.981*** -2.730*** -9.036*** -6.677***
obs 50 101 426 855 836
adj r2 0.991 0.988 0.967 0.972 0.954
dw 1.857 2.04 1.721 1.601 1.576
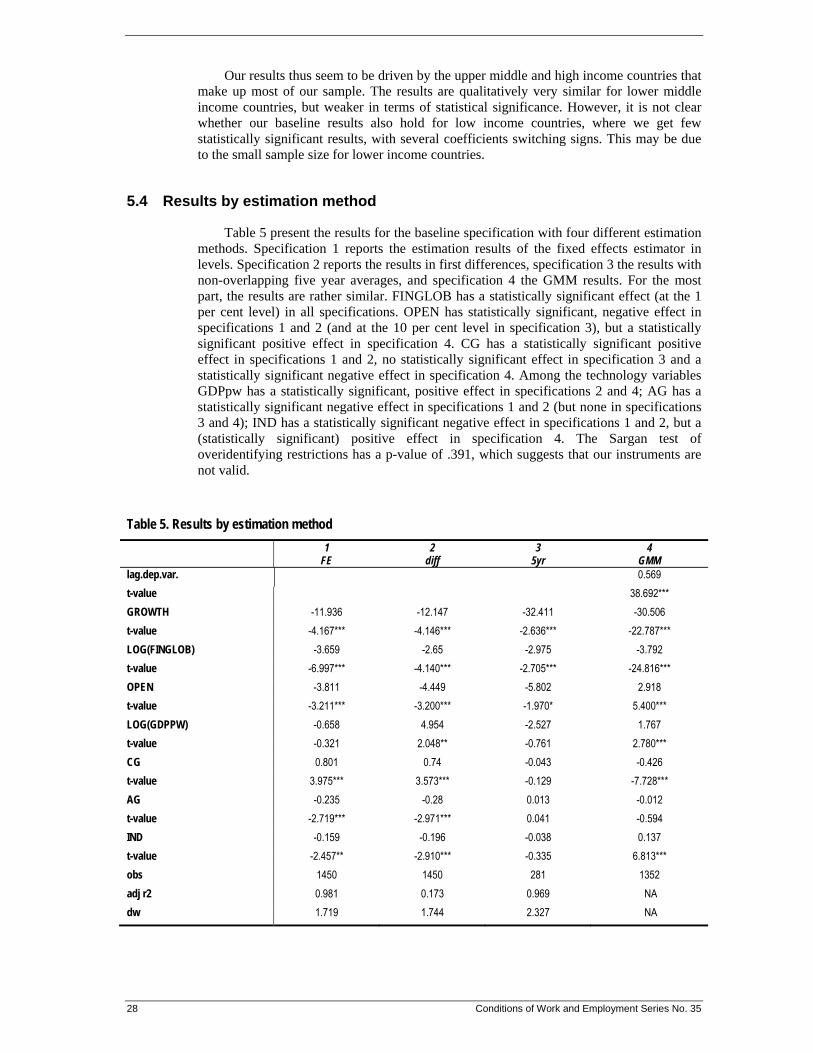
28 Conditions of Work and Employment Series No. 35
Our results thus seem to be driven by the upper middle and high income countries that make up most of our sample. The results are qualitatively very similar for lower middle income countries, but weaker in terms of statistical significance. However, it is not clear whether our baseline results also hold for low income countries, where we get few statistically significant results, with several coefficients switching signs. This may be due to the small sample size for lower income countries.
5.4 Results by estimation method
Table 5 present the results for the baseline specification with four different estimation methods. Specification 1 reports the estimation results of the fixed effects estimator in levels. Specification 2 reports the results in first differences, specification 3 the results with non-overlapping five year averages, and specification 4 the GMM results. For the most part, the results are rather similar. FINGLOB has a statistically significant effect (at the 1 per cent level) in all specifications. OPEN has statistically significant, negative effect in specifications 1 and 2 (and at the 10 per cent level in specification 3), but a statistically significant positive effect in specification 4. CG has a statistically significant positive effect in specifications 1 and 2, no statistically significant effect in specification 3 and a statistically significant negative effect in specification 4. Among the technology variables GDPpw has a statistically significant, positive effect in specifications 2 and 4; AG has a statistically significant negative effect in specifications 1 and 2 (but none in specifications 3 and 4); IND has a statistically significant negative effect in specifications 1 and 2, but a (statistically significant) positive effect in specification 4. The Sargan test of overidentifying restrictions has a p-value of .391, which suggests that our instruments are not valid.
Table 5. Results by estimation method
1 FE
2 diff
3 5yr
4 GMM
lag.dep.var. 0.569
t-value 38.692***
GROWTH -11.936 -12.147 -32.411 -30.506
t-value -4.167*** -4.146*** -2.636*** -22.787***
LOG(FINGLOB) -3.659 -2.65 -2.975 -3.792
t-value -6.997*** -4.140*** -2.705*** -24.816***
OPEN -3.811 -4.449 -5.802 2.918
t-value -3.211*** -3.200*** -1.970* 5.400***
LOG(GDPPW) -0.658 4.954 -2.527 1.767
t-value -0.321 2.048** -0.761 2.780***
CG 0.801 0.74 -0.043 -0.426
t-value 3.975*** 3.573*** -0.129 -7.728***
AG -0.235 -0.28 0.013 -0.012
t-value -2.719*** -2.971*** 0.041 -0.594
IND -0.159 -0.196 -0.038 0.137
t-value -2.457** -2.910*** -0.335 6.813***
obs 1450 1450 281 1352
adj r2 0.981 0.173 0.969 NA
dw 1.719 1.744 2.327 NA
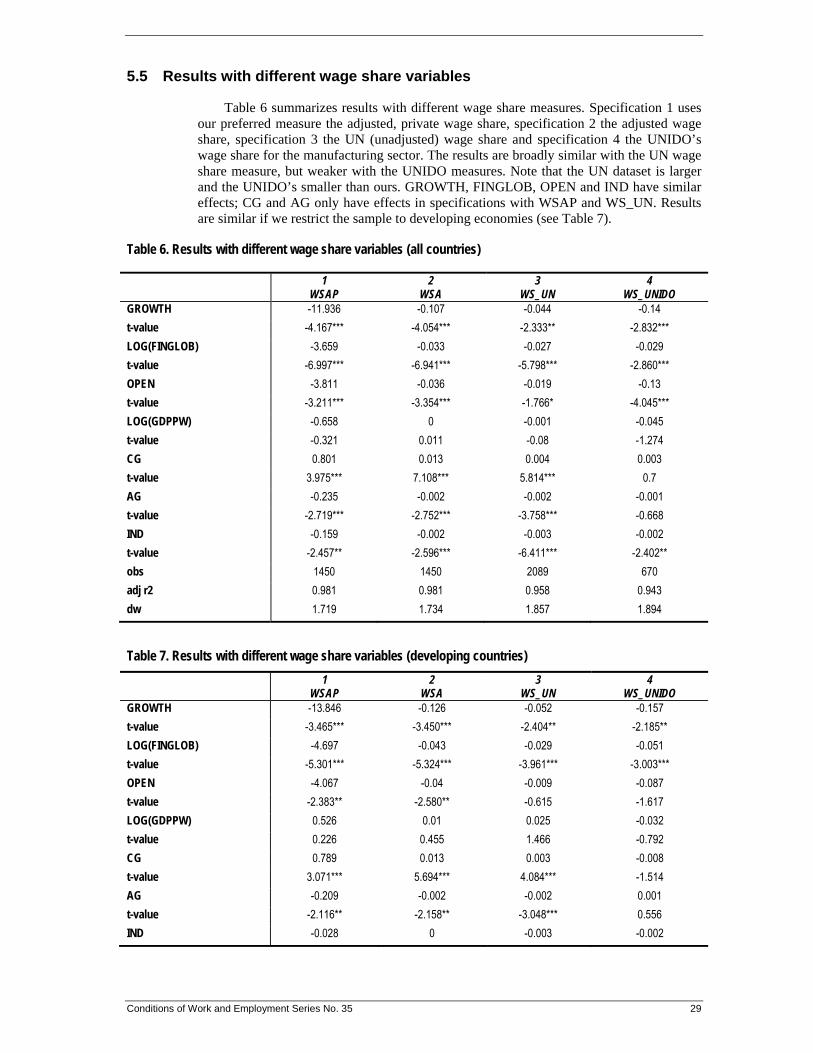
Conditions of Work and Employment Series No. 35 29
5.5 Results with different wage share variables
Table 6 summarizes results with different wage share measures. Specification 1 uses our preferred measure the adjusted, private wage share, specification 2 the adjusted wage share, specification 3 the UN (unadjusted) wage share and specification 4 the UNIDO’s wage share for the manufacturing sector. The results are broadly similar with the UN wage share measure, but weaker with the UNIDO measures. Note that the UN dataset is larger and the UNIDO’s smaller than ours. GROWTH, FINGLOB, OPEN and IND have similar effects; CG and AG only have effects in specifications with WSAP and WS_UN. Results are similar if we restrict the sample to developing economies (see Table 7).
Table 6. Results with different wage share variables (all countries)
1 WSAP
2 WSA
3 WS_UN
4 WS_UNIDO
GROWTH -11.936 -0.107 -0.044 -0.14
t-value -4.167*** -4.054*** -2.333** -2.832***
LOG(FINGLOB) -3.659 -0.033 -0.027 -0.029
t-value -6.997*** -6.941*** -5.798*** -2.860***
OPEN -3.811 -0.036 -0.019 -0.13
t-value -3.211*** -3.354*** -1.766* -4.045***
LOG(GDPPW) -0.658 0 -0.001 -0.045
t-value -0.321 0.011 -0.08 -1.274
CG 0.801 0.013 0.004 0.003
t-value 3.975*** 7.108*** 5.814*** 0.7
AG -0.235 -0.002 -0.002 -0.001
t-value -2.719*** -2.752*** -3.758*** -0.668
IND -0.159 -0.002 -0.003 -0.002
t-value -2.457** -2.596*** -6.411*** -2.402**
obs 1450 1450 2089 670
adj r2 0.981 0.981 0.958 0.943
dw 1.719 1.734 1.857 1.894
Table 7. Results with different wage share variables (developing countries)
1 WSAP
2 WSA
3 WS_UN
4 WS_UNIDO
GROWTH -13.846 -0.126 -0.052 -0.157
t-value -3.465*** -3.450*** -2.404** -2.185**
LOG(FINGLOB) -4.697 -0.043 -0.029 -0.051
t-value -5.301*** -5.324*** -3.961*** -3.003***
OPEN -4.067 -0.04 -0.009 -0.087
t-value -2.383** -2.580** -0.615 -1.617
LOG(GDPPW) 0.526 0.01 0.025 -0.032
t-value 0.226 0.455 1.466 -0.792
CG 0.789 0.013 0.003 -0.008
t-value 3.071*** 5.694*** 4.084*** -1.514
AG -0.209 -0.002 -0.002 0.001
t-value -2.116** -2.158** -3.048*** 0.556
IND -0.028 0 -0.003 -0.002
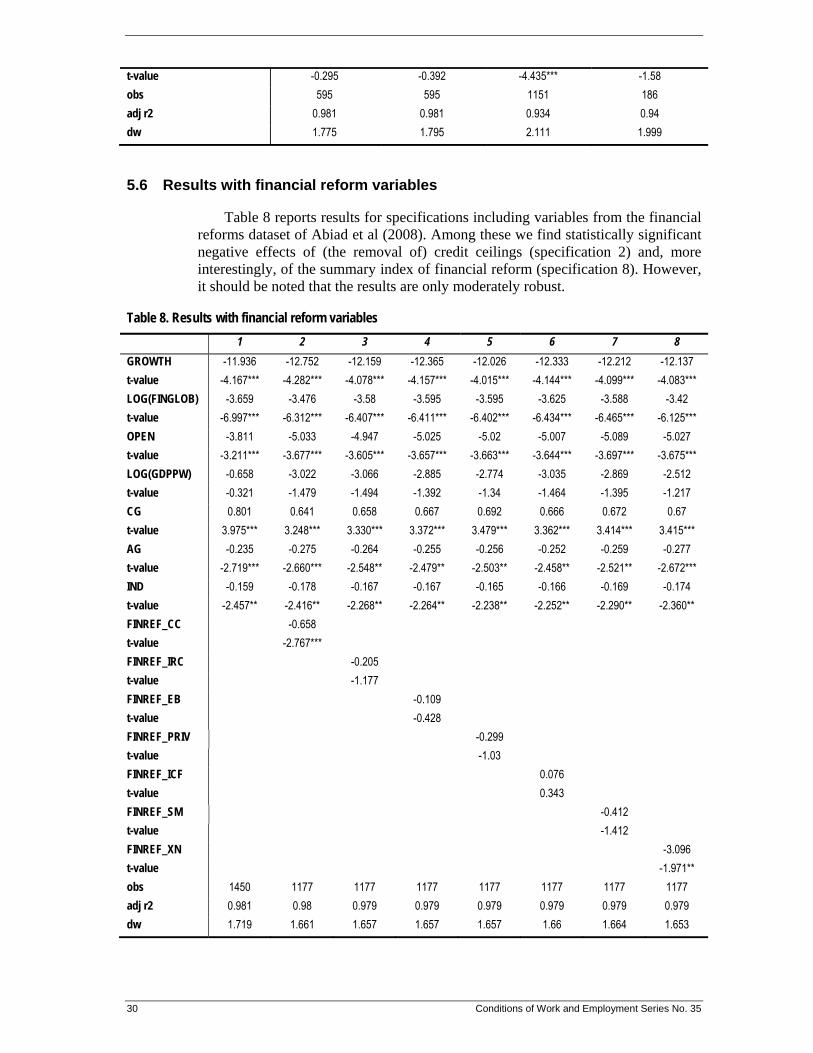
30 Conditions of Work and Employment Series No. 35
t-value -0.295 -0.392 -4.435*** -1.58
obs 595 595 1151 186
adj r2 0.981 0.981 0.934 0.94
dw 1.775 1.795 2.111 1.999
5.6 Results with financial reform variables
Table 8 reports results for specifications including variables from the financial reforms dataset of Abiad et al (2008). Among these we find statistically significant negative effects of (the removal of) credit ceilings (specification 2) and, more interestingly, of the summary index of financial reform (specification 8). However, it should be noted that the results are only moderately robust.
Table 8. Results with financial reform variables
1 2 3 4 5 6 7 8
GROWTH -11.936 -12.752 -12.159 -12.365 -12.026 -12.333 -12.212 -12.137
t-value -4.167*** -4.282*** -4.078*** -4.157*** -4.015*** -4.144*** -4.099*** -4.083***
LOG(FINGLOB) -3.659 -3.476 -3.58 -3.595 -3.595 -3.625 -3.588 -3.42
t-value -6.997*** -6.312*** -6.407*** -6.411*** -6.402*** -6.434*** -6.465*** -6.125***
OPEN -3.811 -5.033 -4.947 -5.025 -5.02 -5.007 -5.089 -5.027
t-value -3.211*** -3.677*** -3.605*** -3.657*** -3.663*** -3.644*** -3.697*** -3.675***
LOG(GDPPW) -0.658 -3.022 -3.066 -2.885 -2.774 -3.035 -2.869 -2.512
t-value -0.321 -1.479 -1.494 -1.392 -1.34 -1.464 -1.395 -1.217
CG 0.801 0.641 0.658 0.667 0.692 0.666 0.672 0.67
t-value 3.975*** 3.248*** 3.330*** 3.372*** 3.479*** 3.362*** 3.414*** 3.415***
AG -0.235 -0.275 -0.264 -0.255 -0.256 -0.252 -0.259 -0.277
t-value -2.719*** -2.660*** -2.548** -2.479** -2.503** -2.458** -2.521** -2.672***
IND -0.159 -0.178 -0.167 -0.167 -0.165 -0.166 -0.169 -0.174
t-value -2.457** -2.416** -2.268** -2.264** -2.238** -2.252** -2.290** -2.360**
FINREF_CC -0.658
t-value -2.767***
FINREF_IRC -0.205
t-value -1.177
FINREF_EB -0.109
t-value -0.428
FINREF_PRIV -0.299
t-value -1.03
FINREF_ICF 0.076
t-value 0.343
FINREF_SM -0.412
t-value -1.412
FINREF_XN -3.096
t-value -1.971**
obs 1450 1177 1177 1177 1177 1177 1177 1177
adj r2 0.981 0.98 0.979 0.979 0.979 0.979 0.979 0.979
dw 1.719 1.661 1.657 1.657 1.657 1.66 1.664 1.653
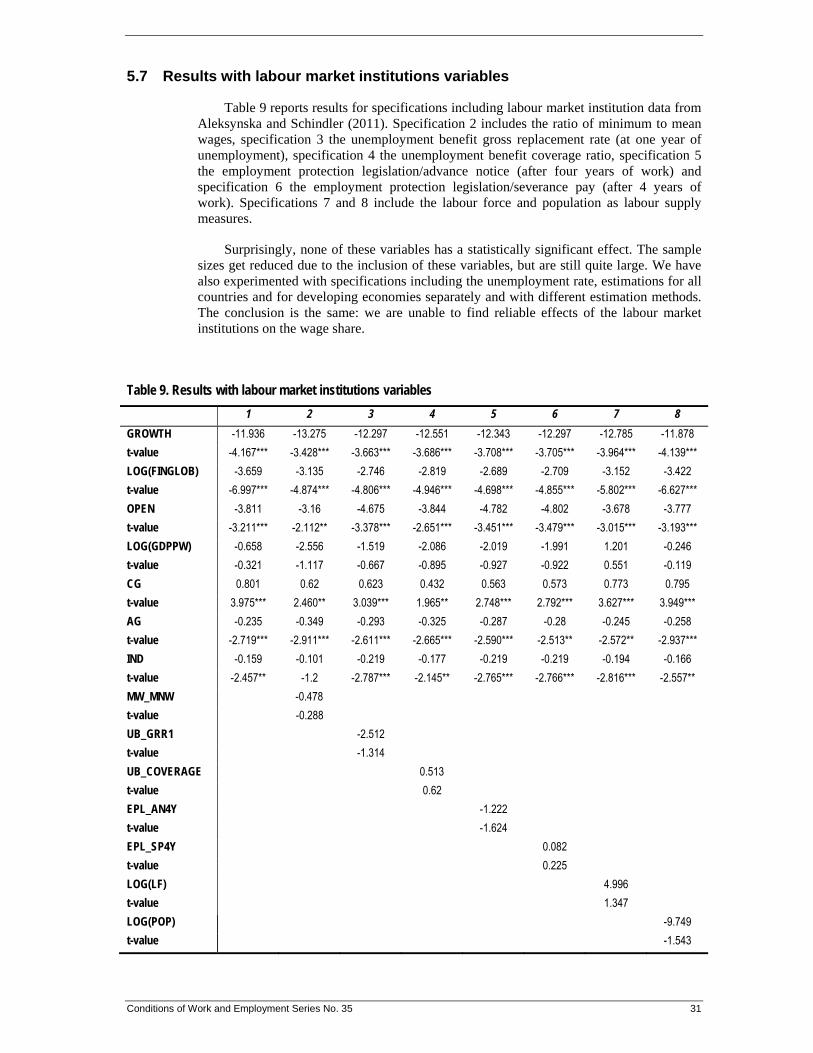
Conditions of Work and Employment Series No. 35 31
5.7 Results with labour market institutions variables
Table 9 reports results for specifications including labour market institution data from Aleksynska and Schindler (2011). Specification 2 includes the ratio of minimum to mean wages, specification 3 the unemployment benefit gross replacement rate (at one year of unemployment), specification 4 the unemployment benefit coverage ratio, specification 5 the employment protection legislation/advance notice (after four years of work) and specification 6 the employment protection legislation/severance pay (after 4 years of work). Specifications 7 and 8 include the labour force and population as labour supply measures.
Surprisingly, none of these variables has a statistically significant effect. The sample sizes get reduced due to the inclusion of these variables, but are still quite large. We have also experimented with specifications including the unemployment rate, estimations for all countries and for developing economies separately and with different estimation methods. The conclusion is the same: we are unable to find reliable effects of the labour market institutions on the wage share.
Table 9. Results with labour market institutions variables
1 2 3 4 5 6 7 8
GROWTH -11.936 -13.275 -12.297 -12.551 -12.343 -12.297 -12.785 -11.878
t-value -4.167*** -3.428*** -3.663*** -3.686*** -3.708*** -3.705*** -3.964*** -4.139***
LOG(FINGLOB) -3.659 -3.135 -2.746 -2.819 -2.689 -2.709 -3.152 -3.422
t-value -6.997*** -4.874*** -4.806*** -4.946*** -4.698*** -4.855*** -5.802*** -6.627***
OPEN -3.811 -3.16 -4.675 -3.844 -4.782 -4.802 -3.678 -3.777
t-value -3.211*** -2.112** -3.378*** -2.651*** -3.451*** -3.479*** -3.015*** -3.193***
LOG(GDPPW) -0.658 -2.556 -1.519 -2.086 -2.019 -1.991 1.201 -0.246
t-value -0.321 -1.117 -0.667 -0.895 -0.927 -0.922 0.551 -0.119
CG 0.801 0.62 0.623 0.432 0.563 0.573 0.773 0.795
t-value 3.975*** 2.460** 3.039*** 1.965** 2.748*** 2.792*** 3.627*** 3.949***
AG -0.235 -0.349 -0.293 -0.325 -0.287 -0.28 -0.245 -0.258
t-value -2.719*** -2.911*** -2.611*** -2.665*** -2.590*** -2.513** -2.572** -2.937***
IND -0.159 -0.101 -0.219 -0.177 -0.219 -0.219 -0.194 -0.166
t-value -2.457** -1.2 -2.787*** -2.145** -2.765*** -2.766*** -2.816*** -2.557**
MW_MNW -0.478
t-value -0.288
UB_GRR1 -2.512
t-value -1.314
UB_COVERAGE 0.513
t-value 0.62
EPL_AN4Y -1.222
t-value -1.624
EPL_SP4Y 0.082
t-value 0.225
LOG(LF) 4.996
t-value 1.347
LOG(POP) -9.749
t-value -1.543
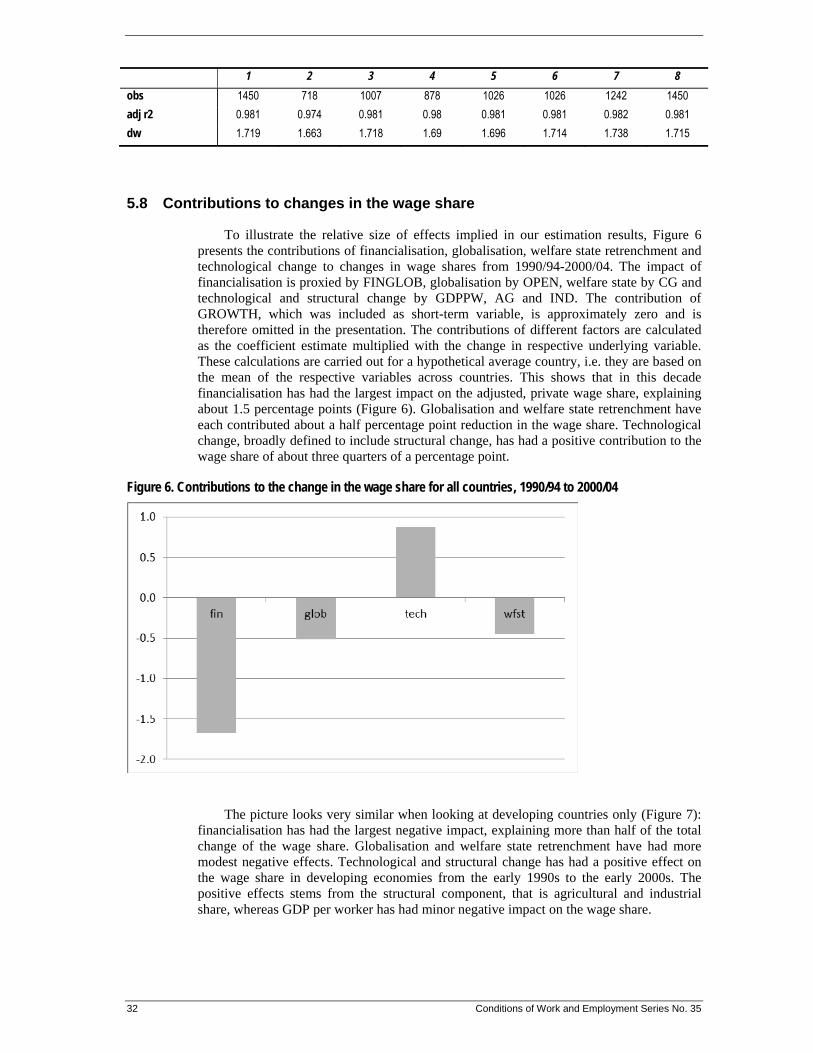
32 Conditions of Work and Employment Series No. 35
1 2 3 4 5 6 7 8
obs 1450 718 1007 878 1026 1026 1242 1450
adj r2 0.981 0.974 0.981 0.98 0.981 0.981 0.982 0.981
dw 1.719 1.663 1.718 1.69 1.696 1.714 1.738 1.715
5.8 Contributions to changes in the wage share
To illustrate the relative size of effects implied in our estimation results, Figure 6 presents the contributions of financialisation, globalisation, welfare state retrenchment and technological change to changes in wage shares from 1990/94-2000/04. The impact of financialisation is proxied by FINGLOB, globalisation by OPEN, welfare state by CG and technological and structural change by GDPPW, AG and IND. The contribution of GROWTH, which was included as short-term variable, is approximately zero and is therefore omitted in the presentation. The contributions of different factors are calculated as the coefficient estimate multiplied with the change in respective underlying variable. These calculations are carried out for a hypothetical average country, i.e. they are based on the mean of the respective variables across countries. This shows that in this decade financialisation has had the largest impact on the adjusted, private wage share, explaining about 1.5 percentage points (Figure 6). Globalisation and welfare state retrenchment have each contributed about a half percentage point reduction in the wage share. Technological change, broadly defined to include structural change, has had a positive contribution to the wage share of about three quarters of a percentage point.
Figure 6. Contributions to the change in the wage share for all countries, 1990/94 to 2000/04
The picture looks very similar when looking at developing countries only (Figure 7): financialisation has had the largest negative impact, explaining more than half of the total change of the wage share. Globalisation and welfare state retrenchment have had more modest negative effects. Technological and structural change has had a positive effect on the wage share in developing economies from the early 1990s to the early 2000s. The positive effects stems from the structural component, that is agricultural and industrial share, whereas GDP per worker has had minor negative impact on the wage share.
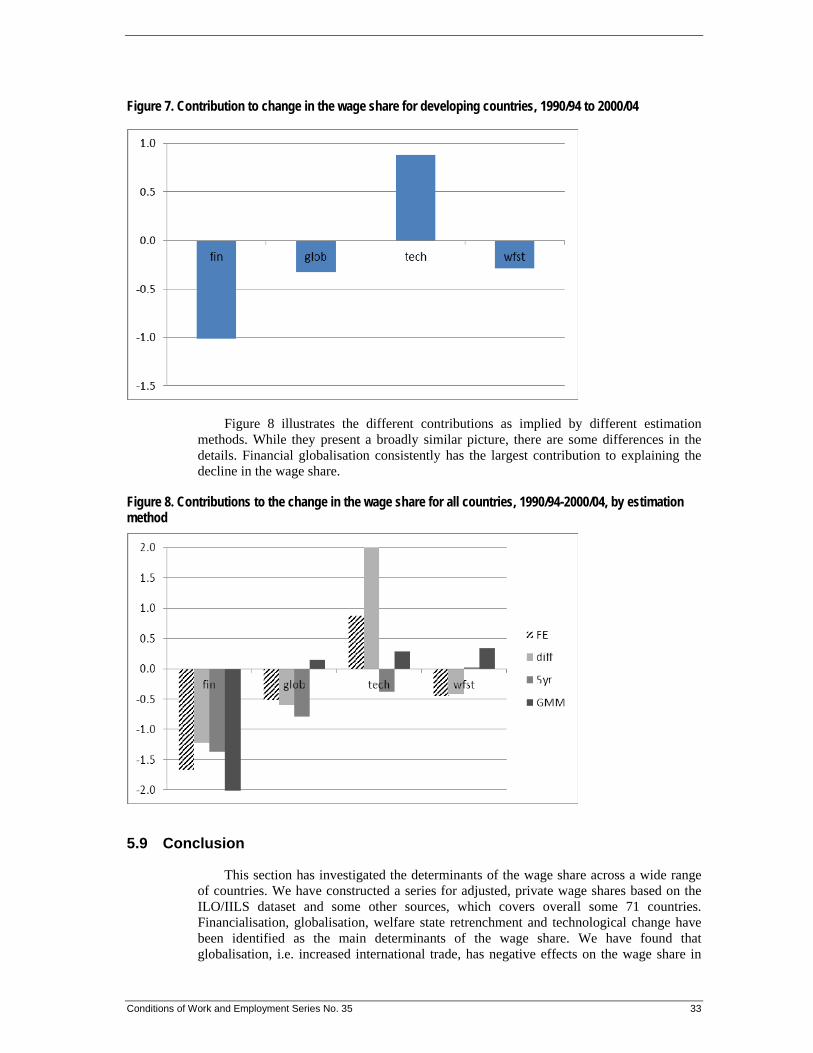
Conditions of Work and Employment Series No. 35 33
Figure 7. Contribution to change in the wage share for developing countries, 1990/94 to 2000/04
Figure 8 illustrates the different contributions as implied by different estimation methods. While they present a broadly similar picture, there are some differences in the details. Financial globalisation consistently has the largest contribution to explaining the decline in the wage share.
Figure 8. Contributions to the change in the wage share for all countries, 1990/94-2000/04, by estimation method
5.9 Conclusion
This section has investigated the determinants of the wage share across a wide range of countries. We have constructed a series for adjusted, private wage shares based on the ILO/IILS dataset and some other sources, which covers overall some 71 countries. Financialisation, globalisation, welfare state retrenchment and technological change have been identified as the main determinants of the wage share. We have found that globalisation, i.e. increased international trade, has negative effects on the wage share in
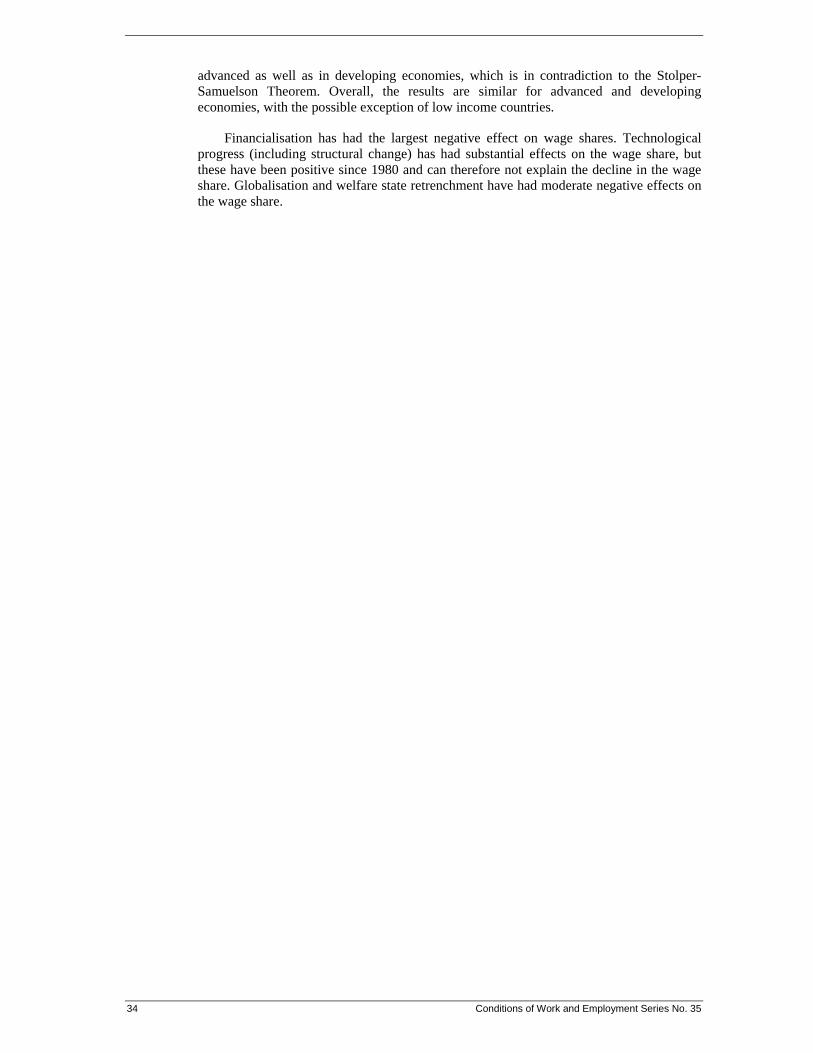
34 Conditions of Work and Employment Series No. 35
advanced as well as in developing economies, which is in contradiction to the Stolper-Samuelson Theorem. Overall, the results are similar for advanced and developing economies, with the possible exception of low income countries.
Financialisation has had the largest negative effect on wage shares. Technological progress (including structural change) has had substantial effects on the wage share, but these have been positive since 1980 and can therefore not explain the decline in the wage share. Globalisation and welfare state retrenchment have had moderate negative effects on the wage share.
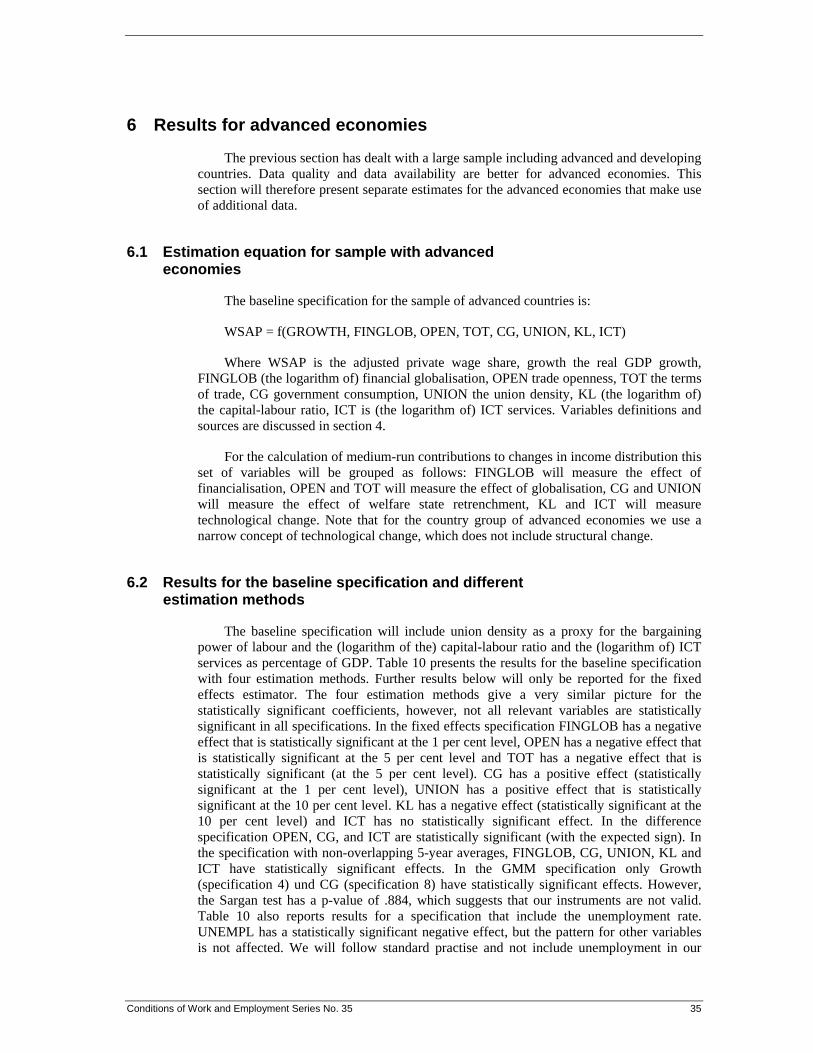
Conditions of Work and Employment Series No. 35 35
6 Results for advanced economies
The previous section has dealt with a large sample including advanced and developing countries. Data quality and data availability are better for advanced economies. This section will therefore present separate estimates for the advanced economies that make use of additional data.
6.1 Estimation equation for sample with advanced economies
The baseline specification for the sample of advanced countries is:
WSAP = f(GROWTH, FINGLOB, OPEN, TOT, CG, UNION, KL, ICT)
Where WSAP is the adjusted private wage share, growth the real GDP growth, FINGLOB (the logarithm of) financial globalisation, OPEN trade openness, TOT the terms of trade, CG government consumption, UNION the union density, KL (the logarithm of) the capital-labour ratio, ICT is (the logarithm of) ICT services. Variables definitions and sources are discussed in section 4.
For the calculation of medium-run contributions to changes in income distribution this set of variables will be grouped as follows: FINGLOB will measure the effect of financialisation, OPEN and TOT will measure the effect of globalisation, CG and UNION will measure the effect of welfare state retrenchment, KL and ICT will measure technological change. Note that for the country group of advanced economies we use a narrow concept of technological change, which does not include structural change.
6.2 Results for the baseline specification and different estimation methods
The baseline specification will include union density as a proxy for the bargaining power of labour and the (logarithm of the) capital-labour ratio and the (logarithm of) ICT services as percentage of GDP. Table 10 presents the results for the baseline specification with four estimation methods. Further results below will only be reported for the fixed effects estimator. The four estimation methods give a very similar picture for the statistically significant coefficients, however, not all relevant variables are statistically significant in all specifications. In the fixed effects specification FINGLOB has a negative effect that is statistically significant at the 1 per cent level, OPEN has a negative effect that is statistically significant at the 5 per cent level and TOT has a negative effect that is statistically significant (at the 5 per cent level). CG has a positive effect (statistically significant at the 1 per cent level), UNION has a positive effect that is statistically significant at the 10 per cent level. KL has a negative effect (statistically significant at the 10 per cent level) and ICT has no statistically significant effect. In the difference specification OPEN, CG, and ICT are statistically significant (with the expected sign). In the specification with non-overlapping 5-year averages, FINGLOB, CG, UNION, KL and ICT have statistically significant effects. In the GMM specification only Growth (specification 4) und CG (specification 8) have statistically significant effects. However, the Sargan test has a p-value of .884, which suggests that our instruments are not valid. Table 10 also reports results for a specification that include the unemployment rate. UNEMPL has a statistically significant negative effect, but the pattern for other variables is not affected. We will follow standard practise and not include unemployment in our
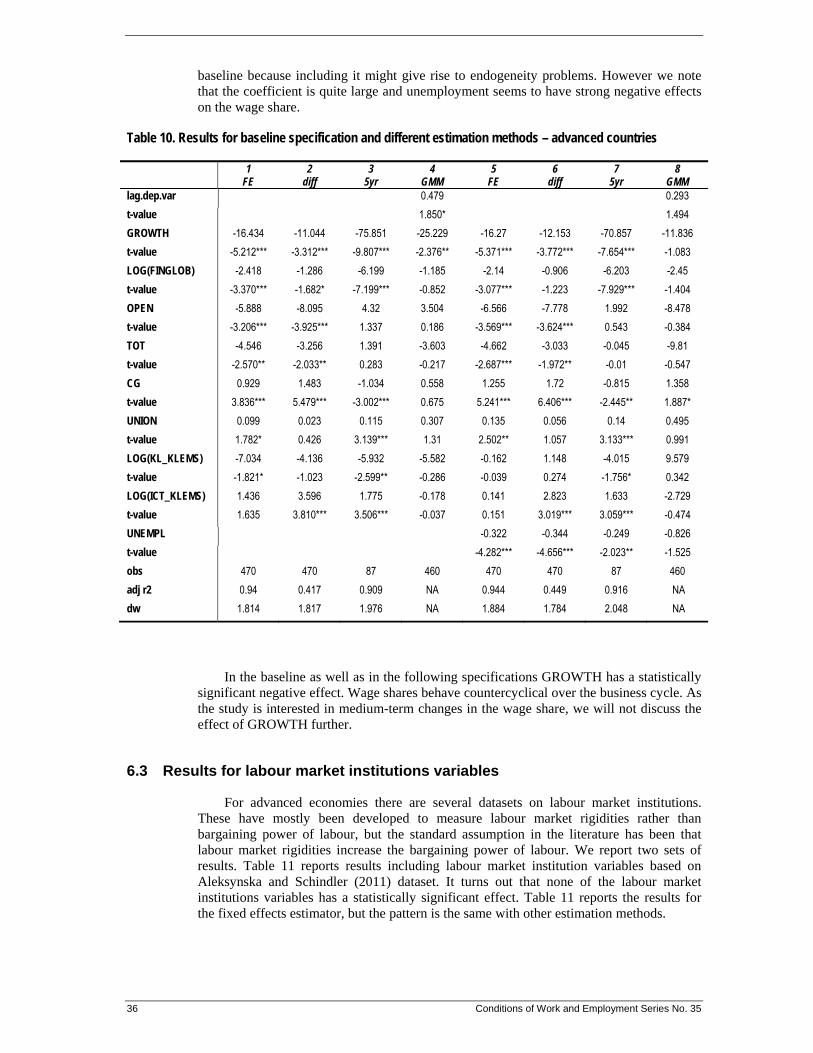
36 Conditions of Work and Employment Series No. 35
baseline because including it might give rise to endogeneity problems. However we note that the coefficient is quite large and unemployment seems to have strong negative effects on the wage share.
Table 10. Results for baseline specification and different estimation methods – advanced countries
1 FE
2 diff
3 5yr
4 GMM
5 FE
6 diff
7 5yr
8 GMM
lag.dep.var 0.479 0.293
t-value 1.850* 1.494
GROWTH -16.434 -11.044 -75.851 -25.229 -16.27 -12.153 -70.857 -11.836
t-value -5.212*** -3.312*** -9.807*** -2.376** -5.371*** -3.772*** -7.654*** -1.083
LOG(FINGLOB) -2.418 -1.286 -6.199 -1.185 -2.14 -0.906 -6.203 -2.45
t-value -3.370*** -1.682* -7.199*** -0.852 -3.077*** -1.223 -7.929*** -1.404
OPEN -5.888 -8.095 4.32 3.504 -6.566 -7.778 1.992 -8.478
t-value -3.206*** -3.925*** 1.337 0.186 -3.569*** -3.624*** 0.543 -0.384
TOT -4.546 -3.256 1.391 -3.603 -4.662 -3.033 -0.045 -9.81
t-value -2.570** -2.033** 0.283 -0.217 -2.687*** -1.972** -0.01 -0.547
CG 0.929 1.483 -1.034 0.558 1.255 1.72 -0.815 1.358
t-value 3.836*** 5.479*** -3.002*** 0.675 5.241*** 6.406*** -2.445** 1.887*
UNION 0.099 0.023 0.115 0.307 0.135 0.056 0.14 0.495
t-value 1.782* 0.426 3.139*** 1.31 2.502** 1.057 3.133*** 0.991
LOG(KL_KLEMS) -7.034 -4.136 -5.932 -5.582 -0.162 1.148 -4.015 9.579
t-value -1.821* -1.023 -2.599** -0.286 -0.039 0.274 -1.756* 0.342
LOG(ICT_KLEMS) 1.436 3.596 1.775 -0.178 0.141 2.823 1.633 -2.729
t-value 1.635 3.810*** 3.506*** -0.037 0.151 3.019*** 3.059*** -0.474
UNEMPL -0.322 -0.344 -0.249 -0.826
t-value -4.282*** -4.656*** -2.023** -1.525
obs 470 470 87 460 470 470 87 460
adj r2 0.94 0.417 0.909 NA 0.944 0.449 0.916 NA
dw 1.814 1.817 1.976 NA 1.884 1.784 2.048 NA
In the baseline as well as in the following specifications GROWTH has a statistically significant negative effect. Wage shares behave countercyclical over the business cycle. As the study is interested in medium-term changes in the wage share, we will not discuss the effect of GROWTH further.
6.3 Results for labour market institutions variables
For advanced economies there are several datasets on labour market institutions. These have mostly been developed to measure labour market rigidities rather than bargaining power of labour, but the standard assumption in the literature has been that labour market rigidities increase the bargaining power of labour. We report two sets of results. Table 11 reports results including labour market institution variables based on Aleksynska and Schindler (2011) dataset. It turns out that none of the labour market institutions variables has a statistically significant effect. Table 11 reports the results for the fixed effects estimator, but the pattern is the same with other estimation methods.
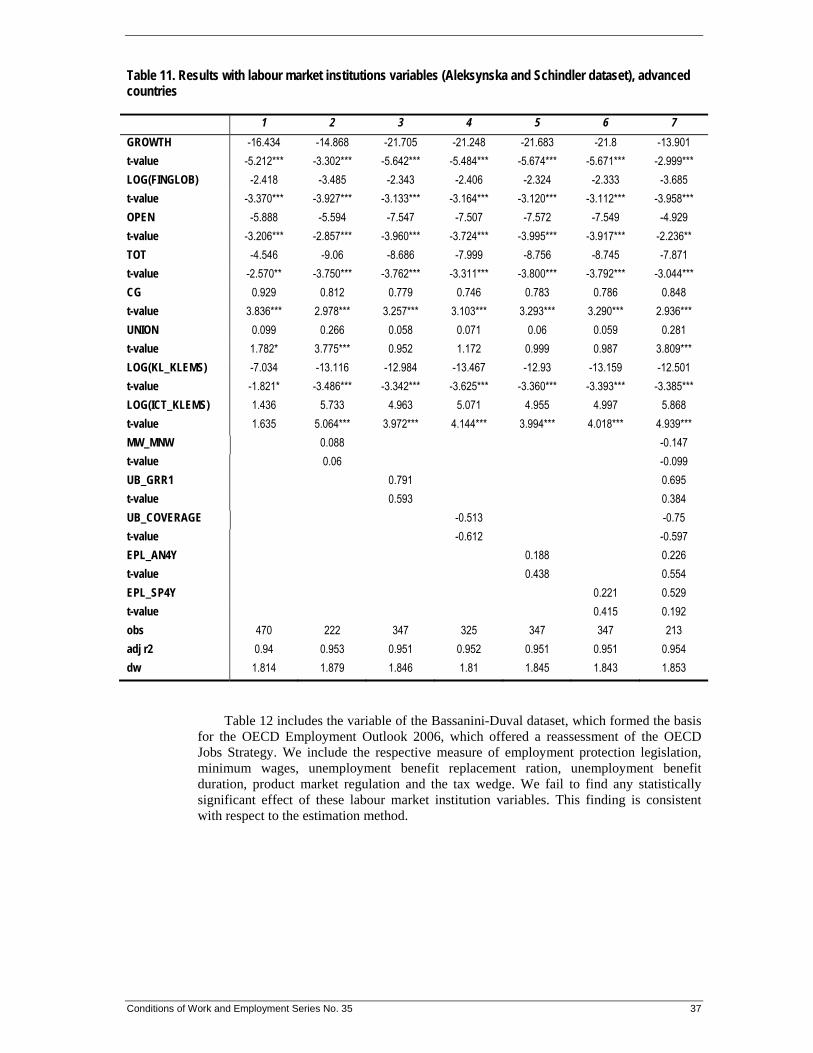
Conditions of Work and Employment Series No. 35 37
Table 11. Results with labour market institutions variables (Aleksynska and Schindler dataset), advanced countries
1 2 3 4 5 6 7
GROWTH -16.434 -14.868 -21.705 -21.248 -21.683 -21.8 -13.901
t-value -5.212*** -3.302*** -5.642*** -5.484*** -5.674*** -5.671*** -2.999***
LOG(FINGLOB) -2.418 -3.485 -2.343 -2.406 -2.324 -2.333 -3.685
t-value -3.370*** -3.927*** -3.133*** -3.164*** -3.120*** -3.112*** -3.958***
OPEN -5.888 -5.594 -7.547 -7.507 -7.572 -7.549 -4.929
t-value -3.206*** -2.857*** -3.960*** -3.724*** -3.995*** -3.917*** -2.236**
TOT -4.546 -9.06 -8.686 -7.999 -8.756 -8.745 -7.871
t-value -2.570** -3.750*** -3.762*** -3.311*** -3.800*** -3.792*** -3.044***
CG 0.929 0.812 0.779 0.746 0.783 0.786 0.848
t-value 3.836*** 2.978*** 3.257*** 3.103*** 3.293*** 3.290*** 2.936***
UNION 0.099 0.266 0.058 0.071 0.06 0.059 0.281
t-value 1.782* 3.775*** 0.952 1.172 0.999 0.987 3.809***
LOG(KL_KLEMS) -7.034 -13.116 -12.984 -13.467 -12.93 -13.159 -12.501
t-value -1.821* -3.486*** -3.342*** -3.625*** -3.360*** -3.393*** -3.385***
LOG(ICT_KLEMS) 1.436 5.733 4.963 5.071 4.955 4.997 5.868
t-value 1.635 5.064*** 3.972*** 4.144*** 3.994*** 4.018*** 4.939***
MW_MNW 0.088 -0.147
t-value 0.06 -0.099
UB_GRR1 0.791 0.695
t-value 0.593 0.384
UB_COVERAGE -0.513 -0.75
t-value -0.612 -0.597
EPL_AN4Y 0.188 0.226
t-value 0.438 0.554
EPL_SP4Y 0.221 0.529
t-value 0.415 0.192
obs 470 222 347 325 347 347 213
adj r2 0.94 0.953 0.951 0.952 0.951 0.951 0.954
dw 1.814 1.879 1.846 1.81 1.845 1.843 1.853
Table 12 includes the variable of the Bassanini-Duval dataset, which formed the basis for the OECD Employment Outlook 2006, which offered a reassessment of the OECD Jobs Strategy. We include the respective measure of employment protection legislation, minimum wages, unemployment benefit replacement ration, unemployment benefit duration, product market regulation and the tax wedge. We fail to find any statistically significant effect of these labour market institution variables. This finding is consistent with respect to the estimation method.
38 Conditions of Work and Employment Series No. 35
Table 12. Results with labour market institutions variables (Bassanini and Duval dataset), advanced countries 1 2 3 4 5 6 7
GROWTH -16.434 -21.529 -22.021 -21.782 -21.792 -21.287 -20.991
t-value -5.212*** -5.100*** -5.155*** -5.109*** -5.133*** -4.961*** -4.956***
LOG(FINGLOB) -2.418 -2.425 -2.455 -2.471 -2.389 -2.466 -2.513
t-value -3.370*** -3.109*** -3.112*** -3.140*** -3.051*** -3.131*** -3.173***
OPEN -5.888 -6.816 -6.917 -6.908 -6.983 -6.93 -6.593
t-value -3.206*** -3.352*** -3.417*** -3.398*** -3.431*** -3.392*** -3.215***
TOT -4.546 -7.591 -7.671 -7.496 -7.509 -7.569 -7.653
t-value -2.570** -3.221*** -3.204*** -3.158*** -3.152*** -3.193*** -3.238***
CG 0.929 0.962 0.93 0.94 0.932 0.962 0.975
t-value 3.836*** 3.692*** 3.522*** 3.573*** 3.567*** 3.658*** 3.746***
UNION 0.099 0.02 0.019 0.014 0.019 0.02 0.023
t-value 1.782* 0.325 0.308 0.222 0.311 0.32 0.367
LOG(KL_KLEMS) -7.034 -14.982 -14.754 -14.95 -14.595 -15.359 -14.385
t-value -1.821* -3.632*** -3.580*** -3.585*** -3.551*** -3.684*** -3.452***
LOG(ICT_KLEMS) 1.436 5.266 5.021 5.079 5.255 5.122 5.334
t-value 1.635 4.068*** 3.969*** 3.966*** 4.109*** 4.019*** 4.040***
EPL_BD 0.505 0.546
t-value 1.125 1.166
BENDUR_BD -0.74 -0.568
t-value -1.076 -0.806
GRR_BD 0.017 0.016
t-value 0.843 0.785
PMR_BD 0.188 0.132
t-value 0.628 0.433
TW_BD -0.038 -0.035
t-value -0.933 -0.845
obs 470 319 319 319 319 319 319
adj r2 0.94 0.949 0.949 0.949 0.949 0.949 0.949
dw 1.814 1.692 1.688 1.687 1.679 1.697 1.697
6.4 Results for financial reform variables
Table 13 includes the variables that make up the IMF financial reform dataset, which consists of categorical variables. We find few statistically significant effects. Financial reforms in the area of interest rate ceilings has a statistically significant (at the 5 per cent level) negative effect. The other financial reform variables do not have statistically significant effects.
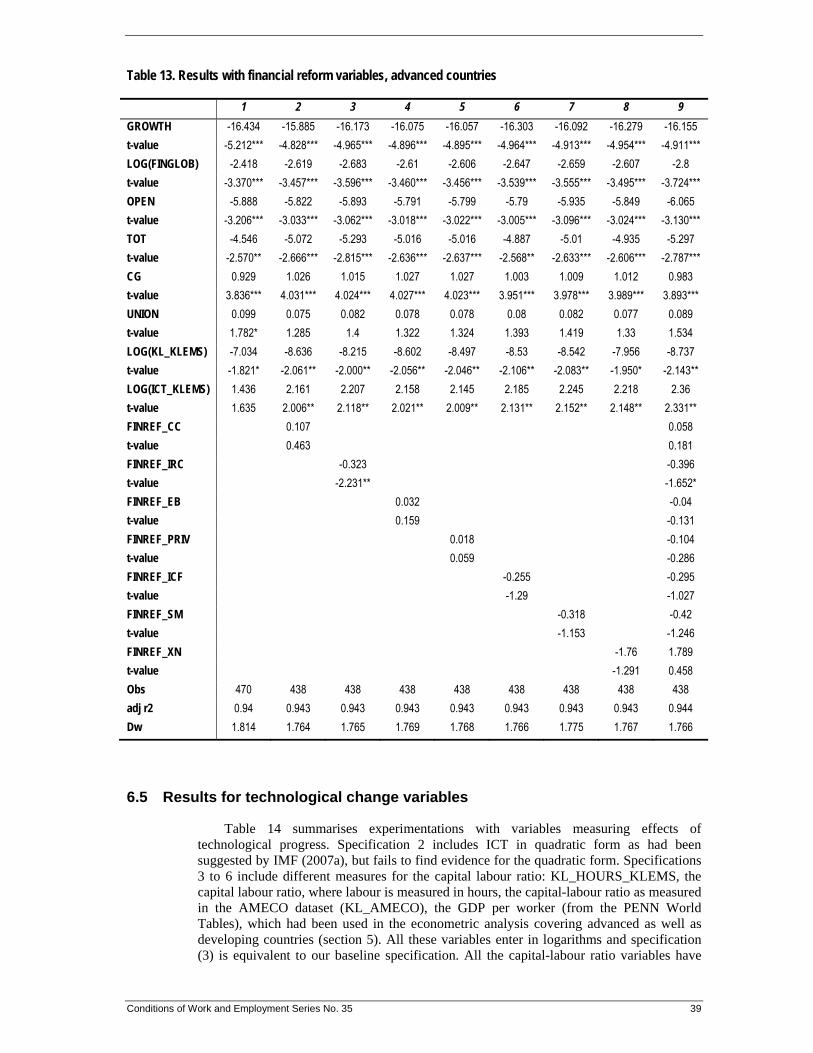
Conditions of Work and Employment Series No. 35 39
Table 13. Results with financial reform variables, advanced countries
1 2 3 4 5 6 7 8 9
GROWTH -16.434 -15.885 -16.173 -16.075 -16.057 -16.303 -16.092 -16.279 -16.155
t-value -5.212*** -4.828*** -4.965*** -4.896*** -4.895*** -4.964*** -4.913*** -4.954*** -4.911***
LOG(FINGLOB) -2.418 -2.619 -2.683 -2.61 -2.606 -2.647 -2.659 -2.607 -2.8
t-value -3.370*** -3.457*** -3.596*** -3.460*** -3.456*** -3.539*** -3.555*** -3.495*** -3.724***
OPEN -5.888 -5.822 -5.893 -5.791 -5.799 -5.79 -5.935 -5.849 -6.065
t-value -3.206*** -3.033*** -3.062*** -3.018*** -3.022*** -3.005*** -3.096*** -3.024*** -3.130***
TOT -4.546 -5.072 -5.293 -5.016 -5.016 -4.887 -5.01 -4.935 -5.297
t-value -2.570** -2.666*** -2.815*** -2.636*** -2.637*** -2.568** -2.633*** -2.606*** -2.787***
CG 0.929 1.026 1.015 1.027 1.027 1.003 1.009 1.012 0.983
t-value 3.836*** 4.031*** 4.024*** 4.027*** 4.023*** 3.951*** 3.978*** 3.989*** 3.893***
UNION 0.099 0.075 0.082 0.078 0.078 0.08 0.082 0.077 0.089
t-value 1.782* 1.285 1.4 1.322 1.324 1.393 1.419 1.33 1.534
LOG(KL_KLEMS) -7.034 -8.636 -8.215 -8.602 -8.497 -8.53 -8.542 -7.956 -8.737
t-value -1.821* -2.061** -2.000** -2.056** -2.046** -2.106** -2.083** -1.950* -2.143**
LOG(ICT_KLEMS) 1.436 2.161 2.207 2.158 2.145 2.185 2.245 2.218 2.36
t-value 1.635 2.006** 2.118** 2.021** 2.009** 2.131** 2.152** 2.148** 2.331**
FINREF_CC 0.107 0.058
t-value 0.463 0.181
FINREF_IRC -0.323 -0.396
t-value -2.231** -1.652*
FINREF_EB 0.032 -0.04
t-value 0.159 -0.131
FINREF_PRIV 0.018 -0.104
t-value 0.059 -0.286
FINREF_ICF -0.255 -0.295
t-value -1.29 -1.027
FINREF_SM -0.318 -0.42
t-value -1.153 -1.246
FINREF_XN -1.76 1.789
t-value -1.291 0.458
Obs 470 438 438 438 438 438 438 438 438
adj r2 0.94 0.943 0.943 0.943 0.943 0.943 0.943 0.943 0.944
Dw 1.814 1.764 1.765 1.769 1.768 1.766 1.775 1.767 1.766
6.5 Results for technological change variables
Table 14 summarises experimentations with variables measuring effects of technological progress. Specification 2 includes ICT in quadratic form as had been suggested by IMF (2007a), but fails to find evidence for the quadratic form. Specifications 3 to 6 include different measures for the capital labour ratio: KL_HOURS_KLEMS, the capital labour ratio, where labour is measured in hours, the capital-labour ratio as measured in the AMECO dataset (KL_AMECO), the GDP per worker (from the PENN World Tables), which had been used in the econometric analysis covering advanced as well as developing countries (section 5). All these variables enter in logarithms and specification (3) is equivalent to our baseline specification. All the capital-labour ratio variables have
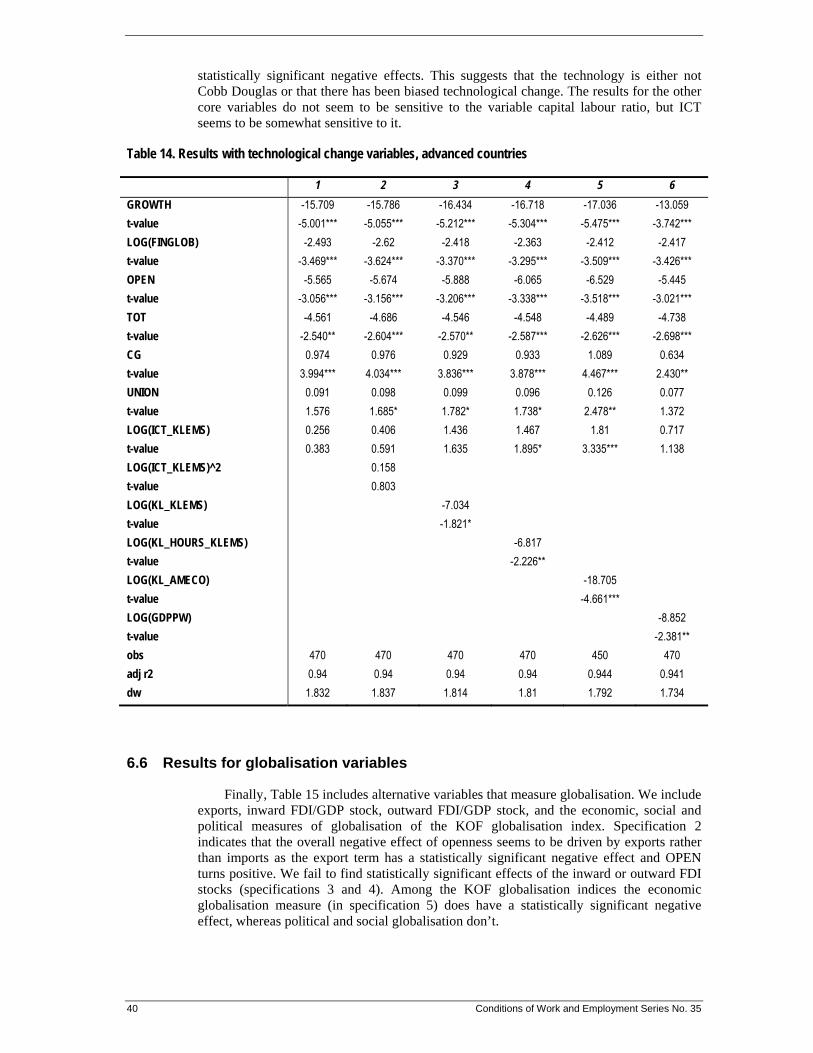
40 Conditions of Work and Employment Series No. 35
statistically significant negative effects. This suggests that the technology is either not Cobb Douglas or that there has been biased technological change. The results for the other core variables do not seem to be sensitive to the variable capital labour ratio, but ICT seems to be somewhat sensitive to it.
Table 14. Results with technological change variables, advanced countries
1 2 3 4 5 6
GROWTH -15.709 -15.786 -16.434 -16.718 -17.036 -13.059
t-value -5.001*** -5.055*** -5.212*** -5.304*** -5.475*** -3.742***
LOG(FINGLOB) -2.493 -2.62 -2.418 -2.363 -2.412 -2.417
t-value -3.469*** -3.624*** -3.370*** -3.295*** -3.509*** -3.426***
OPEN -5.565 -5.674 -5.888 -6.065 -6.529 -5.445
t-value -3.056*** -3.156*** -3.206*** -3.338*** -3.518*** -3.021***
TOT -4.561 -4.686 -4.546 -4.548 -4.489 -4.738
t-value -2.540** -2.604*** -2.570** -2.587*** -2.626*** -2.698***
CG 0.974 0.976 0.929 0.933 1.089 0.634
t-value 3.994*** 4.034*** 3.836*** 3.878*** 4.467*** 2.430**
UNION 0.091 0.098 0.099 0.096 0.126 0.077
t-value 1.576 1.685* 1.782* 1.738* 2.478** 1.372
LOG(ICT_KLEMS) 0.256 0.406 1.436 1.467 1.81 0.717
t-value 0.383 0.591 1.635 1.895* 3.335*** 1.138
LOG(ICT_KLEMS)^2 0.158
t-value 0.803
LOG(KL_KLEMS) -7.034
t-value -1.821*
LOG(KL_HOURS_KLEMS) -6.817
t-value -2.226**
LOG(KL_AMECO) -18.705
t-value -4.661***
LOG(GDPPW) -8.852
t-value -2.381**
obs 470 470 470 470 450 470
adj r2 0.94 0.94 0.94 0.94 0.944 0.941
dw 1.832 1.837 1.814 1.81 1.792 1.734
6.6 Results for globalisation variables
Finally, Table 15 includes alternative variables that measure globalisation. We include exports, inward FDI/GDP stock, outward FDI/GDP stock, and the economic, social and political measures of globalisation of the KOF globalisation index. Specification 2 indicates that the overall negative effect of openness seems to be driven by exports rather than imports as the export term has a statistically significant negative effect and OPEN turns positive. We fail to find statistically significant effects of the inward or outward FDI stocks (specifications 3 and 4). Among the KOF globalisation indices the economic globalisation measure (in specification 5) does have a statistically significant negative effect, whereas political and social globalisation don’t.
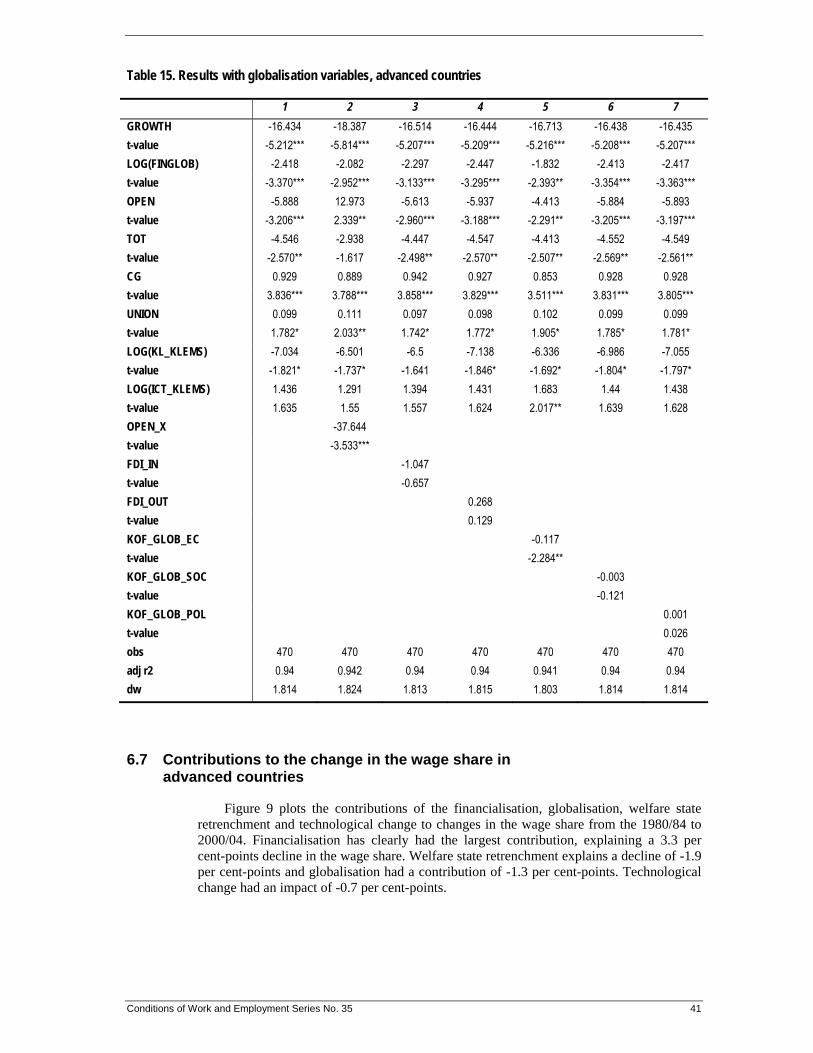
Conditions of Work and Employment Series No. 35 41
Table 15. Results with globalisation variables, advanced countries
1 2 3 4 5 6 7
GROWTH -16.434 -18.387 -16.514 -16.444 -16.713 -16.438 -16.435
t-value -5.212*** -5.814*** -5.207*** -5.209*** -5.216*** -5.208*** -5.207***
LOG(FINGLOB) -2.418 -2.082 -2.297 -2.447 -1.832 -2.413 -2.417
t-value -3.370*** -2.952*** -3.133*** -3.295*** -2.393** -3.354*** -3.363***
OPEN -5.888 12.973 -5.613 -5.937 -4.413 -5.884 -5.893
t-value -3.206*** 2.339** -2.960*** -3.188*** -2.291** -3.205*** -3.197***
TOT -4.546 -2.938 -4.447 -4.547 -4.413 -4.552 -4.549
t-value -2.570** -1.617 -2.498** -2.570** -2.507** -2.569** -2.561**
CG 0.929 0.889 0.942 0.927 0.853 0.928 0.928
t-value 3.836*** 3.788*** 3.858*** 3.829*** 3.511*** 3.831*** 3.805***
UNION 0.099 0.111 0.097 0.098 0.102 0.099 0.099
t-value 1.782* 2.033** 1.742* 1.772* 1.905* 1.785* 1.781*
LOG(KL_KLEMS) -7.034 -6.501 -6.5 -7.138 -6.336 -6.986 -7.055
t-value -1.821* -1.737* -1.641 -1.846* -1.692* -1.804* -1.797*
LOG(ICT_KLEMS) 1.436 1.291 1.394 1.431 1.683 1.44 1.438
t-value 1.635 1.55 1.557 1.624 2.017** 1.639 1.628
OPEN_X -37.644
t-value -3.533***
FDI_IN -1.047
t-value -0.657
FDI_OUT 0.268
t-value 0.129
KOF_GLOB_EC -0.117
t-value -2.284**
KOF_GLOB_SOC -0.003
t-value -0.121
KOF_GLOB_POL 0.001
t-value 0.026
obs 470 470 470 470 470 470 470
adj r2 0.94 0.942 0.94 0.94 0.941 0.94 0.94
dw 1.814 1.824 1.813 1.815 1.803 1.814 1.814
6.7 Contributions to the change in the wage share in advanced countries
Figure 9 plots the contributions of the financialisation, globalisation, welfare state retrenchment and technological change to changes in the wage share from the 1980/84 to 2000/04. Financialisation has clearly had the largest contribution, explaining a 3.3 per cent-points decline in the wage share. Welfare state retrenchment explains a decline of -1.9 per cent-points and globalisation had a contribution of -1.3 per cent-points. Technological change had an impact of -0.7 per cent-points.

42 Conditions of Work and Employment Series No. 35
Figure 9. Contributions to the change in the wage share for advanced countries, 1980/84 -2000/4
Figure 10 plots the contribution to changes in the wage share in advanced economies in the period 1980/84 to 2000/04 for different estimation methods. The effects of financialisation are consistently negative across all four estimation methods. Globalisation has more modest effects, including positive contributions with some estimation methods. Welfare state retrenchment has consistent negative effects. The contribution of technological change varies substantially in size as well as with respect to the sign of the contribution. We thus conclude that financialisation and welfare state retrenchment have had robust negative contributions to the decline in the wage share, whereas the contribution of globalisation and technological changes is harder to pin down for advanced economies.
Figure 10. Contributions to the change in the wage share for advanced countries, 1980/84 -2000/04, by estimation method
‐8.0
‐6.0
‐4.0
‐2.0
0.0
2.0
4.0
6.0
fin glob tech wfst
FE
diff
5yr
GMM
Conditions of Work and Employment Series No. 35 43
7 Conclusion
Functional income distribution has changed substantially in the course of the last three decades. Wage shares have declined in all OECD countries. This is part of a broader trend towards greater social inequality. While the picture is somewhat less homogenous in developing and emerging economies, it is clear that in most of these countries wage shares have also declined. Financialisation, globalisation, welfare state retrenchment and technological change have been identified as possible causes for these changes in income distribution.
The aim of this study has been to investigate the relative impact of financialisation, globalisation, welfare state retrenchment and technological change on functional income distribution. To this end we constructed a dataset covering up to 71 countries (28 advanced and 43 developing and emerging economies) from 1970 to 2007.
Our results indicate that financialisation has been the main cause of the decline in the wage share. There have also been substantial negative effects from globalisation and from welfare state retrenchment. Technological (and structural) change has had positive effects in developing countries. Notably, we find that globalisation has had negative effects on income distribution in developing as well as in advanced economies, which contradicts the Stolper-Samuelson theorem.
We have also presented further results for advanced economies where data availability is better. This confirms our findings for the larger country group. Financialisation emerges as the single most important cause for the decline in the wage share. Welfare state retrenchment and globalisation has had negative effects on the wage share. For advanced economies we also find modest negative effects of technological change in the wage share.
The results of this study clearly refute two widely held views about income distribution. First the view that changes in income distribution in advanced economies have mainly been driven by technological change. This is not correct. While technological change has had a negative effect on wage shares in developed economies, this effect is smaller than that of other factors and it is also very robust. Second, the Stolper-Samuelson prediction that globalisation would benefit workers in developing and emerging economies does not hold. We fail to find statistically different effects in advanced and developing economies and we find an overall negative contribution of globalisation on wage shares in developing economies. The Stolper Samuelson theorem does not apply empirically in the past thirty years.
These findings have important implications for economic and social policy. They suggest that income distribution is not primarily determined by technological progress, but rather depends on social institutions and on the structure of the financial system. Strengthening the welfare state, in particular changing union legislation to foster collective bargaining and financial regulation could help increase the wage share with little if any costs in terms of economic efficiency.
44 Conditions of Work and Employment Series No. 35
References
Aghion, P., Caroli, E., Garcia-Penalosa, C. 1999. Inequality and economic growth: the perspective of the new growth theories. Journal of Economic Literature, 37 (4): 1615-1660.
Amsden, A, van der Hoeven, 1996. Manufacturing output, employment and real wages in teh 1980s: labour’s loss until century’s end. Journal of Development Studies 32, 4: 506-30
Arellano, M, Bond, S, 1991. Some tests of specification for panel data: Monte Carlo evidence and an application to employment equations. Review of Economic Studies 58: 277–297.
Arestis, P, Baddeley, M, Sawyer, M, 2007. The relationship between capital stock, unemployment and wages in nine EMU countries. Bulletin of Economic Research 59, (2): 125-148
Argitis, G., Pitelis, C. (2001), ‘Monetary policy and the distribution of income: evidence for the United States and the United Kingdom’, Journal of Post Keynesian Economics, 23, 617-638.
Atkinson, A, Piketty, T, (eds) 2007. Top Incomes Over the Twentieth Century: A Contrast Between European and English-Speaking Countries. Oxford: Oxford University Press
Atkinson, A., Piketty, T., Saez, E. 2011. Top incomes in the long run of history. Journal of Economic Literature, 49 (1): 3-71.
Autor, David; Katz, Lawrence; and Krueger, Alan B (1999). “Computing Inequality: Have Computers Changed the Labor Market?” Quarterly Journal of Economics 113 1169–1214
Azmat, G, Manning, A, Van Reenen, J, 2007. Privatization, entry regulation and the decline of labour's share of GDP: A cross-country analysis of the network industries. CEPR Discussion Paper No. DP6348
Baker, D., Glyn, A., Howell, D. and Schmitt, J. 2005. Labor market institutions and unemployment: a critical assessment of the cross-country evidence, in Howell, D. (ed.), Fighting Unemployment. The Limits for Free Market Orthodoxy, Oxford, Oxford University
Beck, Nathaniel and Jonathan N. Katz (1995). “What to Do (and Not to Do) With Time-series Cross-section Data,” American Political Science Review, 89(3), 634-647
Bentolila, S., Saint-Paul, G., 2003, Explaining movements in the labor share, Contribution to Macroeconomics, Vol. 3, Issue 1 (Berkeley, California Berkeley Press).
Blundell, R., Bond, S., 1998. Initial conditions and moment restrictions in dynamic panel data models. Journal of Econometrics 87, 115–143.
Card, David and John E. DiNardo, 2002. "Skill-Based Technological Change And Rising Wage Inequality: Some Problems And Puzzles," Journal of Labor Economics, 20 (4), 733-783
Cornia, G, (2004). Inequality, growth and poverty in tan era of liberalization and globalization. Oxford: Oxford University Press
Daudey, Emilie and García-Peñalosa, Cecilia 2007. 'The personal and the factor distributions of income in a cross-section of countries', Journal of Development Studies, 43: 5, 812 — 829
Dreher, Axel (2006). Does Globalization Affect Growth? Evidence from a new Index of Globalization, Applied Economics 38, 10: 1091-1110
Conditions of Work and Employment Series No. 35 45
Duménil, G, Lévy, D, 2001. Costs and benefits of Neoliberalism: a class analysis. Review of International Political Economy 8 (4), 578-607
Duménil, G, Lévy, D, 2004. Capital Resurgent. Roots of the Neoliberal Revolution. Cambridge, MA: Harvard University Press
Ellis, L, Smith, K, 2007. The global upward trend in the profit share. BIS Working Paper No. 231
Epstein, G, Burke, S, 2001 Threat effects and the internationalization of production. Political Economy Research Institute Working Papers 15
Epstein, G, Jayadev, A, 2005. The rise of rentier incomes in OECD countries: financialization, Central Bank policy and labor solidarity In: G. Epstein (ed): Financialization and the World Economy. Cheltenham: Edward Elgar
Ertürk, Ismail, Julie Froud, Sukhdev Johal, Adam Leaver, and Karel Williams (eds.) 2008. Financialization At Work. Key Texts and Commentary. London: Routledge
European Commission 2007. The labour income share in the European Union. Chapter 5 of: Employment in Europe
Feenstra, R. C., Hanson, G. H. (1996), ‘Foreign direct investment, outsourcing, and relative wages’, National Bureau of Economic Research, Working Paper No. 5121.
Feenstra, R. C., Hanson, G. H. (1997), ‘Foreign direct investment and relative wages: evidence from Mexico’s maquiladoras’, Journal of International Economics 42 (3–4), pp. 371–93.
Feenstra, R. C., Hanson, G. H. (1999), ‘The impact of outsourcing and high-technology capital on wages: estimates for the United States, 1979-1990’, Quarterly Journal of Economics, 114 (3), pp. 907-940.
Friedman, M, 1977. Inflation and unemployment. Journal of Political Economy 85 (3): 451-472
Goldberg, P, Pavcnik, N, 2007. Distributional Effects of Globalization in Developing Countries. Journal of Economic Literature, 45(1), 39-82
Golden, M, Wallerstein, M, 2006. Domestic and international causes for the rise of pay inequality: post-industrialism, globalization and labor market institutions. Draft http://www.international.ucla.edu/media/files/golden_wallerstein.pdf
Gollin, Douglas, 2002, “Getting Income Shares Right,” Journal of Political Economy, Vol. 110 (April), pp. 458–74.
Greenaway, D., Hine, R., Wright, P. (1999), ‘An empirical assessment of the impact of trade on employment in the United Kingdom’, European Journal of Political Economy, 15, pp. 485-500.
Greenaway, D., Hine, R., Wright, P. (2000), ‘Further evidence on the effect of foreign competition on industry level wages’, Review of World Economics, 136 (3), pp. 522-38.
Greenaway, D., Nelson, D. (2001), ‘Globalisation and labour markets: literature review and synthesis’, Leverhulme Centre for Research on Globalisation and Economic Policy, Research Paper 2001/29.
Guscina, A, 2006. Effects of globalization on labor’s share in national income. IMF Working Paper 06/294
46 Conditions of Work and Employment Series No. 35
Harrison, A, 2002. Has globalization eroded labor’s share? Some cross-country evidence, Mimeo, UC Berkeley.
Hein, E, 2008. Money Distribution Conflict and Capital Accumulation. Contributions to ‘Monetary Analysis’. Palgrave Macmillan
Hein, E. Mundt, M. 2012. Financialisation and the requirements and potentials for wage-led recovery – a review focussing on the G20. Paper written for the project ‘New perspectives on wages and economic growth: the potentials of wage-led growth’.
Hein, E., Schoder, C. (2011): Interest rates, distribution and capital accumulation – a Post-Kaleckian perspective on the U.S. and Germany, International Review of Applied Economics, forthcoming.
Hein, E., van Treeck, T. (2010), ‘‘Financialisation’ and rising shareholder power in Kaleckian/Post-Kaleckian models of distribution and growth’, Review of Political Economy, 22, 2: 205-233
Hutchinson, J. Persyn, D, 2009. "Globalisation, concentration and footloose firms: in search of the main cause of the declining labour share," LICOS Discussion Paper Series, Discussion Paper 229/2009
ILO 2011. The labour share of income: determinants and potential contribution to exiting the financial crisis. Chapter 3 of World of Work Report 2011: Making Markets Work for Jobs. Geneva: ILO
ILO, 2008. World of Work Report 2008. Income inequalities in the age of financial globalization. Geneva: ILO
IMF, 2007a. The globalization of labor. Chapter 5 of World Economics Outlook April 2007. Washington: IMF
IMF, 2007b. Globalization and inequality. Chapter 4 of World Economic Outlook, Oct 2007
Jaumotte, F.; Tytell, I. 2007. How has the globalization of labour affected the labour income share in advanced countries?, IMF Working Paper No. 298 (IMF, Washington, DC).
Jayadev, A, 2007. Capital account openness and the labour share of inomce. Cambridge Journal of Economics 31, 423-443
Kaldor, N, 1956. Alternative Theories of Distribution. Review of Economic Studies 23 (2): 83-100
Kalecki, M, 1954. Theory of Economic Dynamics. Reprinted in J. Osiatynski (ed): Collected Works of Michal Kalecki, Vol. 1, Oxford: Clarendon Press
Keynes, J, 1937. The General Theory of Employment. Quarterly Journal of Economics 41 (2): 209-223
Keynes, J, 1973. The General Theory of Employment, Interest and Money. The collected writings of John Maynard Keynes volume VII. Cambridge: Macmillan
Korpi, W, Palme, J, 2003. New Politics and Class Politics in the Context of Austerity and Globalization: Welfare State Regress in 18 Countries, 1975-95. American Political Science Review, 97, 3: 425-446
Krueger, A, 1999. Measuring labor´s share. American Economic Review 89 (2): 45-51.
Lane, P, Milesi-Ferretti, 2007. The external wealth of nations mark II: Revised and extended estimates of foreign assets and liabilities. Journal of International Economics 73: 23-250.

Conditions of Work and Employment Series No. 35 47
Lane, P, Milesi-Ferretti, G, 2006, “The external wealth of nations mark II: Revised and extended estimates of foreign assets and liabilities, 1970–2004,” IMF Working Paper 06/69
Lazonick, W, O'Sullivan, M, 2000) Maximising shareholder value: a new ideology for corporate governance. Economy and Society 29 (1): 13-35
Marglin, S, 1984. Growth, Distribution, and Prices. Cambridge, Mass: Harvard University Press
McCloskey, D, Ziliak, S, 1996. The standard error of regressions. Journal of Economic Literature 34 (1): 97-114
Mohun, S. (2006), .Distributive Shares in the U.S. Economy, 1964-2001. Cambridge Journal of Economics 30(3): 347-70
Nunziata, L, 2005. Institutions and wage determination: a multi-country approach. Oxford Bulletin of Economics and Statistics 67 (4): 435-466
OECD 2007. OECD workers in the global economy: increasingly vulnerable? Chapter 3 of OECD Employment Outlook 2007. Paris: OECD
OECD 2008. Growing unequal? Income distribution and poverty in OECD countries. Paris: OECD
OECD 2011. Divided we stand: why inequality keeps rising. Paris: OECD
Onaran, Ö., 2009. Wage share, globalization and crisis: the case of the manufacturing industry in Korea, Mexico and Turkey',International Review of Applied Economics,23:2,113 — 134
Onaran, Ö., Stockhammer, E. and Grafl, L. 2011. Financialization, income distribution, and aggregate demand in the US. Cambridge Journal of Economics 35(4): 637-66
Onaran, Özlem, 2008. The effect of import penetration on labor market outcomes in Austrian manufacturing industry. Vienna University of Economics and Business, Economics Department Working Paper 119
Onaran, Ozlem, 2011. Globalisation, macroeconomic performance and distribution. In E. Hein and E. Stockhammer (eds): A Modern Guide To Keynesian Macroeconomics and Economic Policies. Cheltenham: Edward Elgar
Pierson, Paul. 1994. Dismantling the Welfare State? Reagan, Thatcher, and the Politics of Retrenchment. Cambridge: Cambridge University Press
Piketty, T, Saez, E, 2003. Income inequality in the United States, 1913-1998. Quarterly Journal of Economics, 118 (1): 1-39
Piketty, T, Saez, E, 2007. Income inequality in the United States, 1913-1998. In: A.B. Atkinson and T. Piketty (eds.): Top Incomes in a Global Perspective, Oxford University Press
Power, D, Epstein, G, Abrena, M, 2003. Individual country Technical notes for: Trends in the rentier income share in OECD countries 1960-2000. PERI Working Paper 58b
Power, D, Epstein, G, Abrena, M, 2003. Trends in the rentier income share in OECD countries 1960-2000. PERI Working Paper 58a
Rodrik, D, 1997. Has Globalization Gone Too Far? Washington: Institute of International Economics
Rodrik, D, 1998. Capital mobility and labor. Manuscript. http://ksghome.harvard.edu/~drodrik/capitalm.pdf
48 Conditions of Work and Employment Series No. 35
Rodrik, Dani, 1999. Democracies Pay Higher Wages, Quarterly Journal of Economics, 114(3), 707-738
Rossman, P, 2009. Financialization and casualization of labour – building a trade union and regulatory response. Paper presented at the Global Labour University Conference, Feb. 2009, Mumbai
Rowthorn, R, 1999a. Unemployment, wage bargaining and capital-labour substitution. Cambridge Journal of Economics 23: 413-425
Rowthorn, R, 1999b. Unemployment, Capital-Labor Substitution, and Economic Growth. IMF Working Paper 99/43
Stockhammer E, 2004. Financialization and the slowdown of accumulation. Cambridge Journal of Economics. 28 (5): 719-41
Stockhammer, E, 2008. Is the NAIRU theory a Monetarist, New Keynesian, Post Keynesian or Marxist theory? Metroeconomica 59 (4): 479-510
Stockhammer, Engelbert, 2009. Determinants of functional income distribution in OECD countries. IMK Studies 05-2009
Stockhammer, E, 2010. Financialization and the Global Economy. Political Economy Research Institute Working Paper 242
Stockhammer, E, Klär, E, 2011. Capital accumulation and unemployment in the medium run. Cambridge Journal of Economics 35(2): 437-457
Stockhammer, E, Onaran, Ö and Ederer, S. 2009. Functional income distribution and aggregate demand in the Euro area. Cambridge Journal of Economics 33 (1): 139-159
Stockhammer, E., Ramskogler, P., 2009. Post Keynesian economics - how to move forward. Intervention 5 (2): 227-46
Stolper, W, Samuelson, P, 1941. Protection and real wages, Review of Economic Studies, Vol. 9, 58–73.
Wolff, E, Zacharias, A, 2007. Class structure and economic inequality. Levy Economics Institute Working Paper No. 487
Wood, A. (1994), North-South Trade, Employment and Inequality: Changing Fortunes in a Skill-Driven World, Clarendon Press, Oxford.
Wooldridge, J, 2002. Econometric Analysis of Cross Section and Panel Data. Cambridge, Mass: MIT Press
Zhou, M., Xiao, W., and Yao, X. (2010). “Unbalanced Economic Growth and Uneven National Income Distribution: Evidence from China”, Institute for Research on Labor and Employment Working Paper 2010-11. University of California. Los Angeles.
Ziliak, S, McCloskey, D, 2004. Size matters: the standard error of regressions in the American Economic Review. Econ Journal Watch 1 (2): 331-358
Conditions of Work and Employment Series No. 35 49
Datasets
Abiad, Abdul G., Detragiache, Enrica and Tressel, Thierry, 2008. A New Database of Financial Reforms. IMF Working Papers, Vol.08/266. (link to dataset http://www.imf.org/external/pubs/ft/wp/2008/Data/wp08266.zip , access 06 October 2011)
Aleksynska, Mariya, Schindler, Martin 2011. Labor Market Regulations in Low-, Middle- and High-Income Countries: A New Panel Database. IMF Working Paper No. 11/154 http://www.imf.org/external/pubs/cat/longres.aspx?sk=25015.0 (link to dataset http://www.imf.org/external/pubs/ft/wp/2011/Data/wp11154.zip , access 26 September 2011)
AMECO: Annual macro-economic database, Directorate General for Economic and Financial Affairs. (link to dataset http://ec.europa.eu/economy_finance/ameco/user/serie/SelectSerie.cfm , access 15 June 2011)
Bassanini, A, and Duval, R, 2006. Employment Patterns in OECD Countries: Reassessing the Role of Policies and Institutions, OECD Economics Department Working Papers 486, OECD Publishing.
BGHS: Baker, D., Glyn, A., Howell, D. and Schmitt, J. 2005. Labor market institutions and unemployment: a critical assessment of the cross-country evidence, in Howell, D. (ed.), Fighting Unemployment. The Limits for Free Market Orthodoxy, Oxford, Oxford University Press link: http://www.noapparentmotive.org/topics/BGHS_data.html
ILO/IILS: ILO/IILS data on wage shares, supplied by M. Charpe.
KOF: Dreher, A, 2006. Does Globalization Affect Growth? Evidence from a new Index of Globalization, Applied Economics, 38(10), 1091-111. (link to dataset http://globalization.kof.ethz.ch/static/rawdata/globalization_2011b_short.xls , access 24 June 2011)
Penn World Tables: Heston, A, Summers, R, Aten, B, 2011. Penn World Table Version 7.0 . Center for International Comparisons of Production, Income and Prices, University of Pennsylvania. (link to dataset http://pwt.econ.upenn.edu/Downloads/pwt70/pwt70_06032011version.zip , access 25 May 2011)
EU KLEMS: EU KLEMS Growth and Productivity Accounts: November 2009 Release, updated March 2011. (link to dataset http://www.euklems.net/index.html , access 17 July 2011)
IMF, 2010. World Economic Outlook Database, October 2010. (link to dataset http://www.imf.org/external/pubs/ft/weo/2010/02/weodata/download.aspx , access 21 February 2011)
IMF International Financial Statistics (IFS))
Lane, PR, and Milesi-Ferretti, GM, 2007. The external wealth of nations mark II: Revised and extended estimates of foreign assets and liabilities, 1970–2004. Journal of International Economics, 73, November, 223-250. (link to dataset http://www.imf.org/external/pubs/ft/wp/2006/data/update/wp0669.zip, access 15 February 2011)
OECD: OECD.StatExtracts, http://stats.oecd.org/Index.aspx (access 18 April 2011)
Conference Board: The Conference Board, 2011. Total Economy Database, Growth Accounting and Total Factor Productivity Country Details, 1990-2009, January 2011. (link to dataset http://www.conference-
50 Conditions of Work and Employment Series No. 35
board.org/retrievefile.cfm?filename=TEDII_Jan20111.xls&type=subsite , access 07 March 2011)
United Nations Statistics Division, 2011. National Accounts Official Country Data, UNData Explorer. (link to dataset http://data.un.org/Explorer.aspx?d=SNA , access 18 April 2011)
UNIDO: INDSTAT3, Industrial Statistics Database (Edition: 2006). (link to dataset http://dx.doi.org/10.5257/unido/indstat3/2006 , access 18 April 2011)
World Bank World Development Indicators (WDI). (link to dataset http://data.worldbank.org/data-catalog/world-development-indicators , access 15 February 2011)
Conditions of Work and Employment Series No. 35 51
Conditions of Work and Employment Series
No. 1 Quality of working life: A review on changes in work organization, conditions of employment and work-life arrangements (2003), by H. Gospel
No. 2 Sexual harassment at work: A review of preventive measures (2005), by D. McCann
No. 3 Statistics on working time arrangements based on time-use survey data (2003), by A. S. Harvey, J. Gershuny, K. Fisher & A. Akbari
No. 4 The definition, classification and measurement of working time arrangements (2003), by D. Bell & P. Elias
No. 5 Reconciling work and family: Issues and policies in Japan (2003), by M. Abe, C. Hamamoto & S. Tanaka
No. 6 Reconciling work and family: Issues and policies in the Republic of Korea (2004), by T.H. Kim & K.K. Kim
No. 7 Domestic work, conditions of work and employment: A legal perspective (2003), by J.M. Ramirez-Machado
No. 8 Reconciling work and family: Issues and policies in Brazil (2004), by B. Sorj
No. 9 Employment conditions in an ageing world: Meeting the working time challenge (2004), by A. Jolivet & S. Lee
No. 10 Designing programmes to improve working and employment conditions in the informal economy: A literature review (2004), by Dr. R.D. Rinehart
No. 11 Working time in transition: The dual task of standardization and flexibilization in China (2005), by X. Zeng, L. Lu & S.U. Idris
No. 12 Compressed working weeks (2006), by P. Tucker
No. 13 Étude sur les temps de travail et l’organisation du travail: Le cas du Sénégal. Analyse juridique et enquête auprès des entreprises (2006), by A. Ndiaye
No. 14 Reconciling work and family: Issues and policies in Thailand (2006), by K. Kusakabe
No. 15 Conditions of work and employment for older workers in industrialized countries: Understanding the issues (2006), by N.S. Ghosheh Jr., S. Lee & D. McCann
No. 16 Wage fixing in the informal economy: Evidence from Brazil, India, Indonesia and South Africa (2006) by C. Saget
No. 18 Reconciling work and family: Issues and policies in Trinidad and Tobago (2008), by R. Reddock & Y. Bobb-Smith
No. 19 Minding the gaps: Non-regular employment and labour market segmentation in the Republic of Korea (2007) by B.H. Lee & S. Lee
No. 20 Age discrimination and older workers: Theory and legislation in comparative context (2008), by N. Ghosheh
No. 21 Labour market regulation: Motives, measures, effects (2009), by G. Bertola
52 Conditions of Work and Employment Series No. 35
No. 22 Reconciling work and family: Issues and policies in China (2009), by Liu Bohong, Zhang Yongying & Li Yani
No. 23 Domestic work and domestic workers in Ghana: An overview of the legal regime and practice (2009), by D. Tsikata
No. 24 A comparison of public and private sector earnings in Jordan (2010), by C. Dougherty
No. 25 The German work-sharing scheme: An instrument for the crisis (2010), by A. Crimmann, F. Weissner, L. Bellmann
No. 26 Extending the coverage of minimum wages in India: Simulations from household data (2010), by P. Belser & U. Rani
No. 27 The legal regulation of working time in domestic work (2010), by Deirdre Mc Cann & Jill Murray
No. 28 What do we know about low-wage work and low-wage workers (2011), by Damian Grimshaw
No. 29 Estimating a living wage: a methodological review (2011), by Richard Anker
No. 30 Measuring the economic and social value of domestic work: conceptual and methodological framework (2011), by Debbie Budlender
No. 31 Working Time, Health, and Safety: a Research Synthesis Paper (2012), prepared by Philip Tucker and Simon Folkard, on behalf of Simon Folkard Associates Ltd
No. 32 The influence of working time arrangements on work-life integration or ‘balance’: A review of the international evidence (2012), by Colette Fagan, Clare Lyonette, Mark Smith and Abril Saldaña-Tejeda
No. 33 The Effects of Working Time on Productivity and Firm Performance: a research synthesis paper (2012), by Lonnie Golden
No. 34 Estudio sobre trabajo doméstico en Uruguay (2012), by Dra. Karina Batthyány
No. 35 Why have wage shares fallen? A panel analysis of the determinants of functional income distribution (2012), by Engelbert Stockhammer
No. 36 Wage-led or Profit-led Supply: Wages, Productivity and Investment (2012), by Servaas Storm & C.W.M. Naastepad
No. 37 Financialisation and the requirements and potentials for wage-led recovery – a review focussing on the G20 (2012), by Eckhard Hein and Matthias Mundt
No 38 Wage Protection Legislation in Africa (2012), by Najati Ghosheh
No. 39 Income inequality as a cause of the Great Recession? A survey of current debates (2012), by Simon Sturn & Till van Treeck
No. 40 Is aggregate demand wage-led or profit-led? National and global effects (2012), by Özlem Onaran & Giorgos Galanis
No. 41 Wage-led growth: Concept, theories and policies (2012), by Marc Lavoie & Engelbert Stockhammer


