Page 1
Ground-Truth for Traffic Affected by Security
Attacks
Manuel Antonio Borges Monterroso
Dissertacao para obtencao do Grau de Mestre em
Engenharia de Redes de Comunicacao
JuriPresidente: Prof. Doutor Paulo Jorge Pires FerreiraOrientador: Prof. Doutor Rui Jorge Morais Tomaz ValadasCo-Orientador: Prof. Doutor Carlos Nuno da Cruz RibeiroVogais: Prof. Doutor Paulo Jorge Salvador Serra Ferreira
October 2011
Page 3
”Your time is limited, so don’t waste it living someone else’s life. Don’t be trapped by dogma - which isliving with the results of other people’s thinking. Don’t let the noise of other’s opinions drown out yourown inner voice. And most important, have the courage to follow your heart and intuition. Theysomehow already know what you truly want to become. Everything else is secondary. (...)Stay hungry. Stay Foolish.”
Steve Jobs, 2005
Page 7
Acknowledgments
My sincere and special thanks to my adviser Prof. Rui Valadas for accepting me for this project
and for all the support, patience and advices that made me grow and learn. To my co-adviser Prof.
Carlos Ribeiro for his important contributes and total availability on helping me. Our work meetings
were always very enlightening and enjoyable.
I would also like to thank Prof. Paulo Salvador and Carlos Miranda from Universidade de Aveiro for
the important contribute during the formative stages of this thesis. To Prof. M. Rosario de Oliveira and
Claudia Pascoal for all their kindness and availability on helping me during a crucial phase of this work.
Finally, to all my friends that I had endured throughout the last year (alphabet order): Andre Fernan-
des, Antonio Inacio, Carlos Rodrigues, Diogo Monica, Fabio Gameiro, Joana Campos, Joao Guerreiro,
Juliana Pinto, Lara Leite and Ricardo Menezes.
To each and every one of you - Thank you.
Lisboa, October 2011
Manuel Monterroso
v
Page 9
Abstract
Security is a main topic on network communications, where new threats or mutations of existing ones
appear at frightening rates. Therefore, to prevent those security attacks several techniques based on
traffic analysis have been developed. However, these methods should be evaluated in order to test their
effectiveness. For that, researchers need to resort to traffic traces to obtain the ground-truth, which is very
difficult to acquire in real networks. This Dissertation is focused on emulating network topologies based
on real networks to acquire high quality ground-truth. In different scenarios were generated licit and illicit
traffic according to real patterns. The captured traffic was processed and analyzed to produce some final
results. This Dissertation intends also to provide all the results obtained to the research community in
order to be used to evaluate statistical methods of detecting attacks and applications.
Keywords
Network emulation, licit traffic, illicit traffic, ground-truth, virtualization
vii
Page 11
Resumo
Hoje em dia a seguranca nas redes de computadores e um requisito essencial que se encontra constan-
temente ameacada por ataques, que vao surgindo a um ritmo cada vez mais acelerado. Para prevenir
muitos destes ataques, existem varias tecnicas baseadas na analise de trafego que tem vindo a ser de-
senvolvidas. Contudo, essas tecnicas devem ser avaliadas de modo a tornarem-se mais eficientes. Para
tal e necessario recorrer a traces, de modo a obter um ground-truth que muito dificilmente se obtem nas
redes em producao devido a questoes de privacidade e por ser impraticavel. Esta Dissertacao foca-se na
emulacao de redes baseadas nas topologias reais de modo a obter um ground-truth de alta qualidade.
Foram usados diferentes equipamentos e tecnologias, quer virtuais, quer fısicas, para assim se criar as
topologias. Nos diferentes cenarios desenvolvidos foi gerado trafego lıcito e ilıcito, de acordo com o que
se verifica hoje em dia nas redes em producao. Esta Dissertacao pretende tambem disponibilizar todos os
dados obtidos a comunidade de investigacao por forma a contribuir para uma avaliacao do desempenho
de metodos estatısticos para a deteccao de ataques e aplicacoes.
Palavras Chave
Redes emuladas, trafego lıcito, trafego ilıcito, ground-truth, virtualizacao.
ix
Page 13
Index
1 Introduction 1
1.1 Goals . . . . . . . . . . . . . . . . . . . . . . . . . . . . . . . . . . . . . . . . . . . . . . . 2
1.2 Contributions . . . . . . . . . . . . . . . . . . . . . . . . . . . . . . . . . . . . . . . . . . . 2
1.3 Document Outline . . . . . . . . . . . . . . . . . . . . . . . . . . . . . . . . . . . . . . . . 3
2 Context and Related Work 5
2.1 Emulation and Simulation . . . . . . . . . . . . . . . . . . . . . . . . . . . . . . . . . . . . 5
2.2 Virtualization . . . . . . . . . . . . . . . . . . . . . . . . . . . . . . . . . . . . . . . . . . . 8
2.3 Illicit Traffic . . . . . . . . . . . . . . . . . . . . . . . . . . . . . . . . . . . . . . . . . . . . 9
2.3.1 Denial of Service (DoS) Attacks . . . . . . . . . . . . . . . . . . . . . . . . . . . . . 10
2.3.2 Buffer Overflow . . . . . . . . . . . . . . . . . . . . . . . . . . . . . . . . . . . . . . 12
2.3.3 Port Scan . . . . . . . . . . . . . . . . . . . . . . . . . . . . . . . . . . . . . . . . . 12
2.3.4 Atacking Domain Name System (DNS) Servers . . . . . . . . . . . . . . . . . . . . 13
2.3.5 Fuzzing Attacks . . . . . . . . . . . . . . . . . . . . . . . . . . . . . . . . . . . . . 15
2.3.6 Frameworks . . . . . . . . . . . . . . . . . . . . . . . . . . . . . . . . . . . . . . . . 16
2.4 Licit Traffic . . . . . . . . . . . . . . . . . . . . . . . . . . . . . . . . . . . . . . . . . . . . 18
2.5 Previous Work . . . . . . . . . . . . . . . . . . . . . . . . . . . . . . . . . . . . . . . . . . 23
3 Emulated Networks 25
3.1 Topologies . . . . . . . . . . . . . . . . . . . . . . . . . . . . . . . . . . . . . . . . . . . . . 27
3.2 Configuration of Network Devices . . . . . . . . . . . . . . . . . . . . . . . . . . . . . . . . 29
3.2.1 Servers . . . . . . . . . . . . . . . . . . . . . . . . . . . . . . . . . . . . . . . . . . 29
3.2.2 Clients . . . . . . . . . . . . . . . . . . . . . . . . . . . . . . . . . . . . . . . . . . . 30
3.2.3 Emulated Routers . . . . . . . . . . . . . . . . . . . . . . . . . . . . . . . . . . . . 31
3.3 Technologies for Applications and Attacks . . . . . . . . . . . . . . . . . . . . . . . . . . . 33
3.3.1 Licit Traffic . . . . . . . . . . . . . . . . . . . . . . . . . . . . . . . . . . . . . . . . 34
3.3.2 Illicit Traffic . . . . . . . . . . . . . . . . . . . . . . . . . . . . . . . . . . . . . . . 38
3.4 Traffic Generation . . . . . . . . . . . . . . . . . . . . . . . . . . . . . . . . . . . . . . . . 42
3.5 Capturing Data . . . . . . . . . . . . . . . . . . . . . . . . . . . . . . . . . . . . . . . . . . 44
xi
Page 14
3.6 Grouping Packets per Service/Attack . . . . . . . . . . . . . . . . . . . . . . . . . . . . . . 45
3.6.1 Illicit Traffic . . . . . . . . . . . . . . . . . . . . . . . . . . . . . . . . . . . . . . . 46
3.6.2 Licit Traffic . . . . . . . . . . . . . . . . . . . . . . . . . . . . . . . . . . . . . . . . 47
3.6.3 Flows . . . . . . . . . . . . . . . . . . . . . . . . . . . . . . . . . . . . . . . . . . . 48
4 Results and Discussion 51
4.1 Aggregated Traffic . . . . . . . . . . . . . . . . . . . . . . . . . . . . . . . . . . . . . . . . 51
4.2 Per Flow Traffic . . . . . . . . . . . . . . . . . . . . . . . . . . . . . . . . . . . . . . . . . 59
4.3 Interesting Features to Detect the Attacks . . . . . . . . . . . . . . . . . . . . . . . . . . . 61
5 Conclusions and Future Work 65
xii
Page 15
List of Figures
2.1 TCP Syn Flooding Attack . . . . . . . . . . . . . . . . . . . . . . . . . . . . . . . . . . . . . 11
2.2 Cache poisoning by Dan Kaminsky [1]. . . . . . . . . . . . . . . . . . . . . . . . . . . . . . . 14
2.3 Metasploit Architecture Overview7. . . . . . . . . . . . . . . . . . . . . . . . . . . . . . . . 17
2.4 Breakdown in flows and bytes [2]. . . . . . . . . . . . . . . . . . . . . . . . . . . . . . . . . . 20
2.5 Scenario A [3]. . . . . . . . . . . . . . . . . . . . . . . . . . . . . . . . . . . . . . . . . . . 23
3.1 The proposed architecture. . . . . . . . . . . . . . . . . . . . . . . . . . . . . . . . . . . . . . 26
3.2 The five main phases of project development. . . . . . . . . . . . . . . . . . . . . . . . . . . . 27
3.3 EN1 based on [3]. . . . . . . . . . . . . . . . . . . . . . . . . . . . . . . . . . . . . . . . . . 27
3.4 EN2 based on the Instituto Superior Tecnico (IST)’s network. 1. . . . . . . . . . . . . . . . . . 28
3.5 HP ProLiant DL160 G6 L5630 4GB (1P) 4-core, 2,13 GHz, 12 MB L3, 40W. . . . . . . . . . . . 29
3.6 Router interface configuration example. . . . . . . . . . . . . . . . . . . . . . . . . . . . . . . 32
3.7 Open Shortest Path First (OSPF) configuration example. . . . . . . . . . . . . . . . . . . . . . 33
3.8 Example of a Hyper-Text Transfer Protocol (HTTP)-Streaming client command. . . . . . . . . 34
3.9 Example of FTP downloading using Curl. . . . . . . . . . . . . . . . . . . . . . . . . . . . . . 36
3.10 Example of FTP uploading using Curl. . . . . . . . . . . . . . . . . . . . . . . . . . . . . . . 36
3.11 Example of a HTTP request command. . . . . . . . . . . . . . . . . . . . . . . . . . . . . . . 37
3.12 Example of a HTTP-Streaming server command. . . . . . . . . . . . . . . . . . . . . . . . . . 37
3.13 Example of a HTTP-Streaming client command. . . . . . . . . . . . . . . . . . . . . . . . . . 37
3.14 Example of a nmap command to perform port scans. . . . . . . . . . . . . . . . . . . . . . . . 42
3.15 Structure of a Cron command. . . . . . . . . . . . . . . . . . . . . . . . . . . . . . . . . . . . 42
3.16 Example of a Cron command. . . . . . . . . . . . . . . . . . . . . . . . . . . . . . . . . . . . 43
3.17 Example of a script executing a HTTP Request. . . . . . . . . . . . . . . . . . . . . . . . . . 43
3.18 Points of Captured Data. . . . . . . . . . . . . . . . . . . . . . . . . . . . . . . . . . . . . . 44
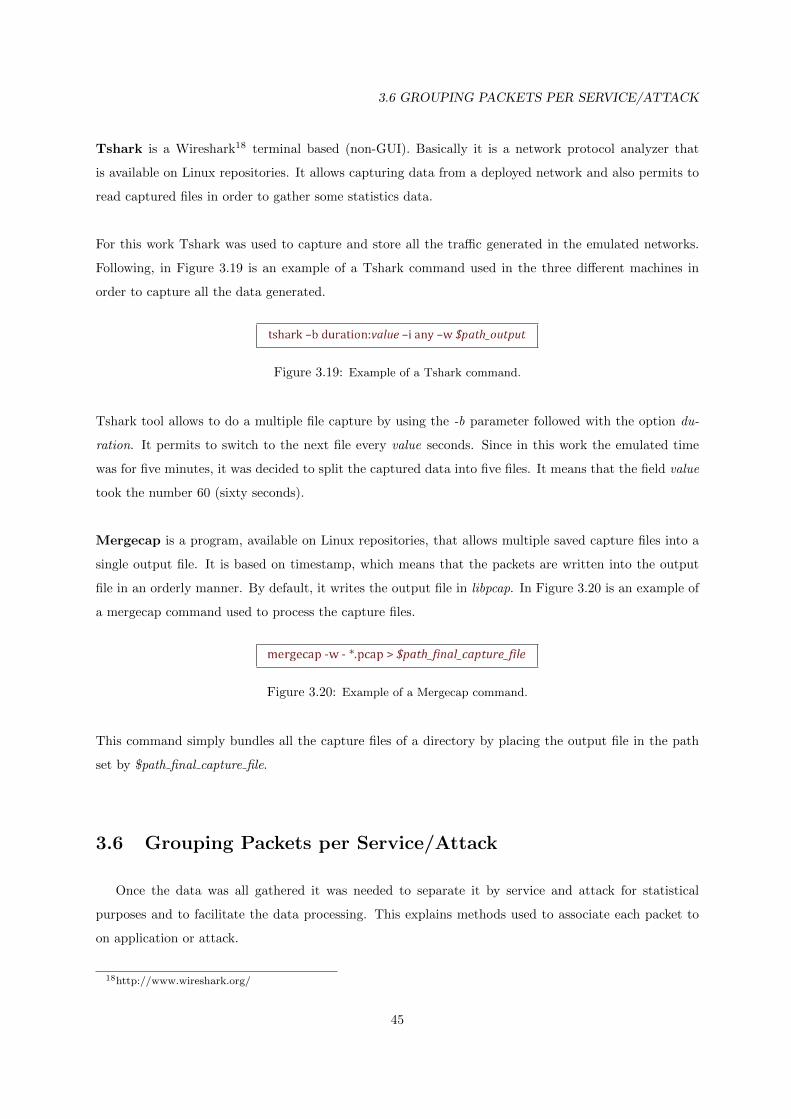
3.19 Example of a Tshark command. . . . . . . . . . . . . . . . . . . . . . . . . . . . . . . . . . . 45
3.20 Example of a Mergecap command. . . . . . . . . . . . . . . . . . . . . . . . . . . . . . . . . . 45
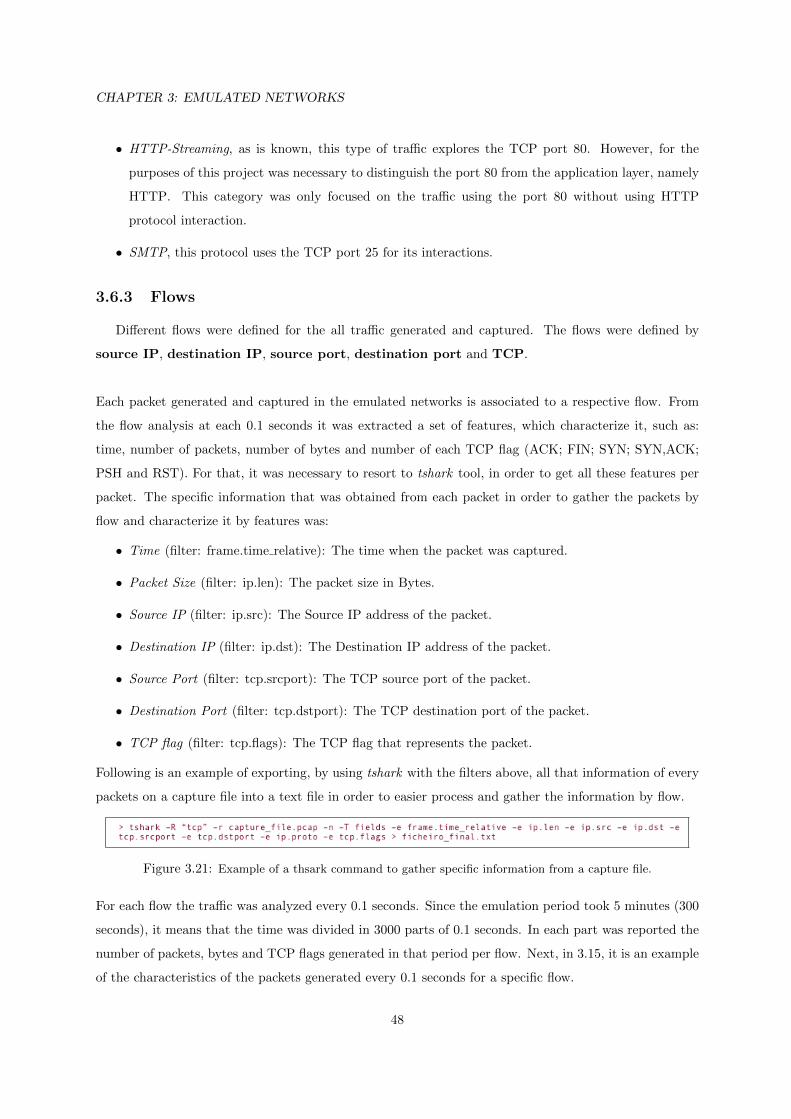
3.21 Example of a thsark command to gather specific information from a capture file. . . . . . . . . . 48
xiii
Page 16
4.1 Packets and Bytes generated by each emulated network. . . . . . . . . . . . . . . . . . . . 52
4.2 Transmission Control Protocol (TCP) and User Datagram Protocol (UDP) traffic gener-
ated in EN1. . . . . . . . . . . . . . . . . . . . . . . . . . . . . . . . . . . . . . . . . . . . 52
4.3 TCP and UDP traffic generated in EN2. . . . . . . . . . . . . . . . . . . . . . . . . . . . . 53
4.4 UDP traffic behaviour in EN1. . . . . . . . . . . . . . . . . . . . . . . . . . . . . . . . . . 53
4.5 UDP traffic behaviour in EN2. . . . . . . . . . . . . . . . . . . . . . . . . . . . . . . . . . 53
4.6 UDP services in EN1. . . . . . . . . . . . . . . . . . . . . . . . . . . . . . . . . . . . . . . 54
4.7 UDP services in EN2. . . . . . . . . . . . . . . . . . . . . . . . . . . . . . . . . . . . . . . 54
4.8 TCP services in EN1. . . . . . . . . . . . . . . . . . . . . . . . . . . . . . . . . . . . . . . 55
4.9 TCP services in EN2. . . . . . . . . . . . . . . . . . . . . . . . . . . . . . . . . . . . . . . 55
4.10 TCP and UDP attacks in EN1. . . . . . . . . . . . . . . . . . . . . . . . . . . . . . . . . . 56
4.11 TCP and UDP attacks in EN2. . . . . . . . . . . . . . . . . . . . . . . . . . . . . . . . . . 57
4.12 HTTP traffic in EN1. . . . . . . . . . . . . . . . . . . . . . . . . . . . . . . . . . . . . . . 57
4.13 HTTP traffic in EN2. . . . . . . . . . . . . . . . . . . . . . . . . . . . . . . . . . . . . . . 58
4.14 File Transfer Protocol (FTP) traffic in EN1. . . . . . . . . . . . . . . . . . . . . . . . . . . 58
4.15 FTP traffic in EN2. . . . . . . . . . . . . . . . . . . . . . . . . . . . . . . . . . . . . . . . 59
4.16 Flows per service in EN2. . . . . . . . . . . . . . . . . . . . . . . . . . . . . . . . . . . . . 60
4.17 Flows per attack in EN2. . . . . . . . . . . . . . . . . . . . . . . . . . . . . . . . . . . . . 61
4.18 Features generated by HTTP. . . . . . . . . . . . . . . . . . . . . . . . . . . . . . . . . . . 62
4.19 Features produced throughout the emulation time for HTTP traffic. . . . . . . . . . . . . 62
4.20 Number of features generated by FTP. . . . . . . . . . . . . . . . . . . . . . . . . . . . . . 63
4.21 Features produced throughout the emulation time for FTP traffic. . . . . . . . . . . . . . 63
xiv
Page 17
List of Tables
2.1 Attacks considered for each category. . . . . . . . . . . . . . . . . . . . . . . . . . . . . . . . 10
2.2 Traces Summary [4]. . . . . . . . . . . . . . . . . . . . . . . . . . . . . . . . . . . . . . . . . 19
2.3 Traces Summary [2]. . . . . . . . . . . . . . . . . . . . . . . . . . . . . . . . . . . . . . . . . 20
2.4 Breakdown in Flows (Bytes) [2]. . . . . . . . . . . . . . . . . . . . . . . . . . . . . . . . . . 21
2.5 Breakdown in Flows (Bytes) [2]. . . . . . . . . . . . . . . . . . . . . . . . . . . . . . . . . . 22
2.6 Traffic percentages in flows (bytes) of the applications/services. . . . . . . . . . . . . . . . 23
3.1 Servers Characteristics. . . . . . . . . . . . . . . . . . . . . . . . . . . . . . . . . . . . . . 30
3.2 List of current Cisco IOS images supported by GNS3. . . . . . . . . . . . . . . . . . . . . 32
3.3 Emulated services. . . . . . . . . . . . . . . . . . . . . . . . . . . . . . . . . . . . . . . . . 33
3.4 Emulated attacks. . . . . . . . . . . . . . . . . . . . . . . . . . . . . . . . . . . . . . . . . 33
3.5 Attacks deployed by each framework. . . . . . . . . . . . . . . . . . . . . . . . . . . . . . . 38
3.6 Module options for Scanner FTP Login. . . . . . . . . . . . . . . . . . . . . . . . . . . . . 39
3.7 Module options for FTP Stack-based Buffer Overflow. . . . . . . . . . . . . . . . . . . . . 39
3.8 Module options for Fuzzer HTTP Malicious URI. . . . . . . . . . . . . . . . . . . . . . . . 40
3.9 Module options for Fuzzer HTTP Incremented URI. . . . . . . . . . . . . . . . . . . . . . 40
3.10 Module options for Kaminsky Attack. . . . . . . . . . . . . . . . . . . . . . . . . . . . . . 41
3.11 Module options for TCP SynFlood. . . . . . . . . . . . . . . . . . . . . . . . . . . . . . . . 41
3.12 Execution process by each service. . . . . . . . . . . . . . . . . . . . . . . . . . . . . . . . 44
3.13 Filters used for each attack. . . . . . . . . . . . . . . . . . . . . . . . . . . . . . . . . . . . 46
3.14 Filters used for each service. . . . . . . . . . . . . . . . . . . . . . . . . . . . . . . . . . . . 47
3.15 Number of packets and their characteristics for a flow. . . . . . . . . . . . . . . . . . . . . 49
4.1 Parameters to detect the attacks. . . . . . . . . . . . . . . . . . . . . . . . . . . . . . . . . 64
5.1 Application for each kind of licit traffic. . . . . . . . . . . . . . . . . . . . . . . . . . . . . 66
xv
Page 19
List of Acronyms
BIND Berkeley Internet Name Domain
BIND9 Berkeley Internet Name Domain version 9
DHCP Dynamic Host Configuration Protocol
DNS Domain Name System
DoS Denial of Service
FTP File Transfer Protocol
GNS Graphical Network Simulator
HTTP Hyper-Text Transfer Protocol
IP Internet Protocol
ISP Internet Service Providers
IDS Intrusion Detection System
IMAP Internet Message Access Protocol
IST Instituto Superior Tecnico
LAN Local Area Network
OSPF Open Shortest Path First
P2P Peer to Peer
POP Post Office Protocol
SMTP Simple Mail Transfer Protocol
SNMP Simple Network Management Protocol
xvii
Page 20
TCP Transmission Control Protocol
UDP User Datagram Protocol
URI Uniform Resource Identifier
URL Uniform Resource Locator
VLC VideoLan Client
xviii
Page 21
1Introduction
The world is becoming more interconnected with the progress of the Internet and new networking
technologies. There is a large amount of information being exchanged all around the world. Nowadays,
high and effective security is demanded on network systems. Recent advances in encryption, public key
exchange, digital signatures and the development of related standards have set groundwork towards the
preventing of security attacks. Despite of this, the number of attacks against Internet-connected systems
continues to grow at frightening rates [5]. Therefore, efficient techniques to detect security attacks are
required.
Most of Intrusion Detection System (IDS) [6] have been classified as signature detection systems. This
kind of method recognizes an intrusion based on known intrusion attacks characteristics or signatures [7].
Its detection algorithm is based on traces, which are supposed to be uncovered by IDS in the observed
system. However, these methods have some disadvantages. The detection of security attacks based on
signatures of already known attacks can completely fail. Since they are signature-based methods for
classifying anomalies and attacks on security, may not be able to detect changes in the anomaly. This
is due to the fact that systems do not analyze the behaviour of network traffic but only rely on signatures.
1
Page 22
CHAPTER 1: INTRODUCTION
Methods based on traffic analysis [8] appeared to be one alternative to this kind of techniques previ-
ously discussed. In this case, traffic behaviour that departs from the “normal” one, observed when only
genuine applications are used in the network, is detected as a security attack or an anomalous event.
The efficiency evaluation of these methods requires that developers and researchers resort to traffic traces
where the flows that correspond to attacks are known precisely. This is called the ground-truth. Ground-
truth requires a complete list of the whole existing anomalies in the data set that is being evaluated [9].
However, it is almost impossible to acquire it, with traffic traces captured in real networks, since attacks
can have patterns very similar to the ones of genuine applications. Moreover, there are a lot of concerns
about sharing the traces with the rest of the scientific community due to privacy concerns.
Emulation and simulation emerge as a better option to obtain the ground-truth. These techniques
allow to define the topologies of several scenarios and to generate licit and illicit traffic. It allows the
execution of real network functionalities in a controllable and reproducible laboratory network environ-
ment. However, these methods have faced the challenge of simulating/emulating scenarios that faithfully
represents real networks.
1.1 Goals
The primary goal of this thesis is to develop and test a set-up for networks emulation capable of
representing real networks, applications and security attacks such that a high quality ground-truth can be
obtained. This work aims to generate licit traffic according to the real network traffic observed nowadays
representative of real applications such as HTTP, FTP, HTTP-Streaming, DNS and Bittorrent. In
addition, the most common attacks, which have impact on traffic behaviour, will also be reproduced on
the emulated networks.
1.2 Contributions
This dissertation shows the possibility of getting high quality data in order to generate a ground-
truth. All that data obtained from different scenarios can be used to evaluate statistical methods for
anomaly detection. Nowadays, there are a lot of apprehensions about sharing traffic traces captured
in real networks due to privacy concerns. However, in this case, the gathered data of this work can
be available to the research community because it was all captured in a controlled emulated network
environment.
2
Page 23
1.3 DOCUMENT OUTLINE
1.3 Document Outline
The remainder of the thesis is structured as follows:
Chapter 2 describes the context and the related work from an emulation technologies perspective, ad-
dressing the licit and illicit traffic that is common nowadays.
Chapter 3 presents all the process of the emulated networks construction. It will focus on the topologies
that were developed, technologies for applications and attacks, traffic generation, capturing data and the
process of grouping packets per Service/Attack.
Chapter 4 is focused on the results obtained from the emulated networks by analyzing and discuss
the produced outcome.
Finally, Chapter 5 concludes the thesis and draws some directions for future work.
3
Page 24
CHAPTER 1: INTRODUCTION
4
Page 25
2Context and Related Work
This thesis addresses an emulation environment running licit and illicit traffic. As was mentioned, in
this work it is proposed to develop networks representative of real networks, applications and security
attacks. For that, an offline emulation environment, which is able to generate real network traffic, is
needed to analyze the traffic behaviour. The traffic generated shall be licit and illicit according to the
real world. This section introduces the current state of the art in different fields of network traffic
behaviour mainly focused on network evaluation. Then, both licit and illicit traffic that are common in
real networks are also analyzed.
2.1 Emulation and Simulation
New protocols and applications keep on emerging as a consequence of the explosive progress of the In-
ternet. Developing and implementing next-generation, robust, large-scale networked systems requires a
deep understanding of system behaviour under a wide variety of circumstances. Both researchers and
application developers need a test environment to assist this development and deployment. Furthermore,
Internet Service Providers (ISP) require equipments and small-scale systems to estimate the performance
5
Page 26
CHAPTER 2: CONTEXT AND RELATED WORK
of their networks in terms of Internet Protocol (IP) routing effectiveness, alternative route availability
and security issues [10]. Besides, to put into effect security system, a trial testbed is required to test
security attacks in order to prevent them.
Network emulators and simulators are commonly used to develop, test and debug new protocols, to
explore and study a specific network-related research issue, to evaluate the performance of an existing
protocol or a scheme or to test its behaviour towards security attacks.
Network simulation [11] offers a synthetic abstract network environment in a specific operating system.
It is easy to configure and permit to create a protocol at some level of abstraction, making simulation
a fast “prototype-and-evaluate” environment [12]. It also provides several protocol modules and config-
uration tools that can be easily used to perform customized simulation experiments. The weakness of
using a simulator compared to a live network is the loss of realism. This kind of reproducing a network
environment is supported on some basic conjectures about network requirements, traffic behaviour and,
consequently, may weakly mimic the real network. Those functionalities that a network simulator may
provide are merely logical operations rather than real implementations.
In the last few years, network emulation [13] has captured the attention of network researchers com-
munity. This technique has being considered important to evaluate the effectiveness of new protocols and
applications in heterogeneous, controllable and realistic network scenarios. Emulation is often a more re-
alistic way to reproduce a network environment since contain real components. An emulator can operate
with router’s operating systems, which allows the network to use real protocols implementations. The
main target of every network emulator is to achieve the highest possible conformance to the behaviour
of a real network. It may mimic a real network more strictly than a network simulation. In an emula-
tion environment the operation of network protocols and applications are “Real” instead of logical entities.
As previously discussed there are main differences between emulation and simulation. A primary dif-
ference between both of them is that while the simulation is executed in virtual simulated time, the
emulation must run in real time. Another important difference is that it is impossible to have an ab-
solutely repeatable order of events in emulation due to its real time nature. Emulation network uses
real computers with restricted resources, and real applications, as well as operating systems running on
them, to realistically represent every host. A simplified simulation model does not abstract flaws and
vulnerabilities [14]. Internet is a moved target and is an extremely heterogeneous system that cannot be
represented with simplified reproductions regularly used by simulators [15]. Emulation methods allow
showing a real-time environment to acquire real traces and to build a platform for the estimation of new
6
Page 27
2.1 EMULATION AND SIMULATION
methodologies to detect security attacks.
So, emulation reveals to be the appropriately technique to reproduce network environments as close
to reality as possible.
Network emulators provide a technique where the properties of an existing and/or planned network
are reproduced in order to measure performance, to predict the impact of modifications or to optimize
the technology. With this technique is possible to determine how a product or service would perform
under assorted network conditions. Most of them can be connected to other emulation environments to
structure a bigger network topology in order to acquire results from the designed topologies. Next, some
of the network emulators, which are commonly used, are described.
Emulab
Emulab1 is a network testbed that can be use by scientist and researchers to develop, debug and eval-
uate their network topologies. It is available without any charge to most researchers worldwide. It can
be deployed in sites all around the world. The Emulab testbed provide an interaction between simulated
and real networks through NS-2 emulation. Emulab works by controlling a PC cluster which allows to
run any operating system.
Dummynet
Initially Dummynet [16] was developed to test network protocols. Though, over the years Dummynet
became very popular among network emulators due its capabilities and features. This approach gives
some of the advantages of both simulation and real-world testing: simplicity, good control over operating
parameters, facility of using real traffic generators. Dummynet do not introduce overhead in the commu-
nication, so experiments can be done up to the maximum speed that the system can handle. The main
platform of this emulator is FreeBSD and it is available for Linux and OpenWRT. Dummynet uses ipfw
rules to capture packets. After being captured, the packages are affected by some objects (“queues” and
“pipes”), which simulate the consequences of bandwidth limitations, delays, bounded-size queues and
multipath.
NetEm
Another well-known network emulator is NetEm [17]. The Linux Foundation supports this approach
and, as others network emulators, it pretends to provide a way to generate large networks in a lab en-
vironment. It can test new protocols on a Wide Area Networks environment. It is controlled by the
1http://www.emulab.net/
7
Page 28
CHAPTER 2: CONTEXT AND RELATED WORK
command line tool “tc” and is constructed using several modules. Lately, researchers also have been
developing a GUI in order to run commands from NetEm.
Sinema
Sinema Network Emulator2 is available in several different models in order to respect several user
requirements. This solution works in the Ethernet layer therefore it does not require any change in the
network. Sinema Network Emulator also provides a unidirectional and bidirectional emulation and a lot
of others characteristics such as simultaneous emulations; layer 2 and layer 3; IPTV MPEG impairments;
latency, jitter; packet loss; duplicate packet; congestion; queue size; fragmentation and others features
that are useful for a network emulation.
Graphical Network Simulator (GNS)3
The GNS3 3 (Graphcial Network Simulator 3) is a cross-platform open-source utility. It gives an
easy-to-use graphical user interface along with several other features. GNS3 permits to emulate the In-
ternetwork Operating System of the Cisco routers along with Dynamips and Dynagen in order to emulate
network topologies. GNS3 is able to support all router commands, besides simulated topology can be
connected to real world. Moreover it is guaranteed that an IOS image in GNS3 behaves exactly in the
same way as an actual CISCO device (with the same image) does in the real world.
For this work it was decided to use GNS3 to emulate all network scenarios. This network emulator
reveals to be a powerful tool, which fulfils the requirements of this work. With GNS3 it is possible to em-
ulate networks in such a way to produce results that are similar (almost 100% identical) to those obtained
in a real implementation. Plus, GNS3 allows connecting emulated topology to real world. Since the goal
of this work is to develop and test emulated network environments representative of real networks, GNS3
emerge as the best option to proceed with the emulation.
2.2 Virtualization
Virtualization [18] is the creation of a virtual version of resource, such as a server, network or an
operating system, where the framework divides it into one or more execution environments. Each guest
operating system act like having the host’s processor, memory and other resources to itself. Virtualization
emerges as good option to build several servers and PC end-hosts, in order to run a lot of services and
to produce a lot of network traffic.
2http://www.simena.net/3http://www.gns3.net/
8
Page 29
2.3 ILLICIT TRAFFIC
VirtualBox4 is a system emulator in Ubuntu. It allows to load multiple guest Operating Systems
under the host OS. With this tool it is possible to run several operating systems, as end-hosts, perform-
ing requests as clients to one (or more) specific server. Since the purpose of this work is execute traffic
network according with daily patterns, VirtualBox emerge as a tool that is able to create several hosts,
in one single physical machine, to generate different network traffic.
Xen Server5 is based on the open source Xen hypervisor. It carries faster and efficient virtualiza-
tion computing and allows users to manage advanced functions from their server and storage hardware.
It also consists on management software and several features such as migration. For this work it was
necessary to create several services running different services, in order to be able to produce network
traffic. Xen Server allows to create several virtual servers, in a single server machine, executing common
services that can be seen nowadays in deployed and realistic networks.
2.3 Illicit Traffic
As was mentioned this project seeks to acquire traffic traces representative of security attacks. There-
fore, it is necessary emulate scenarios, where it will be generated illicit traffic, i.e., attacks. In this section
it will be discussed the illicit traffic that was considered on this work. The discussion will provide basis
to evaluate the illicit traffic later on this report. Several kinds of attacks, which have impact on traffic
behaviour, are now expressed and characterized.
The attacks that will be considered on this work can be classified into four broad categories, namely:
• Denial of Service, which consists on an attacker preventing legitimate users from accessing infor-
mation or services provided by a resource.
• Spoofing, which consists on forging ip source’s address. It is the act of using one host to impersonate
another by falsifying data and thereby getting illegitimate advantage.
• Injection Code, which involves code being injected straight into a program/script from an outside
source for execution at some point in time.
• Probing, which consists on gathering as much information as possible about a Web application and
its infrastructure. Basically, targeted web sites are scanned for known vulnerabilities in infrastruc-
ture software.
4https://www.virtualbox.org/5Citrix Inc. Citrix XenServer. http://www.citrix.com
9
Page 30
CHAPTER 2: CONTEXT AND RELATED WORK
• Fuzzers, which consists on sending malformed or non-standard data do some remote host and
observing how does that machine reacts. If the remote host’s response is slowed or stopped by
these attacks, it can be a clue of a serious vulnerability hosted in the protocol stack.
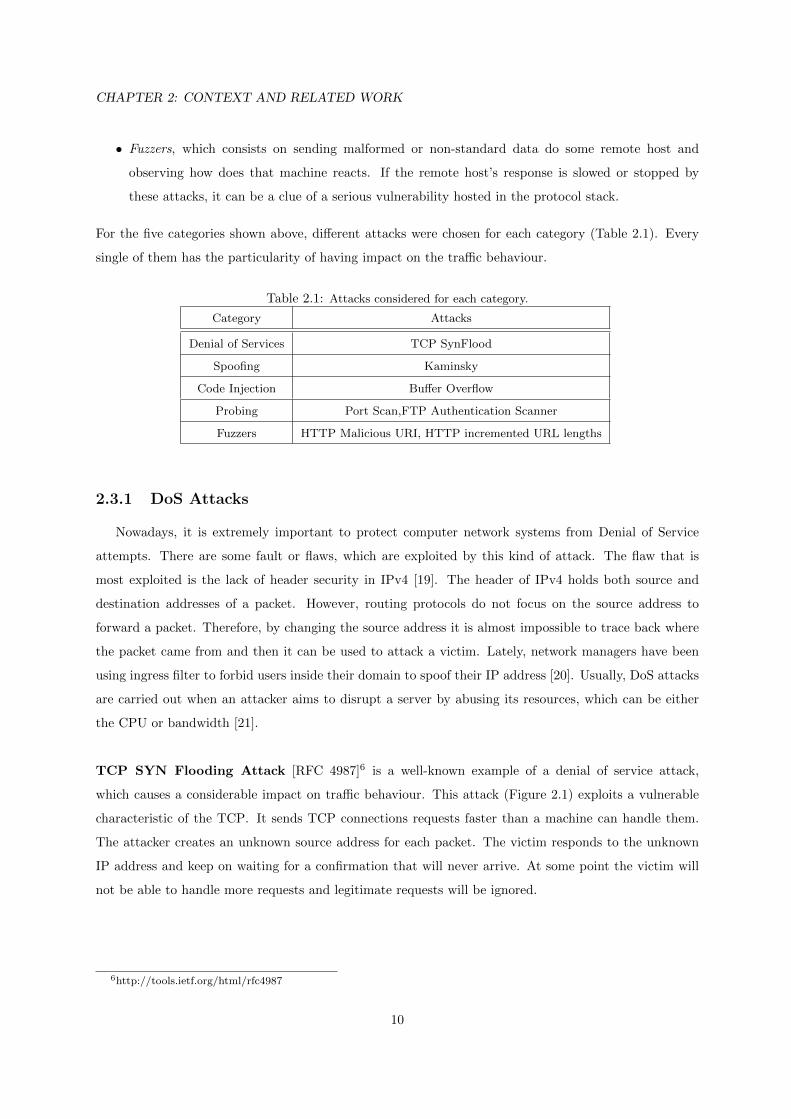
For the five categories shown above, different attacks were chosen for each category (Table 2.1). Every
single of them has the particularity of having impact on the traffic behaviour.
Table 2.1: Attacks considered for each category.
Category Attacks
Denial of Services TCP SynFlood
Spoofing Kaminsky
Code Injection Buffer Overflow
Probing Port Scan,FTP Authentication Scanner
Fuzzers HTTP Malicious URI, HTTP incremented URL lengths
2.3.1 DoS Attacks
Nowadays, it is extremely important to protect computer network systems from Denial of Service
attempts. There are some fault or flaws, which are exploited by this kind of attack. The flaw that is
most exploited is the lack of header security in IPv4 [19]. The header of IPv4 holds both source and
destination addresses of a packet. However, routing protocols do not focus on the source address to
forward a packet. Therefore, by changing the source address it is almost impossible to trace back where
the packet came from and then it can be used to attack a victim. Lately, network managers have been
using ingress filter to forbid users inside their domain to spoof their IP address [20]. Usually, DoS attacks
are carried out when an attacker aims to disrupt a server by abusing its resources, which can be either
the CPU or bandwidth [21].
TCP SYN Flooding Attack [RFC 4987]6 is a well-known example of a denial of service attack,
which causes a considerable impact on traffic behaviour. This attack (Figure 2.1) exploits a vulnerable
characteristic of the TCP. It sends TCP connections requests faster than a machine can handle them.
The attacker creates an unknown source address for each packet. The victim responds to the unknown
IP address and keep on waiting for a confirmation that will never arrive. At some point the victim will
not be able to handle more requests and legitimate requests will be ignored.
6http://tools.ietf.org/html/rfc4987
10
Page 31
2.3 ILLICIT TRAFFIC
Figure 2.1: TCP Syn Flooding Attack
Impact on Traffic
In a DoS attack should be considered that in most situations the attack is performed by a group of
attackers and the attacks are performed directly from their computers. In this kind of attacks it is usual
an attacker generate a large amount of requests to a server. This will be only detectable if the attacker
does not spoof the IPv4 source address. If the attacker spoofs the IPv4 source address, it will increase the
number of hosts that contact a server during an attack. An increased number of contacts may indicate
a possible attack.
Another warning sign, that might be experiencing an attack of this type, is the reduced number of
responses. When a DoS attack is occurring, the attacked is overwhelmed with a considerable quantity
of information in order to make the handling of requests a hard task. This should lead to the awareness
that there are more queries to the server than replies from it. Those kinds of analysis have emerged to
better understand the traffic behaviour of these attacks [22].
The average packet size may also indicate a possible attack. Typically, an attacker sends a large amount
of small packets. The smallest query that will not trigger an error response is still bigger than the ma-
licious packets. This happens because the malicious packets usually do not fill the Query field. The
distribution of the average packet size could imply the existence of the anomalous packets [1]. If this
factor is carefully analyzed it might be helpful to detect this kind of attacks.
11
Page 32
CHAPTER 2: CONTEXT AND RELATED WORK
2.3.2 Buffer Overflow
Broadly speaking, buffer overflow occurs, when software improperly handles more information into
the buffer than the space it has allocated in the memory. Since buffers can only hold a precise quantity of
data, when that capacity has been reached the data has to flow somewhere else, normally into a different
buffer, which can damage data that is already contained in that buffer.
FTP Stack-Based Buffer Overflow is an common attack that has a significant impact on traffic
networks. It exploits a flaw on ProFTPD servers. It sends to the server a large number of malicious
requests in orer to corrupt memory and execute arbitrary code.
Impact on Traffic
It can be easily concluded that an attack of this kind has an impact on the packets. In order to
perform a buffer overflow attack, the attacker may cause a malformed package in such a way that a buffer
in the server software can be spread out. As well as, an attacker can also increase the packet size to
execute a packet overflow. The manipulated data that is sent to the server needs to be large enough to
perform the buffer and to execute a usable code [23].
Generally, in a Buffer Overflow attack several attempts are made in order to get succeed. Therefore
a huge impact on traffic caused by those attempts may indicate that a buffer overflow attack is being
performed. Analyzing the traffic behaviour and its pattern enables the detection of this attack.
2.3.3 Port Scan
A Port Scan is commonly used to send several messages by an attacker whose attempting to break
into a computer to discover services. Mostly, a Port Scan attack approach is based on sending a message
to each port, one at a time. The type of reaction received from the server specifies whether the port is
used and then can be investigated for flaw. A port scan that does not provoke a reaction can be easily
discovered, but if there is a reaction it is really hard to recognize the traffic as a port scan [24].
Impact on Traffic
This attack, as was mentioned earlier pretends to discover hosts’ weaknesses by sending port probes.
An attacker can perform a Port scan attack in several ways [24]. Those ways are following described:
• Horizontal scan this method is a scan that is done from one host to many hosts inside the same
network on a service of a particular host.
• Vertical Scan this technique is executed by connecting a single host to a variety of ports, during
12
Page 33
2.3 ILLICIT TRAFFIC
a short period of time.
• Block Scan Block scan is performed by a combination of a horizontal and a vertical scan.
The technique that has been the target of research studies is the horizontal scan, which cause some impact
on the traffic. When a host make connections to a range of hosts in specific network it may indicate
that a horizontal scan may be performed. When a host that is being scanned does not respond to scan
it might also imply that a horizontal scan is being executed.
FTP Authentication Scanner
This attack explores the FTP protocol. It intends to make several attempts to successfully authenti-
cate in a FTP server. It test FTP logins on a range of machines. This attack can be performed using a
file, which contains usernames and passwords, to be used on the authentication attempts.
Impact on Traffic
As was mentioned, this attack performs several authentication attempts on a FTP server. This action
produces a lot of FTP traffic. All the requests and server responses cause a considerable impact on traffic
behaviour.
2.3.4 Atacking DNS Servers
The DNS is an essential part of the Internet. Therefore, it can be easy to deduce that DNS servers
have also been labelled as targets of security attacks. Actually, DNS servers have been the main targets
for attackers. As is well known, without DNS people would not be allowed to connect to their websites.
Those attacks are possible due to the fact of bugs in the DNS software and exploits in the DNS protocol.
It also can be possible practicing DoS attacks, overloading a host with packets taking up large amount
of bandwidth in order to make the DNS server unavailable for legitimate users, as was mentioned before.
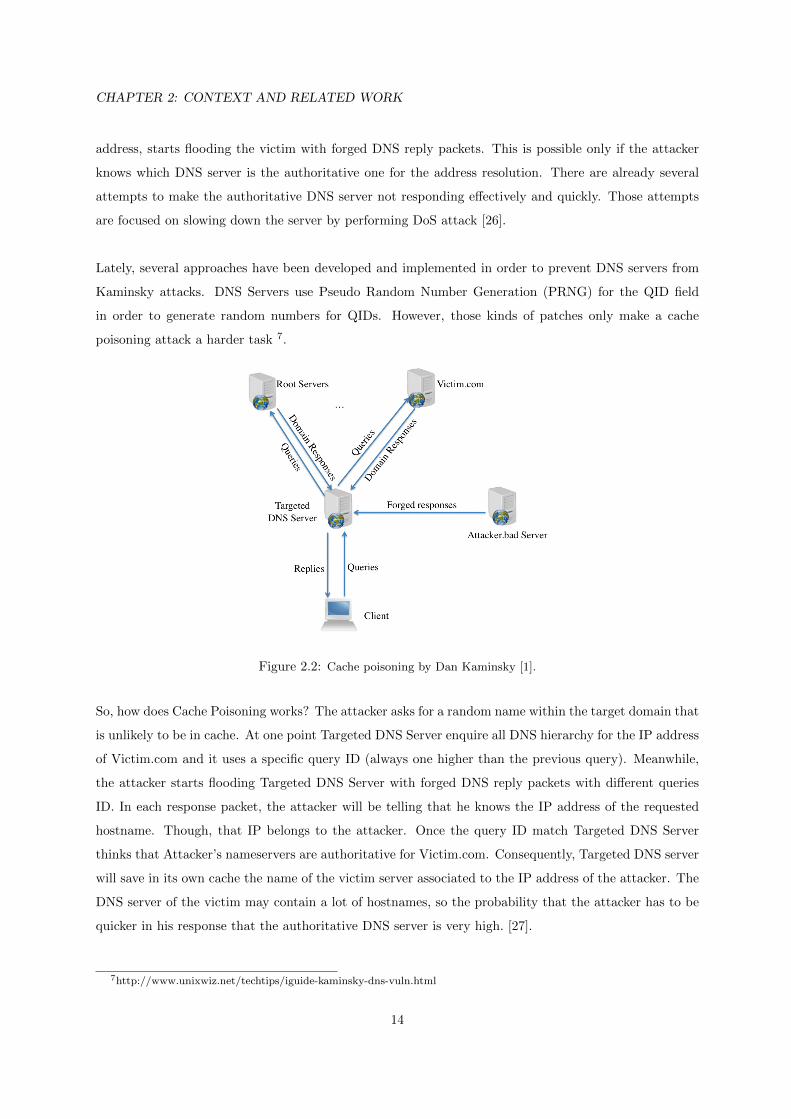
DNS Cache Poisoning - Kaminsky Attack
Security researcher, Dan Kaminsky, discovered a seriousness DNS cache poisoning (Figure 2.2) vul-
nerability, which raises the area for network security developers and administrators and it should cause
development of an ample plan to focus on this dangerous threat.
This attack exploits the lack of any signature validation on DNS entries, which allows the attacker
to inject forged resolves for a domain or host. It is possible to poison the cache of a DNS server with
recursive querying enabled or an end host. It is initiated at the right moment that a victim nameserver
ask for the address resolve. The attacker, knowing that the victim will shortly be asking to resolve an
13
Page 34
CHAPTER 2: CONTEXT AND RELATED WORK
address, starts flooding the victim with forged DNS reply packets. This is possible only if the attacker
knows which DNS server is the authoritative one for the address resolution. There are already several
attempts to make the authoritative DNS server not responding effectively and quickly. Those attempts
are focused on slowing down the server by performing DoS attack [26].
Lately, several approaches have been developed and implemented in order to prevent DNS servers from
Kaminsky attacks. DNS Servers use Pseudo Random Number Generation (PRNG) for the QID field
in order to generate random numbers for QIDs. However, those kinds of patches only make a cache
poisoning attack a harder task 7.
Figure 2.2: Cache poisoning by Dan Kaminsky [1].
So, how does Cache Poisoning works? The attacker asks for a random name within the target domain that
is unlikely to be in cache. At one point Targeted DNS Server enquire all DNS hierarchy for the IP address
of Victim.com and it uses a specific query ID (always one higher than the previous query). Meanwhile,
the attacker starts flooding Targeted DNS Server with forged DNS reply packets with different queries
ID. In each response packet, the attacker will be telling that he knows the IP address of the requested
hostname. Though, that IP belongs to the attacker. Once the query ID match Targeted DNS Server
thinks that Attacker’s nameservers are authoritative for Victim.com. Consequently, Targeted DNS server
will save in its own cache the name of the victim server associated to the IP address of the attacker. The
DNS server of the victim may contain a lot of hostnames, so the probability that the attacker has to be
quicker in his response that the authoritative DNS server is very high. [27].
7http://www.unixwiz.net/techtips/iguide-kaminsky-dns-vuln.html
14
Page 35
2.3 ILLICIT TRAFFIC
This is a serious damaging attack. By possessing the whole target domain, the attacker is able to control
everything that is associated to that resolving nameserver. For the attacker it is possible to redirect web
visitors, route email, etc to his own servers.
Impact on Traffic
As was mentioned before, the goal of this attack is to fake out the victim into thinking that the
attacker runs the domain in question. This attack causes a serious impact on the traffic behaviour.
A high number of responses to a query are a symptom of an unlawful attack. It is even more sus-
pect when is realized that the only difference among all responses is the query ID field in the DNS
header. The huge amount of replies is due to the query ID guessing. The number of replies from the
attacker will fluctuate depending on the DNS servers PRNG (Pseudo Random Number Generator) [28].
This is due to the fact that it is still possible to guess within certain number of packets what is the
next query ID that will be produced by the PRNG. In a network analyzer it is not possible to see the
content of the packet, however it can be clearly seen the increasing number of responses. Therefore, a
time sequence analysis of the ratio between the number of requests and the quantity of responses could
be exploited to find the increased reaction to a DNS server request.
Another factor, which may have a serious impact on traffic behaviour, is the increased amount of re-
cursive DNS requests to a DNS server. In the beginning of the attack, the attacker may request host
resolutions for a huge number of hosts in a domain. However, by doing several analyses it is possible to
observe this phenomenon and realize that at one point there is an amount of suspicious requests to a
DNS server.
2.3.5 Fuzzing Attacks
Fuzzing attacks [25] consist on causing a software or network failure by feeding it randomly generated
data. Usually it finds bugs or flaws in a target victim. It sends malformed data and observes how the
device reacts. The response will indicate if there is a serious vulnerability or flaw, or not, in a certain point.
Fuzzer HTTP Malicious URI and Fuzzer HTTP Incremented URI are two typical attacks
of this kind. Both of them overwhelm the target with malformed HTTP requests. Every single request
is a different combination of a URI.
15
Page 36
CHAPTER 2: CONTEXT AND RELATED WORK
Impact on Traffic
As was mentioned, this kind of attack overwhelms the target with a several HTTP requests, therefore
there is a large amount of data that is generated by fuzzing attacks in a network. These attacks have a
huge impact on the traffic behaviour.
2.3.6 Frameworks
Throughout this section has been describing attacks and traffic that those attacks generate. However,
it is necessary to produce that illicit traffic on the emulated networks. It was made an analysis of the
various software packages that implement security attacks. Since this work focus on attacks, which have
impact on traffic, NMAP and Metasploit emerged as the best option for this work.
NMAP
NMAP8 (“Network Mapper”) is an open source utility used to discover hosts and services on a
computer network. This tool was designed to be performed in large networks but it also works fine in
small networks and against single hosts. NMAP uses raw ip packets to know which hosts are available
on the network. Plus, it can get more information such as: services and operating systems that those
hosts are running, type of packet filters/firewalls used by those hosts, etc.
NMAP supports several methods of port scanning9. Each method intends to achieve a specific goal.
Next, some relevant techniques will be described:
• TCP SYN scan: It is executed on many hosts very quickly on a network with no firewalls. It
first opens a connection by sending a SYN packet, but it never finishes the connection.
• TCP connect scan: This scan is the default when SYN scan is not allowed to perform. It uses
the OS to establish a TCP connection.
• UDP scan: It is used to determine the UDP port status by sending packages without UDP header
to every single host.
• TCP ACK scan: It is used to map firewall rule sets.
• Idlescan: it is performed by sending packets with a forged ip address.
• FTP bounce scan: This kind of scan is used to scan for ftp servers configured as ftp proxies.
NMAP proves to be a powerful tool on port scanning procedures. It handles several of advanced tech-
niques for mapping networks filled with routers, firewalls and any other obstacle.
8http://nmap.org/9http://www.petri.co.il/port-scanning-with-nmap.htm
16
Page 37
2.3 ILLICIT TRAFFIC
Metasploit
The Metasploit framework [29] shall be used to generate illicit traffic. Metasploit is an open source
security software, which can be used to test vulnerabilities of computer systems and has a contribution of
a large developer community. It intends to provide useful information and tools for penetration testers,
security researchers and IDS signature developers.
In Figure 2.3 is illustrated an architecture overview10 of the Metasploit Framework which expresses all
the main components of this tool.
Figure 2.3: Metasploit Architecture Overview7.
• Framework Core: the core provides plugins with the framework and also an interface. It is com-
posed of several subsystems such as module management, session management, event dispatching,
and others.
• Framework Base: provide an easy way to work with the framework. It has some tools, which
allow functionalities such as configuration, logging and sessions.
• Interfaces: the Metasploit framework provides interfaces, which allows the user to interact with
the framework. There are several kinds of interfaces such as:
– msfweb, the metasploit web interface;
– msfgui, the metasploit GUI application;
– msfconsole, metasploit interactive session;
10http://netsec.cs.northwestern.edu/media/slides/metasploit.pdf
17
Page 38
CHAPTER 2: CONTEXT AND RELATED WORK
• Exploits: Metasploit contains more than 110 exploits, which can explore several protocols, such
as UDP, TCP, HTTP, FTP, SMPT, SSH, etc. They all cover multiple platforms and also explore
wireless (802.11) vulnerabilities.
• Payloads: After an exploit being executed the Metasploit provides a wide variety of choices to
execute threads in the remote target. These include Meterpreter, which allows users to control the
screen of a remote device and to browse, upload and download files.
• NOP Generators: NOP generators intend to obfuscate the NOP sequences and NOP sleds in
order to avoid IDSs from triggering on traffic patterns.
• Encoders: Encoders allow the payloads not being detected by encoding them. Payloads can also
trigger IDS signatures, so they must cross over the network without being detected.
As mentioned before this work intends to acquire traffic traces representative of security attacks. The
Metasploit provides several attacks, which can represent the illicit traffic to be generated on the emulated
networks. NMAP, in turn, provides several distinct port scans. It contains many port scanning mecha-
nisms, OS detection, version detection, and more, which make NMAP a powerful tool to scan small and
large networks. Therefore, these frameworks appear to be an appropriate tool to generate the illicit traffic.
All the attacks described on this section were considered on this work. All of them have impact on
the network behaviour. So, they shall be generated and analyzed in an emulated network in order to
identify anomalous events.
2.4 Licit Traffic
All attacks and illicit traffic described earlier shall be explored and analyzed in the most possible real-
istic environment. Therefore, licit traffic must be generated according to real networks implementations.
In this section different research studies, which reports the current traffic breakdown, are described and
analyzed.
Mainly, three different research studies [2, 4, 30] were considered in order to make a realistic charac-
terization of the background traffic. In [4] was used packet traces acquired using a high speed monitoring
box installed on the Internet link of two access networks. Every single packet seen on each direction
of the link was captured. In Table 2.2 are listed three traffic traces (GN, UN1 and UN2), which are
distinguished into several parameters: Date, time, period, source and destination IP addresses, number
of packets, bytes perceived, average of utilization and the average number of flows per 5-minute interval.
18
Page 39
2.4 LICIT TRAFFIC
The GN (Genome Campus) represents three institutions, which employ 1,000 researchers, administrators,
etc. UN1 and UN2, in turn, are organized by numerous academic, research and residential complexes
on-site. It was estimated a user population of 20,000.
Table 2.2: Traces Summary [4].
Set Date Day Start Dur Direc Src.IP Dst.IP Packets Bytes Aver.Util Aver.Flows.
GN 2003-08-19 Tue 17:20 43.9 h Bi-dir. 1455 K 14869 K 1000M 495 G 25Mbps 105 K
UN1 2004-01-20 Tue 16:50 24.6 h Bi-dir 2709 K 2626 K 2308 M 1223 G 110.5 Mbps 596 K
UN2 2004-04-23 Fri 15:40 33.6 h Bi-dir 4502 K 5742 K 3402 K 1652 G 109.4 Mbps 570 K
It can be concluded, by analyzing the table and its results that the two types of traffic traces (GN and
UN) are similar except in Peer to Peer (P2P) category. In GN is verified a low percentage of P2P traffic,
however that result it is not relevant due to the conditions of GN environments.
There are some interesting observations from these traces. In the UN network, web and P2P traffic
are the most dominant. In spite of the difference of the time capture between UN traces, their traffic is
generally similar. On the other hand, GN holds a considerable portion of FTP traffic. Researchers of this
study also report that encrypted flows (such as SSH/SSL) correspond to 1%-2% of the traffic in all traces.
Another relevant fact is that Nonpayload flows report approximately for one third of all flows in both
links. Researchers mention that a deep examination of these flows may indicate that the majority is
related to failed TCP connections on ports of well-known exploits worms. It probably may indicate that
several port scans were being performed while the traces were being captured.
The Unknown category, in turn, demonstrates that there are no guarantees that all flows in the traces
represented can be classified. The analysis of the all applications cannot assure the classification of all
applications participating on the Internet. In the case of the UN traffic, 4%-7% of all flows cannot be
identified.
In another study [2] it was intended to investigate the use of several statistical traffic categorization
methods for an ADSL provider managing many Point of Presence (PoPs).
In order to collect all traces it was used a passive probes located behind a Broadband Access Server
(BAS). The traffic of the BAS routes to and from the digital subscriber line access multiplexers (DSLAM)
and the Internet. Four packet traces were collected at three distinct ADSL PoPs in France from the same
ISP: MS-I, R-II, R-III and T-I. Each trace has at least one hour of complete bidirectional traffic, with
similar number of active consumers differing from 1380 to 2100.
19
Page 40
CHAPTER 2: CONTEXT AND RELATED WORK
In Table 2.3 are listed those four different situations, which have some relevant features related to space
and time: two traces (RII and RIII) were captured at the same location with an offset of seventeen
days between them. T-I was the earliest and longest trace captured. The remaining capture (MSI) was
performed at exactly the same time as RIII.
Table 2.3: Traces Summary [2].
Set Date Start Dur Size[GB] Flows[M] TCP[%] TCP Bytes [%] Local users Distant IPs
MS-I 2008-02-04 14:45 1h 26 0.99 63 90.0 1380 73.4 K
R-II 2008-01-17 17:05 1h 10m 55 1.8 53 90.0 1820 200 K
R-III 2008-02-04 14:45 1h 36 1.3 54 91.9 2100 295 K
T-I 2006-12-04 12:54 1h 48m 60 4.1 48 94.7 1450 561 K
For this work, researchers chose some Classes, which are mentioned in Table 2.4. As it can be seen in
the table HTTP traffic is divided into several classes: Webmail is classified as mail, HTTP streaming as
streaming, HTTP file transfers as FTP, and so on. P2P applications have their own class. However, P2P
applications, which are not so popular, are represented into the P2P-REST class.
On Figure 2.4 the application breakdown of the four different traces is illustrated . Researchers concluded
that the application breakdown on POPs is representative of the traffic witnessed on longer intervals. In
Table 2.5 is represented the approximate percentage values for each application illustrated on 2.4.
Figure 2.4: Breakdown in flows and bytes [2].
As in the previous research study it can be found some dominant applications. Once again, web and P2P
traffic emerged as the most dominants. On P2P applications, it can be observed that most bytes and
flows are related to eDonkey followed by Bittorrent and Gnutella. As it can be seen in Figure 2.4 a large
portion of traffic is related to streaming. Great part of HTTP Streaming class is due to Dailymotion
20
Page 41
2.4 LICIT TRAFFIC
Table 2.4: Breakdown in Flows (Bytes) [2].
Class Application/Protocol
WEB HTTP and HTTPs browsing
EDONKEY eDonkey, eMule obfuscated
MAIL SMTP, POP3, IMAP, IMAPs, POP3s, HTTP Mail
CHAT MSN, IRC, Jabber, Yahoo, Msn, HTTP Chat
HTTP-STR HTTP Streaming
OTHERS NBS, Ms-ds, Epmap, Attacks
DB LDAP, Microsoft SQL, Oracle SQL, mySQL
BITTORRENT Bittorrent
FTP Ftp data, Ftp control, HTTP file transfer
GAMES NFS3, Blizzard Battlenet, Quake II/III, Counter Strike, HTTP Games
STREAMING MS Media Server, Real Player, iTunes, Quick Time
GNUTELLA Gnutella
ARES Ares
TRIBALL Triball
P2P-REST Kazaa, SoulSeek, Filetopia, Others
NEWS Nntp
UNKNOWN -
and Youtube, which hold 80% of bytes. Some P2P streaming applications belongs to STREAMING class
due to, e.g., sport events and they are active only for a short period. Perhaps that is the reason why
sometimes such traffic cannot be seen in the analyzed data. The UNKNOWN class had generated bytes
between 8% and 24%, depending on the trace.
The third research study [30] performed analysis of traffic statistics long-term evolutions, for traces
collected every day, for 15 minutes, between 2001 and 2008, over trans-Pacific backbone links (the MAWI
dataset [31]). The aim of this study was to perform a longitudinal study of the evolution of the traffic
collected every year during seven years. The main datasets are on a daily basis packet traces and has
some relevant features related to space and time. Those traces were captured at two different transit
links of the WIDE network: One from 2001/01 to 2006/06 (hereafter link A) and then in another one
from 2006/10 to 2008/03 (hereafter link B). Due to the fact that traffic is asymmetric researchers had
to study the traffic separately for each direction: Traffic going to Japan (hereafter US2Jp) and outgoing
traffic (hereafter Jp2US ).
21
Page 42
CHAPTER 2: CONTEXT AND RELATED WORK
Table 2.5: Breakdown in Flows (Bytes) [2].
Set Web EDO MAIL Others x BT HTTP-STR FTP DB Streaming
MS-I 62% (50%) 5%(10%) 5%(5%) 15%(4%) 10%(5%) 1%(5%) 1%(10%) 1% (2%) - (5%) - (4%)
R-II 12% (35%) 10% (15%) 5% (5%) 20% (2%) 15% (10%) 5% (10%) 2% (10%) 1% (4%) - (5%) - (4%)
R-III 25% (20%) 15% (30%) 2% (5%) 30% (-) 12% (20%) 10% (5%) 2% (10%) 2%(-) 5% (5%) 2% (5%)
T-I 20% (25%) 25% (35%) 5% (5%) 15% (1%) 20% (20%) 10% (5%) - (2%) - (2%) - (5%) 5% (-)
The results obtained are quite similar to those acquired on the previous research studies. During the all
study period, TCP and UDP handled more than 90% of packets uninterruptedly. Also, ICMP packets
showed to have a relevant impact on traffic: More than 50% packets in Jp2US and 25% packets for
US2Jp. In TCP UDP mostly of packets consists of Web traffic. On A web traffic consists of 40% of valid
traffic for Jp2US, and for US2Jp was around 50-55%. On B, in turn, web traffic raises to approximately
60% in both directions. P2P traffic also has a considerable impact in the traffic evaluated during those
seven years. That kind of traffic represents around 30% of the packets, mainly Napster, Gnutella and
more recently Bittorrent. However, this traffic had a tendency to vanish over the years. However, that
decline does not represent a realistic traffic behaviour. Actually, it happens due to P2P hiding [32] .
All over the years the content of legitimate traffic did not change considerably. Web and P2P traffic
have been emerged as important elements on the traffic behaviour. Researchers also observed that a
significant number of anomalies were found to be consistent.
Three different and recent research studies were analyzed. All of them have their own results, however
they all converged to the same idea: Nowadays, traffic behaviour is mostly represented by web and P2P
traffic. Lately, streaming also emerged as an important element, which influences the traffic behaviour.
Common Internet services such as FTP, mail (Simple Mail Transfer Protocol (SMTP), IMAP,. . . ), new
protocols, DNS, etc. . . also considerably characterized the traffic behaviour and it has been remained
stable all over the years.
Those three studies represent the real traffic behaviour at the present time. Some common applica-
tions and services were considered on this work, based on these research studies, to generate background
traffic. The applications and services that were intended to be deployed on the emulated networks are
mentioned in Table 2.6.
As it can be seen on the table web and P2P traffic were seriously considered on this work. Streaming
traffic was also considered due to the increasing number of streaming applications on the Internet. Other
common services, such as FTP, were also intended to be implemented in order to generate the most
possible genuine traffic on the emulated networks.
22
Page 43
2.5 PREVIOUS WORK
Table 2.6: Traffic percentages in flows (bytes) of the applications/services.
Application/Service Flows (Bytes)
Web 35-40% (30-40%)
Mail 5-10% (5-10%)
Streaming 10-15% (10-15%)
P2P 20-25% (20-25%)
FTP 1-10% (5-15%)
Chat 1-5% (1-5%)
Games 1-5% (1-5%)
Network Management 5-15% (1-5%)
2.5 Previous Work
This project follows on from another one [3], which created a controlled emulation environment to
establish and obtain the ground-truth of a given topology.
In the project [3] different topologies were built. Figure 2.5 is a scenario example which represents
the interaction between two main routers of two departments of Universidade de Aveiro and a backbone
router connected to the server. All of the three routers provide redundancy. On this scenario some
services were configured in the routers and server: Dynamic Host Configuration Protocol (DHCP) server,
DNS, OSPF, Simple Network Management Protocol (SNMP) Agent, Berkeley Internet Name Domain
version 9 (BIND9) and ProFTPD.
Figure 2.5: Scenario A [3].
23
Page 44
CHAPTER 2: CONTEXT AND RELATED WORK
The project of this document relied on the work made in Universidade de Aveiro. However, this project
looked for further goals. It developed different emulated scenarios that faithfully reproduce networks
implemented in the real world. Plus, in different scenarios were implemented more applications and
services according to the statistics gathered in the previous section. More sophisticated attacks, as the
ones described in 2.3, were implemented on the emulated networks.
Summary
In this chapter it was introduced the fundamental concepts, starting with a brief overview of the
network evaluators which can provide a controlled network environment. For this project was adopted
the emulation method due to its capabilities on mimic realistic scenarios. Furthermore, it was described
the main attacks which have impact on traffic behaviour, with emphasis on the FTP Authentication
Scanner, FTP Stack-based Buffer Overflow, Kaminsky’s DNS cache poisoning attack, TCP SynFlood,
Portscans and Fuzzers. For the licit traffic, three different studies were analyzed in order to get the real
and actual traffic behaviour on common deployed networks. It was also described a previous work [3]
made in the Universidade de Aveiro which has an important contribute to this project.
24
Page 45
3Emulated Networks
This chapter presents the architecture that will be used throughout the remainder of the document.
All the necessary topologies, configurations and applications will be reported and discussed. Plus, the
traffic production generated will be also explained. The traffic was divided in two categories: Licit and
Illicit. The generation of both kind of traffic will be detailed and the amount of traffic produced for
each service will be also analyzed. Finally, it will be explained how the data generated on the emulated
networks was captured.
The main target of this project was to acquire a high quality ground-truth by emulating different network
topologies where licit and illicit traffic shall be generated as it is shown on Figure 3.1. This work relied
on the previous work described on previous chapter.
25
Page 46
CHAPTER 3: EMULATED NETWORKS
Figure 3.1: The proposed architecture.
Emulation is based on GNS3 and virtualization. All the network devices (emulated and real) are con-
figured in order to create a network environment. For that, some important points were considered to
develop the proposed work:
• In terms of network topologies it was proposed to develop the scenario described in 2.5. That
topology represents an approximation to the network of Universidade de Aveiro. The motivation
was focused on generate more licit and illicit traffic thus making the scenario more realistic in terms
of traffic behaviour. However, this scenario was holding GNS3, which overwhelms PC resources.
Therefore, this work intended to build an alternative, which would not need an emulation platform
to develop it. It consisted in a topology similar to the Instituto Superior Tecnico network to emulate
in a high-level abstraction-modeling network with highly scalable model.
• In terms of licit traffic it shall include at least all the traffic described in the previous section, such
as DNS, HTTP, HTTP-Streaming, FTP, P2P and SMTP with the respective percentage values
stipulated on section 2.4.
• In terms of illicit traffic it intend to include at least the attacks described earlier in section 2.3.
Those attacks have a considerable impact on traffic network which can causes changes in the traffic
behaviour.
In a high level overview this is how this project looked to achieve the goal of acquire a high quality data
to be used as a ground-truth for the evaluation of statistical methods used to detect security attacks.
The development of this project was based on five different phases, as shown in Figure 3.2: Topologies
Development and their configurations, Technologies for Applications and Attacks, Traffic Generation,
26
Page 47
3.1 TOPOLOGIES
Capturing Data and Grouping Packets per Service/Attack. From now on this chapter will focus on these
five different phases and describe every single step of them.
Figure 3.2: The five main phases of project development.
3.1 Topologies
For this work two different topologies were used. Both of them represent realistic scenarios which
can be seen deployed in Universidade de Aveiro and Instituto Superior Tecnico; those topologies were
emulated in a high-level abstraction modeling network with highly scalable model.
Next, on Figure 3.3, is illustrated the emulated network (hereafter EN1) based on the network developed
in the previous work earlier mentioned on section 2.5.
Figure 3.3: EN1 based on [3].
27
Page 48
CHAPTER 3: EMULATED NETWORKS
This emulated network was developed on three different physical machines. On the physical server were
four virtual servers (Cluster 1) performing services, such as FTP, HTTP, HTTP-Streaming, SMTP and
BitTorrent. On PC1 was the emulated network supported by GNS3 and four virtual end-hosts (Cluster
2). Finally, on PC2 were also four different virtual end-hosts (Cluster 3). One virtual terminal of Cluster
2 and 3 was executing licit and illicit traffic. The other end-hosts were all executing exclusively licit traffic.
On Figure 3.4 is shown the emulated network which represents a high scalable model of the IST’s network
(hereafter EN2). This network is represented by a star model where each Cluster is connected to a central
switch.
Figure 3.4: EN2 based on the IST’s network. 1.
This emulated network was also developed on three different physical machines (one physical server and
two PCs), which are represented as Clusters in the figure. Every physical machine had six different virtual
end-hosts.
The Cluster 1 is represented by six virtual servers running services, such as FTP, HTTP-Streaming,
SMTP, BitTorrent and HTTP. The Clusters 2 and 3 represent the Local Area Network (LAN)’s inside
each department. Every LAN has a total of six virtual end-hosts, each of them making several requests
to every single server on Cluster 1. On Cluster 2 there are 2 hosts executing attacks, as well as another
legitimate applications, in order to perform illicit traffic. On Cluster 3, in turn, there is one end-host
performing only attacks.
28
Page 49
3.2 CONFIGURATION OF NETWORK DEVICES
3.2 Configuration of Network Devices
This section describes all the configurations involved in all devices (emulated or real) of the both emu-
lated networks. It is mainly focused on EN1 for having more emulated components. All the configurations
made on EN2 are nearly the same on the EN1.
3.2.1 Servers
In both topologies the Cluster 1 is represented by different virtual servers. Those servers were virtual
machines in one single physical server (Figure 3.5). In this work the servers would have to run multiple
services at the same time. Therefore, the server virtualization in one single physical server emerged
as a better option due to performance issues. Server virtualization is a proven technology that allows
developing multiple virtual machines in one single physical server. Each virtual machine is totally isolated
from other ones, which allows running different operating systems and applications.
Figure 3.5: HP ProLiant DL160 G6 L5630 4GB (1P) 4-core, 2,13 GHz, 12 MB L3, 40W.
Webmin
Webmin1 is a web-based interface for system administrator for Unix. Instead of manually edit configu-
ration files and run commands to create accounts, Webmin allows setting up a web server and performing
a lot of tasks on it. It provides a web interface to manage all services that a single server handles. The
web server and all its programs are written in Perl version 5. Using any browser that supports tables
and forms, it is possible to setup accounts, Apache, DNS, file sharing and so on. It also performs auto-
matically updates of the all required configuration files.
In all virtual servers of Cluster 1 was installed Webmin in order to have a better efficiency on installing
and configuring every different services. The Webmin page can be accessed on port 10000 of each server
(http://ip.server.address:10000/ ).
Xen Server
All the servers represented on Cluster 1 were implemented on XenServer virtual machine which is
an enterprise version ox Xen from Citrix 2. Four virtual machines (six in EN2) were setup for emula-
tion matters. Each of those virtual machines were running four different services, named FTP, SMTP,
1http://www.webmin.com/2Citrix Inc. Citrix XenServer. http://www.citrix.com/
29
Page 50
CHAPTER 3: EMULATED NETWORKS
HTTP-Streaming and HTTP. However one of those six servers was running two additional services: DNS
and DHCP.
Each virtual machine is assigned 512MB of memory and adequate disk space. In the following table
are represented some of the configurations and applications of each virtual machine.
Table 3.1: Servers Characteristics.
No. Memory(MB) Services
1 512 DHCP, DNS, FTP, HTTP, HTTP-Streaming, SMTP
2 512 FTP, HTTP, HTTP-Streaming, SMTP
3 512 FTP, HTTP, HTTP-Streaming, SMTP
4 512 FTP, HTTP, HTTP-Streaming, SMTP
Summarizing, every single server of Cluster 1 was a virtual machine implemented by XenServer in a
HP ProLiant DL160 physical server. Each server was running different services remotely managed by
Webmin program that was installed in every virtual server. The services implemented on Cluster 1 will
be described in section 3.3.
3.2.2 Clients
The clients that were emulated are the hosts represented on Cluster 2 and 3. In this section it will
be described how the emulated hosts were connected to the real equipment in order to mimic a realistic
network. All the configurations are mainly related to the EN1 (Figure 3.3).
This work intends to emulate end-hosts requesting different kinds of services to externals servers. For
that, as was earlier mentioned, it was resorted to the virtualization technology. It was used Virtual Box,
which is available on linux repositories, to execute the virtualization of all end-hosts of Cluster 1 and
Cluster 2 of both topologies. Virtual Box also provides bridged networking technology for its virtualized
machines.
Since that in EN1 the PC1 was handling an emulated network executed in GNS3 environment it was
necessary to develop a combination of real, emulated and virtual equipment. For that, each virtual end-
host, of Cluster 1, was associated to a virtual interface in order to connect to the emulated network in
GNS3. Plus, it was needed to connect all the virtual and emulated components of PC1 to the external
and physical server. For that it was used the bridge technology in order to gather virtual interfaces,
which were associated to the virtual end hosts, with the external interface of PC1.
30
Page 51
3.2 CONFIGURATION OF NETWORK DEVICES
Linux repositories provides two tools that were used to guarantee the connection of real and emulated
equipment:
• Bridge, is performed on the data link layer and allows to connect two networks segments. Ethernet
bridges represent the software analog to a physical Ethernet switch, which can be used to connect
multiple Ethernet interfaces.
• TUN/TAP interface, is a software that only exist in the kernel and has no physical hardware
component. It can mimic a real network adapters and their main difference is that a tap interface
outputs full Ethernet frames, while a TUN interface outputs raw IP packets. Since in TUN interfaces
are no Ethernet headers added by the kernel, TAP interfaces emerged as a better option for this
work. Plus, with TAP interfaces is possible to connect them to the bridge.
These two tools provided by Linux repositories allow the creation of a bridge to connect the emulation
network to real devices and also the emulation of end-hosts inside the emulated network.
3.2.3 Emulated Routers
Network emulation can combine real equipments with emulated networks. As mentioned the emu-
lated network of EN1 was developed on GNS3 platform, which contains several useful characteristics to
build a network. In GNS3 can be found an entire list of all devices that can be emulated as routers,
ATM switches, Ethernet switches PCs, Clusters among others. Although the platform contains PCs to
be emulated, it was decided to use virtual end-hosts in order to support the execution of several services.
The computers emulated by GNS3 are very limited for this purpose.
The GNS3 also provides a console where it can be seen the Dynagen commands and a topology summary
where is described all the nodes involved in the emulated network and their links to other devices. It also
permits to design the emulated network in an environment for that purpose. All the items that GNS3
allows to emulate can be used for that nature.
In GNS3, as was mentioned, is available a whole number of devices that can be emulated in GNS3
environment. However, some of these nodes (mainly routers) require an IOS image associated with it to
be emulated. Next, in Table 3.2 is shown a list of IOS images that is supported by GNS3.
GNS3 has an additional tool in its environment to prevent the PC overwhelming resources. During the
emulation time, GNS3 can waste PC resources in a fasting time period. In order to avoid that painful
situation and optimize PC resources used by GNS3 the tool Idle PC emerged as a good option. The
user for every single router in the emulated network calculates this value. Once a value is calculated and
31
Page 52
CHAPTER 3: EMULATED NETWORKS
Table 3.2: List of current Cisco IOS images supported by GNS3.
List of Cisco IOS images
1710 2611 2691
1720 2611XM 3620
1721 2620 3640
1750 2620XM 3660
1751 2621 3725
1760 2621XM 3725
1760 2621XM 3745
2610 2650XM 7200
associated to a router the PC resources will be only used when needed.
Router Interface Configuration
In all routers was necessary to configure every single interface. For that, it was needed to execute IP
addressing commands as shown in the Figure 3.6.
Figure 3.6: Router interface configuration example.
As it can be seen in the previous example, it was selected the Ethernet interface (Ethernet0) to address it
with the ip 192.168.30.1 followed with the 255.255.255.0 as the subnet mask. The command no shutdown
allows to set the interface on permanently.
Open Shortest Path First (OSPF)
The OSPF is a routing protocol for IP networks. It keeps track of a whole topological database of all
connections in the local network. This protocol is performed as described bellow:
In EN1 all the routers emulated were configured with OSPF protocol in order to create their routing
tables and get the same description of the topology of the local network. The Figure 3.7 presents the
basic commands to use to configure OSPF protocol in a single router.
32
Page 53
3.3 TECHNOLOGIES FOR APPLICATIONS AND ATTACKS
Figure 3.7: OSPF configuration example.
In this configuration example is defined the OSPF process number 87. It is possible to use a different
number for every router, since it does not propagate outside of the router. It is also define the area ID of
a network that is directly connected to the router (0.0.0.0) and delineates the wildcard (255.255.255.255)
mask for that network. Finally, it is defined the area of the OSPF process (area 0). In case of a small
network, this can take always the value zero (0), however for larger networks, the area IDs should be
accurately planned.
3.3 Technologies for Applications and Attacks
As was reviewed in section 2.4 and 2.3 some services and attacks has a huge impact on real networks
and also characterize the real world wide networks behaviour. The main transport protocols (UDP and
TCP) in common networks were faithfully explored and deployed in the emulated networks. For this
work it was considered to explore services and attacks that usually run over these two protocols. Next, in
Tables 3.3 and 3.4, is illustrated each service and each attack that was explored on the deployed emulated
networks.
Table 3.3: Emulated services.
Services
BitTorrent
DHCP
DNS
FTP
HTTP
HTTP-Streaming
SMTP
Table 3.4: Emulated attacks.
Attacks
FTP Authentication Scanner
FTP Stack-based Buffer Overflow
Fuzzer HTTP Long String
Fuzzer HTTP String URI
Kaminsky
Port Scan
TCP SynFlood
Each server was running services, such as FTP, HTTP, HTTP-Streaming and SMTP, during the emula-
tion time. Though, one server was running two additional services, named DHCP and DNS. BitTorrent
was also another important service running on the emulated networks, but that was generated among
33
Page 54
CHAPTER 3: EMULATED NETWORKS
hosts of Cluster 2 and 3.
Regarding the illicit traffic, in EN1 one host of Cluster 2 and 3 was executing licit and illicit traffic.
In EN2, two hosts of Cluster 2 were running illicit traffic, as well as licit, while in Cluster 3 one single
host was exclusively generating illicit traffic.
In this section all the applications that were generated and its configurations will be described. Plus, the
illicit traffic and the attacks that were used during the emulation time will also be reported.
3.3.1 Licit Traffic
Seven different applications were chosen, according to the studies previously analyzed. Those services
that were deployed on the emulated networks will be following described.
BitTorrent
BitTorrent [RFC 5694]3 is a peer-to-peer file sharing protocol that allows sharing out large amounts of
data all over the networks. This protocol was implemented through all emulated hosts of both topologies.
Two different tools were used to implement BitTorrent:
• Transmission4, is a open source BitTorrent client with several features included such as encryption
and tracker editing. It was used to create the torrent and make the content available for uploading
purposes. This two actions were madden before the emulation period.
• Aria2 5, is a utility for downloading files, which has a segmented downloading engine in its core. It is
able to download one file from several URLs. After downloading an entire file, aria2 put it available
for any other request to download it. In Figure 3.8 is an example of using aria2 for download a
torrent file and start the interaction between other peers.
Figure 3.8: Example of a HTTP-Streaming client command.
To perform this protocol it was needed to install a Tracker in one server in order to assists in the com-
munication among peers using BitTorrent. For that, it was installed the RivetTracker 6 on one server of
the Cluster 1. It uses MySQL as the database backend and it works as most other trackers. It provides
detailed connection statistics and optional support for HTTP Seeding.
3http://tools.ietf.org/html/rfc56944http://www.transmissionbt.com/5http://aria2.sourceforge.net/6http://www.rivetcode.com/software/rivettracker/
34
Page 55
3.3 TECHNOLOGIES FOR APPLICATIONS AND ATTACKS
DHCP
DHCP [RFC2131]7 is a protocol to assign dynamic IP addresses to devices on a network. This proto-
col uses an amount of time that a given IP address will be valid for a computer. This time can diverge
depending on how long a user is likely to require Internet service.
In order to provide DHCP service to the emulated networks it was used DHCPd. DHCPd is also a
service available on the Linux repositories. It allows to allocate address pools in each subnet and enters
them into the dhcpd.conf located in /etc/dhcp3/ directory. On start-up, dhcpd interprets that file and
stores a whole list of available addresses on each subnet in memory. When a client requests for an ip
address, dhcpd assigns an address for it.
DNS
DNS [RFC 1035]8 is an Internet service that translates a computer’s fully qualified domain into an
IP address when queries are made. It is implemented using two different elements: the DNS server and
the DNS client (or resolver).
DNS is an hierarchical structure. On the top is the root, which is the start of all branches in the
DNS tree. Every single branch moves down from level to level. DNS addresses are mentioned to from
the bottom up with the root at the far right.
Berkeley Internet Name Domain (BIND)9 is available on Linux repositories and it permits to config-
ure the DNS zone file, which is stored in /etc/bind/zones. It is also possible to configure the reverse zone
file, stored in the same directory, which allows to get run the process of Reverse DNS Lookup.
FTP
FTP [RFC 959]9 is a standard Internet protocol that runs over TCP. It provides a file transfer service
between different hosts on the Internet. FTP is an uncommon service in that it utilizes two different
ports: Data (20) and Command (21) ports.
In every single server of Cluster 1 of both topologies it was implemented FTP service by installing
ProFTPD10. ProFTPD is available on linux repositories and it provides a FTP Server. This solution
permits to emulate the process of download and upload files. The main configuration file of ProFTPD
7http://www.ietf.org/rfc/rfc2131.txt8http://www.ietf.org/rfc/rfc1035.txt9http://tools.ietf.org/html/rfc959
10http://www.proftpd.org/
35
Page 56
CHAPTER 3: EMULATED NETWORKS
(proftpd.conf ) can be found in the /etc/proftpd directory.
To generate traffic in the emulated networks it was necessary to resort to a tool which allows down-
load and upload using FTP protocol. Curl emerged as an adequate tool for these purposes. It is a
command line tool available in Linux repositories. The command is designed to work without user in-
teraction. It provides several of useful solutions such as user authentication, FTP download and upload
and file transfer resume.
Below, in Figure 3.9 is an example of downloading a file with FTP protocol using Curl. As it can
be seen, FTP is the protocol used to access the FTP server using specific credentials, such as password
and username to download the file foto.png.
Figure 3.9: Example of FTP downloading using Curl.
The command line for upload from a FTP server, in turn, can be shown as the example of the Figure
3.10. As the previous example, the protocol used is FTP using credentials for the authentication.
Figure 3.10: Example of FTP uploading using Curl.
HTTP
The HTTP [RFC 1945]11 is the underlying protocol exploited by the World Wide Web. HTTP clients
(such as Web Browsers) and servers (such as Web Servers) interact via HTTP request and response mes-
sages. It runs over TCP connections. This application protocol uses TCP port 80 by default, although
other ports, such as 8080, appear also as an alternative.
In order to perform HTTP traffic all over the emulated networks it was necessary to set up a LAMP12(Linux
Apache MySql PHP) server. It is the most commonly used combination for setting up a Web Server. All
the components of a LAMP server can be found in the Linux repositories.
For this work it was used six different websites, named CNN, Eurosport, Publico, A Bola, El Pais
and Sky News, which were stored in the Apache’s default document root(/var/www/ ). This is due to
11http://www.ietf.org/rfc/rfc2616.txt12http://digitalfire.com/dreamsite/LAMP.html
36
Page 57
3.3 TECHNOLOGIES FOR APPLICATIONS AND ATTACKS
the fact that this websites own several kinds of content which permits to generate even more traffic when
is performed a HTTP request.
Figure 3.11: Example of a HTTP request command.
HTTP-Streaming
HTTP-Streaming [RFC 6202]13 (also known as HTTP server push) is a method for sending data from
a web server to a web client (e.g. browser). Usually the web server does not finish a connection after
response data has been served to a client. Instead, the web server leaves the connection open such that
if an event is alerted, it can be sent to one or several clients. Nowadays, as was discussed on section 2.4,
this kind of service is common and has a huge impact on real networks. Web Servers, such as Youtube
or Dailymotion, are a realistic example of that.
To perform HTTP-Streaming traffic on both emulated networks it was used VideoLan Client (VLC)14
software. This is a free and open source cross-platform multimedia player that plays most multimedia
files in several streaming protocols. For the reasons mentioned earlier it was adopted the approach of
HTTP-Streaming in order to mimic as realistic as possible the real behaviour and impact that this pro-
tocol has nowadays in real networks implementations.
Next, in figure 3.12, is shown an example of executing a HTTP-Streaming service in the server. As it can
be seen, the server with the IP address 192.168.0.1 is providing HTTP-Sreaming through the port 1234.
Figure 3.12: Example of a HTTP-Streaming server command.
In Figure 3.21, in turn, is represented the command line executed from the client side for getting the
HTTP-Streaming service provided by the server.
Figure 3.13: Example of a HTTP-Streaming client command.
13http://tools.ietf.org/html/rfc620214http://www.videolan.org/vlc/
37
Page 58
CHAPTER 3: EMULATED NETWORKS
SMTP
SMTP [RFC 2821]15 is an outgoing mail server protocol that is used to transfer e-mail messages among
hosts. However, this protocol is limited on queuing messages at the receiving hosts. Due to this fact
SMTP protocol is commonly used with on of two other protocols, named Post Office Protocol (POP)3 and
Internet Message Access Protocol (IMAP). These two protocols let the host save messages in a server
mailbox and download them from the server. Basically, users typically use a program, which employ
SMTP protocol, for sending e-mail and either POP3 or IMAP for receiving them.
As alternative to the widely-used Sendmail program emerged POSTFIX16. POSTFIX was developed
by Wietse Venema and is available on Linux repositories. It supports SMTP and runs in a chroot en-
vironment. In POSTFIX it can be found features such as POP3, Maildir and Mailbox format, Virtual
domains and MySQL Database.
3.3.2 Illicit Traffic
As stated in section 2.3, five different categories were studied and analyzed for this work. For those
categories were selected different scenarios attacks, named TCP SynFlood, Kaminsky, Buffer Overflow,
Port Scan, FTP Authentication Scanner, FTP Stack-based Buffer Overflow Fuzzer HTTP String URI,
and Fuzzer HTTP Long String. All these attacks were performed by the all-malicious end-hosts earlier
reported. However, the Port Scan attack was executed only for one end-host due to reasons that will be
later described.
To perform those attacks two different frameworks were used: Metasploit and NMAP. NMAP tool was
mainly used to perform Port Scans in the emulated networks. Metasploit, in turn, had the purpose of
executing other kind of attacks that have a serious impact on the networks. In Table 3.5 are mentioned
those attacks used by Metasploit.
Table 3.5: Attacks deployed by each framework.
Metasploit
FTP Authentication Scanner
FTP Stack-based Buffer Overflow
Fuzzer HTTP Malicious URI
Fuzzer HTTP Incremented URI
Kaminsky
TCP SynFlood
15http://www.ietf.org/rfc/rfc2821.txt16http://www.postfix.org/
38
Page 59
3.3 TECHNOLOGIES FOR APPLICATIONS AND ATTACKS
In Metasploit every single attack can be used by a different module as noted in section 2.3. For this work
were used two different Metasploit modules, such as Auxiliary and Exploit. The way that the attacks
were generated and configured in the emulated networks differ among them. Then, it will be described
all the attacks mentioned earlier, their configurations and module options17.
FTP Authentication Scanner
This attack can be executed by model located in auxiliary/scanner/ftp/ftp login on Metasploit frame-
work. This attack executes FTP logins on a range of machines and reports succeeded logins. As it can
be guessed this attack performs a large amount of traffic by doing all those attempts. Bellow, in Table
3.6, is described every single option of this module that was used to configure this attack.
Table 3.6: Module options for Scanner FTP Login.
BLANK PASSWORDS Try blank passwords for all users (default: true)
BRUTEFORCE SPEED How fast to bruteforce, from 0 to 5 (default:5)
PASSWORD A specific password to authenticate with
PASS FILE File containing passwords, one per line
RHOST The target address range or CIDR identifier
RPORT The target port (default:21)
USERPASS FILE File containing users and passwords separated by space, one pair per line
FTPTimeout The number of seconds to wait for a reply from an FTP command
TCP::max send size Maxiumum tcp segment size. (0=disable)
TCP::send delay Delays inserted before every send. (0=disable)
FTP Stack-based Buffer Overflow
This attack can be found in the module on exploit/linux/ftp/proftp telnet iac Metasploit framework.
It exploits a stack-based buffer overflow in ProFTPd servers. It sends malicious data in order to damage
the server memory and execute arbitrary code. Some options of this module that were used in this work
to configure the attack are described in Table 3.7.
Table 3.7: Module options for FTP Stack-based Buffer Overflow.
RHOST The Target Address
RPORT The target port (default 21)
CHOST The local client address
ConnectTimeout Maximum number of seconds to establish a TCP connection
TCP::max send size Maxiumum tcp segment size. (0=disable)
TCP::send delay Delays inserted before every send. (0=disable)
17http://www.metasploit.com/modules/
39
Page 60
CHAPTER 3: EMULATED NETWORKS
Fuzzer HTTP Malicious URI
This module explore the HTTP protocol. It sends a chain of HTTP GET requests with malicious
Uniform Resource Identifier (URI)s. This attack has a huge impact on traffic network. It performs several
requests until being succeed. Every single request is a different combination of a URI.Next, in Table 3.8,
are represented the options that were used for this module.
Table 3.8: Module options for Fuzzer HTTP Malicious URI.
RHOST The target address
RPORT The target port (default 80)
URIBASE The base URL to use for the request fuzzer (default:)
VHOST The virutal host name to use in requests
CHOST The local client address
CPORT The local client port
TCP::max send size Maxiumum tcp segment size. (0=disable)
TCP::send delay Delays inserted before every send. (0=disable)
Fuzzer HTTP Incremented URI
Like the previous one this attack also explores the HTTP protocol. Its module is designed by auxil-
iary/fuzzers/http/http get uri long on Metasploit framework. It also generates a large amount of traffic in
a network. It sends a series of HTTP GET requests with incrementing Uniform Resource Locator (URL)
lengths. In order to deploy this attack it was necessary to configure some options of this module. Those
options are described in Table 3.9.
Table 3.9: Module options for Fuzzer HTTP Incremented URI.
MAXLENGTH The longest string length to try (default: 16384)
RHOST The target address
RPORT The target port (default 80)
URIBASE The base URL to use for the request fuzzer (default:)
VHOST The virutal host name to use in requests
CHOST The local client address
CPORT The local client port
TCP::max send size Maxiumum tcp segment size. (0=disable)
TCP::send delay Delays inserted before every send. (0=disable)
Kaminsky
The Kaminsky attack, as was described in section 2.3, has a huge impact on traffic due to the amount of
queries and responses involved in the attack. Its module can be found on auxiliary/spoof/dns/BailiWicked domain.
This module attacks a flaw in DNS implementations which was discovered by Dan Kaminsky. It is per-
40
Page 61
3.3 TECHNOLOGIES FOR APPLICATIONS AND ATTACKS
formed by sending random hostname queries to the target DNS server with spoofed replies. Eventually,
a query response ID will match and the packet will be accepted and the DNS cache will be poisoned from
that moment. In Table 3.10 are described some options of this module that were used to implement this
attack.
Table 3.10: Module options for Kaminsky Attack.
DOMAIN The domain to hijack (default: example.com)
INTERFACE The name of the interface
NEWDNS The hostname of the replacement DNS server
RHOST The target address
SRCADDR The source address to use for sending queries (accepted: Real, Random) (default: Real)
SRCPORT The target server’s source query port (0 automatic)
TCP SynFlood
This attack performs a TCP SYN flooder and its module can be found in auxiliary/dos/tcp/synflood.
It causes a DoS attack by sending several TCP SYN packets to a server or even a host. Due to this
fact, this attack also generates a lot of network traffic and has a considerable impact on its behaviour.
In Table 3.11 are represented some options of this module that were used to implement this attack.
Table 3.11: Module options for TCP SynFlood.
INTERFACE The name of the interface
NUM Number of SYNs to send (else unlimited)
RHOST The target address
RPORT The target port (default 80)
SHOST The spoofable source address (else randomizes)
VERBOSE Enable detailed status messages
Port Scan
As was earlier reported, a Port Scan is commonly used to send several messages in order to discover
flaw in remote hosts. It is not easy to annotate this attack. Due to this fact, it was important to execute
Port Scans attacks by an end-host that was producing exclusively illicit traffic. Therefore, this attack
was performed in EN2 by one host of Cluster 3 that was executing only attacks. In this case, it is much
easier to gather all the Port Scan traffic.
NMAP tool was used to perform this attack. NMAP allows getting any kind of information, such as
services, firewalls, etc. Next, in Figure 3.14, is an example that was used to execute a portscan attack
for this work.
41
Page 62
CHAPTER 3: EMULATED NETWORKS
Figure 3.14: Example of a nmap command to perform port scans.
In the previous example is represented a TCP connect scan. In this case NMAP asks to establish a
connection with the target machine and port by issuing the connect() system call. This level system call
is used by web browsers and P2P clients to establish a connection.
3.4 Traffic Generation
In section 2.4 it was analyzed the impact of each application in common real networks. It was con-
cluded that they all differ from each other in terms of their impact. HTTP and BitTorrent services
emerge as the most representatives of traffic behaviour. FTP, SMTP and UDP traffic also have a consid-
erably impact on real networks. Hence, this work intended to generate traffic in the emulated networks
according to what has been previously studied.
Next it will be describe the process of automatization of each application and how different impact
was guaranteed.
Cron
Cron is a job scheduler based on time that is available on Linux repositories. This tool allows tasks
to be automatically executed in the background at periodically times. It is an effective way to schedule
a routine background job at a specific time. For this work Cron tool was used to generate different kind
of traffic by executing scripts periodically. The structure of a cron command is shown in Figure 3.15.
Figure 3.15: Structure of a Cron command.
As it can be seen the command is represented by six different elements that will be now described:
• MIN, represents the Minute field and its allowed value goes from 0 to 59.
• HOUR, in turn, is the Hour field and it goes from 0 to 23.
• DOM, is the Day of Month and it goes from 1 to 31
• MON, represents the Month field and its allowed value goes from 1 to 12.
• DOW, is the Day of Week and it goes from 0 to 6.
42
Page 63
3.4 TRAFFIC GENERATION
• CMD, is any command to be executed.
FTP, BitTorrent and SMTP were the services used on cron to be automatically generated in the emulated
networks. Following, in Figure 3.16, is illustrated how these protocols were executed by cron.
Figure 3.16: Example of a Cron command.
In this example every field took the value ‘*’. That means that the command was executed every minute
in every hour every day. However, as we shall see later, the emulated time considered for this work was
for five minutes.
Scripts
Some protocols, such as HTTP, has a huge impact on real networks, as was analyzed before. Therefore
it has to be executed more often comparing to other protocols. For that it was decided to write a script
where commands, which were performing a random service (e.g. HTTP requests), were executed more
often. Bellow, is an example of a script executing HTTP requests.
Figure 3.17: Example of a script executing a HTTP Request.
As it can be seen in this example the script performs a HTTP request to the server with the IP address
192.168.0.1. This request is performed every 5 seconds. As previously mentioned, each server was hosting
six different web pages. Therefore this script was invoked for every single web page to all the six servers
representing the Cluster 1.
As previously stated, each service was generated according to some patterns in order to realistically
mimic the traffic behaviour. Some applications were executed more often than others. Basically, the
process of traffic generation aimed to produce mostly HTTP and BitTorrent traffic. FTP and SMTP, in
turn, were generated less often. The percentages that were considered for this work are represented in
the Table 2.6 in Section 2.4.
Next, in the Table 3.12, is described the number of times a service was executed during the emula-
43
Page 64
CHAPTER 3: EMULATED NETWORKS
tion time. In this table will be only represented the FTP, SMTP and HTTP services. Other services,
such as HTTP-Streaming and Bittorrent, were executed once and lasted throughout the emulation period.
Each attack, in turn, was also executed once by Metasploit framework during the emulation period.
Table 3.12: Execution process by each service.
Applications #Hosts #Servers #Requests(per Server) #Execution Period Total of Executions
HTTP 12 6 6 5 25920
SMTP 12 6 1 60 21600
FTP 12 6 1 60 21600
3.5 Capturing Data
The goal of this Dissertation was focused on gathering data through the model, that has been de-
scribed so far, in order to get a high level Ground-Truth. Throughout this chapter has come to describe
the topologies, its configuration components and traffic generation. Particularly, in this section it will be
described the process of gathering data during the emulation time.
The process of capturing data was practically the same in both emulated networks. As it can be seen in
the Figure 3.18 all data was captured on the interface of each machine and Cluster.
Figure 3.18: Points of Captured Data.
The emulation time for both topologies took five minutes. The procedure of capturing and organizing
the data from the all different points was developed with two different tools, named tshark and mergecap.
44
Page 65
3.6 GROUPING PACKETS PER SERVICE/ATTACK
Tshark is a Wireshark18 terminal based (non-GUI). Basically it is a network protocol analyzer that
is available on Linux repositories. It allows capturing data from a deployed network and also permits to
read captured files in order to gather some statistics data.
For this work Tshark was used to capture and store all the traffic generated in the emulated networks.
Following, in Figure 3.19 is an example of a Tshark command used in the three different machines in
order to capture all the data generated.
Figure 3.19: Example of a Tshark command.
Tshark tool allows to do a multiple file capture by using the -b parameter followed with the option du-
ration. It permits to switch to the next file every value seconds. Since in this work the emulated time
was for five minutes, it was decided to split the captured data into five files. It means that the field value
took the number 60 (sixty seconds).
Mergecap is a program, available on Linux repositories, that allows multiple saved capture files into a
single output file. It is based on timestamp, which means that the packets are written into the output
file in an orderly manner. By default, it writes the output file in libpcap. In Figure 3.20 is an example of
a mergecap command used to process the capture files.
Figure 3.20: Example of a Mergecap command.
This command simply bundles all the capture files of a directory by placing the output file in the path
set by $path final capture file.
3.6 Grouping Packets per Service/Attack
Once the data was all gathered it was needed to separate it by service and attack for statistical
purposes and to facilitate the data processing. This explains methods used to associate each packet to
on application or attack.
18http://www.wireshark.org/
45
Page 66
CHAPTER 3: EMULATED NETWORKS
3.6.1 Illicit Traffic
All the attacks have a particular characteristic of their own even if it has to use a deep inspection
packet method to find it. Below, in Table 3.13, the filters used for the traffic generated by each attack
are described followed by a brief explanation for their use.
Table 3.13: Filters used for each attack.Attack Filter
FTP Authentication Scanner ftp.request.arg==”username”||ftp.response.code==530
FTP Stack-based Buffer Overflow ftp.request.command==SITE||ftp.response.code==220
Fuzzers HTTP Incremented URI and HTTP Malicious URI not(http.user agent)&&http.request
Kaminsky dns.qry.name==example.com||dns.resp.name==newdns
TCP SynFlood ip.len==40&&tcp.flags==0x02
Port Scan ip.src==ip.from.the.attacker&¬(http||ftp||tcp.port==21||tcp.port==80)
• FTP Authentication Scanner : To perform this attack it was used a list of, already known, usernames
and passwords that were attempts to successfully login in the FTP servers. Plus, this attack may
generate a lot of attempts to get succeed in a Login interaction. That means that probably it will
produce several login failures. So, the procedure of gathering the traffic generated by this attack
was based on filtering by FTP request login. With this filter is possible to get all the traffic related
to this attack. By performing this filter it was gathered all the malicious attempts on login in the
FTP server and all the responses from the server indicating a Login incorrect (TCP flag = 530).
Those are the main characteristics of this attack.
• FTP Stack-based Buffer Overflow : As was mentioned, this attack was performed by sending FTP
requests, in order to damage the server memory and execute arbitrary code. This attack performed
several FTP requests by sending commands followed by SITE. The server responses were also
considered as a FTP Stack-based Buffer Overflow (TCP flag = 220). Mostly of those responses
allowed the attacker to use and explore the FTP server.
• Fuzzers HTTP, incremented URI and HTTP Malicious URI : As earlier described this kind of
attack is performed by sending HTTP requests. However, those requests do not include many
HTTP headers. In particular, these attacks did not used the HTTP user agent header. This
characteristic was used to identify them since all other HTTP packets generated by the emulator
included this field.
• Kaminsky : This attack is performed by sending random hostname queries to a target DNS server
followed by spoofed replies to queries from the authoritative nameservers for the targeted domain.
Due to this fact, the main characteristics of this attack are the queries initially made to the DNS
46
Page 67
3.6 GROUPING PACKETS PER SERVICE/ATTACK
server and the several spoofed responses. The first parameter of the filter is related to the domain
that was being hijacked and the second one to the hostname of the replacement DNS server.
• TCP SynFlood : As expected this attack contained a parameter that differed from other SYN
packets. As stated in section 2.3, it is common to see DoS attacks using smaller size packets to
attack a remote machine. Usually, a SYN packet has 60 (sixty) bytes but this attack, which was
performed in the emulated networks, used SYN packets with 40 (forty) bytes. So, the data was
filtered by SYN packets with 40 (forty) bytes of length, in order to gather all the information related
exclusively to this attack.
• Port Scan: Only one host located on Cluster 2 of EN2 performed Portscan attack. This host
was producing only illicit traffic. Therefore it was generating only HTTP and FTP apart from
Portscans. To get all the traffic belonged to Portscan attacks it was necessary to filter by attacker
IP address and all traffic that was no HTTP or FTP.
3.6.2 Licit Traffic
Applications and Services generate traffic using some known Application Layer protocols. Each of
them has a particular signature in the networks. Every different protocol explore different TCP ports.
However, the filtering process was not based only in TCP ports but also in host IP addresses and in
application filters. Next, in Table 3.14, are the different filters used for each application followed by short
description.
Table 3.14: Filters used for each service.Attack Filter
BitTorrent (ip.src==X.X.X.X&&ip.dst==Y.Y.Y.Y)||bittorrent
FTP (tcp.port==21||ftp-data)&¬((ftp.request.command==SITE||ftp.response.code==220)||(ftp.request.arg==”username”||ftp.response.code==530))
HTTP http&¬(not(http.user agent)&&http.request)
HTTP-Streaming tcp.port==80&¬(http)
SMTP tcp.port==25||smtp
• BitTorrent, this protocol was used only among hosts of Cluster 2 and 3 of both emulated networks.
Plus, all the interaction between these hosts was exclusively done by BitTorrent protocol. Therefore,
in this case, the filter to use would be a combination of a source and destination IP of all hosts of
both Clusters in the topologies.
• FTP, in this case, the filtering process was based on TCP ports 20 and 21 because those are the
ports mostly explored by FTP protocol.
• HTTP, in this case it was decided to get all the traffic by using the http filter. In this way it would
be possible to gather only the traffic generated by the application layer.
47
Page 68
CHAPTER 3: EMULATED NETWORKS
• HTTP-Streaming, as is known, this type of traffic explores the TCP port 80. However, for the
purposes of this project was necessary to distinguish the port 80 from the application layer, namely
HTTP. This category was only focused on the traffic using the port 80 without using HTTP
protocol interaction.
• SMTP, this protocol uses the TCP port 25 for its interactions.
3.6.3 Flows
Different flows were defined for the all traffic generated and captured. The flows were defined by
source IP, destination IP, source port, destination port and TCP.
Each packet generated and captured in the emulated networks is associated to a respective flow. From
the flow analysis at each 0.1 seconds it was extracted a set of features, which characterize it, such as:
time, number of packets, number of bytes and number of each TCP flag (ACK; FIN; SYN; SYN,ACK;
PSH and RST). For that, it was necessary to resort to tshark tool, in order to get all these features per
packet. The specific information that was obtained from each packet in order to gather the packets by
flow and characterize it by features was:
• Time (filter: frame.time relative): The time when the packet was captured.
• Packet Size (filter: ip.len): The packet size in Bytes.
• Source IP (filter: ip.src): The Source IP address of the packet.
• Destination IP (filter: ip.dst): The Destination IP address of the packet.
• Source Port (filter: tcp.srcport): The TCP source port of the packet.
• Destination Port (filter: tcp.dstport): The TCP destination port of the packet.
• TCP flag (filter: tcp.flags): The TCP flag that represents the packet.
Following is an example of exporting, by using tshark with the filters above, all that information of every
packets on a capture file into a text file in order to easier process and gather the information by flow.
Figure 3.21: Example of a thsark command to gather specific information from a capture file.
For each flow the traffic was analyzed every 0.1 seconds. Since the emulation period took 5 minutes (300
seconds), it means that the time was divided in 3000 parts of 0.1 seconds. In each part was reported the
number of packets, bytes and TCP flags generated in that period per flow. Next, in 3.15, it is an example
of the characteristics of the packets generated every 0.1 seconds for a specific flow.
48
Page 69
3.6 GROUPING PACKETS PER SERVICE/ATTACK
Table 3.15: Number of packets and their characteristics for a flow.
0.1 0.2 0.3 ... 299.9 300
#Packets 10 16 2 ... 17 21
#Bytes 600 960 120 ... 1020 1260
#ACK 6 8 0 ... 7 15
#FIN 0 1 0 ... 2 1
#SYN 2 3 2 ... 3 4
#SYN,ACK 2 3 0 ... 3 1
#PSH 0 0 0 ... 1 0
#RST 0 1 0 ... 1 0
As it can be seen for every 0.1 seconds is reported the quantity of each feature. The number that each
feature generates over the time may indicate a pattern for an attack or service.
Once gathered all the necessary data in a text file, the aggregation process of the flows was under-
taken. For that, all the packets related to a specific flow were collected in order to perceive the typical
features of each application and attack.
Summary
In this chapter it was introduced the architecture and its implementation. Five different phases
were described: Topologies Development, Technologies for Applications and Attacks, Traffic Generation,
Capturing Data and Grouping Packets per Service/Attack. Two different topologies were adopted for
the emulation purposes: EN1 and EN2. It was described the configurations of network devices of each
emulated network and their implementations. In both topologies were generated two kinds of traffic: Licit
and Illicit. All the applications and services that were chosen to represent licit traffic were according to the
research studies analyzed in the section 2.4 . The illicit traffic generated was based on attacks that have
a considerable impact on network traffic behaviour. The method of capturing data, while the emulation
time and the process of gathering data by each application and attack, was also described.
49
Page 70
CHAPTER 3: EMULATED NETWORKS
50
Page 71
4Results and Discussion
The main goal of this chapter is to perform an analysis of the traffic generated in both emulated
networks and verify if it is in agreement with the objectives initially defined. It also seeks to investigate
traffic signatures that can be used to detect the attacks. The analysis, which is held in this chapter, shall
have regard to traffic generation process described in the previous chapter. As previously mentioned, the
procedure of traffic generation was focused on the studies earlier analyzed. Therefore, the results should
be in accordance with the conclusions drawn in section 2.4.
4.1 Aggregated Traffic
Starting from analyzing the amount of traffic generated in both emulated networks it can be seen that
there was a considerable difference. This is due to the fact of both topologies were different from each
other. Next, in Figure 4.1, is shown the traffic generated in both emulated networks in terms of Bytes
and Packets.
51
Page 72
CHAPTER 4: RESULTS AND DISCUSSION
Figure 4.1: Packets and Bytes generated by each emulated network.
As it can be seen there was much more traffic generated in EN2 comparing to EN1. This is due to the fact
that the load balance in EN2 was more or less equally distributed among all physical machines while in
the EN1, the machine that was holding a great part of the emulated network was not capable to process
and capture so much traffic. However, the main reason for this discrepancy was the fact of EN2 having
more end-hosts generating traffic. In each Cluster of EN2 there were two more machines comparing to
EN1 topology. Services, such as, HTTP, HTTP-Streaming, FTP and SMTP were significantly increased
in the amount of traffic generated.
The traffic generated in both emulated networks was mainly TCP and UDP. All the services and attacks
were running over these two transport protocols. Each of those two protocols was differently generated
thus producing different traffic patterns. By comparing the quantity of traffic generated by TCP and
UDP it can be seen a significant divergence. In Figure 4.2, is illustrated the balance of TCP and UDP
traffic generated in EN1.
Figure 4.2: TCP and UDP traffic generated in EN1.
As it can be concluded, by the graphics shown above, great part of the traffic generated was TCP. As
expected UDP only represents ∼20% of the traffic produced. Most of the services and attacks deployed in
the topology were running over TCP. These values are according with the ones analyzed and concluded
in section 2.4. In the EN2, in turn, it was verified a bigger difference on those values previously obtained
52
Page 73
4.1 AGGREGATED TRAFFIC
for the EN1 (Figure 4.3).
Figure 4.3: TCP and UDP traffic generated in EN2.
In EN2, UDP emerged with less impact on the traffic generated in the network. This is due to the fact
there was more end-hosts in EN2. All the new end-hosts were executing much more TCP than UDP
traffic. Since there were two more servers running services, such as, HTTP, HTTP-Streaming, FTP and
SMTP it was expected that the amount of TCP traffic had increased comparing to UDP. Obviously,
that also UDP traffic increased with the number of emulated machines, however it was not so significant.
UDP traffic was produced on the emulated networks by services, such as DHCP and DNS, and cache
poisoning attack (Kaminsky). Over the emulation time, it was verified an unusual UDP traffic behaviour.
In Figures 4.5 and 4.4 is illustrated the performance of UDP traffic throughout the emulation period.
Figure 4.4: UDP traffic behaviour in EN1. Figure 4.5: UDP traffic behaviour in EN2.
As it can be confirmed there is a very unusual traffic behaviour. The UDP traffic grows at frightening
rates somewhere in time during a short period. This is due to the fact that Kaminsky attack was being
performed during that phase. Regarding this attack it overwhelms the DNS server with a lot of DNS
responses. This attack causes a significant increase in DNS traffic and therefore in UDP traffic. This
attack can not be detected with the aggregated traffic of TCP and UDP. The filtering process must be
exclusively focused on UDP traffic.
53
Page 74
CHAPTER 4: RESULTS AND DISCUSSION
In Figure 4.6 is shown the UDP traffic breakdown in EN1. DNS traffic is the most representative
UDP traffic generated on the emulated network comparing to other services, such as DHCP.
Figure 4.6: UDP services in EN1.
In EN2, Figure 4.7, was also verified the same kind of behaviour in UDP traffic. The DNS traffic generated
represented most of UDP traffic due to the DNS cache poisoning attack that was deployed on the network.
Figure 4.7: UDP services in EN2.
Summarizing, DNS traffic is the most common UDP traffic verified in both emulated networks. Despite
the fact that the DNS licit traffic had a considerable contribution, the Kaminsky attack was the prime
contributor for the UDP traffic.
Focusing now on TCP traffic that was produced on both topologies it can be verified that all the services
that were described earlier had a considerable impact on the traffic behaviour.
As earlier mentioned each service was carefully configured in order to cause the impact according to
conclusions drawn on 2.3. All the services mentioned above, such as BitTorrent, FTP, HTTP, SMTP
and HTTP-Streaming were captured and analyzed. On Figure 4.8 is the impact of each protocol, that
runs over TCP, in the EN1.
54
Page 75
4.1 AGGREGATED TRAFFIC
Figure 4.8: TCP services in EN1.
As is illustrated in the figure HTTP and BitTorrent traffic were the services that generate more traffic in
the network followed by other two services (HTTP-Streaming and FTP) with a considerable impact on
the traffic. The high number of HTTP packets is due to the fact that several requests had been done to
all the four servers of Cluster 1 and to the both Fuzzers attacks that were exploring HTTP. BitTorrent
traffic represents about 35% of the TCP traffic and FTP 15%. FTP had a huge impact on the traffic
behaviour comparing to the real networks. This is due to the fact of two different attacks that exploit
FTP were deployed thus increasing the amount of its traffic. The HTTP-Streaming(∼17%) and SMTP
(∼1%), in turn, had the expected impact.
In Figure 4.9 it is represented the impact of each protocol that runs over TCP in EN2. Regarding
the previous topology there are some similarities related to the TCP traffic behaviour.
Figure 4.9: TCP services in EN2.
In EN2, HTTP(∼37%) and BitTorrent(∼ 25%) also represented great part of the traffic generated due
to the same reasons explained for the EN1. The HTTP-Streaming also represents a considerable part
of TCP traffic (∼ 15%). There was a increase in the amount of FTP traffic compared to the previous
topology, about 15% to 22%. The SMTP is still represented by a rather low traffic compared to the other
services.
55
Page 76
CHAPTER 4: RESULTS AND DISCUSSION
Some of the attacks that have been described throughout this document affected the impact of some
applications. This factor was already expected because the attacks were chosen under the condition of
generating a lot of traffic. Next, it will be analyzed the impact of the attacks in the traffic generated by
each service.
All the attacks that were earlier described were deployed in the EN1. In Figure 4.10 is illustrated
the impact of each attack, whether it runs over TCP or UDP, in the traffic behaviour generated on the
emulated network.
Figure 4.10: TCP and UDP attacks in EN1.
As it can be seen the attack that generated more traffic during the emulation time was Fuzzer HTTP
Malicious URI (∼53%). The other fuzzer attack (Fuzzer HTTP Incremented URI) also was considerably
representing the illicit traffic generated since it represents around (∼31%) of attacks that were executed.
The Kaminsky attack (∼7%), in turn, did not have as much impact as the others.
Focusing now on the impact of the attacks executed in the EN2 it can be seen a similar behaviour
in relation to the previous topology. However, in this emulated network was also deployed Port Scan
attacks. Next, in Figure 4.11, is shown the balance of the attacks generated in the emulated network.
56
Page 77
4.1 AGGREGATED TRAFFIC
Figure 4.11: TCP and UDP attacks in EN2.
Although there was port scan traffic in this topology, the impact of each attack was found to be similar
to the one seen in the previous topology. The Fuzzer attacks remain the predominant generator of illicit
traffic in the emulated network (together ∼66%) followed by Port Scan with ∼24%. The DNS cache
poisoning had also a considerable impact on the traffic behaviour since it represents approximately 5%
of the illicit traffic but it is still very low compared to the amount of TCP traffic that was generated.
Two protocols were affected by illicit traffic, named HTTP and FTP. The HTTP was mostly repre-
sented by the Fuzzer attacks in EN1 as it can be seen in Figure 4.12.
Figure 4.12: HTTP traffic in EN1.
HTTP Licit represents the legitimate interaction (HTTP requests, etc.) between servers and hosts. As it
can be seen on the figure, the HTTP Licit traffic did not represent the majority of HTTP traffic (∼29%).
On the other hand Fuzzer attacks represent most of the HTTP traffic. It produced about 70% of the
HTTP traffic. This is due to the fact that both attacks generate a lot of traffic when they are executed.
On EN2 the behaviour of the Fuzzer attacks and HTTP Licit was not too different from the previous
case. In Figure 4.13 is represented the impact of fuzzer attacks and Licit traffic on HTTP.
57
Page 78
CHAPTER 4: RESULTS AND DISCUSSION
Figure 4.13: HTTP traffic in EN2.
Once again, HTTP is mostly represented by illicit traffic (∼60%). The Fuzzer HTTP Malicious URI at-
tack emerged as the greatest producer of HTTP traffic. Therefore, in the EN2, the licit traffic represents
only a small part of the HTTP traffic (∼16%).
FTP was also affected by illicit traffic that was generated by the security attacks mentioned above.
Unlike the previous case, it was found that licit traffic had far more impact that the illicit one. In the
Figure 4.14 is represented the FTP traffic behaviour on EN1.
Figure 4.14: FTP traffic in EN1.
Despite the attacks that were generated have a significant impact on the traffic behaviour it was found
that licit traffic was the most abundant in the FTP (∼88%). The illicit traffic that was generated by the
attacks FTP Authentication and FTP Stacked-based Buffer Overflow Attack only represented a small
part of the FTP traffic(∼12%).
In EN2 the FTP traffic behaviour was not so different of the one verified in EN1. Then, in Figure
4.15, is shown the impact of licit and illicit FTP traffic in that the traffic generated in EN2.
58
Page 79
4.2 PER FLOW TRAFFIC
Figure 4.15: FTP traffic in EN2.
In this case, the FTP Licit remains as the most common FTP traffic in the emulated network (∼92%).
Illicit traffic that was generated by the attacks mentioned above only represents around (∼8%) of the
FTP traffic.
4.2 Per Flow Traffic
One of the main goals of the emulator is to acquire a ground-truth (annotated traffic) which can be
used to evaluate statistical methods of detection attacks and/or applications. For that it was needed
to first understand how each kind of traffic behaved during the emulation period, in order to perceive
the impact of each application and attack in the traffic network. Then, for each attack, it was required
to analyze its traffic generated by evaluating the features throughout the emulation period. In case of
finding a type of behaviour that occurs only in traffic where attacks have been generated, it may indicate
that a specific pattern is symptom of an attack.
As had been described each application and attack has a different traffic characteristics. Every ap-
plication revealed to have a typical pattern in the network environment. The attacks, in turn, were
deployed in order to generate a considerable amount of traffic.
Seven different attacks were considered for this work: FTP Authentication Scanner, FTP Stack-based
Buffer Overflow, Fuzzer HTTP Long String, Fuzzer HTTP String URI, Kaminsky DNS cache poisoning,
Port Scan and TCP Syn Flood. Each of them had a particular pattern on the traffic network.
In some attacks, it can be found a signature that is unique of it. As was mentioned in section 2.3,
the IP packet size may indicate that a DoS attack is being performed. Usually, when an attacker is
performing a DoS attack it sends a large amount of small packets. In this work the TCP Syn Flood
59
Page 80
CHAPTER 4: RESULTS AND DISCUSSION
attack represented a DoS attack. In section 3.6 it was mentioned that a specific filter was used to get
all the traffic related to this attack. The filter used was the ip.len==40 because the SYN packets size
generated by the attacker were all with 40 bytes instead of the SYN packets with 60 bytes generated by
legitimate traffic.
Kaminsky DNS poisoning attack also shows to have a particular characteristic that obviously shown
when this attack is being executed. Figures 4.4 and 4.5, which were earlier discussed, show that it is
evident when this attack is performed. When the UDP, specially DNS, traffic significantly increases
means that an DNS cache poisoning is being performed. This is due to the amount of responses packets
that the attacker sends to the DNS Server. Therefore, the high number of DNS responses in a short time
period can be considered as a signature of a Kaminsky’s attack.
As earlier mentioned, different flows were defined for all the traffic generated and captured in EN2.
Those flows were identified by Source IP, Destination IP, Source Port, Destination Port and TCP. The
number of flows produced was different among the applications (licit traffic) and attacks (illicit traffic).
In Figure 4.16, is shown the percentage of flows generated by each service in EN2.
Figure 4.16: Flows per service in EN2.
By analyzing the chart, the low percentage number of BitTorrent flows is what draws the most attention
(∼1%). This is due to the fact that the peers did not use so many ports for the interaction and data
transfer. This is related to the fact that the flows could be bigger in terms of bytes and packets. HTTP
emerged as the service with more flows (∼71%) followed by FTP with ∼24%. HTTP-Streaming, in turn,
produced about 4% of the flows. This low percentage value was due to the fact that the same ports were
used during the video streams.
60
Page 81
4.3 INTERESTING FEATURES TO DETECT THE ATTACKS
As well as the services, it was also defined flows representative of illicit traffic. In Figure 4.17, is shown
the percentage values of the flows generated for each attack.
Figure 4.17: Flows per attack in EN2.
Port Scan was the attack that generated more flows (∼87%) because it scans and explores all the possible
ports in a network. The rest of the attacks generated a low number of flows comparing to Port Scan
attack. Only the Fuzzer HTTP Malicious URI stands out with ∼8%. This fact may indicate that the
frequency of flows generation during a short time period may indicate if a Port Scan is occurring. If
the number of flows increases very fast in a short time period it departs from normal traffic behaviour,
therefore illicit traffic is likely to be generated.
4.3 Interesting Features to Detect the Attacks
As stated in section 3.6, each flow was characterized at each time interval of 0.1 seconds, throughout
the emulation period, for different features, which were: the number of packets, bytes and each TCP flag.
The purpose of the features on this work was to find if there is a significant change on the way that they
are generated, during the emulation period, when an attack is being performed.
Fuzzers attacks explored the HTTP protocol, as have been mentioned throughout this document. The
six virtual servers of the EN2 were attacked by this attack. Therefore, the main concern was on focusing
on the HTTP traffic that was involving those six servers. For that, all the traffic represented by HTTP
licit and illicit traffic was analyzed in order to better understand the features generation frequency. In
Figure 4.18, is represented the number of generated features per each kind of traffic.
61
Page 82
CHAPTER 4: RESULTS AND DISCUSSION
Figure 4.18: Features generated by HTTP.
The ACK flag was clearly the most generated. However it was the only one that was produced more
often by licit traffic. All the rest of the features were mostly produced by Fuzzer HTTP Malicious URI
attack. In the opposite, the Fuzzer HTTP Incremented URL attack, in turn, was the type of traffic that
produced less features.
The main purpose of the features was to understand how often they are generated during a specific
time period. For that, all the HTTP traffic licit and illicit were gathered in order to analyze the traffic
behaviour during the emulation time. In Figure 4.19, is illustrated the production frequency of each
feature.
Figure 4.19: Features produced throughout the emulation time for HTTP traffic.
The generation of the features remains stable, which means that is unlikely to be an attack being per-
formed. However, at a given point three features start being generated at frightening rate. The HTTP
protocol uses several times the TCP flags ACK and SYN. Since the Fuzzers attacks consist on sending
many HTTP requests to a server it is normal that those flags start being generated more often. The PSH
62
Page 83
4.3 INTERESTING FEATURES TO DETECT THE ATTACKS
is used to tells the TCP stack to flush all buffers and send any up to the application including the data
that hold the PSH flag set. Since there are many HTTP requests and HTTP “Not Found” (due to the
high number of attempts) the number of PSH feature increases.
FTP protocol was also affected by illicit traffic in the EN2. Like in the previous case, all the FTP
traffic (licit and illicit) was gathered in order to perceive if there are any pattern that can identify an
attack that is exploiting the FTP. In Figure 4.20, is represented the number of FTP packets that had
specific flags set in the EN2.
Figure 4.20: Number of features generated by FTP.
As was expected the most frequent feature was ACK. Clearly the licit traffic produced much more packets
with this feature than the illicit traffic. Whether licit or illicit traffic it was produced a considerable
number of PSH packets. As it will be shown in the figure 4.21 this feature may indicate when the FTP
Authentication Scanner might be occurring.
Figure 4.21: Features produced throughout the emulation time for FTP traffic.
Until a certain moment the feature PSH remains stable in time. However, at some point it considerably
63
Page 84
CHAPTER 4: RESULTS AND DISCUSSION
increases during a short period. It is a clearly sign that an attack FTP Authentication Scanner may be
occurring. As it was mentioned this attack attempts to successfully authenticate in a FTP server. The
interaction between the attacker and the server uses this feature due to the number of requests and re-
sponses generated among them. Since there are a lot of authentication failures, due to the several attempts
that the attack performs, more PSH features are generated than ACK. Therefore, it can be concluded
that when PSH are generated more often than ACK it may be a symptom of a FTP authentication attack.
The FTP Stacked-based Buffer overflow, in turn, was not clearly identified by the behaviour of TCP
flags during the emulation time.
By looking to the previous charts it can be concluded that some attacks have an impact on the way
that some features are generated. In Table 4.1, is shown how those attacks, which have been discussed
so far, can be detected by analyzing the traffic behaviour.
Table 4.1: Parameters to detect the attacks.Detectable by Signature Detectable by Traffic Conditions Flow Features that Better Detect the Attack
FTP Authentication Scanner # ! PSH
FTP Stack-based Buffer Overflow # # -
Fuzzer HTTP Long String # ! SYN and PSH
Fuzzer HTTP String URI # ! SYN and PSH
Kaminsky # ! #Packets, #Bytes
TCP SYN Flood ! ! SYN
As was previous discussed, most of the attacks can be detected by analyzing how often the features PSH
and SYN are generated. FTP Authentication Attack, in particular, can be detected if the PSH increases
more than ACK feature during a short period of time. Fuzzers attacks can also be detected by looking to
the SYN and PSH feature. DNS cache poisoning attack, in turn, can be detected by analyzing the UDP
traffic behaviour. Finally, TCP SYN Flood can be detected by signature since the typical DoS attacks
use smaller IP packet size to be performed. Port Scan attack, in turn, can be detected by how often
different flows are generated during a short time period.
Summary
In this section it was presented the results obtained from the emulated networks described in the previous
section. It was compared the impact of each application and attack in the traffic behaviour. Then, from
those results was discussed how an attack can be detected by the way that TCP flags are generated. It
was concluded that some attacks can be also detected by signature or traffic conditions.
64
Page 85
5Conclusions and Future Work
This thesis was focused on the development of emulated networks in order to acquire a high quality
ground-truth. The cornerstones of this work are the topologies developed and the variety of traffic that
was generated. Two kind of traffic were considered for this work: Licit and Illicit.
For the licit traffic three different research studies were analyzed in order to perceive which kind of
traffic is produced in common networks. It was concluded that the main applications produced were
Web, P2P, Streaming, FTP, SMTP and Network Management. Each of them revealed to have different
impact on the traffic that is common on real networks: The most representatives were Web (∼35%-40%)
and P2P (∼20%-25%) followed by Streaming (∼10%-15%), Mail (∼5%-10%) and FTP (∼1%-10%). Net-
work Management, in turn, showed to be the kind of traffic that was less often generated (∼1%-5%). For
each kind of licit traffic different applications were adopted as is shown in Table 5.1.
65
Page 86
CHAPTER 5: CONCLUSIONS AND FUTURE WORK
Table 5.1: Application for each kind of licit traffic.
Traffic Service Application
Web HTTP LAMP server
P2P BitTorrent Aria2c and Transmission
Streaming HTTP-Streaming VLC
Mail SMTP Postfix
FTP FTP ProFTPd
Network Management DNS, DHCP BIND9
Each kind of traffic was generated according with the research studies analyzed in order to realistic mimic
the traffic patterns in real networks.
For the illicit traffic it was necessary to deploy in the emulated networks attacks that have a consid-
erable impact on the traffic behaviour. Several attacks were analyzed and it was decided to execute the
following ones: DNS Cache Poisoning (Kaminsky), FTP Authentication Scanner, FTP Stack-based Buffer
Overflow, Fuzzer HTTP Malicious URI, Fuzzer HTTP Incremented URI, Portscan and TCP SYN Flood.
Each of them explores different Internet services, which allowed studying the illicit traffic in different fields.
To perform those attacks two different frameworks were adopted: NMAP and Metasploit. The pur-
pose of NMAP was to execute Port Scan attacks. Metasploit, in turn, allowed deploying all the other
attacks. Every single attack was properly configured in order to have an impact on traffic behaviour.
Two different topologies were adopted in order to generate the licit and illicit traffic: EN1 and EN2.
Realistic networks inspired both of them. Part of the EN1 was a triangle network emulated on GNS3
framework which was connecting three different Clusters. However, the network emulated on GNS3 over-
whelmed the PC resources. Instead, for the EN2 was adopted a switch to connect all Clusters.
All the licit and illicit traffic described above was generated in those two emulated networks during
an emulation time period of 5 minutes. Then, all the data was gathered and processed. Plus, for each
kind of traffic different flows were defined by Source IP, Destination IP, Source Port, Destination Port
and TCP. For each flow, it was extracted a set of features at each 0.1 seconds, such as: time, number of
packets, number of bytes and number of each TCP flag (ACK; FIN; SYN; SYN,ACK; PSH and RST).
The results obtained show that there was much more traffic generated in EN2 comparing to EN1. In
both emulated networks was produced more TCP traffic then UDP. The application that was more rep-
66
Page 87
CHAPTER 5: CONCLUSIONS AND FUTURE WORK
resentative of the traffic obtained was HTTP followed by BitTorrent. That fact was in accordance to the
research studies that were analyzed. The Attack that generate more traffic was Fuzzer HTTP Malicious
URI. DNS Cache Poisoning and FTP attacks did not have a considerable impact comparing to the Fuzzers.
For different attacks it was verified that different features may indicate when an attack is occurring.
TCP flags, such as, SYN and PSH can designate an attack depending on how often they are generated
during a short time period. DNS Cache Poisoning, in turn, can be detected by traffic conditions. TCP
SYN Flood, in turn, can be easily discovered by its signature, which consists on its IP packet size. Finally,
a Port Scan attack can be identified by observing how often different flows are generated during a short
time period.
As future work, it might be interesting to develop another topologies with other characteristics. Plus,
it can be deployed more attacks, mainly Denial of Service, in order to cause different illicit traffic to be
analyzed.
For this kind of work it would be helpful to determine the ideal computational load for each kind of
emulation. Knowing in advance what equipment to use, for a particular topology, to maintain a certain
balance in the computational load, it would help to efficiently develop this kind of solutions.
67
Page 88
CHAPTER 5: CONCLUSIONS AND FUTURE WORK
68
Page 89
Bibliography
[1] S. Roolvink, “Detecting attacks involving DNS servers : a netflow data based approach,” Dec.
2008. [Online]. Available: http://essay.utwente.nl/58497/
[2] M. Pietrzyk, J.-L. Costeux, G. Urvoy-Keller, and T. En-Najjary, “Challenging statistical
classification for operational usage: the ADSL case,” in Proceedings of the 9th ACM SIGCOMM
conference on Internet measurement conference, ser. IMC ’09. New York, NY, USA: ACM, 2009,
pp. 122–135. [Online]. Available: http://doi.acm.org/10.1145/1644893.1644908
[3] C. M. dos Santos Miranda, “Implementation of Realistic Scnarios For Ground Truth Purposes,”
MSc, Universidade de Aveiro, 2010.
[4] T. Karagiannis, K. Papagiannaki, and M. Faloutsos, “BLINC: multilevel traffic classification in
the dark,” in Proceedings of the 2005 conference on Applications, technologies, architectures, and
protocols for computer communications, ser. SIGCOMM ’05. New York, NY, USA: ACM, 2005,
pp. 229–240. [Online]. Available: http://doi.acm.org/10.1145/1080091.1080119
[5] V. Yegneswaran, P. Barford, and J. Ullrich, “Internet intrusions: global characteristics and
prevalence,” SIGMETRICS Perform. Eval. Rev., vol. 31, no. 1, pp. 138–147, Jun. 2003. [Online].
Available: http://doi.acm.org/10.1145/885651.781045
[6] N. B. Anuar and H. Sallehudin, “Identifying false alarm for network intrusion detection
system using data mining and decision tree,” in Proceedings of the 7th conference on
Data networks, communications, computers. Stevens Point, Wisconsin, USA: World Scientific
and Engineering Academy and Society (WSEAS), 2008, pp. 22–28. [Online]. Available:
http://portal.acm.org/citation.cfm?id=1503580.1503586
[7] D. Yang, E. Usynin, and J. W. Hines, “Anomaly-Based Intrusion Detection for SCADA Systems,”
2006.
[8] G. Danezis, K. U. L. Esat/cosic, and K. Arenberg, “Introducing Traffic Analysis: Attacks, Defences
and Public Policy Issues.” University of Cambridge Computer Lab, Tech. Rep., 2005.
69
Page 90
CHAPTER 5: CONCLUSIONS AND FUTURE WORK
[9] H. Ringberg, M. Roughan, and J. Rexford, “The need for simulation in evaluating anomaly
detectors,” SIGCOMM Comput. Commun. Rev., vol. 38, no. 1, pp. 55–59, Jan. 2008. [Online].
Available: http://doi.acm.org/10.1145/1341431.1341443
[10] I. Yeom and A. L. N. Reddy, “ENDE: An End-to-end Network Delay Emulator Tool for Multimedia
Protocol Development,” Multimedia Tools Appl., vol. 14, no. 3, pp. 269–296, Aug. 2001. [Online].
Available: http://portal.acm.org/citation.cfm?id=597035.597205
[11] L. Breslau, D. Estrin, K. Fall, S. Floyd, J. Heidemann, A. Helmy, P. Huang, S. McCanne,
K. Varadhan, Y. Xu, and H. Yu, “Advances in Network Simulation,” Computer, vol. 33, no. 5, pp.
59–67, May 2000. [Online]. Available: http://portal.acm.org/citation.cfm?id=619051.621475
[12] S. Guruprasad, R. Ricci, and J. Lepreau, “Integrated Network Experimentation using
Simulation and Emulation,” in Proceedings of the First International Conference on
Testbeds and Research Infrastructures for the DEvelopment of NeTworks and COMmunities.
Washington, DC, USA: IEEE Computer Society, 2005, pp. 204–212. [Online]. Available:
http://portal.acm.org/citation.cfm?id=1042447.1043717
[13] C. Kiddle, “Scalable Network Emulation,” Ph.D. dissertation, University of Calgary, Washington,
DC, USA, 2004.
[14] S. Guruprasad, R. Ricci, and J. Lepreau, “Issues in integrated network experimentation using simula-
tion and emulation,” In Proceedings of 2 nd International IEEE/Create-Net Conference on Testbeds
and Research Infrastructures for the Development of Networks and Communities (TridentCom 2005,
Tech. Rep., 2005.
[15] R. Chertov, S. Fahmy, and N. Shroff, “Emulation versus Simulation: A Case Study TCP-Targeted
Denial of Service Attacks,” pp. 316–325. [Online]. Available: http://ieeexplore.ieee.org/lpdocs/
epic03/wrapper.htm?arnumber=1649164
[16] L. Rizzo, “Dummynet: A simple approach to the evaluation of network protocols,”
ACM Computer Communication Review, vol. 27, pp. 31–41, 1997. [Online]. Available:
http://citeseerx.ist.psu.edu/viewdoc/summary?doi=10.1.1.57.2969
[17] S. Hemminger, “Network Emulation with {NetEm},” in LCA 2005, Australia’s 6th national Linux
conference (linux.conf.au), M. Pool, Ed., Linux Australia. Sydney NSW, Australia: Linux Australia,
Apr. 2005. [Online]. Available: http://www.linux.org.au/conf/2005/abstract2e37.html?id=163
[18] P. Barham, B. Dragovic, K. Fraser, S. Hand, T. Harris, A. Ho, R. Neugebauer, I. Pratt, and
A. Warfield, “Xen and the art of virtualization,” in Proceedings of the nineteenth ACM symposium
70
Page 91
CHAPTER 5: CONCLUSIONS AND FUTURE WORK
on Operating systems principles, ser. SOSP ’03. New York, NY, USA: ACM, 2003, pp. 164–177.
[Online]. Available: http://doi.acm.org/10.1145/945445.945462
[19] S. Bellovin, “Defending Against Sequence Number Attacks,” United States, 1996.
[20] C. Brenton, “Egress Filtering FAQ,” SANS institute, 2006.
[21] K. Argyraki and D. R. Cheriton, “Scalable network-layer defense against internet bandwidth-
flooding attacks,” IEEE/ACM Trans. Netw., vol. 17, no. 4, pp. 1284–1297, Aug. 2009. [Online].
Available: http://dx.doi.org/10.1109/TNET.2008.2007431
[22] J. C. S. H. Christian Kreibich Andrew Warfield and I. Pratt, “Using Packet Symmetry to Curtail
Malicious Traffic,” 2005.
[23] D. Larochelle and D. Evans, “Statically detecting likely buffer overflow vulnerabilities,” in
Proceedings of the 10th conference on USENIX Security Symposium - Volume 10. Berkeley, CA,
USA: USENIX Association, 2001, p. 14. [Online]. Available: http://portal.acm.org/citation.cfm?
id=1267612.1267626
[24] C. B. Lee, C. Roedel, and E. Silenok, “Detection and Characterization of Port Scan Attacks,” Journal
of Computer Security, 2003.
[25] A. Takanen, J. DeMott, and C. Miller, Fuzzing for Software Security Testing and Quality Assurance,
1st ed. Norwood, MA, USA: Artech House, Inc., 2008.
[26] D. Slee, “Common Denial of Service Attacks,” 2007.
[27] P. Ren, J. Kristoff, and B. Gooch, “Visualizing DNS traffic,” in Proceedings of the 3rd international
workshop on Visualization for computer security, ser. VizSEC ’06. New York, NY, USA: ACM,
2006, pp. 23–30. [Online]. Available: http://doi.acm.org/10.1145/1179576.1179582
[28] D. Dagon, M. Antonakakis, P. Vixie, T. Jinmei, and W. Lee, “Increased DNS forgery resistance
through 0x20-bit encoding: security via leet queries,” in Proceedings of the 15th ACM conference
on Computer and communications security, ser. CCS ’08. New York, NY, USA: ACM, 2008, pp.
211–222. [Online]. Available: http://doi.acm.org/10.1145/1455770.1455798
[29] J. C. Foster, Metasploit Toolkit for Penetration Testing, Exploit Development, and Vulnerability Research.
Syngress Publishing, 2007.
[30] P. Borgnat, G. Dewaele, K. Fukuda, P. Abry, and K. Cho, “Seven Years and One Day: Sketching
the Evolution of Internet Traffic.”
71
Page 92
CHAPTER 5: CONCLUSIONS AND FUTURE WORK
[31] K. Cho, K. Mitsuya, and A. Kato, “Traffic data repository at the WIDE project,”
in Proceedings of the annual conference on USENIX Annual Technical Conference, ser.
ATEC ’00. Berkeley, CA, USA: USENIX Association, 2000, p. 51. [Online]. Available:
http://portal.acm.org/citation.cfm?id=1267724.1267775
[32] T. Karagiannis, A. Broido, N. Brownlee, K. claffy, and M. Faloutsos, “Is P2P dying or just hiding?”
in IEEE Globecom, 2004.
72