Date post: | 21-Dec-2015 |
Category: |
Documents |
View: | 218 times |
Download: | 0 times |
ENGINEERING 536
MASS TRANSFER OPERATIONSFALL 1997
TEAM MEMBERS:
Dr. Jim Henry, P.E.
Sean Cunningham
Mark Koss, P.E.
Sandy Koss
Tara Ostrander, E.I.
Nittaya Pittayataree
Beth Ruta
Nitipol Suksathaporn
IntroductionIntroduction
Study of mass transfer operations using the distillation column
Approach to the study of the distillation column included
- Literature search
- Operating the column- Computer modeling
+ Ponchon-Savarit
+ PROII
This report will cover
- column calibrations
- experimental results- computer modeling
DISTILLATION COLUMNDISTILLATION COLUMN
1
2
3
4
5
6
7
8
9
10
11
12Reboiler
TI
TI
TI
TI
TI
TI
TI
TI
TI
TI
TI
TI
Product Cooler
Electromagnetic Reflux Control
Feed Tank(Product Tank)
Cooling Water SupplyCondenser
Reboiler Pump
Distillate Pump
Feed Pump
LI
Cooling Water Return
TI
TI LI
PI
TI
TITI
COLUMN COLUMN DESCRIPTIONSDESCRIPTIONS
Condenser Reflux valve Trays RTDs Pumps - Feed pump
- Reboiler pump - Distillate pump - Auxiliary pump Reboiler Level Control - Condenser
- Reboiler FEED LOCATIONS
Column Column CalibrationsCalibrations
Heat loss studyHeat loss study RTD calibrationRTD calibration Pump and cooling Pump and cooling
water calibrationwater calibration
Heat Loss StudyHeat Loss Study
Previous heat loss calculations seemed excessive
Parameters of the study are - selected reboiler amperage
- 100% reflux - no condensate produced Column losses are equal to the
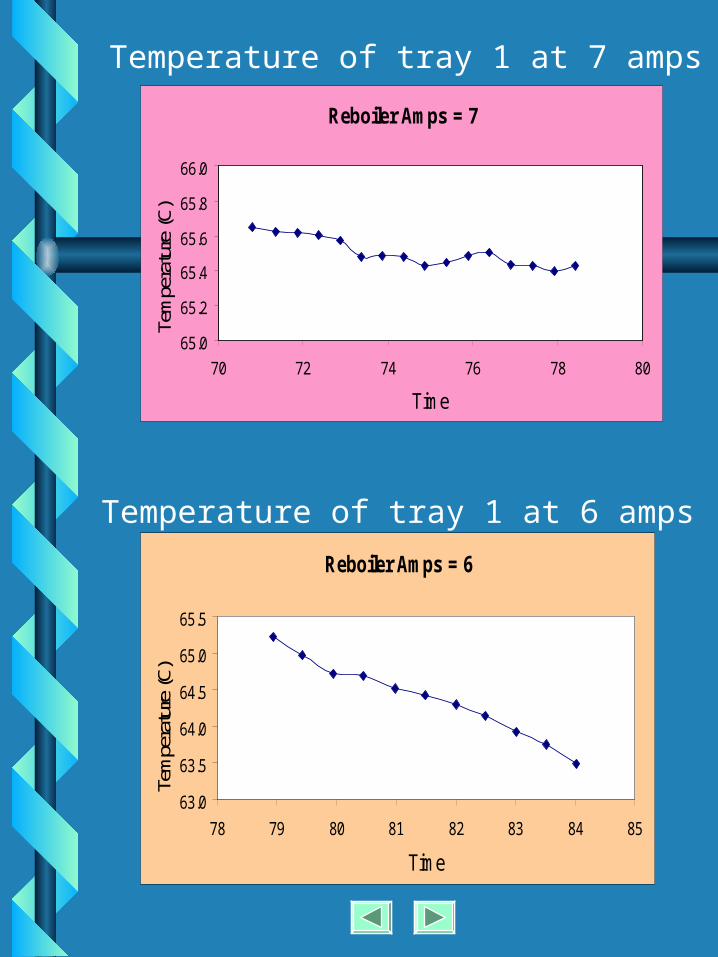
energy input into the column Minimum amperage to
maintain the temperature on tray 1 is between 6 and 7 amps
Estimated column heat loss is between 1230 Watts and 1435 Watts
Reboiler Amps = 7
65.0
65.2
65.4
65.6
65.8
66.0
70 72 74 76 78 80
Time
Tem
pera
ture
(C)
Reboiler Amps = 6
63.0
63.5
64.0
64.5
65.0
65.5
78 79 80 81 82 83 84 85
Time
Tem
pera
ture
(C)
Temperature of tray 1 at 7 amps
Temperature of tray 1 at 6 amps
RTD CalibrationRTD Calibration
Temperature is calculated by multiplying the voltage by the scale and then adding the offset
Steps to calibrate RTDs
- fill reboiler with pure
methanol- allow steady state- set offset to zero- set scale to one- collect voltage readings- repeat with water
Voltage is taken at 100oC (pure water) and 64.5oC (pure methanol)
Straight line was fit between the two points
Slope of the line is the scale
y intercept is the offset
Pump and Cooling Pump and Cooling Water CalibrationWater Calibration
Pump and cooling water calibrations seem to be reliable
Pump calibration - by measuring the outflow of the pump for a timed period Cooling water calibration - by measuring the flow at the cooling water system
drain at various valve openings
Pump Calibration Pump Calibration CurveCurve
Feed Pump Calibration Curve
F = -2.3996M2 + 98.326M - 81.102
R2 = 0.9942
0
100
200
300
400
500
600
0 2 4 6 8 10
Pump Setting
Flo
wra
te (
ml/
min
)
Pump : 7017-21 Pattern No. 3.358.609
Conclusions Conclusions (calibrations)(calibrations)
Pump and cooling water calibrations seem to be reliable
Calibrations performed on the glass RTDs were unsuccessful ( repeated several times)
Replacement of the glass RTDs with stainless steel improved the calibrations
- three RTDs do not give
reliable temperature indication
Recommendation Recommendation (calibrations)(calibrations)
Perform calibrations- after a period of inactivity
- whenever equipment is changed
or modified
Reduce time spent on calibrations
- Calibrate the RTDs individually
with ice and boiling water
- UTC engineering/maintenance
personnel should complete
calibrations
Experimental Experimental ResultsResults
Energy and mass Energy and mass balancebalance
Capacity testCapacity test Feed location impactFeed location impact Reflux ratio impactReflux ratio impact
Energy and Mass Energy and Mass BalanceBalance
Excel spreadsheet was developed to facilitate mass and energy calculations
Calculations showed an increase in water and a decrease in methanol
Column had not reached steady-state conditionsFlowrate (gms/min)
Mixture Methanol WaterFeed 321 315 12Bottoms 205 168 12Distillate 116 147 0
DISTILLATION COLUMN EXPERIMENT (10/15/97)MASS BALANCE
InputsReflux Ratio= 1.78 Tank Temp= 30.00Distillate: Reboiler: Feed:Pump Setting: 1.20 Pump Setting: 2.10 Pump Setting: 5.00RTD Reading: 64.57 RTD Reading: 75.67 %MeOH(Molar): 0.50Density: 0.79 Density: 0.94 Density 0.92
Distillate Reboiler: Feed Pump:%MeOH (Molar) 99.55 %MeOH (Molar) 39.15 %MeOH (Molar) 50.00Frac (Wt) 1.00 Frac (Wt) 0.53 Frac (Wt) 0.64Flow Rate (ml/min) 15.05 Flow Rate (ml/min) 336.57 Flow Rate (ml/min) 350.54Mass flow rate (g/min) 11.91 Mass flow rate (g/min) 315.13 Mass flow rate (g/min) 320.95Mass MeOH (g/min) 11.88 Mass MeOH (g/min) 168.14 Mass MeOH (g/min) 205.41Mass H2O(g/min) 0.03 Mass H2O(g/min) 147.00 Mass H2O(g/min) 115.54
water balance 31.48 gm/minMeOH balance -25.39 gm/min
ENERGY BALANCEENERGY IN AT REBOILERReboiler (Amps) 15.43Energy In(watts) 3394.60
CONDENSER RE BOILERCool Water Temp-in(°C) 19.74 Delta T 45.67Cool Water Temp-out (°C) 20.63Cool Water Flow (ml/min) 9000.00Water Cp (KJ/KgoK) 4.18 MeOH Cp 2.55Energy Out Cond(watts) 557.94 Qcond Reboiler Energy 794.47 QrLatent Heat(watts) 615.07 Qlatent
Capacity TestCapacity Test
Performed to determine the maximum capacity of the column to produce distillate
Parameters for the test are -- reboiler was filled with a mixture of methanol and water
- reboiler current set at 20 amps (maximum) - reflux set 95 % Methanol distillate
- steady-state conditions were established
- Set various feed pump settings- Set various feed pump settings
- Set various reflux ratios- Set various reflux ratios
-- Determine distillate and reboiler Determine distillate and reboiler
flowrateflowrate
- Column did not produce distillate at- Column did not produce distillate at
pump setting of 7 pump setting of 7
Feed Pump Feed Flowrate Percent Distillate ReboilerSetting (ml/min) Reflux Flowrate Flowrate
(ml/min) (ml/min)3 192 76 25 1805 350 75 32 3326 420 76 21 3907 490 - - -
Capacity Test Capacity Test ComparisonComparison
Feed Location Feed Location ImpactImpact
ParameterParameter
- Pump setting of 3- Pump setting of 3
- Reboiler amps at 20- Reboiler amps at 20
- 70% reflux- 70% reflux ResultsResults
- Tray 4 - 89% - Tray 4 - 89%
- Tray 5 - 93% - Tray 5 - 93%
- Tray 6 - 97%- Tray 6 - 97%
Reflux ImpactReflux Impact
Parameter Parameter
- Feed location tray 4- Feed location tray 4
- Pump setting of 3- Pump setting of 3
- Reboiler amps at 20- Reboiler amps at 20 ResultsResults
- Reflux 50% - 78% at 43- Reflux 50% - 78% at 43
ml/minml/min
- Reflux 70% - 89% at 23- Reflux 70% - 89% at 23
ml/min ml/min
Conclusions Conclusions (Experimental (Experimental Results)Results)
Design and execution of experiments
- useful way of gaining experience
- found column performed in a predictable manner - increased the students’ level of confidence
energy and mass balance calculations demonstrated
- purity of the product was surpassed with a reduction in the quantity of
the product
Based on observations from the capacity test
- maximum output of the reboiler heaters
could not maintain boiling conditions above a feedwater flowrate of
420ml/min
Based on observations from the feed location experiment
- optimum feed tray location - tray 6
- due to the higher methanol composition
in the distillate
Based on observations from the percent reflux experiment
- between 50- and 70-percent reflux
* two times the distillate flowrate* 1.6 times the amount of methanol
Recommendation Recommendation (Experimental (Experimental Results)Results)
Review the RTD calibrations to account for the discrepancies in the mass balance
Perform additional feed location impact experiments
Take physical measurement of the distillate flow (not pump flowrates)
PRO IIPRO II
Steady-state heat and material balance simulator
Simulates any number of components, streams, units, and recycle loops
Requirement- Feed stream
- composition
- temperature- flowrate
- pressure - Tray efficiency
Specify two of the following parameters
- Any specific tray temperature
- Heat duty of the condenser- Temperature of the distillate- Composition of the distillate- Flowrate of the distillate- Reflux ratio- Temperature of the bottoms- Composition of the bottoms- Flowrate of the bottoms- Heat duty of the reboiler
PROII will calculate remaining
parameters
PRO II - Optimizing Distillation ColumnPRO II - Optimizing Distillation ColumnStream Name 1 2 3Stream DescriptionPhase Liquid Liquid LiquidTemperature C 25 65.53888 99.82745Pressure ATM 0.994603 0.994603 0.994603Flowrate G-MOL/MIN 12.00385 6.488153 5.515693Composition MEOH 0.5 0.925 6.91E-05 H2O 0.5 0.075 0.999931Total StreamRate G-MOL/MIN 12.00385 6.488153 5.515693
G/MIN 300.4381 201.0676 99.37048Std. Liq. Rate CM3/MIN 350 250.4837 99.51627Temperature C 25 65.53888 99.82745Pressure ATM 0.994603 0.994603 0.994603Molecular Weight 25.0285 30.98997 18.01597Enthalpy M*J/MIN 0.023033 0.034942 0.041537
J/G 76.66611 173.7827 417.998Mole Fraction Liquid 1 1 1Reduced Temperature 0.514083 0.647976 0.576169Reduced Pressure 0.006671 0.011017 0.004556Acentric Factor 0.45835 0.552148 0.348015UOP K-Value 9.962891 10.55651 8.76176Std. Liquid Density G/CM3 0.858395 0.802717 0.998535 Sp. Gravity 0.859242 0.803509 0.999521 API Gravity 33.18008 44.60248 10.06786VaporRate G-MOL/MIN n/a n/a n/a
G/MIN n/a n/a n/aCM3/MIN n/a n/a n/a
Molecular Weight n/a n/a n/aZ (from Density) n/a n/a n/aEnthalpy J/G n/a n/a n/aCP J/G-C n/a n/a n/aDensity G/CM3 n/a n/a n/aTh. Conductivity KCAL/HR-M-Cn/a n/a n/aViscosity CP n/a n/a n/aLiquidRate G-MOL/MIN 12.00385 6.488153 5.515693
G/MIN 300.4381 201.0676 99.37048CM3/MIN 352.8752 265.9261 103.6818
Molecular Weight 25.0285 30.98997 18.01597Z (from Density) 0.001195 0.001467 0.000611Enthalpy J/G 76.66611 173.7827 417.998CP J/G-C 3.115483 2.895487 4.21597Density G/CM3 0.851401 0.756103 0.958418Surface Tension DYNE/CM n/a n/a n/a
Ponchon-Savarit Ponchon-Savarit TheoryTheory
Graphical Method Graphical Method • Plots Enthalpy Against Plots Enthalpy Against
CompositionComposition Provides Exact SolutionsProvides Exact Solutions Incorporates Effects of Incorporates Effects of
Heat Losses Heat Losses • Inputs of Individual Tray Inputs of Individual Tray
LossesLosses• Inherent Material and Inherent Material and
Energy BalancesEnergy Balances
Ponchon-Savarit Ponchon-Savarit Diagram on ExcelDiagram on Excel
Inputs Needed (highlighted in yellow)• Distillate and Bottoms
Compositions Desired• Distillate and Bottoms
Flowrates• Heat Losses on Each Tray
Works For Up To 13 Stages Tested For Bottoms
Concentrations down to 0.01% and Distillate Concentrations up to 97.9%
ConclusionConclusion(Computer (Computer Modeling)Modeling)
PROII- user friendly
- fast- not accurate- limited by constraints
Ponchon-Savarit- heat loss on individual
trays must be known- only valid for methanol-
water mixtures
RecommendationsRecommendations(Computer (Computer Modeling)Modeling)
Modify the PROII model to more closely approximate the UTC distillation column
Conduct training for students on the use of modeling tools
Determine the heat losses on the individual trays (Ponchon-Savarit)
ConclusionsConclusions(Final)(Final)
Technical - Study of mass transfer operations using the distillation column - Approach to the study of the distillation column included
- Literature search
- Operating the column
- Computer modeling
* Ponchon-Savarit
* PROII
- Each student had the opportunity to participate in
- operation
- calibration- repair
- Provided a better understanding
through - research
- classroom discussion- design of experiments
Accomplishments- Ponchon-Savarit spreadsheet
developed- PROII model developed - Energy and mass balance spreadsheet developed- Determination of the column capacity- Determination of heat lost to the environment- Performed feed input experiments
RecommendationsRecommendations(Final)(Final)
Allow for more continuous laboratory time - Modify class schedule
- Maintain the distillation column components - Establish course objectives,
perform calibrations, research literature, and familiarize
students with modeling programs
within the first month of the semester