Page 1
Fargo Moorhead Metropolitan Area BCOES‐ATR/Sponsor/PDT Review Flood Risk Management Project Diversion Inlet Structure
Appendix F:
AppendixF:StructuralDesign&Criteria
FargoMoorheadMetropolitanArea
FloodRiskManagementProject
DiversionInletStructure
EngineeringandDesignPhase
P2# 370365
POST BCOES‐ATR/Sponsor/PDT Submittal
3 May 2016
Page 2
Fargo Moorhead Metropolitan Area BCOES‐ATR/Sponsor/PDT Review Flood Risk Management Project Diversion Inlet Structure
Appendix F:
This page is intentionally left blank
Page 3
Fargo Moorhead Metropolitan Area BCOES‐ATR/Sponsor/PDT Review Flood Risk Management Project Diversion Inlet Structure
Appendix F:
DDR_FMM_Diversion_Inlet_Appendix_F_Structural.docx F‐ i
AppendixF:StructuralDesign&CriteriaTable of Contents
F.1 General .................................................................................................................................................. 1
F.1.1 Design Guidance ....................................................................................................................... 1
F.1.2 Material Properties ................................................................................................................... 2
F.1.3 Unit Weights ............................................................................................................................. 3
F.1.4 Soil Parameters ......................................................................................................................... 3
F.1.5 General Design Loads ................................................................................................................ 5
F.1.5.1 Water Loads .......................................................................................................................... 5
F.1.5.2 Uplift ..................................................................................................................................... 5
F.1.5.3 Ice loads ................................................................................................................................ 8
F.1.5.4 Debris loads ........................................................................................................................... 8
F.1.5.5 Wave loads ............................................................................................................................ 8
F.1.5.6 Wind loads ............................................................................................................................ 9
F.1.5.7 Surcharge/Construction Loads .............................................................................................. 9
F.1.5.8 Seismic Design Considerations .............................................................................................. 9
F.1.5.9 Vehicle Live Loads ............................................................................................................... 10
F.2 Control structure ................................................................................................................................. 12
F.2.1 General Requirements ............................................................................................................ 12
F.2.2 Alternatives Considered .......................................................................................................... 12
F.2.2.1 Dam Walls versus Soil Embankment Alternatives .............................................................. 12
F.2.2.2 Combined or Separated Mechanical Platform and Vehicle service Bridge ........................ 13
F.2.3 General Configuration ............................................................................................................. 15
F.2.4 Design Criteria ......................................................................................................................... 18
F.2.4.1 Load Cases ........................................................................................................................... 18
F.2.4.2 Concrete Design .................................................................................................................. 21
F.2.4.3 Pile Design ........................................................................................................................... 22
F.2.4.4 Deflection Criteria ............................................................................................................... 22
F.2.5 Design Considerations ............................................................................................................. 23
Page 4
Fargo Moorhead Metropolitan Area BCOES‐ATR/Sponsor/PDT Review Flood Risk Management Project Diversion Inlet Structure
Appendix F:
DDR_FMM_Diversion_Inlet_Appendix_F_Structural.docx F‐ ii
F.2.5.1 Piling .................................................................................................................................... 23
F.2.5.2 Rebound .............................................................................................................................. 23
F.2.5.3 Design for Rebound ............................................................................................................ 23
F.2.5.4 Pile Tension Connectors ...................................................................................................... 26
F.2.6 Joints ....................................................................................................................................... 27
F.2.7 Foundation Design .................................................................................................................. 28
F.2.7.1 Configuration ...................................................................................................................... 28
F.2.7.2 Foundation Design Process ................................................................................................. 30
F.2.7.3 Joints ...................................................................................... Error! Bookmark not defined.
F.2.7.4 Pile Group Effects ................................................................................................................ 30
F.2.7.5 Foundation Design Summary .............................................................................................. 30
F.2.8 Abutment/Stilling Basin Walls ................................................................................................ 38
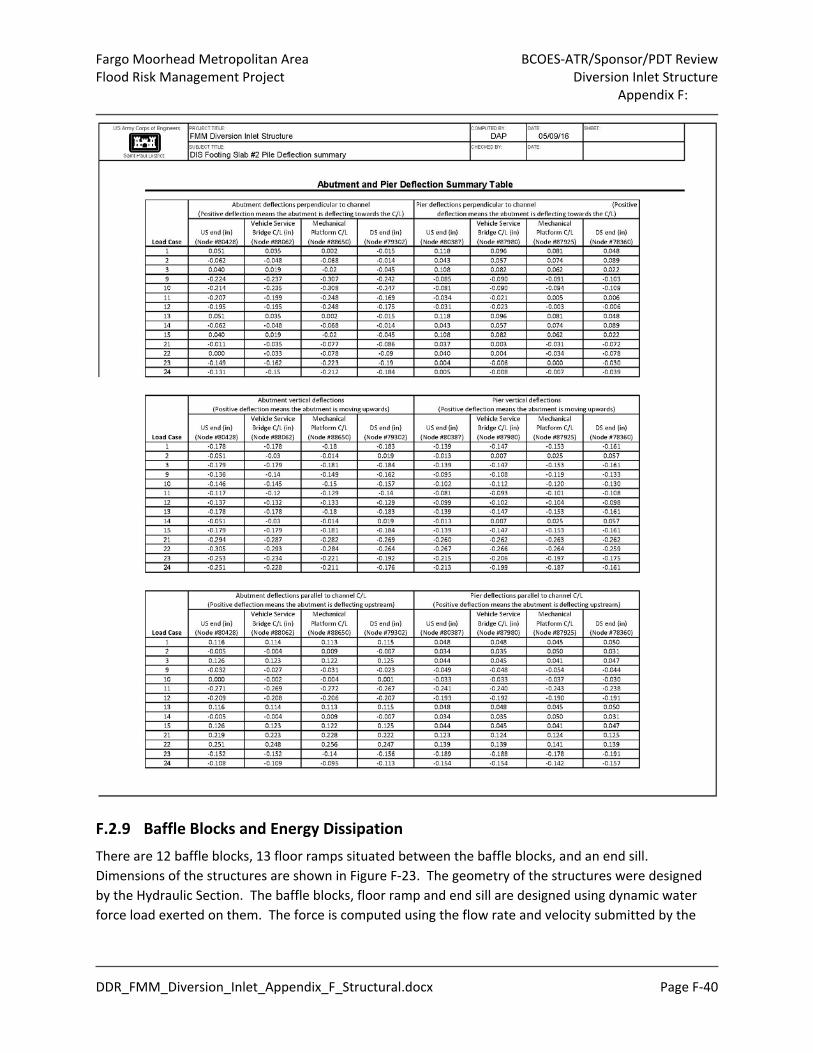
F.2.9 Baffle Blocks and Energy Dissipation ...................................................................................... 40
F.2.10 Dam Walls ............................................................................................................................... 41
F.2.10.1 Configuration ...................................................................................................................... 41
F.2.10.2 Design Procedure ................................................................................................................ 42
F.2.10.3 Load Cases ........................................................................................................................... 43
F.2.10.4 Design Analysis .................................................................................................................... 45
F.3 Tainter Gates ....................................................................................................................................... 48
F.3.1 Tainter Gate 3D Model Overview ........................................................................................... 48
F.3.2 Loads ....................................................................................................................................... 51
Page 5
Fargo Moorhead Metropolitan Area BCOES‐ATR/Sponsor/PDT Review Flood Risk Management Project Diversion Inlet Structure
Appendix F:
DDR_FMM_Diversion_Inlet_Appendix_F_Structural.docx F‐ iii
F.3.2.1 Gravity Loads ....................................................................................................................... 51
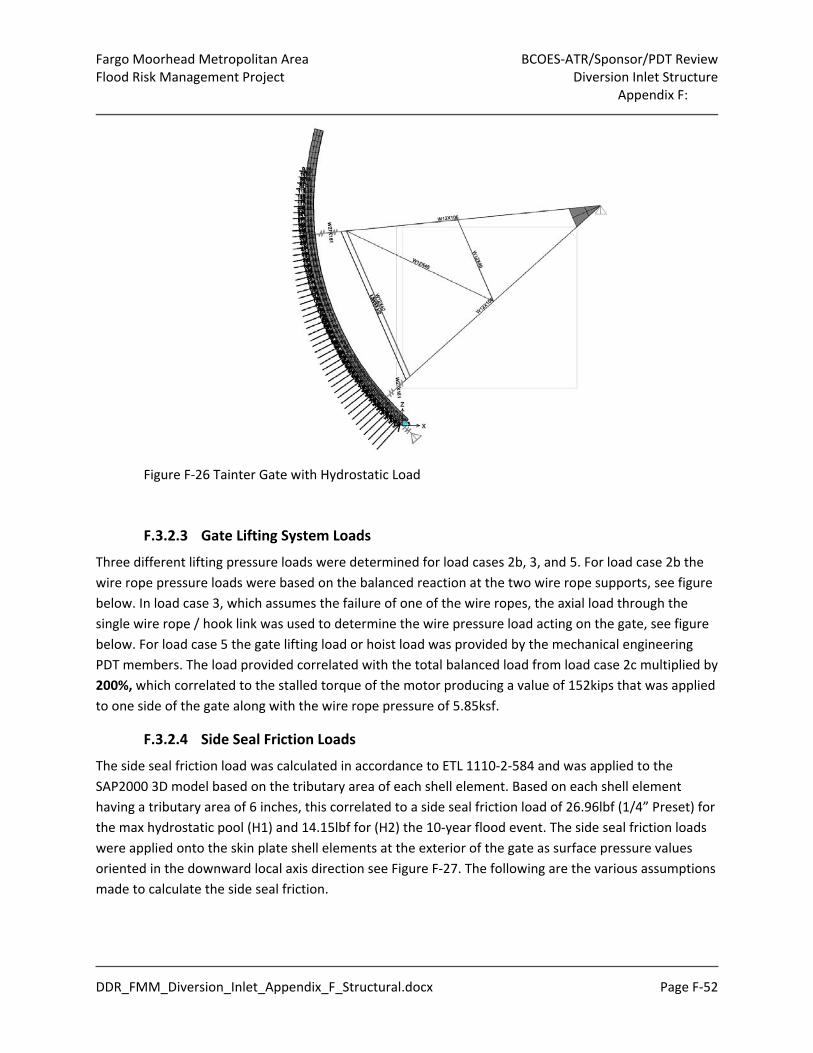
F.3.2.2 Hydrostatic Loads ................................................................................................................ 51
F.3.2.3 Gate Lifting System Loads ................................................................................................... 52
F.3.2.4 Side Seal Friction Loads ....................................................................................................... 52
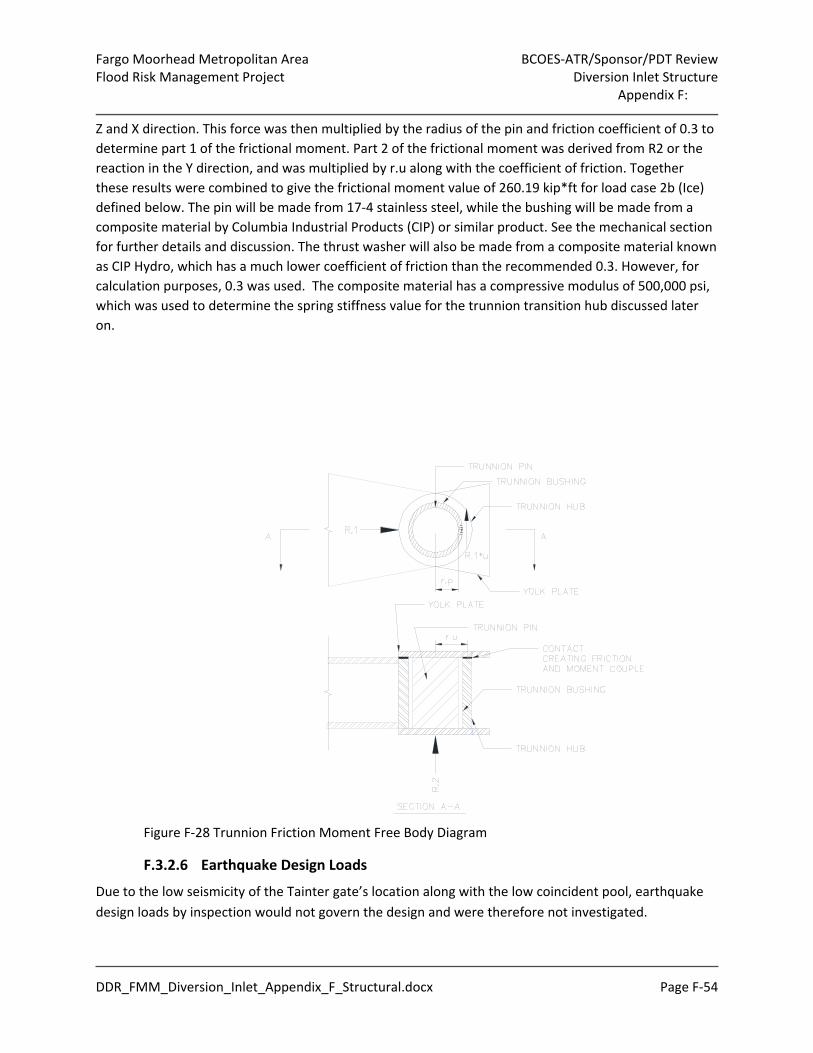
F.3.2.5 Trunnion Pin Friction Loads ................................................................................................ 53
F.3.2.6 Earthquake Design Loads .................................................................................................... 54
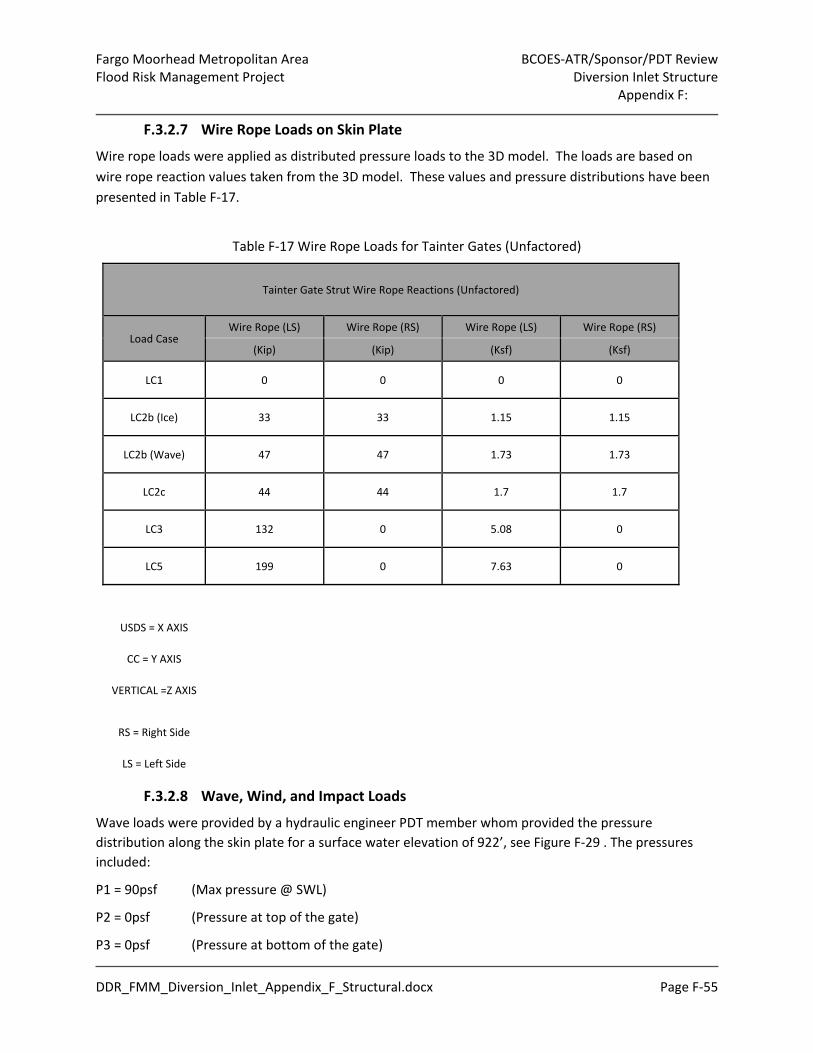
F.3.2.7 Wire Rope Loads on Skin Plate ........................................................................................... 55
F.3.2.8 Wave, Wind, and Impact Loads .......................................................................................... 55
F.3.2.9 Selected Load Cases ............................................................................................................ 57
F.3.3 Tainter Gate Material Selection .............................................................................................. 60
F.3.4 Tainter Gate Analysis and Results ........................................................................................... 60
F.3.4.1 Analysis Summary ............................................................................................................... 60
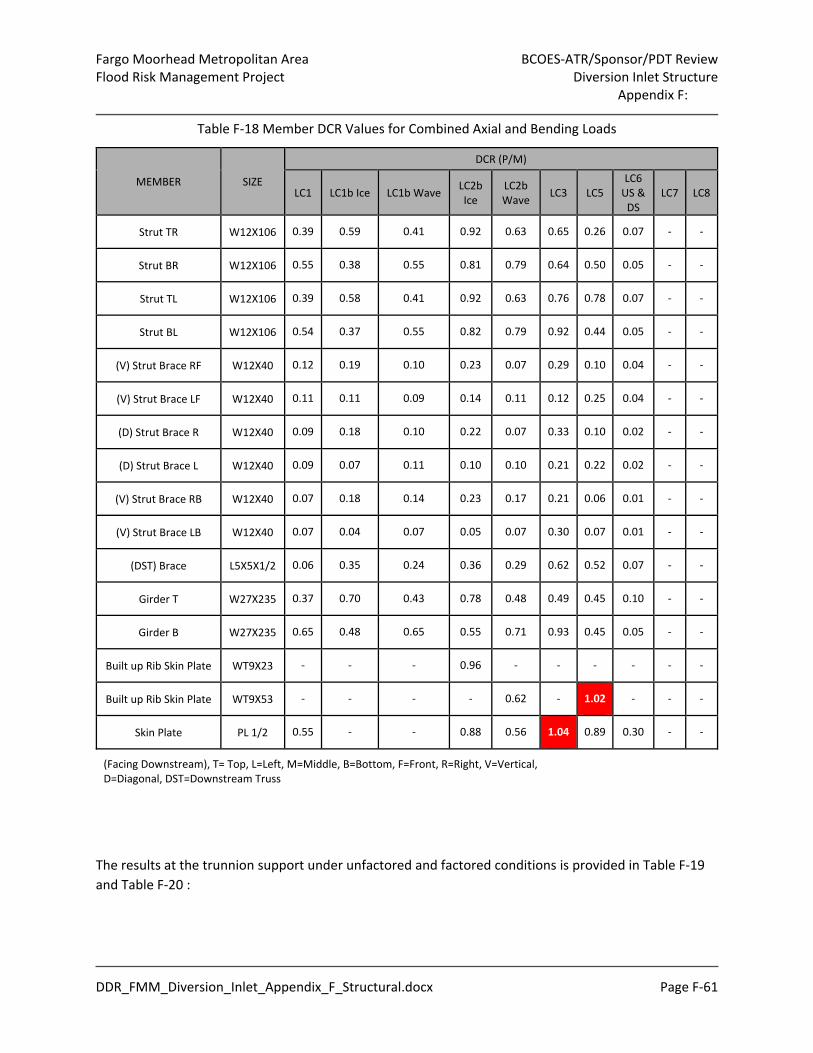
F.3.4.2 Discussion of Results ........................................................................................................... 64
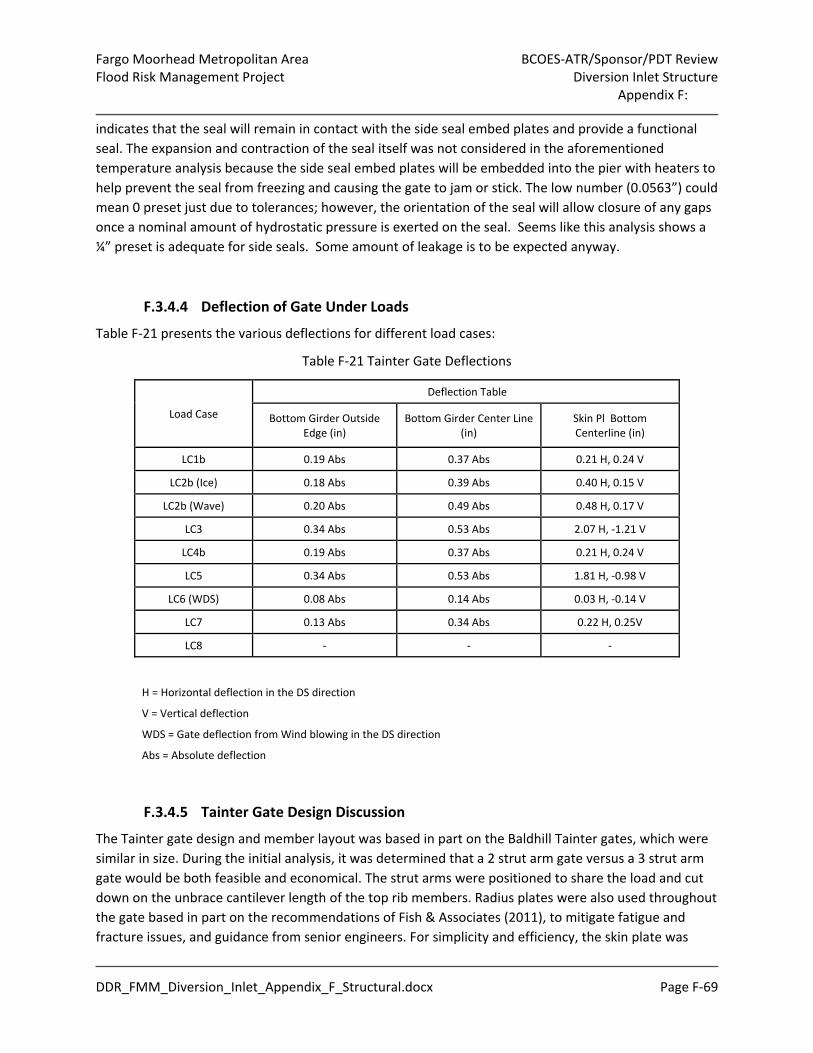
F.3.4.3 Deflection of Gate from Temperature ................................................................................ 68
F.3.4.4 Deflection of Gate Under Loads .......................................................................................... 69
F.3.4.5 Tainter Gate Design Discussion ........................................................................................... 69
F.3.5 Tainter Gate Trunnion Transition Hub .................................................................................... 72
F.3.5.1 Trunnion Transition Hub Finite Element Model Description & Assumptions ..................... 72
F.3.5.2 Trunnion Transition Hub Loads / Demands ........................................................................ 73
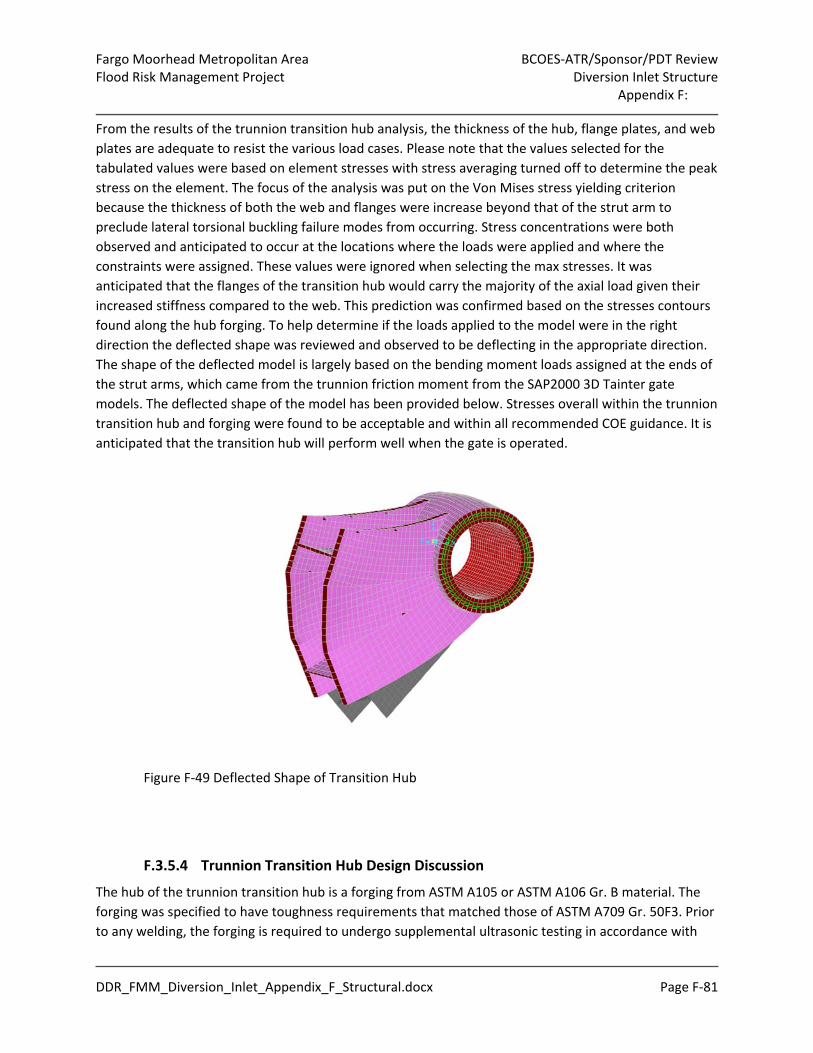
F.3.5.3 Trunnion Transition Hub Results ......................................................................................... 75
F.3.5.4 Trunnion Transition Hub Design Discussion ....................................................................... 81
F.3.6 Tainter Gate Trunnion Assembly ............................................................................................ 83
F.3.6.1 Finite Element Model Description & Assumptions ............................................................. 83
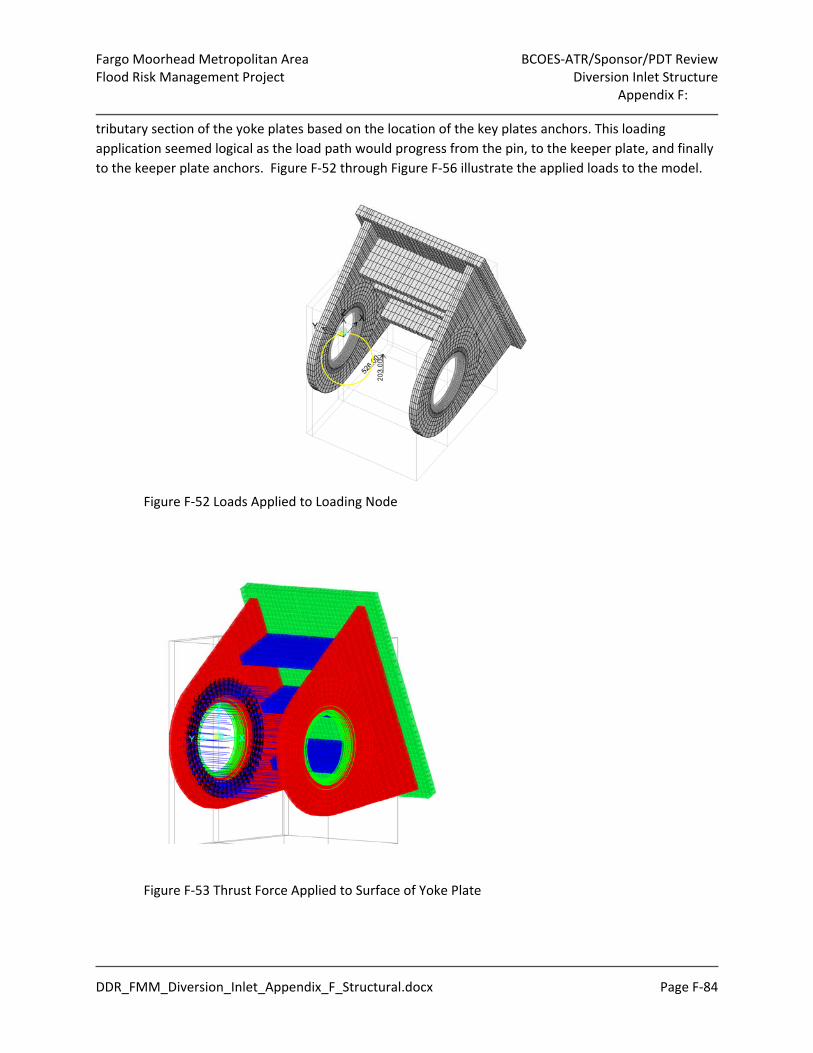
F.3.6.2 Applied Loading ................................................................................................................... 83
F.3.6.3 Results of the Yield Limit State ........................................................................................... 86
F.3.6.4 Results of Bearing and Buckling Limit States ...................................................................... 89
F.3.7 Misc. Tainter Gate Components ............................................................................................. 93
Page 6
Fargo Moorhead Metropolitan Area BCOES‐ATR/Sponsor/PDT Review Flood Risk Management Project Diversion Inlet Structure
Appendix F:
DDR_FMM_Diversion_Inlet_Appendix_F_Structural.docx F‐ iv
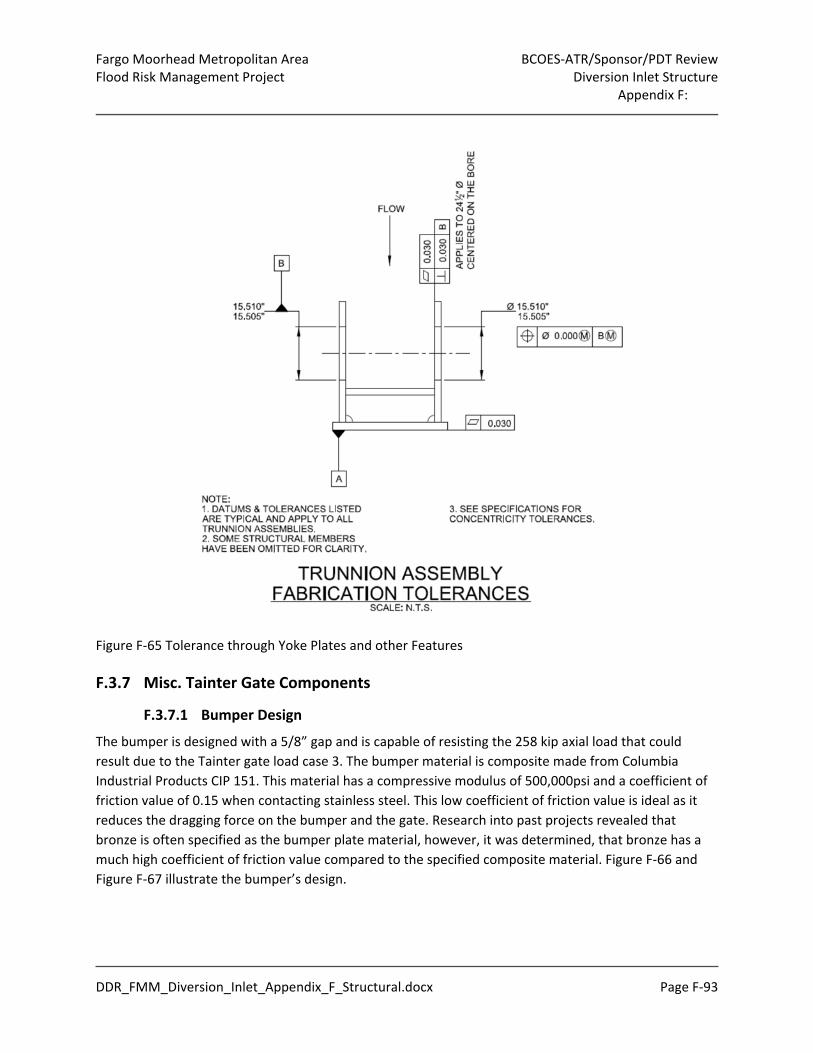
F.3.7.1 Bumper Design .................................................................................................................... 93
F.3.7.2 Side Seal and Bumper Embed Plate Design ........................................................................ 94
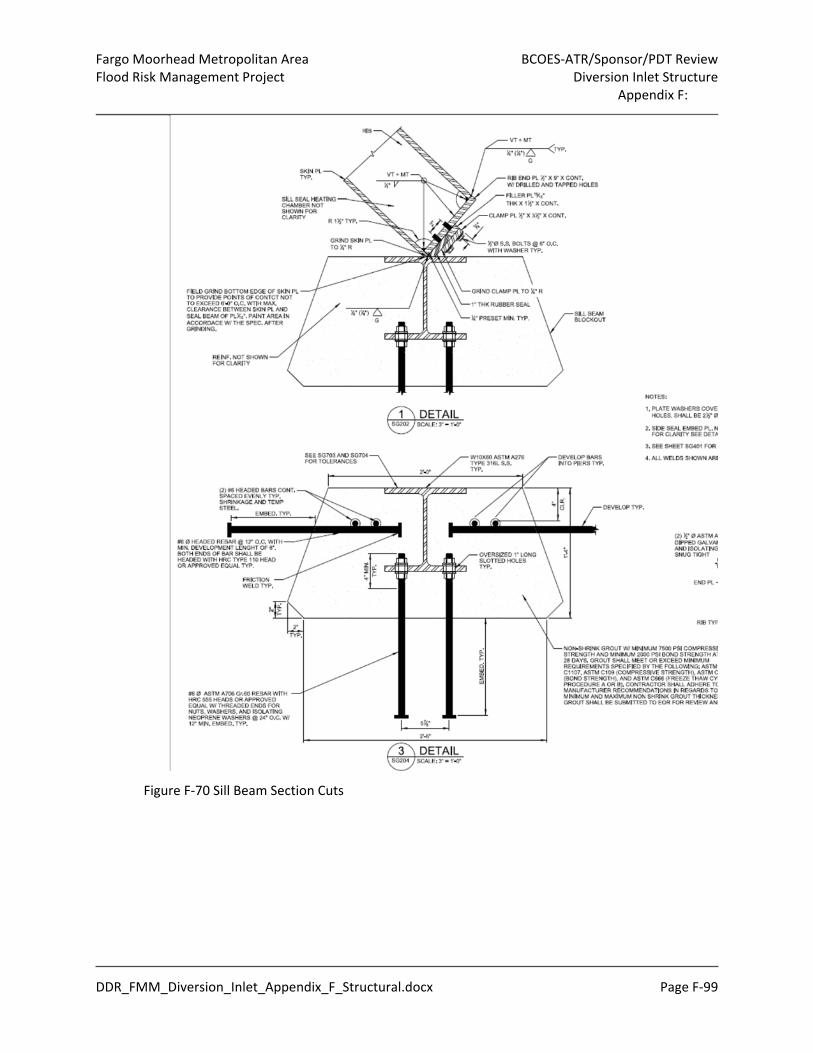
F.3.7.3 Sill Beam Design .................................................................................................................. 98
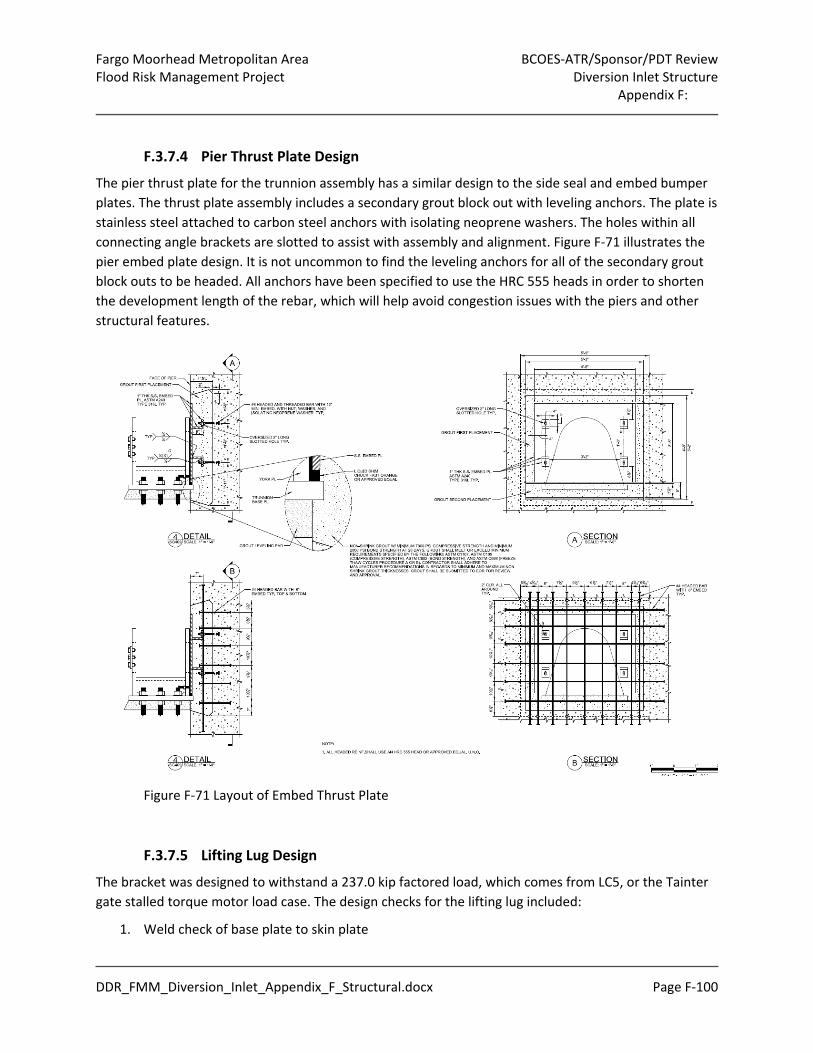
F.3.7.4 Pier Thrust Plate Design .................................................................................................... 100
F.3.7.5 Lifting Lug Design .............................................................................................................. 100
F.3.7.6 Seal Design and Assembly ................................................................................................. 101
F.3.7.7 Tolerance Design ............................................................................................................... 104
F.3.7.8 References ........................................................................................................................ 104
F.4 Trunnion Girder ................................................................................................................................. 105
F.4.1 General Description .............................................................................................................. 105
F.4.2 Material Properties ............................................................................................................... 105
F.4.3 Load Cases and Load Factors ................................................................................................ 105
F.4.4 Factored Trunnion Load Values ............................................................................................ 105
F.4.5 Analysis of Anchorage forces ................................................................................................ 106
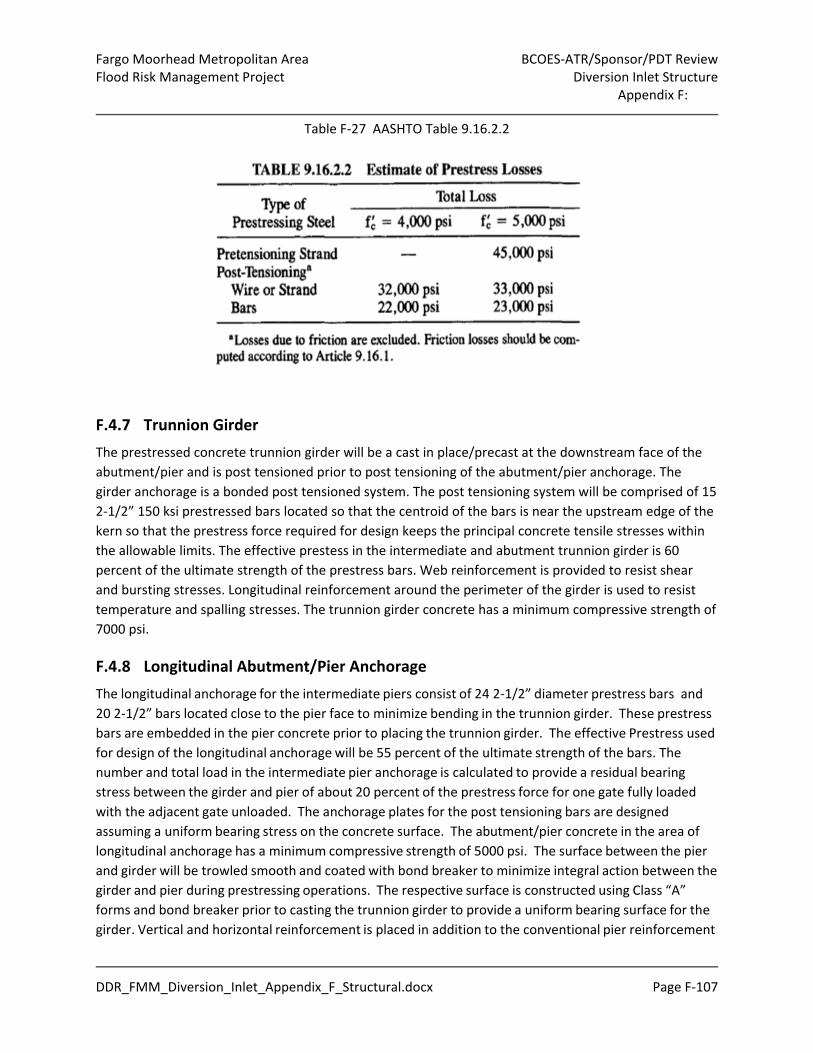
F.4.6 Prestress Losses .................................................................................................................... 106
F.4.7 Trunnion Girder ..................................................................................................................... 107
F.4.8 Longitudinal Abutment/Pier Anchorage ............................................................................... 107
F.4.9 Corrosion Protection ............................................................................................................. 108
F.5 Bridges .............................................................................................................................................. 108
F.5.1 Vehicle Service Bridge ........................................................................................................... 108
F.5.2 Bridge on Dam Walls ............................................................................................................. 109
F.5.3 Mechanical Platform ............................................................................................................. 109
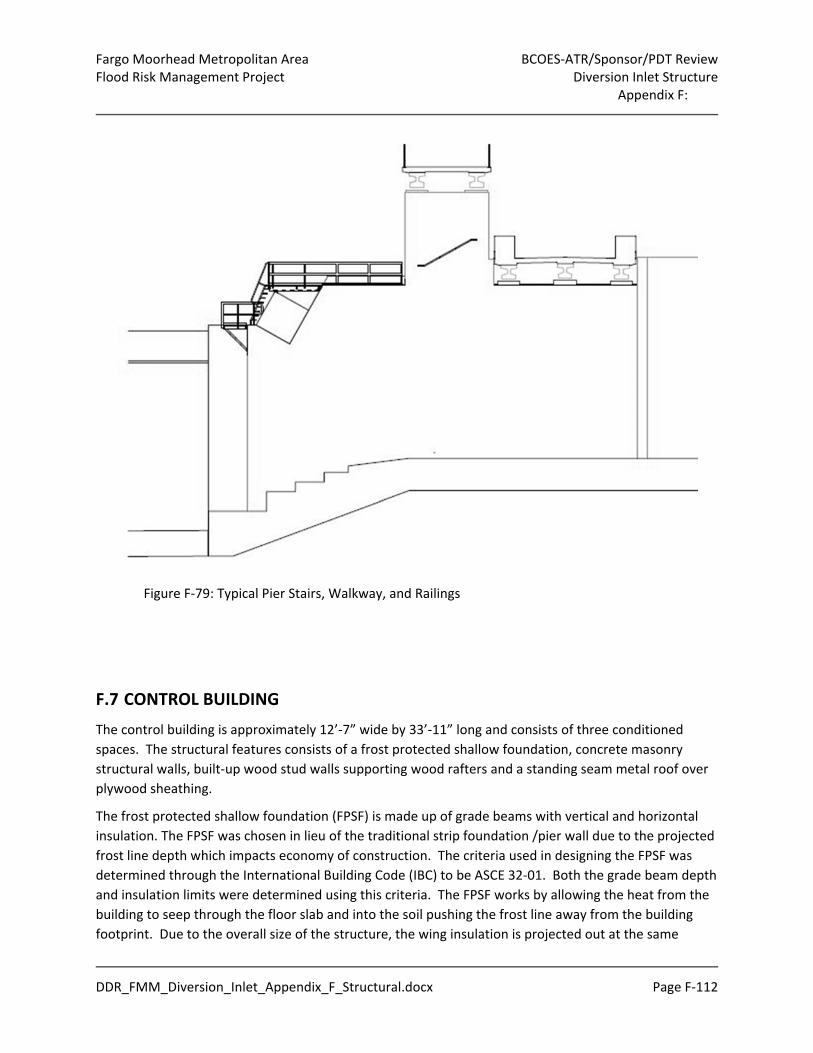
F.6 Railings, Stairways, and Walkways ................................................................................................... 110
F.7 Control Building ................................................................................................................................ 112
F.8 Aesthetics .......................................................................................................................................... 113
F.9 Reference Documents ....................................................................................................................... 114
F.10 Calculations ....................................................................................................................................... 114
Table of contents for calculations ............................................................................................................. 114
Page 7
Fargo Moorhead Metropolitan Area BCOES‐ATR/Sponsor/PDT Review Flood Risk Management Project Diversion Inlet Structure
Appendix F:
DDR_FMM_Diversion_Inlet_Appendix_F_Structural.docx Page F‐1
AppendixF:StructuralDesign&Criteria
F.1 GENERAL
The Design Documentation Report (DDR) outlines the assumptions and methods for both analysis and
design specific to the Diversion Inlet Structure of the Fargo Moorhead Metro Project. The elements
involved in the diversion inlet structure are the foundation, piers, tainter gates, trunnion girder, vehicle
service bridge, mechanical platform, dam wall, control building, stepped spillway, stilling basin and
abutment walls.
F.1.1 Design Guidance
Analysis and design for the Final Technical Review (FTR) level is being performed using the guidance of
several USACE engineering manuals, design guidelines, codes and the Project Design Guidance. A selected
list of the critical design criteria documents are listed below.
a. ECB No. 2014‐24 Issued 7 Nov 2014 (Revision and Clarification of EM 1110‐2‐2100 and EM 1110‐
2‐2502)
b. EM 385‐1‐1 Safety and Health Requirements (September 2008)
c. EM 1110‐1‐1, Safety and Health Requirements Manual (September 2008)
d. EM 1110‐2‐1605 (Hydraulic Design of Navigation of Dams)
e. EM 1110‐2‐1612, Ice Engineering (October 2002)
f. EM 1110‐2‐2100, Stability Analysis of Concrete Structures (December 2005)
g. EM 1110‐2‐2102, Waterstops and Other Preformed Joint Materials for Civil Works
h. Structures (September 1995)
i. EM 1110‐2‐2104, Strength Design of Reinforced Concrete Hydraulic Structures (June 1992) with
change 1 August 2003
j. EM 1110‐2‐2105, Design of Hydraulic Steel Structures (March 1993) with change 1
k. May 1994
l. EM 1110‐2‐2502, Retaining and Floodwalls (September 1989)
m. EM 1110‐2‐2504, Design of Sheet Pile Walls (March 1994)
n. EM 1110‐2‐2702, Design of Spillway Tainter Gates (January 2000)
o. EM 1110‐2‐2902, Conduits, Culverts, and Pipers (October 1997) with change 1 March 1998
p. EM 1110‐2‐2906, Design of Pile Foundations (January 1991)
q. ETL 1110‐2‐584, Design of Hydraulic Steel Structures (30 June 2014)
r. American Welding Society, AWS D1.1 and D1.5
s. ACI 318‐14, Building Code Requirements for Structural Concrete
t. AISC Manual of Steel Construction, 14th Edition
u. AASHTO LRFD Bridge Design Specifications 2014 7th Edition
v. T‐Wall Design Procedure (08 May 2009, based on revisions from 05 May 2008)
w. DRAFT Project Design Guidelines Version 3 2013 Fargo Moorhead Metropolitan Area Flood Risk
Management Project Engineering and Design Phase.
Page 8
Fargo Moorhead Metropolitan Area BCOES‐ATR/Sponsor/PDT Review Flood Risk Management Project Diversion Inlet Structure
Appendix F:
DDR_FMM_Diversion_Inlet_Appendix_F_Structural.docx Page F‐2
x. Hydraulic Structures Design Guidelines Appendix F dated 15 February 2013 of the Fargo
Moorhead Metropolitan Area Flood Risk Management Project, Project Design Guidelines.
y. Static and Dynamic Load Test Results Fargo Moorhead Pile Load Test Program prepared by
Industrial Builders, Inc.
z. Fish & Associates. (2011). “Standard detailing of hydraulic steel structures.” Task Order No. 22,
U.S. Army COE (USACE), Washington, DC.
aa. United State Army Corps of Engineers, 2014 “Design of Hydraulic Steel Structures” Engineering
Technical Letter ETL 1110‐2‐584.
bb. United States Army Corps of Engineers, 2000 “Design of Spillway Tainter Gates” Engineering
Manual 1110‐2‐2702.
cc. International Building Code (IBC 2012) dd. OSHA 3124: Stairways and Ladders ee. OSHA 1910.24: Fixed Industrial Stairs ff. OSHA 1917.120: Fixed Stairways
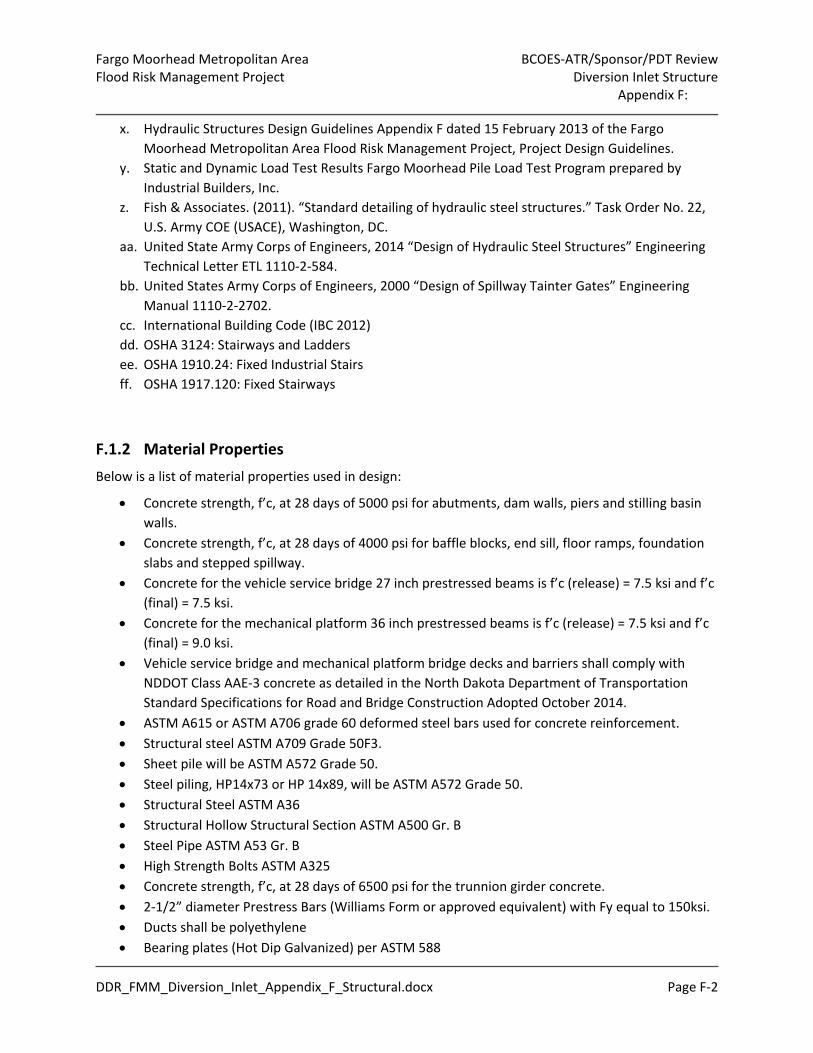
F.1.2 Material Properties
Below is a list of material properties used in design:
Concrete strength, f’c, at 28 days of 5000 psi for abutments, dam walls, piers and stilling basin
walls.
Concrete strength, f’c, at 28 days of 4000 psi for baffle blocks, end sill, floor ramps, foundation
slabs and stepped spillway.
Concrete for the vehicle service bridge 27 inch prestressed beams is f’c (release) = 7.5 ksi and f’c
(final) = 7.5 ksi.
Concrete for the mechanical platform 36 inch prestressed beams is f’c (release) = 7.5 ksi and f’c
(final) = 9.0 ksi.
Vehicle service bridge and mechanical platform bridge decks and barriers shall comply with
NDDOT Class AAE‐3 concrete as detailed in the North Dakota Department of Transportation
Standard Specifications for Road and Bridge Construction Adopted October 2014.
ASTM A615 or ASTM A706 grade 60 deformed steel bars used for concrete reinforcement.
Structural steel ASTM A709 Grade 50F3.
Sheet pile will be ASTM A572 Grade 50.
Steel piling, HP14x73 or HP 14x89, will be ASTM A572 Grade 50.
Structural Steel ASTM A36
Structural Hollow Structural Section ASTM A500 Gr. B
Steel Pipe ASTM A53 Gr. B
High Strength Bolts ASTM A325
Concrete strength, f’c, at 28 days of 6500 psi for the trunnion girder concrete.
2‐1/2” diameter Prestress Bars (Williams Form or approved equivalent) with Fy equal to 150ksi.
Ducts shall be polyethylene
Bearing plates (Hot Dip Galvanized) per ASTM 588
Page 9
Fargo Moorhead Metropolitan Area BCOES‐ATR/Sponsor/PDT Review Flood Risk Management Project Diversion Inlet Structure
Appendix F:
DDR_FMM_Diversion_Inlet_Appendix_F_Structural.docx Page F‐3
Hex nuts (Hot Dip Galvanized) per ASTM A29 or A576
Hardened Washers (Hot Dip Galvanized) per ASTM F436
F.1.3 Unit Weights
Below is a list of unit weights and material properties used in design:
‐ Water: 62.5 pcf ‐ Concrete: 150 pcf ‐ Concrete for prestressed beam design: 155 pcf ‐ Structural steel: 490 pcf
F.1.4 Soil Parameters
Soil strength parameters are outlined in Appendix D. Figure F‐1 shows the basic stratigraphy for the
site. Table F‐1 shows a summary of parameters.
Figure F‐1. Soil Stratigraphy
Page 10
Fargo Moorhead Metropolitan Area BCOES‐ATR/Sponsor/PDT Review Flood Risk Management Project Diversion Inlet Structure
Appendix F:
DDR_FMM_Diversion_Inlet_Appendix_F_Structural.docx Page F‐4
Table F‐1 Soil Parameters for the Inlet Diversion Structure
Page 11
Fargo Moorhead Metropolitan Area BCOES‐ATR/Sponsor/PDT Review Flood Risk Management Project Diversion Inlet Structure
Appendix F:
DDR_FMM_Diversion_Inlet_Appendix_F_Structural.docx Page F‐5
F.1.5 General Design Loads
F.1.5.1 Water Loads
The Diversion Inlet Structure will be designed for 2 different water elevations.
Headwater 926.00 and tailwater 917.00. This condition will be referred to as the Probable Maximum
Flood (PMF) and this will be treated as an extreme load case. When this flood occurs the tainter gates
will be completely out of the water. During a Probable Maximum Flood if one gate were unable to open
with a headwater of 926.00 the tailwater could be as low as 910.00. This is considered a very unlikely
case and would be very conservative. That is why load cases 9 and 10 and 21 and 22 for foundation slab
#2 have different tailwater elevations for the probable maximum flood condition.
Headwater elevation of 922.00 and no tailwater. This condition will be referred to as the Maximum
Head Condition and this will be treated as an unusual load case. This will occur when the tainter gates
for the diversion inlet structure are closed and water is being stored in the staging area. This load
condition has an annual chance of exceedance of 1%.
F.1.5.2 Uplift
Two possible scenarios of hydrostatic uplift pressure on the Diversion Inlet Structure foundation will be
designed for.
Condition #1 is a steady state seepage uplift pressure on the foundation. This condition would
result in the maximum hydrostatic uplift pressures that could exist. The uplift pressures were
computed by Geotechnical section as described in Appendix D. The uplift pressure for the
Maximum Head Condition is shown as elevation head in Figure F‐2 and as pressure head on the
bottom of the foundation slabs in Figure F‐3. The uplift pressure for the Probable Maximum Flood
Condition is shown as elevation head in Figure F‐4, and as pressure head on the bottom of the
foundation slabs in Figure F‐5.
Condition #2 assumes that only the normal pre‐flood groundwater uplift pressure will act on the
foundation. With the excavation of the diversion channel it is assumed that the groundwater
level will be lowered to the diversion channel invert both upstream and downstream of the
diversion inlet structure. The groundwater is assumed to be at elevation 899.7 upstream of the
sheet pile cutoff wall that crossed under the tainter gates sills, and elevation 888.5 downstream
of that sheet pile cutoff wall. This assumption will result in the largest net downward force and
largest loads for the piles in compression. Given the relatively impermeable foundation clays,
the sheet pile ringing the structure, the rebound forces in the foundation that will press upward
on the foundations and prevent contact seepage, and that no drainage system will be provided,
something like this condition is possible. For the maximum head case the forces on the bottom
of the foundation were used from Figures F‐2 and F‐3. This applied to foundation slabs #2, #3
and #4.
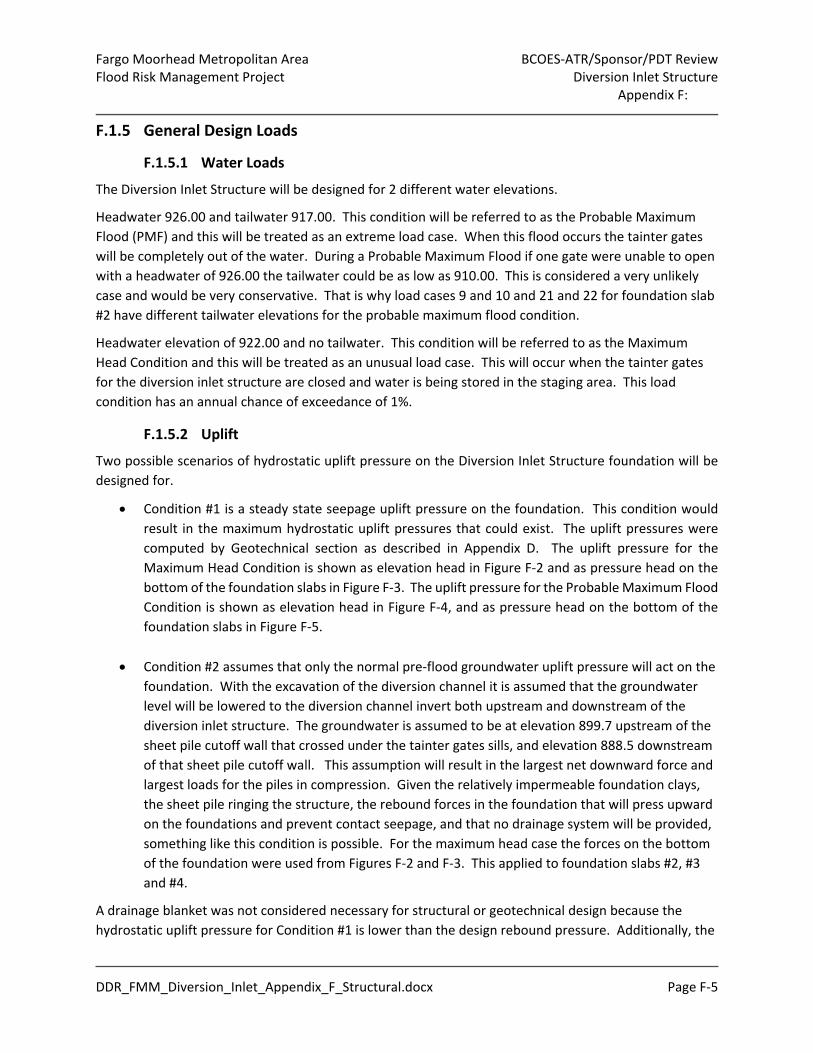
A drainage blanket was not considered necessary for structural or geotechnical design because the
hydrostatic uplift pressure for Condition #1 is lower than the design rebound pressure. Additionally, the
Page 12
Fargo Moorhead Metropolitan Area BCOES‐ATR/Sponsor/PDT Review Flood Risk Management Project Diversion Inlet Structure
Appendix F:
DDR_FMM_Diversion_Inlet_Appendix_F_Structural.docx Page F‐6
drainage blanket could be susceptible to clogging and lost efficiency over time requiring continued
monitoring and maintenance.
Figure F‐2 Steady State Seepage Elevation Head Underneath the Control Structure for Condition with
Pool at 922 and no Tailwater.
Page 13
Fargo Moorhead Metropolitan Area BCOES‐ATR/Sponsor/PDT Review Flood Risk Management Project Diversion Inlet Structure
Appendix F:
DDR_FMM_Diversion_Inlet_Appendix_F_Structural.docx Page F‐7
Figure F‐3 Steady State Seepage Pressures Underneath the Control Structure for Condition with Pool at
922 and no Tailwater
Figure F‐4 Steady State Seepage Elevation Head Underneath the Control Structure for PMF Condition.
Figure F‐5 Steady State Seepage Pressures Underneath the Control Structure for PMF Condition.
Page 14
Fargo Moorhead Metropolitan Area BCOES‐ATR/Sponsor/PDT Review Flood Risk Management Project Diversion Inlet Structure
Appendix F:
DDR_FMM_Diversion_Inlet_Appendix_F_Structural.docx Page F‐8
F.1.5.3 Ice loads
Ice loads will be applied to the structure since the spring flooding season in the Red River Valley is
typically from late March to mid‐April and the weather can vary drastically during the flood season. The
staging area water surface could develop an ice surface and those loads will be applied to the tainter
gate and on the pier depending on the load case.
The ice loads on the tainter gates are detailed in EM 1110‐2‐2702 section 3‐4 (1) (d) and in Appendix F –
Hydraulic Structures Design Guidelines. The ice load is specified as a uniform distributed load of 5.0 kips
per foot that acts in the downstream direction and is applied along the width of the gate at the upper
pool (headwater) elevation of 922.0. In the Probable Maximum Flood (PMF) load case it has been
assumed that the water and ice lateral loads do not act on the tainter gate as the tainter gate would be
completely out of the water. Therefore only the pier would be subjected to these water and ice lateral
loads.
The ice loads on the pier and abutments are detailed in EM 1110‐2‐1612 section 6‐6 on page 6‐20. The
thickness of the ice was assumed to be 1.0 feet thick due to the diversion inlet structure being 3 miles
from the Wild Rice River and 6 miles from the Red River. Therefore any ice that would be near the
diversion inlet structure would be ice that may have formed on the water in the staging area during cold
weather. Any ice impact on the diversion inlet structure should have minimal thickness due to the
distance to the nearest body of water and the ice that may accumulate on the pool would be over a
short period of time. The ice crushing pressure for the diversion inlet structure was assumed to be
101.5 psi due to the proximity to the nearest body of water and the short time the ice would have to
form. The ice force on the piers was calculated to be 97.93 kips and 79.80 kips on the abutments, is in
the foundation slab #2 calculations.
F.1.5.4 Debris loads
Debris loading is possible but there will not be a channel with deadfall and high velocities upstream of
the structure. It is 3 miles from the Wild Rice River and 5 miles from the Red River. Therefore, only
aberrant windblown debris is expected at the inlet. The ice loads used for design will be much higher
than expected debris loads and debris therefore was not analyzed as a separate load case.
F.1.5.5 Wave loads
The wave loads were calculated by the Hydraulics and Hydrology group and are shown in the
calculations. See attachment C‐2 of the Hydraulics DDR for the wave analysis. The waves were added to
the low chance of occurrence flood loads and so are from wind events with 50% chance of exceedance
given the event occurs. The wave loads were applied to the dam walls for the design of the bridge piers,
stem, foundation and piling. The wave loads were also applied to the tainter gates, piers and abutments
for the design of foundation slab #2. The wave loads were combined with the probable maximum flood
as well as the maximum head conditions.
Page 15
Fargo Moorhead Metropolitan Area BCOES‐ATR/Sponsor/PDT Review Flood Risk Management Project Diversion Inlet Structure
Appendix F:
DDR_FMM_Diversion_Inlet_Appendix_F_Structural.docx Page F‐9
Wave uplift on the bottom of the vehicle service bridge beam was investigated using the waves for the
Probable Maximum Flood condition but the overall uplift force (approximately 10.86 kips) was
significantly less than the weight of the bridge beams, deck and barriers (at least 244 kips).
F.1.5.6 Wind loads
A wind load of 40 pounds per square foot was applied to the stilling basin walls, abutment walls and
piers. A wind pressure of 40 psf is a conservative wind assumption based on engineering judgment and
does not control the design. For the tainter gate, a design wind load of 50 psf was used for design. This
is a conservative wind load that is above all expected wind loads but does not control the design. Wind
loads on the control building were determined according to the International Building Code.
F.1.5.7 Surcharge/Construction Loads
A live load of 250 pounds per square foot was used for a surcharge load to cover equipment loads and
minor material stacking during the construction of the diversion inlet structure. Large crane loads will
not be allowed next to the structure. This load was used in load cases #1 and #13.
F.1.5.8 Seismic Design Considerations
The Diversion Inlet Structure is located at Latitude 46.718, Longitude ‐96.904 in the north‐central United
States in the Great Lakes tectonic zone. The historic seismic activity is very limited for this location. The
Figure F‐6 shows that for an earthquake with a two percent probability of exceedance in 50 years, this
region including the diversion inlet structure site is still within the lowest earthquake hazard zone (0‐4%
g).
Figure F‐6: USGS Conterminous U.S. PGA 2% in 50 years (USGS 2014)
A seismic hazard curve was generated using the USGS Seismic Hazard Curve Application, which is based
on 2014 mapping data. The seismic hazard curve for the full‐range of peak horizontal ground
Diversion Inlet
Structure
3g
1g
.5g
.15g
.1g
.05g
<0.4g
Page 16
Fargo Moorhead Metropolitan Area BCOES‐ATR/Sponsor/PDT Review Flood Risk Management Project Diversion Inlet Structure
Appendix F:
DDR_FMM_Diversion_Inlet_Appendix_F_Structural.docx Page F‐10
acceleration (PGA) is shown in Figure F‐7.
Figure F‐7: Seismic Hazard Curve for PGA (USGS 2014)
Based on the USGS’s 2014 data, the PGA for an earthquake that has a 50 percent probability of being
exceeded in 100 years is less than 0.005g, and the PGA for an earthquake with an annual exceedance
probability (AEP) of 1/10,000 is 0.064g. This provides a basis for the general loading level. For sites in the
vicinity of the dam, the estimated seismic hazard is considered quite low. For perspective, a PGA of
about 0.2g is generally required to knock objects off of shelves, and 0.1g is sometimes used as an
approximate lower limit for damage to unreinforced masonry such as brick chimneys (FEMA 2000). Such
estimates are approximate, and local site conditions will affect any estimated damage distribution.
Therefore, seismic design consideration is not required for the Diversion Inlet Structure structural
design.
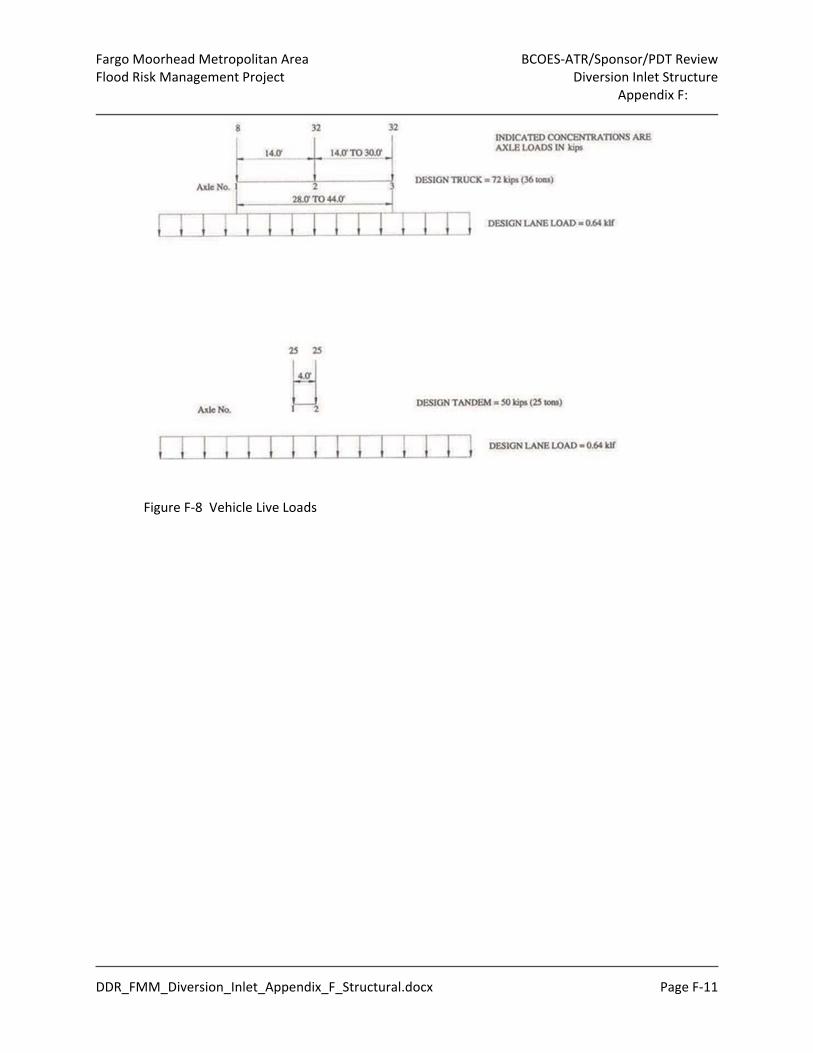
F.1.5.9 Vehicle Live Loads
The diversion inlet structure vehicle service bridge is designed for a HL‐93 designation as per the North
Dakota Department of Transportation. A HL‐93 designation shall consist of a “design truck” or a “design
tandem” and a “design lane load” as outlined in AASHTO section 3.6.1.2. The vehicle service bridge was
not designed for a crane load. If a crane is ever needed for the structure it could be driven down the
embankment and parked on the foundation. Vehicle loads are shown in Figure F‐8.
Page 17
Fargo Moorhead Metropolitan Area BCOES‐ATR/Sponsor/PDT Review Flood Risk Management Project Diversion Inlet Structure
Appendix F:
DDR_FMM_Diversion_Inlet_Appendix_F_Structural.docx Page F‐11
Figure F‐8 Vehicle Live Loads
Page 18
Fargo Moorhead Metropolitan Area BCOES‐ATR/Sponsor/PDT Review Flood Risk Management Project Diversion Inlet Structure
Appendix F:
DDR_FMM_Diversion_Inlet_Appendix_F_Structural.docx Page F‐12
F.2 CONTROL STRUCTURE
F.2.1 General Requirements
The general requirements and design of the structure were performed by Hydraulics. See Appendix B.
Required dimensions for the control structure (all elevations are NAVD88 datum) are shown below:
Three tainter gates, each 50 feet wide and 26 feet high
Gate sill elevation of 899.7 feet (0.5’ above the approach channel invert elevation at the
structure)
Concrete apron (elevation 899.7’) extending upstream from the pier noses
In their completely raised state the highest elevation required for the bottom of the gates is 926.0 feet (i.e. tainter gates will need to clear the maximum pool elevation)
Channel/Stilling Basin Invert elevation downstream of gated structure is 888.5 feet
Top of damming surface is 931 feet
F.2.2 Alternatives Considered
This section will talk about different alternates that were discussed during the design phase, the advantages and disadvantage to each alternate and ultimately what alternate was chosen.
F.2.2.1 Dam Walls versus Soil Embankment Alternatives
The diversion inlet structure will have an upstream top of foundation elevation of 899.7 and a top of
roadway elevation of 931.0, whereas the top of the soil embankments would have a top of 931.0. Two
alternatives considered for transitioning the tieback embankment and overflow embankment into the
diversion inlet structure. One alternative would be to extend the tieback embankment and the overflow
embankment to the diversion inlet structure. The second alternative is to construct a dam wall from the
tieback embankment and the overflow embankment to the diversion inlet structure.
Soil Embankments
The soil embankments alternative would require extending the tieback embankment and the overflow
embankment to the abutment walls of the diversion inlet structure. In this scenario, the abutment walls
(parallel to the diversion channel) would retain approximately 32 feet of soil. This alternative could
potentially cost less and require less maintenance in the future. The disadvantages of this are the global
stability issues (commonly referred to as unbalanced loads) that arise from removing soil for the
diversion inlet structure (from existing soil elevation 915.0 to 888.5) and adding soil embankments
(existing soil elevation 915.0 to 931.0). The removal of soil on one side (down to the diversion inlet
structure foundation) and the addition of soil on the backside of the wall this could potentially cause
global stability issues. This unbalanced load can be addressed with a standard retaining wall type
structure using USACE design guidance already developed. The diversion inlet structure would provide
lateral movement resistance to the foundation sliding, but the soil wedge would induce an uplift force
on the bottom side of the diversion inlet structure foundation. In order to calculate the exact uplift
force on the bottom of the foundation, the Geotechnical group would need to create a detailed FLAC
model of this situation.
Page 19
Fargo Moorhead Metropolitan Area BCOES‐ATR/Sponsor/PDT Review Flood Risk Management Project Diversion Inlet Structure
Appendix F:
DDR_FMM_Diversion_Inlet_Appendix_F_Structural.docx Page F‐13
Dam Walls
For the dam wall alternative, the diversion inlet structure would be constructed in the excavated
channel and dam walls would connect the diversion inlet structure to the tieback embankment and the
overflow embankment. See the plans for more information on the dam wall alternative. The dam wall
alternative would decrease the retained soil height needed for the control structure from approximately
32 feet to approximately 12 feet. This alternative will likely increase maintenance amounts by a small
amount, but the design is straightforward and does not require detailed FLAC modeling to address
unbalanced load concerns.
Conclusion
The initial thought was that the embankment alternative would cost less from both an initial cost and a
life cycle cost standpoint; however after further investigation into the alternatives the retaining walls
associated with the embankment alternate would be quite extensive. The embankment alternative
would result in twin retaining walls that are approximately 40 feet tall and approximately 550 feet long.
In addition, the wall and structure foundation requirements (piles and foundations) for the embankment
alternative would be much more substantial than the foundation requirements for the dam wall
alternative. There are also the preliminary unknowns of the retaining wall global stability forces creating
uplift on the control structure foundation. From a ball park cost standpoint, the two alternatives end up
being similar. The decision to pursue the dam wall design has been made for the following reasons: 1.
The two alternatives are expected to be similar in cost; 2. The modeling required to determine what the
loads on the retaining walls and structure would be for the embankment alternative would take
additional time and would extend the design schedule; 3. There are more unknowns with the
embankment alternative resulting in higher cost and schedule risk. As a result, the cost of the
embankment alternative could end up being more than currently envisioned. With regard to the
reference to the Presidential budget, there is still a possibility of receiving construction funding through
other mechanisms, so it is in everyone’s best interest to remain on the current schedule so that the
project is in position to put construction funding to work if it becomes available.
F.2.2.2 Combined or Separated Mechanical Platform and Vehicle service Bridge
Two alternatives were evaluated on how to best facilitate the mechanical bridge platform and the
vehicle service bridge. One alternative would be to combine the mechanical platform and the vehicle
service bridge into one combined structure and the second alternative would be to separate the two
into individual structures. The advantages and disadvantages of each alternative are discussed below
along with the conclusion.
Separate Mechanical Platform and Vehicle Service Bridge
This alternate would separate the vehicle service bridge and the mechanical platform into two separate
structures; see Figure F‐9. One advantage of this alternative would be the decreased length of the pier
and overall length of the foundation. Another advantage would be that this arrangement would reduce
the horizontal force on the mechanical equipment. The disadvantage of this alternative would be the
overall height of the mechanical platform above the top of the structure and the need for stairs and
ladders to access the mechanical platform.
Page 20
Fargo Moorhead Metropolitan Area BCOES‐ATR/Sponsor/PDT Review Flood Risk Management Project Diversion Inlet Structure
Appendix F:
DDR_FMM_Diversion_Inlet_Appendix_F_Structural.docx Page F‐14
Figure F‐9 Concept with Separate Vehicle Bridge and Machinery Platform
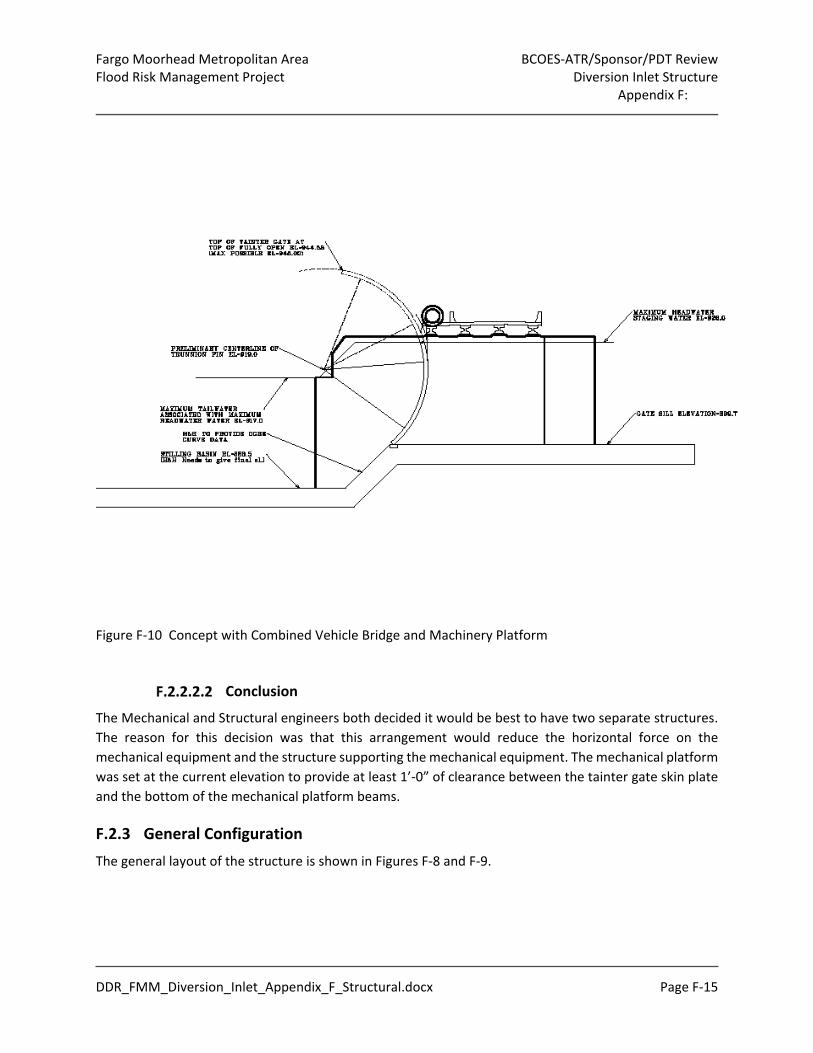
This alternate would combine the mechanical platform and the vehicle service bridge into one combined
structure, as shown in Figure F‐10. The mechanical platform would be located on the bridge deck
outside of the vehicle barrier for the mechanical equipment and any maintenance and inspection work
that needs to be done. The advantages of this system would be that the overall height of the piers
would be reduced. The disadvantages of combining the mechanical platform and the vehicle service
bridge would be the increase in overall length of the piers and thus the length of the foundation.
Another disadvantage of the combined vehicle service bridge and the mechanical platform would be
that the angle between the mechanical equipment hoist and the tainter gate would increase the
horizontal force on the mechanical equipment.
Page 21
Fargo Moorhead Metropolitan Area BCOES‐ATR/Sponsor/PDT Review Flood Risk Management Project Diversion Inlet Structure
Appendix F:
DDR_FMM_Diversion_Inlet_Appendix_F_Structural.docx Page F‐15
Figure F‐10 Concept with Combined Vehicle Bridge and Machinery Platform
Conclusion
The Mechanical and Structural engineers both decided it would be best to have two separate structures.
The reason for this decision was that this arrangement would reduce the horizontal force on the
mechanical equipment and the structure supporting the mechanical equipment. The mechanical platform
was set at the current elevation to provide at least 1’‐0” of clearance between the tainter gate skin plate
and the bottom of the mechanical platform beams.
F.2.3 General Configuration
The general layout of the structure is shown in Figures F‐8 and F‐9.
Page 22
Fargo Moorhead Metropolitan Area BCOES‐ATR/Sponsor/PDT Review Flood Risk Management Project Diversion Inlet Structure
Appendix F:
DDR_FMM_Diversion_Inlet_Appendix_F_Structural.docx Page F‐16
Figure F‐11. Control Structure Isometric with Dam Walls.
Page 23
Fargo Moorhead Metropolitan Area BCOES‐ATR/Sponsor/PDT Review Flood Risk Management Project Diversion Inlet Structure
Appendix F:
DDR_FMM_Diversion_Inlet_Appendix_F_Structural.docx Page F‐17
Figure F‐12 Control Structure Isometric
The diversion inlet structure will have (3) 50 foot wide bays with (2) 10 foot thick piers along with (2) 6
foot thick abutment walls (parallel to the diversion channel) on the outside of the diversion inlet
structure. The piers and abutments will support the tainter gates, the trunnion girder, the vehicle
service bridge and the mechanical platform.
There will be a walkway connecting the dam wall bridge deck surface via a blockout in the concrete
barrier to the downstream side of each abutment. The walkway will be supported on the landside of
each abutment. There will also be a stairway connecting the downstream side of the abutment to the
top of the mechanical platform and an alternating tread stairway will allow access to the trunnion.
Access to the mechanical platform will be from each of the abutments with no intermediate access at
the piers.
There will be a tunnel through the pier connecting the vehicle service bridge deck surface via an opening
in the concrete barrier to the downstream side of each pier. An alternating tread stair will allow access
to the trunnion girder.
The pier thickness was determined by researching tainter gate width to height ratios in numerous structures as shown in Table F‐2.
Page 24
Fargo Moorhead Metropolitan Area BCOES‐ATR/Sponsor/PDT Review Flood Risk Management Project Diversion Inlet Structure
Appendix F:
DDR_FMM_Diversion_Inlet_Appendix_F_Structural.docx Page F‐18
Table F‐2 Existing Tainter Gate Control Structure Dimension
With input from the Hydraulics and Hydrology engineers the upstream nosing will be rounded to a point
on the upstream side and be a square shape on the downstream side, see the plans for more detailed
information on the pier shape. The upstream pier nosing shape was obtained from the Corps Hydraulic
Design Criteria, Sheet 111‐5. The Hydraulic Design Criteria was referenced in EM 1110‐2‐1605
(Hydraulic Design of Navigation Dams) section 5‐16.c. Also with input from the dam designers at the
Risk Management Center and at ERDC the type 3 pier shape was chosen for this structure based on their
experience with dams. With the pier thickness being 10 feet, mass concrete specifications will be used
in an effort to reduce temperature and shrinkage cracks and numerous horizontal construction joints
will be incorporated into the plans. The piers will have a tunnel that will be transverse to the diversion
channel alignment that will allow access to the dead end of the trunnion girder anchorage. Access to
this gallery will allow removal of the anchorages should they lose section due to corrosion or for routine
inspection. This gallery will be accessed from the side of the piers on top of the foundation slab.
F.2.4 Design Criteria
F.2.4.1 Load Cases
Load cases in Tables F‐3 – F‐6 were used for the design of the abutments, stilling basin walls and
foundation slabs.
Page 25
Fargo Moorhead Metropolitan Area BCOES‐ATR/Sponsor/PDT Review Flood Risk Management Project Diversion Inlet Structure
Appendix F:
DDR_FMM_Diversion_Inlet_Appendix_F_Structural.docx Page F‐19
Table F‐3 Load Case for Foundation Slab #1
Diversion Inlet Structure Load Case Foundation Slab #1
Load Cases below use Full uplift Water Elevations
Load TypeHeadwater Tailwater
1. Construction (Foundation only with compaction surcharge loading) + soil rebound
899.7 888.5 Unusual
2. Normal - In the dry + soil rebound 899.7 888.5 Usual 9. Probable Maximum Flood 926.0 917.0 Extreme
11. Maximum Head Condition (Annual chance of exceedance = 1%)
922.0 888.5 Unusual
Load Cases below use Groundwater uplift Water Elevations
Load TypeHeadwater Tailwater
13. Construction (Foundation only with compaction surcharge loading) + soil rebound
899.7 888.5 Unusual
14. Normal - In the dry + soil rebound 899.7 888.5 Usual 21. Probable Maximum Flood 926.0 917.0 Extreme
23. Maximum Head Condition (Annual chance of exceedance = 1%)
922.0 888.5 Unusual
Table F‐4 Load Case for Foundation Slab #2
Diversion Inlet Structure Load Case Foundation Slab #2
Load Cases below use Full uplift Water Elevations Load
Type Headwater Tailwater 1. Construction of structure including compaction surcharge loading + Wind Load + (No Rebound) + (No Hydrostatic Uplift)
899.7 888.5 Unusual
2. Normal - In the dry + Bridge Live Load + Wind load + Soil Rebound + (No Hydrostatic Uplift) 899.7 888.5 Usual
3. Normal - In the dry + Bridge Live Load + Wind load (No Rebound) + (Hydrostatic Uplift) 899.7 888.5 Usual
9. Probable Maximum Flood + Ice Load + Bridge Live Load + (No Rebound) 926.0 910.0 Extreme
10. Probable Maximum Flood + Wave Load + Bridge Live Load + (No Rebound) 926.0 910.0 Extreme
11. Maximum Head Condition + Ice Load + (No Rebound) (Annual chance of exceedance = 1%)
922.0 888.5 Unusual
12. Maximum Head Condition + Wave Load + (No Rebound) (Annual chance of exceedance = 1%)
922.0 888.5 Unusual
Load Cases below use Groundwater uplift Water Elevations Load
Type Headwater Tailwater 13. Construction of structure including compaction surcharge loading + Wind Load + (No Rebound) + (No Hydrostatic Uplift)
899.7 888.5 Unusual
899.7 888.5 Usual
Page 26
Fargo Moorhead Metropolitan Area BCOES‐ATR/Sponsor/PDT Review Flood Risk Management Project Diversion Inlet Structure
Appendix F:
DDR_FMM_Diversion_Inlet_Appendix_F_Structural.docx Page F‐20
14. Normal - In the dry + Bridge Live Load + Wind load + Soil Rebound + (No Hydrostatic Uplift) 15. Normal - In the dry + Bridge Live Load + Wind load (No Rebound) + (Hydrostatic Uplift)
899.7 888.5 Usual
21. Probable Maximum Flood + Ice Load + Bridge Live Load + (No Rebound) 926.0 917.0 Extreme
22. Probable Maximum Flood + Wave Load + Bridge Live Load + (No Rebound) 926.0 917.0 Extreme
23. Maximum Head Condition + Ice Load + (No Rebound) (Annual chance of exceedance = 1%)
922.0 888.5 Unusual
24. Maximum Head Condition + Wave Load + (No Rebound) (Annual chance of exceedance = 1%)
922.0 888.5 Unusual
All load cases include Bridge Dead Loads
Table F‐5 Load Case for Foundation Slab #3
Diversion Inlet Structure Load Case Foundation Slab #3
Load Cases below use Full uplift Water Elevations Load
Type Headwater Tailwater
1. Construction (Foundation & Wall only with compaction surcharge loading) + soil rebound
899.7 888.5 Unusual
2. Normal - In the dry + soil rebound + wind load 899.7 888.5 Usual 9. Probable Maximum Flood 926.0 917.0 Extreme
11. Maximum Head Condition (Annual chance of exceedance = 1%) 922.0 888.5 Unusual
Load Cases below use Groundwater uplift Water Elevations Load
Type Headwater Tailwater
13. Construction (Foundation & Wall only with compaction surcharge loading) + soil rebound
899.7 888.5 Unusual
14. Normal - In the dry + soil rebound + wind load 899.7 888.5 Usual 21. Probable Maximum Flood 926.0 917.0 Extreme
23. Maximum Head Condition (Annual chance of exceedance = 1%) 922.0 888.5 Unusual
Page 27
Fargo Moorhead Metropolitan Area BCOES‐ATR/Sponsor/PDT Review Flood Risk Management Project Diversion Inlet Structure
Appendix F:
DDR_FMM_Diversion_Inlet_Appendix_F_Structural.docx Page F‐21
Table F‐6 Load Case for Foundation Slab #4
Diversion Inlet Structure Load Case Foundation Slab #4
Load Cases below use Full uplift Water Elevations
Load Type Headwater Tailwater
1. Construction (Foundation & Wall only with compaction surcharge loading) + soil rebound
899.7 888.5 Unusual
2. Normal - In the dry + soil rebound + wind load 899.7 888.5 Usual 9. Probable Maximum Flood 926.0 917.0 Extreme
11. Maximum Head Condition (Annual chance of exceedance = 1%) 922.0 888.5 Unusual
Load Cases below use Groundwater uplift Water Elevations
Load Type Headwater Tailwater
13. Construction (Foundation & Wall only with compaction surcharge loading) + soil rebound
899.7 888.5 Unusual
14. Normal - In the dry + soil rebound + wind load 899.7 888.5 Usual 21. Probable Maximum Flood 926.0 917.0 Extreme
23. Maximum Head Condition (Annual chance of exceedance = 1%) 922.0 888.5 Unusual
F.2.4.2 Concrete Design
Load factors used in the concrete design of the control structure are shown in Table F‐7. These load factors are from the "Fargo‐Moorhead Flood Risk Management Project Design Guidelines" Appendix F Section F.4 Table F‐2 on page F‐6.
Concrete cover for the abutments, piers, stilling basin walls and foundation shall have 4 inches of clear cover from the reinforcement to the surface. EM 1110‐2‐2104 states that the concrete clear cover should be 6 inches however since the structure will be very rarely used the structure is more susceptible to freeze thaw degradation than flowing water erosion. The clear cover of 4 inches will provide better crack control for freeze thaw degradation than a clear cover of 6 inches.
The vertical surfaces of the abutments, piers and stilling basin walls shall receive a Class A‐HV formed finish and the tops of the foundation slabs shall receive a troweled finish. These surfaces will then meet the requirements of being an abrasion resistant surface.
All concrete will have a 1‐1/2” chamfer as shown in the plans with the following exceptions;
The baffle blocks, end sill and floor ramps which will receive a 3/4” chamfer to reduce to possibility of cavitation.
The corners of the stepped spillway shall receive a 1/2” radius tooled edge.
Page 28
Fargo Moorhead Metropolitan Area BCOES‐ATR/Sponsor/PDT Review Flood Risk Management Project Diversion Inlet Structure
Appendix F:
DDR_FMM_Diversion_Inlet_Appendix_F_Structural.docx Page F‐22
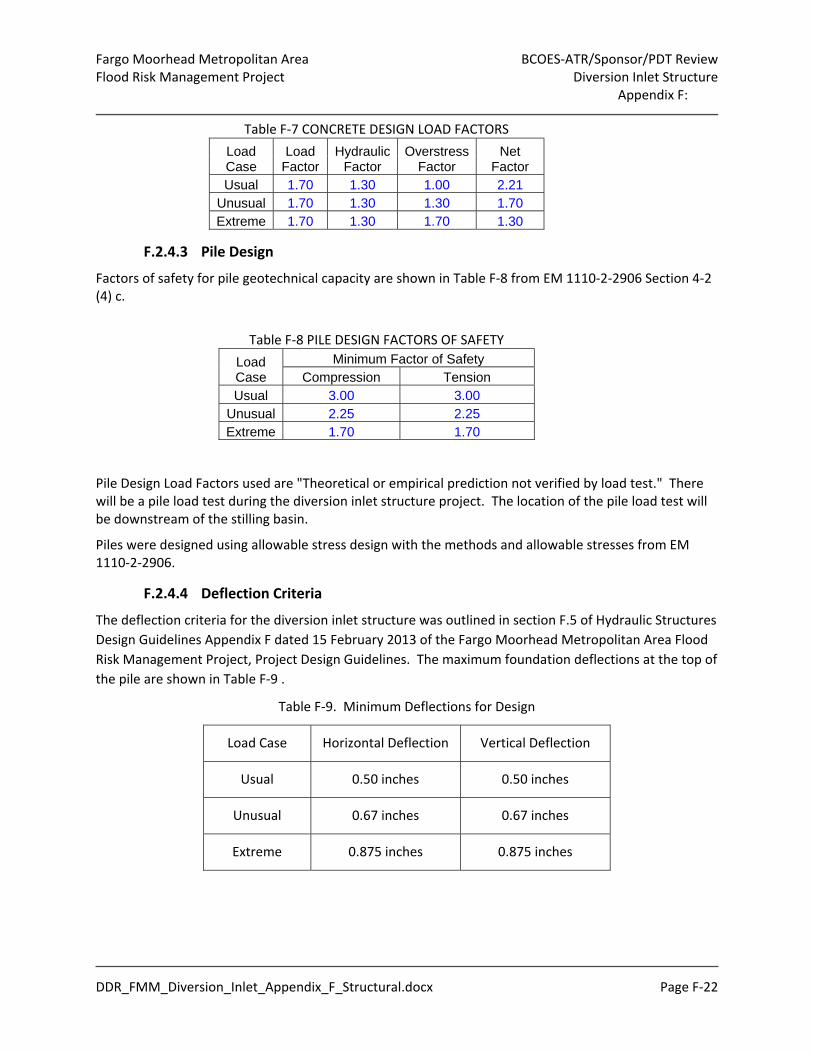
Table F‐7 CONCRETE DESIGN LOAD FACTORS
Load Case
Load Factor
Hydraulic Factor
Overstress Factor
Net Factor
Usual 1.70 1.30 1.00 2.21 Unusual 1.70 1.30 1.30 1.70 Extreme 1.70 1.30 1.70 1.30
F.2.4.3 Pile Design
Factors of safety for pile geotechnical capacity are shown in Table F‐8 from EM 1110‐2‐2906 Section 4‐2 (4) c.
Table F‐8 PILE DESIGN FACTORS OF SAFETY
Load Case
Minimum Factor of Safety Compression Tension
Usual 3.00 3.00 Unusual 2.25 2.25 Extreme 1.70 1.70
Pile Design Load Factors used are "Theoretical or empirical prediction not verified by load test." There will be a pile load test during the diversion inlet structure project. The location of the pile load test will be downstream of the stilling basin.
Piles were designed using allowable stress design with the methods and allowable stresses from EM 1110‐2‐2906.
F.2.4.4 Deflection Criteria
The deflection criteria for the diversion inlet structure was outlined in section F.5 of Hydraulic Structures
Design Guidelines Appendix F dated 15 February 2013 of the Fargo Moorhead Metropolitan Area Flood
Risk Management Project, Project Design Guidelines. The maximum foundation deflections at the top of
the pile are shown in Table F‐9 .
Table F‐9. Minimum Deflections for Design
Load Case Horizontal Deflection Vertical Deflection
Usual 0.50 inches 0.50 inches
Unusual 0.67 inches 0.67 inches
Extreme 0.875 inches 0.875 inches
Page 29
Fargo Moorhead Metropolitan Area BCOES‐ATR/Sponsor/PDT Review Flood Risk Management Project Diversion Inlet Structure
Appendix F:
DDR_FMM_Diversion_Inlet_Appendix_F_Structural.docx Page F‐23
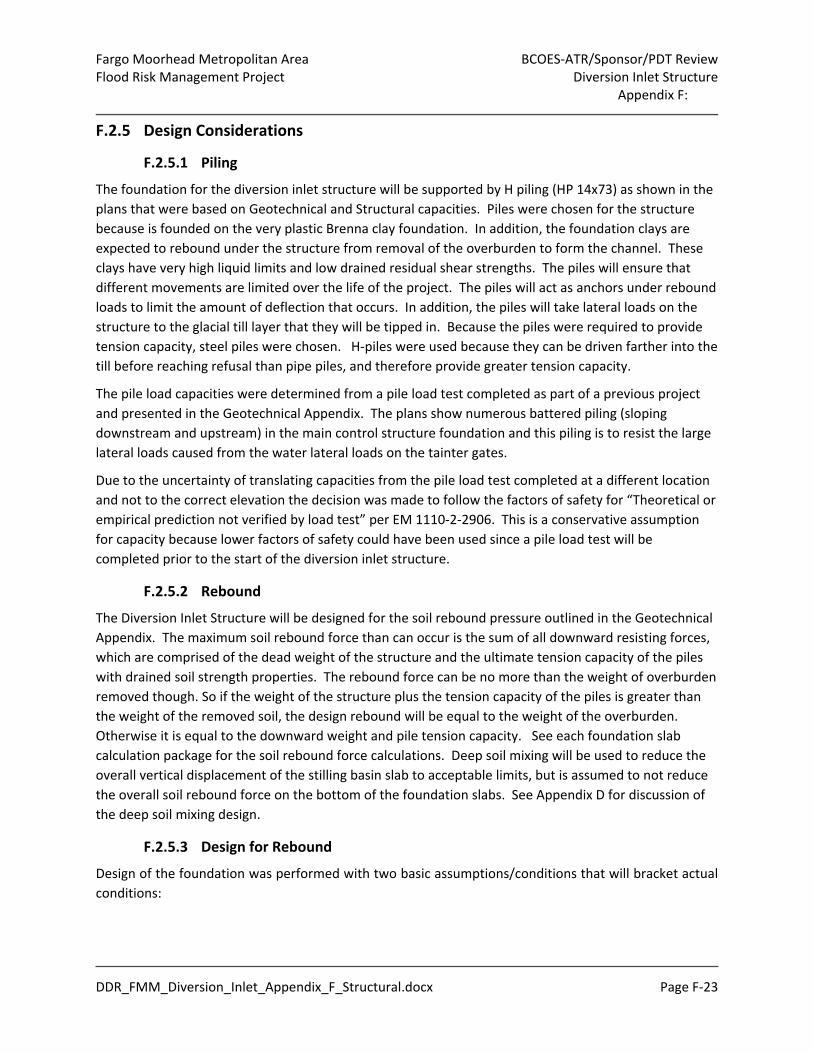
F.2.5 Design Considerations
F.2.5.1 Piling
The foundation for the diversion inlet structure will be supported by H piling (HP 14x73) as shown in the
plans that were based on Geotechnical and Structural capacities. Piles were chosen for the structure
because is founded on the very plastic Brenna clay foundation. In addition, the foundation clays are
expected to rebound under the structure from removal of the overburden to form the channel. These
clays have very high liquid limits and low drained residual shear strengths. The piles will ensure that
different movements are limited over the life of the project. The piles will act as anchors under rebound
loads to limit the amount of deflection that occurs. In addition, the piles will take lateral loads on the
structure to the glacial till layer that they will be tipped in. Because the piles were required to provide
tension capacity, steel piles were chosen. H‐piles were used because they can be driven farther into the
till before reaching refusal than pipe piles, and therefore provide greater tension capacity.
The pile load capacities were determined from a pile load test completed as part of a previous project
and presented in the Geotechnical Appendix. The plans show numerous battered piling (sloping
downstream and upstream) in the main control structure foundation and this piling is to resist the large
lateral loads caused from the water lateral loads on the tainter gates.
Due to the uncertainty of translating capacities from the pile load test completed at a different location
and not to the correct elevation the decision was made to follow the factors of safety for “Theoretical or
empirical prediction not verified by load test” per EM 1110‐2‐2906. This is a conservative assumption
for capacity because lower factors of safety could have been used since a pile load test will be
completed prior to the start of the diversion inlet structure.
F.2.5.2 Rebound
The Diversion Inlet Structure will be designed for the soil rebound pressure outlined in the Geotechnical
Appendix. The maximum soil rebound force than can occur is the sum of all downward resisting forces,
which are comprised of the dead weight of the structure and the ultimate tension capacity of the piles
with drained soil strength properties. The rebound force can be no more than the weight of overburden
removed though. So if the weight of the structure plus the tension capacity of the piles is greater than
the weight of the removed soil, the design rebound will be equal to the weight of the overburden.
Otherwise it is equal to the downward weight and pile tension capacity. See each foundation slab
calculation package for the soil rebound force calculations. Deep soil mixing will be used to reduce the
overall vertical displacement of the stilling basin slab to acceptable limits, but is assumed to not reduce
the overall soil rebound force on the bottom of the foundation slabs. See Appendix D for discussion of
the deep soil mixing design.
F.2.5.3 Design for Rebound
Design of the foundation was performed with two basic assumptions/conditions that will bracket actual
conditions:
Page 30
Fargo Moorhead Metropolitan Area BCOES‐ATR/Sponsor/PDT Review Flood Risk Management Project Diversion Inlet Structure
Appendix F:
DDR_FMM_Diversion_Inlet_Appendix_F_Structural.docx Page F‐24
The first is the case with no rebound having occurred. In this condition the structure is supported
only by the piles. Uplift may be present. This case will be the controlling case for compression
loading on the piles. All load case are evaluated for this condition. It is depicted in Figure F‐13.
Figure F‐13, Condition with no rebound
The second is the case with full rebound soil pressure applied to the base of the foundation slab.
The rebound of the soil is resisted by the dead weight of the structure and the tension capacity
of the piles with drained soil strength. If the rebound pressure exceeds the downward resisting
forces the structure will move upward. This is the controlling case for upward pressures on the
structure. This condition is evaluated for the normal, dead load, case only. This condition is
depicted in Figure F‐14
Figure F‐14, Condition with Rebound and Dead Loads
Uplift
Other Applied Loads
Piles in Compression
Structure Weight
Piles in Tension
Rebound
Structure Weight
Page 31
Fargo Moorhead Metropolitan Area BCOES‐ATR/Sponsor/PDT Review Flood Risk Management Project Diversion Inlet Structure
Appendix F:
DDR_FMM_Diversion_Inlet_Appendix_F_Structural.docx Page F‐25
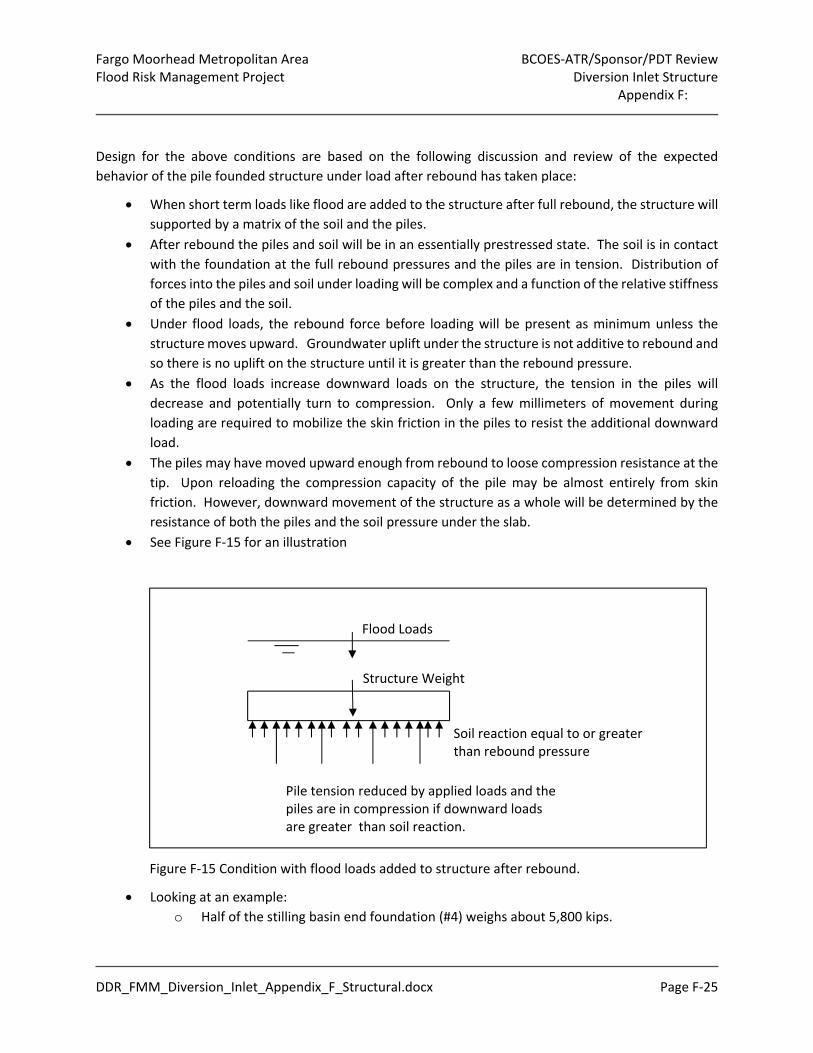
Design for the above conditions are based on the following discussion and review of the expected
behavior of the pile founded structure under load after rebound has taken place:
When short term loads like flood are added to the structure after full rebound, the structure will
supported by a matrix of the soil and the piles.
After rebound the piles and soil will be in an essentially prestressed state. The soil is in contact
with the foundation at the full rebound pressures and the piles are in tension. Distribution of
forces into the piles and soil under loading will be complex and a function of the relative stiffness
of the piles and the soil.
Under flood loads, the rebound force before loading will be present as minimum unless the
structure moves upward. Groundwater uplift under the structure is not additive to rebound and
so there is no uplift on the structure until it is greater than the rebound pressure.
As the flood loads increase downward loads on the structure, the tension in the piles will
decrease and potentially turn to compression. Only a few millimeters of movement during
loading are required to mobilize the skin friction in the piles to resist the additional downward
load.
The piles may have moved upward enough from rebound to loose compression resistance at the
tip. Upon reloading the compression capacity of the pile may be almost entirely from skin
friction. However, downward movement of the structure as a whole will be determined by the
resistance of both the piles and the soil pressure under the slab.
See Figure F‐15 for an illustration
Figure F‐15 Condition with flood loads added to structure after rebound.
Looking at an example:
o Half of the stilling basin end foundation (#4) weighs about 5,800 kips.
Structure Weight
Flood Loads
Pile tension reduced by applied loads and the piles are in compression if downward loads are greater than soil reaction.
Soil reaction equal to or greater than rebound pressure
Page 32
Fargo Moorhead Metropolitan Area BCOES‐ATR/Sponsor/PDT Review Flood Risk Management Project Diversion Inlet Structure
Appendix F:
DDR_FMM_Diversion_Inlet_Appendix_F_Structural.docx Page F‐26
o It has 84 piles with an ultimate drained tension capacity of 125 per pile for a total pile
tension capacity of 10,500 kips to resist rebound.
o The total rebound pressure possible is the sum of the structure weight and tension pile
capacity of 16,300 kips. Over the 74’x 92’ monolith this is 2.4 kips/ft2.
o The amount of rebound force created can be no more than the weight of the overburden
material removed, and will be somewhat less as some amount of rebound will occur
during construction.
o The maximum flood loading is the PMF where the tailwater is at elevation 917 ft. The
top of the foundation is 888 feet making the water depth 29 ft. The total downward
force from water is therefore 29 x 0.0624 lb/ft3 x 74’ x (92‐3.25)’ = 11,900 kips (with 3.25
feet being the wall width).
o Adding downward loads, the water plus the concrete is 17,700 kips.
o The bottom of the slab is at 883 making the maximum potential uplift (917 – 883) x
0.0624 = 2.12 lb/ft2. The rebound force is greater than the potential uplift and therefore
the soil is still in contact with the foundation.
o The total rebound force of 16,300 kips is less than the downward forces of 17,700 kips.
o If the soil reaction pressures did not increase above the rebound pressure as the flood
load was applied the piles would now be in compression to balance the loads. The load
per pile would be (17,700‐16,300)/84 piles = 17 kips/pile.
o The piles go only 17 kips into compression assuming that the soil pressure under the slab
does not increase above the rebound pressure. In reality the soil under the slab is likely
to increase reaction pressure as load is added and the slab deflects downward. This
example is therefore the upper bound for loads in the piles.
o The stilling basin has the most water weight on it. So the example should represent
close to an upper bound without analyzing all of the monoliths.
The conclusions of this review are that after rebound, the structure will act as mostly a soil
founded structure with the piles acting to reduce movements from rebound, to “prestress” the
soil foundation, and to provide resistance to lateral loads.
The maximum forces in the slab will be bracketed by the cases with no rebound and full water loads
(maximum downward loading) and with full rebound and no additional water loads on the slab
(maximum upward loading). Cases with rebound plus flood loading will result in net pressures across
the structure that are between than the bracketed design values. Therefore, the cases with full rebound
and flood loading were not used for design. These cases were not needed for strength and this
eliminated the need to attempt the model the complicated soil structure interaction problem.
F.2.5.4 Pile Tension Connectors
Connectors are provided at the top of the piles to ensure that loads on the slab can be transferred to the
piles that are in tension. The maximum ultimate load in tension under rebound provided by
geotechnical section was 125 kips. This load was used for design using LRFD with a load factor of 2.0.
The load factor was chose to account for the uncertainty in the geotechnical capacity to ensure that the
piles fails through shear friction in the soil and by pulling out of the concrete. The tension connection
will be provide using weldable (ASTM A706) reinforcing steel.
Page 33
Fargo Moorhead Metropolitan Area BCOES‐ATR/Sponsor/PDT Review Flood Risk Management Project Diversion Inlet Structure
Appendix F:
DDR_FMM_Diversion_Inlet_Appendix_F_Structural.docx Page F‐27
F.2.6 Joints
The regions expansive soil conditions and rebound effects are likely to cause both vertical and horizontal
differential movements, within the Diversion Inlet Structure. Two different vertical movements are
predicted to occur and are summarized in the table below, whereas one (≤ 1”) horizontal movement is
projected. The joints were design in accordance with EM 1110‐2‐2104, Strength Design for Reinforced
Concrete Hydraulic Structures, and ACI 224.3R Joints in Concrete Construction.
The greater vertical movement of (≤ 1.5”) is likely to occur within the Control Structure. Therefore, a
tear web water‐stop was chosen to accommodate the larger vertical movements, see Figure F‐16 for
more information. The following joints within the control structure were designed as 1” expansion
joints, Control Structure / Approach Apron, Control Structure / Stilling basin, and Control Structure /
Section 1 Dam Wall.
The lesser vertical movement will likely occur within the remaining Dam Wall Sections. Therefore, a
ribbed centerbulb water‐stop with an inside diameter of 7/8” was chosen to accommodate the less
extensive vertical movement, see Figure F‐17 for more information. The anticipated vertical movement
within the remaining Dam Wall Sections is on the order of 1” and will be progressively less as you go up
the 1V on 7H side slopes.
Table F‐10 shows the anticipated differential movement for the Diversion Inlet Control and Dam Wall
Structures, the Type of Joint, and the recommended water‐stop. The anticipated differential movement
is shown in Appendix D Attachment 7.
Table F‐10. Expected Structural Movements
Structure Joint
Anticipated Differential Movement
(inches) Type of Joint Waterstop
Vertical Horizontal
Foundation#1 to Foundation #2
≤ 1.5 ≤ 1.0 Expansion Joint Tear Web
Foundation #2 to Foundation #3
≤ 1.0 ≤ 1.0 Expansion Joint Tear Web
Foundation #3 to Foundation #4
≤ 1.0 ≤ 1.0 Expansion Joint Tear Web
Foundation #2 to Dam Wall Monolith
L1/R1 ≤ 1.5 ≤ 1.0 Expansion Joint Tear Web
Page 34
Fargo Moorhead Metropolitan Area BCOES‐ATR/Sponsor/PDT Review Flood Risk Management Project Diversion Inlet Structure
Appendix F:
DDR_FMM_Diversion_Inlet_Appendix_F_Structural.docx Page F‐28
Dam Wall Monolith L2/R2 to Dam Wall
Monolith L3/R3 ≤ 0.75 ≤ 1.0 Expansion Joints Tear Web
Dam Wall Monolith L4/R4 to Dam Wall
Monolith L5/R5 ≤ 0.5 ≤ 1 Expansion Joints Ribbed Centerbulb
Dam Wall Monolith L8/R8 to Dam Wall
Monolith L9/R9 ≤ 0.5 ≤ 1 Expansion Joints Ribbed Centerbulb
Dam Wall Monolith L9/R9 to Dam Wall Monolith L10/R10
≤ 0.5 ≤ 1 Contraction Joints Ribbed Centerbulb
Figure F‐16 Waterstop for larger expected movements.
Figure F‐17 Waterstop for smaller movements
F.2.7 Foundation Design
F.2.7.1 Configuration
The foundation for the diversion inlet structure will be separated into 4 slab slabs as shown in Figure F‐
18. The two upstream slabs (Foundation slabs #1 and #2) commonly referred to as the control structure
Page 35
Fargo Moorhead Metropolitan Area BCOES‐ATR/Sponsor/PDT Review Flood Risk Management Project Diversion Inlet Structure
Appendix F:
DDR_FMM_Diversion_Inlet_Appendix_F_Structural.docx Page F‐29
foundation and the two downstream foundation slabs (foundation slabs #3 and #4) commonly referred
to as the stilling basin. The foundation and the abutment walls will be designed as a U type structure
that is symmetrical about the longitudinal centerline of the structure.
Diversion Inlet Structure Foundation slabs
Figure F‐18 Control Structure Foundation Slabs
Foundation Slab #4
Foundation Slab #3
Foundation Slab #2
Foundation Slab #1
Page 36
Fargo Moorhead Metropolitan Area BCOES‐ATR/Sponsor/PDT Review Flood Risk Management Project Diversion Inlet Structure
Appendix F:
DDR_FMM_Diversion_Inlet_Appendix_F_Structural.docx Page F‐30
F.2.7.2 Foundation Design Process
An Excel spreadsheet was developed to compute all of the forces on the foundation slabs for foundation
s slabs #1, #3 and #4. A Microstation diagram was created to show the forces for each load case for
foundation slab #2. The reason foundation slab #2 was done in Microstation was because it was easier
to show the loads and calculations on the same drawing. The each foundation slab was modeled using
STAAD pro V8i. The STAAD models used linear springs to represent the horizontal stiffness of the soil
based on spring forces obtained from the Geotechnical group, see the calculations for the spring
stiffness’s for each soil layer. A nonlinear spring was used to model the soil skin friction and end bearing
resistance and then applied at the bottom of the piling. The vertical nonlinear spring stiffness was
calculated using the pile load test results as the spring stiffness varies in compression and tension. This
base spring also had the same spring stiffness for both lateral directions to represent the stiffness of the
glacial till for the horizontal component of the battered piling. Linear springs were used for the lateral
soil stiffness due to the nonlinear soil springs causing the models to take too long to analyze. See the
figure below for the spring stiffness’s used in the different layers of soil.
STAAD was used for the final pile layout design because STAAD will treat the foundation cap as flexible
and this will provide the most accurate foundation and piling forces. Output from the STAAD model can
also be used to design the concrete foundation for flexural reinforcement and the piling.
F.2.7.3 Pile Group Effects
Pile group effects were considered on foundation slab #2 but were not considered on foundation slabs
#1, #3 and #4. They were not considered on foundation slabs #3 and #4 because any group effects
would reduce the spring stiffness in the transverse direction (slabs pushing towards each other). Since
the joint down the centerline of the structure is a contraction joint foundation slabs #3 and #4 would
end up pushing against each other and since the load is the same on both sides any pile group effects on
these foundation slabs were neglected.
The pile group effects that were utilized on foundation slab #2 were calculated using the Group 7.0
Technical Manual chapter 7. The calculations for the group effects for foundation #2 are shown in the
foundation slab #2 calculations. The group effects reduced the lateral spring stiffness of the piling but
did not reduce the axial capacity of the piling since the piling will be tipped in the glacial till.
F.2.7.4 Foundation Design Summary
Foundation slab #1 will serve as a 38 foot long apron leading up to the front of the piers. The apron will
serve as an erosion control apron for the apron. Foundation slab #1 will support the vertical weight of
the water, dead load of the concrete and hydrostatic uplift forces (See section F.1.5.2). Foundation slab
#1 is supported by piling because the soil in the channel is expected to rise approximately 18” over time
and this differential elevation change from foundation slab #1 to foundation slab #2 was deemed too
much per Hydraulics.
Figure F‐19 Foundation #1 Pile Layout
Page 37
Fargo Moorhead Metropolitan Area BCOES‐ATR/Sponsor/PDT Review Flood Risk Management Project Diversion Inlet Structure
Appendix F:
DDR_FMM_Diversion_Inlet_Appendix_F_Structural.docx Page F‐31
Below is a summary of the piling design for foundation #1. The piling below that are “NO GOOD” have
failed in geotechnical tension capacity of the soil due to the large rebound force exerted to the bottom
of the foundation and along the piling. Geotech has said that the entire structure will move up with the
Page 38
Fargo Moorhead Metropolitan Area BCOES‐ATR/Sponsor/PDT Review Flood Risk Management Project Diversion Inlet Structure
Appendix F:
DDR_FMM_Diversion_Inlet_Appendix_F_Structural.docx Page F‐32
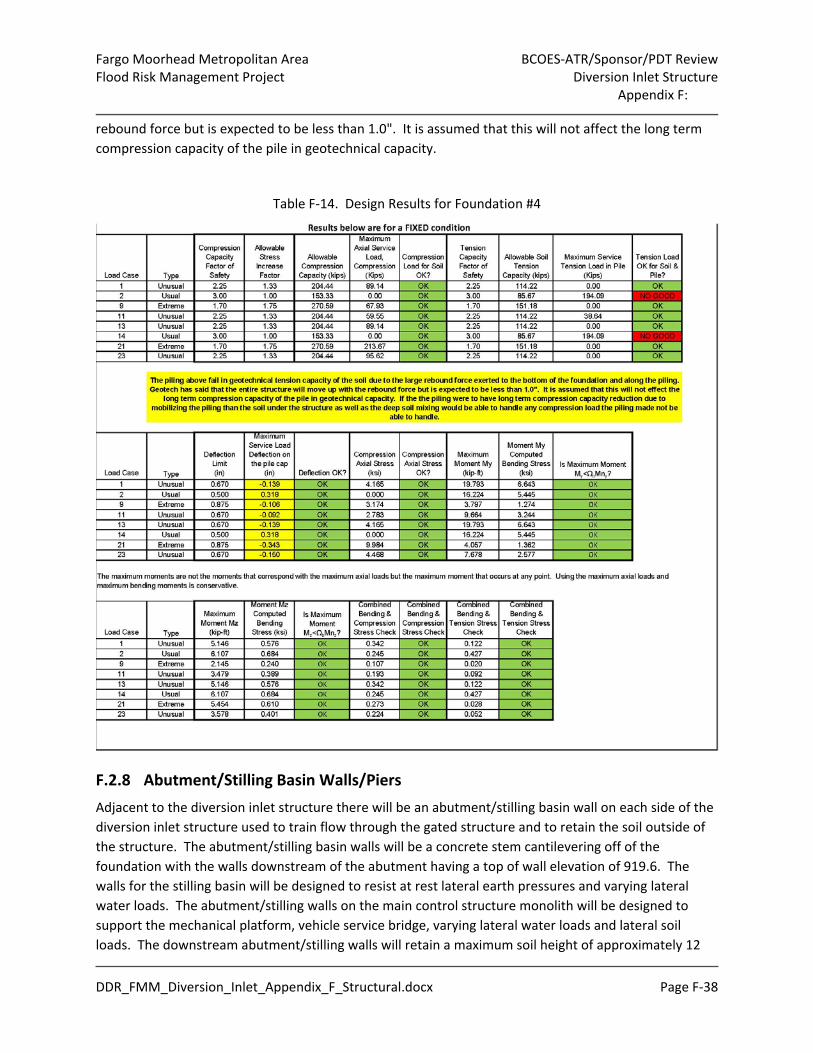
rebound force but is expected to be less than 1.5". It is assumed that this will not affect the long term
compression capacity of the pile in geotechnical capacity.
Table F‐11. Design Results for Foundation #1
Foundation slab #2 will support vertical loads from the piers, vehicle service bridge dead and live loads,
mechanical platform dead and live loads, tainter gates, trunnion girders, stepped spillway, a portion of
the dam wall bridge deck and barriers, weight of the water and hydrostatic uplift forces (See paragraph
F.1.5.2). Foundation slab #2 will also provide lateral resistance to the water loads, ice and/or wave loads
and soil loads acting on the abutment walls.
Page 39
Fargo Moorhead Metropolitan Area BCOES‐ATR/Sponsor/PDT Review Flood Risk Management Project Diversion Inlet Structure
Appendix F:
DDR_FMM_Diversion_Inlet_Appendix_F_Structural.docx Page F‐33
Figure F‐20 Foundation #2 Pile Layout
Below is a summary of the piling design for foundation #2. The piling below that are “NO GOOD” have
failed in geotechnical tension capacity of the soil due to the large rebound force exerted to the bottom
of the foundation and along the piling. Geotechnical Section has said that the foundation slab #2 will
Page 40
Fargo Moorhead Metropolitan Area BCOES‐ATR/Sponsor/PDT Review Flood Risk Management Project Diversion Inlet Structure
Appendix F:
DDR_FMM_Diversion_Inlet_Appendix_F_Structural.docx Page F‐34
move up with the rebound force but is expected to be less than 0.5". It is assumed that this will not
affect the long term compression capacity of the pile in geotechnical capacity.
Table F‐12. Design Results for Foundation #2
Page 41
Fargo Moorhead Metropolitan Area BCOES‐ATR/Sponsor/PDT Review Flood Risk Management Project Diversion Inlet Structure
Appendix F:
DDR_FMM_Diversion_Inlet_Appendix_F_Structural.docx Page F‐35
Foundation slab #3 will support the vertical weight of the floor ramps, baffle blocks, end sill, weight of
the water and hydrostatic uplift forces (See paragraph F.1.5.2) Foundation slab #3 will also provide
lateral resistance to the soil loads acting on the abutment walls.
Figure F‐21 Foundation #3 Pile Layout
Below is a summary of the piling design for foundation #3. The piling below that are “NO GOOD” have
failed in geotechnical tension capacity of the soil due to the large rebound force exerted to the bottom
Page 42
Fargo Moorhead Metropolitan Area BCOES‐ATR/Sponsor/PDT Review Flood Risk Management Project Diversion Inlet Structure
Appendix F:
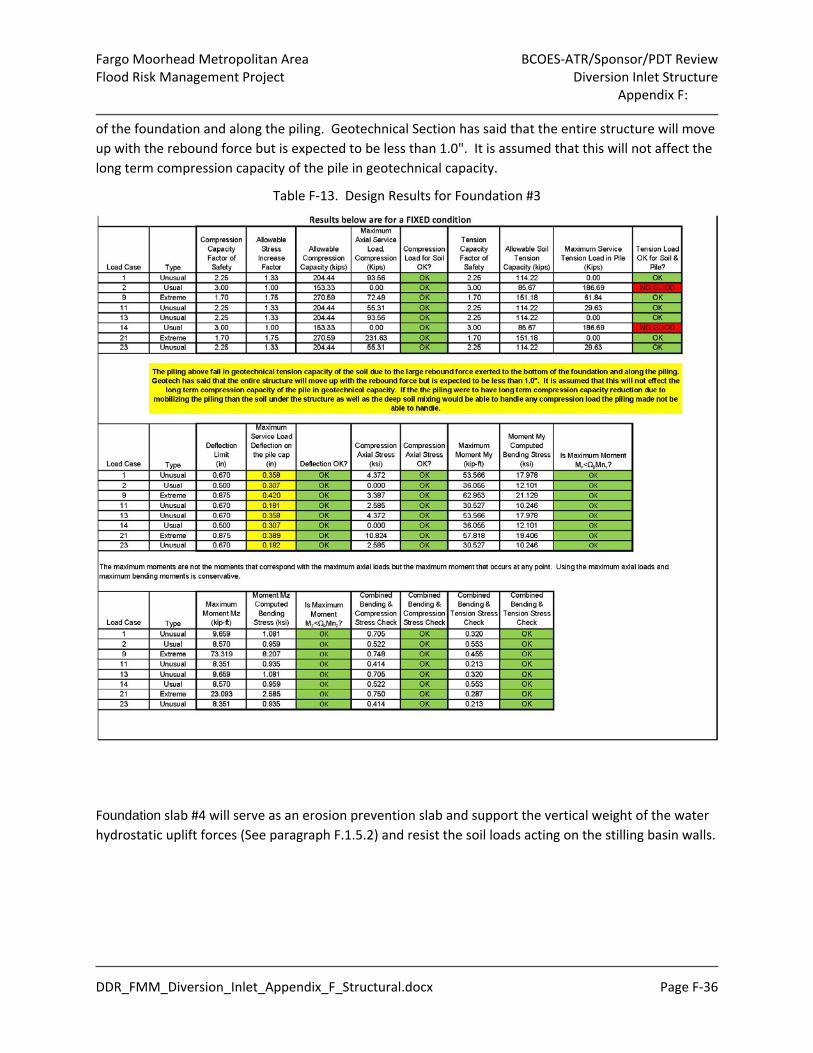
DDR_FMM_Diversion_Inlet_Appendix_F_Structural.docx Page F‐36
of the foundation and along the piling. Geotechnical Section has said that the entire structure will move
up with the rebound force but is expected to be less than 1.0". It is assumed that this will not affect the
long term compression capacity of the pile in geotechnical capacity.
Table F‐13. Design Results for Foundation #3
Foundation slab #4 will serve as an erosion prevention slab and support the vertical weight of the water
hydrostatic uplift forces (See paragraph F.1.5.2) and resist the soil loads acting on the stilling basin walls.
Page 43
Fargo Moorhead Metropolitan Area BCOES‐ATR/Sponsor/PDT Review Flood Risk Management Project Diversion Inlet Structure
Appendix F:
DDR_FMM_Diversion_Inlet_Appendix_F_Structural.docx Page F‐37
Figure F‐22 Foundation #4 Pile Layout
Below is a summary of the piling design for foundation #4. The piling below that are “NO GOOD” have
failed in geotechnical tension capacity of the soil due to the large rebound force exerted to the bottom
of the foundation and along the piling. Geotech has said that the entire structure will move up with the
Page 44
Fargo Moorhead Metropolitan Area BCOES‐ATR/Sponsor/PDT Review Flood Risk Management Project Diversion Inlet Structure
Appendix F:
DDR_FMM_Diversion_Inlet_Appendix_F_Structural.docx Page F‐38
rebound force but is expected to be less than 1.0". It is assumed that this will not affect the long term
compression capacity of the pile in geotechnical capacity.
Table F‐14. Design Results for Foundation #4
F.2.8 Abutment/Stilling Basin Walls/Piers
Adjacent to the diversion inlet structure there will be an abutment/stilling basin wall on each side of the
diversion inlet structure used to train flow through the gated structure and to retain the soil outside of
the structure. The abutment/stilling basin walls will be a concrete stem cantilevering off of the
foundation with the walls downstream of the abutment having a top of wall elevation of 919.6. The
walls for the stilling basin will be designed to resist at rest lateral earth pressures and varying lateral
water loads. The abutment/stilling walls on the main control structure monolith will be designed to
support the mechanical platform, vehicle service bridge, varying lateral water loads and lateral soil
loads. The downstream abutment/stilling walls will retain a maximum soil height of approximately 12
Page 45
Fargo Moorhead Metropolitan Area BCOES‐ATR/Sponsor/PDT Review Flood Risk Management Project Diversion Inlet Structure
Appendix F:
DDR_FMM_Diversion_Inlet_Appendix_F_Structural.docx Page F‐39
feet at the bottom of the stepped spillway. The abutment/stilling walls will be designed for a surcharge
loading of 250 psf to account for possible soil surcharge during construction. The abutment/stilling walls
will have varying length wall panels between and 20’‐0” and 25’‐0”and expansion joint spacing to match
the diversion inlet structure foundation expansion joints. The expansion joints will have an internal
waterstop to eliminate water or soil leakage through the joints. The top of the stilling basin walls will be
set at elevation 919.60. The walls will have a concrete form liner on the land side of the walls and a
smooth surface on the channel side as show in the Aesthetics section of the DDR.
With input from H&H the water elevation from supercritical flow was set at elevation 902 feet upstream
of the baffle blocks and a tailwater elevation of 917 after the hydraulic jump. The load combination of
the soil and tail water at elevation 917 outside of the stilling basin in the area of supercritical flow at
elevation 902 inside the stilling basing governed the design of the stilling basin walls. With the
uncertainty of the hydraulic jump location it was decided to apply the same reinforcement (#10’s @ 6”
OC) throughout the length of the stilling basin walls. The channel side reinforcement for the stilling
basin walls was designed to meet two design conditions. Condition one is with a channel water
elevation of 915.00, land side water elevation of 910.00, land side soil elevation of 898.00. This would
apply from the upstream edge of the stilling basin to the baffle blocks. This was designed as an unusual
load case (load factor of 1.70) and the design required #9’s @ 1’‐0” OC. Condition #2 is with a channel
water elevation of 922.00, land side water elevation of 917.00 and no soil on the land side. This was
designed as an extreme load case (load factor of 1.30) and the design required #10’s @ 1’‐0” OC. These
two conditions were coordinated with Hydraulics and guidance from the Risk Management Center in
Denver Colorado.
The Abutment and Pier Deflection Summary Table below shows the deflections/movements of the
abutments and piers under the design load cases. These numbers do not reflect the movement of the
foundation as a whole.
Page 46
Fargo Moorhead Metropolitan Area BCOES‐ATR/Sponsor/PDT Review Flood Risk Management Project Diversion Inlet Structure
Appendix F:
DDR_FMM_Diversion_Inlet_Appendix_F_Structural.docx Page F‐40
F.2.9 Baffle Blocks and Energy Dissipation
There are 12 baffle blocks, 13 floor ramps situated between the baffle blocks, and an end sill.
Dimensions of the structures are shown in Figure F‐23. The geometry of the structures were designed
by the Hydraulic Section. The baffle blocks, floor ramp and end sill are designed using dynamic water
force load exerted on them. The force is computed using the flow rate and velocity submitted by the
Page 47
Fargo Moorhead Metropolitan Area BCOES‐ATR/Sponsor/PDT Review Flood Risk Management Project Diversion Inlet Structure
Appendix F:
DDR_FMM_Diversion_Inlet_Appendix_F_Structural.docx Page F‐41
Hydraulic Section. Obtained loads were multiplied by a safety factor of 2.21 (1.7x1.3) to design the
reinforcement. Analysis and design are shown later in this appendix.
Figure F‐23 Energy Dissipation Features
F.2.10 Dam Walls
F.2.10.1 Configuration
The dam walls will maintain the dam surface between the tieback embankment, overflow embankment,
and the diversion inlet structure as well as provide access to the diversion inlet structure from the
embankment access roads.
Page 48
Fargo Moorhead Metropolitan Area BCOES‐ATR/Sponsor/PDT Review Flood Risk Management Project Diversion Inlet Structure
Appendix F:
DDR_FMM_Diversion_Inlet_Appendix_F_Structural.docx Page F‐42
The dam wall system will have a vehicle service bridge deck with (2) concrete barriers. The design of the
bridge is described in the Paragraph F.5.2. To reduce the overturning moment developed by the water
lateral load on the dam wall stem, the center of gravity of the bridge structure was purposely positioned
on the upstream side of the dam wall. For the bridge substructure, two options were considered: the
first was a pier cap, supporting the deck plank, on top of a column and the flood wall to act as a moment
frame, and the second was a bridge pier acting as a brace for the dam wall and as a pier cap for the
bridge deck. Both situations were preliminarily modeled in STAAD, and the first option, the moment
frame, consisted of larger moments and deflections in the pier cap and dam wall because of slenderness
issues in the column. Since the column was less stiff than the other two elements, a significant amount
of the load was transferred to the pier cap and the dam wall. In addition, because the dam wall no
longer acted as a cantilever, the moment demand was large at the pier cap to dam wall connection. To
reduce these large moments in the pier cap and dam wall, the size of the column needed to increase to
the point where it was the thickness of a solid wall. The second option is presented because it will brace
the flood wall across its full height and be able to support the bridge deck. The second option also will
be easier to construct compared to the first option since it can be built in fewer concrete pours. As a
result, the second option was determined to be the path for design.
The bridge piers are the bearing surfaces for the precast plank and are spaced a maximum of 30 feet on
center. The concrete bridge piers and the dam walls will be supported by a pile founded concrete
foundation. In addition, the dam wall foundation s will have a minimum of 5’‐0” of frost protection from
the top of the soil to the bottom of the foundation per 2007 Minnesota State Building Code.
Instead of keeping the same dam wall cross section from the abutment to the embankment road tie in,
the dam walls were broken up into different heights of sections to minimize the amount of structure
below ground, but still meet the frost protection requirements. Expansion joints are provided where the
change in foundation elevation occurs. Section 1 of the dam walls is 57 feet in length and is the tallest
section. The next is Section 2, which is 60 feet, and Section 3, which is 120 feet. Section 4 and Section 5
have the same foundation elevation, making them the only sections not divided by an expansion joint,
and are 30 feet and 32 feet, respectively. Section 4 and Section 5 are divided into two sections because
of their differences in geometry, since Section 5 has two bridge piers to support the approach slab.
Contraction joints are placed at a maximum of 30 foot increments to create 30 foot monolith segments.
The bridge pier width was based on initial bearing pad width calculation following the AASHTO
requirements and aesthetic concerns. The length of the pier cap was determined by the requirements
to allow for the chosen standard barrier and the clear distance of 15 feet. In order to keep the moments
low, the cantilever of the pier cap was kept at less than 4 feet, which then determined the length of the
bridge pier. The aesthetic design then modified the model and set the design cantilever length. The
shape of the cantilever was based upon aesthetics.
F.2.10.2 Design Procedure
For the bridge pier, the dam wall and the foundation, the AASHTO 7th Edition service load case was used
in the design and combined with USACE EM 2104 net load factors for Usual, Unusual, and Extreme as
shown in the list below. The dam wall, bridge pier, and foundation are considered to be USACE
hydraulic structures. The dead load (D) is the self‐weight of the structural elements, the live load is the
Page 49
Fargo Moorhead Metropolitan Area BCOES‐ATR/Sponsor/PDT Review Flood Risk Management Project Diversion Inlet Structure
Appendix F:
DDR_FMM_Diversion_Inlet_Appendix_F_Structural.docx Page F‐43
vehicle lane load and the HL‐93 wheel loads (multiplied by the dynamic load allowance (IM) factor
[AASHTO C3.6.2.1‐1]), and the water load (W) which includes wave, hydrostatic water, and hydrostatic
seepage pressure.
Usual: 2.21*(1.0*D+1.0L)
Unusual: 1.7*(1.0D+1.0L+1.0W)
Extreme: 1.3*(1.0D+1.0L+1.0W)
For the cantilever portion of the bridge pier, which acts similarly to a traditional pier cap for the negative
moment regions, the AASHTO LRFD Bridge Design Specifications 7th Edition load cases were used. The
load cases listed in Table F‐15 from the AASHTO Table 3.4.1‐1 of Load Combinations and Load Factors
for top bar reinforcement in the pier cap. The wind on substructure was not included in the load cases
because the wave load on the structure is greater than the wind pressure; the wave pressure covers the
entire face of the structure, so there is nowhere for the wind to act. Wind on live load was not included
because the likelihood of vehicles driving on the structure during maximum wind load conditions is
extremely small. AASHTO load cases Service II, III, and IV were not considered for the following reasons:
the structure is not steel construction and the bridge pier and cap are not prestressed concrete
members [AASHTO page 3‐10]. The Strength III load case was not considered because the two versions
of Strength IV bracket the Strength III load case.
Table F‐15. AASHTO Load Combinations
1. Strength I 1.25D+1.75L+1.0W
2. Strength I 0.9D+1.75L+1.0W
3. Strength IV 0.9D+1.0W
4. Strength IV 1.5D+1.0W
5. Strength V 0.9D+1.35L+1.0W
6. Strength V 1.25D+1.35L+1.0W
7. Fatigue II 0.75L
8. Service I 1.0D+1.0L+1.0W
F.2.10.3 Load Cases
For the design of the dam walls, bridge piers, and foundation, each of the five sections were modeled and
had the following loads applied for each of the load cases discussed previously:
Usual: 1. A) Groundwater at surface causing hydrostatic uniform uplift (i.e. 3 ft of ground with an additional
3 ft thick foundation results in 6 ft of hydrostatic head across bottom of foundation)
plus self‐weight,
plus weight of saturated soil
Page 50
Fargo Moorhead Metropolitan Area BCOES‐ATR/Sponsor/PDT Review Flood Risk Management Project Diversion Inlet Structure
Appendix F:
DDR_FMM_Diversion_Inlet_Appendix_F_Structural.docx Page F‐44
plus a soil rebound force (For Sections 1 and 2 only)
B) Groundwater at surface causing hydrostatic uniform uplift (i.e. 3 ft of ground with an additional 3 ft thick foundation results in 6 ft of hydrostatic head across bottom of foundation)
plus self‐weight,
plus weight of saturated soil
plus lane and vehicle live load
plus a soil rebound force (For Sections 1 and 2 only)
2. A) Dry,
self‐weight of structure
plus weight of saturated soil
plus a soil rebound force (For Sections 1 and 2 only)
B) Dry
self‐weight of structure
plus weight of saturated soil
plus lane and vehicle live load
Unusual:
3. A) Water level 922
no gap
plus wave,
self‐weight,
weight of soil/water on top of foundation,
seepage uplift,
unbalanced loads, (Sections 1 and 2 only)
with lane and vehicle load
B) Water level 922
no gap
plus wave,
self‐weight,
weight of soil/water on top of foundation,
seepage uplift,
unbalanced loads, (Sections 1 and 2 only)
no vehicle load.
4. A) Water level 922
with a gap between foundation and soil on high water side
plus wave,
self‐weight,
weight of soil/water on top of foundation,
seepage uplift,
No unbalanced loads,
with lane and vehicle load
B) Water level 922
Page 51
Fargo Moorhead Metropolitan Area BCOES‐ATR/Sponsor/PDT Review Flood Risk Management Project Diversion Inlet Structure
Appendix F:
DDR_FMM_Diversion_Inlet_Appendix_F_Structural.docx Page F‐45
with a gap between foundation and soil on high water side
plus wave, self‐weight,
weight of soil/water on top of foundation,
seepage uplift,
no unbalanced loads,
no vehicle load.
Extreme: Same as Unusual but water level changes to 926 HW and 917 TW.
926 headwater and 900.7 (also referred to as zero) tailwater was chosen to be conservative since
Hydraulics was uncertain about the tailwater elevation during operation and what level should be actually
used.
F.2.10.4 Design Analysis
The dam walls were analyzed using STAAD Pro V8i 3D. Plate elements were used for the dam wall,
piers, and foundation and beam elements for the piles. The dam walls and bridge piers were, initially,
designed without the foundation attached to them. The structure was fixed at the base for this design
since the foundation was not designed yet. Hydrostatic pressures were applied to the plate elements.
Wave loads from Hydraulics were also applied to Sections 1 through 4. Section 5 was not exposed to
wave load since it is buried. Loads from the bridge deck and vehicle are transferred at the bridge piers
through the use of a beam element with equivalent stiffness to the bridge plank. All five sections of the
wall were modeled for final design calculations. The dam wall thickness was sized based on the shear
capacity of the concrete being greater than the demand. The shear force in the dam wall came from the
plate elements.
The shear force in the bridge piers was computed from STAAD results by summing up the reactions at
the base of the wall. The moment for the main vertical flexural reinforcement at the upstream end of
the bridge pier was computed based upon vertical reaction of the fixed supports times the distance from
the support to the centroid of the “T” section.
The pile layout was then evaluated based upon the modeling of the entire dam wall, bridge pier,
foundation, and pile interaction in the STAAD 3D plate model. Beam elements were attached to the
foundation to model the piles and springs were positioned along the beam at approximately 2 foot
increments to model the soil. The beams were battered at 3V:1H for Sections 1 through 4. Section 5
required vertical piling due to it being buried in soil. Modeling the foundation in the 3D model was
necessary because the shear walls create 2‐way slab action in the foundation. Modeling with the Group
program has a major limitation because it neglects the relative stiffness’s of the other elements in the
wall, and assumes a rigid foundation. STAAD accounts for the foundation being semi‐rigid, since STAAD
is able to model all of the elements.
The STAAD 3D model included the effect of the soil resistance in the piles through the use linear springs
along the piling and nonlinear spring at the end of the pile. The STAAD models used linear springs to
represent the lateral stiffness of the soil based on spring forces obtained from the Geotechnical group.
See the calculations for the spring stiffness’s for each soil layer. Linear springs were used for the lateral
soil stiffness to be consistent throughout the structure and due to the nonlinear soil springs causing the
models to take too long to analyze. A nonlinear spring was used to model the soil skin friction and end
Page 52
Fargo Moorhead Metropolitan Area BCOES‐ATR/Sponsor/PDT Review Flood Risk Management Project Diversion Inlet Structure
Appendix F:
DDR_FMM_Diversion_Inlet_Appendix_F_Structural.docx Page F‐46
bearing resistance axially along the pile and then applied at the bottom of the piling. The vertical
nonlinear spring stiffness was calculated using the pile load test results. This base spring also had the
same spring stiffness in the horizontal direction along the batter to represent the stiffness of the glacial
till for the horizontal component of the battered piling. To account for the elastic shortening of the
beam that could not be resisted without vertical springs representing the skin friction along the entire
length of the pile, the area of the HP 14 X 73 pile was increased by 10 times. The self‐weight was then
reduced back to normal by decreasing the density by 10 times.
Water pressure on the base of the foundation from seepage and uplift was calculated according to ECB
No. 2014‐24 Revision and Clarification of EM 1110‐2‐2100 and EM 1110‐2‐2502. The “No Gap”
classification in the above load cases is where the seepage path goes along all edges of the foundation
and down and around the effective length of the sheet pile (7.5 ft). The sheet pile cutoff is assumed to
be 15’ long with only half effective for design purposes (EM 1100‐2‐2100 page C‐5 Section C‐4.c “Soil
and Pile Foundations). “Gap” meant that the foundation on the upstream side had displaced and now
the soil is undrained and no head is lost on the upstream side of the sheet pile. The sheet pile location
was adjusted based upon the location of the piles to be halfway between the rows battering in opposite
directions.
Unbalanced loads were provided by Geotech for Sections 1 and 2. Sections 3, 4, and 5 located at or
above the natural grade did have unbalanced loads. The unbalanced load procedure was followed
according to the document T‐Wall Design Procedure 08 May 2009 Section 3.4.3.1 HPS T‐Wall Design
Procedure. The springs down to the critical failure surface were reduced to 50% stiffness according to
the procedure, because the computed factors of safety without the piles in place were about 1.25. This
is 50% of the way between factor of safety of 1.0 (at which no springs would be used) and the target
factor of safety of 1.5 (at which full spring stiffness would be used). Conservatively, 50% spring
stiffness was used for consistency in both models (Sections 1 and 2) down to the failure surface. Section
2’s Factor of Safety was 1.36 with reinforcement load of 500 lbs (failure surface elevation 899). Section
1 (HW 922) Factor of Safety was 1.27 with reinforcement load of 6000 lbs (failure surface elevation 881).
Section 1 (HW 926 and TW 910) required a reinforcement load of 400 lbs (failure surface elevation 881).
The unbalanced load was applied as a distributed load on the piles down to the failure surface. The
headwater side received 50% of the unbalanced load and the downstream piles evenly received the
other 50% of the load distributed over the number of rows.
The models were analyzed in STAAD with the vehicle axle loads positioned the farthest downstream on
the pier cap (3.333 feet from end) to create the worse conditions. The moment, axial, and shear forces
in the piles were taken from the results when the piles were fixed to the foundation. A study by ERDC
showed that a pile acts somewhere between fixed and pinned within the foundation. As an upper
bound for deflections at the pile cap the piles were also pinned. The reported deflections are from the
pinned case, so knowing that the pile will not truly act pinned nor fixed then the deflections will actually
be smaller than what is reported by the pinned model. The deflection limit from the document on
Hydraulic Structures Design Guidelines, maximum tension and compression limit (dependent on pile
load test from Geotech and safety factor), combined bending/axial compression/tension were checked
based on EM 1110‐2‐2906 and AISC 14th Edition Section H1‐1, and shear in pile based on AISC 14th
Edition Section G. The factors of safety for the piles are shown in the Section F.1.1.3.
Page 53
Fargo Moorhead Metropolitan Area BCOES‐ATR/Sponsor/PDT Review Flood Risk Management Project Diversion Inlet Structure
Appendix F:
DDR_FMM_Diversion_Inlet_Appendix_F_Structural.docx Page F‐47
The foundation concrete thickness was designed based on the one‐way shear demand. Punching shear
of the piles was also computed, but did not control. The effective depth “d” of the foundation was
reduced by 12 inches to account for the embedment of the pile. For Sections 1 through 4, the maximum
axial force from the pile (not located under the dam wall stem) was divided by the tributary width to get
the shear into the foundation per foot of foundation. Due to being unsymmetrical, Section 5 required
shear to be computed as the sum of the axial forces along the upstream pile row then divided by the
length of the foundation to get an average shear force in the foundation.
The moment reinforcement was computed from the plate moments from the model. The worst case
moment was determined by Mx +/‐ Mxy and My +/‐ Mxy. The requirements for Temperature and
Shrinkage reinforcement were also met according to EM 2104.
The sensitivity of the model to soil spring stiffness changes was also checked. The springs in the model
for Section 3 were increased to 2 times as stiff and half as stiff. The results are in the following table.
The deflections come from the pinned case, so in reality as discussed previously, the deflection would
not be as much. The results show that the interaction was not affected, so the model is not very
sensitive to changes in spring stiffness. It was determined, that the slight changes in stratigraphy
presented by Geotech later in the design process could be neglected due to the results shown below in
Table F‐16 .
Table F‐16. Dam Wall Section 3 Stiffness Comparison
0.5 X Stiffness
1 X Stiffness
2 X Stiffness
Usual
Max Compression [kip] 175 176.68 177.84
Max Tension [kip] 0 0 0
Deflection [inches] 1.028 0.641 0.403
Interaction ‐ Compression [] 0.668 0.638 0.610
Interaction ‐ Tension [] 0.249 0.224 0.201
Max Plate Unfactored Moment Mx [kip‐ft] 81.5625 76.6181 72.8752
Min Plate Unfactored Moment Mx [kip‐ft] -35.0769 -31.6131 -28.7316
Max Plate Unfactored Moment My [kip‐ft] 53.2796 52.3722 51.2949
Min Plate Unfactored Moment My [kip‐ft] -36.8750 -34.4147 -33.0187
Shear in foundation [kip] factored 22.486 21.163 19.716
Unusual
Max Compression [kip] 224.95 225.63 225.36
Max Tension [kip] 0.00 0 0
Deflection [inches] 0.762 0.468 0.294
Interaction ‐ Compression [] 0.490 0.453 0.447
Interaction ‐ Tension [] 0.126 0.098 0.094
Max Plate Unfactored Moment Mx [kip‐ft] 67.3070 66.9059 66.0354
Min Plate Unfactored Moment Mx [kip‐ft] -21.2352 -20.4863 -20.0640
Max Plate Unfactored Moment My [kip‐ft] 57.0957 58.2633 58.6518
Min Plate Unfactored Moment My [kip‐ft] -28.6095 -28.0645 -27.7263
Page 54
Fargo Moorhead Metropolitan Area BCOES‐ATR/Sponsor/PDT Review Flood Risk Management Project Diversion Inlet Structure
Appendix F:
DDR_FMM_Diversion_Inlet_Appendix_F_Structural.docx Page F‐48
Shear in foundation [kip] factored 17.084 18.454 19.066
Extreme
Max Compression [kip] 265.50 265.55 265.23
Max Tension [kip] 0.00 0 0
Deflection [inches] 1.719 0.964 0.579
Interaction ‐ Compression [] 0.458 0.454 0.445
Interaction ‐ Tension [] 0.130 0.127 0.120
Max Plate Unfactored Moment Mx [kip‐ft] 103.8323 103.0282 100.9840
Min Plate Unfactored Moment Mx [kip‐ft] -37.3193 -36.4138 -33.9728
Max Plate Unfactored Moment My [kip‐ft] 74.6562 74.9834 74.7959
Min Plate Unfactored Moment My [kip‐ft] -31.8817 -31.6575 -31.2832
Shear in foundation [kip] factored 34.514 34.522 34.480
F.3 TAINTER GATES
There will be (3) 50 foot wide Tainter gates as shown on Figure F ‐ 21. The maximum headwater
elevation that the Tainter gates will be designed to is 922.0 with no tailwater, which will provide 3.7ft of
freeboard. The Tainter gate will be in the down position until a flood event occurs at which the FMM
Diversion Authority will open the gates as outlined in the operation and maintenance manual. The
Tainter gate will rest on a Tainter gate seat at the top of the parabolic spillway which will be set at an
elevation of 899.7 (As outlined in section F.1.3.1). The gate will be 26 feet high, putting the top of the
gate at elevation 925.7 in the closed position. The trunnion girder will be set at elevation 919.0, which is
2 feet above the maximum tailwater elevation of 917.0. There will be a minimum of 1 foot of clearance
between the Tainter gate and any portion of the bridge deck or bridge beams throughout the full range
of motion of the Tainter gate. See Figure F ‐ 8 for the preliminary location of the Tainter gates.
F.3.1 Tainter Gate 3D Model Overview
The Tainter gate models are composed of both frame and shell elements, see figures below. The models
were first drawn in AutoCAD 3D with the help of preliminary calculations and as‐built drawings from
Baldhill dam, which is similar in size to the Fargo Tainter gates. The Tainter gate’s strut arms, strut arm
braces, outer and interior cross braces, and girders were imported as frame members into SAP2000. The
skin plate and ribs were meshed manually in AutoCAD using 3D faces and then imported into SAP2000
as (thick) shell elements. The Trunnion assembly was simplified and modeled as (thick) shell elements 6”
thick. All elements were selected to be (thick) shell elements in order to account for the effects of
transverse shearing deformation described in the SAP2000s user manual. After the frame members
were imported into SAP2000, they were rotated along their local axis to their anticipated constructed
position. To accurately model the various offset distances of both the frame elements and shell
elements with respect to other members, rigid links were used. Examples of this include:
rib to horizontal girder connection
cross bracing to horizontal girder connection
Page 55
Fargo Moorhead Metropolitan Area BCOES‐ATR/Sponsor/PDT Review Flood Risk Management Project Diversion Inlet Structure
Appendix F:
DDR_FMM_Diversion_Inlet_Appendix_F_Structural.docx Page F‐49
For individual member boundary conditions, the cross bracing members received partial fixity by
releasing their end moments and effectively creating a pin. However, the strut arms, braces, and
horizontal girders, did not have any degrees of freedom released and therefore maintained their full
fixity. In addition, all frame elements were not divided into segments, but rather were made continuous
in order to avoid misleading demand capacity ratio (DCR) values outputted by SAP2000. In the case of
the horizontal girders, the unbrace length in regards to bending (lateral torsional buckling, LTB) and
along the girder’s weak axis (L) was inputted into the design overwrite feature of SAP2000 as 0.3. The
unbrace length ratio of 0.3 was conservatively selected based on the spacing between the downstream
truss connection points along the girder. The skin plate and ribs was assumed to continuously brace the
upstream flange or the horizontal girder. To capture the wire rope lifting system, the elements
representing the wire rope were inputted as tension only non‐linear hook elements. In regards to the
rigid links, the boundary conditions were fixed for all translational and rotational degrees of freedom.
To model the concrete foundation that the gate rests on for various load cases, non‐linear gap link
elements with a high effective stiffness (100,000 k/in) were used. Please note that for the strut arms,
member offsets was applied to prevent the strut arm framing elements protruding into the horizontal
girders. The wire ropes were added to various models as nonlinear hook elements that could only
withstand loads in tension. The connection point of the hook element to the skin plate received a finer
mesh size compared to the typical skin plate element in order to more accurately depict the stresses at
this location. The finer elements were assigned edge constraints in order to smoothly and accurately
transition stresses back into the typical more coarse skin plate mesh. The end of the hook element,
which traveled a few feet at a tangent from the skin plate, was attached to a pin support. The stiffness
of the hook element was calculated using AE/L in which the area was represented by (3) 1” dia. steel
ropes, E was the modulus of elasticity of steel (29000ksi), and L was taken as the arc length of the skin
plate or 25.71ft. Putting these together a stiffness value of 222kip/in was determined and used in the
models. It is acknowledged that the rope will travel a few more feet past the skin plate where it
connects to the hoist system, however this added distance will not significantly affect the wire rope
stiffness and or the results of the SAP model.
Page 56
Fargo Moorhead Metropolitan Area BCOES‐ATR/Sponsor/PDT Review Flood Risk Management Project Diversion Inlet Structure
Appendix F:
DDR_FMM_Diversion_Inlet_Appendix_F_Structural.docx Page F‐50
Figure F‐24 Completed 3D Tainter Gate Model Facing Upstream
Figure F‐25 Completed 3D Tainter Gate Model Side Elevation View
To evaluate the skin plate and ribs, a separate frame model was created that followed the guidance of
ETL 1110‐2‐584. The Tainter gate model was restrained globally at the Trunnion assembly with a pin
Page 57
Fargo Moorhead Metropolitan Area BCOES‐ATR/Sponsor/PDT Review Flood Risk Management Project Diversion Inlet Structure
Appendix F:
DDR_FMM_Diversion_Inlet_Appendix_F_Structural.docx Page F‐51
support, and then fixed in rotation about the z axis for all load cases. The y‐axis rotation was left
unrestrained to imitate the gates ability to rotate around the Trunnion pin. In the load cases that
involved the hoist system acting as a support, a pin support was used at the end of the hook link
element, which attached to the skin plate at the same location of the lifting bracket. A similar approach
was used for the gate jammed load case, which will be discussed and illustrated in more detail later.
F.3.2 Loads
The loads applied to the model followed the definitions prescribed in ETL 1110‐2‐584 and supplemented
in part with EM 1110‐2‐2702. Each load case was evaluated and the governing load cases selected based
on analysis results. Some loads were omitted such as seismic or earthquake loads as these load cases by
inspection would not govern the design.
F.3.2.1 Gravity Loads
The dead load of the Tainter gate was increased by 5% to conservatively account for the paint coatings,
welds, and various gusset plates. The 5% was added into the model by changing the self‐weight of the
members by a factor of 1.05. In addition, a 2” thick distributed ice load was applied to the horizontal
girders and strut arms, which had a net value of 23.44plf and 10.42plf respectively. The assumed 2”
thickness of ice was based on PDT team members observations on similar gates near the proposed Fargo
construction site. (Kent Hokens). Mud loads were considered negligible and not included in the analysis.
F.3.2.2 Hydrostatic Loads
The hydrostatic loads were applied to the model as surface pressures normal to the face of the shell
elements, where the maximum surface pressure value was 1393.75lb/ft2 located at the bottom of the
gate, see below. This pressure value correlates to the maximum headwater elevation expected to be
seen by the gate at elevation 922.0’, see Figure F‐26.
Page 58
Fargo Moorhead Metropolitan Area BCOES‐ATR/Sponsor/PDT Review Flood Risk Management Project Diversion Inlet Structure
Appendix F:
DDR_FMM_Diversion_Inlet_Appendix_F_Structural.docx Page F‐52
Figure F‐26 Tainter Gate with Hydrostatic Load
F.3.2.3 Gate Lifting System Loads
Three different lifting pressure loads were determined for load cases 2b, 3, and 5. For load case 2b the
wire rope pressure loads were based on the balanced reaction at the two wire rope supports, see figure
below. In load case 3, which assumes the failure of one of the wire ropes, the axial load through the
single wire rope / hook link was used to determine the wire pressure load acting on the gate, see figure
below. For load case 5 the gate lifting load or hoist load was provided by the mechanical engineering
PDT members. The load provided correlated with the total balanced load from load case 2c multiplied by
200%, which correlated to the stalled torque of the motor producing a value of 152kips that was applied
to one side of the gate along with the wire rope pressure of 5.85ksf.
F.3.2.4 Side Seal Friction Loads
The side seal friction load was calculated in accordance to ETL 1110‐2‐584 and was applied to the
SAP2000 3D model based on the tributary area of each shell element. Based on each shell element
having a tributary area of 6 inches, this correlated to a side seal friction load of 26.96lbf (1/4” Preset) for
the max hydrostatic pool (H1) and 14.15lbf for (H2) the 10‐year flood event. The side seal friction loads
were applied onto the skin plate shell elements at the exterior of the gate as surface pressure values
oriented in the downward local axis direction see Figure F‐27. The following are the various assumptions
made to calculate the side seal friction.
Page 59
Fargo Moorhead Metropolitan Area BCOES‐ATR/Sponsor/PDT Review Flood Risk Management Project Diversion Inlet Structure
Appendix F:
DDR_FMM_Diversion_Inlet_Appendix_F_Structural.docx Page F‐53
Side seal friction load (Fs) shall be evaluated using equation (3‐2) of EM 1110‐2‐27025. The
following values will be used for evaluating the side seal friction force:
μs = 0.75 (Coefficient of friction)
l.s = 28.53’ (Total length of the side seal, service gate)
l1 = 24.76’ (length of the side seal from the headwater to the bottom
of the seal)
d = 4” (Width of seal exposed to upper pool hydrostatic
pressure, per rubber side seal
δ = 0.25” (Preset of seal,
D.j = 1.75” (diameter of j bulb)
E = 900psi (modulus of elasticity E, per specification p. 11‐5, 300%
modulus = 900psi)
Figure F‐27 Illustration of Side Seal Friction Applied to Tainter Gate
F.3.2.5 Trunnion Pin Friction Loads
The Trunnion friction loads were determined following the guidelines of ETL 1110‐2‐584. The wire rope
applied loads were iterated along with the trunnion friction moment (which was applied along the –Y
Global axis of the SAP2000 model) into a MathCAD spreadsheet until both the reaction values of the
model’s supports matched the MathCAD iteration. The Figure F‐28 illustrates the free body diagram
used to determine the trunnion friction moment. R1 was found by determining the resultant force in the
Page 60
Fargo Moorhead Metropolitan Area BCOES‐ATR/Sponsor/PDT Review Flood Risk Management Project Diversion Inlet Structure
Appendix F:
DDR_FMM_Diversion_Inlet_Appendix_F_Structural.docx Page F‐54
Z and X direction. This force was then multiplied by the radius of the pin and friction coefficient of 0.3 to
determine part 1 of the frictional moment. Part 2 of the frictional moment was derived from R2 or the
reaction in the Y direction, and was multiplied by r.u along with the coefficient of friction. Together
these results were combined to give the frictional moment value of 260.19 kip*ft for load case 2b (Ice)
defined below. The pin will be made from 17‐4 stainless steel, while the bushing will be made from a
composite material by Columbia Industrial Products (CIP) or similar product. See the mechanical section
for further details and discussion. The thrust washer will also be made from a composite material known
as CIP Hydro, which has a much lower coefficient of friction than the recommended 0.3. However, for
calculation purposes, 0.3 was used. The composite material has a compressive modulus of 500,000 psi,
which was used to determine the spring stiffness value for the trunnion transition hub discussed later
on.
Figure F‐28 Trunnion Friction Moment Free Body Diagram
F.3.2.6 Earthquake Design Loads
Due to the low seismicity of the Tainter gate’s location along with the low coincident pool, earthquake
design loads by inspection would not govern the design and were therefore not investigated.
Page 61
Fargo Moorhead Metropolitan Area BCOES‐ATR/Sponsor/PDT Review Flood Risk Management Project Diversion Inlet Structure
Appendix F:
DDR_FMM_Diversion_Inlet_Appendix_F_Structural.docx Page F‐55
F.3.2.7 Wire Rope Loads on Skin Plate
Wire rope loads were applied as distributed pressure loads to the 3D model. The loads are based on
wire rope reaction values taken from the 3D model. These values and pressure distributions have been
presented in Table F‐17.
Table F‐17 Wire Rope Loads for Tainter Gates (Unfactored)
Tainter Gate Strut Wire Rope Reactions (Unfactored)
Load Case Wire Rope (LS) Wire Rope (RS) Wire Rope (LS) Wire Rope (RS)
(Kip) (Kip) (Ksf) (Ksf)
LC1 0 0 0 0
LC2b (Ice) 33 33 1.15 1.15
LC2b (Wave) 47 47 1.73 1.73
LC2c 44 44 1.7 1.7
LC3 132 0 5.08 0
LC5 199 0 7.63 0
USDS = X AXIS
CC = Y AXIS
VERTICAL =Z AXIS
RS = Right Side
LS = Left Side
F.3.2.8 Wave, Wind, and Impact Loads
Wave loads were provided by a hydraulic engineer PDT member whom provided the pressure
distribution along the skin plate for a surface water elevation of 922’, see Figure F‐29 . The pressures
included:
P1 = 90psf (Max pressure @ SWL)
P2 = 0psf (Pressure at top of the gate)
P3 = 0psf (Pressure at bottom of the gate)
Page 62
Fargo Moorhead Metropolitan Area BCOES‐ATR/Sponsor/PDT Review Flood Risk Management Project Diversion Inlet Structure
Appendix F:
DDR_FMM_Diversion_Inlet_Appendix_F_Structural.docx Page F‐56
Figure F‐29 Wave Loading for a 100 Year Event
Page 63
Fargo Moorhead Metropolitan Area BCOES‐ATR/Sponsor/PDT Review Flood Risk Management Project Diversion Inlet Structure
Appendix F:
DDR_FMM_Diversion_Inlet_Appendix_F_Structural.docx Page F‐57
These pressures are in reference to EM 1110‐2‐1100 Table VI‐5‐53. The wave loads were applied into
the SAP2000 3D model using two different joint patterns with one related to an upper wave (El. 922’
and above, P1 to P2) and another related to a lower wave (El. 922’ and below P1 to P3).
Wind loads were based on the maximum wind pressure recommended by ETL 1110‐2‐584 of 50 psf and
were applied on the skin plate as a surface pressure in both the upstream and downstream directions.
This is conservative, but was selected because wind loads never govern gate design when compared to
hydrostatic pressures.
Ice impact loads were also based on ETL 1110‐2‐584 with a value of 5 klf and were applied as a joint load
along the skin plate of the SAP2000 3D model at Elevation 922’. Please note that because the skin plate
shell mesh was divided into a 6” mesh, the loads at the joints had a value of 2.5klf.
F.3.2.9 Selected Load Cases
The load cases selected for the analysis include:
Limit State (Strength I)
Usual Operation
Loads consist of unusual hydrostatic head differential with gate subjected to self‐weight and gravity
loads:
1 1.2 1.6 1.4 1
Load case 1a was added for completeness, but was not found to govern design.
Loads consist of unusual hydrostatic head differential with gate subjected to self‐weight, gravity loads,
plus wave or impact, whichever controls:
1 1.2 1.6 1.4 1 1.2 1.6
Limit State (Strength II)
Usual Operation
Gate Open, Gate operating on two hoists. Loads consist of extreme hydrostatic head differential with
gate subjected to self‐weight, gravity loads, and side seal and trunnion friction:
2 3.
Gate Open, Gate operating on two hoists. Loads consist of unusual hydrostatic head differential with
gate subjected to self‐weight, gravity loads, and side seal and trunnion friction plus wave or impact,
whichever controls:
Page 64
Fargo Moorhead Metropolitan Area BCOES‐ATR/Sponsor/PDT Review Flood Risk Management Project Diversion Inlet Structure
Appendix F:
DDR_FMM_Diversion_Inlet_Appendix_F_Structural.docx Page F‐58
2 1.2 1.6 1.4 1 1.2 1.6
1.4 1.0 1.0 (Note Q values are from both hoist operating under normal
conditions)
Gate Open, Gate operating on two hoists. Loads consist of extreme hydrostatic head differential with
gate subjected to self‐weight, gravity loads, and side seal and trunnion friction:
2 1.2 1.6 1.4 1 1.4 1.0
(Load Case was used to determine typical load acting on wire ropes)
Gate Open, Gate operating on two hoists. Loads consist of self‐weight, gravity loads, and side seal and
trunnion friction:
2 1.2 1.4 1.0
(Load Case was used as a construction load case for trial operation to determine load acting on trunnion
anchors.)
Unusual Operation
Gate Open, Gate operating on one hoist. Loads consist of unusual hydrostatic head differential with gate
subjected to self‐weight, gravity loads, and side seal and trunnion friction:
3 1.2 1.6 1.4 1 1.4 1.0 1.0
Limit State (Extreme I)
Extreme Operation
Gate Closed. Loads consist of extreme hydrostatic head differential with gate subjected to self weight,
and gravity loads.
4 1.2 1.6 1.4 1
(Identical to Load Case 1a based on water elevations and low seismic activity. Load case omitted from
evaluation.)
Gate Closed. Loads consist of usual hydrostatic head differential with gate subjected to self‐weight,
gravity loads, and earthquake:
Page 65
Fargo Moorhead Metropolitan Area BCOES‐ATR/Sponsor/PDT Review Flood Risk Management Project Diversion Inlet Structure
Appendix F:
DDR_FMM_Diversion_Inlet_Appendix_F_Structural.docx Page F‐59
4 Omittedbecauseareaisnotseismicallyactive.
Loads consist of usual hydrostatic head differential gate subjected to self‐weight, gravity loads, and
maximum hydraulic cylinder OR wire rope forces, whichever is applicable:
5 1.2 1.6 1.2 1 1.2 3
(Highlighted load factor changed due to unlikely event that the surface water elevation will be at 922’
when the gate gets jammed)
Please note that within the Tainter gate model the wire rope pressure received a load combination of
1.0. However, a value of 1.2 should be used for mechanical load, Q, for load case 5.
Gate Fully Opened. Loads consist of self‐weight and gravity loads plus wind or earthquake, whichever
controls:
6 1.2 1.6 1.2 3 1.3
It should be noted that all load cases were increased by a factor of 1.11 to account for the performance
factor in lieu of reducing the capacity of 0.9 in accordance with ETL 1110‐2‐584.
Gate Closed (Extra Load Case
Loads consist of water up to the top of the gates with ice impacting the top of the gate. This load case is
an extreme scenario with all factors set to unity. The intent of the load case was to make sure the gate
was not forced open due to ice impacts.
7 1.0 1.0 1.0 1.0
Loads consist self‐weight and gravity loads. The intent of the load was to determine deflection of gate
during temperature changes.
8 1.2 1.6
Variable Definitions based on EM 1110‐2‐2702 and ETL 1110‐2‐584:
‐ D: Dead load
‐ Fs: Side seal friction load
‐ Ft: Trunnion friction load
‐ G: Gravity loads including mud and ice
‐ Hs1: Hydrostatic load associated with highest water level ever to be expected on Tainter gates
‐ Hs2: Hydrostatic load associated with a 10 year flood event
Page 66
Fargo Moorhead Metropolitan Area BCOES‐ATR/Sponsor/PDT Review Flood Risk Management Project Diversion Inlet Structure
Appendix F:
DDR_FMM_Diversion_Inlet_Appendix_F_Structural.docx Page F‐60
‐ Hs3: Hydrostatic load associated with pool levels that are exceeded up to 50% of the year
(please note that this water level does not reach the Tainter gate skin plate and the gate is
effectively dry on the upstream side)
‐ IM: Ice impact load
‐ Q: Wire rope pressure/load
‐ Q3: Wire rope pressure/load associated with the stall torque of motor hoist
‐ Hd: Wave load or Hydrodynamic load
‐ W: Wind Load
F.3.3 Tainter Gate Material Selection
All members of the gate included rolled shapes and plates will be made from ASTM A709 Gr. 50F3 steel
due to the criticality of the Tainter gates.
F.3.4 Tainter Gate Analysis and Results
F.3.4.1 Analysis Summary
The design capacity ratio (DCR) of the framing members has been provided in Table F‐18. A DCR value
below 1.0 is considered acceptable by AISC 14th Edition and ETL 1110‐2‐584. The DCR values are based
on the interaction of both axial and bending moment forces for the framing members, while the plate
members DCR values are based on the yielding limit state with the demands from a Von Mises stress
distribution. Within the table, Red indicates the DCR value has exceeded 1.0. Orange, Yellow, and Green
indicate DCR value ranges with Orange illuminating the range between 0.9‐0.99, Yellow illuminating the
range between 0.8‐0.89, and Green illuminating the range between 0.7‐0.79. The color scale was
provided to allow designers and reviewers to quickly determine, which areas of the Tainter gate were
being heavily loaded or overloaded for a given load case. The inputs provided were taken directly out of
SAP2000, which uses the “Direct Analysis Method” as described in Appendix 7 of the AISC manual. The
“Direct Analysis Method” eliminates the use of different “K” or effective length factors for columns or
beams by using a secondary elastic analysis, which considers both P‐ δ and P‐Δ effects, notional loads,
reduced flexural stiffness, and reduced axial stiffness. These values were verified to be accurate and
suitable for use with a MathCAD hand calculation, which has been provided in the appendix.
Page 67
Fargo Moorhead Metropolitan Area BCOES‐ATR/Sponsor/PDT Review Flood Risk Management Project Diversion Inlet Structure
Appendix F:
DDR_FMM_Diversion_Inlet_Appendix_F_Structural.docx Page F‐61
Table F‐18 Member DCR Values for Combined Axial and Bending Loads
MEMBER SIZE
DCR (P/M)
LC1 LC1b Ice LC1b Wave LC2b Ice
LC2b Wave
LC3 LC5 LC6 US & DS
LC7 LC8
Strut TR W12X106 0.39 0.59 0.41 0.92 0.63 0.65 0.26 0.07 ‐ ‐
Strut BR W12X106 0.55 0.38 0.55 0.81 0.79 0.64 0.50 0.05 ‐ ‐
Strut TL W12X106 0.39 0.58 0.41 0.92 0.63 0.76 0.78 0.07 ‐ ‐
Strut BL W12X106 0.54 0.37 0.55 0.82 0.79 0.92 0.44 0.05 ‐ ‐
(V) Strut Brace RF W12X40 0.12 0.19 0.10 0.23 0.07 0.29 0.10 0.04 ‐ ‐
(V) Strut Brace LF W12X40 0.11 0.11 0.09 0.14 0.11 0.12 0.25 0.04 ‐ ‐
(D) Strut Brace R W12X40 0.09 0.18 0.10 0.22 0.07 0.33 0.10 0.02 ‐ ‐
(D) Strut Brace L W12X40 0.09 0.07 0.11 0.10 0.10 0.21 0.22 0.02 ‐ ‐
(V) Strut Brace RB W12X40 0.07 0.18 0.14 0.23 0.17 0.21 0.06 0.01 ‐ ‐
(V) Strut Brace LB W12X40 0.07 0.04 0.07 0.05 0.07 0.30 0.07 0.01 ‐ ‐
(DST) Brace L5X5X1/2 0.06 0.35 0.24 0.36 0.29 0.62 0.52 0.07 ‐ ‐
Girder T W27X235 0.37 0.70 0.43 0.78 0.48 0.49 0.45 0.10 ‐ ‐
Girder B W27X235 0.65 0.48 0.65 0.55 0.71 0.93 0.45 0.05 ‐ ‐
Built up Rib Skin Plate WT9X23 ‐ ‐ ‐ 0.96 ‐ ‐ ‐ ‐ ‐ ‐
Built up Rib Skin Plate WT9X53 ‐ ‐ ‐ ‐ 0.62 ‐ 1.02 ‐ ‐ ‐
Skin Plate PL 1/2 0.55 ‐ ‐ 0.88 0.56 1.04 0.89 0.30 ‐ ‐
(Facing Downstream), T= Top, L=Left, M=Middle, B=Bottom, F=Front, R=Right, V=Vertical, D=Diagonal, DST=Downstream Truss
The results at the trunnion support under unfactored and factored conditions is provided in Table F‐19
and Table F‐20 :
Page 68
Fargo Moorhead Metropolitan Area BCOES‐ATR/Sponsor/PDT Review Flood Risk Management Project Diversion Inlet Structure
Appendix F:
DDR_FMM_Diversion_Inlet_Appendix_F_Structural.docx Page F‐62
Table F‐19 Tainter Gate Strut Arm Support Reactions Unfactored
Tainter Gate Strut Arm Support Reactions (Unfactored)
Load Case
Force X Axis
Force Y Axis
Force Z Axis Moment X
(Kip*ft) Moment Y
(Kip*ft) Moment Z (Kip*ft)
(Kip) (Kip) (Kip)
LC1b (Ice) (LS) ‐497 ‐208 ‐187 0 0 4
LC2b (Ice) (LS) ‐524 ‐224 ‐202 0 ‐168 59
LC2b (Wave) (LS) ‐432 ‐193 ‐221 0 ‐149 49
LC3 (LS) ‐485 ‐216 ‐268 0 ‐164 19
LC3 (RS) ‐350 159 ‐178 0 ‐118 ‐72
LC5 (LS) ‐497 ‐205 ‐177 0 0 ‐9
LC5 (RS) ‐346 158 ‐204 0 0 ‐3
LC6 (US) (LS) 15 7 ‐7 0 0 ‐6
LC6(DS) (LS) ‐35 ‐21 45 0 0 2
USDS = X AXIS
CC = Y AXIS
Page 69
Fargo Moorhead Metropolitan Area BCOES‐ATR/Sponsor/PDT Review Flood Risk Management Project Diversion Inlet Structure
Appendix F:
DDR_FMM_Diversion_Inlet_Appendix_F_Structural.docx Page F‐63
VERTICAL =Z AXIS
RS = Right Side
LS = Left Side
Table F‐20 Tainter Gate Strut Arm Support Reactions Factored
Tainter Gate Strut Arm Support Reactions (Factored)
Load Case Force X Axis Force Y Axis Force Z Axis Moment X
(Kip*ft) Moment Y
(Kip*ft) Moment Z (Kip*ft) (Kip) (Kip) (Kip)
LC1b (Ice) (LS)
‐729 ‐304 ‐264 0 0 6
LC2b (Ice) (LS)
‐756 ‐321 ‐282 0 ‐242 85
LC2b (Wave) (LS)
‐597 ‐268 ‐310 0 ‐202 69
LC3 (LS) ‐684 ‐304 ‐367 0 ‐231 39
LC3 (RS) ‐486 223 ‐261 0 ‐164 ‐90
LC5 (LS) ‐607 ‐250 ‐215 0 0 ‐11
LC5 (RS) ‐414 188 ‐245 0 0 ‐3
LC6 (US) (LS) 19 9 ‐9 0 0 ‐6
LC6(DS) (LS) ‐42 ‐26 55 0 0 1
USDS = X
AXIS
CC = Y AXIS
Page 70
Fargo Moorhead Metropolitan Area BCOES‐ATR/Sponsor/PDT Review Flood Risk Management Project Diversion Inlet Structure
Appendix F:
DDR_FMM_Diversion_Inlet_Appendix_F_Structural.docx Page F‐64
VERTICAL =Z AXIS
RS = Right
Side
LS = Left Side
F.3.4.2 Discussion of Results
Governing load cases for the various members can be seen in the table above. The selection of the
horizontal girders (W27X235) was based in part on the width of the flanges, which allowed the
W12X106 strut arms to frame into the girders without any overhang. In addition, the width of the girder
flanges allowed enough clearance for the welds to be wrapped. A W12X40 was selected as the bracing
member of the strut arms based on its similar depth, which allowed for a fixed moment connection
between the two flanges. The downstream cross bracing members governing DCR value was 0.62. The
built up rib section governing DCR value was found to be 1.02. Although this exceeds the allowable limit,
the load case is extreme and 2% overstress was deemed acceptable.
The skin plate stresses for several load cases were found to be high in a few locations. However, it is
important to note that these high stresses are not widespread and only occur in concentrated areas
such as where the gate is being supported by the cables. It is possible that some local yielding will occur
on the skin plate during the load cases in which the gate is jammed or lifted on a single side. However,
the results indicated that Von Mises stresses are below the yield stress of the gate. Figure F‐30, Figure F‐
31, and Figure F‐32 provide Von Mises stress contours for the skin plate and show where stress values
were taken to compare to design checks. Figure F‐33, Figure F‐34, and Figure F‐35 illustrate the
deflected shape of the Tainter gate, axial loads in strut arms, and bending moment in horizontal girders
for load case 2b. In addition, the deflected shape of the Tainter gate for load case 3 has also been
provided in Figure F‐36. The final estimated gate weight was determined to be 95 kips.
Page 71
Fargo Moorhead Metropolitan Area BCOES‐ATR/Sponsor/PDT Review Flood Risk Management Project Diversion Inlet Structure
Appendix F:
DDR_FMM_Diversion_Inlet_Appendix_F_Structural.docx Page F‐65
Figure F‐30 Skin Plate Von Mises Stress Distribution Load Case 2b Ice (Selected Max Stress
Circled)
Figure F‐31 Skin Plate Von Mises Stress Distribution Load Case 3 (Selected Max Stress Circled)
Location of
Applied Ice
Impact loads
Lower stresses due to
increase in steel thickness
from wear plate
Location of
Increased Wire
Pressure Load from
Single Sided Lift,
stresses are lower
due to increase in
thickness from the
wear plate.
Page 72
Fargo Moorhead Metropolitan Area BCOES‐ATR/Sponsor/PDT Review Flood Risk Management Project Diversion Inlet Structure
Appendix F:
DDR_FMM_Diversion_Inlet_Appendix_F_Structural.docx Page F‐66
Figure F‐32 Skin Plate Von Mises Stress Distribution Load Case 5 (Selected Max Stress Circled)
Figure F‐33 Deflected shape of Tainter gate for Load Case 2b
Location of
Increased Wire
Pressure Load
from Stall
Torque of
Motor
Location of Stall Torque
Lifting Tension Load
Page 73
Fargo Moorhead Metropolitan Area BCOES‐ATR/Sponsor/PDT Review Flood Risk Management Project Diversion Inlet Structure
Appendix F:
DDR_FMM_Diversion_Inlet_Appendix_F_Structural.docx Page F‐67
Figure F‐34 Bending moment diagram in strut arms load case 2b (ice)
Figure F‐35 Axial load diagram in strut arms load case 2b (ice)
Page 74
Fargo Moorhead Metropolitan Area BCOES‐ATR/Sponsor/PDT Review Flood Risk Management Project Diversion Inlet Structure
Appendix F:
DDR_FMM_Diversion_Inlet_Appendix_F_Structural.docx Page F‐68
Figure F‐36 Deflected shape of Tainter gate for Load Case 3
Load case 7 was evaluated to determine how the gate would respond to a full head of water and ice
impacting the very top of the gate. The concern was that this loading condition could lead to the gate
being forced open. Given that the primary objective of load case 7 is the entire gate’s behavior and not a
single member’s design, the DCR results of the various structural members are not presented. The same
can be said with the temperature study of the gate, Load case 8. The result of the unfactored Load case
7 determined that the gate does not lift completely off the sill beam and that this particular loading
condition is not enough to force the gate open, however excessive leakage could be expected.
F.3.4.3 Deflection of Gate from Temperature
The deflection of the gate under a maximum and minimum temperature condition was evaluated in
order to determine the appropriate clear space between the bumper and embed pl, and to investigate
any disruption to the seal preset. The guidance of AASHTO LRFD Bridge Design 2012 was used to select
the temperature range. Table 3.12.2.1‐1 was followed and a cold climate was assumed. This provided a
temperature range between ‐30 deg F to 120 deg F for Steel. Both sets of values were inputted into
SAP2000 and the entire model was subjected to both ‐30 deg and 120 deg with dead load acting on the
gate only. The upper right upstream skin plate node was selected to determine the absolute total
deflection change between the temperatures of ‐30 deg and 120 deg. The total calculated change in
deflection was determined to be Abs(0.2333 ‐ (‐0.0573)) = 0.2906in. From this result, using a ½” clear
space on either side of the gate is conservative and will not jam the gate under extreme temperature
conditions. In regards to the seal preset (0.25”), the preset was assumed to occur at a temperature of 70
deg F. Under this initial condition, the difference between the Max and Min temperatures will cause a
preset value of (0.2333”(120deg)‐0.1364”(70deg)) + 0.25”(Preset) = 0.3469” and ‐ (0.1364”(70 deg)‐ ‐
0.0573”(‐30deg)) + 0.25” (Preset) = 0.0.0563” respectively. Because both values remain positive, this
Page 75
Fargo Moorhead Metropolitan Area BCOES‐ATR/Sponsor/PDT Review Flood Risk Management Project Diversion Inlet Structure
Appendix F:
DDR_FMM_Diversion_Inlet_Appendix_F_Structural.docx Page F‐69
indicates that the seal will remain in contact with the side seal embed plates and provide a functional
seal. The expansion and contraction of the seal itself was not considered in the aforementioned
temperature analysis because the side seal embed plates will be embedded into the pier with heaters to
help prevent the seal from freezing and causing the gate to jam or stick. The low number (0.0563”) could
mean 0 preset just due to tolerances; however, the orientation of the seal will allow closure of any gaps
once a nominal amount of hydrostatic pressure is exerted on the seal. Seems like this analysis shows a
¼” preset is adequate for side seals. Some amount of leakage is to be expected anyway.
F.3.4.4 Deflection of Gate Under Loads
Table F‐21 presents the various deflections for different load cases:
Table F‐21 Tainter Gate Deflections
Load Case
Deflection Table
Bottom Girder Outside Edge (in)
Bottom Girder Center Line (in)
Skin Pl Bottom Centerline (in)
LC1b 0.19 Abs 0.37 Abs 0.21 H, 0.24 V
LC2b (Ice) 0.18 Abs 0.39 Abs 0.40 H, 0.15 V
LC2b (Wave) 0.20 Abs 0.49 Abs 0.48 H, 0.17 V
LC3 0.34 Abs 0.53 Abs 2.07 H, ‐1.21 V
LC4b 0.19 Abs 0.37 Abs 0.21 H, 0.24 V
LC5 0.34 Abs 0.53 Abs 1.81 H, ‐0.98 V
LC6 (WDS) 0.08 Abs 0.14 Abs 0.03 H, ‐0.14 V
LC7 0.13 Abs 0.34 Abs 0.22 H, 0.25V
LC8 ‐ ‐ ‐
H = Horizontal deflection in the DS direction
V = Vertical deflection
WDS = Gate deflection from Wind blowing in the DS direction
Abs = Absolute deflection
F.3.4.5 Tainter Gate Design Discussion
The Tainter gate design and member layout was based in part on the Baldhill Tainter gates, which were
similar in size. During the initial analysis, it was determined that a 2 strut arm gate versus a 3 strut arm
gate would be both feasible and economical. The strut arms were positioned to share the load and cut
down on the unbrace cantilever length of the top rib members. Radius plates were also used throughout
the gate based in part on the recommendations of Fish & Associates (2011), to mitigate fatigue and
fracture issues, and guidance from senior engineers. For simplicity and efficiency, the skin plate was
Page 76
Fargo Moorhead Metropolitan Area BCOES‐ATR/Sponsor/PDT Review Flood Risk Management Project Diversion Inlet Structure
Appendix F:
DDR_FMM_Diversion_Inlet_Appendix_F_Structural.docx Page F‐70
designed with one uniform thickness versus decreasing the thickness along the height of the gate.
Stiffeners were placed at the location where the strut arms connect to the horizontal girder and behind
the ribs that resist wire rope loads. Stiffeners were also placed along all the ribs where the horizontal
girders are connected and at the ends of the girders to allow for mounting of the bumper assemblies.
In regards to the connections all strut arm to horizontal girder connections received a complete joint
penetration weld along with connections made to the braces and the transition hub. Welded
connections at these critical locations will have more resistance to corrosion attack over the design life
of the gate. Several nondestructive tests have also been called out to be performed on all critical welds
to help insure defects are found and removed. These tests include visual testing, ultrasonic testing,
phased array testing, and magnetic particle testing. The downstream truss connection will be bolted
using high strength bolts that are fully tensioned, but not slip critical. The ribs will be fillet welded to the
skin plate and the horizontal girder will be fillet welded to the ribs. The welding of the horizontal girder
to the ribs was selected over the bolts for improved corrosion resistance. Bolted connections can over
time be susceptible to pack rust or rust wedging.
Due to the size of the weld access holes, additional drain holes were not detailed into the horizontal
girders or strut arms. Drain holes were provided on either side of the Tainter gate at the base where the
side seal connects to the outside rib. This should allow any water that collects at the bottom of the gate
to drain freely.
Because the gate may see water and debris on either side, it was decided to paint the entire gate with
system 5‐E‐Z versus the upstream face of the skin plate with system 5‐E‐Z and the downstream side of
the skin plate with system 3‐A‐Z. According to ERDC’s paint center of expertise, the system 5‐E‐Z is ideal
for resisting corrosion attach and abrasion from debris; due to this quality it seemed logical to paint the
entire gate with this system. It is important to note that the specified paint system also holds up very
well to cold climates.
Although some tolerances with regards to member length are provided in the specification 05 59 13
Fabrication of Hydraulic Structures, additional tolerances were specified to the ribs and skin plate to
avoid fit up issues. However, specifying tight tolerances may not preclude all fit up issues and shims may
still be needed to properly align the horizontal girder to the ribs. Oregon Iron Works was contacted
regarding the rib to horizontal girder fit up and it was recommended to put on the drawings an overall
height tolerance for the ribs to help avoid fabrication issues.
Figure F‐37 and Figure F‐38 illustrate some of the final design details for the Tainter gates.
Page 77
Fargo Moorhead Metropolitan Area BCOES‐ATR/Sponsor/PDT Review Flood Risk Management Project Diversion Inlet Structure
Appendix F:
DDR_FMM_Diversion_Inlet_Appendix_F_Structural.docx Page F‐71
Figure F‐37 Side Elevation View of the Tainter Gate
Page 78
Fargo Moorhead Metropolitan Area BCOES‐ATR/Sponsor/PDT Review Flood Risk Management Project Diversion Inlet Structure
Appendix F:
DDR_FMM_Diversion_Inlet_Appendix_F_Structural.docx Page F‐72
Figure F‐38 Typical Weld Details on the Tainter Gate
F.3.5 Tainter Gate Trunnion Transition Hub
F.3.5.1 Trunnion Transition Hub Finite Element Model Description & Assumptions
A 3D finite element model was created for the trunnion transition hub to determine the thickness of the
flange and web plates framing into it. The model was created by meshing the hub, flange plates, and
web plates in autoCAD as 3D faces. The stiffness of the gap links were estimated by using the tributary
area of either the trunnion hub, which were the same, the thickness or length of the bearing (which was
assumed), and the compression modulus of the bearing material (500,000psi according to CIP brochure
provided by sales representative). Several boundary conditions / restraints were incorporated into the
model. The outside faces of the hub were fully fixed in order to accurately capture the behavior of the
transition plates as they underwent bending between a fixed point at the transition hub and the strut
arms. The figures below show the final model created in SAP2000. It is important to note that the results
from the model in regards to the trunnion hub were not recorded due to the various boundary
conditions assigned in the model, which would created unrealistic stress singularities. The hub was
evaluated using hand calculations and the procedure described in EM 1110‐2‐2702 and ETL 1110‐2‐584,
in which a portion of the hub is idealized as a cantilever section. Figure F‐39 illustrates the model
created for the trunnion transition hub.
Page 79
Fargo Moorhead Metropolitan Area BCOES‐ATR/Sponsor/PDT Review Flood Risk Management Project Diversion Inlet Structure
Appendix F:
DDR_FMM_Diversion_Inlet_Appendix_F_Structural.docx Page F‐73
Figure F‐39 Realistic View of Trunnion Transition Hub
F.3.5.2 Trunnion Transition Hub Loads / Demands
The loads applied to the trunnion transition hub model came directly from the Tainter gate models at
the point where the strut arms frame elements connect to the simulated transition hub. The demands at
this point were recorded for all of the load cases and were taken from the unfactored runs in order to
comply with the recommendation of ETL 1110‐2‐584, which recommends that the trunnion transition
hub be designed under ASD load cases with all load factors set to 1.0. The loads were applied in the
model as a joint load at each end joint of the strut arm framing member. Table F‐22 and
Page 80
Fargo Moorhead Metropolitan Area BCOES‐ATR/Sponsor/PDT Review Flood Risk Management Project Diversion Inlet Structure
Appendix F:
DDR_FMM_Diversion_Inlet_Appendix_F_Structural.docx Page F‐74
Table F‐23 illustrate all of the applied loads to the trunnion transition model for the various load cases.
Table F‐22 Loads Applied to Trunnion Transition Hub (ASD values)
Tainter Gate Trunnion Transition Hub Demands (ASD)
Load Case
Force X Axis Force Y Axis Force Z Axis Moment X (Kip*ft)
Moment Y (Kip*ft)
Moment Z (Kip*ft)
(Kip) (Kip) (Kip)
LC1 (Top) 321.997 120.686 31.67 ‐0.4674 ‐0.1234 4.8532
LC1 (Bot) 174.765 87.199 155.711 ‐6.2039 4.1739 4.6149
LC2b (Ice) (Top)
359.082 132.683 43.676 ‐23.7038 56.5901 31.4405
LC2b (Ice) (Bot)
164.243 90.594 158.902 21.6085 75.5566 ‐65.514
LC2c (Wave) (Top)
229.715 84.216 30.362 ‐21.0256 50.4292 26.827
LC2c (Wave) (Bot)
202.197 108.72 190.866 18.9879 64.1413 ‐56.3327
LC3 (LS) (Top) 234.921 81.643 32.231 ‐25.8195 56.132 54.971
LC3 (LS) (Bot) 249.341 134.032 235.558 21.2252 70.0336 ‐61.8716
LC4b (Top) 335.107 122.989 33.283 ‐1.1392 ‐0.3092 12.2082
LC4b (Bot) 161.376 81.937 143.969 ‐6.7589 1.8508 6.5099
LC5 (Top) 321.997 120.686 31.67 ‐0.4674 ‐0.1234 4.8532
LC5 (Bot) 174.765 87.199 155.711 ‐6.2039 4.1739 4.6149
Page 81
Fargo Moorhead Metropolitan Area BCOES‐ATR/Sponsor/PDT Review Flood Risk Management Project Diversion Inlet Structure
Appendix F:
DDR_FMM_Diversion_Inlet_Appendix_F_Structural.docx Page F‐75
Table F‐23 Loads Applied to Trunnion Transition Hub (LRFD values)
Tainter Gate Trunnion Transition Hub Demands (LRFD)
Load Case Force X Axis Force Y Axis Force Z Axis Moment X
(Kip*ft) Moment Y (Kip*ft)
Moment Z (Kip*ft) (Kip) (Kip) (Kip)
LC1 (Top) 485.613 182.063 47.799 ‐0.7099 ‐0.1917 7.4234
LC1 (Bot) 243.066 121.304 216.747 ‐9.0326 6.3053 6.5975
LC2b (Ice) (Top)
531.888 196.79 64.541 ‐34.9001 83.5929 45.2339
LC2b (Ice) (Bot)
223.715 124.19 218.003 31.2443 112.1314 ‐96.3194
LC2c (Wave) (Top)
311.202 114.205 41.355 ‐29.0003 69.794 36.046
LC2c (Wave) (Bot)
285.029 152.976 268.648 25.9217 88.2515 ‐77.286
LC3 (LS) (Top) 346.69 122.745 47.615 ‐36.0533 80.5574 68.5752
LC3 (LS) (Bot) 336.762 180.962 319.48 31.1872 100.8738 ‐89.8818
LC4b (Top) 410.64 150.744 40.742 ‐1.4649 ‐0.2394 15.1449
LC4b (Bot) 195.49 99.165 174.362 ‐8.2153 2.2879 7.8916
LC5 (Top) 485.613 182.063 47.799 ‐0.7099 ‐0.1917 7.4234
LC5 (Bot) 243.066 121.304 216.747 ‐9.0326 6.3053 6.5975
F.3.5.3 Trunnion Transition Hub Results
The results of the finite element model were evaluated based on the Von Mises stress distribution
(Yielding criterion), and helped determine if the assumed hug diameter and wall thickness were
adequate. The trunnion hub had an outside diameter of 24.0” and a wall thickness of 3.25”. The flange
and web plates received a thickness of 1.5” and 0.75” respectively. The hub was assumed to be a forging
that was made from ASTM A105 or ASTM A106 Gr. C steel and have minimum required yield strength
Page 82
Fargo Moorhead Metropolitan Area BCOES‐ATR/Sponsor/PDT Review Flood Risk Management Project Diversion Inlet Structure
Appendix F:
DDR_FMM_Diversion_Inlet_Appendix_F_Structural.docx Page F‐76
between 36‐40 ksi. The flange and web plates were assumed to be made from ASTM A709 Gr. 50 steel.
The results of the Von Mises stress distribution for the various load cases have been illustrated in Figure
F‐40 through Figure F‐48 for the trunnion hub, flange plates, and web plates. Please note that the
trunnion hub was evaluated using ASD load factors set to 1.0 per ETL 1110‐2‐584, while the flange and
web plates were evaluated using the LRFD load factors prescribed by the Tainter gate load cases.
Figure F‐40 Load Case 1b (LRFD; units in KSI)
Figure F‐41 Load Case 2b Ice (LRFD; units in KSI)
Page 83
Fargo Moorhead Metropolitan Area BCOES‐ATR/Sponsor/PDT Review Flood Risk Management Project Diversion Inlet Structure
Appendix F:
DDR_FMM_Diversion_Inlet_Appendix_F_Structural.docx Page F‐77
Figure F‐42 Load Case 2b Wave (LRFD; units in KSI)
Figure F‐43 Load Case 3 (LRFD; units in KSI)
Page 84
Fargo Moorhead Metropolitan Area BCOES‐ATR/Sponsor/PDT Review Flood Risk Management Project Diversion Inlet Structure
Appendix F:
DDR_FMM_Diversion_Inlet_Appendix_F_Structural.docx Page F‐78
Figure F‐44 Load Case 5 (LRFD; units in KSI)
Figure F‐45 Von Mises Stress Contours in Web Plates for Load Case 1b (LRFD, Units in ksi)
Page 85
Fargo Moorhead Metropolitan Area BCOES‐ATR/Sponsor/PDT Review Flood Risk Management Project Diversion Inlet Structure
Appendix F:
DDR_FMM_Diversion_Inlet_Appendix_F_Structural.docx Page F‐79
Figure F‐46 Von Mises Stress Contours in Web Plates for Load Case 2b Ice (LRFD, Units in ksi)
Figure F‐47 Von Mises Stress Contours in Web Plates for Load Case 3 (LRFD, Units in ksi)
Page 86
Fargo Moorhead Metropolitan Area BCOES‐ATR/Sponsor/PDT Review Flood Risk Management Project Diversion Inlet Structure
Appendix F:
DDR_FMM_Diversion_Inlet_Appendix_F_Structural.docx Page F‐80
Figure F‐48 Von Mises Stress Contours in Web Plates for Load Case 5 (LRFD, Units in ksi)
The results from the various load cases were separated into various member sections and the DCR
values inputted into Table F‐24. For the Flange and Web plates the capacity was determined by taking
the yield strength of the steel (50ksi) and multiplying it by a 0.9 reduction factor to get a limiting stress
value of 45ksi. For the trunnion hub forging a limiting stress value of 18 ksi was used based on ETL‐1110‐
2‐584, which prescribes that a limiting value of 0.5*F.y be used.
Table F‐24 Von Mises Stress Distribution within Trunnion Transition Hub
Load Case
DCR (Von Mises Stress Distribution)
Flange PL (LRFD) Web PL (LRFD) Hub
(Load factor of 1)
LC1b 0.40 0.25 ‐
LC2b_Ice 0.44 0.34 0.41
(Governing Case)
LC2b_Wave 0.38 0.29 ‐
LC3 0.42 0.34 ‐
LC5 0.31 0.25 ‐
Flange Pl = 1.5", Web Pl = 0.75", and Hub = 24" OD & 3.25" thk; ASTM A709 Gr. 50 = Flange PL, Web PL; ASTM A105, ASTM A106 Gr. C = Hub
Page 87
Fargo Moorhead Metropolitan Area BCOES‐ATR/Sponsor/PDT Review Flood Risk Management Project Diversion Inlet Structure
Appendix F:
DDR_FMM_Diversion_Inlet_Appendix_F_Structural.docx Page F‐81
From the results of the trunnion transition hub analysis, the thickness of the hub, flange plates, and web
plates are adequate to resist the various load cases. Please note that the values selected for the
tabulated values were based on element stresses with stress averaging turned off to determine the peak
stress on the element. The focus of the analysis was put on the Von Mises stress yielding criterion
because the thickness of both the web and flanges were increase beyond that of the strut arm to
preclude lateral torsional buckling failure modes from occurring. Stress concentrations were both
observed and anticipated to occur at the locations where the loads were applied and where the
constraints were assigned. These values were ignored when selecting the max stresses. It was
anticipated that the flanges of the transition hub would carry the majority of the axial load given their
increased stiffness compared to the web. This prediction was confirmed based on the stresses contours
found along the hub forging. To help determine if the loads applied to the model were in the right
direction the deflected shape was reviewed and observed to be deflecting in the appropriate direction.
The shape of the deflected model is largely based on the bending moment loads assigned at the ends of
the strut arms, which came from the trunnion friction moment from the SAP2000 3D Tainter gate
models. The deflected shape of the model has been provided below. Stresses overall within the trunnion
transition hub and forging were found to be acceptable and within all recommended COE guidance. It is
anticipated that the transition hub will perform well when the gate is operated.
Figure F‐49 Deflected Shape of Transition Hub
F.3.5.4 Trunnion Transition Hub Design Discussion
The hub of the trunnion transition hub is a forging from ASTM A105 or ASTM A106 Gr. B material. The
forging was specified to have toughness requirements that matched those of ASTM A709 Gr. 50F3. Prior
to any welding, the forging is required to undergo supplemental ultrasonic testing in accordance with
Page 88
Fargo Moorhead Metropolitan Area BCOES‐ATR/Sponsor/PDT Review Flood Risk Management Project Diversion Inlet Structure
Appendix F:
DDR_FMM_Diversion_Inlet_Appendix_F_Structural.docx Page F‐82
ASTM A388 to insure there are no defects present in the material, which could become more
pronounced or worse when large amounts of heat are introduced during welding of the flange and web
plates. In addition, the forging is required to be heat treated per AWS D1.5. Attached on the outer face
of the ring forging, is a stainless steel ring. This ring serves as the contact surface between the thrust
washer, which is a composite material by Columbia Industrial Products, and the hub. In order to achieve
a low coefficient of friction, between the hub and thrust washer it is recommended that the ring be
stainless steel. The contractor is required to submit a procedure qualification record or PQR that
demonstrates they can successfully weld the stainless steel ring to the hub. This type of welding has
been done before on several projects by the Portland district. This detail was submitted for review to
the Center of Expertise in Welding at Portland District and comments provided to accurately call out all
necessary steps to successfully weld the two components together. Please note that that the stainless
steel ring was called out to receive a very smooth surface finish to help achieve manufacturer friction
coefficient values. In addition, the outer surface of the stainless steel ring will receive System 4 paint
coating compared to the rest of the trunnion transition hub, which will use a System 5‐E‐Z. This coating
is better suited for stainless steel and was recommended by the Paint Center of Expertise. The flanges
and web plates of the trunnion transition hub were called out to be ASTM A709 Gr. 50F3 and will be
complete joint penetration welded to the forging. Figure F‐50 illustrates the final design detail of the
trunnion transition hub.
Figure F‐50 Trunnion Transition Hub Layout
Page 89
Fargo Moorhead Metropolitan Area BCOES‐ATR/Sponsor/PDT Review Flood Risk Management Project Diversion Inlet Structure
Appendix F:
DDR_FMM_Diversion_Inlet_Appendix_F_Structural.docx Page F‐83
F.3.6 Tainter Gate Trunnion Assembly
F.3.6.1 Finite Element Model Description & Assumptions
The trunnion assembly was first drawn in AutoCAD as 3D faces and then imported into SAP2000 to be
extruded into solids. Solid elements were selected based on results and recommendations presented on
similar trunnion assemblies for the Folsom Auxiliary Dam JFP Ph. III and the New Hogan Dam retrofit
project. The sections that were extruded into solids included the trunnion yoke plates, pin, stiffeners,
and base plate. Nonlinear links were also used to help capture the interface stiffness of various
materials. The stiffness values were calculated as follows: (Please note because area springs were used a
unit area of 1 in2 was inputted as a place holder due to SAP2000 automatically calculating the area for
each element.)
Pier Bearing Plate (PR_BRG_PL) =1066 kip/in (E = 533 ksi, Chockfast Orange)
Base Plate Bearing Surface (BS_PL_GP_LNK) =1200 kip/in (E = 6000ksi, Nonshrink Grout)
The model’s boundary conditions consisted of pin supports at the anchors. Specifically, the pin supports
were restrained against translation along all 3 axis. Figure F‐51 illustrates the final model constructed
and used for analysis.
Figure F‐51 Layout of Trunnion Assemly, Realistic and Model View
F.3.6.2 Applied Loading
Loads were applied to the model at a loading node (LDG_ND), which represents the location that the
two struts arms local axes intersect. The global reactionary forces (XZ) were applied to this node from
the various Tainter gate load cases. The thrust force from the hub was applied to the yoke plate as a
surface pressure. Because rotational forces/ bending moment cannot be applied to solids, the bending
moments along the Y axis from trunnion friction and Z axis, were broken up into components and
applied to the yoke plates. In the case of the trunnion friction moment, the couples were applied to a
Page 90
Fargo Moorhead Metropolitan Area BCOES‐ATR/Sponsor/PDT Review Flood Risk Management Project Diversion Inlet Structure
Appendix F:
DDR_FMM_Diversion_Inlet_Appendix_F_Structural.docx Page F‐84
tributary section of the yoke plates based on the location of the key plates anchors. This loading
application seemed logical as the load path would progress from the pin, to the keeper plate, and finally
to the keeper plate anchors. Figure F‐52 through Figure F‐56 illustrate the applied loads to the model.
Figure F‐52 Loads Applied to Loading Node
Figure F‐53 Thrust Force Applied to Surface of Yoke Plate
Page 91
Fargo Moorhead Metropolitan Area BCOES‐ATR/Sponsor/PDT Review Flood Risk Management Project Diversion Inlet Structure
Appendix F:
DDR_FMM_Diversion_Inlet_Appendix_F_Structural.docx Page F‐85
Figure F‐54 Moment Couple Applied to Yoke Plates from Trunnion Pin Friction
Figure F‐55 Friction from Thrust Washer
Page 92
Fargo Moorhead Metropolitan Area BCOES‐ATR/Sponsor/PDT Review Flood Risk Management Project Diversion Inlet Structure
Appendix F:
DDR_FMM_Diversion_Inlet_Appendix_F_Structural.docx Page F‐86
Figure F‐56 Half of the Couple from the MZ Reaction
F.3.6.3 Results of the Yield Limit State
The results from the trunnion assembly analysis used a Von Mises stress distribution to evaluate the
various members stress values. The results and applied loads were based on a load factor of 1.0 and
performance factor of 1.33 per ETL 1110‐2‐584. The trunnion assembly yoke plates are ASTM A709 Gr.
70W, while the base plate and stiffener plates are ASTM A709 Gr. 50. The maximum limiting value for
the yoke plates was determined to be 41.92 ksi. The maximum limiting value for the base plate and
stiffener plates was determined to be 29.94 ksi. Both of these are based on a reduction factor of 1.67
from ASD criteria. The primary controlling load cases for the various plate sections included LC2 with an
Ice impact, LC3 (single hoist), and LC5 (gate jammed). Table F‐25 and figures that follow illustrate the
final results.
Table F‐25 Trunnion Assembly DCR Value Results
Load Case
Stresses and DCR Values Based on Von Mises Stress Distribution
Yoke PL (ksi) Yoke PL (DCR) Stiffener PL (ksi) Stiffener PL (DCR) Base PL (ksi)
Base PL (DCR)
LC1b 38.96 0.93 9.09 0.30 7.52 0.25
LC2b 41.70 0.99 11.31 0.38 6.92 0.23
LC3 41.00 0.98 12.53 0.42 6.44 0.22
LC5 37.53 0.89 10.03 0.34 9.39 0.31
Yoke PL = ASTM A709 Gr. 70W, Stiffener PL & Base PL = ASTM A709 Gr. 50
Page 93
Fargo Moorhead Metropolitan Area BCOES‐ATR/Sponsor/PDT Review Flood Risk Management Project Diversion Inlet Structure
Appendix F:
DDR_FMM_Diversion_Inlet_Appendix_F_Structural.docx Page F‐87
Figure F‐57 Stiffener and Base Plate Von Mises Stress Distribution LC5 Downstream View
Figure F‐58 LC2_ICE Von Mises Stress Distribution in Yoke Plate
Page 94
Fargo Moorhead Metropolitan Area BCOES‐ATR/Sponsor/PDT Review Flood Risk Management Project Diversion Inlet Structure
Appendix F:
DDR_FMM_Diversion_Inlet_Appendix_F_Structural.docx Page F‐88
Figure F‐59 LC3 Von Mises Stress Distribution in Yoke Plate
Figure F‐60 LC5 Von Mises Stress Distribution in Yoke Plate
Page 95
Fargo Moorhead Metropolitan Area BCOES‐ATR/Sponsor/PDT Review Flood Risk Management Project Diversion Inlet Structure
Appendix F:
DDR_FMM_Diversion_Inlet_Appendix_F_Structural.docx Page F‐89
Figure F‐61 Ice Von Mises Stress Distribution in Yoke Plate (Zoomed in)
During the analysis, the yoke plates were found to be challenging to design and size such that they
would achieve acceptable DCR values. The configuration of the yoke plates appeared to cause a stress
riser on the inside edge of the left downstream plate. This stress concentration illustrated above in LC5,
was found not to be widespread and deemed acceptable given the rarity of this extreme load case. All
load cases were found to be elevated, but under the recommended stress limit.
The pin supports on the base plate caused several unrealistically high stress concentrations around the
joints. In order to evaluate the other areas of the base plate besides the anchor locations, the solid
elements around the pin supports were removed. The remaining solid elements within both the base
plate and stiffener plate were found to have acceptable DCR values.
Based on the reactions of LC2c and LC4b, by inspection these load cases would not govern the design,
and were therefore not evaluated in order to expedite the trunnion assembly’s design.
The trunnion assembly model was also used to design the trunnion anchors. The trunnion anchors
consist of through bolts, which pass through the trunnion girder and are anchored on either side. The
bolts used to resist the pin support reactions, were taken from the Williams Form Engineering Corp.
catalog (150 ksi all thread bar). The resultant shear force generated by the analysis was found to be very
low and the all thread bars were ok by inspection.
F.3.6.4 Results of Bearing and Buckling Limit States
The bearing limit state and buckling limit state of the trunnion yoke plate ears were also evaluated
(following ASD criteria) and found to have acceptable DCR values of 0.13 and 0.42 respectively.
Page 96
Fargo Moorhead Metropolitan Area BCOES‐ATR/Sponsor/PDT Review Flood Risk Management Project Diversion Inlet Structure
Appendix F:
DDR_FMM_Diversion_Inlet_Appendix_F_Structural.docx Page F‐90
Figure F‐62 Effective Compression Area used for Buckling Check
Trunnion Assembly Design Discussion
The yoke plates of the trunnion assembly were called out to be ASTM A709 HPS 70WF3. The selection of
this higher steel strength was based on the aforementioned analysis results that indicated a high edge
loading stress. The higher strength steel will help prevent any nonlinear deformations within the steel
from occurring, which could result in the binding of the gate.
All components of the trunnion assembly received a complete joint penetration weld with extensive
weld quality testing due to the criticality / fracture critical labeling of the structural feature. Any
component coming into contact with a stainless steel member was detailed to be isolated from that
member with a neoprene pad. Such isolation can be seen between the keeper plate and the yoke plate.
The design of the trunnion pin keeper plate was based on the trunnion friction moment. The friction
moment was broken up into force couples that were applied along the centerlines of the keeper plate
bolts and at the edge of the keeper plate’s web. Both the keeper plate and bolts were evaluated for
shear and bending forces. The governing friction moment was 168.30 kip*ft unfactored. The governing
shear in the bolts was 131.57 kips, and 168.58 kips in the web. The design required included (6) 1 ½” dia.
ASTM A490 bolts total and a 1” thick keeper plate made from ASTM A693 Type 17‐4 H1150 stainless
steel. For further details on the analysis, please see the MathCAD calculations in the appendix.
The figure below illustrates the final design of the trunnion assembly:
Yk.pl.dmd.F
1'-2.0000"
1'-10.0000"
1'-3.5000"
Page 97
Fargo Moorhead Metropolitan Area BCOES‐ATR/Sponsor/PDT Review Flood Risk Management Project Diversion Inlet Structure
Appendix F:
DDR_FMM_Diversion_Inlet_Appendix_F_Structural.docx Page F‐91
Figure F‐63 Trunnion Assembly Design
Trunnion Assembly Misc. Design Components Discussion
The alignment of the trunnion assembly is critical to maintain functionality of the Tainter gate. To help achieve this precise alignment, the following items were included into the design:
Bracket assemblies to adjust alignment,
Chockfast Orange Liquid Shim to accommodate formwork misalignment of concrete
pier,
Base plate grout pad and a
Procedure to identify Datums to align trunnion pins correctly and install the trunnion
assemblies to within specified tolerances.
Figure F‐64 and Figure F‐65 illustrate some of the design callouts to assist the contractor with aligning
the trunnion assemblies properly.
Page 98
Fargo Moorhead Metropolitan Area BCOES‐ATR/Sponsor/PDT Review Flood Risk Management Project Diversion Inlet Structure
Appendix F:
DDR_FMM_Diversion_Inlet_Appendix_F_Structural.docx Page F‐92
Figure F‐64 Trunnion Assembly Bracket Alignment Assemblies
Page 99
Fargo Moorhead Metropolitan Area BCOES‐ATR/Sponsor/PDT Review Flood Risk Management Project Diversion Inlet Structure
Appendix F:
DDR_FMM_Diversion_Inlet_Appendix_F_Structural.docx Page F‐93
Figure F‐65 Tolerance through Yoke Plates and other Features
F.3.7 Misc. Tainter Gate Components
F.3.7.1 Bumper Design
The bumper is designed with a 5/8” gap and is capable of resisting the 258 kip axial load that could
result due to the Tainter gate load case 3. The bumper material is composite made from Columbia
Industrial Products CIP 151. This material has a compressive modulus of 500,000psi and a coefficient of
friction value of 0.15 when contacting stainless steel. This low coefficient of friction value is ideal as it
reduces the dragging force on the bumper and the gate. Research into past projects revealed that
bronze is often specified as the bumper plate material, however, it was determined, that bronze has a
much high coefficient of friction value compared to the specified composite material. Figure F‐66 and
Figure F‐67 illustrate the bumper’s design.
Page 100
Fargo Moorhead Metropolitan Area BCOES‐ATR/Sponsor/PDT Review Flood Risk Management Project Diversion Inlet Structure
Appendix F:
DDR_FMM_Diversion_Inlet_Appendix_F_Structural.docx Page F‐94
Figure F‐66 Bumper Design Detail Part 1
Figure F‐67 Bumper Design Detail Part 2
F.3.7.2 Side Seal and Bumper Embed Plate Design
The side seal and bumper embed plate were combined into a single secondary grout block out. The side
seal was designed to include a cavity and a panel access point to install and maintain a heating device.
The heater would be installed inside the cavity and used to warm the surrounding steel and ultimately
the side seals. The end of the side seal assembly plate was machined 1/2” and the surrounding concrete
was recessed to avoid the seal hitting any protrusion. Both the side seal and bumper embed plate were
called out to have a very smooth machined surface to help reduce friction and improve the tolerance of
Page 101
Fargo Moorhead Metropolitan Area BCOES‐ATR/Sponsor/PDT Review Flood Risk Management Project Diversion Inlet Structure
Appendix F:
DDR_FMM_Diversion_Inlet_Appendix_F_Structural.docx Page F‐95
the plate, which will be used in the creation of datum A, discussed later. All materials used for the seal
plating were called out as stainless, while the anchors were called out as plain carbon steel. To avoid
galvanic corrosion, neoprene isolating washers were called out on any area where stainless steel came
into contact with plain carbon steel. Figure F‐68 and Figure F‐69 illustrate the side seal and bumper
embed plates.
Page 102
Fargo Moorhead Metropolitan Area BCOES‐ATR/Sponsor/PDT Review Flood Risk Management Project Diversion Inlet Structure
Appendix F:
DDR_FMM_Diversion_Inlet_Appendix_F_Structural.docx Page F‐96
Figure F‐68 Side Seal and Bumper Embed Plate Layout
Page 103
Fargo Moorhead Metropolitan Area BCOES‐ATR/Sponsor/PDT Review Flood Risk Management Project Diversion Inlet Structure
Appendix F:
DDR_FMM_Diversion_Inlet_Appendix_F_Structural.docx Page F‐97
Figure F‐69 Details for Side Seal and Bumper Embed Plate
Page 104
Fargo Moorhead Metropolitan Area BCOES‐ATR/Sponsor/PDT Review Flood Risk Management Project Diversion Inlet Structure
Appendix F:
DDR_FMM_Diversion_Inlet_Appendix_F_Structural.docx Page F‐98
F.3.7.3 Sill Beam Design
The seal beam is composed of a wide flange stainless steel beam embedded into a second grout
placement with leveling anchors. The secondary grout placement has an inverted mushroom like shape
to help key in both the sill beam and grout block out from being uprooted during flows. Research into
past sill beam designs determined that a common sill beam design approach was to use a carbon steel
wide flange beam with a removable stainless steel cover plate. However, due to concerns with galvanic
corrosion combined with freeze thaw cycles, it seemed more appropriate to embed a solid stainless
steel member. So long as the solid stainless member remains isolated from any surrounding plain
carbon steel, the sill beam should have a long design life with little need for maintenance. Figure F‐70
illustrates the sill beam design.
Page 105
Fargo Moorhead Metropolitan Area BCOES‐ATR/Sponsor/PDT Review Flood Risk Management Project Diversion Inlet Structure
Appendix F:
DDR_FMM_Diversion_Inlet_Appendix_F_Structural.docx Page F‐99
Figure F‐70 Sill Beam Section Cuts
Page 106
Fargo Moorhead Metropolitan Area BCOES‐ATR/Sponsor/PDT Review Flood Risk Management Project Diversion Inlet Structure
Appendix F:
DDR_FMM_Diversion_Inlet_Appendix_F_Structural.docx Page F‐100
F.3.7.4 Pier Thrust Plate Design
The pier thrust plate for the trunnion assembly has a similar design to the side seal and embed bumper
plates. The thrust plate assembly includes a secondary grout block out with leveling anchors. The plate is
stainless steel attached to carbon steel anchors with isolating neoprene washers. The holes within all
connecting angle brackets are slotted to assist with assembly and alignment. Figure F‐71 illustrates the
pier embed plate design. It is not uncommon to find the leveling anchors for all of the secondary grout
block outs to be headed. All anchors have been specified to use the HRC 555 heads in order to shorten
the development length of the rebar, which will help avoid congestion issues with the piers and other
structural features.
Figure F‐71 Layout of Embed Thrust Plate
F.3.7.5 Lifting Lug Design
The bracket was designed to withstand a 237.0 kip factored load, which comes from LC5, or the Tainter
gate stalled torque motor load case. The design checks for the lifting lug included:
1. Weld check of base plate to skin plate
Page 107
Fargo Moorhead Metropolitan Area BCOES‐ATR/Sponsor/PDT Review Flood Risk Management Project Diversion Inlet Structure
Appendix F:
DDR_FMM_Diversion_Inlet_Appendix_F_Structural.docx Page F‐101
2. Weld check of lifting ears to base plate
3. Base metal checks
4. Shear Yielding of lifting ears
5. Shear Rupture of lifting ears
6. Bearing
The final design of the lifting bracket has been illustrated in Figure F‐72. The lifting bracket is considered
to be a fracture critical element and has therefore been detailed to undergo extensive nondestructive
testing of its welds.
Figure F‐72 Lifting Lug Design and Layout
F.3.7.6 Seal Design and Assembly
The seals were designed based on as built drawings from previous projects and discussions with
mechanical engineer Matt Hess PE of Portland District. Mr. Hess recommended that the side seals be
mounted using the configuration below, as it would allow the “J” bulb seals to deflect and create a
better seal. In addition, if the seals need to be replaced during their design life, the arrangement of the
side seal assembly allows for easy replacement.
The bottom seal assembly was designed based on as built drawings from past Tainter gate projects, such
as Blue River dam out of Portland district. Tolerances on how often the Tainter gate skin plate must
touch the sill beam were also reused and specified.
Figure F‐73 through Figure F‐75 illustrate some of the seal details specified for the Tainter gates:
Page 108
Fargo Moorhead Metropolitan Area BCOES‐ATR/Sponsor/PDT Review Flood Risk Management Project Diversion Inlet Structure
Appendix F:
DDR_FMM_Diversion_Inlet_Appendix_F_Structural.docx Page F‐102
Figure F‐73 Side Seal Detail
Figure F‐74 Bottom Seal Detail
Page 109
Fargo Moorhead Metropolitan Area BCOES‐ATR/Sponsor/PDT Review Flood Risk Management Project Diversion Inlet Structure
Appendix F:
DDR_FMM_Diversion_Inlet_Appendix_F_Structural.docx Page F‐103
Figure F‐75 Tainter Gate Seal Layout
Page 110
Fargo Moorhead Metropolitan Area BCOES‐ATR/Sponsor/PDT Review Flood Risk Management Project Diversion Inlet Structure
Appendix F:
DDR_FMM_Diversion_Inlet_Appendix_F_Structural.docx Page F‐104
F.3.7.7 Tolerance Design
To measure tolerances in the field, multiple Datums must be established that serve as reference planes.
To accomplish this, a procedure was laid out to establish Datum A using all of the various embedment
plates. The plates would be machined to have a smooth flat surface and then leveled by the contractor
to meet contract drawings parallelism and perpendicularity tolerance requirements. Once in place
points on each face of the embedded plates would be collected and used to create a best fit plane; this
would become Datum A. Datum A would then serve as the main reference Datum and would help
establish Datum B, which is the Datum designated for the trunnion pins centerlines, and Datum C, which
is the sill beam. Once Datum A is establish this will allow the contractor to begin establishing the other
Datums and begin construction efforts to meet the tolerance requirements. Both the specifications and
the tolerance sheets require the contractor to verify structural features maintain tolerance following
gate commissioning, secondary grout placements, and anchor tensioning. Figure F‐76 illustrates some of
the various Datums and tolerances.
Figure F‐76 Illustration of Datums and other Tolerances
F.3.7.8 References
AISC. (2010). Steel construction manual, 14th Ed., Chicago.
Fish & Associates. (2011). “Standard detailing of hydraulic steel structures.” Task Order
No. 22, U.S. Army COE (USACE), Washington, DC.
United State Army Corps of Engineers, 2014 “Design of Hydraulic Steel Structures”
Engineering Technical Letter ETL 1110‐2‐584.
United States Army Corps of Engineers, 2000 “Design of Spillway Tainter Gates”
Engineering Manual 1110‐2‐2702.
Page 111
Fargo Moorhead Metropolitan Area BCOES‐ATR/Sponsor/PDT Review Flood Risk Management Project Diversion Inlet Structure
Appendix F:
DDR_FMM_Diversion_Inlet_Appendix_F_Structural.docx Page F‐105
F.4 TRUNNION GIRDER
F.4.1 General Description
The anchorage system will consist of cast in place/precast trunnion girder held in place by longitudinal anchorage that extends into the concrete abutment/pier. The transverse trunnion girder anchorage will be a bonded prestress system. The anchors will be placed inside ducts embedded in concrete and tensioned after the annular space between post tensioned steel and duct are grouted for corrosion protection. The longitudinal abutment/pier anchorage system will be an unbonded post tensioned system consisting of ducts, prestress bars and accessories. The unbonded system will allow for testing, operation and maintenance during the life of the structure.
F.4.2 Material Properties
Abutment/Pier Anchorage Zone Concrete 5000 psi
Trunnion Girder Concrete 7000 psi
2‐1/2” Prestress Bars(Williams Form or approved equal) 150 ksi
Ducts Approved by COR
Bearing Plates (Hot dipped galvanized) ASTM 588
Hex Nuts (Hot dipped galvanized) ASTM A29 or A576
Hardened Washers (Hot dipped galvanized) ASTM F436
F.4.3 Load Cases and Load Factors
A hydraulic factor of 1.3 is applied to all loads for obtaining the required nominal strength per EM 1110‐ 2‐2104 and a single load factor of 1.7 for dead and live loads is also used in addition to the hydraulic factor. The anchorage zone is designed for the jacking load with a load factor of 1.2. Final jacking loads shall be provided by manufacture however the initial jacking load will be taken as 0.65 of the ultimate strength of Prestress bars
F.4.4 Factored Trunnion Load Values
Table F‐26 Factored Trunnion Load Values
L Case Ptv PTH Mfrict R Thrust α Rtv Rtv
LC 1 (LS) ‐370.84 799.03 4.76 880.89 ‐356.43 62.50 ‐567.975 ‐673.33
LC2b Ice ‐455.33 ‐1160.45 4.63 1246.58 ‐500.26 ‐65.58 1070.079 ‐639.45
**LC5(LS) ‐603.53 ‐1205.07 ‐68.71 1347.76 ‐518.13 ‐37.47 1138.037 722.03
LC5 (b ice ‐403.44 ‐775.11 ‐57.81 873.82 347.43 0.00 827.181 ‐281.66
LC6 US LS ‐14.85 32.71 ‐11.25 35.92 14.87 0.00 ‐33.1686 ‐13.79
LC 6 DS LS 98.90 ‐75.80 2.57 124.61 ‐46.03 0.00 121.34 28.37
Page 112
Fargo Moorhead Metropolitan Area BCOES‐ATR/Sponsor/PDT Review Flood Risk Management Project Diversion Inlet Structure
Appendix F:
DDR_FMM_Diversion_Inlet_Appendix_F_Structural.docx Page F‐106
** Governing Load Case
F.4.5 Analysis of Anchorage forces
Trunnion girder is analyzed as a simply supported beam with cantilevered end spans. The position of
the supports is assumed to lie at the center of gravity of the anchorage steel group. Reaction forces
were determined by summing moments about the supports. The anchorage force was calculated to be
2850 kips after prestress losses.
Figure F‐77 Analytical model to establish minimum anchorage force.
F.4.6 Prestress Losses
The sources of prestress losses to be examined are friction, seating (anchorage loss), elastic shortening
of concrete, creep of concrete, shrinkage of the concrete, and the relaxation of steel. The initial
prestress is estimated at 23 psi per AASHTO Table 9.16.1. Friction losses were assumed to be minimal
because of the use of threaded bars. However, prestress losses will be calculated and compared with
estimated losses and the final losses as discussed with manufacturer.
Page 113
Fargo Moorhead Metropolitan Area BCOES‐ATR/Sponsor/PDT Review Flood Risk Management Project Diversion Inlet Structure
Appendix F:
DDR_FMM_Diversion_Inlet_Appendix_F_Structural.docx Page F‐107
Table F‐27 AASHTO Table 9.16.2.2
F.4.7 Trunnion Girder
The prestressed concrete trunnion girder will be a cast in place/precast at the downstream face of the
abutment/pier and is post tensioned prior to post tensioning of the abutment/pier anchorage. The
girder anchorage is a bonded post tensioned system. The post tensioning system will be comprised of 15
2‐1/2” 150 ksi prestressed bars located so that the centroid of the bars is near the upstream edge of the
kern so that the prestress force required for design keeps the principal concrete tensile stresses within
the allowable limits. The effective prestess in the intermediate and abutment trunnion girder is 60
percent of the ultimate strength of the prestress bars. Web reinforcement is provided to resist shear
and bursting stresses. Longitudinal reinforcement around the perimeter of the girder is used to resist
temperature and spalling stresses. The trunnion girder concrete has a minimum compressive strength of
7000 psi.
F.4.8 Longitudinal Abutment/Pier Anchorage
The longitudinal anchorage for the intermediate piers consist of 24 2‐1/2” diameter prestress bars and
20 2‐1/2” bars located close to the pier face to minimize bending in the trunnion girder. These prestress
bars are embedded in the pier concrete prior to placing the trunnion girder. The effective Prestress used
for design of the longitudinal anchorage will be 55 percent of the ultimate strength of the bars. The
number and total load in the intermediate pier anchorage is calculated to provide a residual bearing
stress between the girder and pier of about 20 percent of the prestress force for one gate fully loaded
with the adjacent gate unloaded. The anchorage plates for the post tensioning bars are designed
assuming a uniform bearing stress on the concrete surface. The abutment/pier concrete in the area of
longitudinal anchorage has a minimum compressive strength of 5000 psi. The surface between the pier
and girder will be trowled smooth and coated with bond breaker to minimize integral action between the
girder and pier during prestressing operations. The respective surface is constructed using Class “A”
forms and bond breaker prior to casting the trunnion girder to provide a uniform bearing surface for the
girder. Vertical and horizontal reinforcement is placed in addition to the conventional pier reinforcement
Page 114
Fargo Moorhead Metropolitan Area BCOES‐ATR/Sponsor/PDT Review Flood Risk Management Project Diversion Inlet Structure
Appendix F:
DDR_FMM_Diversion_Inlet_Appendix_F_Structural.docx Page F‐108
to resist the tensile stresses caused by the bearing loads from the longitudinal bars. Hoop type
reinforcement across the pier is used throughout the anchorage zone to resist bursting and spalling.
F.4.9 Corrosion Protection
Due to the fact the longitudinal anchorage will be an un‐bonded permanent system the anchors have
been upsize and coated with 12 mils of epoxy coating. The fusion bonded epoxy coating will help
prevent corrosion because of the chemical stability of the epoxy coating. The coating is specified
between 10 to 12 mils. Bearing plates and prestress accessories will be galvanized according to ASTM
123. All damaged coating will be reported to the COR (Contracting Officer Representative) and be
repaired per manufacturer.
F.5 BRIDGES
F.5.1 Vehicle Service Bridge
The vehicle service bridge will provide controlled access for persons across the diversion inlet structure
to provide onsite operations, inspections of the structure and other uses as needed. A small truck
mounted crane may be needed to repair or replace some items in the mechanical equipment if the need
arises. The width of a control structure service bridge is normally dictated by the size of the crane
needed to set bulkheads and/or the public highway capacity required. However, the diversion inlet
structure service bridge will not be open to the public as there will be a highway bridge downstream of
the diversion inlet structure. Also, the project design team decided in the design charette that there is
no need for bulkheads on the diversion inlet structure as it will normally be a dry structure and the
normal flood event only lasts for a few weeks a year. Therefore, there is no need for a large crane on
the service bridge and installation of the tainter gates will not be allowed from the vehicle service
bridge. It was then decided that the service bridge should be wide enough to safely pass two pick‐up
trucks (Ford F‐150 or similar type ½ ton truck). The Structures group researched numerous pick‐up truck
manufacturers and determined that the typical pick‐up truck width is 97" (8'‐1" including standard
mirrors). The minimum required width for 2 pickups would be 194" (16'‐2"). Therefore a service bridge
clear width of 20'‐0" (inside face of barrier to inside face of barrier) for the diversion inlet structure was
proposed to the local sponsor. The sponsor has accepted the service bridge width in an email from John
Glatzmaier on 12 January 2015. The vehicle service bridge will be designed for AASHTO HL‐93 truck
loads so that it will not be limited for practical vehicles that may use it.
The vehicle service bridge will have an expansion joint at each of the abutments and the piers. The
requirement of Test Level 2 was chosen because it is a bridge that is expected to have a small number of
heavy vehicles and posted speeds are reduced. The bridge deck will be a 9 inch cast‐in‐place concrete
deck that will provide support for the (2) vehicle parapets that meet Test Level 2 requirements of NCHRP
Report 350. The height of the concrete parapets will ensure proper fall protection for the users of the
diversion inlet structure. The bridge deck will have a 2% cross slope and a crown elevation of 931.0.
With the parapet chosen and the 2% cross slope on the bridge deck this will provide drainage for any
water on the bridge deck. The bridge deck will be supported by (3) 27 inch deep prestressed concrete
Page 115
Fargo Moorhead Metropolitan Area BCOES‐ATR/Sponsor/PDT Review Flood Risk Management Project Diversion Inlet Structure
Appendix F:
DDR_FMM_Diversion_Inlet_Appendix_F_Structural.docx Page F‐109
beams and a combination of expansion and fixed bearings at the abutments and piers. The vehicle
service bridge will also have block outs in the downstream concrete parapet at each of the piers and
abutments to allow authorized personnel to access the downstream side of the abutment and piers.
The vehicle barrier in the plans is a Modified Kansas Corral Bridge Rail that has been crash tested to
NCHRP 230 requirements and has been considered acceptable for use on Federal aid projects by the
Federal Highway Administration in the letter from the Chief, Federal Aid and Design Division, dated May
30, 1997. The acceptance concluded that the Modified Kansas Corral Bridge Rail is approved for NCHRP
350, Test Level 2 (design speeds of 70 km/h and less). The test level approval was based on NCHRP 230
crash tests.
F.5.2 Bridge on Dam Walls
The dam wall system will have a vehicle service bridge deck with (2) vehicle parapets that meets Test
Level 2 requirements of NCHRP Report 350. The requirement of Test Level 2 was chosen because it is a
bridge that is expected to have a small number of heavy vehicles and posted speeds are reduced. This
parapet then meets the definition of TL‐2 per AASHTO LRFD Bridge Design Specifications 7th edition,
2014 section 13.7.2 on page 13‐7. The dam wall vehicle service bridge will be a precast plank of
approximately 30 foot spans. Two precast producers were contacted to ensure that 30 foot spans were
acceptable for precast plank, Hanson Building Products and Molin Concrete Products. They informed us
that for a HL‐93 loading, a minimum of a 14 inch solid plank was suggested. Precast deck plank was
chosen over cast‐in‐place concrete to reduce the amount of design work required and for ease of
construction. Wave uplift force on the bottom of the precast concrete bridge deck sections was
neglected because the probable maximum flood water elevation is at elevation 926.00 which would
provide approximately 4 feet of clearance from the water surface elevation to the bottom of the precast
concrete bridge deck sections.
F.5.3 Mechanical Platform
The mechanical platform will provide support for the mechanical equipment needed to raise and lower
the (3) tainter gates and also access to personnel performing maintenance and/or inspection on the
mechanical equipment. The mechanical platform will have a minimum of 2 feet of walkway adjacent to
the mechanical equipment and have will have access points at each of the 2 abutments via a stairs from
the downstream side of the abutments. The mechanical platform will also have a handrail at 3’‐6”
above the walkway and meet fall protection requirements. The intent is to have the mechanical
equipment installed from a smaller type crane off of the vehicle service bridge. However if the crane
needed to install the mechanical equipment is too large the crane will then need to be located on the
foundation slab. The total bridge deck width is 13’‐9” with a 9” thick cast in place structural deck. The
final design of the mechanical platform specifies (2) 27 inch deep prestressed concrete beams similar to
the vehicle service bridge beams and a concrete platform deck. The beams for the mechanical platform
will be provided by the Mechanical group and they will be the maximum load in which the mechanical
equipment will stall. The mechanical equipment will be located on a platform that will transfer all of the
loads to the center line of the prestressed I‐beams.
Page 116
Fargo Moorhead Metropolitan Area BCOES‐ATR/Sponsor/PDT Review Flood Risk Management Project Diversion Inlet Structure
Appendix F:
DDR_FMM_Diversion_Inlet_Appendix_F_Structural.docx Page F‐110
An alternate plan would be to use (2) steel beams and steel grating for the platform surface. The reason to use prestressed concrete beams would be that they are more durable, require less maintenance then the steel beams and there would be expected cost savings in using a similar structural system as the vehicle service bridge.
F.6 RAILINGS, STAIRWAYS, AND WALKWAYS
The railings, stairways, and walkways on the diversion inlet concrete control structure will allow
pedestrian access from the vehicle service bridge to the trunnion girders and mechanical platform. On
the abutments, a walkway will extend off the side from the vehicle service bridge to a platform. From
this platform, there will be a gate, to control access to a staircase which leads up to the mechanical
platform. The walkway will continue to the downstream side of the trunnion girder. On the piers, a
tunnel through the pier will allow access to a landing on the downstream side which, via a steel
alternating tread staircase, will lead to a lower platform for access to the trunnion girder. Since this
project is being designed by the Army Corps of Engineers, but will not be owned or run by the Corps,
design guidance for the elements was taken to be the most conservative guideline based on EM 385,
OSHA standards, and IBC.
The railing systems are separated into two groups, those on the stairways (referred to as handrails) and
those that are not (referred to as safety railings). Each type of railing was designed at the controlling
case, all others being sufficient by inspection. This was done for ease of calculation and construction, so
the materials used would be as uniform across the structure as possible. Due to the long drops possible
from the walkways and stairs, two railings, one at the top, 42 inches above the walking surface, and one
in the middle, 21 inches above the walking surface, were necessary. Since the platforms will not be open
to the public and will not have a high occupancy, the openings in the railing do not have to be any
smaller. On the staircases, an additional railing at 36 inches above the walking surface is required as a
handhold.
For the safety railing, based on IBC and EM 385, a live load of 50lb/ft and 200 lbs was applied to the top
railing. The maximum spacing between the posts, based on the geometry of the layout, IBC, and EM385
is 7 ft. For the stairway hand railings, in IBC, the guardrail/safety rail, which is comprised of the top and
middle rail, has a separate loading condition from the handrail. The hand rail loads are 50lb/ft a
concentrated 200lbs. The design spacing is 3.75ft. There was no wind loading applied to the railing
system due to the small amount of area present to load.
For the stairs, landings, platforms, and walkways, live loads were taken to be the most severe between
IBC and EM385 for the situation designed. The controlling case was designed for, all others being
sufficient by inspection, for ease of calculation and constructability. For lateral bracing and anchorage, a
load of 2 kips was applied. This is a conservative design assumption for ease of calculation. Two kips is a
relatively large load since the wind loading will not be that high on a small area and there is virtually no
seismic loading. On the piers, a steel alternating tread stair will connect the upper platform to the lower
platform. The alternating tread stair is preferred over a ladder since it allows a shortening of the upper
platform, is easier to climb, is closer to being parallel to the face of the trunnion girder, and it has been
used in this manner on previous corps projects. Widths of the landings, walkways and stairs are in line
Page 117
Fargo Moorhead Metropolitan Area BCOES‐ATR/Sponsor/PDT Review Flood Risk Management Project Diversion Inlet Structure
Appendix F:
DDR_FMM_Diversion_Inlet_Appendix_F_Structural.docx Page F‐111
with EM385, OSHA, and IBC. On the downstream side of the abutments, the rise and run of the main
staircase to the equipment platform was dictated by the geometry of the concrete platform and IBC
standards. The angle from the horizontal cannot exceed 50 degrees, per EM385, while the geometry of
the concrete platform was dictated by the abutment design. The rise and run of the stair treads follow
OSHA requirements.
Figure F‐78: Typical Abutment Stairway, Walkway, and Railings
Page 118
Fargo Moorhead Metropolitan Area BCOES‐ATR/Sponsor/PDT Review Flood Risk Management Project Diversion Inlet Structure
Appendix F:
DDR_FMM_Diversion_Inlet_Appendix_F_Structural.docx Page F‐112
Figure F‐79: Typical Pier Stairs, Walkway, and Railings
F.7 CONTROL BUILDING
The control building is approximately 12’‐7” wide by 33’‐11” long and consists of three conditioned
spaces. The structural features consists of a frost protected shallow foundation, concrete masonry
structural walls, built‐up wood stud walls supporting wood rafters and a standing seam metal roof over
plywood sheathing.
The frost protected shallow foundation (FPSF) is made up of grade beams with vertical and horizontal
insulation. The FPSF was chosen in lieu of the traditional strip foundation /pier wall due to the projected
frost line depth which impacts economy of construction. The criteria used in designing the FPSF was
determined through the International Building Code (IBC) to be ASCE 32‐01. Both the grade beam depth
and insulation limits were determined using this criteria. The FPSF works by allowing the heat from the
building to seep through the floor slab and into the soil pushing the frost line away from the building
footprint. Due to the overall size of the structure, the wing insulation is projected out at the same
Page 119
Fargo Moorhead Metropolitan Area BCOES‐ATR/Sponsor/PDT Review Flood Risk Management Project Diversion Inlet Structure
Appendix F:
DDR_FMM_Diversion_Inlet_Appendix_F_Structural.docx Page F‐113
distance as the corner insulation in order to minimize the need for varying size insulation. The insulation
is protected by a cementitious covering if excavation and planting occurs after the building has been
constructed.
The width of the grade beam is based on the allowable bearing capacity of 1900 psf provided by the
project geotechnical engineer. The grade beam is designed in accordance with the strength
requirements of ACI 318 and is capable of spanning a maximum of 10 feet. The purpose of this design
feature is to permit jacking under the grade beam to level the structure in case of differential
settlement. The floor slab is also designed as a one‐way slab spanning between the grade beams. The
material below the foundation is structural fill consisting of less than 5% silts for frost heave mitigation.
The main wind force resisting system consists of reinforced concrete masonry unit walls. The design
loads follows the criteria outlined in ASCE 7‐10 using the directional procedure. The built‐up stud wall
transition to the roof diaphragm is designed to transfer the horizontal load to the double bond beam
spanning the interior and exterior walls. These wood components were designed using the American
Wood Council Manual for Engineered Wood Construction. Tension straps are specified in order to
ensure adequate bond between the masonry and the wood framing. As the building drifts, the tension
straps would engage and aid in transmitting the load to the vertical reinforcement. The horizontal shear
that develops at the interface is resisted by the anchors. Additional rotational resistance is provided by a
¼” plate across the bottom plate at each anchor location.
The concrete masonry walls are designed in accordance with the strength requirements found in ACI
530. Control joints are located along the long walls and are spaced so not to exceed 14’‐0” as
determined by the criteria. Due to the use of various construction materials, special care was given to
the shrinkage and expansion of these materials and appropriate bond breaking methods were
incorporated in the plans and specifications. Although temperature cracks are not structural, it may
pose to be aesthetically unpleasing to the owner and thus crack control was considered.
There are several penetrations of which are not of any structural issue as the penetrations are framed
nicely within the designed reinforcement layout of the building. The perimeter walls are all fully grouted
in order to increase its thermal mass where otherwise, only the reinforced cells are required to be
grouted.
F.8 AESTHETICS
The aesthetics for the Diversion Inlet Structure were developed by the Local Sponsor and will
be a brick form liner with reveals. The form liner brick finish is to match Customrock pattern
#12036 “Split Face stone.” The color of the “Split Faced Stone” will be Federal Standard color
33448 and Federal Standard 33522 to be applied to the smooth surfaces.
Page 120
Fargo Moorhead Metropolitan Area BCOES‐ATR/Sponsor/PDT Review Flood Risk Management Project Diversion Inlet Structure
Appendix F:
DDR_FMM_Diversion_Inlet_Appendix_F_Structural.docx Page F‐114
F.9 REFERENCE DOCUMENTS
Links to or copies of the following documents are on the project Extranet site at: https://extranet.dse.usace.army.mil/sites/Divisions/MVD/MVP/FargoMoorhead/ [accessible within USACE] or https://onecorps.usace.army.mil/sites/Divisions/MVD/MVP/FargoMoorhead/ [accessible outside of USACE]
Fargo Moorhead Metropolitan Area Flood Risk Management Project; Oxbow, Hickson, Bakke Ring Levee Attachment D‐1 Geotechnical Engineering Parameters dated 7 April 2014 for soil design properties.
F.10 CALCULATIONS
Table of contents for calculations
Foundation 1 – Attachment #1 Foundation 2 – Attachment #2‐#3 Foundation 3 – Attachment #4 Foundation 4 – Attachment #5 Vehicle Service Bridge – Attachment #6 Mechanical Platform – Attachment #7‐#8 Stilling Basin Walls – Attachment #9 Energy Dissipation Elements – Attachment #10 Dam Wall Section 1 – Attachment #11 Dam Wall Section 2 – Attachment #12 Dam Wall Section 3 – Attachment #12 Dam Wall Section 4 – Attachment #12 Dam Wall Section 5 – Attachment #12 Control Building – Attachment #13 Railings, Walkways, and Stairs – Attachment #13 Signs – Attachment #13 Trunnion Girder and Pier Anchorage – Attachment #14 Tainter Gates – Attachment #15