22
Engineering Company Role Engineering Company Role on Energy Projects on Energy Projects Sept 13, 2007 The Grand Hotel, Taipei, 2007
Engineering Company RoleEngineering Company Roleon Energy Projectson Energy Projects
Sept 13, 2007
The Grand Hotel, Taipei, 2007
1
1. Chiyoda as Eng’g Company
2. Energy Supply and Demand
3. Trend & Nature of Production Facilities
4. Economy of Scale
5. Smart EPC Requisite
6. Summary : Challenges for Sustainability
Contents

2
1. Chiyoda as Eng’g Company (1/2) : Area of Services
CHIYODACHIYODA
Pharmaceutical
Petrochemicals,Chemicals & Fertilizer
EnvironmentalPreservation
Metal & MiningPetroleumRefining
Gas Value ChainGas Processing/LNG/LPG
General Industries Established Jan., 1948
Employees 6,000Global Basis

3
BY CLIENTBY CLIENT
• Operator Assignment
• Start Operation
• MasterPlanningApproval
• BudgetApproval
• SpecificationApproval
• Drawing,CalculationApproval
• Attending ProgressMeeting
• Inspection • Attending ProgressMeeting
• Inspection
• Procedure Approval
• Basic Concept• Market Research• etc.
OPTIONOPTION(if Required by Client)(if Required by Client)
FINANCE ARRANGEMENT• Investor Research• Official Development Assistance• Export Credit Agency• Other Funds
Research & Developmentfor Applied Mechanics, PollutionControl Technology, etc. BY CHIYODABY CHIYODA
• Basic, Operation,Logistics Concept
• Market Research
• Future Program
• Feasibility Study
• etc.
• Site, CapacityDetermination
• Basic Data• Master
Schedule• Manning
Schedule • Budget
Estimation• Other Client’s
Requirement• etc.
• Basic Design• Review of
Equip.• Review of
Material, Heat & Other Balance
• Construction CostEstimation
• Budget Allocation
• etc.
• Basic DesignSchedule
• Specification for subcontracting
• Quotation• Evaluation of
Sub-Contractor• Detail Design• etc.
• Procurement Detail Schedule
• VendorSelection
• Purchase Order
• Machine/Equip. Fabrication
• Inspection• etc.
• Construction Detail Schedule
• Temporary Work• Notification to
Authorities• Selection of
Subcontractor• Subcontracting• Construction under
Quality, Safety, Cost,Schedule Control
• Inspection• Preparation for
Commissioning• etc.
• Power -In• Machine
& Equip.Start-Up
• PipeFlushing
•etc.
• Training ofOwner’s Operator
Project Concept Master
Planning Basic Design
Detail Design
ProcurementConstruction
Commissioning
TrainingOperation
Maintenance
1. Chiyoda as Eng’g Company (2/2) : Field of Services

4
2. Energy Supply and Demand (1/5) : Primary Energy Supply
source: IEA World Energy Outlook 2004
2,413
892
1,40729
795
3,575
2,068
2,310
672
1,344
4,308
2,703
2,763
778
1,641
5,074
3,451
3,193
776
1,891
5,766
4,130
3,601
764
2,226
0
2,000
4,000
6,000
8,000
10,000
12,000
14,000
16,000
18,000
Energ
y D
em
ands
(M
toe)
1971 2000 2010 2020 2030
Petroleum
Natural gas
Coal
Nuclear powerNuclear power
Total 5,536
Total 9,969
Total 12,193
Total 14,385
Total 16,487
yearyear
Water、RenewableRenewableenergyenergy

5
2. Energy Supply and Demand (2/5) : Fossil Resources
Source: BP Statistical Review of World Energy 2006Source: BP Statistical Review of World Energy 2006
• Proved Reserves : 1,201 billion bblProduction : 29.6 billion bbl per year R/ P Ratio : 40.6 years
• Proved Reserves : 179.83 Tri. Sm3 Production : 2,763.0 Bil. Sm3 R/ P Ratio : 65.1 years
• Proved Reserves : 909,064 million tonsProduction : 5,853 million tons R/ P Ratio : 155 years
Oil
Coal
Gas
FossilResources Data at end of 2005
Reserves, Production & R/P Ratio
Oil: Dominant still in 2030, but Shift to transport fuels and chemicals
Coal: One of major fuels to generate electric power
Natural Gas: Accelerated Shift
Chiyoda’s Outlook
6
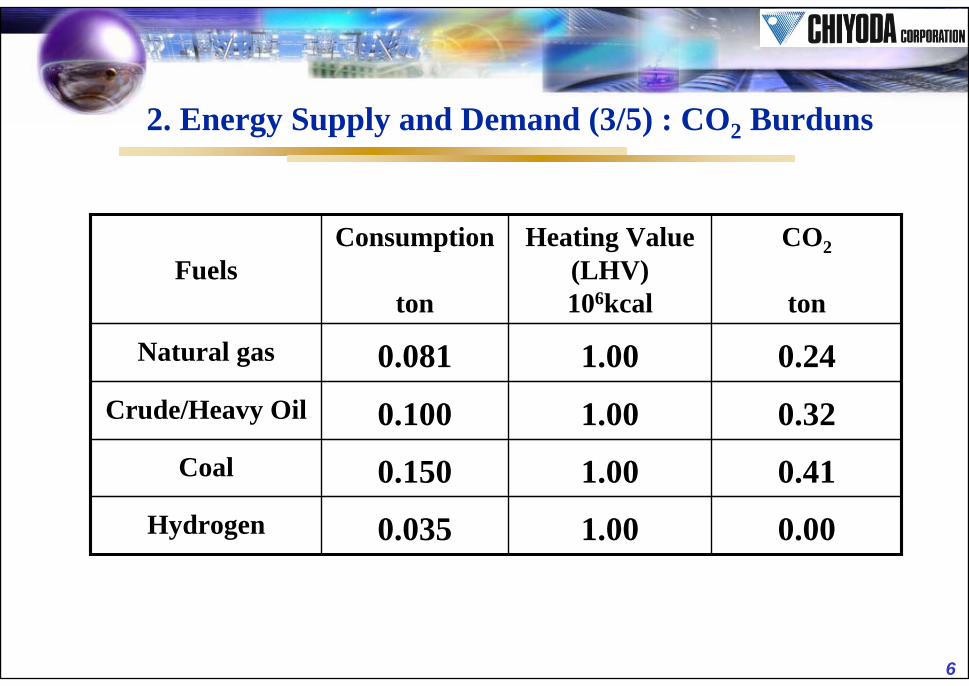
2. Energy Supply and Demand (3/5) : CO2 Burduns
0.411.000.150Coal
0.001.000.035Hydrogen
0.321.000.100Crude/Heavy Oil
0.241.000.081Natural gas
CO2
ton
Heating Value(LHV)106kcal
Consumption
tonFuels
7
0
1,000
2,000
3,000
4,000
5,000
6,000
1970 1980 1990 2000 2010 2020 2030
Oil 1.3%/yr
Coal1.8%/yr
Gas2.0%/yr
Actual Supply Projection
Mto
e
Year
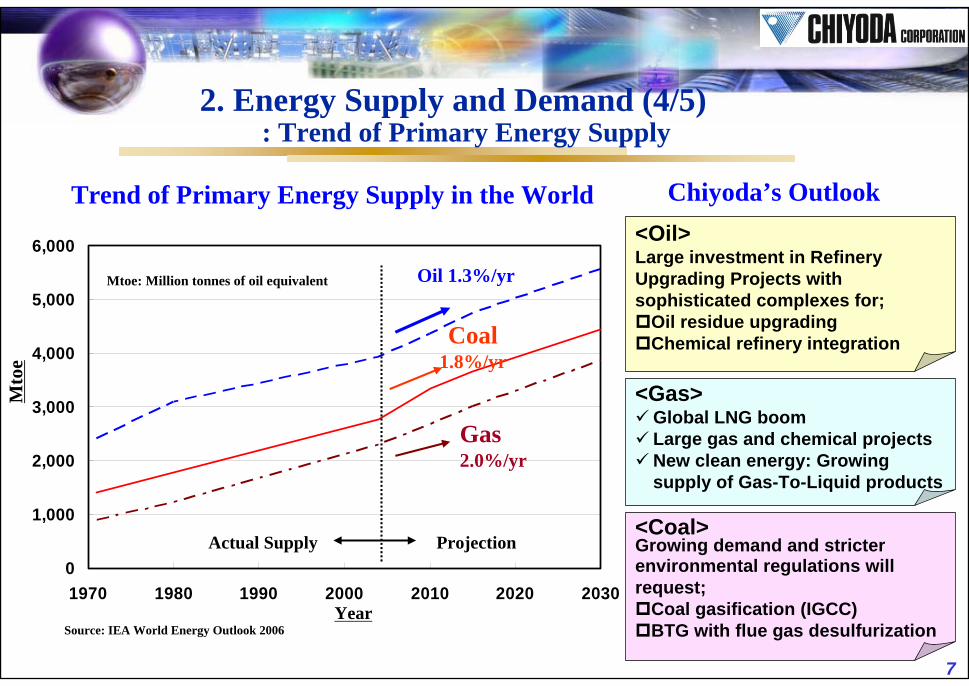
Trend of Primary Energy Supply in the World
Source: IEA World Energy Outlook 2006
Mtoe: Million tonnes of oil equivalent
2. Energy Supply and Demand (4/5): Trend of Primary Energy Supply
<Oil>Large investment in Refinery Upgrading Projects with sophisticated complexes for;
Oil residue upgradingChemical refinery integration
<Coal>Growing demand and stricter environmental regulations will request;
Coal gasification (IGCC) BTG with flue gas desulfurization
<Gas>Global LNG boomLarge gas and chemical projects New clean energy: Growing supply of Gas-To-Liquid products
Chiyoda’s Outlook

8Source: IEA World Energy Outlook 2006Source: IEA World Energy Outlook 2006
Energy Demand by FuelCoal Oil Natural Gas
Power Transport
Industry20042004
20302030Power
Power
Power
Industry
Industry
Industry
Industry
Industry
Transport
Residential
1.65times 1.42times 1.69times
2,493 Mtoe
4,120 Mtoe
3,317 Mtoe
4,698 Mtoe
2,025 Mtoe
3,422 Mtoe
Residential
Residential
MtoeMtoe: Million : Million tonnestonnes of oil equivalentof oil equivalent
Residential
2. Energy Supply and Demand (5/5) Energy Demand

9
3. Trend & Nature of Production Facilities (1/2) : General
Plant NatureSophisticated process complexMega-sized projects with very large equipment and piping
Plant NatureSophisticated process complexMega-sized projects with very large equipment and piping
Market TrendsUpstream Gas Processing ProjectsResidue upgrading projects Chemical refinery integration projectsLNG and GTL projectsGas-based petrochemical projects
Market TrendsUpstream Gas Processing ProjectsResidue upgrading projects Chemical refinery integration projectsLNG and GTL projectsGas-based petrochemical projects
10
3. Trend & Nature of Production Facilities (2/2): Key Technology Trend
- Safe and Reliable Operation
- Economy of Scale
- Lower Energy Consumption
- Environmentally Clean
11
-
0.2
0.4
0.6
0.8
1.0
1.2
1.4
1.6
1.8
2.0
1960 1965 1970 1975 1980 1985 1990 1995 2000 2005 2010
Start Up Year
Pla
nt
Capacity(M
illio
n t
on/Year)
0
20
40
60
80
100
120
140
160
180
200
Eth
yle
ne D
em
and/Pro
duct.
(Millio
n T
on/Year)
Demand
Production Capacity
Ethylene Plant Capacity Trend (1Train)Ethylene Plant Capacity Trend (1Train)
-
1,000
2,000
3,000
4,000
5,000
6,000
7,000
8,000
1960 1965 1970 1975 1980 1985 1990 1995 2000 2005 2010
Start Up Year
Pla
ntC
apacity(M
TA)
0
5
10
15
20
25
30
35
40
Meth
anol D
em
and/Pro
duct.
(M
TA)
Methanol Plant Capacity Trend (1Train)Methanol Plant Capacity Trend (1Train)
Demand
Production Capacity
0.0
1.0
2.0
3.0
4.0
5.0
6.0
7.0
8.0
9.0
10.0
1960 1965 1970 1975 1980 1985 1990 1995 2000 2005 2010
Start Up Year
Pla
nt
Capacity (
Million T
on/Year)
0
50
100
150
200
250
LNG D
em
and/Pro
dut.Cap
.
(Mill
ion T
on/Year
)
LNG Plant Capacity Trend (1 Train)LNG Plant Capacity Trend (1 Train)
Production Capacity
Demand
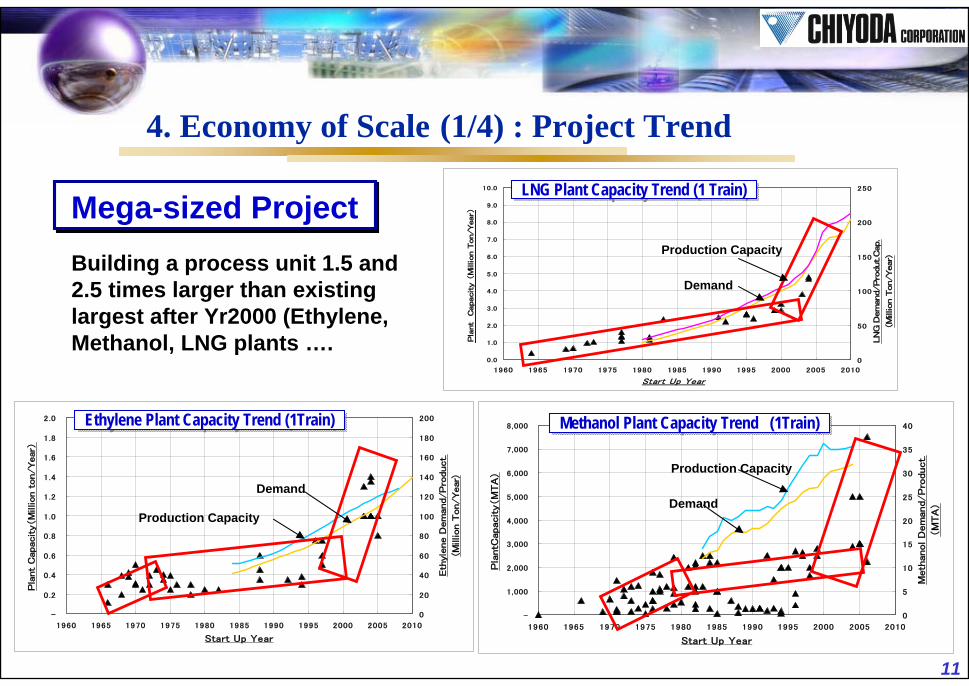
4. Economy of Scale (1/4) : Project Trend
Mega-sized ProjectMega-sized ProjectBuilding a process unit 1.5 and 2.5 times larger than existing largest after Yr2000 (Ethylene, Methanol, LNG plants ….

12
ChiyodaChiyoda’’s LNG Experiences LNG Experience
4. Economy of Scale (2/4) : LNG Capacity and Driver Selection
ADGAS Train 3ADGAS Das Island, U.A.E. 2.5mtpa 1994
Arun Train 4 & 5 PertaminaArun, Indonesia.76mtpa x 2 1984
ADGAS Train 1 & 2 ADGAS Das Island, U.A.E. 1.1mtpa x 2 1976
Bontang Train E, F, G Pertamina Bontang, Indonesia 2.3mtpa 1989, 1993, 1997
Sakhalin LNG Train 1 & 2 Sakhalin Energy Sakhalin Island, Russia 4.8mtpa x 2 2008
Oman LNG Train 1 & 2 Oman LNG Qalhat, Oman 3.3mtpa x 2 2000
Qalhat LNG Project Qalhat LNG Qalhat, Oman 3.3mtpa 2005
Qatargas Train 3 Qatargas Ras Laffan, Qatar 2.0mtpa 1998
Qatargas Train 1 & 2Qatargas Ras Laffan, Qatar 2.0mtpa x 2 1997
RasGas II Train 4RasGasII Ras Laffan, Qatar4.7mtpa 2005
RasGas II Train 5RasGas II Ras Laffan, Qatar4.7mtpa 2006
RasGas II Train 3RasGas II Ras Laffan, Qatar4.7mtpa 2003
Qatargas Debottlenecking ProjectQatargas Ras Laffan, Qatar+1.0mtpa x 3 2003, 2004, 2005
Qatargas 2 Train 4 & 5Qatargas 2 Ras Laffan, Qatar7.8mtpa x 2 2007, 2008
RasGas(3) Train 6 & 7RasGas(3) Ras Laffan, Qatar7.8mtpa x 2 2008, 2009
Qatargas 3&4 Train 6 & 7Qatargas 3&4 Ras Laffan, Qatar7.8mtpa x 2 2008, 2009

13
4. Economy of Scale (3/4) : Effect on Design
• Plant area vs. Capacity : LNG Plant Case
- Plant Capacity (106 Ton/Y) 2.5 3.0 4.5 8.0
- Plant Area (Ratio/BASE) BASE 1.7 2.4 3.6
• Effect of Larger Plant on Design
- Design exceeds standard size
- Unbalance between the plant components
- “Design by Analysis” and new “Design by Rule”

14
4. Economy of Scale (4/4) : Challenges
- Updating of Design Standard for Mega-Size Plant Design
- Adoption of Innovative Material / Design for Equip & Mat’l
- Strengthen Manufacturing Infra for Large Equip & Mat’l
Technology exchanges and collaboration between various industries are more important than before

15
5. Smart EPC requisite (1/5) : Quality Requisite
Sophisticated & Mega-sized project
Supply Security
Security of Planned Plant Quality
Reliable and Proven Smart EPC
Reliability of OperationCreditability of Plant Completion
Secu
rity
of P
ayou
t
Security of Planned Product Quality
A number of potential projects.
A huge amount of investment.
Global Environment Measure
Minimization of CAPEX & OPEX
Driv
erProven Technology & Advanced Solution

16
5. Smart EPC requisite (2/5) : Reliability
High Quality
On-Schedule Completion
HSE Management
Risk Management
Reliable Plant for Operation & Maintenance
Cost Effectiveness with High Efficiency
EPC : Engineering, Procurement
& Construction
Maximum Reliability of EPC
17
5. Smart EPC requisite (3/5) : Work Volume
Many varieties of plant processes and site environment. Each project is unique, and the business is hard to standardize or formulate.
Huge amount of information of complex material compositions.(0.5 million sheets of documents, 3 million equipment data).
Complicated dynamically inter-related thousands of activities of E-P-C.
Global work share.
EPC Contractor needs to manage:

18
Enhancement for continuous improvement in quality management system. Utilization of the lessons learnt in the past projects to a fullextent through the well organized and user friendly LL system.
Global operation on a common engineering platform.
Time
Spa
ce
Discipline
5. Smart EPC requisite (4/5) : Countermeasures
Well organized coaching, advice, monitoring and education system to new recruits.
Intelligent and integrated IT system, which allows us to execute all EPC activities in a single consistent virtual plant.

19
Intelligent & IntegratedProject EngineeringSystems
i-PLANT21TMii--PLANT21PLANT21TMTM
Intelligent&
Integrated
CONSTRUCTION
ENGINEERING
i-FIELDConstructionManagement
i-3DIntegrated
3D Plant Design
i-ENGEngineering Database
i-FRONTFront End Engineering
i-PMSProject Management
i-DMSProject Document
Management
i-MATMaterial Management
PROCUREMENT
5. Smart EPC requisite (5/5) : Design IT System

20
6. Summary
Market demands sophisticated complex and mega-sized projects. To realize them, required are;
Proven less energy, environmentally clean technologiesAdvanced solution
Design by Rule => Design by Analysis => New Design by RuleSmart EPC for maximum reliability in project execution.Intelligent and integrated IT system.
Technology exchanges and collaboration between various industries are more important than before.
Shortage of experienced persons has significant impact on the industry’s long-term health. Finding and training new recruits to replace an ageing workforce is a priority for every part of energy business chain.

21
Thank YouThank You


