EPA/600/R-14/336 | September 2014 |www.epa.gov/research Engineering Design and Operation Report: Biological Treatment Process for the Removal of Ammonia from a Small Drinking Water System in Iowa: Pilot to Full-Scale Office of Research and Development
Transcript
EPA/600/R-14/336 | September 2014 |www.epa.gov/research
Engineering Design and Operation Report: Biological Treatment Process for the Removal of Ammonia from a Small Drinking Water System in Iowa: Pilot to Full-Scale
Biological Treatment Process for the Removal of Ammonia from a Small Drinking Water System in Iowa: Pilot to Full-Scale
Prepared by
Darren A. Lytle, Dan Williams, Christy Muhlen, Maily Pham, Keith Kelty U.S. Environmental Protection Agency, Office of Research and Development
National Risk Management Research Laboratory Water Supply and Water Resources Division
26 W ML King Drive Cincinnati, Ohio 45268, United States
Matthew Wildman HR Green, Inc
8710 Earhart Lane SW Cedar Rapids, Iowa 52404, United States
Glenn Lang Water Plant Operator
City of Palo, Iowa 52324, United States
Mitch Wilcox Pegasus Technical Services, Inc.
26 W ML King Drive Cincinnati, Ohio 45268, United States
Melissa Kohne University of Cincinnati
Cincinnati, Ohio 45221, United States
September 2014
1
Notice
The U.S. Environmental Protection Agency, through its Office of Research and Development partially funded and collaborated in the research described herein. It has been subjected to the Agency’s administrative review and has been approved for external publication. Any opinions expressed in this paper are those of the author (s) and do not necessarily reflect the views of the Agency, therefore, no official endorsement should be inferred. Any mention of trade names or commercial products does not constitute endorsement or recommendation for use.
2
Foreword
The U.S. Environmental Protection Agency (EPA) was charged by Congress with protecting the Nation’s land, air, and water resources. Under a mandate of national environmental laws, EPA is tasked with formulating and implementing actions leading to a compatible balance between human activities and the ability of natural systems to support and nurture life. To help meet this mandate, EPA’s research program is providing data and technical support for solving environmental problems today and building a science knowledge base necessary to protect human health and the environment.
The National Risk Management Research Laboratory (NRMRL) is the Agency’s center for investigation of technological and management approaches for preventing and reducing risks from pollution that threaten human health and the environment. NRMRL’s solution-based research program is focused on (1) method and technology development and their cost effectiveness for prevention and control of pollution to air, land, water, and subsurface resources; (2) protection of water quality in public water systems; (3) remediation of contaminated sites, sediments, and groundwater; (4) prevention and control of indoor air pollution; and (5) restoration of ecosystems.
This research provides solutions to environmental problems by developing and promoting technologies that protect and improve the environment. NRMRL’s research advances scientific and engineering information to support regulatory and policy decisions, and provides the technical support and information transfer to ensure implementation of environmental regulations and strategies at the national, state, and community levels. NRMRL collaborates with both public and private sector partners to anticipate emerging challenges and foster the development of technologies that reduce the cost of regulatory compliance.
The information provided in this document will be of use to stakeholders such as state and federal regulators, Native American tribes, consultants, contractors, and other interested parties.
Cynthia Sonich-Mullin, Director
National Risk Management Research Laboratory
3
Abstract
Many regions in the United States have excessive levels of ammonia in their groundwater as a result of natural or agricultural sources. Although ammonia in water does not pose a direct health concern, nitrification (i.e., conversion of ammonia to nitrite and nitrate by bacteria) of significant levels of excessive ammonia from the source water in the drinking water distribution system may pose a concern. Specifically, nitrification in the distribution system leads to potential corrosion problems, oxidant demand, taste and odor complaints, and elevated nitrite levels. In addition, ammonia can interfere with the effectiveness of some drinking water treatment processes.
Across the United States, including small communities like Palo, Iowa, (approx. pop. 1026) there are relatively high levels of ammonia in the drinking water supplies. Palo’s groundwater contains 3.3 mg N/L. Given the negative issues associated with ammonia, there was a serious need for Palo to establish an effective treatment approach to remove it from their water. With the support of the United States Environmental Protection Agency (EPA) Region 7, the Iowa Department of Natural Resources (DNR) and the City of Palo, EPA researchers performed a year-long pilot study in Palo to evaluate the use of an innovative biological drinking water treatment process to remove ammonia from their water. After the success of the pilot study, the DNR approved the city’s plans to construct a full-scale treatment system based on the design and operating configurations identified during the pilot study. The objective of this study was to document the operation and treatment effectiveness of the city of Palo’s innovative full-scale biological ammonia removal drinking water treatment plant. The treatment plant engineering design criteria and operating conditions are presented, and development of the project from pilot to full-scale is discussed. Lastly, lessons learned from the project, and future considerations when designing and operating biological treatment systems for ammonia reduction are presented.
4
Table of Contents Foreword ...................................................................................................................................................... 3
List of Figures ................................................................................................................................................ 6
List of Tables ................................................................................................................................................. 7
Abbreviations and Acronyms ....................................................................................................................... 8
2.3.4 Chemical Feed and other Design Features ................................................................................. 22
2.3.5 Distribution System .................................................................................................................... 22
2.3.6 System Start-Up. ........................................................................................................................ 22
2.3.7 Water Treatment Plant Operation ............................................................................................. 23
3. Materials and Methods .......................................................................................................................... 24
3.1 Field Sampling ................................................................................................................................... 24
3.2 Water Quality Analysis ...................................................................................................................... 24
4.1 Important Dates ................................................................................................................................ 26
4.2 General Source Water Chemistry ..................................................................................................... 27
4.3 Removal of Ammonia in Source Water ............................................................................................. 30
4.10 Other ............................................................................................................................................... 48
5. Conclusions and Recommendations ...................................................................................................... 49
Figure 1. Map of ammonia levels in Iowa based on groundwater well analyses (1998–2012) provided by the State of Iowa (star is the approximate location of the City of Palo). ................................................... 11 Figure 2. Schematic of the pilot biological ammonia removal treatment technology system. ................. 14 Figure 3. Pilot biological water treatment system for ammonia removal at the Palo, Iowa study site. .... 14 Figure 4. Photographs of the new (a) well, (b) water main, and (c) water tower in Palo, Iowa. ............... 17 Figure 5. Schematic of the City of Palo’s water treatment plant. .............................................................. 18 Figure 6. Photographs of (a) aeration contactors, (b) contactor media and piping, (c) aeration contactors and air blowers, and (d) aerated contactor surface. .................................................................................. 20 Figure 7. Photograph of pressure filters. .................................................................................................... 21 Figure 8. Chemical feed pictures of a) pipe configuration, and b) phosphate feed tanks. ........................ 22 Figure 9. Water treatment plant building................................................................................................... 23 Figure 10. Nitrogen balance in contactor 1 effluent (ammonia failed quality check on day 34 and nitrate failed on day 139). ...................................................................................................................................... 30 Figure 11. Nitrogen balance in contactor 2 effluent. ................................................................................. 31 Figure 12. Nitrogen balance in filter 1 effluent (ammonia failed quality check on day 34 and nitrate failed on day 139). ................................................................................................................................................ 34 Figure 13. Nitrogen balance in filter 2 effluent (ammonia failed quality check on day 34 and nitrate failed on day 139). ................................................................................................................................................ 35 Figure 14. Nitrogen balance in filter 3 effluent (ammonia failed quality check on day 34 and nitrate failed on day 139). ................................................................................................................................................ 35 Figure 15. Nitrogen balance in finished water (ammonia failed quality check on day 34 and nitrate failed on day 139). ................................................................................................................................................ 36 Figure 16. On-site temperature measurements through treatment plant (winter [1/15 to 4/21/2014], spring [4/22 to 6/20/2014], summer [6/21 to time of report preparation]). ............................................ 37
6
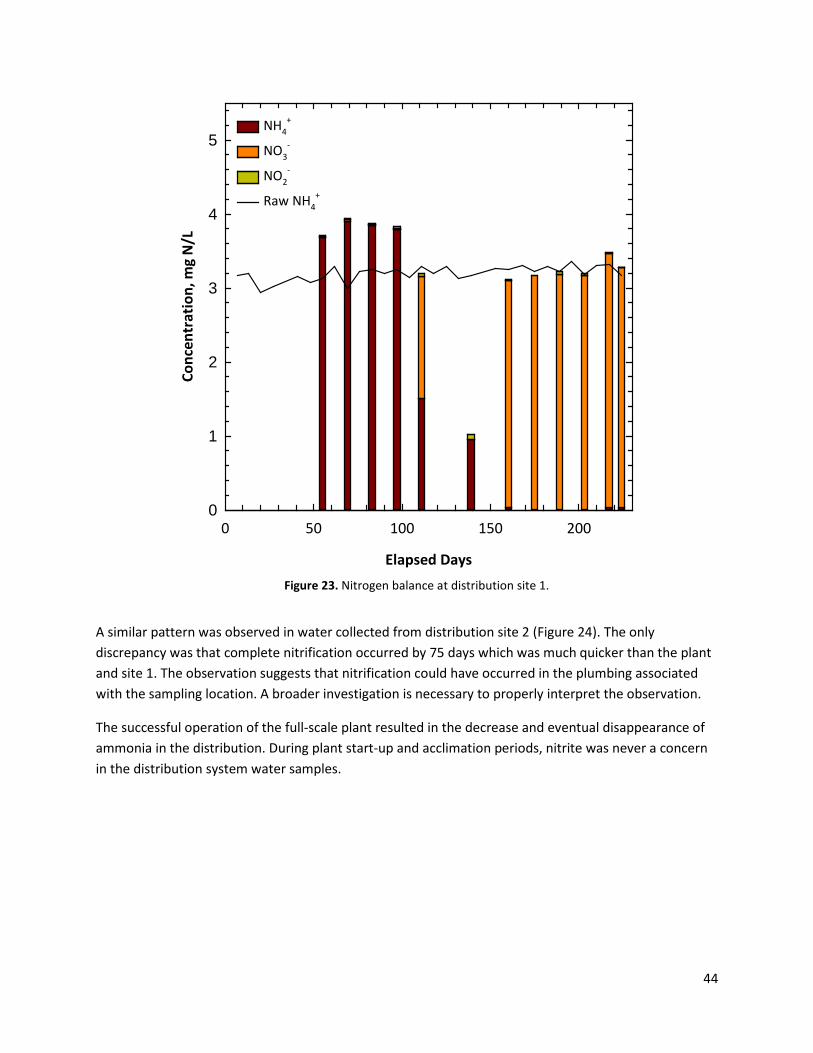
Figure 17. Total and free chlorine in the finished water. ........................................................................... 38 Figure 18. Field pH measurements through treatment plant. ................................................................... 39 Figure 19. Field vs analytical ortho- and total phosphate in finished water. ............................................. 40 Figure 20. Dissolved oxygen levels throughout treatment. ....................................................................... 41 Figure 21. Total alkalinity throughout treatment. ...................................................................................... 42 Figure 22. Heterotrophic plate count measurements through the treatment plant and at one distribution system location. .......................................................................................................................................... 43 Figure 23. Nitrogen balance at distribution site 1. ..................................................................................... 44 Figure 24. Nitrogen balance at distribution site 2. ..................................................................................... 45 Figure 25. Nitrite concentration through treatment plant and distribution system. ................................. 47 Figure 26. Bench ammonia vs laboratory ammonia results. ...................................................................... 48
List of Tables
Table 1. Quality Analysis of Palo, Iowa’s Drinking Water Source. .............................................................. 11 Table 2. Palo, Iowa drinking water distribution and treatment project schedule. .................................... 16 Table 3. Engineering and operational design parameters of pilot and full-scale treatment systems. ...... 19 Table 4. Water quality analyses performed and methods (* indicates random sampling). ...................... 25 Table 5. Timeline of operational changes for treatment plant. ................................................................. 27 Table 6. Extensive water quality analyses of the source water, contactor and filter effluents and finished waters over the operation of the Palo treatment plant (average ± standard deviation [# samples]). *= pending analytical results, NA= not analyzed. ............................................................................................ 29 Table 7. Water plant and distribution system monitoring requirements for Palo, IA set by the Iowa DNR (*Distribution system sample rotated among several locations pre-identified by Iowa DNR field staff). . 46 Table 8. Estimated and actual project costs. .............................................................................................. 47
7
Abbreviations and Acronyms
ATP Adenosine Triphosphate CaCO3 Calcium Carbonate CDBG Community Development Block Grant CO2 Carbon Dioxide DNA Deoxyribonucleic Acid DNR State of Iowa Department of Natural Resources EPA United States Environmental Protection Agency H Hydrogen H2O Water HCO3 Bicarbonate Ions HPC Heterotrophic Plate Count HUD Housing and Urban Development MCL Maximum Contaminant Level N Nitrogen NH3 Ammonia NH +
4 Ammonium NO -
2 Nitrite NO -
3 Nitrate O2 Oxygen ORD EPA Office of Research and Development PO4 Phosphate PVC Polyvinyl Chloride RO Reverse Osmosis WHO World Health Organization
8
Acknowledgments
The authors would like to thank Michelle Latham, Tom Sorg and John Olszewski of the U.S. Environmental Protection (EPA) for providing technical and quality assurance reviews of the document. The authors would also like to thank Andrew Roberts, Amber Seaman, Scott Lippett, Zach Radabaugh and Colin White with the University of Cincinnati, and Roberta Campbell with the Senior Environmental Employee program of the EPA for performing water analyses and providing assistance in report preparation and review. The authors would like to thank Jennifer Bunton with the Iowa DNR for initiating the project and providing valuable suggestions, and the City of Palo, Iowa, for supporting the work. Lastly, the authors would like to thank Brenda Groskinsky of EPA Region 7 for support and suggestions on the project. This work was performed under EPA’s Regional Applied Research Effort (RARE) program with EPA Region 7.
9
1. Background
1.1 Ammonia in Drinking Water Sources
Many regions in the United States have excessive levels of ammonia in their drinking water sources (e.g., ground and surface waters) as a result of naturally occurring processes, agricultural and urban runoff, concentrated animal feeding operations, municipal wastewater treatment plants, and other sources. Ammonia is not regulated by the U.S. Environmental Protection Agency (EPA) as a contaminant. Based on a 2003 World Health Organization (WHO) assessment, ammonia levels in groundwater are typically below 0.2 milligrams per liter (mg/L), and do not pose a direct health concern at levels expected in drinking water (WHO 2003); however, they may pose a concern when nitrification of significant levels of ammonia from the source water occurs in the drinking water distribution system. Specifically, this nitrification, which is the conversion of the ammonia to nitrite and nitrate by bacteria, leads to water quality issues, such as potential corrosion problems, oxidant demand, taste and odor complaints, and elevated nitrite levels (Bremer et al., 2001; Fleming et al., 2005; Lee et al., 1980; Odell et al., 1996; Rittman & Snoeyink, 1984; Suffet et al., 1996). The EPA’s regulatory limits for nitrite and nitrate (at the entry point to the distribution system) are 0.1 and 10 mg N/L, respectively.
Ammonia in water may also pose problems with water treatment effectiveness. For example, in source waters containing both ammonia and arsenic, the ammonia may negatively impact the removal of arsenic by creating a chlorine demand, therefore reducing the availability of chlorine needed to oxidize the arsenic (Lytle et al., 2007). Lastly, water systems that have ammonia in their source water, and desire to maintain a free chlorine residual, will need to add additional chlorine to overcome the demand of ammonia, or have potential difficulty in meeting contact times needed to achieve disinfection goals. Clearly, the complete oxidation of source water ammonia prior to or as part of the water treatment process would eliminate potential negative impacts of nitrification on distribution system water quality.
1.2 Study Community: Palo, Iowa
Palo, Iowa is a small community of 1,026 people located 7 miles (11.3 km) west of Cedar Rapids. Prior to 2008, the community did not have centralized water treatment or a drinking water distribution system. Following extensive flooding to the region in 2008, support to build the necessary infrastructure to supply the community with potable drinking water was put into place. The treatment system needed to be designed to address elevated levels of ammonia and iron in the source water. The State of Iowa’s DNR requested assistance from EPA‘s Office of Research and Development (ORD) to develop an appropriate treatment system to address the source water concerns. Specifically, ORD’s experience in applying biological water treatment to remove ammonia from water was requested. As a result, the State of Iowa DNR, and EPA ORD and Region 7, conducted a pilot study to evaluate the impact of biological water treatment on ammonia oxidation.
10
1.3 Elevated Ammonia Levels in Palo, Iowa
The Midwest is particularly impacted by ammonia in source waters from natural sources, agricultural runoff, and other farming practices. For example, the State of Iowa has a widespread distribution of ammonia in well waters across its communities (Figure 1). Water quality testing of the source groundwater in Palo, Iowa (Table 1.3.1) showed that, on average, ammonia levels were 3.3 mg of nitrogen (N)/L.
Although the focus of this report is on ammonia contamination, it is relevant to note that the water contained an average of 0.82 mg/L of iron. Similar to ammonia, iron in drinking water does not pose a direct health concern. However, there is an EPA recommended, non-enforceable National Secondary Drinking Water Regulation Standard of 0.3 mg/L for iron, which is based on aesthetic and technical issues, rather than health-based concerns. Specifically, iron in the water can cause a metallic taste, discoloration of the water, staining of faucet and fixtures, and sediment build-up. Given the negative issues associated with high ammonia levels in drinking water, and with the added issues from the high levels of iron, there is a clear need to establish effective treatment approaches to address these issues. Furthermore, the State of Iowa Department of Natural Resources (DNR) can request water systems to monitor nitrite and nitrate in their distribution systems, should they suspect that nitrification is occurring in their distribution system, and enforce the respective regulatory limits if they are exceeded.
Table 1. Quality Analysis of Palo, Iowa’s Drinking Water Source.
Figure 1. Map of ammonia levels in Iowa based on groundwater well analyses (1998–2012) provided by the State of Iowa (star is the approximate location of the City of Palo).
11
1.4 Ammonia Treatment Options
The most commonly used water treatment options for addressing elevated ammonia in source waters are the formations of monochloramine and breakpoint chlorination. Breakpoint chlorination results in the removal of ammonia as nitrogen gas by a chemical reaction with chlorine; typically in the range of 8 to 11 times the mg N/L ammonia present. For a community such as Palo, Iowa, this would be a very high chlorine dose. The formation of monochloramine involves the addition of chlorine to concentrations where ammonia is not removed but rather bound to chlorine. Other approaches including ion exchange with zeolites, reverse osmosis (RO), advanced oxidation, and air stripping, are capable of removing ammonia from water, but are relatively complex, expensive, or have limited applications.
Although often performed unintentionally, biological ammonia “removal”1 is another treatment approach to reduce source water ammonia. The process relies on bacteria to convert ammonia to nitrate. As a result, a more biologically-stabile water is produced, nitrification in the distribution system is not an issue, and free chlorine residual is easily achieved. Biological conversion of ammonia (NH3) to nitrate (NO3
-) involves a two-step sequence of reactions mediated by two different genera of bacteria: Nitrosomonas and Nitrospira. These autotrophic bacteria derive energy for cellular functions from the oxidation of ammonia and nitrite, respectively. Nitrosomonas are responsible for the oxidation of ammonia, in the form of ammonium (NH4
+), to nitrite (NO2-) according to the reaction:
NH4+ + 1.5 O2 → NO2
- + H2O + 2H+
Nitrospira subsequently oxidizes nitrite to nitrate, as follows:
NO2- + 0.5 O2 → NO3
-
By summing these equations, the overall nitrification reaction is obtained:
NH4+ + 2 O2 → NO3
- + 2 H+ + H2O
It should be noted that these equations are net reactions involving a complex series of enzyme-catalyzed intermediate steps. Nitrification produces free protons, H+ which readily consume available bicarbonate ions (HCO3
-), thereby reducing the buffering capacity of the water. In addition, nitrifying bacteria consume CO2 to build new cells. The total consumption of alkalinity by nitrification is 7.1 mg as CaCO3 per mg NH4
+- N oxidized (US EPA, 1975). The oxygen demand of nitrification is also significant. For complete nitrification, 4.6 mg O2 is required per mg NH4
+- N oxidized (US EPA, 1975; US EPA 1993).
Other factors that affect nitrification include phosphate concentration, pH, and water temperature. All organisms including nitrifying bacteria require phosphorus to build cell mass, with approximately 3% of dry weight consisting of phosphorus. Microorganisms use phosphate as the source of phosphorus for
1 The terms “removal” and “oxidation” will be used interchangeably throughout this document. “Removal” is used to represent the conversion of ammonia to nitrate and/or nitrite by biological oxidation. It is recognized that treatment does not physically remove ammonia-nitrogen but rather converts the form of nitrogen (i.e., total of ammonia, nitrite, and nitrate).
(1)
(2)
(3)
12
the synthesis of structural and physiological biomolecules such as deoxyribonucleic acid (DNA), phospholipids (membranes), teichoic acid (cell walls), and most importantly, as inorganic phosphorus in adenosine triphosphate (ATP) synthesis. Without ATP, the cellular metabolism (i.e. nitrification) cannot proceed and the cells either become dormant or die. Some organisms are more sensitive to phosphate starvation than others, and in the case of nitrification, ammonia oxidizing bacteria are less sensitive than nitrite oxidizing bacteria (de Vet et al., 2012; Scherrenberg et al., 2011; Scherrenberg et al., 2012).
Numerous laboratory studies have cited the optimum pH for complete nitrification is between 7.4 and 8.0; although in practice, the bulk water pH may deviate from this value while nitrification remains high (Shammas, 1986). Temperature can impact growth rate and metabolism by slowing or destroying necessary enzymes and proteins involved in physiological processes. Laboratory studies have demonstrated that the growth rate of nitrifying bacteria is negatively impacted by temperatures below 10°C, although adjustments to the treatment process can be made to enhance nitrification in colder climates (Andersson, et al., 2001).
1.5 Biological Ammonia Treatment Limitations Nitrification is a two-step, microbiological process that requires oxygen (aerobic) to oxidize NH4
+ to NO2-,
and then to NO3-. The entire process requires approximately 4.5 mg of O2/mg of NH4
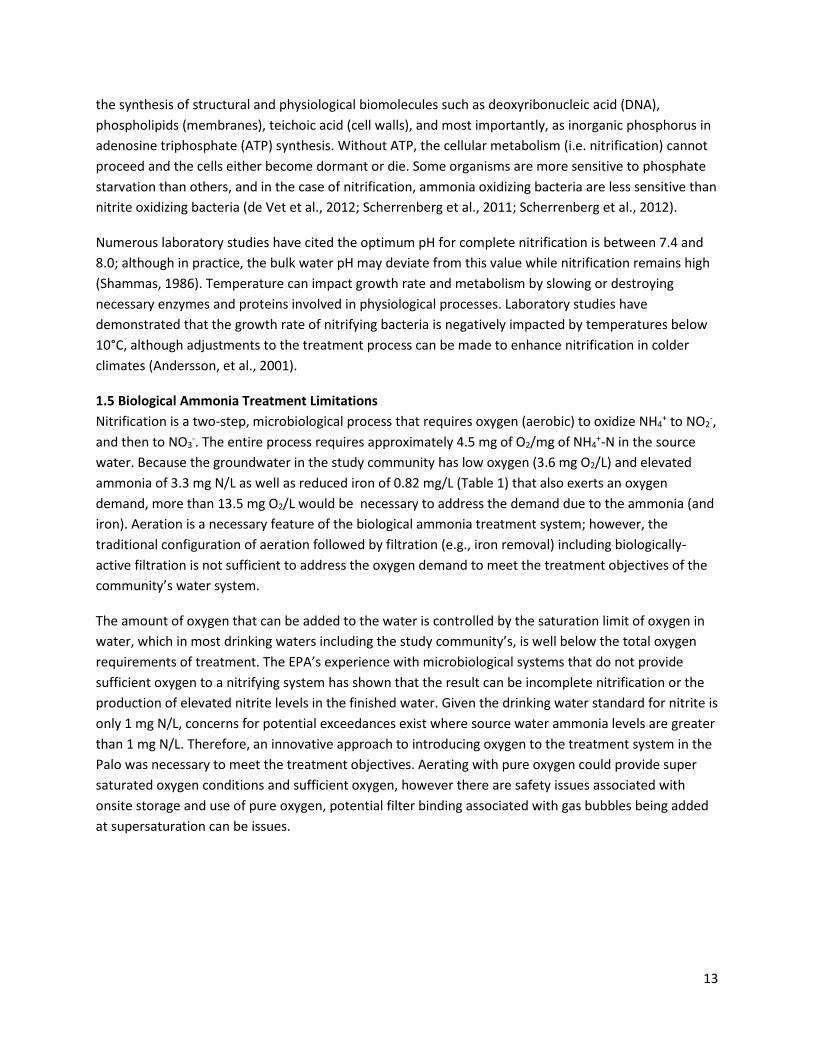
+-N in the source water. Because the groundwater in the study community has low oxygen (3.6 mg O2/L) and elevated ammonia of 3.3 mg N/L as well as reduced iron of 0.82 mg/L (Table 1) that also exerts an oxygen demand, more than 13.5 mg O2/L would be necessary to address the demand due to the ammonia (and iron). Aeration is a necessary feature of the biological ammonia treatment system; however, the traditional configuration of aeration followed by filtration (e.g., iron removal) including biologically-active filtration is not sufficient to address the oxygen demand to meet the treatment objectives of the community’s water system.
The amount of oxygen that can be added to the water is controlled by the saturation limit of oxygen in water, which in most drinking waters including the study community’s, is well below the total oxygen requirements of treatment. The EPA’s experience with microbiological systems that do not provide sufficient oxygen to a nitrifying system has shown that the result can be incomplete nitrification or the production of elevated nitrite levels in the finished water. Given the drinking water standard for nitrite is only 1 mg N/L, concerns for potential exceedances exist where source water ammonia levels are greater than 1 mg N/L. Therefore, an innovative approach to introducing oxygen to the treatment system in the Palo was necessary to meet the treatment objectives. Aerating with pure oxygen could provide super saturated oxygen conditions and sufficient oxygen, however there are safety issues associated with onsite storage and use of pure oxygen, potential filter binding associated with gas bubbles being added at supersaturation can be issues.
13
1.6 Biological Ammonia Treatment Pilot Study
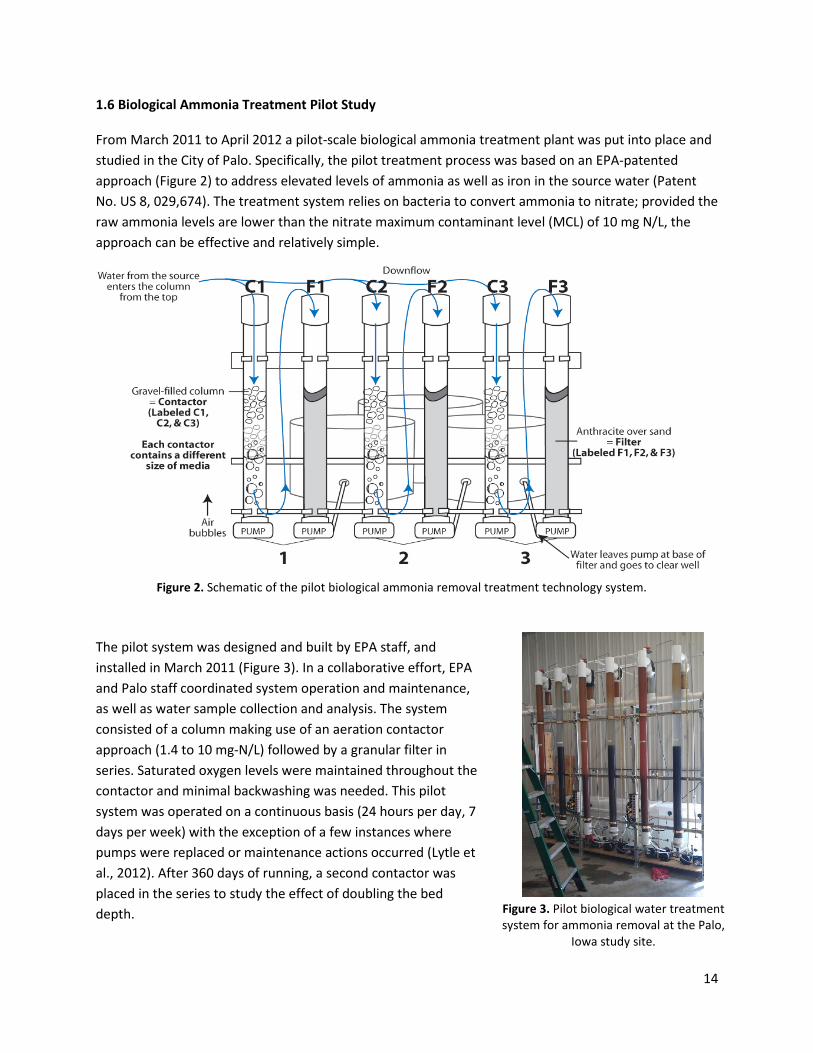
From March 2011 to April 2012 a pilot-scale biological ammonia treatment plant was put into place and studied in the City of Palo. Specifically, the pilot treatment process was based on an EPA-patented approach (Figure 2) to address elevated levels of ammonia as well as iron in the source water (Patent No. US 8, 029,674). The treatment system relies on bacteria to convert ammonia to nitrate; provided the raw ammonia levels are lower than the nitrate maximum contaminant level (MCL) of 10 mg N/L, the approach can be effective and relatively simple.
The pilot system was designed and built by EPA staff, and installed in March 2011 (Figure 3). In a collaborative effort, EPA and Palo staff coordinated system operation and maintenance, as well as water sample collection and analysis. The system consisted of a column making use of an aeration contactor approach (1.4 to 10 mg-N/L) followed by a granular filter in series. Saturated oxygen levels were maintained throughout the contactor and minimal backwashing was needed. This pilot system was operated on a continuous basis (24 hours per day, 7 days per week) with the exception of a few instances where pumps were replaced or maintenance actions occurred (Lytle et al., 2012). After 360 days of running, a second contactor was placed in the series to study the effect of doubling the bed depth.
Figure 2. Schematic of the pilot biological ammonia removal treatment technology system.
Figure 3. Pilot biological water treatment system for ammonia removal at the Palo,
Iowa study site.
14
In April of 2012, the pilot system was deemed a success and the decision to move toward full-scale was made. The pilot system provided new and very important findings that will improve the drinking water field’s understanding of biological water treatment in general and how to effectively operate such systems. The key research findings cited directly from EPA’s published pilot study report (Lytle et al., 2012) are as follows:
• Once optimized, the biological pilot system achieved the treatment goal of completely oxidizing all of the ammonia in the source groundwater to nitrate. Complete oxidation of ammonia all the way to nitrate was eventually achieved in the contactor (Contactor 1) that contained 30 inches (76.2 cm) of small gravel. The addition of air at the base of the contactor was a necessary design feature to address the oxygen demand of the nitrification process and iron oxidation.
• A dual media (20 inches [50.8 cm] anthracite/10 inches [25.4 cm] sand) filter (Filter 1) after the contactor provided additional ammonia/nitrite oxidation, and achieved excellent and consistent iron removal.
• The source water contained very little phosphorus. Orthophosphate is an important biological nutrient and its addition was necessary to increase the rate of microbial acclimation, particularly with regards to nitrite oxidizing bacteria. The system responded almost immediately to the addition of orthophosphate. A dose of 0.3 mg PO4/L was used in the pilot. The orthophosphate feed was terminated for an extended period of time during which no negative impact on the system’s performance was noted.
• Maintaining near saturated dissolved oxygen levels in the contactor was critical to the operation and process effectiveness in achieving desired ammonia oxidation and iron removal. Drop in dissolved oxygen levels due to diffuser “clogging” resulted in delayed oxidation of ammonia in the contactor and release of nitrite. Dissolved oxygen monitoring was a good process measurement tool and must be incorporated into full-scale operation. Diffuser design will also be very important engineering aspect of the full-scale system.
• Contactor and filter loading rates were important operating variables, although the pilot system was more sensitive to orthophosphate and oxygen concentration. The pilot demonstrated that a contactor and filter operated in series at loading rates of 2.2 gpm/ft2 (5.6 m/hr) and 2.0 gpm/ft2
(5 m/hr), respectively, met desired finished water quality objectives.
• Alkalinity decrease following nitrification in the systems was predicted by theoretical considerations and could be used as an additional process monitoring tool.
• Contactor maintenance was minimal. Although, not systematically evaluated during the pilot, there was some evidence to suggest backwashing an acclimated contactor was beneficial. As a result, monthly backwash of the contactors is recommended. Similarly, minimal filter maintenance was necessary. Filters were backwashed only once a week by achieving 50% bed expansion for 15 minutes.
15
2. Full-Scale Treatment Plant Design and Operation
2.1 EPA Study Objective
The objective of this study was to document the operation and treatment effectiveness of the city of Palo, Iowa’s innovative full-scale biological ammonia and iron removal drinking water treatment plant. The treatment plant engineering design criteria and operating conditions are presented. The evaluation of the project from pilot to full-scale is discussed. Lastly, lessons learned from the project, and future considerations when designing and operating biological treatment systems for ammonia reduction are presented. The treatment plant represents the first full-scale biological drinking water treatment system specifically designed to address elevated ammonia in the United States.
2.2 Palo Project Timeline
The City of Palo, Iowa, prior to 2008, had no community-wide public drinking water system, but instead was supplied drinking water through individual or neighborhood wells. In 2010, Palo secured the services of the engineering firm HR Green, Inc. Under the leadership of Project Manager Matthew Wildman, PE, of HR Green, an engineering report was completed that evaluated source water, distribution system, treatment and storage options. Based on the report, recommendations were made to provide the City both potable water and sufficient fire protection. As previously noted, the State of Iowa DNR required a drinking water treatment process that would address elevated ammonia and iron in Palo’s source water. The City received a Community Development Block Grant (CDBG) from the United States Department of Housing and Urban Development (HUD) to support the project. The engineering report was completed in August 2010 and by January 2014, the distribution system and water treatment plant were completed, and residents receive treated drinking water (project timeline summarized in Table 2).
Project Schedule Engineering Report August 2010
Pilot Plant March 2011 to April 2012
Bid—Well, Water Main, Tower December 2011
Well Construction January 2012 to August 2012
Water Main Construction January 2012 to November 2013
Tower Construction March 2012 to July 2013
Bid—Water Treatment Plant January 2013
Iowa DNR Approval of Pilot April 2013
Water Treatment Plant Construction April 2013 to January 2014
Table 2. Palo, Iowa drinking water distribution and treatment project schedule.
16
As already noted in Section 1.6, the EPA and Palo staff performed a year-long pilot study in Palo to assess the effectiveness of a unique biological treatment approach to address elevated ammonia and iron in the source water between March and April, 2012. In December 2011, bids for the new well drilling, water main installation and water tower construction were awarded. The construction of the well, main and tower were completed by July 2013 (Figure 4). During the time prior to the completion of the treatment plant, a limited but growing number of connections in the city were supplied raw ground water treated with chlorine. Given the elevated ammonia in the source water, the system was likely considered to be a chloraminated system although chlorine was added. The bid for the water treatment plant construction went out in January 2013 and the Iowa DNR approved the pilot and plant design in April 2013 (Table 2). The water treatment plant was constructed between April 2013 and January 2014. It took nearly 3.5 years for the City of Palo to complete the project.
Figure 4. Photographs of the new (a) well, (b) water main, and (c) water tower in Palo, Iowa.
(a) (b)
(c)
17
2.3 Water Treatment System Technology Engineering and Design Specifications
As previously described in Section 1.6, the Palo water treatment plant is based on an EPA-patented approach to address elevated levels of ammonia as well as iron in the source water (Patent No. US 8, 029,674). The primary unit processes in the treatment train are the “aeration contactors”, blowers and dual media filters (Figure 5). Also included in the treatment train are phosphate (blended phosphate) feed, chlorine (sodium hypochlorite) feed and sodium hydroxide (caustic) feed. The new drinking water treatment system was designed to service a population of 1,139 people with an average daily demand of 0.115 million gallons/day (MGD), equivalent to 0.44 million L/day, and a peak daily demand of 0.23 million MGD (0.87 million L/day). Using a system design flow rate of 300 gpm (1,136 L/min), the treatment plant would operate an average of approximately 6.4 hours/day and as much as 12.8 hours/day during peak demand. Following the two contactors were two high service pumps with variable frequency drives to help control the level in the contactors. The two pumps fed into a common header that dosed the three, dual-media pressure filters sized for 100 gpm each. The pressure filters were designed to remove any iron that was oxidized and passed through the contactors. The finished water then passed through a monitoring station and into the new 200,000-gallon water tower prior to entering the new distribution system.
Figure 2.3.1. Schematic of the City of Palo’s water treatment plant.
Figure 5. Schematic of the City of Palo’s water treatment plant.
18
The engineering design features and parameters of the full-scale plant were based on the pilot study findings (Lytle et al., 2012). Table 3 summarizes the major engineering design and operating parameters of the pilot- and full-scale systems. The City receives water from two wells; the original well (designated as “well 2”) which has a capacity of 320 gpm (1,211 L/min) and the new well developed under the project (“well 3”) which has a capacity of 180 to 200 gpm (681 L/min to 757 L/min). The wells are within approximately 600 yards of each other and have similar water quality. Well 2 was used entirely during the pilot study.
Table 3. Engineering and operational design parameters of pilot and full-scale treatment systems.
19
2.3.1 Aeration Contactor Design. The treatment plant used two cylindrical aluminum up-flow aeration contactors (Figure 6a) (designated as contactor 1 and 2) configured in parallel. Each contactor was 10.5 ft (3.2 m) in diameter and 10 ft (3.05 m) high, and filled with 45 inches (114 cm) of gravel with effective size of ¼ inch (0.65 cm). Air was delivered to the bottom of the contactor at a rate of 1.5 cfm/ft2 (0.40 m) through a network of non-clogging, horizontally-slotted plastic distributers (Figure 6b) using a Delta rotary positive displacement blower unit (Figure 6c). Each contactor has a dedicated blower, however, both blowers can direct air flow into one contactor during the backwash process to increase air, scour the media and dislodge any trapped sediment or loose biomass.
Raw water was pumped into the bottom of the contactor at a rate of 2.2 gpm/ft2 (5.6 m/hr), although under normal operation water is pumped at a rate of 1.7 gpm/ft2 (4.3 m/hr) so that water flow is upward and co-current with the air flow. This configuration differed from the pilot (counter-current operation), but was thought to reduce any likelihood of flow restrictions or blockages through the contactor. Similar pilot studies performed elsewhere in Iowa at the time of design showed no difference in performance between counter- and co-current contactor operations (Lytle, et al., 2014a). Contactors can be backwashed with raw water if necessary at a rate of 15 gpm/ft2 (0.63 m/min) for 7 minutes. This backwash condition will not expand the bed but remove loosely attached particles and biofilm from the
(a)
Figure 6. Photographs of (a) aeration contactors, (b) contactor media and piping, (c) aeration contactors and air blowers, and (d) aerated contactor surface.
(b)
(c) (d)
20
gravel. HR Green performed volatile gas measurements and determined there was no requirements for specialized ventilation above the contactors.
2.3.2 Blower Design. Two rotary positive displacement three-lobe blowers were used to deliver air to the contactors. The blower performance criteria include maximum blower speed of 2,700 rpm, discharge pressure rise of 4.5 psig (31.03 kPa), and maximum motor Hp 7.5 (5.6 kW). The blowers deliver 130 standard cubic feet per minute (SCFM) at 4.5 psig (3.68 m3/min at 31.03 kPa). Air is pulled from outside of the building and as a result is subject to seasonal temperature changes.
2.3.3 Filter Design. The treatment plant used three parallel 100 gpm (378 L/min) dual media steel pressurized tanks (100 psig) (689.5 kPa) (designated as filters 1, 2, and 3) and operated at a loading rate of 2.2 gpm/ft2 (5.6 m/hr). The filter design differed from the pilot in that the pilot filters were operated under gravity feed. Pressurized filters are commonly used in the region to remove iron and, although not evaluated for ammonia removal, were not anticipated to be detrimental. The filters were designed to be biologically active, and provide additional ammonia and nitrite oxidation should the contactors not sufficiently address the ammonia load from the raw water. Each filter was 6 feet, 6 inches (198 cm) in diameter and 5 feet (152 cm) high, and contained 20 inches (51 cm) of anthracite (0.04 inch [0.1 cm] effective size) over 10 inches (25 cm) of sand (0.018 inch [0.046 cm] effective size) (Figure 7).
The filter backwash design rate is 17 gpm/ft2 (0.72 m/min) to achieve 50% filter bed expansion for 15 minutes. The frequency of backwash was established during full-scale operation to only be once per three weeks such that only one filter was backwashed per week. Filters were backwashed with finished chlorinated water. Filters were backwashed with non-chlorinated water in the pilot to avoid destroying the nitrifying biofilm. The backwash procedure in the full-scale system will be examined to identify
Figure 7. Photograph of pressure filters.
21
whether using chlorinated backwash water has a negative effect on biological activity within the filters. Past work that documented a full-scale biologically active nitrifying water treatment plant in Ohio that used chlorinated finished water to backwash the filters showed no negative impact on the nitrifying ability of the filter (Lytle et al., 2007)
2.3.4 Chemical Feed and other Design Features. The treatment plant was designed with three chemical feed capabilities (Figure 8). Phosphate is fed using a LMI (Milton Roy) Pulsafeeder Series positive displacement chemical metering pump ahead of the contactors to achieve a desired orthophosphate concentration of 0.3 mg PO4/L. Phosphate is used to provide the necessary nutrients to the nitrifying biomass as identified in the pilot study (Lytle et al., 2012). A blended phosphate (75%/25% poly/ortho phosphate) chemical was used in the full-scale plant whereas the pilot called for a straight orthophosphate feed chemical. The discrepancy was not expected to pose an issue because the target phosphate dose is based on the orthophosphate fraction. A straight orthophosphate chemical will be used in the future. Sodium hypochlorite is fed after the filters to achieve a total chlorine residual of 2 mg Cl2/L using a LMI (Milton Roy) Pulsafeeder Series positive displacement chemical metering pump. Lastly, sodium hydroxide can be fed ahead of the filters to compensate for potential pH drop in the contactor (as a result of nitrification) to avoid corrosion issues in premise plumbing. The desired pH of the finished water 8.
2.3.5 Distribution System. The City of Palo’s new distribution consists of 8 miles of 6 and 8 inch diameter C900 PVC and ductile iron valves, and has 385 connections. Treated water was released into the city’s new water system and transported to a 200,000 gallon elevated, spheroid storage tank via an eight inch C900 PVC water main. The system is pressurized to 65 psi using the two high service pumps in the water treatment plant.
2.3.6 System Start-Up. Recognizing the potential for elevated nitrite levels to be produced during contactor and filter acclimation periods, the system was incrementally started. That is contactor 2 and filters 1, 2 and 3 were started up initially. Treated water was monitored daily for ammonia, nitrite, and
(a) (b)
Figure 8. Chemical feed pictures of a) pipe configuration, and b) phosphate feed tanks.
22
nitrate to make sure effluent nitrite levels were not increasing too rapidly and to help the city avoid violating the MCL for nitrite. When nitrite levels began to exceed 0.3 mg/L, treated water was redirected to the sanitary sewer and raw water from the wells was fed into the distribution system. The water treatment plant was drained to waste 4 to 5 hr/day, 5 days a week while there was an operator available to monitor the tower. Once the nitrite levels in the treated water consistently dropped below 0.1 mg/L, the treated water was returned to the distribution system and contactor 1 was placed in service.
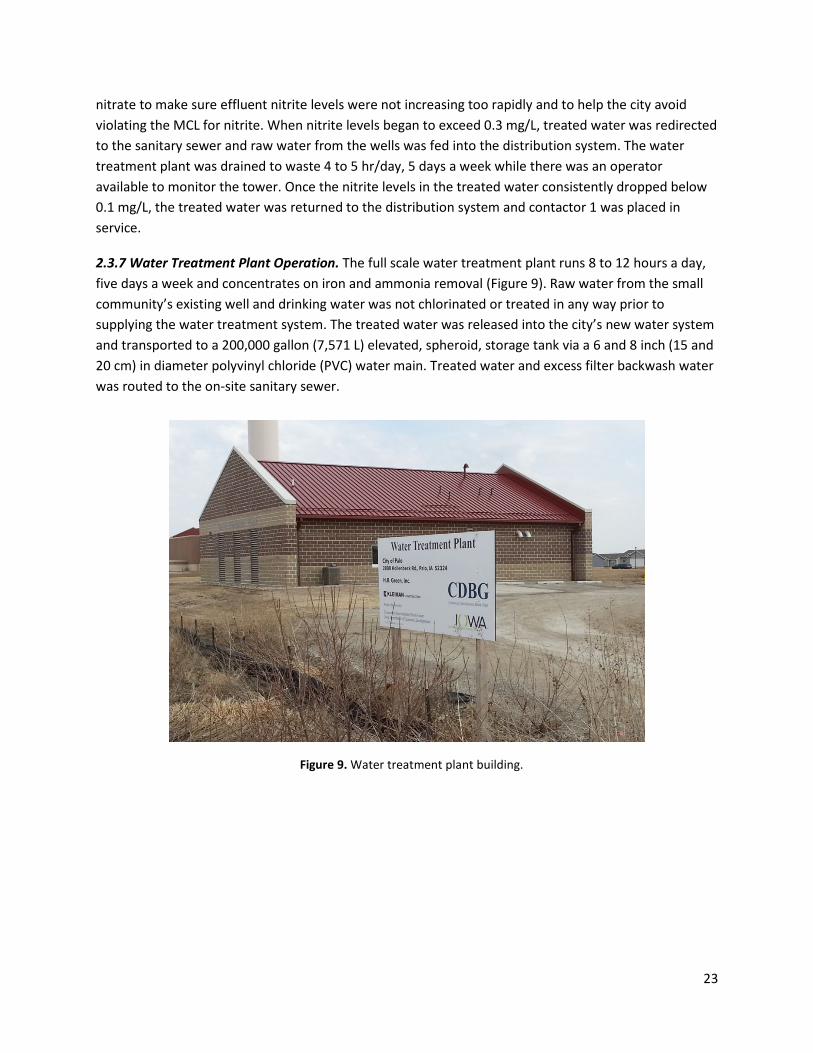
2.3.7 Water Treatment Plant Operation. The full scale water treatment plant runs 8 to 12 hours a day, five days a week and concentrates on iron and ammonia removal (Figure 9). Raw water from the small community’s existing well and drinking water was not chlorinated or treated in any way prior to supplying the water treatment system. The treated water was released into the city’s new water system and transported to a 200,000 gallon (7,571 L) elevated, spheroid, storage tank via a 6 and 8 inch (15 and 20 cm) in diameter polyvinyl chloride (PVC) water main. Treated water and excess filter backwash water was routed to the on-site sanitary sewer.
Figure 9. Water treatment plant building.
23
3. Materials and Methods
3.1 Field Sampling
Field operating and basic water quality measurements were made by Palo’s water plant operator. On-site water quality measurements include temperature, dissolved oxygen, nitrite, free and total chlorine, and pH. Dissolved oxygen, pH, and temperature were measured using an HQ40d meter with an LD101 dissolved oxygen probe and PHC281 pH probe (HACH Company, Loveland, CO). Headloss, flowrates and other operating treatment system conditions were recorded.
3.2 Water Quality Analysis
Weekly, EPA shipped a cooler containing pre-labelled sample bottles, a chain of custody form, and an overnight return shipping label to the city. Palo staff collected weekly water quality samples, made routine water quality measurements and recorded results on the chain of custody form, and shipped them overnight on ice to the EPA laboratory in Cincinnati, Ohio, for analysis. Water samples were collected from the raw (or source), raw water after phosphate addition, raw water after both contactor effluents, raw water after all three filter effluents, finished (treated) water (post chlorine addition, entry point to the distribution system) and water from two distribution system locations. The following water samples were collected on a weekly basis from most locations:
• 250 mL for inorganic analysis (e.g., alkalinity, ammonia, nitrite, nitrate, orthophosphate, etc...)
• 60 mL for metals analysis (e.g., iron, calcium, magnesium, etc…)
• 250 mL for bacteriological analysis (heterotrophic plate counts [HPCs])
• 40 mL for total organic carbon (TOC) analysis
Upon arrival at EPA, the samples, along with the chain of custody form, were removed from the cooler, preserved accordingly, and submitted for analysis. Free and total chlorine, and pH of the samples were measured as a screen with the understanding that they are not reliable reportable numbers. Ammonia was also measured onsite using the HACH DR 2700 spectrophotometer and appropriate test kit (HACH method 8155, ammonia salicylate method) so that results could later be compared to laboratory results. Ammonia, nitrite, and nitrate analyses were typically performed in the laboratory on the same day the cooler arrived (within 24 hours after sampling) to insure best results. All water analyses were performed according to EPA or Standard Methods (Table 4).
24
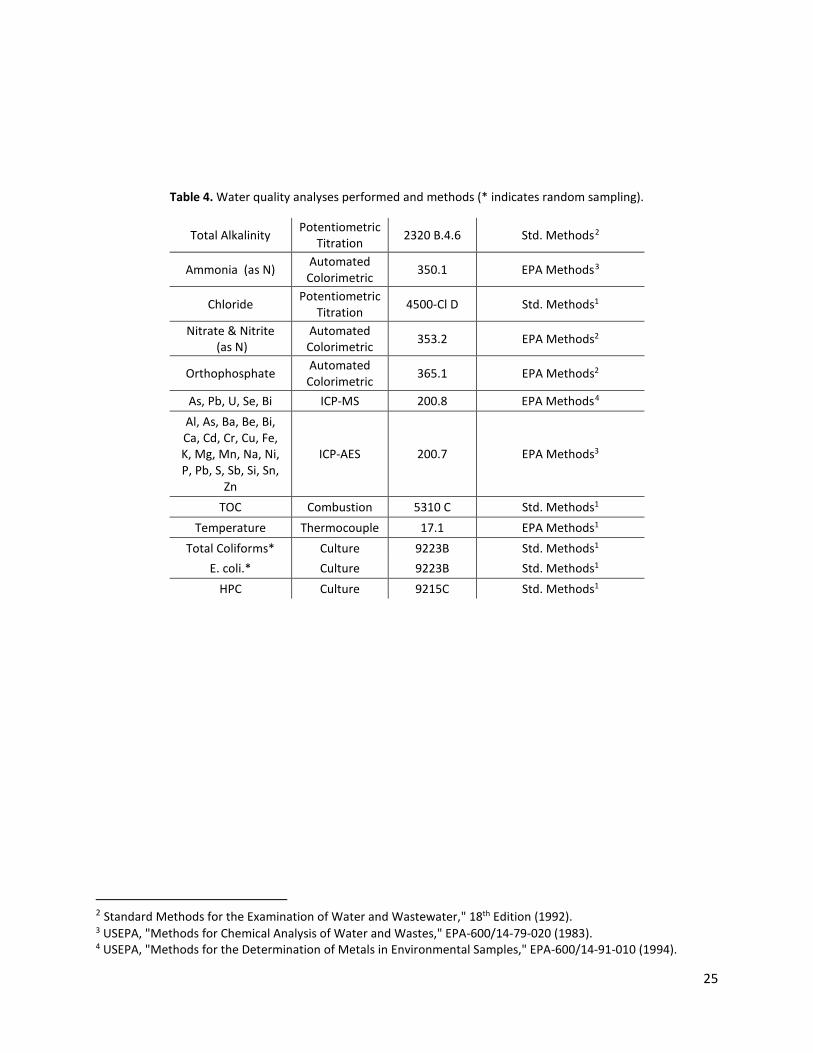
Table 4. Water quality analyses performed and methods (* indicates random sampling).
Total Alkalinity Potentiometric Titration 2320 B.4.6 Std. Methods2
As, Pb, U, Se, Bi ICP-MS 200.8 EPA Methods4 Al, As, Ba, Be, Bi, Ca, Cd, Cr, Cu, Fe, K, Mg, Mn, Na, Ni, P, Pb, S, Sb, Si, Sn,
Zn
ICP-AES 200.7 EPA Methods3
TOC Combustion 5310 C Std. Methods1 Temperature Thermocouple 17.1 EPA Methods1
Total Coliforms* Culture 9223B Std. Methods1 E. coli.* Culture 9223B Std. Methods1
HPC Culture 9215C Std. Methods1
2 Standard Methods for the Examination of Water and Wastewater," 18th Edition (1992). 3 USEPA, "Methods for Chemical Analysis of Water and Wastes," EPA-600/14-79-020 (1983). 4 USEPA, "Methods for the Determination of Metals in Environmental Samples," EPA-600/14-91-010 (1994).
25
4. Results
4.1 Important Dates
There were a number of operating changes and other events that occurred over the course of the full-scale evaluation period that are worth noting (Table 5). Palo’s full-scale water treatment plant started up on Jan. 15, 2014, with the exception of contactor 2, and treated water was pumped to the elevated storage tank and distribution system. Chlorine was added as sodium hypochlorite to achieve a goal of 2 mg Cl2/L total chlorine residual. Contactor 2 start-up was delayed to provide a safety back-up in the event excess nitrite was generated while contactor 1 and the three filters transitioned through the biological acclimation phase of operation. The system’s piping to the elevated storage tank froze in late January, so the tank was taken out of service for nearly a month. During this time (Feb. 14, 2014), filter 3 was taken offline to halt nitrification progression in the filter and provide an additional safety factor as nitrite levels began to increase. The air blower was turned off to contactor 1 on Feb. 18, 2014 for a day as concern grew for sensitivity toward increasing nitrite levels. The tower and filter 3 were put back in service on Feb. 21, 2014. As a precaution, however, non-chlorinated treated water was wasted to the on-site sewer, and chlorinated raw water was sent directly to the distribution system as it had prior to Jan. 15, 2014.
Iowa DNR required distribution system nitrite monitoring, and on March 6, 2014, the city identified elevated nitrite levels in a public facility that resulted in a public notification posting to the building. Upon investigation, the building was rarely used and it was believed that very little water was used in the facility leading up the sampling. After aggressively flushing water through the building, nitrite levels dropped off to very low and safe levels. During the same time period, additional distribution sites were sampled and measurements showed negligible nitrite levels. On April 22, 2014, the plant flow rate was decreased from 150 gpm (568 L/min) to 100 gpm (379 L/min) as a precaution to allow longer contact time through the system for nitrification to occur. At the same time, plant finished water was pumped into the distribution system. Lastly, contactor 2 was put into service on June 2, 2014, although initially at only 25% of the total flow (75% of the influent water going to contactor 1). The flow to contactor 2 has gradually been increased with the eventual goal to split the plant flow evenly between the two contactors.
It is worth emphasizing that there was great awareness by the plant operator, Iowa DNR and the EPA that nitrite levels could be elevated through the treatment plant during the biological acclimation phases. Nitrite, a regulated contaminant based on acute exposure, was not permitted to enter the distribution system at levels near the regulatory threshold of 1 mg N/L in any case. The plant operator measured nitrite in the finished water daily using a field colorimetric (HACH Company) DR 900 test kit that had an “over concentration range” limit of 0.35 mg N/L. The operator responded conservatively to over range readings by taking action to avoid sending “water of potential concern” to the distribution system as indicated throughout the event timeline (Table 5).
26
Table 5. Timeline of operational changes for treatment plant.
Date ET, days Description of Change
1/15/2014 0 Plant turned on (contactor 1 and all filters
feeding distribution system).
1/29-2/21/2014
14-37 (frozen 23)
Pipe to elevated storage tank froze.
2/14/2014 30 Filter 3 taken out of service as nitrite increased.
2/17/2014 33 Phosphate feed pump down.
2/18/2014 34 Air blower turned off as nitrite increased.
2/21/2014 37 Tower back in service, filter 3 back in service,
plant finished water sent to waste, chlorinated raw water sent to distribution system.
Elevated nitrite identified in community center. Other locations sampled without an issue. Center
had been down and as a result very little water was used. Problem was resolved through
flushing.
4/22/2014 97 Plant finished water was sent back to the distribution system at a rate of 100 gpm.
6/2/2014 138 Contactor 2 was put into service.
9/3/2014 231 Report preparation began.
4.2 General Source Water Chemistry
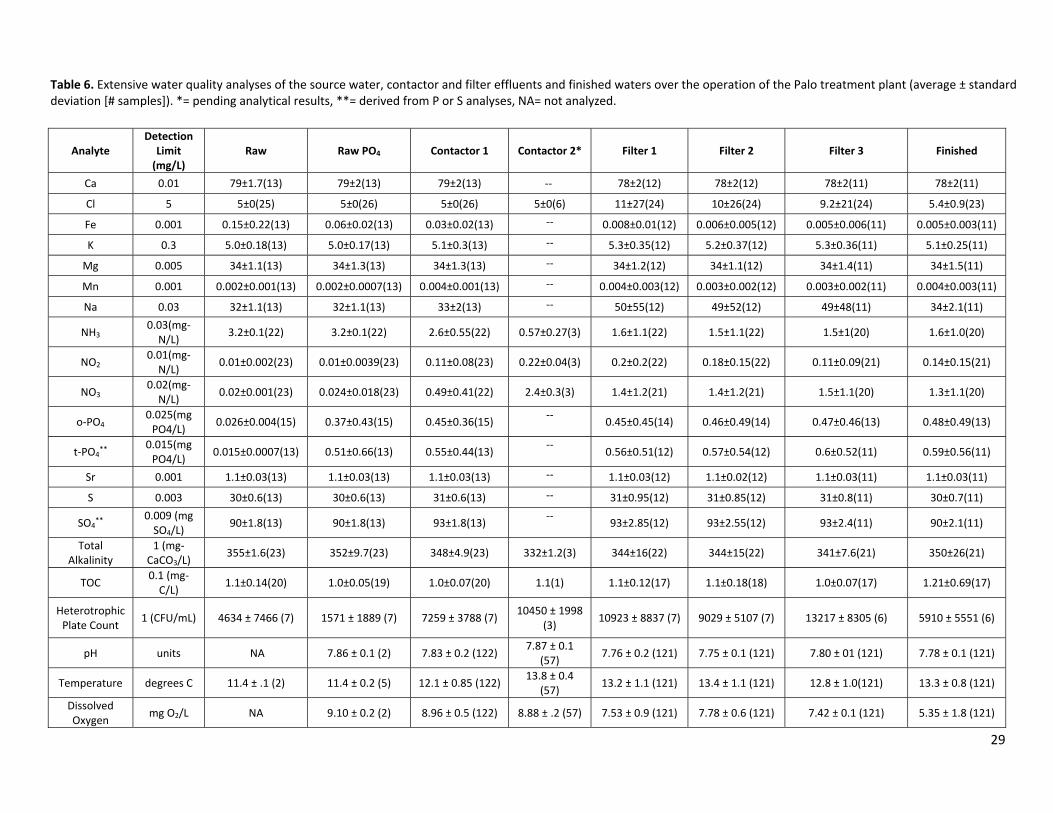
Extensive water quality analyses of the source water, contactor and filter effluents, finished water, and distribution system water of the Palo treatment plant, are summarized in Table 6. Palo can draw from two wells: the original (well 2) was solely used in the pilot study and the new well (well 3), which is within several hundred yards of well 2, was used as the source at the start of the full-scale plant operation. However, shortly after system startup, the original well became the primary source of the city’s water supply since the full-scale plant went into operation. The source water was a relatively hard, high alkalinity groundwater with calcium and magnesium levels averaging 79 and 34 mg/L, respectively, or a total hardness of 337 mg CaCO3/L, a total alkalinity of 355 mg CaCO3/L and a pH of 7.86. Iron levels averaged 0.15 mg/L although the average was impacted by a few random high concentrations that were measured early in the study as also reflected by the relatively large standard deviation. Interestingly, the pilot and full-scale water quality measurements were nearly identical with the exception of iron. The pilot results indicated that source water contained 0.63 mg/L of iron on average (Lytle et al., 2012) (the
27
discrepancy and possible implications will be discussed later). The ammonia concentration averaged 3.2 mg N/L. Sulfate and chloride averaged 90 mg SO4/L (derived from S analyses) and 5 mg/L, respectively. Orthophosphate was very low, averaging 0.026 mg PO4/L, and total phosphorus was at the detection limit of 0.005 mg P/L. Manganese, nitrite, and nitrate were at or near the respective method detection limits; strontium averaged 1.1 mg/L; and TOC averaged 1.1 mg C/L.
28
29
Analyte Detection Limit (mg/L)
Raw Raw PO4 Contactor 1 Contactor 2* Filter 1 Filter 2 Filter 3 Finished
Ca 0.01 79±1.7(13) 79±2(13) 79±2(13) ‐‐ 78±2(12) 78±2(12) 78±2(11) 78±2(11)
Table 6. Extensive water quality analyses of the source water, contactor and filter effluents and finished waters over the operation of the Palo treatment plant (average ± standard deviation [# samples]). *= pending analytical results, **= derived from P or S analyses, NA= not analyzed.
4.3 Removal of Ammonia in Source Water
The goal and expectation was that the treatment plant’s contactors would oxidize the bulk of the ammonia in the source water and the filters would oxidize any ammonia and/or nitrite that remained.
4.3.1 Aeration Contactors. Contactor 1 was started on January 15, 2014. The first indication of ammonia oxidation was observed at 28 days of operation when a small amount of nitrite (0.1 mg N/L) and detectable nitrate were observed in the contactor effluent (Figure 10). Over the next five weeks of operation, nitrite levels were no more than approximately 0.2 mg N/L. By 35 days into operation, nitrate in the contactor effluent became more evident (Figure 10). Nitrate in the contactor effluent gradually increased between 35 days and 130 days to 1 mg N/L. During the same time, nitrite levels were very low and in most cases less than 0.1 mg N/L. Strangely, between 139 days and 150 days of operation, ammonia increased rapidly back up to 2.5 mg N/L.
Elapsed Days
0 50 100 150 200
Conc
entr
atio
n, m
g N
/L
0
1
2
3
4
5NH4
+
NO3-
NO2-
Raw NH4+
Figure 10. Nitrogen balance in contactor 1 effluent (ammonia failed quality check on day 34 and nitrate failed on day 139).
30
During the same time period, contactor 2 was put into service (138 days into operation). Although it is not certain whether the events were linked, and if so, how such an event might impact contactor performance, the disruption as a result of changing flow patterns to account for contactor 2 going on-line could be important. Two significant changes occurred to contactor 1 when contactor 2 went online: (1) the flowrate dropped from 100 gpm (378 L/min) to 67 gpm (254 L/min), and (2) the air feed rate was reduced by 50% (changes will be detailed later). The contactor recovered relatively quickly over the next 50 days with ammonia levels dropping below 1 mg N/L at the time of reporting. During this time, nitrite levels remained very low.
Contactor 2 was put into service at 138 days of plant operation. The staggered start-up was a precaution in the event contactor 1 released excessive levels of nitrite. Although not in operation, the media in contactor 2 always remained submerged in raw water. Somewhat unanticipated, ammonia levels leaving the contactor were very low from the start-up and ranged between 0.25 and 1 mg N/L (Figure 11). Measurable levels of nitrite as high as 0.3 mg N/L were observed through the 60-day reporting period. Exactly why an acclimation period did not occur is unknown, but it is conceivable that nitrifying bacteria were able to colonize and acclimate during this period while the contactor 2 sat idle. In addition,
Elapsed Days
0 50 100 150 200
Conc
entr
atio
n, m
g N
/L
0
1
2
3
4
5NH4
+
NO3-
NO2-
Raw NH4+
Figure 11. Nitrogen balance in contactor 2 effluent.
31
contactor 2 consistently performed better than contactor 1. The reason might be that contactor 2 has mainly been operated at 1/3 the flowrate (or 33 gpm [124.74 L/min]) of contactor 1 to ease it into operation. The flowrate of contactor 2 has been gradually increased over time and will eventually be equal to that of contactor 1, or 50 gpm (189 L/min).
Nitrogen balances comparing source water ammonia levels (primary nitrogen source representing total nitrogen in source water) and contactor effluent total nitrogen (sum of ammonia, nitrite, and nitrate) as a data quality check are graphically compared in figures 10 and 11. The closeness of the values (bar compared to raw) reflects the good sampling protocol, and high quality and reliability of the laboratory data.
The expectation, based on the pilot study, has been that the contactors would eventually oxidize all of the ammonia in the source water. After 231 days of operation, the contactors were consistently reducing ammonia levels to below 1 mg N/L to as low as 0.25 mg N/L. The acclimation period of the contactors has progressed slowly as expected based on past work. Unfortunately the pilot study conducted in Palo was not useful in projecting more precisely how long acclimation would take. The pilot system operated for over 360 days and during that time system acclimation was seriously delayed because of a lack of phosphate (identified as a necessary nutrient during the pilot) and oxygen delivery issues (Lytle et al., 2012). Once optimized, the system rapidly responded and performed as expected.
The Palo pilot system was moved to a neighboring Iowa community and operated under the optimal conditions identified at the end of the Palo pilot study which are also the engineering and operating conditions applied to Palo’s full scale system (Lytle et al., 2014b). The new pilot system operated 24 hours per day and seven days per week, and the source water quality including ammonia levels were very similar to Palo’s source water. The new pilot contactors and filters acclimated (complete oxidation of ammonia to nitrate) within 50 days of operation. Other EPA work has suggested that the acclimation time for a biologically active nitrifying filter is linearly dependent on the number of hours of operation. For example, a filter in a given system that operates 12 hours a day will take twice as long to acclimate as compared to one operating 24 hours a day. The Palo full-scale system was only operated approximately 4 to 5 hours per day during weekdays, which suggests that it will take more than 4.8 to 6 times (assuming no operation on weekends) longer to acclimate than the new pilot study suggests (240 to 300 days). After late April, the system usage rate was increased to 6 to 7 hours per day over the entire week which should decrease the projection time. Based on this discussion, it is a reasonable possibility that the contactors are still in the biological acclimation period at the time of reporting.
Some other considerations regarding the contactor engineering design and operation are worth noting. The contactors do not have individual water flow meters to monitor and regulate flowrate through them. Water flow through the contactors is controlled by the operator based on the number of turns on gate valves that feed the contactors raw water following phosphate addition. This flow regulation technique is obviously not reliable and may impact the interpretation of the results because the amount of water passing through each contactor cannot be accurately determined. Secondly, the air flow rate to the contactors appeared aggressive based solely on visual observation. The design air delivery rate is based on the pilot study, but this parameter may not scale-up well. Excessive air flow could provide
32
scouring action to the media and attached biofilm thereby limiting biological growth and beneficial nitrification. Unfortunately the blower design does not incorporate controls to adjust air delivery rate. However, when contactor 2 was placed on-line, the decision was made to split air flow from one blower rather than add the second blower.
With regard to water quality, the iron levels in the source water were very low and much lower than the pilot study despite using the same source water. This discrepancy was thought to be related to the large difference in pumping rates between the pilot- and full-scale systems. The pilot system was operated at a rate of 500 ml/min (as compared to 100 to 150 gpm [379 L/min to 568 L/min] in the full-scale plant) and, at the time the pilot study was conducted, there was very little demand on the well since the distribution system was not in place. Iron deposition onto the gravel media may provide some protection to the biofilm and improve biofilm attachment. White et al. (2012) examined biofilm on filter media from an iron and ammonia (<1.4 mg N/L) removal plant in Ohio. They observed that the biofilm was largely present under an inorganic (largely iron) layer that covered the anthracite and sand media. Lastly, phosphate was injected ahead of the contactors in the form of a blended phosphate (75%/25% poly-/ortho- phosphate) to achieve a concentration goal of 0.3 mg PO4/L. This differed from the pilot scale experiment where straight orthophosphate was used. Only orthophosphate measurements were made at the plant and were solely used for process control as recommended. There is no evidence to suggest that the polymeric portion of chemical formulation would impact nitrifying biofilm. The blended phosphate was mistakingly purchased and will be replaced with a straight orthophosphate when completely consumed.
4.3.2 Filters. The purpose of the dual media filters that followed the contactors was to remove iron particles that developed in the contactors. The filters were also biologically-active and provided additional ability to oxidize ammonia and nitrite that passed through the contactor. Ammonia, nitrite, and nitrate levels entering the filters were either equal to the level leaving contactor 1 or the combination of contactor 1 and 2 effluents (after 138 days).
In general, the patterns and progression of nitrification in the filters paralleled the contactors (Figures 12 to 14). Additional oxidation of the ammonia and nitrite from the contactors was observed. Ammonia levels in all filters gradually decreased with time up to approximately 138 days. After 138 days, ammonia levels in all filters dropped to very low levels for the remainder of the data collection period. Nitrite on a few rare occasions reached as high as 0.7 mg N/L, but typically were very low. The filters improved overall water quality by polishing contactor effluent. The finished water ammonia, nitrite and nitrate values paralleled the filters and reflected the combination of all three (Figure 15). Nitrite levels in the plant finished water never approached the drinking standard of 1 mg N/L.
As a data quality check, nitrogen between source water ammonia levels (primary nitrogen source representing total nitrogen in source water) and filter effluent total nitrogen (sum of ammonia, nitrite, and nitrate) are graphically compared in figures 10 to 14. The closeness of the values reflects good sampling protocol, and high quality and reliability of the laboratory data.
33
Some additional observations regarding filter operation are important to highlight. The filters are pressure filters, which are different than gravity filters used in the pilot study. Pressure filters are obviously not detrimental to the biological nitrification process based effectiveness of the full-scale filters to oxidize ammonia and nitrite in this study. Palo’s treatment plant operator noted that very little headloss built-up across the pressure filters. Since iron was very low, biomass was likely the major contributer to headloss, but apparently it was not significant enough to require frequent backwashing.
The filters were backwashed once every three weeks on a staggered schedule (i.e., one filter was backwashed per week) based solely on time in service. Lastly, a trend developed that one filter a week had slightly higher nitrite levels than the others. Upon examination, it was discovered that the elevated nitrite filter effluent was always the last one backwashed. The observation suggests that chlorinated backwashing might have an impact on filter operation and biological activity. As described under the contactor discussion in section 4.3, iron deposition onto the filter media may provide some support to the nitrifying biofilm by improving biofilm attachment and protection against biofilm contact with chlorine during backwashing with chlorinated water.
Elapsed Days
0 50 100 150 200
Conc
entr
atio
n, m
g N
/L
0
1
2
3
4
5 NH4+
NO3-
NO2-
Raw NH4+
Figure 12. Nitrogen balance in filter 1 effluent (ammonia failed quality check on day 34 and nitrate failed on day 139).
34
Elapsed Days
0 50 100 150 200
Conc
entr
atio
n, m
g N/
L
0
1
2
3
4
5NH4
+
NO3-
NO2-
Raw NH4+
Figure 13. Nitrogen balance in filter 2 effluent (ammonia failed quality check on day 34 and nitrate failed on day 139).
Elapsed Days
0 50 100 150 200
Conc
entr
atio
n, m
g N/
L
0
1
2
3
4
5NH4
+
NO3-
NO2-
Raw NH4+
Figure 14. Nitrogen balance in filter 3 effluent (ammonia failed quality check on day 34 and nitrate failed on day 139).
35
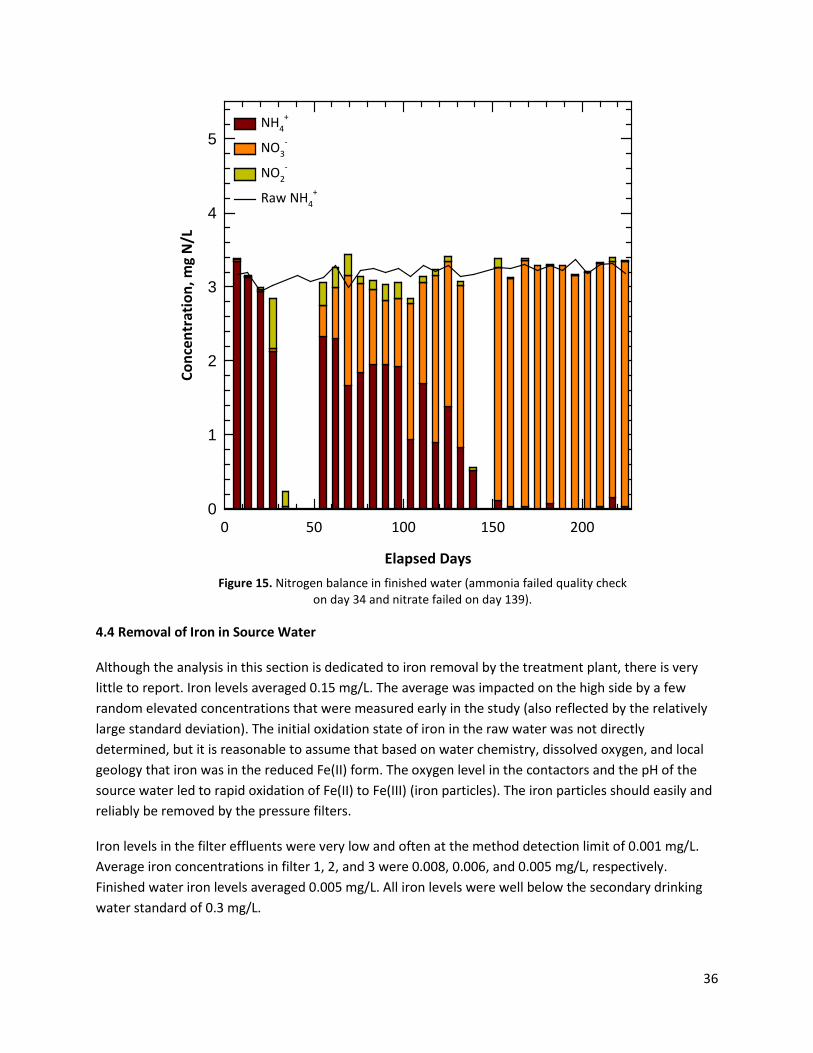
4.4 Removal of Iron in Source Water
Although the analysis in this section is dedicated to iron removal by the treatment plant, there is very little to report. Iron levels averaged 0.15 mg/L. The average was impacted on the high side by a few random elevated concentrations that were measured early in the study (also reflected by the relatively large standard deviation). The initial oxidation state of iron in the raw water was not directly determined, but it is reasonable to assume that based on water chemistry, dissolved oxygen, and local geology that iron was in the reduced Fe(II) form. The oxygen level in the contactors and the pH of the source water led to rapid oxidation of Fe(II) to Fe(III) (iron particles). The iron particles should easily and reliably be removed by the pressure filters.
Iron levels in the filter effluents were very low and often at the method detection limit of 0.001 mg/L. Average iron concentrations in filter 1, 2, and 3 were 0.008, 0.006, and 0.005 mg/L, respectively. Finished water iron levels averaged 0.005 mg/L. All iron levels were well below the secondary drinking water standard of 0.3 mg/L.
Elapsed Days
0 50 100 150 200
Conc
entr
atio
n, m
g N
/L
0
1
2
3
4
5NH4
+
NO3-
NO2-
Raw NH4+
Figure 15. Nitrogen balance in finished water (ammonia failed quality check on day 34 and nitrate failed on day 139).
36
4.5 Other Water Quality Parameters
A number (nine) of other important water quality parameters were monitored during the study. Temperature is important from the perspective of microbial activity. The metabolism of important microorganisms including nitrifying bacteria decreases with decreasing temperature. Laboratory studies have demonstrated that the growth rate of nitrifying bacteria is negatively impacted by temperatures below 10°C, although adjustments to the treatment process can be made to enhance nitrification in colder climates (Andersson, et al., 2001). Although the air temperature in Palo can be very cold in the winter, the ground water source only dropped to approximately 11o C (Figure 16) during the winter. As the seasons changed from spring to summer, a gradual increase in temperature was observed to 14o C. The blowers used outdoor air to supply air to the contactors. There was some initial concern that the cold outdoor air during winter months would decrease water temperature in the contactors and impact biological activity. Although there was not an obvious air temperature impact, the system was also going through a transitioning acclimation period in the winter which could complicate conclusions. Monitoring will continue through the 2014/2015 winter season in order to draw a final conclusion.
Figure 16. On-site temperature measurements through treatment plant (winter [1/15 to 4/21/2014], spring [4/22 to 6/20/2014], summer [6/21 to time of report preparation]).
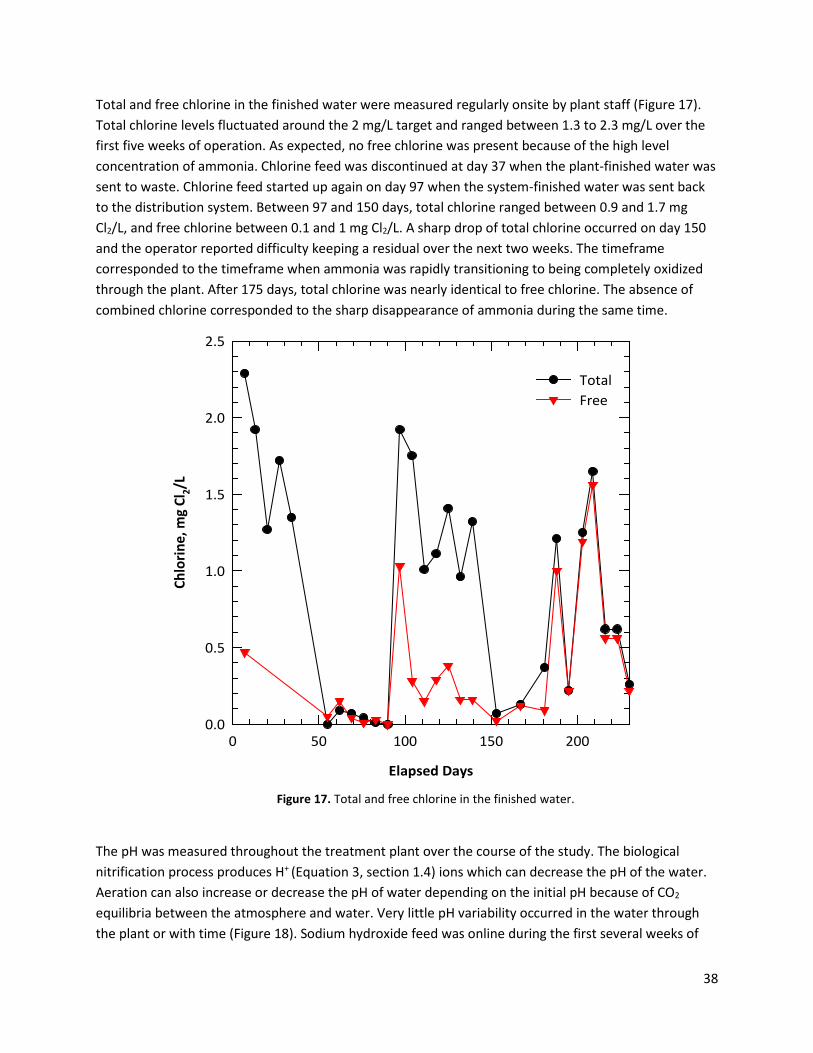
Total and free chlorine in the finished water were measured regularly onsite by plant staff (Figure 17). Total chlorine levels fluctuated around the 2 mg/L target and ranged between 1.3 to 2.3 mg/L over the first five weeks of operation. As expected, no free chlorine was present because of the high level concentration of ammonia. Chlorine feed was discontinued at day 37 when the plant-finished water was sent to waste. Chlorine feed started up again on day 97 when the system-finished water was sent back to the distribution system. Between 97 and 150 days, total chlorine ranged between 0.9 and 1.7 mg Cl2/L, and free chlorine between 0.1 and 1 mg Cl2/L. A sharp drop of total chlorine occurred on day 150 and the operator reported difficulty keeping a residual over the next two weeks. The timeframe corresponded to the timeframe when ammonia was rapidly transitioning to being completely oxidized through the plant. After 175 days, total chlorine was nearly identical to free chlorine. The absence of combined chlorine corresponded to the sharp disappearance of ammonia during the same time.
The pH was measured throughout the treatment plant over the course of the study. The biological nitrification process produces H+ (Equation 3, section 1.4) ions which can decrease the pH of the water. Aeration can also increase or decrease the pH of water depending on the initial pH because of CO2 equilibria between the atmosphere and water. Very little pH variability occurred in the water through the plant or with time (Figure 18). Sodium hydroxide feed was online during the first several weeks of
Elapsed Days
0 50 100 150 200
Chlo
rine,
mg
Cl2/L
0.0
0.5
1.0
1.5
2.0
2.5
TotalFree
Figure 17. Total and free chlorine in the finished water.
38
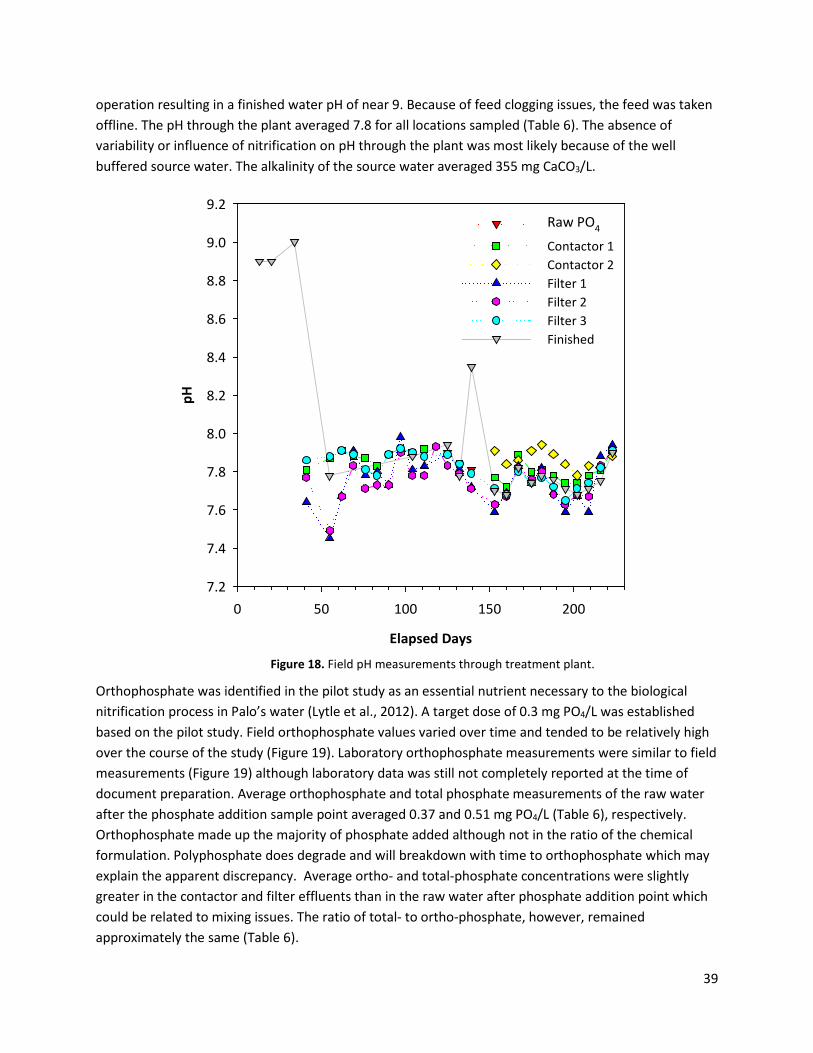
operation resulting in a finished water pH of near 9. Because of feed clogging issues, the feed was taken offline. The pH through the plant averaged 7.8 for all locations sampled (Table 6). The absence of variability or influence of nitrification on pH through the plant was most likely because of the well buffered source water. The alkalinity of the source water averaged 355 mg CaCO3/L.
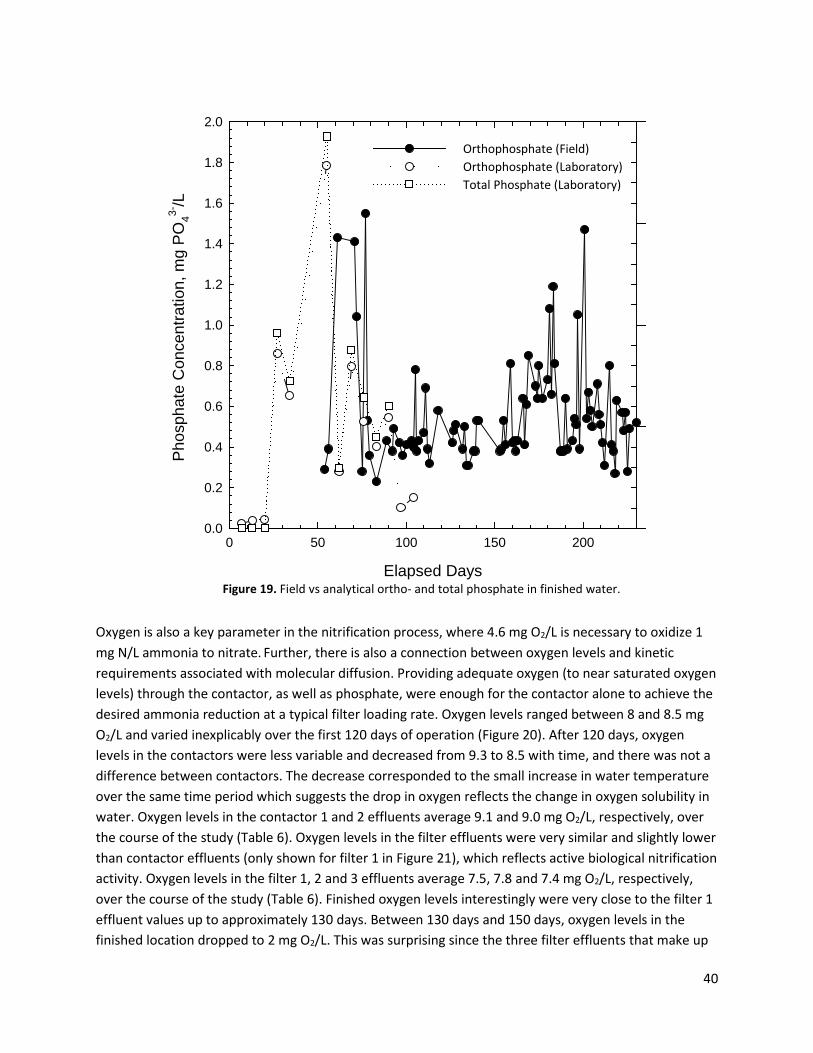
Orthophosphate was identified in the pilot study as an essential nutrient necessary to the biological nitrification process in Palo’s water (Lytle et al., 2012). A target dose of 0.3 mg PO4/L was established based on the pilot study. Field orthophosphate values varied over time and tended to be relatively high over the course of the study (Figure 19). Laboratory orthophosphate measurements were similar to field measurements (Figure 19) although laboratory data was still not completely reported at the time of document preparation. Average orthophosphate and total phosphate measurements of the raw water after the phosphate addition sample point averaged 0.37 and 0.51 mg PO4/L (Table 6), respectively. Orthophosphate made up the majority of phosphate added although not in the ratio of the chemical formulation. Polyphosphate does degrade and will breakdown with time to orthophosphate which may explain the apparent discrepancy. Average ortho- and total-phosphate concentrations were slightly greater in the contactor and filter effluents than in the raw water after phosphate addition point which could be related to mixing issues. The ratio of total- to ortho-phosphate, however, remained approximately the same (Table 6).
Figure 18. Field pH measurements through treatment plant.
39
Oxygen is also a key parameter in the nitrification process, where 4.6 mg O2/L is necessary to oxidize 1 mg N/L ammonia to nitrate. Further, there is also a connection between oxygen levels and kinetic requirements associated with molecular diffusion. Providing adequate oxygen (to near saturated oxygen levels) through the contactor, as well as phosphate, were enough for the contactor alone to achieve the desired ammonia reduction at a typical filter loading rate. Oxygen levels ranged between 8 and 8.5 mg O2/L and varied inexplicably over the first 120 days of operation (Figure 20). After 120 days, oxygen levels in the contactors were less variable and decreased from 9.3 to 8.5 with time, and there was not a difference between contactors. The decrease corresponded to the small increase in water temperature over the same time period which suggests the drop in oxygen reflects the change in oxygen solubility in water. Oxygen levels in the contactor 1 and 2 effluents average 9.1 and 9.0 mg O2/L, respectively, over the course of the study (Table 6). Oxygen levels in the filter effluents were very similar and slightly lower than contactor effluents (only shown for filter 1 in Figure 21), which reflects active biological nitrification activity. Oxygen levels in the filter 1, 2 and 3 effluents average 7.5, 7.8 and 7.4 mg O2/L, respectively, over the course of the study (Table 6). Finished oxygen levels interestingly were very close to the filter 1 effluent values up to approximately 130 days. Between 130 days and 150 days, oxygen levels in the finished location dropped to 2 mg O2/L. This was surprising since the three filter effluents that make up
Figure 19. Field vs analytical ortho- and total phosphate in finished water.
40
the finished sample were at approximately 7 mg O2/L. This was also the time period where nitrification through the plant rapidly became established. Upon questioning the operator and examination of the plant sampling taps and plumbing, the most reasonable explanation for the observation was that biofilm growth and nitrification occurred in the plumbing leading to the sample tap. A long run of copper pipe ran from the plant effluent to the relatively unused sample faucet in the laboratory. In later sample events, the operator left the tap open for extended periods of time before sampling.
Alkalinity in the source water averaged 355 mg CaCO3/L. Average alkalinity in contactors 1 and 2 were 348 and 332 mg CaCO3/L, respectively (Table 6). Alkalinity change is directly related to nitrification, and therefore closer examination of alkalinity trends are worthwhile (Figure 21). At the beginning of the study, the alkalinity level in the raw water and each contactor was very close. However, with time as nitrification progresses through the plant, alkalinity levels decrease. Once acclimation through the plant is achieved, the alkalinity level in the finished water is approximately 24 mg CaCO3/L lower that the raw water. This decrease is in very close proximity to the theoretical predicted drop of 7.1 mg CaCO3/L per 1 mg N/L ammonia oxidized.
Elapsed Days
0 50 100 150 200
Diss
olve
d O
xyge
n, m
g O
2/L
0
2
4
6
8
10
Contactor 1Contactor 2Filter 1Finished
Figure 20. Dissolved oxygen levels throughout treatment.
41
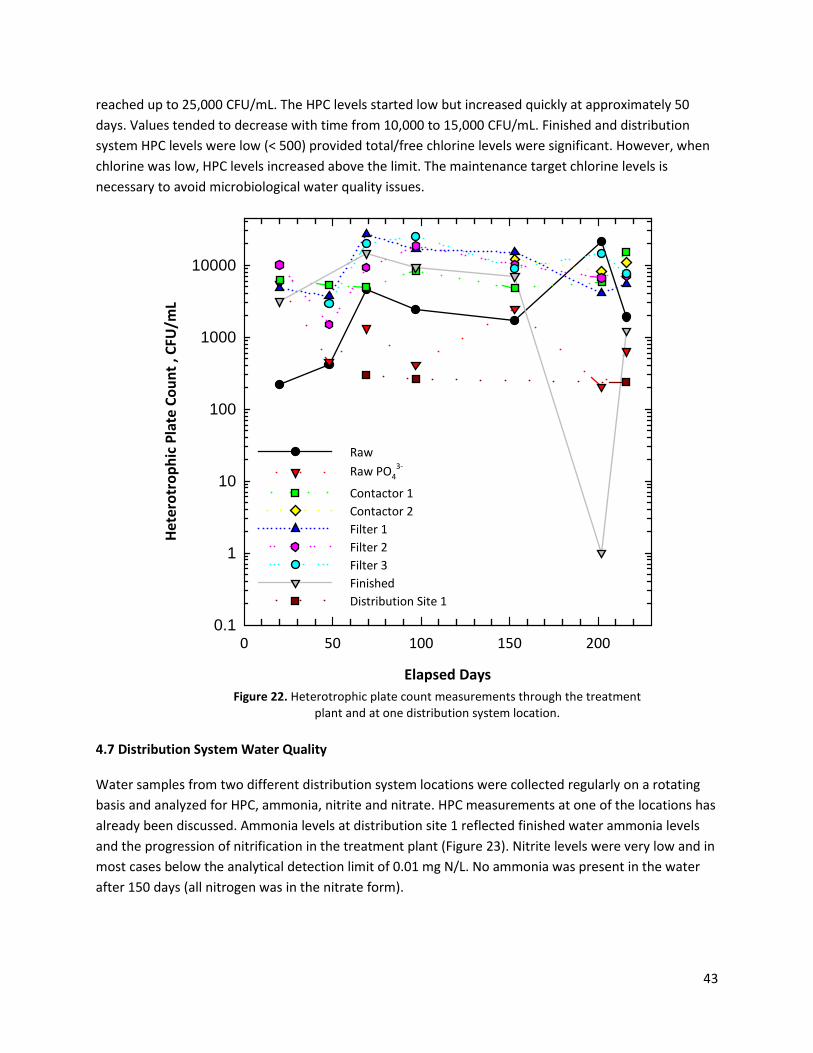
4.6 Assessment of Bacterial Population Based on HPCs
Health effects are not associated with HPCs, but HPC analyses are used to measure the variety of bacteria that are common in water. In general, the lower the concentration of bacteria in drinking water, the better maintained the water system. EPA has set a recommended limit for HPCs of 500 CFU/ml for potable water.
HPC levels in the raw water were relatively low and in several cases less than 500 CFU/mL. The other raw water samples contained less than 6000 CFU/mL with the exception of one value of 22,000 CFU/mL at 200 days (Figure 22). HPC values varied from week to week with no apparent trend with time. Phosphate addition did not have an obvious impact on the magnitude of HPC values. Contactor 1 effluent HPC values were much greater than the raw water levels, ranged between 4,000 and 15,000 CFU/mL, and averaged 7,300 CFU/mL. An obvious HPC correlation with time was not found that might correspond to contactor acclimation or development of biomass in the contactor. Contactor 2 HPCs were typically higher than contactor 1 and averaged 10,500 CFU/mL, although the data was based on only three data sampling events because of the delayed start. Filter effluent values were the highest and
Elapsed Days
0 20 40 60 80 100 120 140 160 180
Tota
l Alk
alin
ity C
once
ntra
tion,
mg
CaCO
3/L
320
330
340
350
360
370
380
Raw Contactor 1Filter 1Finished
Figure 21. Total alkalinity throughout treatment.
42
reached up to 25,000 CFU/mL. The HPC levels started low but increased quickly at approximately 50 days. Values tended to decrease with time from 10,000 to 15,000 CFU/mL. Finished and distribution system HPC levels were low (< 500) provided total/free chlorine levels were significant. However, when chlorine was low, HPC levels increased above the limit. The maintenance target chlorine levels is necessary to avoid microbiological water quality issues.
4.7 Distribution System Water Quality
Water samples from two different distribution system locations were collected regularly on a rotating basis and analyzed for HPC, ammonia, nitrite and nitrate. HPC measurements at one of the locations has already been discussed. Ammonia levels at distribution site 1 reflected finished water ammonia levels and the progression of nitrification in the treatment plant (Figure 23). Nitrite levels were very low and in most cases below the analytical detection limit of 0.01 mg N/L. No ammonia was present in the water after 150 days (all nitrogen was in the nitrate form).
Elapsed Days
0 50 100 150 200
Hete
rotr
ophi
c Pl
ate
Coun
t , C
FU/m
L
0.1
1
10
100
1000
10000
Raw Raw PO4
3-
Contactor 1Contactor 2Filter 1Filter 2Filter 3FinishedDistribution Site 1
Figure 22. Heterotrophic plate count measurements through the treatment plant and at one distribution system location.
43
A similar pattern was observed in water collected from distribution site 2 (Figure 24). The only discrepancy was that complete nitrification occurred by 75 days which was much quicker than the plant and site 1. The observation suggests that nitrification could have occurred in the plumbing associated with the sampling location. A broader investigation is necessary to properly interpret the observation.
The successful operation of the full-scale plant resulted in the decrease and eventual disappearance of ammonia in the distribution. During plant start-up and acclimation periods, nitrite was never a concern in the distribution system water samples.
Elapsed Days
0 50 100 150 200
Conc
entr
atio
n, m
g N
/L
0
1
2
3
4
5NH4
+
NO3-
NO2-
Raw NH4+
Figure 23. Nitrogen balance at distribution site 1.
44
4.8 Monitoring Requirements
The Iowa DNR was actively involved in all phases of the Palo project. The DNR was updated throughout the pilot study and operation of the full-scale plant. During the pilot study, the DNR was provided treatment data by the EPA team, and EPA’s input and suggestions were requested. The open communication and success of the pilot study were critical to obtaining final acceptance of the new approach from the DNR. The discussions between EPA and the DNR were also helpful in developing appropriate sampling requirements of the community once the full-scale system was brought on-line.
Once the full-scale system was placed in operation, the Iowa DNR required additional routine water quality monitoring beyond federal drinking water regulatory requirements (Table 7). The driving concerns were the newness of the treatment approach, lack of full-scale long-term operating experience to draw from, and the possibility that elevated nitrite could be generated through the plant or in the distribution system in the event of an unexpected failure episode. Specifically, the DNR requires the City of Palo to take a water sample for nitrite analysis from the raw sources (two wells), the entry point to the distribution system (finished water), and one location in the distribution system on a monthly basis. Distribution sample locations are rotated among several sites pre-identified by Iowa DNR field staff. These samples must be performed by a certified laboratory and reported to the DNR.
Elapsed Days
0 50 100 150 200
Conc
entr
atio
n, m
g N
/L
0
1
2
3
4
5NH4
+
NO3-
NO2-
Raw NH4+
Figure 24. Nitrogen balance at distribution site 2.
45
The DNR also requires the city to “self-monitor” water quality regularly to insure that the treatment system is operating properly (Table 7). Specifically, ammonia is monitored from the entry point to the distribution system (finished water) on a monthly basis. Dissolved oxygen and nitrite are monitored at the same location on a daily basis. The DNR set a dissolved oxygen target goal of 7 mg O2/L as an indicator of good treatment process control and a nitrite standard of 1 mg N/L in the finished water. Lastly, ammonia is monitored weekly and nitrite is monitored on a daily basis at various locations in the distribution system. As with reported monitoring requirements, distribution sample locations are rotated among several sites pre-identified by Iowa DNR field staff.
The major concern of the project and sample monitoring driver is nitrite generation. As noted in previous sections, nitrite levels have been low and never close to the 1 mg N/L nitrite standard at any time. Figure 25 highlights nitrite levels at all sampling locations over the course of the study. With the exception of a several rare instances where nitrite levels reach as high as 0.7 mg N/L (filter effluents), nitrite levels were very low and of no concern.
Certified Laboratory Reporting
Location Parameter Frequency Distribution System* Nitrite Monthly Entry into Distribution System (Finished Water)
Nitrite Monthly
Raw Water Sample from Each Well Nitrite Monthly
Self-Monitoring
Location Parameter Frequency Entry into Distribution System (Finished Water)
Ammonia Weekly
Entry into Distribution System (Finished Water)
Dissolved Oxygen Daily
Entry into Distribution System (Finished Water)
Nitrite Daily
Distribution System* Nitrite Daily
Distribution System* Ammonia Weekly
Table 7. Water plant and distribution system monitoring requirements for Palo, IA set by the Iowa DNR (*Distribution system sample rotated among several locations pre-identified by Iowa DNR field staff).
46
4.9 Project Cost
The project costs are provided in Table 8. The water treatment plant construction and equipment costs were nearly 1.5 million dollars.
Project Aspect Estimate Actual
Engineering $1,114,000 $1,021,280
Pilot Plant $36,000 $0
Water Main $3,922,000 $2,720,326
Well $180,000 $330,658
Tower $840,000 $809,486
Treatment Plant $1,485,000 $809,486
Total $7,577,000 $6,403,917
CDBG Grant ($6,450,000) ($6,645,781)
Palo’s Cost $1,127,000 ($199,864)
Table 8. Estimated and actual project costs.
Figure 25. Nitrite concentration through treatment plant and distribution system.
Elapsed Days
0 50 100 150 200
Nitr
ite C
once
ntra
tion,
mg
N/L
0.0
0.2
0.4
0.6
0.8
1.0
1.2
1.4RawContactor 1Filter 1Filter 2Filter 3FinishedDistribution Site 1Distribution Site 2
47
4.10 Other
The reliability of field test kits used by water plant operators is important, particularly when the kits are used to assess plant performance and identify problems on-site. Ammonia levels in water samples received by the EPA were immediately measured upon arrival with a HACH bench test kit and results were compared to analyses on the same samples using the laboratory EPA method (Figure 26). The Field HACH test kit ammonia measurements were in relatively good agreement with laboratory results (Figure 26). Bench test kit measurements tended to be slightly high at the higher ammonia concentrations and tended to be much less significant at lower concentrations. For example, at an ammonia concentration of 3 mg N/L, the field test kit was approximately 0.4 mg N/L higher based on simply comparing the data regression plot to the unbiased line. The test data indicated that the HACH test kit provides a good measurement of ammonia.
Lastly, it is worth acknowledging the relative ease of operation and reliability of the water treatment plant. The city of Palo is a small water utility and small drinking water treatment systems must be relatively simple, reliable and effective. Operators of small municipal treatment systems are typically responsible for many aspects of municipal operations. For example, Palo’s operator was responsible for snow plowing, landscaping and mowing of city grounds, and many other duties as assigned, while at the
Laboratory NH4+ Levels, mg N/L
0 1 2 3 4
Benc
h N
H4+ L
evel
s, m
g N
/L
0
1
2
3
4
RawRaw PO4
3-
Contactor 1Contactor 2Filter 1Filter 2Filter 3FinishedRef LineReg Line
Figure 26. Bench ammonia vs laboratory ammonia results.
48
same time, responsible for operating the new water treatment plant. The plant ran largely without issue with the exception of several chemical feed problems related to pumping failures and feed line clogging episodes. Although busy with regular water sampling and monitoring through the plant, the operator did not report difficulties with running the plant.
5. Conclusions and Recommendations
The City of Palo developed and constructed their entire drinking water treatment plant and distribution system over a period of approximately 3.5 years. The water treatment plant incorporated an innovative biological treatment system developed by EPA’s Office of Research and Development to remove elevated ammonia (> 3 mg N/L) and iron in the ground water supplies. The EPA patented process was successfully demonstrated at the pilot-scale study during a year-long evaluation period. This report documents the scale-up of the pilot system to a full-scale plant. The engineering design and operating criteria applied to the full-scale plant that were established during the pilot were compared. The performance of the full-scale plant over the first 231 days of operation was described. As a result of this effort, the following conclusions were drawn:
• The new and innovative biological drinking water treatment process to remove high ammonia levels was successfully scaled-up and demonstrated at the full-scale.
• The biological ammonia treatment plant is robust, reliable and relatively simple to operate.
• The biological ammonia treatment system successfully met the primary treatment objective of removing essentially all of the ammonia in the source water. Negligible concentrations of ammonia entered the distribution system once the filters were acclimated, thereby eliminating the possibility of nitrification in the distribution system. Iron in the source water was also successfully removed through the treatment plant although the iron levels in the source water were much lower than in the pilot study, likely due to differences in well demand.
• By the end of the reporting period of the full-scale system study, the contactors were consistently reducing ammonia levels down to between 0.25 and 1 mg N/L. The expectation is that eventually ammonia concentrations leaving the contactors will be negligible. Because the treatment plant only operates eight to 12 hours a day five days a week, it is reasonable to assume that the contactors will continue to be in the biofilm acclimation process for many more weeks. The filters provide additional ammonia oxidation and after 138 days, the filter effluent ammonia levels were negligible.
• Incorporating blended phosphate feed, co-current air/water flow in contactors, and pressure filters of the full-scale plant did not have a detrimental impact on plant operation. Filters were backwashed with chlorinated water (not advised), causing a degredation effect on filter performance.
• The success of developing a new biological treatment approach at a small water system was largely a result of a successful pilot study, and regular and meaningful communication between
49
EPA, State of Iowa DNR, the community and engineering consultant during all phases of project development.
Recommendation for follow-up studies:
• Perform a closely evaluated study of the impact of backwashing the filters with chlorinated water. In the event that there is significant impact, options to minimize the impact (e.g., reducing frequency and backwash time) will be explored as well as alternatives to using chlorinated water will be proposed.
• Explore options to place flowrate monitoring devices on contactors’ effluent waters and controllers on the air blower output. Implement changes if feasible and affordable.
• Perform an evaluation of contactor air flowrate on contactor operation and effectiveness.
• Continue to monitor water quality through the plant over the next winter to fully determine whether seasonal changes (i.e., temperature) have an impact on plant operation.
• Perform an in-depth analysis of the microbiological quality and community structure in the contactors, filters and distribution system.
• Evaluate the impact of iron on the effectiveness of biological treatment. The presence of iron and other inorganic solids on the attachment and filter media may be beneficial.
50
6. References
Andersson, A.; Laurent, P.; Kihn, A.; Prévost, M.; Servais, P. Impact of Temperature on Nitrification in Biological Activated Carbon (BAC) Filters used for Drinking Water Treatment. Water Research. 2001, 35:2923-2934.
Bremer, P.J.; Webster, B.J.; Wells, D.B. Biocorrosion of Copper in Potable Water. Journal AWWA. 2001, 93, 82–91.
de Vet, W.W.J. M; van Loosdrecht, M.C.M.; Rietveld, L.C. Phosphorus Limitation in Nitrifying
Groundwater Filters. Water Research. 2012, 46:1061-1069.
Fleming, K.K.; Harrington, G.W.; Noguera, D.R. Nitrification Potential Curves: A New Strategy for Nitrification Prevention. Journal AWWA. 2005, 97, 90–99.
Lee, S.H.; O’Connor, J.T.; Banerji, S.K. Biologically Mediated Corrosion and Its Effects on Water Quality in
Distribution Systems. Journal AWWA. 1980, 72, 636–645. Lytle, D.A.; Sorg, T.J., Wang, L.; Muhlen, C.; Rahrig, M.; French, K. Biological Nitrification in Full-Scale and
Pilot-Scale Iron Removal Drinking Water Treatment Plant Filters. Jour. Water Supply: Res. and Tech.: AQUA. 2007, 56, 125–136.
Lytle, D.A.; White C.; Williams, D.; Koch, L.; Nauman, E. Summary Report: Results from the Pilot Study of
an Innovative Biological Treatment Process for the Removal of Ammonia from a Small Drinking Water System in Iowa. Office of Research and Development, Cincinnati, Ohio. EPA/600/R-12/655. 2012.
Lytle, D.A.; Williams, D., Muhlen, C.; Bayner, M. Summary Report: Third Pilot Study of Biological
Treatment Process for the Removal of Ammonia from a Small Drinking Water System: Application of Lessons Learned. Office of Research and Development, Cincinnati, Ohio. In Review. 2014a.
Lytle, D.A.; Williams, D., Muhlen, C.; Bayner, M. Summary Report: Second Pilot Study of Biological
Treatment Process for the Removal of Ammonia from a Small Drinking Water System: Application of Lessons Learned. Office of Research and Development, Cincinnati, Ohio. In Review. 2014b.
Nitrification in Chloraminated Distribution Systems. Journal AWWA. 1996, 88, 74. Rittman, B.E.; Snoeyink, V.L. Achieving Biologically Stable Drinking Water. Journal AWWA. 1984.76, 106. Scherrenberg, S. M.; Menkveld, H.W.; Bechger, M.; van der Graaf, J.H. Minimising the Risk on
Phosphorus Limitation; an Optimised Coagulant Dosage System. Water Sci Technol. 2011, 64:1708-1715.
51
Scherrenberg, S. M.; Neef, R.; Menkveld, H.W.; van Nieuwenhuijzen, A.F.; van der Graaf, J.H. Investigating Phosphorus Limitation in a Fixed Bed Filter with Phosphorus and Nitrogen Profile Measurements. Water Environ Res. 2012, 84:25-33.
Shammas, N.K. Interactions of Temperature, pH, and Biomass on the Nitrification Process. J. Water Pollut. Control Fed. 1986. 58, 52–58.
Suffet, I.H.; Corado, A.; Chou, D.; McGuire, M.J.; and Butterworth, S. AWWA Taste and Odor Survey.
Journal AWWA. 1996. 88, 168–180.
White, C.P., DeBry, R.W., and D.A. Lytle. Microbial Ecology of a Full-Scale Biologically Active Filter for Drinking Water Treatment. Appl. Environ. Microbiol. 78(17):6390 (2012).
U.S. Environmental Protection Agency (US EPA), Process Design Manual for Nitrogen Control, Technology Transfer, U.S. EPA, Washington D.C., 1975.
U.S. Environmental Protection Agency (US EPA), Manual: Nitrogen Control. Office of Research and Development. Office of Water, Washington, DC EPA1625/R-93/010. 1993.
WHO, Ammonia in Drinking-Water. Background Document for Preparation of WHO Guidelines for Drinking-Water Quality. Geneva, World Health Organization (WHO/SDE/WSH/03.04/1). 2003.