Analysis for Yangmingtan Bridge collapse Yunxiao Fan ⇑ , Jing Zhu, Jingjing Pei, Zhi Li, Yanguang Wu China University of Geosciences (Beijing), China article info Article history: Received 27 September 2014 Received in revised form 6 March 2015 Accepted 8 May 2015 Available online 21 May 2015 Keywords: Yangmingtan Bridge accident NVivo software Rasmussen’s accident causation model Accident analysis abstract In recent years, more than thirty bridge accidents have occurred in China, but only few accidents were tracked and most accident investigation reports were not open to the pub- lic. The Yangmingtan Bridge collapse accident occurred on 24 August, 2012 in Harbin City, which caused three fatalities and five injuries. This accident has evoked wide concern from the public and media, but no official report provided any conclusion on the cause of the accident until now, while no related research was ever undertaken either. NVivo is a qual- itative data analysis package which helps researchers to organize and analyze complex non numerical or unstructured data. Because of the lack of data in the official report, this research collected both texts and multimedia information from the web, newspaper and videos to identify potential root causes of the accident. This research first organized all information with the aid of NVivo 8.0 software. Then Rasmussen’s accident causation model was adopted for use as the frame nodes for the case study. Based on the software, this research analyzed the system wide failures and actions involved in the accident and identified the multi-levels of failure modes which included government, regulatory agency, company, management, staff, and the physical accident sequence. Ó 2015 Elsevier Ltd. All rights reserved. 1. Introduction In the recent years, more than thirty bridge accidents have occurred in China [1]. Learning from accidents, incidents and disasters contributes to improvement of safety and the prevention of unwanted events [2]. One reason for the fact that inci- dents keep recurring is a failure to successfully learn from incidents [3]. For these Chinese bridge accidents, although there was a lot of information or data related to them when they occurred, only a few of the accidents were tracked and most acci- dent investigation reports were not open to public. Sometimes, the real causes were unconsciously misunderstood by the public because the original information was too complicated or un-integrated [4–8]. As time went on, the accidents were gradually forgotten and few things were learnt from them. Yangmingtan Bridge is located in Harbin City. It was constructed on December 25, 2009 and put into use on November 6, 2011. The bridge collapse accident occurred on 24 August, 2012, and killed three persons, injured five persons and involved four trucks falling down from the bridge. This accident evoked widespread concern from the public and media, but no official accident investigation report has drawn any conclusion as to what caused the accident until now. As well, no related research was carried out. In order to prevent similar incidents, this research sought to find the most appropriate method to capture the accident information and identify the potential root causes of the Yangmingtan Bridge collapse accident. http://dx.doi.org/10.1016/j.engfailanal.2015.05.003 1350-6307/Ó 2015 Elsevier Ltd. All rights reserved. ⇑ Corresponding author. Tel.: +86 10 8232 2619. E-mail address: [email protected](Y. Fan). Engineering Failure Analysis 56 (2015) 20–27 Contents lists available at ScienceDirect Engineering Failure Analysis journal homepage: www.elsevier.com/locate/engfailanal
In recent years, more than thirty bridge accidents have occurred in China, but only fewaccidents were tracked and most accident investigation reports were not open to the pub-lic. The Yangmingtan Bridge collapse accident occurred on 24 August, 2012 in Harbin City,which caused three fatalities and five injuries. This accident has evoked wide concern fromthe public and media, but no official report provided any conclusion on the cause of theaccident until now, while no related research was ever undertaken either. NVivo is a qual-itative data analysis package which helps researchers to organize and analyze complex nonnumerical or unstructured data. Because of the lack of data in the official report, thisresearch collected both texts and multimedia information from the web, newspaper andvideos to identify potential root causes of the accident. This research first organized allinformation with the aid of NVivo 8.0 software. Then Rasmussen’s accident causationmodel was adopted for use as the frame nodes for the case study. Based on the software,this research analyzed the system wide failures and actions involved in the accident andidentified the multi-levels of failure modes which included government, regulatory agency,company, management, staff, and the physical accident sequence.
� 2015 Elsevier Ltd. All rights reserved.
1. Introduction
In the recent years, more than thirty bridge accidents have occurred in China [1]. Learning from accidents, incidents anddisasters contributes to improvement of safety and the prevention of unwanted events [2]. One reason for the fact that inci-dents keep recurring is a failure to successfully learn from incidents [3]. For these Chinese bridge accidents, although therewas a lot of information or data related to them when they occurred, only a few of the accidents were tracked and most acci-dent investigation reports were not open to public. Sometimes, the real causes were unconsciously misunderstood by thepublic because the original information was too complicated or un-integrated [4–8]. As time went on, the accidents weregradually forgotten and few things were learnt from them.
Yangmingtan Bridge is located in Harbin City. It was constructed on December 25, 2009 and put into use on November 6,2011. The bridge collapse accident occurred on 24 August, 2012, and killed three persons, injured five persons and involvedfour trucks falling down from the bridge. This accident evoked widespread concern from the public and media, but no officialaccident investigation report has drawn any conclusion as to what caused the accident until now. As well, no relatedresearch was carried out. In order to prevent similar incidents, this research sought to find the most appropriate methodto capture the accident information and identify the potential root causes of the Yangmingtan Bridge collapse accident.
Y. Fan et al. / Engineering Failure Analysis 56 (2015) 20–27 21
2. Methods
2.1. Organizing the accident information by NVivo
When an accident occurs in China, there is usually a lot of information to explain the accident background, what triggeredthe accident, how it developed and so on. This information may come from local government, the media, the victims or theirfamilies and various witnesses. There can be a mass of different types of information, so there should be a tool to organizethat information.
NVivo is a qualitative data analysis (QDA) computer software package designed for qualitative researchers working withvery rich text-based and/or multimedia information, where deep levels of analysis on small or large volumes of data arerequired [9]. It is intended to help users organize and analyze non-numerical or unstructured data. The software allows usersto classify, sort and arrange information; examine relationships in the data; and combine analysis with linking, shaping,searching and modeling [10]. Fig. 1 shows the framework of NVivo software. While different types of data are inputted, theyare coded by the software and shown as free nodes. Based on these free nodes, they are organized and analyzed according toa specified analysis model (in this research, a proper accident model will be chosen) which provides a framework (tree) ofaccident causes. According to the keywords in the framework, this data is assigned to categories, which then builds treenodes and can be coded as a form of classification [11–14]. This research will adopt NVivo 8.0 to organize and analyzethe original information.
2.2. Accident causation model
Accident prevention depends to a large degree on lessons learned from accident investigation. What we can learn in turnreflects the different perceptions of the accident phenomenon, which for many years now have been called the accidentmodels [15,16]. Providing conceptualization of characteristics of the accident, accident models typically show the relationbetween causes and effects [17]. From an international viewpoint, accident models started with relatively uncomplicatedsingle-factor models, e.g. accident proneness [18] and developed via simple and complex linear causation models topresent-day systematic or functional models [16,19]. With a very fast pace of change of technology, there is little doubt thatsome form of human error contributes to most incidents and accidents which occur in complex systems [20–25]. Dekker [26]described how the role of human error in accident investigation over the last two decades has shifted from a personapproach to a system/organization one, and the analysis has moved from the more direct cause of accidents to problemsdeeper inside the system. New types of accident model, based on system theory, classified as systemic accident modelsemerged which described characteristic performance on the level of the system as a whole [17]. For the Yangmingtan acci-dent, although the initial direct cause was regarded as driving an overloaded truck on the bridge, more information disclosedfaults in design, and the lack of regulations or standards which were root causes in systemic accident models. These rawmaterials matched the nature of systemic accident models and revealed the contributors to the accident both at the sharpend (the staff) and the blunt end (regulation agency or the government).
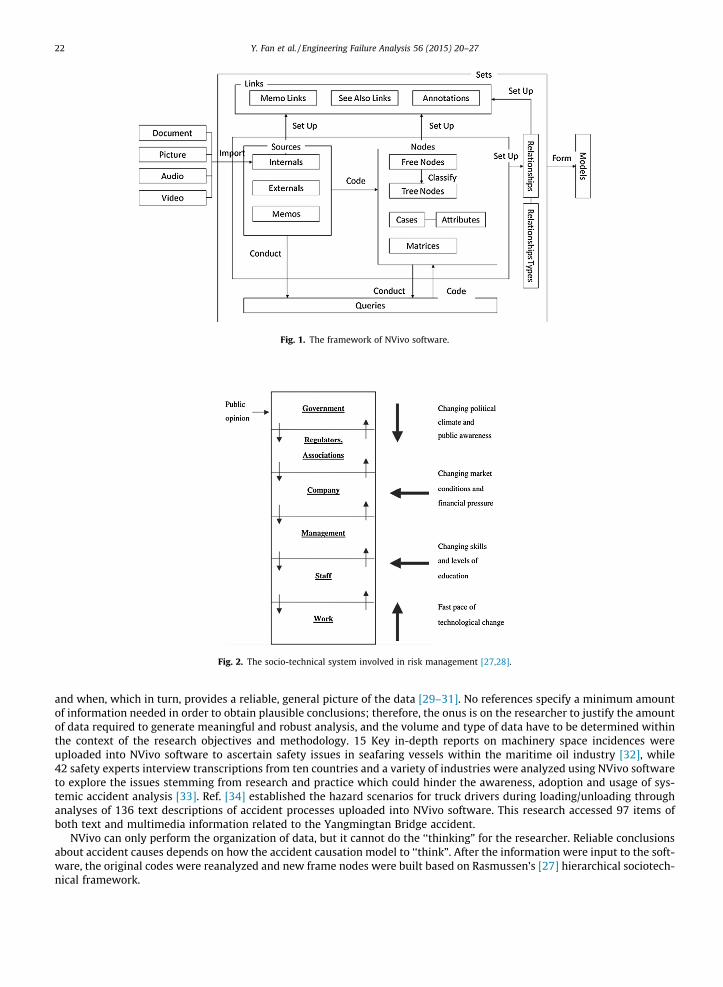
Among the systemic accident causation models, Rasmussen’s [27] hierarchical sociotechnical framework is one of notableapproaches that endeavors to capture the dynamics and nonlinear interactions between system components in complexsociotechnical systems. Rasmussen [27,28] considers that the propagation of an accidents course of events is shaped bythe activity of people that can either trigger an accident’s flow of events or divert a normal flow. Safety, then, depends onthe control of work processes so as to avoid accident side effects causing harm to people, environment, or investment.According to Rasmussen’s risk management framework, many levels of politicians, managers, safety officers, and work plan-ners are involved in the control of safety by means of laws, rules, and instructions (which may be verbal), for the ultimatecontrol of some hazardous, physical process. They seek to motivate workers and operators, to educate them, to guide them,or to constrain their behavior by rules, so as to increase the safety of their performance; see Fig. 2. This research will adoptRasmussen’s model to show factors which caused a failure of control from the sharp end (the immediate accident sequence)to the blunt end (the quite remote government level).
2.3. The process of the accident analysis
As stated above, several bridge accidents have occurred in recent years but few lessons were learnt from them becausethe original investigation information was not collected or provided in a systematic way and the accident investigationreports were not made available publicly. What the public could read was only the information from the web or news pro-grams or papers. Although this information is available just after the occurrence of the accident, it disappears gradually withtime. Based on the current background of accident investigation in China, this research collected all the information and datarelated to the accident from the web, newspaper and videos after the accident as thoroughly as possible. Faulty or unreliableinformation identified by the research team was discarded.
Next, both texts and multimedia information related to the accident were input into the NVivo 8.0 software package foranalysis, then priority codes were defined for template analysis. NVivo is a data organization tool, it serves to facilitate anaccurate and transparent data analysis process while also providing a quick and simple way of counting who said what
Fig. 1. The framework of NVivo software.
Fig. 2. The socio-technical system involved in risk management [27,28].
22 Y. Fan et al. / Engineering Failure Analysis 56 (2015) 20–27
and when, which in turn, provides a reliable, general picture of the data [29–31]. No references specify a minimum amountof information needed in order to obtain plausible conclusions; therefore, the onus is on the researcher to justify the amountof data required to generate meaningful and robust analysis, and the volume and type of data have to be determined withinthe context of the research objectives and methodology. 15 Key in-depth reports on machinery space incidences wereuploaded into NVivo software to ascertain safety issues in seafaring vessels within the maritime oil industry [32], while42 safety experts interview transcriptions from ten countries and a variety of industries were analyzed using NVivo softwareto explore the issues stemming from research and practice which could hinder the awareness, adoption and usage of sys-temic accident analysis [33]. Ref. [34] established the hazard scenarios for truck drivers during loading/unloading throughanalyses of 136 text descriptions of accident processes uploaded into NVivo software. This research accessed 97 items ofboth text and multimedia information related to the Yangmingtan Bridge accident.
NVivo can only perform the organization of data, but it cannot do the ‘‘thinking” for the researcher. Reliable conclusionsabout accident causes depends on how the accident causation model to ‘‘think”. After the information were input to the soft-ware, the original codes were reanalyzed and new frame nodes were built based on Rasmussen’s [27] hierarchical sociotech-nical framework.
Y. Fan et al. / Engineering Failure Analysis 56 (2015) 20–27 23
3. Result
This research accessed 97 items information related to the accident. Fig. 3 is an interface of original information input intoNVivo 8.0 software. Because the original materials are in Chinese, English notes are added in the text to the parts shown withgreen dotted line rectangles, tagged sequentially with numbers.
All the information was collected in the folder named as ‘‘内部材料” tagged with ① in Fig. 3. According to their sources,they were first classified into four categories which included Media, official organization, professionals and victims’ familiestagged with② in Fig. 3. The right part tagged with③ is the statistic of each category. The bottom part is a piece of input froma newspaper named the Eastern Morning News on 24 September 2012 (tagged with ④ in Fig. 3). The title of the piece ofnews is ‘‘There are still some issues unsolved” (tagged with ⑤ in Fig. 3). Based on the notification issued on 23September 2012 from Harbin government office that the Yangmingtan accident was caused by overloading (tagged with⑥ in Fig. 3), several queries (in red1 color in Fig. 3) were provided by the citizens and media such as the structure design,the quality of the project, alarm and so on (tagged with⑦ in Fig. 3). The news also provided some detailed proof of these queries(tagged with ⑧ in Fig. 3).
After all the information was inputted to NVivo 8.0 software, four tree nodes were built based on the original context andthe interface of the software is shown in Fig. 4. These tree nodes were poor design of the bridge, stress born by the bridge,quality of construction and overload. The tree nodes and their sub-nodes are shown in left part of Fig. 4 and they also aredepicted in Fig. 5 in English as the contributors to the accident from each of the tree nodes. Besides these tree nodes, thereare some free nodes, include regulation, supervision, maintenance and so on. Finally, the information was organized and ana-lyzed according to the six levels of Rasmussen’s causation model.
4. The contributors to the accident
Based on the information organized using NVivo 8.0, Fig. 6 depicts the contributors to the accident in six levels accordingto Rasmussen’s accident model. The arrows in Fig. 6 are to be understood as meaning ‘‘cause”.
4.1. The accident sequence
Level 1, the bottom level of Fig. 6, lays out the events – physical processes and operator actions – which contributed to theaccident sequence. The irregular star represents the critical outcome – the collapse of the bridge. The sequence starts withthe ‘‘ill” bridge which followed the truck overload. This led to the bridge being subject to uneven stress and overstress invarious parts which caused the collapse of the bridge (the accident), with the resulting fatalities and injuries.
4.2. The truck overload
Level 2 is about staff, which here refers to the driver who triggered the Yangmingtan Bridge accident and the operator inYangmingtan Bridge operational management office who supervised the overloaded truck. The truck overload is the mostdirect cause of this accident. The maximum load limit of each truck on the bridge is 105 kg while the actual load was over4 � 105 kg. Each truck driver loaded their truck with as much as possible in order to improve their work efficiency and earnmore money, but the loads were well over the bridge limit. The load in each truck would be checked by an operator in thebridge operational management office who was responsible for the maintenance of the bridge. There is no information whichproved the driver knew the maximum load limit for the bridge, but the operator in the operational management officeshould have known it. However, the operators usually implemented their management by charging a fine, resulting in anoverloaded truck travelling across the bridge by paying the fine instead of reducing the load.
4.3. Poor maintenance of the bridge
Level 3 is about the management of the bridge. The Yangmingtan Bridge operational management office was responsiblefor the maintenance of the bridge and the supervision of the passing vehicles. If an overloaded truck was the main cause ofthe collapsed bridge accident, any warning about overloading should be the first issue raised between the bridge manage-ment office and the driver. But around the bridge, there was no sign reminding the drivers of the maximum load for thebridge and about taking responsibility for their loads. When a vehicle which was overloaded arrived at the entrance ofbridge, the driver did not need to reduce their load, and was allowed to pass through by paying a fine. Such ‘‘punishingescrow” can affect overloading, but it cannot control the effect of overloading in the long run. In fact, the bridge had beenin use for less than two years before the accident occurred. Except for the overloaded truck problem, the operational man-agement office was responsible for the maintenance of the bridge and identifying the defect while it was in use, but no evi-dence can be to prove that the operational management office had done any other routine maintenance in the two years thebridge was in use before it collapsed. While the office is responsible for the management of the bridge, there were no clear
1 For interpretation of color in Fig. 3, the reader is referred to the web version of this article.
Fig. 3. An example of original information input to NVivo.
Fig. 4. An interface of the tree nodes.
24 Y. Fan et al. / Engineering Failure Analysis 56 (2015) 20–27
requirements or detailed procedures that detailed how to maintain the bridge, or what personnel should inspect in theiroperation of the bridge on a daily basis.
4.4. Poor quality of the bridge
Level 4 is about the design and construction of the Yangmingtan Bridge. The accident is related to three companies whichare the design company, the construction company and the project supervision company. These companies depended oneach other to assure the quality of the bridge. Any one of them with poor quality in their work will affect the quality ofthe whole project. However, the problem is that each of them in this project has had a very bad performance. For the designcompany, there are two obvious faults in their design. One is lack of enough support which refers that the two sides of thecross section for the bridge has not any supporting points. The other is that the connection part is not strong enough for the
Causations of the accident
Poor design
Poor quality of construction
Stress born by the bridge
Overload
Defectivestructure design
Error in calculation data
Defective construction diagram
Improper construction method
Uneven stress
Excessive stress
Poor operational management
Poor operational mechanism
Morals
Lack of regulation
Defective supervision
Defective management
Poor education
Fig. 5. The contributors of the accident from the tree nodes.
Y. Fan et al. / Engineering Failure Analysis 56 (2015) 20–27 25
stress applied to it, furthermore the junction is not staked very well. A serious problem is that the original proposal has beenchanged in order to save money. In this project, eight major sections of the ground adopted the steel–concrete structureinstead of concrete structure, which decreased the weight of the bridge thus affected its balance. As to the construction com-pany, they shortened the construction time limit and adopted substitute materials which sacrificed safety to decrease theircosts and improve profitability. As for the project supervision company, it is one to whom a citation had been issued by thelocal construction regulation agency and its two supervisors each were guilty of violations just before this project. It showshazard identification, risk evaluation and hazard control had been carried out very poorly through each phase of the project’slife cycle. The concept of system safety was not defined or set out in the project.
4.5. Lack of standards
Level 5 is about regulatory agencies or associations. Design using single-column piers was adopted for the YangmingtanBridge. This kind of design was common in Europe and America, but the pertinent specification and standard are notmatched by accepted practice in China. In fact, the actual Chinese standard is not adequate. Statistics show that bridgeload-carrying capacity in China is only 60–70% of that in developed countries [35], while vehicle overload is very commonin Chinese traffic. As a result, the present Chinese standard for load-carrying capacity is inadequate. In addition, according tothe pertinent Chinese code of practice of code for the single-column pier design, there is no requirement for any countermea-sures which may be needed. Poor design by the design company was caused by lack of a suitable standard. That meant thatthe regulatory agency could not adequately furnish the companies with skilled and impartial advice and assistance.
4.6. Government failure
Level 6, the top level of Fig. 6, is about the government. The government should define clearly the responsibility of eachlevel in the diagram, contemplating something in the nature of continuous official supervision and rigorous enforcement.However, from a vertical perspective view of this accident, neither the driver nor the operational management office recog-nized their responsibility for the safety of the bridge. As to the regulatory agency or associate, although they published stan-dards, no one had measured the reliability or feasibility of these standards. There are also big gaps between the standardsand the practice.
5. Conclusion
While a number of bridge accidents have occurred in recent years, we have not learnt from these accidents. Based on verylimited official and other data, this research analyzed the Yangmingtan Bridge accident by adopting the NVivo softwarepackage. This organized and analyzed original information using Rasmussen’s accident model to identify the contributoryfactors to the accident. The research shows the effectiveness of using content analysis in exposing major contributing factorsto Chinese bridge collapse accidents.
No definition of
responsibilityPoor
supervisionNo rigorous enforcement
Lack of standards
Unapplied standards
Faultycaculation in
design
Change structure of the
design
Reducing construction
period
Substituted materials with poor quality
Supervisor company with
poor performance
Poor supervision on
overload
Poor maintenance
No warning Punishingescrow
Overload by the driver
Permission of overload truck
pass by the operator
Ill bridge Truck overloadUneven stress or excessive
stress
Death and injuries
Collapse of the bridge
Government
Regulatory agency/Association
Company
Management
Staff
Physical accident sequence
Fig. 6. The contributory factors to the Yangmingtan Bridge accident based on Rasmussen’s accident model.
26 Y. Fan et al. / Engineering Failure Analysis 56 (2015) 20–27
This research analyzed the system wide failures and actions involved in the accident and identified the six levels of failuremodes including government, regulatory agency, company, management, staff, and the physical accident sequence. It showsthat:
(1) Human error based on organization proved to be the main root cause of the bridge collapse accident, which wasimpacted by the decisions at all levels, not just by those of driver or operator in the Yangmingtan Bridge managementoffice alone.
(2) This research identified the contributors both at sharp end (the driver) and the blunt end (regulatory agencyand the government). The requirements of system safety should be built into government and companies,and this requires hazard identification, risk evaluation and hazard control through all phases of the project’slife cycle.
(3) The body which is responsibility for assuring the bridge safety is not clear in China. There is a lack of balance betweenthe regulatory and voluntary elements of the overall ‘‘system”. There are also big gaps between the standards and thepractice.
Y. Fan et al. / Engineering Failure Analysis 56 (2015) 20–27 27
Acknowledgements
The funding of this research was provided by National Science Foundation of China (NSFC Grant No. 51474193) and ChinaUniversity of Geosciences (Beijing) through the ‘Fundamental Research Funds for the Central Universities’ (No. 2652013103).The authors would like to thank Mr. Ian Preston and Professor Geoffrey Taylor of Curtin University for help with editing theEnglish.
References
[1] Fu G. 37 Bridge accidents in five years, only 7 of them were tracked, [cited 2014 September 23]; 2012. <http://finance.people.com.cn/GB/n/2012/0831/c1004-18884837.html>.
[2] Drupsteen L, Guldenmund FW. What is learning? A review of the safety literature to define learning from incidents, accidents and disasters. JContingencies Crisis Manage 2014;22(2):81–95.
[3] Kirwan B. Coping with accelerating socio-technical systems. Saf Sci 2001;37(2–3):77–107.[4] Qu W, Su Y, Zhang C. Analysis and suggestions on domestic bridge accidents. Cybertecture Field 2013;14:316.[5] Qi B, Fu Z. Analysis on the causes of bridge collapse in China. J Civil Eng 2010;43:495–8.[6] Li Y. Survey and research on bridge collapse accidents in China in recent years. Theoretical Studies of Urban Construction, 2012. p. 2.[7] Wu T. Lessons and elucidation of the recent bridge collapse accidents. Sichuan Build 2013;33(2):194–7.[8] Xu H, Guo G, Pu H, Yuan M. The cause and lesson of bridge accidents in recent years in China. China Saf Sci J 2007;17(1):90–7.[9] QSR International, What is qualitative research? <http://www.qsrinternational.com/what-is-qualitative-research.aspx> [cited 2014 September 23].[10] Guo Y. Qualitative data analysis: use bible of Nvivo 8. Taipei: Higher Education Culture Co., Ltd.; 2009.[11] An Y. Analysis of qualitative data analysis software NVivo computer. Chin Technol Inf 2012;5:66–7.[12] Yuan Z. Using NVivo mathematics students’ concept of information technology. Mod Ed Technol 2012;9:28–31.[13] Fletcher R, Baulcomb C, Hall C, Hussain S. Revealing marine cultural ecosystem services in the Black Sea. Mar Pol 2014;50:151–61.[14] Hovden J, Størseth F, Tinmannsvik RK. Multilevel learning from accidents – case studies in transport. Saf Sci 2011;49(1):98–105.[15] Benner LJ. Five accident theories and their implications for research. In: Joint international meeting of the American association for automotive
medicine and the international association for accident and traffic medicine. Ann Arbor (MI); 1978. <http://www.iprr.org/THEORY/AnnArbor78.htm>.[16] Hollnagel E. Resilience – the challenge of the unstable. In: Hollnagel E, Woods DD, Leveson N, editors. Resilience engineering: concepts and precepts.
Aldershot: Ashgate; 2006.[17] Qureshi ZH. A review of accident modelling approaches for complex critical sociotechnical systems. Command, control, communications and
intelligence division, defence science and technology organisation: Edinburgh; 2008.[18] Greenwood SJ, Woods HM. The incidence of industrial accidents upon individuals with special reference to multiple accidents. London: HMSO: British
Industrial Fatigue Research Board; 1919.[19] Hollnagel E. Barriers and accident prevention. Hampshire: Ashgate; 2004.[20] Atkins. Research programme management rail-specific HRA technique for driving tasks user manual. London: Rail Safety and Standards Board
Research Catalogue; 2003.[21] Baysari MT, Caponecchia C, McIntosh AS, Wilson JR. Classification of errors contributing to rail incidents and accidents: a comparison of two human
error identification techniques. Saf Sci 2009;47:948–57.[22] Gilchrist A, Bowen K, Moynihan P. An investigation into the causation of signals passed at danger. Rail Safety and Standards Board Research Catalogue;
1990.[23] Hall S. Beyond hidden dangers: railway safety into the 21st century. Hersham: Surrey Ian Allan Publishing; 2003.[24] Krokos KJ, Baker DP. Preface to the special section on classifying and understanding human error. Hum Factors Ergonomics Manuf Service Ind 2007;49
(2):175–7.[25] Shappell SA, Wiegmann DA. A human error approach to accident investigation: the taxonomy of unsafe operations. Int J Aviation Psychol 1997;7
(4):269–91.[26] Dekker SWA. Reconstructing human contributions to accidents: the new view on human error and performance. J Saf Res 2002;33:371–85.[27] Rasmussen J. Risk management in a dynamic society: a modelling problem. Saf Sci 1997;27(2–3):183–213.[28] Rasmussen J, Svedung I. Proactive risk management in a dynamic society. Karlstad: risk & environmental department, Swedish Rescue Services
Agency; 2000.[29] Morrison M, Moir J. The role of computer software in the analysis of qualitative data: efficient clerk, research assistant or Trojan horse? J Adv Nurs
1998;28(1):106–16.[30] Richards L, Richards T. From filing cabinet to computer. In: Bryman A, Burgess RG, editors. Analysing qualitative data. London: Routledge; 1994.[31] Welsh E. Dealing with data: using NVivo in the qualitative data analysis process. Forum: Qual Soc Res 2002;3(2).[32] Ikeagwuani UM, John GA. Safety in maritime oil sector: content analysis of machinery space fire hazards. Saf Sci 2013;51(1):347–53.[33] Underwood P, Waterson P. Systemic accident analysis: examining the gap between research and practice. Accident Anal Prevention 2013;55:154–64.[34] Shibuya H, Cleal B, Kines P. Hazard scenarios of truck drivers’ occupational accidents on and around trucks during loading and unloading. Accident Anal
Prevention 2010;42(1):19–29.[35] Luo C, Xie X. Comparison study of accident causing theory. J Saf Sci Technol 2007;3(5):111–5.