Failure predictions of DP600 steel sheets using various uncoupled fracture criteria Niloufar Habibi a , Ali Ramazani b,⇑ , Veera Sundararaghavan b , Ulrich Prahl a a Steel Institute, RWTH Aachen University, Germany b Department of Aerospace Engineering, University of Michigan, Ann Arbor, USA article info Article history: Received 8 April 2017 Received in revised form 1 December 2017 Accepted 15 December 2017 Available online 26 December 2017 Keywords: Dual-phase (DP) steel Forming limit diagram at fracture Ductile fracture criteria Cross-die test Bulge test abstract Dual-phase (DP) steel sheets have high potential for utilization as automotive structures due to their good combination of strength and ductility. As sheet metal forming processes induce complicated stress-strain states, determination of forming limit is vital, particularly using numerical approaches. This current study aims to examine the fracture behavior of DP600 steel sheets through several ductile fracture criteria in a wide range of stress states. For a better and more accurate understanding of the experimental tests, parallel numerical simulations were performed. First, the models were calibrated using the results of Nakazima tests, and then the fracture loci in principal strains, and equivalent strain- stress triaxiality spaces were predicted by each model. The capability of the criteria was verified through cross-die and bulge tests. Also, errors were quantified for the calculated results using correlation coefficient and relative error methods. The results reveal that Maximum Shear Stress, Modified Mohr Coulomb, and Lou fracture models were able to predict the onset of fracture with acceptable accuracy. However, Maximum Shear Stress required only one experimental test to be calibrated. Ó 2017 Elsevier Ltd. All rights reserved. 1. Introduction The selected sheet materials to manufacture the body-in-white and closure panels of an automobile have a strong influ- ence on a vehicle’s performance terms of safety, fuel economy, noise and vibration, and durability. In this regard, modern automotive manufacturing introduced materials with higher strength-to-weight ratios, such as advanced high strength steels (AHSSs) to replace the conventional ones [1–3]. Among AHSSs, dual phase (DP) steels have been of great interest in the automotive industry due to their microstructure consisting of dispersion of hard martensite particles in soft and form- able ferrite matrix [4–6]. This structure provides superior strength without any decrease in formability [6,7]. However, their applications are restricted due to their complex failure behavior [8–10]. Therefore, their failure behavior should be under- stood and subsequently controlled in different forming processes, which is very important for automotive industry [11– 13]. On the other hand, since the multiphase microstructure of DP steels results in a complex micromechanical behavior, formability of these steels requires to be studied in order to make their widespread use possible, particularly in automobile body structure [13–16]. A relatively new experimental technique, which was originally designed by the automotive industry as a press-shop formability test is ‘cross-die’ deep drawing test. Since this method is able to trigger a wide variety of stress states, i.e. from https://doi.org/10.1016/j.engfracmech.2017.12.022 0013-7944/Ó 2017 Elsevier Ltd. All rights reserved. ⇑ Corresponding author. E-mail address: [email protected](A. Ramazani). Engineering Fracture Mechanics 190 (2018) 367–381 Contents lists available at ScienceDirect Engineering Fracture Mechanics journal homepage: www.elsevier.com/locate/engfracmech
Niloufar Habibi a, Ali Ramazani b,⇑, Veera Sundararaghavan b, Ulrich Prahl a
a Steel Institute, RWTH Aachen University, GermanybDepartment of Aerospace Engineering, University of Michigan, Ann Arbor, USA
a r t i c l e i n f o
Article history:Received 8 April 2017Received in revised form 1 December 2017Accepted 15 December 2017Available online 26 December 2017
Keywords:Dual-phase (DP) steelForming limit diagram at fractureDuctile fracture criteriaCross-die testBulge test
a b s t r a c t
Dual-phase (DP) steel sheets have high potential for utilization as automotive structuresdue to their good combination of strength and ductility. As sheet metal forming processesinduce complicated stress-strain states, determination of forming limit is vital, particularlyusing numerical approaches. This current study aims to examine the fracture behavior ofDP600 steel sheets through several ductile fracture criteria in a wide range of stress states.For a better and more accurate understanding of the experimental tests, parallel numericalsimulations were performed. First, the models were calibrated using the results ofNakazima tests, and then the fracture loci in principal strains, and equivalent strain-stress triaxiality spaces were predicted by each model. The capability of the criteria wasverified through cross-die and bulge tests. Also, errors were quantified for the calculatedresults using correlation coefficient and relative error methods. The results reveal thatMaximum Shear Stress, Modified Mohr Coulomb, and Lou fracture models were able topredict the onset of fracture with acceptable accuracy. However, Maximum Shear Stressrequired only one experimental test to be calibrated.
� 2017 Elsevier Ltd. All rights reserved.
1. Introduction
The selected sheet materials to manufacture the body-in-white and closure panels of an automobile have a strong influ-ence on a vehicle’s performance terms of safety, fuel economy, noise and vibration, and durability. In this regard, modernautomotive manufacturing introduced materials with higher strength-to-weight ratios, such as advanced high strengthsteels (AHSSs) to replace the conventional ones [1–3]. Among AHSSs, dual phase (DP) steels have been of great interest inthe automotive industry due to their microstructure consisting of dispersion of hard martensite particles in soft and form-able ferrite matrix [4–6]. This structure provides superior strength without any decrease in formability [6,7]. However, theirapplications are restricted due to their complex failure behavior [8–10]. Therefore, their failure behavior should be under-stood and subsequently controlled in different forming processes, which is very important for automotive industry [11–13]. On the other hand, since the multiphase microstructure of DP steels results in a complex micromechanical behavior,formability of these steels requires to be studied in order to make their widespread use possible, particularly in automobilebody structure [13–16].
A relatively new experimental technique, which was originally designed by the automotive industry as a press-shopformability test is ‘cross-die’ deep drawing test. Since this method is able to trigger a wide variety of stress states, i.e. from
Ci material constants in the ductile fracture criteriaD damage indicator, D ¼ R �ef
0d�e
fðg;lÞ (when D = 1 the fracture occurs)E experimental results, in this study the results of equivalent strainsK, n material constants in Hollomon strain hardening model, �r ¼ K�enN the number of data were utilized in the investigation (stress triaxialities)P predicted results, in this study the results of equivalent strainsb strain ratio, b ¼ de2
de1r1;r2;r3 principal stresses, r1 P r2 P r3�r von Mises equivalent stress, 2 �r2 ¼ ðr1 �r2Þ2 þ ðr1 �r2Þ2 þ ðr1 �r2Þ2rm mean or hydrostatic stress, rm ¼ ðr1 þr2 þr3Þ=3e1; e2; e3 principal strains, e1 P e2 P e3�e equivalent plastic strain�ef equivalent plastic strain at fractureg stress triaxiality, g ¼ rm=�rl Lode parameter, l ¼ ð2r2 �r1 �r3Þ=ðr1 �r3ÞAHSS advanced high strength steelDP dual-phaseFE finite elementFFLD fracture forming limit diagramFLD forming limit diagramJ-C Johnson–CookMMC3 Modified Mohr-ColoumbMSS Maximum Shear Stress
368 N. Habibi et al. / Engineering Fracture Mechanics 190 (2018) 367–381
unixial tension to plane-strain, and biaxial tension, it is a good candidate to evaluate the formability of sheets. As the sheetsexperience complicated stress states during the deformation, like other forming processes, a comprehensive study isrequired to obtain the forming limits, i.e. the onset of necking, fracture, tearing, and wrinkling. While the experimental deter-mination of formability is a time-consuming and difficult process, theoretical prediction methods are preffered. Like otherAHSS sheets, DP steel sheets fail catastrophically with little post necking strains, damage is considered as the most criticalforming limit [17–20]. In this regard, different coupled damage models were successfully employed to measure the forminglimits through cross-die deep drawing tests [21–23]. However, the capability of uncoupled fracture models have never beenassessed to predict the forming limits of this experimental test.
In the present research, a comparative numerical study was made on the ability of uncoupled ductile fracture criteria todescribe the failure behavior of DP600 steel sheets in a wide range of stress triaxialities. The models were calibrated usingthe results of Nakazima tests, then the fracture loci in principal strains, and equivalent plastic strain-stress triaxiality spaceswere predicted by each model. The capability of the criteria were examined through cross-die and bulge tests. Finally, theerrors were quantified for calculated results.
2. Experimental procedure
2.1. Material
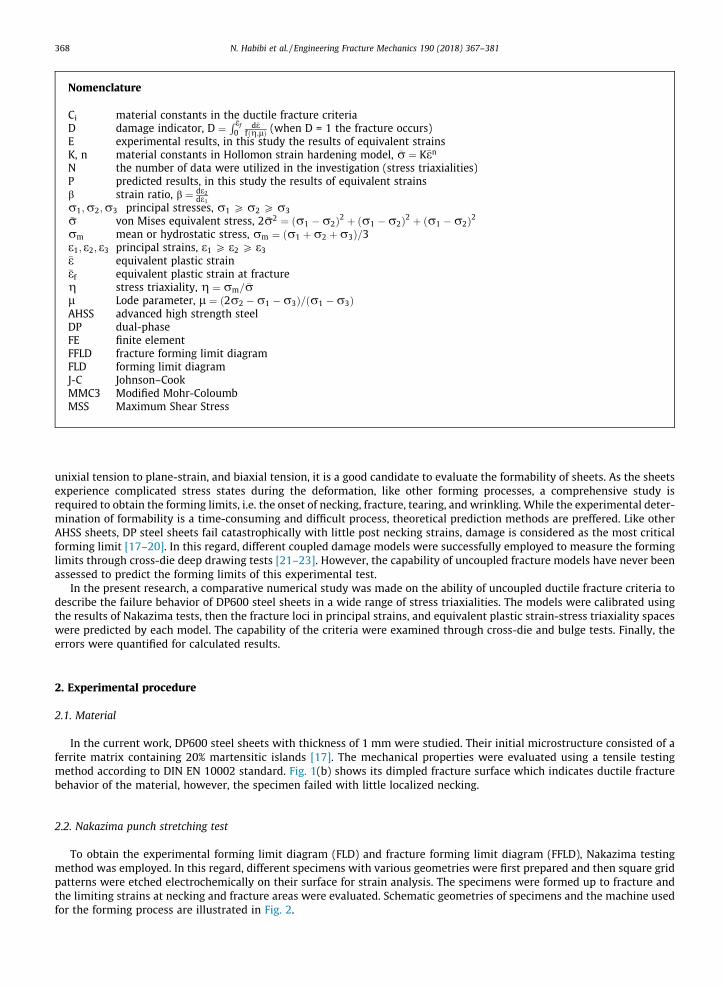
In the current work, DP600 steel sheets with thickness of 1 mm were studied. Their initial microstructure consisted of aferrite matrix containing 20% martensitic islands [17]. The mechanical properties were evaluated using a tensile testingmethod according to DIN EN 10002 standard. Fig. 1(b) shows its dimpled fracture surface which indicates ductile fracturebehavior of the material, however, the specimen failed with little localized necking.
2.2. Nakazima punch stretching test
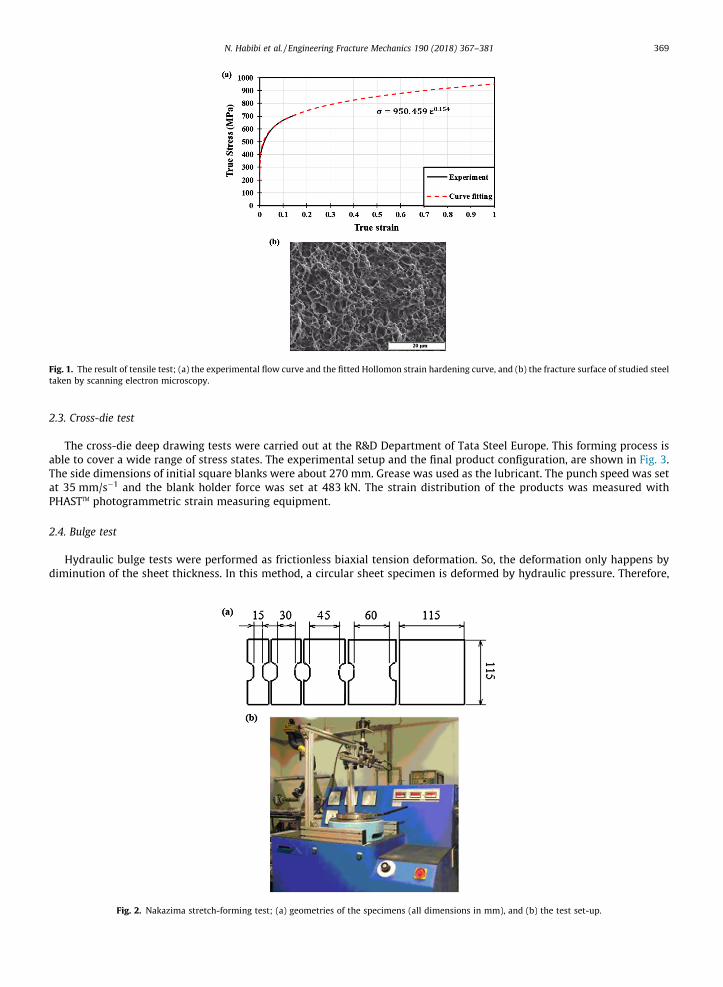
To obtain the experimental forming limit diagram (FLD) and fracture forming limit diagram (FFLD), Nakazima testingmethod was employed. In this regard, different specimens with various geometries were first prepared and then square gridpatterns were etched electrochemically on their surface for strain analysis. The specimens were formed up to fracture andthe limiting strains at necking and fracture areas were evaluated. Schematic geometries of specimens and the machine usedfor the forming process are illustrated in Fig. 2.
Fig. 1. The result of tensile test; (a) the experimental flow curve and the fitted Hollomon strain hardening curve, and (b) the fracture surface of studied steeltaken by scanning electron microscopy.
N. Habibi et al. / Engineering Fracture Mechanics 190 (2018) 367–381 369
2.3. Cross-die test
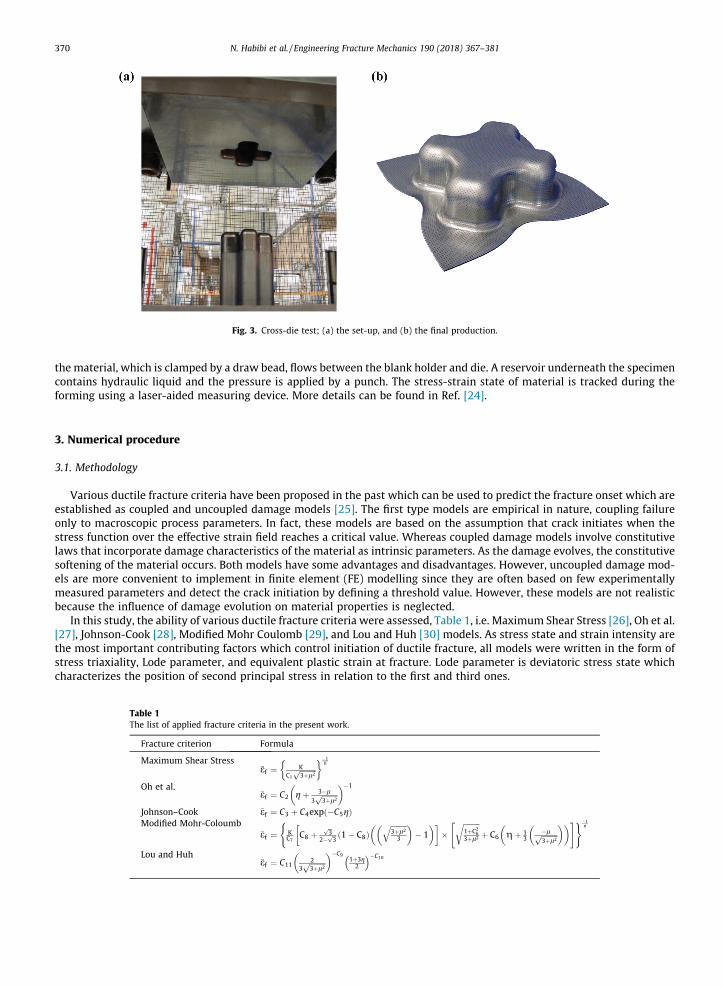
The cross-die deep drawing tests were carried out at the R&D Department of Tata Steel Europe. This forming process isable to cover a wide range of stress states. The experimental setup and the final product configuration, are shown in Fig. 3.The side dimensions of initial square blanks were about 270 mm. Grease was used as the lubricant. The punch speed was setat 35 mm/s�1 and the blank holder force was set at 483 kN. The strain distribution of the products was measured withPHASTTM photogrammetric strain measuring equipment.
2.4. Bulge test
Hydraulic bulge tests were performed as frictionless biaxial tension deformation. So, the deformation only happens bydiminution of the sheet thickness. In this method, a circular sheet specimen is deformed by hydraulic pressure. Therefore,
Fig. 2. Nakazima stretch-forming test; (a) geometries of the specimens (all dimensions in mm), and (b) the test set-up.
Fig. 3. Cross-die test; (a) the set-up, and (b) the final production.
370 N. Habibi et al. / Engineering Fracture Mechanics 190 (2018) 367–381
the material, which is clamped by a draw bead, flows between the blank holder and die. A reservoir underneath the specimencontains hydraulic liquid and the pressure is applied by a punch. The stress-strain state of material is tracked during theforming using a laser-aided measuring device. More details can be found in Ref. [24].
3. Numerical procedure
3.1. Methodology
Various ductile fracture criteria have been proposed in the past which can be used to predict the fracture onset which areestablished as coupled and uncoupled damage models [25]. The first type models are empirical in nature, coupling failureonly to macroscopic process parameters. In fact, these models are based on the assumption that crack initiates when thestress function over the effective strain field reaches a critical value. Whereas coupled damage models involve constitutivelaws that incorporate damage characteristics of the material as intrinsic parameters. As the damage evolves, the constitutivesoftening of the material occurs. Both models have some advantages and disadvantages. However, uncoupled damage mod-els are more convenient to implement in finite element (FE) modelling since they are often based on few experimentallymeasured parameters and detect the crack initiation by defining a threshold value. However, these models are not realisticbecause the influence of damage evolution on material properties is neglected.
In this study, the ability of various ductile fracture criteria were assessed, Table 1, i.e. Maximum Shear Stress [26], Oh et al.[27], Johnson-Cook [28], Modified Mohr Coulomb [29], and Lou and Huh [30] models. As stress state and strain intensity arethe most important contributing factors which control initiation of ductile fracture, all models were written in the form ofstress triaxiality, Lode parameter, and equivalent plastic strain at fracture. Lode parameter is deviatoric stress state whichcharacterizes the position of second principal stress in relation to the first and third ones.
Table 1The list of applied fracture criteria in the present work.
N. Habibi et al. / Engineering Fracture Mechanics 190 (2018) 367–381 371
In order to employ any fracture criterion, it is crucial to have the entire stress-strain history of the material during defor-mation. Since it was difficult to acquire directly from the experimental tests, parallel numerical simulations were performedto calibrate the fracture models. In this respect, the experimental and simulation results of hemispherical-punch stretchingtest specimens with 15, 45, and 115 mm widths, which apply the different stress triaxialities, were analyzed.
3.2. Finite element simulation
The numerical simulations of all tests were performed according to the real conditions using the commercial finite-element software Abaqus/Explicit V6.12. The sheets were assigned as deformable homogenous shell with four-node quadri-lateral shell elements of type S4R. A dense mesh has been employed in all models in order to resolve the strain field andcapture instabilities. Mechanical properties of the investigated steel were taken from the tensile test result (Fig. 1). A fric-tional coefficient of 0.05 was applied between the contact surfaces using Coulomb friction model. Moreover, the followingassumptions were made:
1. As DP600 steel sheets exhibit little anisotropy in plasticity, von Mises isotropic yield function was employed in the pre-sent study.
2. Plane stress conditions were satisfied, i.e. r3 ¼ 0.3. The volume remained constant during plastic deformation, i.e. de1 þ de2 þ de3 ¼ 0.4. Strain hardening was isotropic and Hollomon strain-hardening law was used, �r ¼ K�en.5. The sheet metal is proportionally loaded.
6. Damage indicator was defined to track the onset of damage, D ¼ R �ef0
d�ef g;lð Þ, where crack initiates if D = 1.
7. The relation between stress triaxiality and strain path is g ¼ rm�r ¼ 1þbffiffi
3p ffiffiffiffiffiffiffiffiffiffiffiffi
1þbþb2p .
8. The Lode parameter can be related to stress triaxiality when r3 ¼ 0, cos p2 1� 6
p sin�1 �lffiffiffiffiffiffiffiffiffil2þ3
p� �� �� �
¼ �272 g g2 � 1
3
� �.
4. Results and discussion
4.1. Numerical simulation results
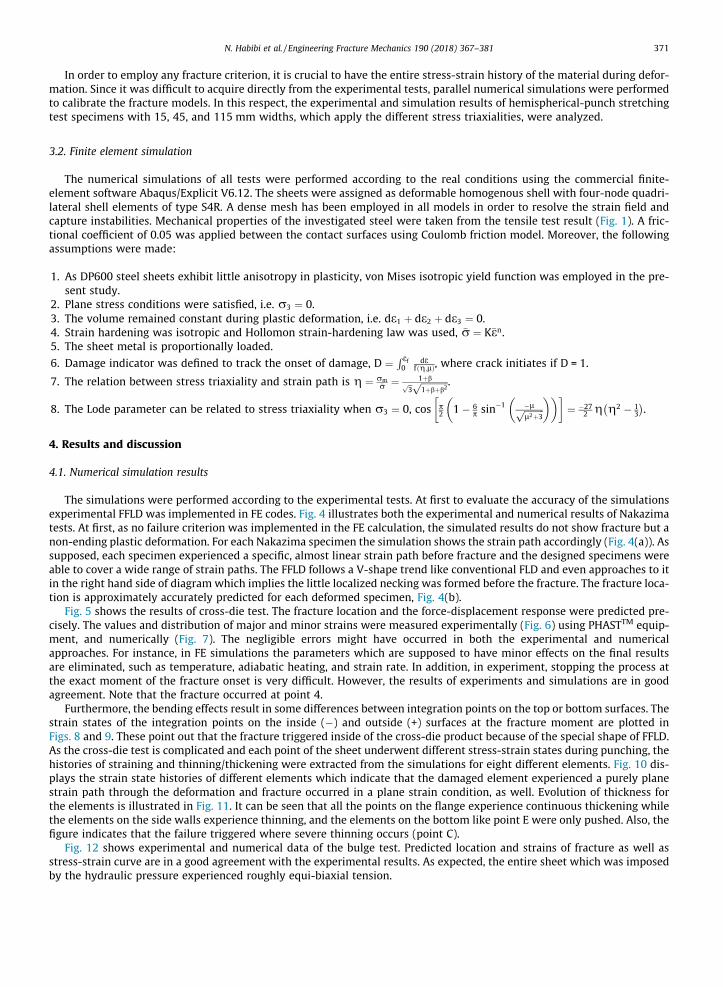
The simulations were performed according to the experimental tests. At first to evaluate the accuracy of the simulationsexperimental FFLD was implemented in FE codes. Fig. 4 illustrates both the experimental and numerical results of Nakazimatests. At first, as no failure criterion was implemented in the FE calculation, the simulated results do not show fracture but anon-ending plastic deformation. For each Nakazima specimen the simulation shows the strain path accordingly (Fig. 4(a)). Assupposed, each specimen experienced a specific, almost linear strain path before fracture and the designed specimens wereable to cover a wide range of strain paths. The FFLD follows a V-shape trend like conventional FLD and even approaches to itin the right hand side of diagram which implies the little localized necking was formed before the fracture. The fracture loca-tion is approximately accurately predicted for each deformed specimen, Fig. 4(b).
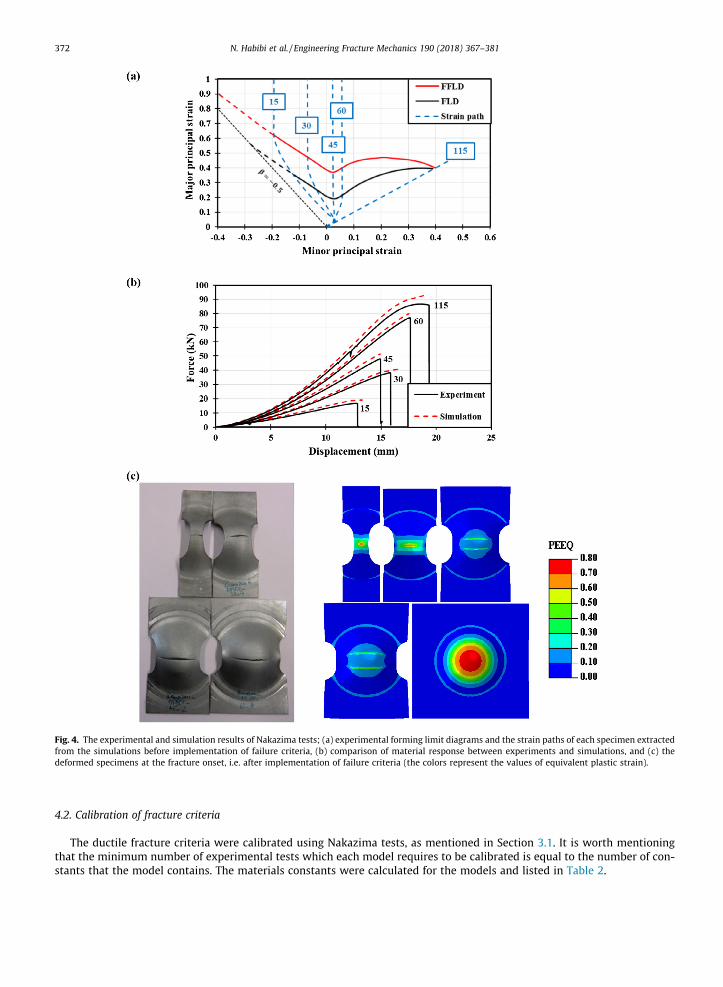
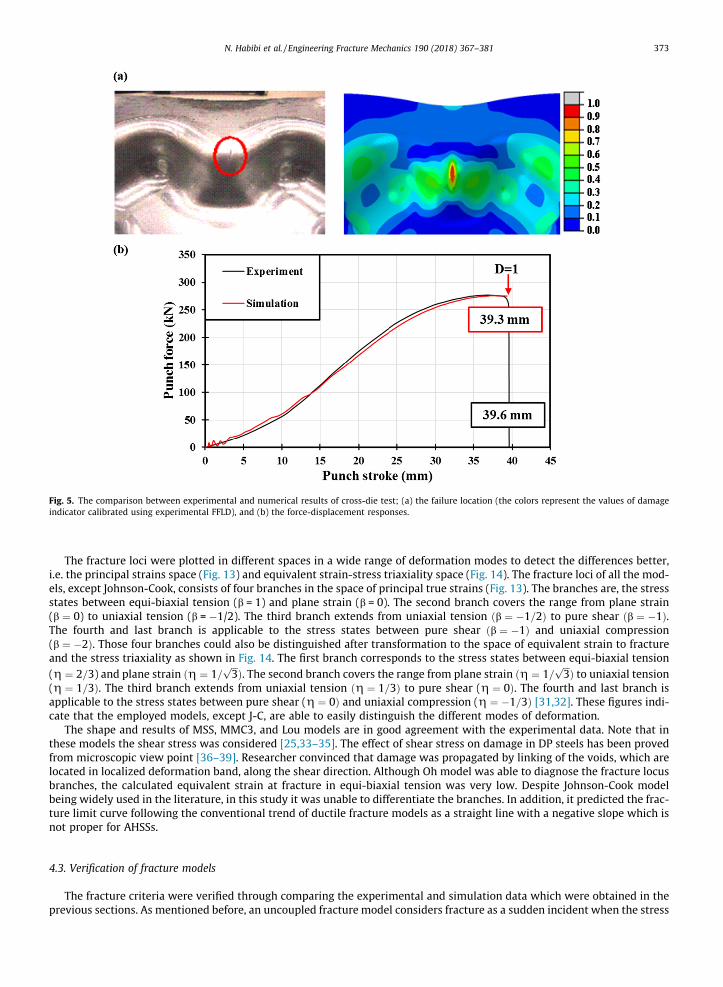
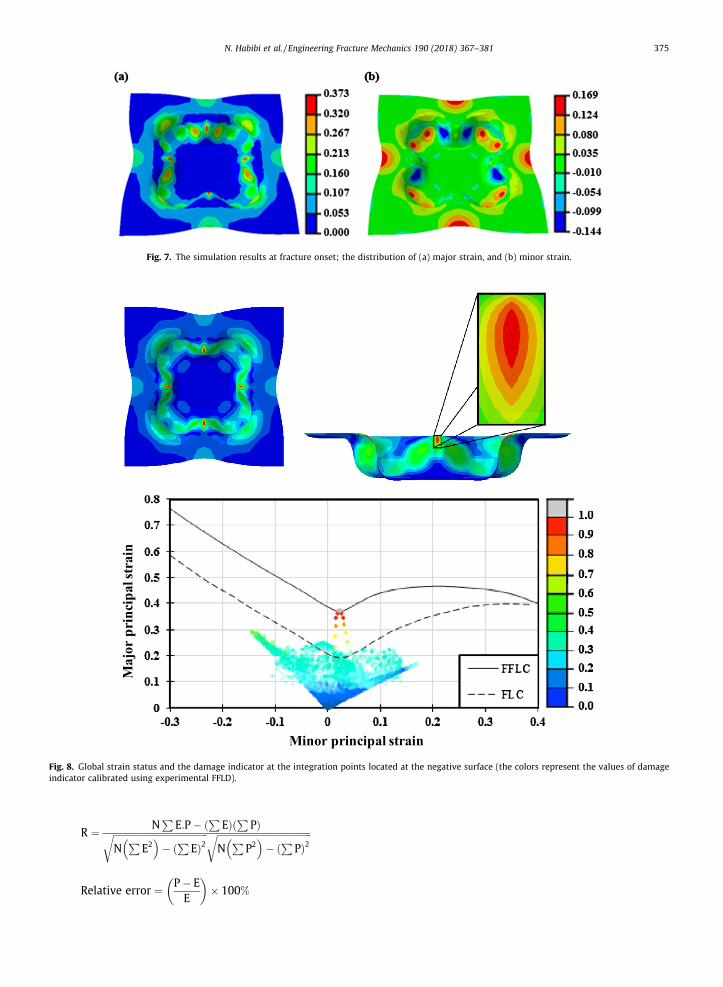
Fig. 5 shows the results of cross-die test. The fracture location and the force-displacement response were predicted pre-cisely. The values and distribution of major and minor strains were measured experimentally (Fig. 6) using PHASTTM equip-ment, and numerically (Fig. 7). The negligible errors might have occurred in both the experimental and numericalapproaches. For instance, in FE simulations the parameters which are supposed to have minor effects on the final resultsare eliminated, such as temperature, adiabatic heating, and strain rate. In addition, in experiment, stopping the process atthe exact moment of the fracture onset is very difficult. However, the results of experiments and simulations are in goodagreement. Note that the fracture occurred at point 4.
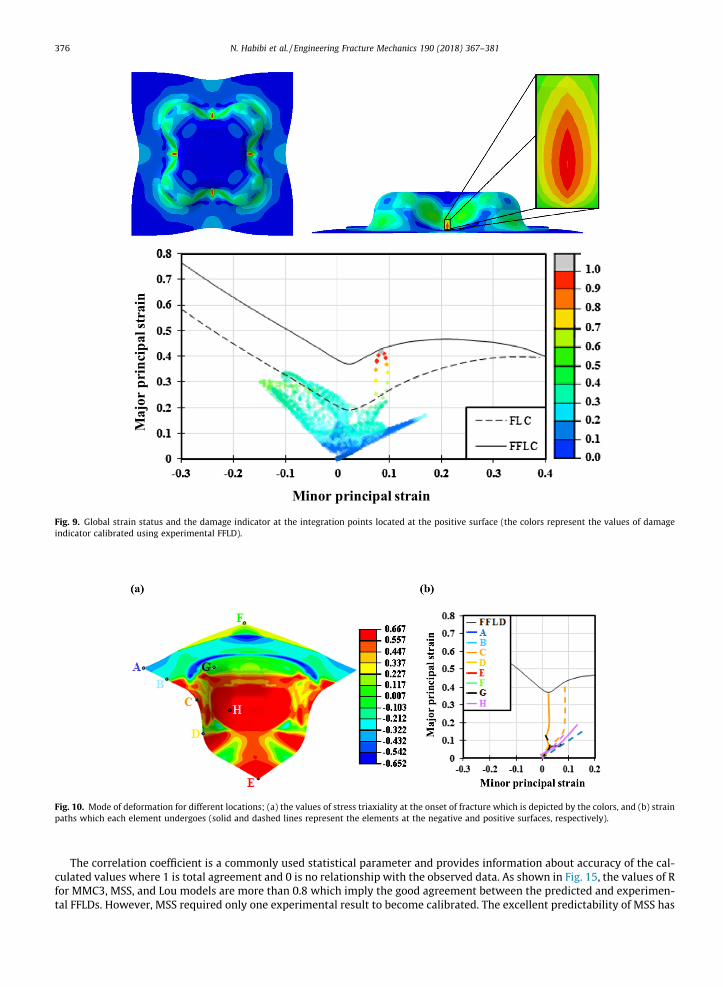
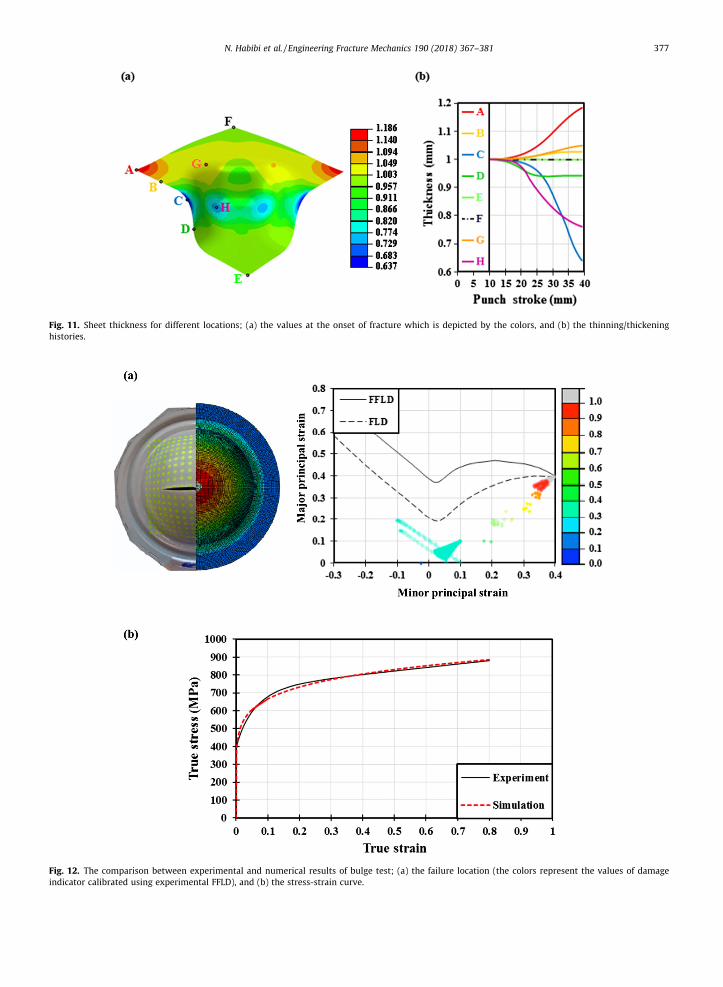
Furthermore, the bending effects result in some differences between integration points on the top or bottom surfaces. Thestrain states of the integration points on the inside (�) and outside (+) surfaces at the fracture moment are plotted inFigs. 8 and 9. These point out that the fracture triggered inside of the cross-die product because of the special shape of FFLD.As the cross-die test is complicated and each point of the sheet underwent different stress-strain states during punching, thehistories of straining and thinning/thickening were extracted from the simulations for eight different elements. Fig. 10 dis-plays the strain state histories of different elements which indicate that the damaged element experienced a purely planestrain path through the deformation and fracture occurred in a plane strain condition, as well. Evolution of thickness forthe elements is illustrated in Fig. 11. It can be seen that all the points on the flange experience continuous thickening whilethe elements on the side walls experience thinning, and the elements on the bottom like point E were only pushed. Also, thefigure indicates that the failure triggered where severe thinning occurs (point C).
Fig. 12 shows experimental and numerical data of the bulge test. Predicted location and strains of fracture as well asstress-strain curve are in a good agreement with the experimental results. As expected, the entire sheet which was imposedby the hydraulic pressure experienced roughly equi-biaxial tension.
Fig. 4. The experimental and simulation results of Nakazima tests; (a) experimental forming limit diagrams and the strain paths of each specimen extractedfrom the simulations before implementation of failure criteria, (b) comparison of material response between experiments and simulations, and (c) thedeformed specimens at the fracture onset, i.e. after implementation of failure criteria (the colors represent the values of equivalent plastic strain).
372 N. Habibi et al. / Engineering Fracture Mechanics 190 (2018) 367–381
4.2. Calibration of fracture criteria
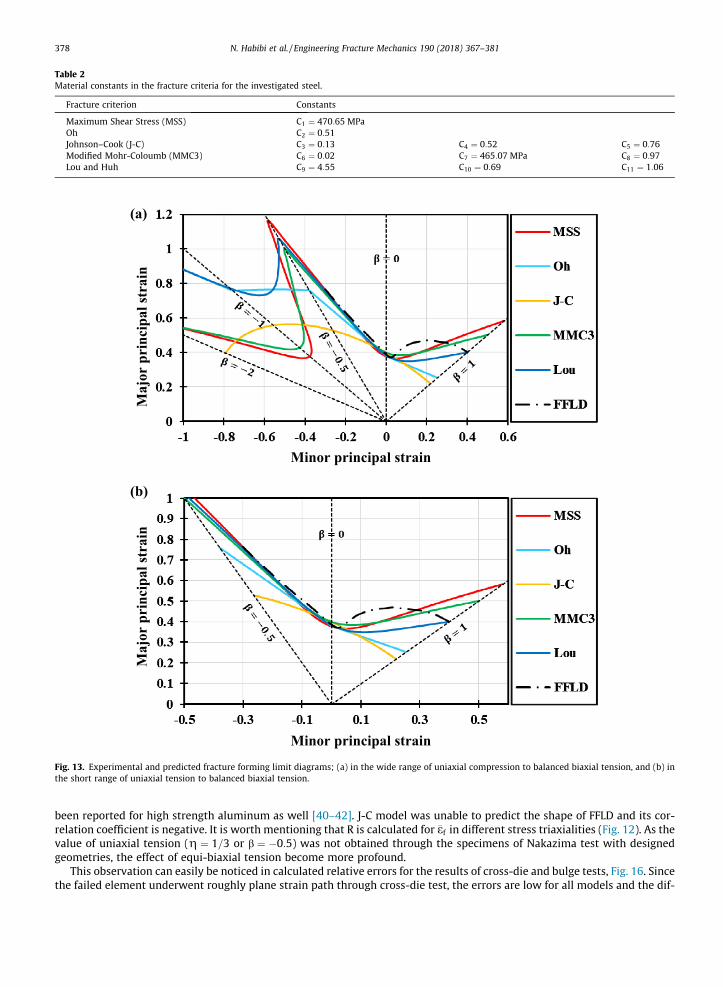
The ductile fracture criteria were calibrated using Nakazima tests, as mentioned in Section 3.1. It is worth mentioningthat the minimum number of experimental tests which each model requires to be calibrated is equal to the number of con-stants that the model contains. The materials constants were calculated for the models and listed in Table 2.
Fig. 5. The comparison between experimental and numerical results of cross-die test; (a) the failure location (the colors represent the values of damageindicator calibrated using experimental FFLD), and (b) the force-displacement responses.
N. Habibi et al. / Engineering Fracture Mechanics 190 (2018) 367–381 373
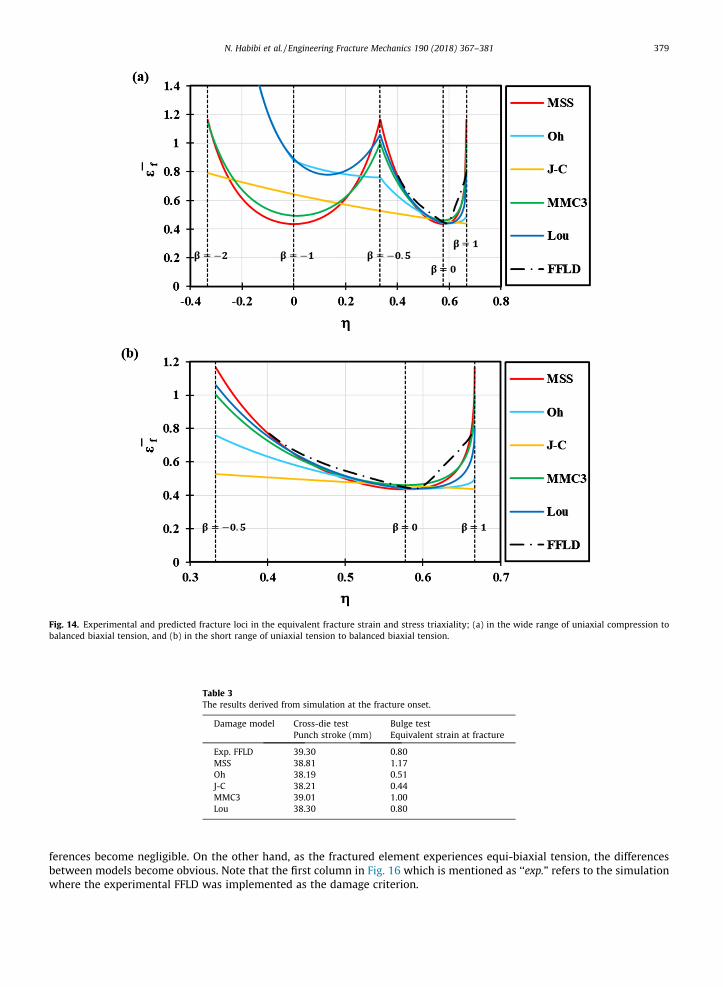
The fracture loci were plotted in different spaces in a wide range of deformation modes to detect the differences better,i.e. the principal strains space (Fig. 13) and equivalent strain-stress triaxiality space (Fig. 14). The fracture loci of all the mod-els, except Johnson-Cook, consists of four branches in the space of principal true strains (Fig. 13). The branches are, the stressstates between equi-biaxial tension (b = 1) and plane strain (b = 0). The second branch covers the range from plane strain(b ¼ 0) to uniaxial tension (b = �1/2). The third branch extends from uniaxial tension ðb ¼ �1=2Þ to pure shear ðb ¼ �1Þ.The fourth and last branch is applicable to the stress states between pure shear ðb ¼ �1Þ and uniaxial compression(b ¼ �2Þ. Those four branches could also be distinguished after transformation to the space of equivalent strain to fractureand the stress triaxiality as shown in Fig. 14. The first branch corresponds to the stress states between equi-biaxial tension(g ¼ 2=3) and plane strain ðg ¼ 1=
ffiffiffi3
pÞ. The second branch covers the range from plane strain ðg ¼ 1=
ffiffiffi3
pÞ to uniaxial tension
(g ¼ 1=3Þ. The third branch extends from uniaxial tension ðg ¼ 1=3Þ to pure shear (g ¼ 0Þ. The fourth and last branch isapplicable to the stress states between pure shear (g ¼ 0Þ and uniaxial compression (g ¼ �1=3Þ [31,32]. These figures indi-cate that the employed models, except J-C, are able to easily distinguish the different modes of deformation.
The shape and results of MSS, MMC3, and Lou models are in good agreement with the experimental data. Note that inthese models the shear stress was considered [25,33–35]. The effect of shear stress on damage in DP steels has been provedfrom microscopic view point [36–39]. Researcher convinced that damage was propagated by linking of the voids, which arelocated in localized deformation band, along the shear direction. Although Oh model was able to diagnose the fracture locusbranches, the calculated equivalent strain at fracture in equi-biaxial tension was very low. Despite Johnson-Cook modelbeing widely used in the literature, in this study it was unable to differentiate the branches. In addition, it predicted the frac-ture limit curve following the conventional trend of ductile fracture models as a straight line with a negative slope which isnot proper for AHSSs.
4.3. Verification of fracture models
The fracture criteria were verified through comparing the experimental and simulation data which were obtained in theprevious sections. As mentioned before, an uncoupled fracture model considers fracture as a sudden incident when the stress
Fig. 6. The experimental data at fracture moment which was measured using PHASTTM equipment; (a) Major strain distribution, (b) minor straindistribution, and (c) measured strains for the different locations.
374 N. Habibi et al. / Engineering Fracture Mechanics 190 (2018) 367–381
and strain states of the undamaged continuum reaches a critical level. Therefore, the deformation trend remained unchangedby implementation of uncoupled fracture models into the FE codes. However, each model predicted different moment for theonset of failure. Table 3 presents the fracture results for cross-die and bulge tests which were predicted by aforementionedfailure models. The predictability of the damage criteria is also quantified for equivalent strain-stress triaxiality spaces usingstandard statistical parameters such as correlation coefficient (R) and relative error which are expressed as:
Fig. 7. The simulation results at fracture onset; the distribution of (a) major strain, and (b) minor strain.
Maj
or p
rinc
ipal
stra
in
Minor principal strain
Fig. 8. Global strain status and the damage indicator at the integration points located at the negative surface (the colors represent the values of damageindicator calibrated using experimental FFLD).
N. Habibi et al. / Engineering Fracture Mechanics 190 (2018) 367–381 375
Fig. 9. Global strain status and the damage indicator at the integration points located at the positive surface (the colors represent the values of damageindicator calibrated using experimental FFLD).
Fig. 10. Mode of deformation for different locations; (a) the values of stress triaxiality at the onset of fracture which is depicted by the colors, and (b) strainpaths which each element undergoes (solid and dashed lines represent the elements at the negative and positive surfaces, respectively).
376 N. Habibi et al. / Engineering Fracture Mechanics 190 (2018) 367–381
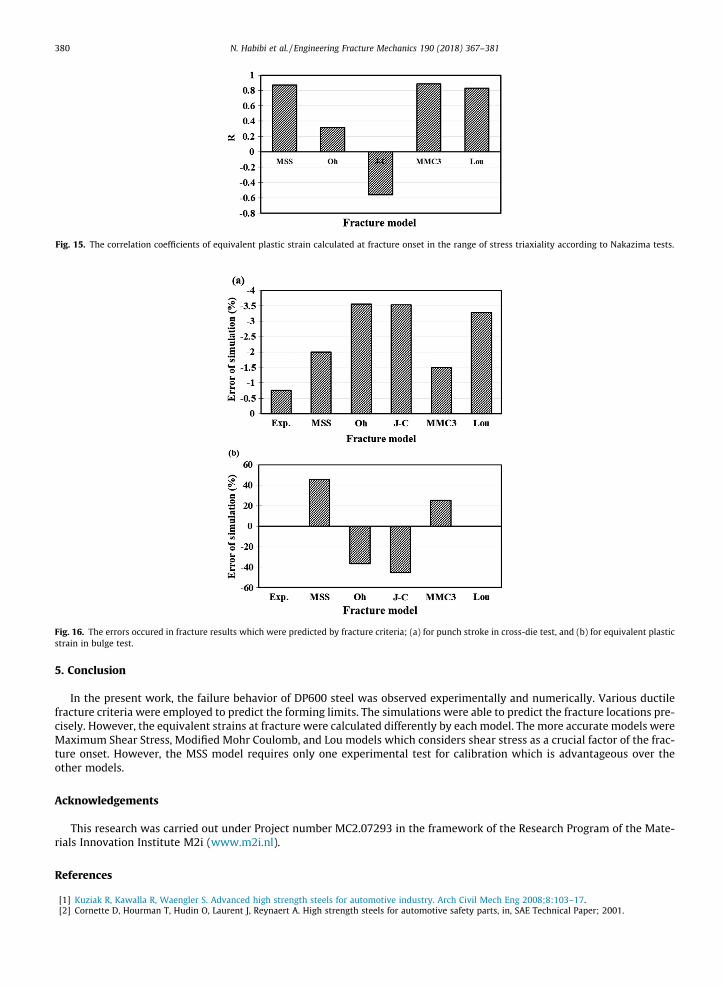
The correlation coefficient is a commonly used statistical parameter and provides information about accuracy of the cal-culated values where 1 is total agreement and 0 is no relationship with the observed data. As shown in Fig. 15, the values of Rfor MMC3, MSS, and Lou models are more than 0.8 which imply the good agreement between the predicted and experimen-tal FFLDs. However, MSS required only one experimental result to become calibrated. The excellent predictability of MSS has
Fig. 11. Sheet thickness for different locations; (a) the values at the onset of fracture which is depicted by the colors, and (b) the thinning/thickeninghistories.
Fig. 12. The comparison between experimental and numerical results of bulge test; (a) the failure location (the colors represent the values of damageindicator calibrated using experimental FFLD), and (b) the stress-strain curve.
N. Habibi et al. / Engineering Fracture Mechanics 190 (2018) 367–381 377
Table 2Material constants in the fracture criteria for the investigated steel.
Fig. 13. Experimental and predicted fracture forming limit diagrams; (a) in the wide range of uniaxial compression to balanced biaxial tension, and (b) inthe short range of uniaxial tension to balanced biaxial tension.
378 N. Habibi et al. / Engineering Fracture Mechanics 190 (2018) 367–381
been reported for high strength aluminum as well [40–42]. J-C model was unable to predict the shape of FFLD and its cor-relation coefficient is negative. It is worth mentioning that R is calculated for �ef in different stress triaxialities (Fig. 12). As thevalue of uniaxial tension (g ¼ 1=3 or b ¼ �0:5) was not obtained through the specimens of Nakazima test with designedgeometries, the effect of equi-biaxial tension become more profound.
This observation can easily be noticed in calculated relative errors for the results of cross-die and bulge tests, Fig. 16. Sincethe failed element underwent roughly plane strain path through cross-die test, the errors are low for all models and the dif-
Fig. 14. Experimental and predicted fracture loci in the equivalent fracture strain and stress triaxiality; (a) in the wide range of uniaxial compression tobalanced biaxial tension, and (b) in the short range of uniaxial tension to balanced biaxial tension.
Table 3The results derived from simulation at the fracture onset.
Damage model Cross-die test Bulge testPunch stroke (mm) Equivalent strain at fracture
N. Habibi et al. / Engineering Fracture Mechanics 190 (2018) 367–381 379
ferences become negligible. On the other hand, as the fractured element experiences equi-biaxial tension, the differencesbetween models become obvious. Note that the first column in Fig. 16 which is mentioned as ‘‘exp.” refers to the simulationwhere the experimental FFLD was implemented as the damage criterion.
Fig. 15. The correlation coefficients of equivalent plastic strain calculated at fracture onset in the range of stress triaxiality according to Nakazima tests.
Fig. 16. The errors occured in fracture results which were predicted by fracture criteria; (a) for punch stroke in cross-die test, and (b) for equivalent plasticstrain in bulge test.
380 N. Habibi et al. / Engineering Fracture Mechanics 190 (2018) 367–381
5. Conclusion
In the present work, the failure behavior of DP600 steel was observed experimentally and numerically. Various ductilefracture criteria were employed to predict the forming limits. The simulations were able to predict the fracture locations pre-cisely. However, the equivalent strains at fracture were calculated differently by each model. The more accurate models wereMaximum Shear Stress, Modified Mohr Coulomb, and Lou models which considers shear stress as a crucial factor of the frac-ture onset. However, the MSS model requires only one experimental test for calibration which is advantageous over theother models.
Acknowledgements
This research was carried out under Project number MC2.07293 in the framework of the Research Program of the Mate-rials Innovation Institute M2i (www.m2i.nl).
References
[1] Kuziak R, Kawalla R, Waengler S. Advanced high strength steels for automotive industry. Arch Civil Mech Eng 2008;8:103–17.[2] Cornette D, Hourman T, Hudin O, Laurent J, Reynaert A. High strength steels for automotive safety parts, in, SAE Technical Paper; 2001.
N. Habibi et al. / Engineering Fracture Mechanics 190 (2018) 367–381 381
[3] Ramazani A, Berme B, Prahl U. Steel and iron based alloys, transportation. Wiley-VCH; 2013. p. 5–48.[4] Zuidema BK, Denner SG, Engl B, Sperle J-O. New high strength steels applied to the body structure of ULSAB-AVC, in, SAE Technical Paper; 2001.[5] Speich G. Physical metallurgy of dual-phase steels. Fundam Dual-phase Steels 1981:3–45.[6] Bourell D, Rizk A. Influence of martensite transformation strain on the ductility of dual-phase steels. Acta Metall 1983;31:609–17.[7] Cai X-L, Garratt-Reed A, Owen W. The development of some dual-phase steel structures from different starting microstructures. Metall Trans A
1985;16:543–57.[8] Steinbrunner DL, Matlock D, Krauss G. Void formation during tensile testing of dual phase steels. Metall Trans A 1988;19:579–89.[9] Maire E, Bouaziz O, Di Michiel M, Verdu C. Initiation and growth of damage in a dual-phase steel observed by X-ray microtomography. Acta Mater
2008;56:4954–64.[10] Zhuang X, Xu C, Zhao Z. Experimental and numerical investigation of failure mode in geometrically imperfect DP590 steel. Sci China Technol Sci
2015;58:476–84.[11] Ahmad E, Manzoor T, Ali KL, Akhter J. Effect of microvoid formation on the tensile properties of dual-phase steel. J Mater Eng Perform 2000;9:306–10.[12] Ramazani A, Schwedt A, Aretz A, Prahl U. Failure initiation in dual-phase steel, in: Key Engineering Materials, Trans Tech Publ, 2014, pp. 67–71.[13] Sun X, Choi KS, Liu WN, Khaleel MA. Predicting failure modes and ductility of dual phase steels using plastic strain localization. Int J Plast
2009;25:1888–909.[14] Pfestdorf M. The need for multi-phase steel for the body-in-white of a passenger car. In: Great designs in steel seminar; 2005. p. 843–51.[15] Ramazani A, Kazemiabnavi S, Larson R. Quantification of ferrite-martensite interface in dual phase steels: A first-principles study. Acta Mater
2016;116:231–7.[16] Calcagnotto M, Adachi Y, Ponge D, Raabe D. Deformation and fracture mechanisms in fine-and ultrafine-grained ferrite/martensite dual-phase steels
and the effect of aging. Acta Mater 2011;59:658–70.[17] Ramazani A, Bruehl S, Gerber T, Bleck W, Prahl U. Quantification of bake hardening effect in DP600 and TRIP700 steels. Mater Des 2014;57:479–86.[18] Habibi N, Zarei-Hanzaki A, Abedi H-R. An investigation into the fracture mechanisms of twinning-induced-plasticity steel sheets under various strain
paths. J Mater Process Technol 2015;224:102–16.[19] Li H, Fu M, Lu J, Yang H. Ductile fracture: experiments and computations. Int J Plast 2011;27:147–80.[20] West O, Lian J, Münstermann S, Bleck W. Numerical determination of the damage parameters of a dual-phase sheet steel. ISIJ Int 2012;52:743–52.[21] Ramazani A, Abbasi M, Prahl U, Bleck W. Failure analysis of DP600 steel during the cross-die test. Comput Mater Sci 2012;64:101–5.[22] Niazi M, Wisselink H, Meinders T, Huetink H. Failure predictions for DP steel cross-die test using anisotropic damage. Int J Damage Mech 2011.
1056789511407646.[23] Carvalho-Resende T, Balan T, Bouvier S, Abed-Meraim F, Sablin S-S. Numerical investigation and experimental validation of a plasticity model for sheet
steel forming. Modell Simul Mater Sci Eng 2012;21:015008.[24] Bleck W, Blumbach M. Laser-aided flow curve determination in hydraulic bulging. Steel Res Int 2005;76:125–30.[25] Bai Y, Wierzbicki T. A comparative study of three groups of ductile fracture loci in the 3D space. Eng Fract Mech 2015;135:147–67.[26] Tresca H. Memoir on the flow of solid bodies under strong pressure. Comptes-rendus de l’académie des sciences 1864;59:754–8.[27] Oh S, Chen C, Kobayashi S. Ductile fracture in axisymmetric extrusion and drawing—part 2: workability in extrusion and drawing. J Eng Industry
1979;101:36–44.[28] Johnson GR, Cook WH. Fracture characteristics of three metals subjected to various strains, strain rates, temperatures and pressures. Eng Fract Mech
1985;21:31–48.[29] Bai Y, Wierzbicki T. Application of extended Mohr-Coulomb criterion to ductile fracture. Int J Fract 2010;161:1–20.[30] Lou Y, Huh H, Lim S, Pack K. New ductile fracture criterion for prediction of fracture forming limit diagrams of sheet metals. Int J Solids Struct
2012;49:3605–15.[31] Li Y, Luo M, Gerlach J, Wierzbicki T. Prediction of shear-induced fracture in sheet metal forming. J Mater Process Technol 2010;210:1858–69.[32] Dunand M, Mohr D. Effect of Lode parameter on plastic flow localization after proportional loading at low stress triaxialities. J Mech Phys Solids
2014;66:133–53.[33] Lou Y, Chen L, Clausmeyer T, Tekkaya AE, Yoon JW. Modeling of ductile fracture from shear to balanced biaxial tension for sheet metals. Int J Solids
Struct 2017.[34] Jia Y, Bai Y. Ductile fracture prediction for metal sheets using all-strain-based anisotropic eMMC model. Int J Mech Sci 2016;115:516–31.[35] Lou Y, Yoon JW. A shear ductile fracture criterion for metal forming. J Phys: Conf Ser 2016:032137. IOP Publishing.[36] de Geus T, Peerlings R, Geers M. Fracture in multi-phase materials: why some microstructures are more critical than others, arXiv preprint
arXiv:1603.08910, 2016.[37] Szewczyk A, Gurland J. A study of the deformation and fracture of a dual-phase steel. Metall Trans A 1982;13:1821–6.[38] Kim J-H, Serpantié A, Barlat F, Pierron F, Lee M-G. Characterization of the post-necking strain hardening behavior using the virtual fields method. Int J
Solids Struct 2013;50:3829–42.[39] Ramazani A, Abbasi M, Kazemiabnavi S, Schmauder S, Larson R, Prahl U. Development and application of a microstructure-based approach to
characterize and model failure initiation in DP steels using XFEM. Mater Sci Eng, A 2016;660:181–94.[40] Jain M, Allin J, Lloyd D. Fracture limit prediction using ductile fracture criteria for forming of an automotive aluminum sheet. Int J Mech Sci
1999;41:1273–88.[41] Zadpoor AA, Sinke J, Benedictus R. Formability prediction of high strength aluminum sheets. Int J Plast 2009;25:2269–97.[42] Mirnia MJ, Shamsari M. Numerical prediction of failure in single point incremental forming using a phenomenological ductile fracture criterion. J
![Deformation and Fracture Mechanics of Engineering Material [RichardW.hertzberg]](https://static.documents.pub/doc/80x56/5695d03c1a28ab9b029195f8/deformation-and-fracture-mechanics-of-engineering-material-richardwhertzberg.jpg)


![[D. Broek] Elementary Engineering Fracture Mechanics](https://static.documents.pub/doc/80x56/544fc455b1af9f07188b4595/d-broek-elementary-engineering-fracture-mechanics.jpg)


