116
Engineering Psychology Handbook AY 2012 – 2013 Department of Behavioral Sciences and Leadership United States Military Academy Editor: MAJ Louis P. Nemec

Engineering Psychology
Handbook
AY 2012 – 2013
Department of Behavioral Sciences and Leadership
United States Military Academy
Editor:
MAJ Louis P. Nemec

Christopher Douglas Kurkowski September 23, 1964 - February 26, 1988
Joseph Oliver Reed, III February 21, 1966 - April 14, 1996
The Kurkowski-Reed Excellence in Engineering Psychology Award was established in
2001. The award honors Christopher Kurkowski (USMA, Class of 1986) and Joseph Reed
(USMA, Class of 1989). Both were Engineering Psychology majors whose lives were cut short
in aviation accidents while on active duty. The award was made possible through the
generosity of the classes of 1986 and 1989 who deemed it a fitting tribute to the service and
sacrifice of their classmates.
The award goes to the graduating cadet with the highest grade point average in the
Engineering Psychology courses that are common to both the honors and major program. The
award winner receives a silver tray at a Department of Behavioral Sciences and Leadership
Ceremony during Graduation Week. In addition, the award winner’s name is engraved on a
plaque that resides in the department Awards Room.
2001 Honoree: Anastasia Piotrowski
2002 Honoree: Jennifer Smith
2003 Honoree: Joseph Mitek
2004 Honoree: Eric Wagoner
2005 Honoree: Ryan S. Labio
2006 Honoree: Brandon M. Kennedy
2007 Honoree: Kyle R. Storjohann
2008 Honoree: David Feltner
2009 Honoree: Nathaniel Drake
2010 Honoree: David G. Johnson
2011 Honoree: Cort Mukina
2012 Honoree: Matthew Ryan
Excellence in Engineering Psychology Award
Kurkowski – Reed
i
MADN-BSL August 2012
To Cadets Enrolled in the Engineering Psychology Program:
Congratulations on your selection of Engineering Psychology as your Major!
Engineering Psychology (or Human Factors) is a dynamic and challenging field, where
technological advances are being developed almost daily. To maintain its status as the
world's premier land power, the United States Army will require more sophisticated
technology. Human-centered design will be a crucial factor in the effectiveness of the
equipment soldiers use to fight and win America's wars. Engineering psychologists make
invaluable contributions in conducting theoretical and applied research, in designing
human-centered equipment and in introducing that equipment into an organization.
In many ways, the engineering psychologist is the interface between engineers
and psychologists. As such, you will be the one to ensure that humans and machines
interact well together. Just as you are responsible for human-machine interaction, you
often will serve the unique role of integrating the understanding of engineers,
psychologists, and management.
Throughout the next two years, you will grow from educated lay persons into
budding young scientists. You will also develop a frame of reference that will cause you
to view the world in a unique way - through the eyes of a human-centered scientist who is
also capable of developing and implementing practical solutions. Starting with
introductory research methods classes (PL386 and MA376) and a basic biopsychology
class (PL390), you will progress through increasingly more challenging courses until you
finish with an analysis and a design of an actual human-machine system. The
Engineering Psychology faculty will partner with you in this learning process. We are
truly here to make your transformation into an Engineering Psychologist a rewarding
experience. You can contact the Engineering Psychology Faculty and Staff at any time.
COL James Ness, Ph.D.
Engineering Psychology Program Director
DEPARTMENT OF THE ARMY UNITED STATES MILITARY ACADEMY
West Point, New York 10996

ii
Engineering Psychology Faculty and Staff
Thayer Office
Name Room Phone
COL James Ness (Program Director) 267D 0239
Dr. Michael Matthews 283 3696
MAJ Lou Nemec 267E 0066
Dr. Ericka Rovira 267B 5902
Ms. Vasiliki “Bess” Georgoulas 262 3598
The following exceptional soldiers and civilians had the privilege of working as
teammates in the Engineering Psychology program. Recent contact information is
provided for many.
MAJ Jennifer Bower [email protected]
COL Joseph P. DeAntona [email protected]
Dr. Gina Kolisinski
MAJ Silas Martinez
MAJ Mark McMillion
COL Douglas Mulbery
LTC(R) Timothy O’Neill [email protected]
COL(R) Larry Shattuck [email protected]
SPC Agent Joe Shevlin
MAJ Jared Sloan [email protected]
LTC Christopher Talcott
MAJ Stoney Trent
MAJ Carla Joyner
MAJ Joseph McLaine
Ms. Tish Torgerson [email protected]
MAJ Bart Wilkison [email protected]
LTC(R) James Merlo [email protected]
MAJ Dan Hall [email protected]

iii
Table of Contents
WHAT IS THE ENGINEERING PSYCHOLOGY HANDBOOK? .................................................1
ENGINEERING PSYCHOLOGY GENERAL POLICIES AND PROCEDURES ..............................2
Educational Philosophy ................................................................................................2
High Standards ......................................................................................................2
Availability ............................................................................................................2
Out of Classroom Meetings ...................................................................................2
Group/Individual Activities ...................................................................................2
Pre-looks ................................................................................................................3
Curriculum…………………………………………………………………………... 3
Course Content .............................................................................................................4
Lesson Outlines .....................................................................................................4
DSQs ......................................................................................................................5
WPRs .....................................................................................................................5
Term End Examination ..........................................................................................5
Written and Oral Projects ....................................................................................5
Documentation ..............................................................................................................6
Feedback .......................................................................................................................7
Institutional Research ...................................................................................................7
Statistical Packages .......................................................................................................7
RESEARCH REPORTS AND THE PHILOSOPHY OF SCIENCE .................................................8
APA FORMAT ......................................................................................................................8
USMA Title Page .........................................................................................................9
APA-Style Title Page .................................................................................................10
Abstract .......................................................................................................................11
Introduction .................................................................................................................12
Method ........................................................................................................................13
Participants .........................................................................................................13
Apparatus ............................................................................................................14
Procedure ............................................................................................................15
Results.........................................................................................................................15
Discussion ...................................................................................................................19
Notes ...........................................................................................................................20
References ...................................................................................................................21
Appendices .................................................................................................................22
Tables ..........................................................................................................................22
Figures ........................................................................................................................23
General Format Tips ...................................................................................................27
Fonts ....................................................................................................................27
Section Titles and Headings ................................................................................27
In-Text Citation ...................................................................................................27
Multiple Experiments .................................................................................................28
EVALUATION OF WRITTEN AND ORAL REPORTS .............................................................29

iv
Evaluation Criteria ......................................................................................................29
General Standards ...............................................................................................29
Written and Oral Evaluation Criteria .................................................................30
Critical Evaluation of Research Articles .............................................................30
APPENDIX A (BLOOM'S TAXONOMY) ...........................................................................31
APPENDIX B (RESEARCH FORMS AND INSTRUCTIONS) ...............................................37
APPENDIX C (WRITTEN REPORT EVALUATION CRITERIA) ........................................56
APPENDIX D (ORAL REPORT EVALUATION CRITERIA) ..............................................60
APPENDIX E (QUESTIONS FOR EVALUATION OF RESEARCH ARTICES) ......................64
APPENDIX F (SYMBOLS, CONVENTIONS, AND BUZZWORDS) .......................................68
APPENDIX G (COMMON NOMENCLATURE) ..................................................................78
APPENDIX H (COMMON CADET ERRORS) ....................................................................84
APPENDIX I (SAMPLE APA-Style Paper)………….…………….…………….……88

1
Engineering PsychologyHandbook
What is the Engineering Psychology Handbook? As you should know by now, the Engineering Psychology curriculum is unique
among academic fields at West Point because of its interdisciplinary and integrated
electives. All cadets take the same electives in the same sequence. This design allows
maximum integration among courses and eliminates the “dump” mentality. You can’t
afford to forget what you’ve learned in previous Engineering Psychology courses because
material in PL386 (Experimental Psychology), for example, is used in all other
Engineering Psychology courses. Likewise, knowledge of the anatomical and
physiological characteristics of the eye, mastered in PL390 (Biopsychology), is needed to
understand visual perception in PL391 (Sensation & Perception) and cognitive processes
in PL392 (Cognitive Psychology).
Accordingly, uniform standards for work in all Engineering Psychology courses
exist. For example, the written report is the fundamental exchange medium between
instructor and cadet. During your first semester in Engineering Psychology, you will
learn how to write a report (in PL386). Later, you will use that knowledge to compose
reports for other courses. Regardless of the course, your Engineering Psychology
instructors will use the same criteria to evaluate your work - the criteria contained in this
Handbook. Therefore, a thorough understanding of what's contained in this Handbook
will not only reduce your workload, but quite probably will result in a higher grade. It
has been developed to complement, clarify, and tailor the material found in both the
Little, Brown Handbook and the Dean’s Documentation of Academic Work (2010).
Keep it for the rest of your time at West Point and refer to it often.
(Return to Table of Contents)

2
Engineering Psychology General Policies and Procedures
Throughout the Engineering Psychology curriculum, we have standardized
several academic policies designed to enhance your learning and reduce potential
confusion that might exist among the courses. The following is a list of the policies and
procedures that are standard to all Engineering Psychology courses.
Educational Philosophy
The Engineering Psychology faculty work to create a cooperative learning
environment. Though all of us have advanced degrees in some aspect of Engineering
Psychology, we do not pretend to know all the answers. Rather than remaining aloof and
placing the burden on you to extract the right information from us, we prefer to come
along side you, to partner with you as we both gain more knowledge and experience in
this exciting discipline. You are the apprentices and we are the journeymen who will
guide you. Other characteristics of our educational philosophy include:
High Standards
We set the bar high. But, we have found that not only do cadets meet the
standards, they enjoy being challenged to reach their full potential. Your success to date
at the Academy is because you have high standards; we plan to capitalize on this fact.
Availability
We will make ourselves available to you as much as we possibly can - day or
night. We are here to teach you and we are committed to your success. With that said,
however, you should realize that we have a lot of demands on our time. You can increase
the likelihood that we will be available to meet with you if you schedule a meeting in
advance rather than just dropping by our offices. Not only does scheduling a meeting
with us ensure our availability, it demonstrates courtesy.
Out of Classroom Meetings
Most courses in the Engineering Psychology program include a large project.
Although we will provide you with detailed criteria of our expectations, you will find it
necessary to meet with us outside of the classroom. We stand ready to assist you, to send
you down the right paths, and to pull you back when you begin to wander down the
wrong ones. But it's up to you to come to us. Coming to see us early and often will
maximize your learning and ensure a better grade.
Group/Individual Activities
Throughout the Engineering Psychology curriculum you will engage in both
individual activities and group activities. Individual work gives us the ability to develop
and assess your particular knowledge, skills, and abilities. Group work is typically done
for several reasons. First, the scope of the project is too large for any one cadet to
reasonably complete given the time limits of a semester. Second, since most real work is
done as part of a team, this experience provides you the opportunity to work

3
cooperatively as you will in the Army. Third, the group process gives you insight into
different viewpoints and develops your ability to “sell” your point of view.
Group activities are meant to be synergistic. That is, we expect the outcome of
your group work to be greater than the sum of the members’ individual labors. A group
project does not mean that one cadet works on the introduction of a report, another works
on the method section, another works on the results section, and at the end the individual
work is cut and pasted together. A group project does mean that all cadets in the group
are intellectually engaged in all aspects of the project.
Specific courses within the Engineering Psychology program may or may not
provide cadets the opportunity to formally evaluate group members' contributions to a
project. Whether or not a formal process exists, we encourage you to talk to us whenever
there is a significant disparity in the contributions of group members and you have not
been able to resolve the problem amongst yourselves. If problems do exist, try to work
them out early. If you can't resolve them, notify your instructor. Waiting until just
before a project is due to raise a problem diminishes our ability to intervene.
Pre-looks
All Engineering Psychology instructors encourage pre-looks of your written
submissions. It has been our experience that cadets can raise their score by at least a full
letter grade when they submit their paper for a pre-look. A lot of learning occurs when
you review the comments made by your instructor and modify your paper accordingly.
Pre-looks should be submitted the lesson before the assignment is due (i.e., not less than
48 hours). We will review, make comments, and return it to you at least the day before
the requirement is due. (Return to Table of Contents)
Curriculum
The Engineering Psychology curriculum is highly integrated and cumulative.
That is, the courses build on each other, and success in higher level courses depends on
learning the material presented in lower level courses. For example, cadets learn about
the structure and function of the nervous system in PL390 (Biological Psychology) in the
Fall semester of the Cow year. This knowledge is needed to understand the material
covered in PL391 (Sensation, Perception, and Psychophysics) and PL392 (Cognitive
Psychology) taken in the Spring semester of the Cow year. In turn, the material covered
during the Cow year serves as the basis for understanding theory and application covered
in Firstie year courses, such as PL475 (Human Computer Interaction) and PL485 (Human
Factors Engineering).
Engineering Psychology is an experimental/scientific discipline. As such, it requires
mastery of statistics and research design. MA376 (Applied Probability and Statistics)
and PL386 (Experimental Psychology), taken during the fall semester of the Cow year,
provide the research, design, and statistical skills required in all other Engineering
Psychology courses. These skills are best learned and sharpened by frequent application
to real experimental questions. In your four semesters in the Engineering Psychology
major, you will design and conduct several experiments, analyze data using appropriate
statistical procedures, write scientific research reports to document your research, and

4
orally present your results to your peers and faculty. You may even have a chance to
present results of your experiments at a national conference and/or publish them in a
scholarly journal. During this past academic year, 2011-2012, cadets presented papers at
the Army Research Laboratory Conference in Atlantic City, NJ in November 2011. An
Engineering Psychology major typically takes the following sequence of courses
(students that desire and meet entry requirements to participate in the Honors Program
take the additional two electives during the Firstie year.)
Table 1
Typical Engineering Psychology Course Schedule
Fall, 2nd Class Year Spring, 2nd Class Year Fall, 1st Class Year Spring, 1st Class Year
PL390, Biological
Psychology
PL391, Sensation,
Perception, and
Psychophysics
PL475, Human
Computer Interaction
PL488E, Colloquium in
Engineering Psychology
MA376, Applied
Probability and
Statistics
PL392, Cognitive
Psychology
PL485, Human Factors
Engineering
PL490, Engineering
Psychology Design &
Application
PL386, Experimental
Psychology
PL394, Anthropometrics
and Biomechanics
Elective (Honors only) Elective (Honors only)
(Return to Table of Contents)
Course Content
Engineering Psychology courses typically provide a brief history of the discipline,
followed by simple facts and major theories that cadets will integrate and use in their
final course project. Each lesson will list one or more Lesson Objectives (LOs) and
several Performance Objectives (POs). The Performance Objectives (POs) indicate the
information you should master prior to class. In class, your instructor will assist you in
achieving the LOs. Most courses (PL488E and PL 490 are the exception) consist of both
subjective and objective testing methods that include Daily Study Questions (DSQs),
Written Partial Reviews (WPRs), written and oral projects, and a Term End Examination
(TEE).
Lesson Outlines
All courses will have lesson outlines. The lesson outlines are found in the course
guide and describe what is expected of cadets for every class period. Generally, each
lesson will be comprised of a study assignment, Lesson Objective(s), Performance
Objectives, and special instructions, if required. All Lesson and Performance Objectives
follow Bloom’s taxonomy (Appendix A). Bloom's taxonomy is a list of key words and
their definitions that describe increasingly more sophisticated levels of understanding.
You should pay attention to the words from Bloom's taxonomy that are used in the
Lesson Outlines (usually bolded, underlined, italicized, or some combination of all three)
because they determine the cognitive complexity of the questions we will ask on WPRs.
For example, if a PO uses "Define," we will ask you to give the meaning of a term;
however, if the PO uses "Apply," we will expect you to use a theory to solve a problem.

5
Taxonomy terms that specify a particular level of understanding assume that you are able
to answer questions at that level and all levels of lesser sophistication.
DSQs
Toward the beginning of any given class meeting your instructors may test your
preparedness for class using a Daily Study Question (DSQ). The total number of DSQs
will vary between courses, but each will test a PO required for that lesson. You can
ensure success on DSQs by preparing for class and having all POs answered prior to
class.
WPRs
WPRs normally include both subjective and objective portions. Objective
questions may include multiple choice, matching, or fill in the blank that cover the POs
for that testing cycle. The subjective portion will typically be in the form of short
answer/essay questions and will generally address the lesson objectives covered during
that testing period. Since no test is perfect, you may contest your answers that were
marked wrong by providing your instructor with a written statement explaining why your
response is correct. This approach affords us the opportunity to see where the question
might be ambiguous or where your reasoning may be flawed. All contested answers will
be given to your instructor by the beginning of next lesson in written format. No group
responses will be accepted; each cadet must submit his/her own written rebuttal. The
awarding of points is at the sole discretion of the instructor.
Term End Examination
Each TEE will also consist of subjective and objective portions. The objective
portion will focus on PO level of knowledge, whereas the subjective questions will
address integrative LO knowledge. All TEEs will be a least 20% of the course grade.
Although most engineering psychology courses have TEEs, there are some exceptions
(such as the valedictory courses, PL488E and PL490 which do not have TEEs). You
should consult individual course guides to determine if a particular course has a TEE or
not.
Written and Oral Projects
Each course will have written and oral projects. Oral presentations will be
accompanied by a top quality PowerPoint computer-generated slide presentation. All
written projects will be turned in to the section marcher at the beginning of the period
the requirement is due. You are not required to use a 'brown bomber' when submitting
your written work. Other guidelines for both oral and written work follow later in this
Handbook. Due to course differences, any deviations from those noted in the Handbook
will be specifically explained by your instructor for that course.
(Return to Table of Contents)

6
Documentation
Good scholarship is not synonymous with originality. Good scholarship happens
when you dive into the literature, properly interpret and synthesize the relevant ideas of
others, and use what you've learned to guide your research, to interpret your results, or to
form new knowledge. Building on the intellectual foundation laid by others adds
credibility to your work. Good scholarship also means proper documentation.
The Dean's Documentation of Academic Work (2011) for AY 2012 - 2013
dictates that The Little, Brown Handbook (Fowler, Aaron, & Brittenham, 1998) will be
used as the reference for proper documentation. The Little, Brown Handbook (LBH)
describes four documentation styles and the Dean's pamphlet leaves it to the discretion of
academic department heads to select the style most appropriate for their disciplines. The
department head of BS&L has selected the American Psychological Association (APA)
style of documentation. Accordingly, papers you submit for grade in any Engineering
Psychology course will follow USMA and APA documentation policies. This includes
Parenthetical references (author's last name(s), year of publication) to
acknowledge sources cited in the text of your paper.
Endnotes (not footnotes) to document collaboration.
A reference list (not a bibliography), including entries for both sources cited
in the text and the collaboration activities listed in the endnotes.
We recognize that documentation can be a source of confusion and frustration for
cadets. However, proper documentation is essential if you are to acknowledge the
contributions that others have made to your work. The Dean's Documentation of
Academic Work (2011), The Little, Brown Handbook and especially the sixth edition of
the APA Publication Manual should answer most of your questions about format and
documentation. This Engineering Psychology Handbook is intended be a handy, easy to
use source that synthesizes the requirements from all three sources to help you generate
well written, documented, and formatted manuscripts. Later in this Handbook, you will
find a sample research paper (see Appendix I) that can be used as a template for
preparing your papers. Since all the engineering psychology instructors evaluate your
paper for format, it is best to abide by the guidelines provided, but if a situation is ever
unclear, here are a few general principles that should be useful:
Principle 1. When in doubt, document. It's much better to document a source
when it is not necessary than to not document a source when you
should have done so.
Principle 2. Provide us sufficient information in your reference so that we can
find the source on our own if we want to learn more.
Principle 3. If Principles 1 or 2 do not help to clarify things, ask your
Engineering Psychology instructor!
(Return to Table of Contents)

7
Feedback
In an effort to continually improve the Engineering Psychology Program, we
regularly solicit feedback from you throughout the course in the form of mid-course
critiques (usually a one-question feedback sheet at the end of a lesson). Should you
consider something to be effective or ineffective, please discuss it with us then and/or at
any time. Pay particular attention to techniques that assist you in comprehending and
integrating material within and between courses. We care very deeply about providing
you the best academic and military mentorship we can – and the more feedback we
receive the better we will serve you and the Army.
(Return to Table of Contents)
Institutional Research
Many of the courses in Engineering Psychology will require you to perform a
research project. This research will require you to have approval of the academy’s
Institutional Review Board (IRB) prior to gathering data. Although approval is usually
given, certain rules and procedures must be followed to obtain that approval. These
procedures, instructions, and necessary forms can be accessed via sharepoint. Your
instructor will provide you with the link. Appendix B also provides you with the same
information. You may choose to download the forms onto your computer and type in the
required information or you may reproduce them from this document and type in the
required information. Do not turn in the forms with handwritten information as this
portrays an unprofessional image and may discredit your project.
(Return to Table of Contents)
Statistical Packages
The SPSS statistical package is suitable for your data analysis. SPSS software is
available on the Engineering Psychology Laboratory computers and can be used when the
lab is open. At other times, contact any Engineering Psychology instructor or Ms.
Vasiliki Georgoulas to get access to lab facilities. (Return to Table of Contents)

8
Research Reports and the Philosophy of Science
When you originally learned to write, you learned the expository style of writing.
The expository method requires one to state a thesis, then attempt to prove that thesis
through argument, based more or less on the dialectic style of the Greek philosophers.
For a scientist, this style is fatally flawed and should not be used. Scientists are skeptics.
We are not concerned with proving theories. Instead, we seek to describe reality and
discover truth. The expository style might cause scientists to lend a blind eye to contrary
explanations for their test results. Additionally, in most cases, one can never prove a
theory anyway. To prove it, one would have to use a 100% sample (that is, test the
population of all cases). In most cases, testing the entire population is not practical. Still,
theories can be empirically tested through scientific experimentation and observation; a
theory can be disproved.
Consequently, we use the scientific, or hypothetico-deductive method, which
reverses the expository approach and tries to disprove our theory. This approach means,
in practical experimental terms that we attempt to reject a hypothesis derived from the
theory. Failure to accomplish this, “rejecting the null hypothesis,” is usually defined as a
“success.” Accordingly, the format for research reports will reflect this objective,
skeptical bias. (Return to Table of Contents)
APA Format
This section describes how to construct your research paper. Although BS&L and
the Engineering Psychology program have adopted the APA style for written
submissions, there are USMA-specific requirements described in the Dean's
Documentation of Academic Work (2010) that must be blended into the APA format.
Since you will have to use this blended format for virtually every course in the
Engineering Psychology program it is worth your time and energy to familiarize yourself
with the information contained herein. The 6th
edition of the APA Publication Manual is
the standard for all Engineering Psychology courses, and all research reports will contain
the following:
USMA title page (from the Dean's Documentation of Academic Work pamphlet)
APA-style title page (as described in the APA Publication Manual, 6th
Edition)
Abstract
Introduction (including problem statement, literature review, hypothesis)
Method (including Participants, Apparatus, and Procedure sub-sections)
Results
Discussion
Notes
References
Appendices
Tables and Figures
(Return to Table of Contents)

9
USMA Title Page
UNITED STATES MILITARY ACADEMY
ORDERING OF INFORMATION AND
EFFECTS ON THE CONCLUSION DRAWN
PL386: EXPERIMENTAL PSYCHOLOGY
SECTION 1H
COL LAWRENCE SHATTUCK
BY
CADET JILL ERWAY '05, CO D3
WEST POINT, NEW YORK
11 DECEMBER 2002
Title page is
double-spaced
All text on title
page is capitalized

10
The title of your research report should be short (no more than 10-12 words),
succinct, and describe your experiment accurately. It should allude to both the variables
and the data collection methods. Avoid cute titles. A title should inform, not amuse. If
you want to have an offbeat title, be certain it’s for a reason that makes scientific sense.
If you are reporting on the influence of stimulus brightness on critical flicker fusion,
don’t choose a title like “Visual Perception” or “Flicker Fusion.” These titles may
suggest you are testing everything related to visual perception (quite a large experiment!)
or whether flicker fusion exists (it does). Instead, a title like “The Influence of Stimulus
Brightness on Critical Flicker Fusion” will do nicely.
(Return to Table of Contents)
APA-Style Title Page
Running head: ESTABLISHING WORKLOAD 2
Establishing Workload Acceptability:
An Evaluation of a Proposed M-1 Tank Console Redesign
Justin D. Rueb, Lawrence G. Shattuck, and Douglas S. Mulbury
United States Military Academy
Author Note
Justin D. Rueb, Lawrence G. Shattuck, and Douglas S. Mulbury, Department of
Behavioral Sciences and Leadership, U.S. Military Academy.
Correspondence concerning this article should be addressed to Lawrence G.
Shattuck, Department of Behavioral Sciences & Leadership, Building 601, Room 281,
Cullum Road, U.S. Military Academy, West Point, NY 10096. E-mail:
(Return to Table of Contents)
Include a page header at the top of every page. Type the running head flush left. And insert the page number flush right. The running
head is an abbreviated title, all capitalized, not to exceed 50 characters, including spaces. NOTE: on the title page, your page header should include the words “Running head:” (and note that the 'h' in Running head is not capitalized). Pages after the title page should
have only the running head text.
The Author Note identifies the departmental
affiliations at the time of the study, and includes a
complete mailing address for correspondence.
Center the title in the upper
half of the page; typed in upper and lower case and double-
spaced.
Name(s) of authors are typed on the
double-spaced line below title. The
affiliation of the author(s) appears
on the double-spaced line below the
name(s)
All font is 12
point and Times
New Roman

11
Abstract
The abstract is a summary of the research, not to exceed 960 characters
(approximately 120 words), including punctuation and spaces. The abstract is written on
a page of its own with the word “Abstract” centered on the page and the text in a single
block paragraph without a tab (see example on next page). The purpose of the abstract is
to inform the reader about the experiment and allow them to decide whether or not to
read the whole article.
To accomplish this abstracts usually:
1. Start with a sentence or two of background to introduce the problem, establish
interest, and identify the applicable psychological theory under study.
2. Next, they succinctly summarize the experimental task/method and the
experimental design, to include identifying the independent and dependent
variables.
3. Then, they concisely summarize the results.
4. Finally, they cite the most important theoretical and/or practical implications of
the findings.
Common mistakes include the following:
Failure to adequately accomplish directives 1 -4 above.
Use of the future tense. The experiment is over and the use of past tense is
appropriate. The only exception is for a research proposal.
Use of We & I. The words “we” or “I” should not be used in the Abstract.
Inclusion of excess detail. Precise procedures/apparatus are best confined to the
body of the text. Do not state your hypothesis or cite exact statistics.
ESTABLISHING WORKLOAD 3
Abstract
In recent years, workload assessment has played an increased role in system design
and evaluation. However, one concern in workload assessment has been the
identification of “How much workload is too much?” This . . .
"Abstract" is centered on the first line
below the header.
1" left margin
1" right
margin
No
indentation Double space
Text of abstract (and throughout the manuscript) is double-
spaced. The abstract should not exceed 960 characters or
about 120 words.

12
Introduction
Begin the introduction on page 4 (the first 2 pages are the title pages, the third is
the abstract). Begin the body of the report with the title centered. It should in
upper/lower case with the first letter of the title and key words capitalized in the
conventional way. Like the text, the title should be double-spaced. Next, indent the first
paragraph and begin the text of the introduction (as shown on the next page). The
purpose of the introduction is to grab the reader and guide them to understand that your
research is a justified, well conceived, next logical step in the investigation of your area
of engineering psychology.
To accomplish this introduction usually:
1. Provide a brief, but broad, background of the issue/theory under study. In
doing so you must establish the importance of the issue and grab the interest
of the reader.
2. Second (or third), state the purpose of your current research (e.g. identify what
questions remain and what specific research question you investigated).
3. Third, (or second) summarize the pertinent literature that serves as a
background (and justification) for your own research, your design, and your
own hypothesis. There are three main types of literature that are pertinent and
should be cited - each source you cite should inform your own research in one
of three ways:
a. Psychological Theory- Most importantly, you should cite sources
that describe the psychological theories that are relevant to your
research question (or that are being investigated by your research).
b. Domain- You should cite sources that described the domain in
which you investigated your psychological research question (i.e.
if investigating decision making in a military setting you might cite
Army doctrine and/or field manuals).
c. Methodological- You should cite prior research describing
methodologies that other researchers have used to investigate this
or similar questions (or cite other literature that serves to justify
your choice of experimental task, your experimental design, your
variables, measures, etc.)
Note: Individual citations should be concise. Include only essential details to
understanding/supporting your own research. You may sometimes
elaborate more on major studies but otherwise, simply state what prior
researchers studied; what they found or learned; and how it informs your
research, your design, your methodology, or hypothesis.
4. Lastly, in well written introductions, all of the above should flow logically to
(and support) your hypothesis, which you should state at the end of the
introduction section.

13
Common mistakes include the following:
Failure to adequately accomplish directives 1-4 above.
Failure to construct a logical argument justifying you research and/or your
hypothesis.
Failure to transition well between citations of specific pieces of literature You must explain to the reader how and why the prior research in an area led you
to design and execute the current research in the manner you chose to do it.
ESTABLISHING WORKLOAD 4
Establishing Workload Acceptability: An Evaluation of
a Proposed M-1 Tank Console Redesign
Workload assessment has become a common part of the evaluation of
new or redesigned operator interfaces (Gopher & Donchin, 1986;
O’Donnell & Eggemeier, 1986). One reason workload assessment is an
important adjunct to simple performance measurement is that the human
operator is sometimes flexible enough to disguise the effects of excessively
demanding systems by expending . . .
(Return to Table of Contents)
Method
The method section will receive the closest scrutiny because scientists may want
to replicate your work or simply may look for alternative explanations for your results.
The Method section will have at least three sub-sections (Participants, Apparatus, and
Procedure):
1. Participants
The Participants section includes a succinct description of the relevant
characteristics of the sample group. How many, how old, from what population, and
method of selection are all typical questions that should be answered by this section. The
applicable characteristics and statistics may be presented in tables by experimental group
so that readers may evaluate for potential biases across experimental groups – or they
may be cited in the text as shown (on the next page).
1/2" from top of page
1" left
margin 1" right
margin
Indent 5 spaces
Title is centered, double-spaced, and one double-spaced
line below the right margin header
Bottom margin is
1"

14
For example:
Twenty male Sprague-Dawley rats twelve-weeks old were used in this
experiment. They varied in weight from 282 to 326 grams.
or
Eighteen undergraduate freshmen at the United States Military Academy,
ranging in age from 17 - 21, participated in this study. All were enrolled in a
General Psychology course and received credit for their participation. They
were screened for visual acuity (Snellen) and color vision (Dvorine
Pseudoisochromatic).
Ethics Statement. After describing the participants used in your experiment,
complete the Participants section with the statement:
“Participants were treated in accordance with ethical standards established by the
American Psychological Association. The research methods used in this experiment were
approved by the U.S. Military Academy Human Subjects Use Committee.”
Occasionally a variety of common terms are abbreviated - among them,
Participant(s) (P, Ps), Observer(s) (O, Os) and Experimenter (E). Generally, this
approach is used only when the frequency of the fully spelled word may begin to annoy
the reader. In any case, the first instance of an abbreviated term should always be spelled
out and then followed immediately by the abbreviation - United States Military Academy
(USMA).
Common mistakes include the following:
Failure to provide applicable demographics or characteristics of interest.
Failure to include the Ethics Statement.
Use of inappropriate terminology. Specifically (in the APA style) humans
who take part in research are referred to as "participants." Animals who
take part in research are referred to as "subjects."
2. Apparatus
This section provides sufficient detail to allow another researcher to replicate the
research with enough accuracy to avoid apparatus-related variance. However, extraneous
detail is not acceptable (i.e. you don’t need to specify that you used a “No. 2 pencil and 8
1/2" x 11" white bond paper” to record participant responses). Readers can still replicate
your study if they use a pen and some other type of paper. Yet, it is important and useful
to describe a computer in such detail that you give readers information about processing
speed, monitor size, resolution, and refresh rate since each of these may impact on the
presentation of stimuli. For describing visual displays, visual size must be specified in
degrees of visual angle. An official nomenclature for most common apparatus used in
our lab can be found in Appendix G.

15
3. Procedure
This section should be detailed enough for a reader familiar with the field to
replicate your experiment without calling you for clarification. If not previously covered
in the introduction, you should begin with:
a concise statement of the experimental design
a precise explanation of the operational definitions of the variables, and
a precise description of the experimental task and conditions
Otherwise, simply give a detailed description of how the data was collected (usually
recounting the experience of a single participant, in chronological order, from reception
to data collection, through release).
Note: A common stylistic error involves overuse of weak passive forms.
Inexperienced writers may fall to this habit because it “seems more scientific,” and it is
easy to do. For example: “All participants in the control group were administered the
sham treatment.” Passive sentences waste words and fail to communicate who did what.
Although, occasional passive voice in this section may be unavoidable, in general, you
should write in active voice. For example: “All participants in the control group received
the sham treatment.” A word of caution: Although you are allowed to use the first
person, most writers avoid its use because it detracts and makes the paper appear “folksy”
and less polished. If critical instructions are given to the participant by the experimenter,
include them verbatim (most likely, reference them in an Appendix). Do this only when
the wording of the instructions could be considered critical to the nature of the response.
(Return to Table of Contents)
Results
The purpose of the results section is to communicate what you measured (e.g. the
data), as well as the results of your statistical analysis. In general you will do this by
reporting two types of statistics (descriptive and inferential statistics). The descriptive
statistics will summarize and describe what you measured. The inferential statistics will
clarify if observed differences are ‘significant’ or not.
Begin the results section by stating what analysis you performed (e.g. “the
reaction times were subjected to a 2 way ANOVA procedure…”). Follow this by
presenting the descriptive statistics. This is often accomplished by simply referencing a
table and/or a figure depicting a straightforward recapitulation of the numerical results by
group (means, frequencies, standard deviations, etc.).
End with the inferential statistics. This information can also be included in a table
(as shown on the next page) but, for most experiments the significance of the results are
reported in text. For example, “Reaction times of fatigued pilots were longer than those
of rested pilots, F(2, 87) = 3.12, p = .045.”
Notice that the preceding example obeys a strict format for reporting these
statistical inferences. The guidelines for this format are found in the APA Publication
Manual, but the notation is generally formatted as follows:

16
Mean scores for Group 1 were higher than those of Group 2, t(129) = 3.86, p
= .032.
or
The group main effect was significant, F(2, 87) = 3.12, p = .045. However,
the time main effect was nonsignificant (p = .165).
or
Frequencies of positive response differed significantly across regiments,
2(4) = 3.86, p = .016
Common mistakes include the following:
Be sure to italicize test statistics (F and t), and also italicize "p".
Cite the actual p value: For example, p = .165; unless p < .01. In that case
simply cite it as p < .01.
The degrees of freedom for the test statistic follow the test statistic in
parentheses.
Do not be overly precise. If measuring how long it takes participants to read
several pages of text, then recording the times to the 2nd
decimal place (i.e.,
hundreds of a second) is not necessary. On the other hand, if measuring
response time to a simple stimulus presented on a computer, then precision to
the 2nd
decimal place might be appropriate.
Set alpha (, your acceptable level of risk) prior to analyzing your data. Most commonly, it will be set at .05, meaning that any inferential statistic
yielding a probability of a Type I error of .05 or less will be defined as
“statistically significant.”
If an ANOVA table is used to depict the results of your inferential
analysis, do it correctly (see below).
Table 3
An Example of an ANOVA Summary Table
____________________________________________________________________
Source SS df MS F p
Between 9352.3 4 2338.01 3.96 < .01
Within 237986.8 403 590.50
Total 247339.1 407
____________________________________________________________________
Assume your reader has a professional knowledge of statistics. Basic
assumptions, such as rejecting the null hypotheses, should not be reviewed. If
17
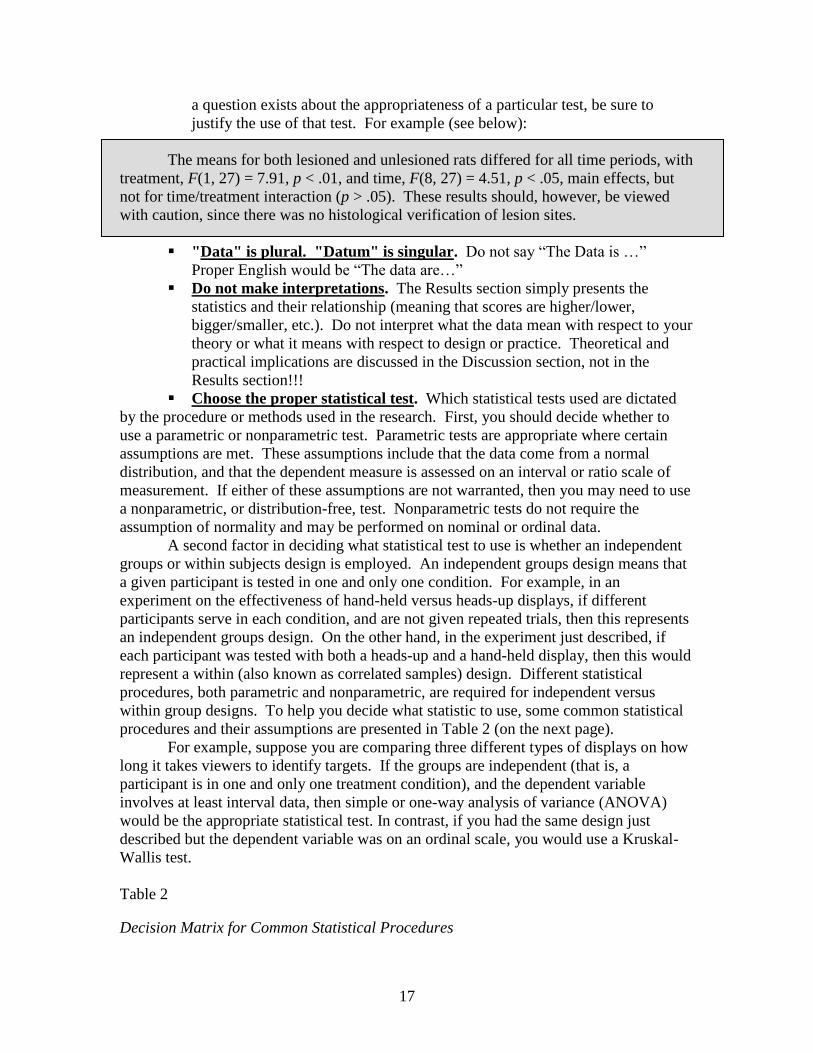
a question exists about the appropriateness of a particular test, be sure to
justify the use of that test. For example (see below):
The means for both lesioned and unlesioned rats differed for all time periods, with
treatment, F(1, 27) = 7.91, p < .01, and time, F(8, 27) = 4.51, p < .05, main effects, but
not for time/treatment interaction (p > .05). These results should, however, be viewed
with caution, since there was no histological verification of lesion sites.
"Data" is plural. "Datum" is singular. Do not say “The Data is …”
Proper English would be “The data are…”
Do not make interpretations. The Results section simply presents the
statistics and their relationship (meaning that scores are higher/lower,
bigger/smaller, etc.). Do not interpret what the data mean with respect to your
theory or what it means with respect to design or practice. Theoretical and
practical implications are discussed in the Discussion section, not in the
Results section!!!
Choose the proper statistical test. Which statistical tests used are dictated
by the procedure or methods used in the research. First, you should decide whether to
use a parametric or nonparametric test. Parametric tests are appropriate where certain
assumptions are met. These assumptions include that the data come from a normal
distribution, and that the dependent measure is assessed on an interval or ratio scale of
measurement. If either of these assumptions are not warranted, then you may need to use
a nonparametric, or distribution-free, test. Nonparametric tests do not require the
assumption of normality and may be performed on nominal or ordinal data.
A second factor in deciding what statistical test to use is whether an independent
groups or within subjects design is employed. An independent groups design means that
a given participant is tested in one and only one condition. For example, in an
experiment on the effectiveness of hand-held versus heads-up displays, if different
participants serve in each condition, and are not given repeated trials, then this represents
an independent groups design. On the other hand, in the experiment just described, if
each participant was tested with both a heads-up and a hand-held display, then this would
represent a within (also known as correlated samples) design. Different statistical
procedures, both parametric and nonparametric, are required for independent versus
within group designs. To help you decide what statistic to use, some common statistical
procedures and their assumptions are presented in Table 2 (on the next page).
For example, suppose you are comparing three different types of displays on how
long it takes viewers to identify targets. If the groups are independent (that is, a
participant is in one and only one treatment condition), and the dependent variable
involves at least interval data, then simple or one-way analysis of variance (ANOVA)
would be the appropriate statistical test. In contrast, if you had the same design just
described but the dependent variable was on an ordinal scale, you would use a Kruskal-
Wallis test.
Table 2
Decision Matrix for Common Statistical Procedures

18
Type of Sample Assumptions
Differences Between Groups
Two Independent Samples
t test Normality, Homogeneity, Interval
Mann-Whitney U test Ordinal
Two Correlated Samples
t test Normality, Interval
Wilcoxon test Ordinal
Multiple Correlated Samples
Repeated measures ANOVA Normality, Interval
Friedman two-way ANOVA Ordinal
Several Independent Samples
Simple ANOVA Normality, Homogeneity, Interval
Two-factor ANOVA Normality, Homogeneity, Interval
Kruskal-Wallis test Ordinal
Tests of Association
One Sample
Pearson product-moment Normality, Interval
correlation
Spearman rank-order
correlation Ordinal
Chi-square test for r x c tables Nominal
Two Independent Samples
Test of the difference between Normality, Interval
two Pearson correlations
(Return to Table of Contents)
19
Discussion
This section may be combined with the previous section if the discussion is brief
and does not require a lot of theoretical restatement. In that case, the section is called
Results and Discussion. Most important, do not simply and redundantly restate your
results. The purpose of the discussion section is to communicate the theoretical and
practical implications of the results, and point the way for future researchers to continue
this line of work. To accomplish this discussion sections usually:
1. Begin by addressing the hypothesis(es) you detailed at the conclusion of the
introduction section. The results of your inferential statistical analysis either
support or fail to support your hypotheses.
2. Next, discuss the theoretical implications of your findings. Because (in your
introduction section) you justified/supported your hypothesis with psychological
theory and extant research, it is important to discuss what the results tell us
pertaining to that theory and research.
a. If the data support the hypothesis (e.g., null hypothesis rejected), then the
results were expected, were in accordance with and support, the theory
and research you cited in the introduction.
b. If the data fail to support the hypothesis (e.g., relationships or group
differences were not statistically significant) then something unexpected
happened. This is not necessarily bad – on the contrary it can be very
important and interesting. Perhaps existing theory or research were
inadequate or flawed in some way? Perhaps the theory we used to deduce
the hypothesis should be re-examined or altered in some way? Perhaps
future research should investigate alternative explanations for our results
which our research design failed to control for? Address any or all these
issues as appropriate.
3. Having just discussed (above) what we’ve learned from these results (the
theoretical implications), the next logical issue is to address the practical
implications of your findings. How might we apply what we’ve learned to
potentially improve human-machine systems to make them safer, more effective,
more comfortable?
4. Finally, conclude by discussing future research. What research questions remain
or are raised by this line of work? Usually one would pose 2-3 suggestions for
future research ideas before transitioning the paper to a close.
Common mistakes include the following:
Failure to adequately accomplish directives 1-4 above.
Slamming your own research. It is good scientific practice to identify
potential problems with your research, but no study is perfect and questions
always remain or are raised. Do not be so condemning that the reader
questions your contribution or, worse yet, your ability as a researcher.
(Return to Table of Contents)

20
Notes
The primary reason for using notes in papers you submit for grade is to document
collaboration. Neither the APA Publication Manual nor the APA section of the Little,
Brown Handbook discuss the use of notes to document collaboration. As a result, you
will have to refer to the Dean's Documentation of Academic Work (2010) for specific
information.
We encourage you to collaborate! However, collaboration must be documented if
the assistance you received is from a source other than the instructor who gave you the
assignment or the members of your formal group. (A formal group is established by your
instructor for the purpose of completing an assignment.) According to USMA policy, the
following types of assistance also do not have to be documented: editing by others for
spelling, grammar, and punctuation, and the assistance of computer spelling and grammar
checkers. Help that you receive from your roommate, teammate, or any other
acquaintance (unless they are members of your formal group) must be documented. Your
documentation of the help you received must be specific. A note that says, "My
roommate helped me with this assignment." is not acceptable. Any notes that appear in
your Notes section must also be cited in your References section.
ESTABLISHING WORKLOAD 12
Notes
1. Cadet Jason Barker, '03, A2, assistance given to author, verbal
discussion, West Point, NY 21 November 2000. Cadet Barker explained
to me how to format the data so that the SPSS program would analyze it
properly.
2. COL Jose Picart, BS&L, assistance given to author, review of paper,
West Point, NY, 23 November 2000. COL Picart suggested that I explain
Schachter's cognitive theory in greater detail.
Note: All collaboration documented in the Notes section also must be cited in the
References section of your paper.
(Return to Table of Contents)
1/2" from top of page
"Notes" is centered and one double-spaced line
below the right margin header
Notes are
double-spaced
1" left margin
1" right
margin

21
References
As mentioned previously, APA style requires that you use parenthetical
references when citing sources in the text of your research paper. These parenthetical
references serve as pointers to the full citation in the References section of your paper.
The sixth edition of the APA Publication Manual provides guidance on citing various
types of references. Refer to the APA Publication Manual for specific formatting
information, but see the References example below for general guidance.
Sometimes you may need to cite an author’s work presented in the work of
another author. This situation is called a secondary citation or indirect source. For
instance, you read an experiment by Craig and Tulving in your Cognitive Psychology
book that you want to cite. You should first attempt to get the original article in the
library. If unable or not required to do so (due to time constraints, some in-class labs will
not require you to get original citations), then you can still reference the article through
secondary citation. In text, you would simply cite the study as usual, followed by the
authors of the document that you actually read (e.g., “Craik and Tulving (as cited in
Galotti, 1994) found that . . .”). Only the work that you actually read - in this case,
Galotti, 1994 - would be listed in your References section.
ESTABLISHING WORKLOAD 13
References
Endsley, M. (1988). Design and evaluation for situation awareness
enhancement. Proceedings of the Human Factor Society 32nd
Annual Meeting (pp. 97 – 101). Santa Monica, CA: Human
Factors and Ergonomics Society.
Reason, J. (1990). Human error. New York: Cambridge University
Press.
Roth, E.M., Bennett, K.B., & Woods, D.D. (1987). Human interaction
with an “intelligent” machine. International Journal of Man-
Machine Studies, 27, 479 – 525
Wilkins, R. S., & Caldwell, G. L. (2000, Dec 3). [Discussion with author].
West Point, NY.
Note: APA format calls for a "References" section, not a "Bibliography."
1/2" from top of page
"References" is centered and one double-spaced
line below the right margin header
Citations are
double-spaced
Use a five-space
hanging indent.
1" left
margin
1" right
margin
Last name, first and middle (if known)
initials
Proceedings citation
Book citation
Journal citation with 3 authors
Collaboration citation

22
(Return to Table of Contents)
Appendices
On some occasions, an appendix may be needed. This situation happens when
detailed expository information would be distracting if inserted in the text. In
Engineering Psychology reports, the most common appendix items are: nonstandard test
materials, standardized set of instructions, complex description of apparatus, original
computer programs, and other items that another researcher would need to replicate your
work, but which the normal reader would find confusing in the text.
Note: MINITAB and SPSS statistics outputs are not included as an appendix.
(Return to Table of Contents)
Tables
Tables are generally used when relationships among individual results (means,
standard deviations, etc.) can best be understood outside of the text, as is the case when
many individual entries exist. However, articles submitted to journals are conservative in
their use of tables, since non-text copy is expensive. Use tables only when they enhance
understanding! In addition, tables prepared for submission to a journal are unadorned.
Your own tables should be so as well -- in most cases, decoration confuses clarity. Do
not have them look like those in USA Today!!
Table 4
Mean Detection Time as a Function of Pattern and Training Level
Training Level
______________________________________________
Pattern Low Intermediate High
Standard 2.34 5.22 2.03
Symmetric 2.03 3.34 1.56
High-Density 1.52 2.27 2.67
For Engineering Psychology papers, tables will be inserted appropriately in the
text, offset from their text references only as far as necessary to prevent splitting a table
across two pages. This technique is in agreement with final manuscript method found in
APA, so place the tables where they flow and look best.

23
Tables should supplement text. Every table should be referenced in the text
describing what the table shows, but not so detailed that the table is unnecessary. Tables
should be numbered sequentially with Arabic numerals (Table 1, Table 2, etc.). Put the
table number and title at the top of the table, left justified (see Table 4).
Note: Titles for Tables and Figures should always be self-explanatory.
(Return to Table of Contents)
Figures
Graphs or pictures (called figures in scientific writing) are used only when the
point you are trying to make favors graphic presentation. If your experiment consists of
two groups and one measure, a graph would only convey that one score was higher than
the other, which can be expressed just as effectively in text. Generally, use a graph for
trends and relationships that are hard to express in words (e.g., ANOVA interactions).
Ensure the axes are properly annotated and the measurement scale identified. Whether to
to include a graph or not is your decision, but a good scientist will generally graph their
data (whether used or not) to investigate trends noticeable to the eye, but not evident
when examining mere numbers.
Kinds of Graphs. The computer SPSS graphics package available in the
laboratory contains virtually every type of graph used by scientists. You will most likely
use only three: the line graph, the x-y scattergram, and the bar graph.
The Line Graph is used to show a continuous change, such as a series of
measurements taken over time. The independent variable (categorical in nature) is on the
x-axis, and the dependent (continuous) is on the y-axis. Figure 1 is a line graph with one
independent variable. In accordance with APA format, graphs are now plotted with
means and some form of deviation or standard error bar to demonstrate spread of the
data.
Figure 1. A line graph with four cases of a single IV with error bars.
20
15
10
5
0
Group1 Group 4Group 3Group 2
Dep
end
ent
Var
iab
le
Independent Variable

24
Figure 2 shows a line graph with two independent variables. This graph is useful
to show trends such as two main effects and an interaction. This graph would be very
hard to portray in text or with a table. In this case, a picture is worth a thousand words.
Notice the error bars are not present (although their inclusion is acceptable) as their
inclusion might make it more difficult to interpret the graph. Again the decision is yours.
20
15
10
5
0 Group 1 Group 3 Group 2
Dep
end
ent
Var
iab
le
Independent Variable
Males
Females
Group 4
Figure 2. A line graph with two independent variables and no error bars.
Certain symbols are indicative of graphs. The first involves the “node symbols”
and , which mark the points on the x-axis of actual measurements. Without the
symbols, the reader could assume that all points on the line represented actual measures.
Unless some compelling reason presumes the line represents continuous measure (e.g.,
heart rate), node symbology should be used. Use a legend for more than one line. (see
Figure 2). Do not put a title on the top of the graph. APA requires figure captions be
placed at the bottom of the graph.
The Bar Graph (see Figure 3) is generally best used for discrete categories (e.g.,
ANOVA, t-tests) when relative magnitude is important to convey rather than trends. Be
sure to include error bars. Caution: The bar graph becomes unwieldy when too many
variables are being displayed. Notice that a legend is appropriate with a bar graph.
A problem inherent in bar graphs is shading interactions. To differentiate
between two variables, the shaded bars have two different cross-hatch patterns. But these
patterns set up a visual rivalry called a moiré illusion. This illusion may cause a sort of
induced motion or shimmering illusion, particularly if the lines are close together. Avoid
fancy cross-hatching by using solid filled and colored bars. Figure 4 is a much better bar
graph.

25
Figure 3. Bar graph with hatchure - poor coding.
20
15
10
5
0 Group 1 Group 4 Group 3 Group 2
Dep
enden
t V
aria
ble
Independent Variable
Males
Females
Figure 4. Bar graph with proper color coding.
The X-Y Graph (sometimes called a scatterplot or scattergram) has two
continuous axes (unlike the line graph, which has a discrete x-axis (See Figure 5). The
scattergram depicts the relationship of two continuous variables (frequently used for
correlations and linear regression).
20
15
10
5
0Group 1 Group 4Group 3Group 2
Dep
end
ent
Var
iab
le
Independent Variable
Males
Females

26
Figure 5. Example of x-y graph with the currently popular “range-frame” design.
Occasionally other graphs are used, but never inflict a pie chart on your
instructor! Although aesthetically appealing, the pie chart provides little valuable
information. Again, don’t have your figures look like those in USA Today. Remember
to present the graph with maximum content and minimal clutter. Be precise and
concise!!
Pictures in a scientific report most commonly include examples of stimuli,
drawings of special apparatus, histological drawings (showing locations of lesion sites),
etc. All drawings will be in black ink only. The sole exception is the rare case of a
stimulus whose color is critical, and necessary to convey this color information to the
reader.
If you use a diagram, use a computer graphics package. The lab computers have
several packages: PowerPoint, AutoCad, Mannequin, and Altia. For more complicated
drawings or animation use AutoCAD or Altia. You can animate using Altia, which is the
newest acquisition to the lab. These graphics packages will take training, but are worth
it. Computer drawings should be printed to laser printers or the CAD plotter. All graphs
and illustrations will be embedded in the text and labeled Figure XX, in sequence with all
other figures. (Return to Table of Contents)
100 190200
300
500
X - Variable
Y-
Var
iable

27
General Format Tips
All text should be in the same typeface: 12-point New Times Roman, left
justified, just like this text. Unlike this text, the research paper is double spaced, and is
not boldfaced or italicized.
Fonts
Use italics for words that are normally italicized. By “normally italicized,” we
mean foreign words not in wide use (e.g., a posteriori but not etc., since the Latin et
cetera is of such widespread use and is essentially an English phrase; a posteriori is a
term limited to mathematicians and logicians, hence still “foreign”). Other allowable
underlined words are those used to emphasize (“. . . it is particularly interesting to note
that none of the participants in the control group exceeded the criterion score”). In
addition, test statistics are italicized in printed publications, hence, italicize them in your
typescript (t, F, M, etc.). In previous manuals, writers were instructed to utilize
underlining in place of italics. However, with the widespread use of word processors,
italics are now used in paper submissions.
Section Titles and Headings
Titles and section headings are generally in upper/lower case. First-level
headings are centered above the text. Major headings include the Title, Method, Results,
Discussion, and References. Second-level headings (subsections such as the Participants,
Apparatus, and Procedures - parts of the method section) are italicized and flush left. If
you have third-level headings, indent them five spaces, italicize, and end with a period.
RUNNING HEAD 7
Method
Participants
Twenty volunteers, ranging in age from 18-35 (M = 25.5) participated. They
received 5 bonus points toward their Introductory Psychology grade for ….
Apparatus
Computer complex. A Gateway P450 computer . . .
In-Text Citation
The citation simply references the conclusions of an earlier experiment. APA
style specifies the use of parenthetical references. The format for a parenthetical
reference is: (Author's last name, year of publication). The page number is included
after the year of publication when citing a quotation, i.e., (Author’s last name, year of
publication, page number). For complete instructions regarding in-text citations and
First-level headings are centered,
bold, & in upper and lower case
Second-level headings are flush left, &
upper and lower case,.
Third-level headings are typed in “sentence case,”
indented 5 spaces, bolded, and ended with a "."

28
references, please see the APA Publication Manual located in the Engineering
Psychology library. Additional formatting information includes:
For two authors use an "&" between their names.
For three to five authors, separate their names by commas and use an "&"
between the last two names. After the first citation of the source, you may use
"et al." (i.e., Smith, et al., 1998).
For more than five authors, use "et al." for all parenthetical references.
Use "p." when referring to a single page number and "pp." for more than one
page.
When using the names of the authors in your text, you need only include the
year in the parenthetical reference. Example: Barnes and Franklin (1994)
found that …. Note that when the names of multiple authors are cited in the
text, the last two names are separated by "and" rather than "&."
If you are referencing a specific quotation found in the publication you must
include the page number in the citation.
(Return to Table of Contents)
Multiple Experiments In some instances you may need to report a series of two or more experiments that
methodically develop your theory or test and eliminate alternative hypotheses. If so,
separate methods/results/discussions for each experiment should exist. Mark the
beginning of each experiment with a title (i.e., Experiment 1, Experiment 2, etc.) centered
above the first paragraph.
(Return to Table of Contents)
29
Evaluation of Written and Oral Reports
The Objectives of the Formal Report are numerous. First, this lab report process
establishes a logical, scientific bias in problem solving and inquiry. Experience shows us
that practice makes perfect. Writing lab reports forces you to review the planning and
execution of the experiment, which increases the probability of applying this logical
system to the solution of other problems.
Second, this process develops comprehensive writing and speaking skills.
Although this approach may appear to be the Betty Crocker school of applied prose
where elements are assembled automatically and mixed together like ingredients in a
devil’s food cake, it is, in fact, not as easy as it appears. For instance, you still have to
understand the experiment and its procedures. You cannot bluff your way through a
research paper or lab report. Additionally, oral presentations require you to logically and
professionally present your work (for example, the course project in PL386 requires both
a full written report and an oral defense). This approach is the Engineering Psychology
cadre doing its part to support a major thread of the cadet experience--developing the best
soldier-scholars for tomorrow’s Army.
Evaluation Criteria
A thorough understanding of the evaluation criteria we use in the Engineering
Psychology program will help you excel in everything from small lab reports in PL386 to
the course project in PL490. We will use the criteria in this Handbook to evaluate nearly
all of your oral and written work. There are a few instances in which other criteria will
be used (i.e., case studies in PL488E). On these occasions your instructor will provide
you with the criteria well in advance of the due date.
Learning to write research reports and to present your findings orally are
developmental processes. Therefore we have structured the Engineering Psychology
curriculum so that you learn to crawl, then walk, then run. In PL386, for example, you
will submit your course project written report at least three times. The first submission
will include just the Introduction. The second submission will include both the
Introduction and the Method sections. And the third submission will include the
Abstract, Introduction, Method, Results, and Discussion sections. Although the criteria
will remain the same, we have every expectation that you will improve in your ability to
write and speak effectively as you progress through the program.
General Standards
The evaluation standards we've established for you derive from the Academy's
academic program goals as listed in the Dean's Educating Army Leaders for the 21st
Century. One of the nine goals is effective (oral and written) communication. The
pamphlet describes the four dimensions of communication as Substance, Organization,
Style, and Correctness. The following chart describes how our evaluation criteria
dovetail with the Dean's criteria.

30
Dimension Description Method of Evaluation
Substance Factual accuracy, appropriate and Lit review in Introduction should lead
adequate evidence, pertinent research, logically to your hypothesis and method.
purposeful use of data, quality of ideas, Discussion of data collected should address
propriety of attribution. hypothesis and studies cited in Introduction.
Organization Coherence, intelligibility, conciseness, Use of APA format (Introduction, Method,
orderliness, soundness of logical Results, Discussion). Internal consistency
relationships, persuasiveness, complete- among sections of research paper.
ness, method and form of presentation.
Style Fluency of language, precision of Style should be appropriate for scientific
vocabulary, appropriateness of tone, writing. Use active voice. Just the facts.
effectiveness of sentence structure, use Flowery prose is not appropriate. Proposal
of active verbs, imaginative use of papers are written in future tense. Final
language. research papers are written in past tense.
Correctness Observance of appropriate usage, Paper should be free of all spelling, gram-
grammar, spelling, punctuation, docu- mar, and punctuation errors. Correct use
mentation format, and other conventions of parenthetical references, reference list,
of educated discourse. and notes.
Written and Oral Evaluation Criteria
Appendix C lists the evaluation criteria for written reports. Appendix D lists the
criteria for oral reports and includes tips for preparing your oral presentation. Although
the criteria are organized around the APA format (Abstract, Introduction, Method,
Results, and Discussion), they support the four dimensions of communication described
on the previous page. You should use these criteria as a checklist to ensure you have
covered all the necessary topics for each section of your report. Oral reports will include
visual aids prepared with PowerPoint presentation software.
Note: Content is much more important than slick slides. We will not be impressed
with ‘bells and whistles’ unless they augment the presentation. In most cases, however,
they detract from the presentation.
Critical Evaluation of Research Articles
The ability to critically read and evaluate the research of others is an absolutely
essential skill for Engineering Psychologists. Critical analysis requires practice and is a
crucial program goal of the Engineering Psychology Program. Appendix E provides you
with a checklist for critically evaluating research articles. Follow it closely and you will be
sure to perform a thoughtful, systematic review of the scientific literature.
(Return to Table of Contents)

31
APPENDIX A
Bloom’s Taxonomy

32
This page is intentionally left blank.

33
Bloom’s Taxonomy of Key Words
The following list of key words and their definitions is provided to promote an
understanding of exactly what is required by Lesson Objectives (LOs), Performance
Objectives (POs), and examination questions. The key words are presented in order of an
ascending hierarchy. Those terms that require little original thought are presented first.
When evaluating student performance, the instructor assumes the lower level skills have
been mastered in Performance Objectives that are stated at a higher level. It is not
necessary to memorize this list of key words.
COGNITIVE DOMAIN ACTION VERBS WITH
(Level of Understanding) DEFINITIONS
KNOWLEDGE: Requires re- Identify: To recognize and indicate
call of specific information specific information such as
concepts and theories from definitions, names principles, etc.
reading assignments, films,
class presentations.
List: To reproduce an itemized
set of terms, principles or things
in a prescribed order if appropriate.
Define: To state the meaning of
a term.
Describe: To give a detailed account
of a theory, concept, thing or an event.
Differentiate: To give a detailed
account of distinctions between
related theories, concepts, things,
or events.

34
COGNITIVE DOMAIN ACTION VERBS WITH
(Level of Understanding) DEFINITIONS
COMPREHENSION: Requires, Summarize: To express in concise form
in addition to recall, demonstrated without losing key ideas.
An awareness of the implications
of reading assignments, films, and
class presentations. Comprehension
subsumes knowledge of the material. Illustrate: To make clear and intelligible
a term, concept, or theory by means
of figures, examples, comparisons, etc.
Infer: To draw conclusions or
make generalizations suggested
by a specific set of data.
Classify: To place concepts, examples,
terms, objects, words or situations in
categories according to specific criteria.
Relate: To bring into logical
or natural association by stating
the connection between concepts,
theories, terms, issues, etc.
Predict: To use a concept, theory
or principle to forecast an outcome.
APPLICATION: Requires the use Apply: To use learned material such as
of abstractions from reading rules, concepts, principles or theories to
assignments, classes, and films to solve a problem in a given situation.
solve particular problems. It includes
the ability to predict a probable outcome.
Application subsumes comprehension Explain: To use a given theory or
of the material to be applied. concept to account for the occurrence
of a given phenomenon.

35
COGNITIVE DOMAIN ACTION VERBS WITH
(Level of Understanding) DEFINITIONS
ANALYSIS: Requires breaking a Analyze: To break down a situation,
situation, issue, or event into its issue, or event into its component parts,
constituent elements so that the summarizing the relationships among
assumptions or components are components.
made clear and the relationships
between them are made explicit.
Analysis subsumes comprehension Compare: To state similarities by bringing
of the material to be analyzed. theories, concepts, paradigms or principles
together for the purpose of demonstrating
likeness.
Contrast: To state dissimilarities by bringing
theories, concepts, paradigms, or principles
together for the purpose of demonstrating
unlikeness.
SYNTHESIS: Requires combining Synthesize: To combine separate elements
elements or parts so as to form a into an orderly, functional, structured
new whole. new whole.
Design: To conceive, contrive, or create
a plan which draws on two or more elements
and has reasoned purpose or intent.
EVALUATION: Requires Discuss: To state arguments for and against
judgment about the value of an issue, concept, or term.
material based on quantitative
or qualitative criteria.
Evaluate: To form a conclusion as to whether
a concept, principle theory, etc., is right, just
or valid when compared against definite
criteria established by the instructor or
provided by the student.
(Return to Table of Contents)

36
This page is intentionally left blank.

37
APPENDIX B
Research Forms
&
Instructions

38
This page is intentionally left blank.

39
Approval Procedure for Use of Human Participants in Research
In our department, we maintain a research participant pool of cadets who want to
get extra credit for their PL100 class. This pool was established to supply participants to
the researchers in the department and is maintained according to the USMA guidelines in
using human participants. There are circumstances when PL100 students are not the
appropriate participant pool for the research project being conducted. In either case, the
management of participant treatment must be watched closely. Accordingly, strict steps
must be followed.
*** In most cases, it will take less than three weeks, after submission of a request to
the Research Coordinator, to receive approval from the Human Subjects Research
Review Board. Examples of all the necessary forms are included in this appendix. You
may also find them on sharepoint.
Procedure for Research Project Approval
Any human participant data collected by faculty or cadets must undergo
review. Benign research involving interviews, surveys, or desk-top simulations will
undergo Exempt review. Research that involves risk to participants, either due to
the nature of the questions and/or intervention, will undergo Non-Exempt or
Expedited IRB review. Retrieve the appropriate IRB documents via sharepoint.
Your instructor will provide you with the link.
1. Complete CITI Training: https://www.citiprogram.org/Default.asp
a. The institution you are affiliated with is: U.S. Army Human Research
Protections Office (AHRPO)
b. Training that you need to complete:
i. If this is your first time obtaining your CITI training you will need
to complete the: Social & Behavioral Investigators & Research
Personnel, Basic Course. Note it will take you 2-3 hours to
complete the course, afterwards save a copy of your certification.
Note, keep a copy for yourself, you will need to include a copy of
your certification with every new protocol you submit. Your
certification is valid for two years.
ii. If you have completed the training within the past two years, you
may complete the CITI Refresher Course. Note it should take
you under an hour to complete.
iii. All faculty, colleagues, and cadets involved in the project need to
complete CITI training.
2. Go the Sharepoint IRB site to retrieve paper work. Your instructor will provide
you with the link.

40
3. Complete USMA_Exempt_Request_Form_Template_Apr_09 found in Shared
Documents > Exempt Protocol Documents and Procedures. Note, your
instructor should be listed as the Principal investigator and as such should sign
Page 9.
4. Complete Exempt Consent Form found in Shared Documents > Exempt
Protocol Documents and Procedures.
5. Complete Exempt Consent Form found in Shared Documents > Exempt
Protocol Documents and Procedures.
6. Submit a copy of your Curriculum Vitae or Resume. Basic information should
include education, academic positions (include courses taught), previously held
jobs/positions and duty descriptions, and publications if any. Cadet transcripts are
sufficient.
7. All documents should be scanned and combined into 1 PDF document. The single
PDF document should be emailed to the Lab Director, Ericka Rovira, Ph. D. If
you have any questions regarding the instructions email or call the Lab Director
for clarification x5902.
8. Researcher(s) coordinate for laboratory/classroom space as needed for their
project.
9. Research requiring human participants will be announced and managed via the
sona-system. It is the responsibility of the Researcher(s) to post, update, and
manage all research information in the sona-system. Instructions for posting and
managing research information in sona-system can be found on sharepoint. Your
instructor can provide you with the link.
10. Researchers complete their data collection. Researchers must debrief all
participants and update their Research Participation Points in the sona-system.
REMEMBER:

41
1. ALL STUDIES REQUIRE INSTITUTIONAL APPROVAL, regardless of
what kind of study you are doing.
2. Plebes cannot participate in data collection during other mandatory activities (i.e.,
formations, classes, evening study period, etc.) and their participation may not last
more than 165 minutes.
3. Data collection must be done in an academic setting (classroom, laboratory, etc.)
unless other arrangements are approved by the Human Research Protection
Program (HRPP).
4. Data collection may not begin until project approval has been given.
5. Informed consent forms are to be turned in to the Psych Tech, Ms. Vasiliki
Georgoulas, NLT Lesson 40 of the semester during which the research is
conducted.
6. If, during data collection, the cadet participant does not arrive for his or her
scheduled time slot, NO adverse actions will be taken. However, the researcher
will NOT award Research Participation Points in the sona-system. If the
researcher fails to arrive but the participant has kept his or her scheduled time, the
participant will notify his or her PL100 instructor. The instructor will inform the
faculty member advising the cadet researcher that the researcher did not show.
The faculty advisor will determine what action should be taken, and the
researcher will award the participant ONE Research Participation Point in the
sona-system.

42
This page is intentionally left blank.

43
USMA Human Research ProtectionProgram (HRRP) Example of Request for Exemption (p. 1 of 9)

44
USMA Human Research ProtectionProgram (HRRP) Example of Request for Exemption (p. 2 of 9)

45
USMA Human Research ProtectionProgram (HRRP) Example of Request for Exemption (p. 3 of 9)
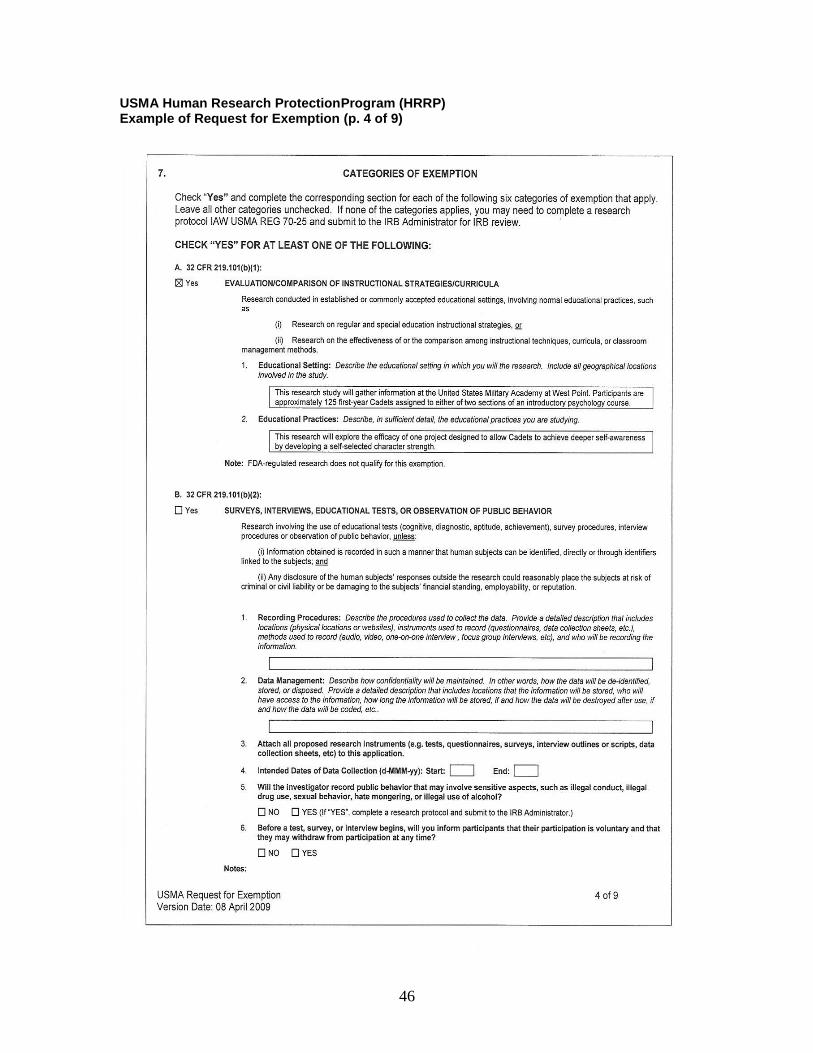
46
USMA Human Research ProtectionProgram (HRRP) Example of Request for Exemption (p. 4 of 9)

47
USMA Human Research ProtectionProgram (HRRP) Example of Request for Exemption (p. 5 of 9)

48
USMA Human Research ProtectionProgram (HRRP) Example of Request for Exemption (p. 6 of 9)

49
USMA Human Research ProtectionProgram (HRRP) Example of Request for Exemption (p. 7 of 9)

50
USMA Human Research ProtectionProgram (HRRP) Example of Request for Exemption (p. 8 of 9)

51
USMA Human Research ProtectionProgram (HRRP) Example of Request for Exemption (p. 9 of 9)

52
USMA Human Research ProtectionProgram (HRRP) Volunteer Consent Form (p. 1 of 2)
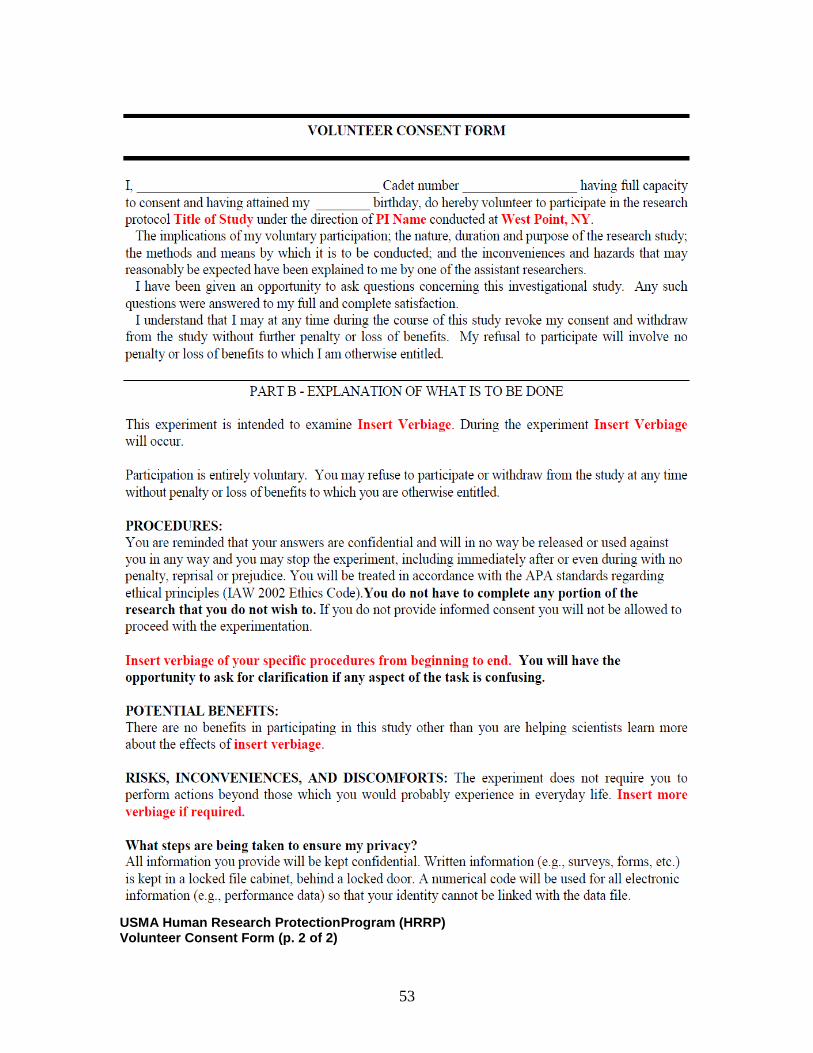
53
USMA Human Research ProtectionProgram (HRRP) Volunteer Consent Form (p. 2 of 2)

54
(Return to Table of Contents)

55
This page is intentionally left blank.

56
APPENDIX C
Written Report
Evaluation Criteria

57
This page is intentionally left blank.

58
Evaluation Criteria
WRITTEN REPORT
NAME ____________________ Total Score (Out of ___Pts.) ___________
____________________
____________________
1. TITLE PAGES (_________) ___________
IAW p. 9-10 of this handbook?
2. ABSTRACT (_________) ___________
Approx 120 words?
Summary of your research?
Background, task/methodology, variables defined?
Results concisely summarized?
Important theoretical/practical implications cited?
IAW p. 11 of this handbook?
3. INTRODUCTION (_________) ___________
Brief, broad background (why interesting/important?)
Purpose of current research?
Lit review.
Psych Theory lit?
Domain lit?
Methodological lit?
(What’s already been done on the topic? Their results?)
Logically support/justify your research, your design, method, hypothesis
State the hypothesis(es)
IAW p.12-13 of this handbook?
4. METHOD (___________) ____________
Participants. Detailed description of participants used.
Are demographics of participants that could affect
results presented?
What were the conditions of participation?
Apparatus. (Detailed enough so that someone else could understand
and replicate the study)
Procedures. (Detailed enough so that someone else could understand
and replicate the study)
IAW p. 13-15 of this handbook?

59
5. RESULTS AND ANALYSIS (_________) ____________
Type of analysis used?
Descriptive Statistics
Inferential Statistics (Main effects, interactions)
Qualitative Data Analysis (if appropriate)
Avoid discussion of theory/practical applications?
IAW p. 15-18 of this handbook
6. DISCUSSION (______) ____________
Address support of hypothesis?
Theoretical implications?
Alternative explanations addressed without slamming own research?
Practical implications?
Future research?
IAW p. 19 of this handbook?
7. NOTES & REFERENCES (__________) _____________
Are all citations in text in the reference list?
Are all references properly documented in agreement
with The Little, Brown Handbook, the Dean’s
Documentation of Written Work, and the APA Publication
Manual (IAW p. 20-21 of this handbook)?
8. Grammar/Spelling/Punctuation (__________) ____________
(Return to Table of Contents)

60
APPENDIX D
Oral Report
Evaluation Criteria

61
This page is intentionally left blank.

62
Evaluation Criteria
ORAL REPORT
NAME ____________________ Score (Out of ___Pts.)___________
____________________
____________________
INTRODUCTION (________) ___________
Brief, broad background (establish interest)?
Was the purpose defined?
Was the lit review accurate, sufficient?
Theory?
Domain?
Methodological?
Was the hypothesis well stated?
Was the research and hypothesis logically supported/justified?
METHOD (___________) ___________
Were participants’ demographics adequately covered?
Was explanation of apparatus used clear, precise,
and comprehensive?
Was the design logically support hypothesis testing?
Were the variables well defined?
Was the procedure clear and chronologically ordered?
RESULTS (_________) ___________
Was (were) the appropriate test(s) used?
Were the data presented clearly without bias?
Were the Tables/Figures well organized?
Were the data accurately interpreted?
DISCUSSION (________) ___________
Hypotheses addressed?
What was impact on theory?
Were practical implications addressed?
Were the implications logically supported by the results?
Were alternative explanations for the results addressed?
Were conclusions/future directions presented?
QUESTION & ANSWER (________) ___________
Were the cadets poised and confident?
Were the responses reflective of preparation?
Were the questions adequately answered?

63
Tips in Preparing for a Presentation
1. Do not read your report. Boring. Your audience wants to hear you talk, not listen to
you read.
2. Make notes. Use index cards or some other method. Organize your cards and
number them clearly according to the order in which you will use them.
3. Secure the attention of your audience. Your discussion of the background should
also serve as an “attention grabber.”
4. Use connective sentences and phrases. The ear cannot check back or jump ahead as
can the eye. Therefore, you must remind your audience of what they have just heard and
prepare them for what they are about to hear whenever you go from one idea to another.
Example: “Now that you have a clear idea of what causes multiple sclerosis, it is time to
look into some of the potential cures that are being reported.”
5. Rehearse your speech. Time your talk. Learn to handle your notes naturally. If you
have overhead transparencies or PowerPoint slides pay special attention to the transitions
between subsequent slides (and to the transition between the ideas or discussion points
illustrated by subsequent slides). In most cases you must complete your talk in no more
than 12 minutes.
6. Other Suggestions. As you speak, look directly at each individual in the audience.
Eye contact is very important in the overall impression that you make. Always present
information in graph or picture form when possible. Visual aids should be clear, labeled,
and legible. Avoid detailed calculations, “busy” looking pictures or graphs. Follow the
“keep it simple” principle.
(Return to Table of Contents)

64
APPENDIX E
Checklist for Critical Evaluation
of Research Articles

65
This page is intentionally left blank.

66
Questions for Evaluation of Research Articles
Introduction 1. What is the author’s goal? (test a theory? introduce a new theory? Investigate a theory
under specific circumstances? review of a particular problem area? investigate
solutions to a problem? Exploratory research?)
2. How comprehensive is the lit review? Have important articles or areas been
neglected? Could any of these citations bear fruit for my own introduction?
3. What are the hypotheses?
4. Given his introduction, are the research and hypothesis logically supported/justified?
(Look for fallacies in the author’s arguments: provincialism, false dilemmas, hasty
conclusions/generalizations, circular logic, purposeful ambiguity or inappropriately
operationalized concepts and variables).
Method 5. Who are the subjects?
Are selection procedures adequate (number/type of subjects)?
Do the demographics and psychographics match the target population?
Given the characteristics of the sample, can the results be generalized to larger
populations?
6. What are the independent, dependent, and extraneous variables?
7. Is the experimental design appropriate for actually testing the hypothesis?
8. Are extraneous variables adequately controlled?
9. How appropriate are the stimuli, materials, and apparatus?
10. How appropriate are the procedures?
Are tasks/events properly sequenced?
Are instructions leading or misleading?
Results 11. Has the data been properly analyzed?
Could alternative or additional analyses be performed?
Have critical analyses been neglected?
How were the data coded? reduced?
12. Are the tables and figures clear/properly prepared? Are they misleading?
13. What were the results? Did the author get the “wrong” results?
Discussion 14. Do the results support the hypotheses?
15. Are there alternative explanations for the findings? Are they adequately discussed?
16. What are the theoretical implications of the findings?
17. What are the practical implications of the findings?
18. Do you agree with the author’s interpretation of the results? Are there fallacies in the
author’s logic leading to the theoretical and practical implications s/he cited?
19. What additional research might be performed to increase understanding of the
problem?

67
Relevance 20. How does this research/literature inform my research? To be useful it should:
Describe psychological theories that are relevant to the behavior under study in
my research
Describe methodologies used by other researchers studying similar problems
Describe the Domain in which I am studying behavior (military settings, law
enforcement settings, civilian settngs, etc.)
These questions are modified from Weimer, Research Techniques in Human
Engineering. 1995. Upper Saddle River, NJ: Prentice Hall.
(Return to Table of Contents)

68
Appendix F
Symbols, Conventions,
&
Buzzwords

69
This page is intentionally left blank.

70
Symbols, Conventions, & Buzzwords The items listed below represent a fairly complete sample of commonly
encountered key terms, symbols, abbreviations, and other conventions used in technical
reports in our discipline. They are arranged alphabetically. Greek letters are fitted at the
end of alphabetic lists for their English counterparts. If there is no counterpart (like ),
entries are placed at the end of the list. If a term is in italics, it should be underlined in
your reports.
A/D Analog-to-digital conversion
ad lib. ad libitum. Literally “at pleasure.” When rats are
placed on an ad libitum feeding schedule, they have
all the food they want all the time.
AP Anterior-posterior axis.
a posteriori A conditional probability; P [A/B] (“probability of
event A given condition B”).
a priori A probability stated in advance of some
manipulation, generally used as a criterion. The a
priori criterion for most experiments is , the
probability of a Type I error.
ANCOVA Analysis of covariance (ANOVA with one or more
regression variables [covariates]).
AND A Boolean logical state; the intersection of two
conditions.
Probability of a Type I error.
Statistical symbol of treatment effect for ANOVA.
BCD Binary coded decimal.
Bipolar In electroencephalography, measurement of
an area across both hemispheres (see unipolar).

71
bregma Junction of coronal and sagittal sutures; stereotaxic
reference point.
Beta (Greek letter); (1) a priori probability of a
Type II error; (2) criterion level for a sensory
decision; (3) standardized regression coefficient;
(4) population parameter for regression coefficient
C The statistic associated with the Friedman test;
contrast.
candela (cd) Unit of luminous intensity.
cd/m2 Candelas per square meter (measure of luminance).
c/d Cycles per degree
CFF Critical flicker frequency
chi square Statistical test of association or goodness of fit; the
chi square distribution.
CIE Commission Internationale de l’Eclairage; source
of standards for light and color.
CR Continuous (FRI) reinforcement
CRT Cathode ray tube - refers to a vector-type display
(like an oscilloscope); TV screens use a raster
display, and are generally referred to as VDT.
CSF Contrast Sensitivity Function
c/s Cycles per second (usually Hz).
curve, tuning A function associated with some signal distribution
with a center peak and bandwidth.
CVC Consonant-Vowel-Consonant; a type of trigram.
D/A Digital to analog conversion.
dB decibel
Delta A category of brain activity.

72
Dexamphetamine Dexadrine; an indirect dopamine agonist.
DRL Differential reinforcement, low frequency (operant
terms).
DV Dorsal-ventral axis
E, Es Experimenter(s)
In regression equation, unexplained or residual
error.
F The F statistic.
FFT Fast Fourier Transform
FI Fixed interval reinforcement schedule
fL Foot-Lambert (measure of luminance).
FR Fixed ratio reinforcement schedule
g (1) Gram. (2) Gravitational force
Gamma - statistical
Graticule A grid superimposed on a display for estimating
magnitudes of deflection.
Hz Hertz (cycles per second)
HZP Horizontal zero point of de Groot
im Intramuscular (injection)
I/O Input-output
ip Intraperitoneal (injection)
ISI Interstimulus interval
iv Intravenous (injection)
IV Independent variable
jnd Just noticeable difference

73
k Number of groups in an ANOVA design
Ketamine Relaxant used as a precursor to anesthesia
kg Kilogram
LED Light-emitting diode
linearized Converted to a linear scale, usually for ease of
adjustment of measurement.
lumen Unit of luminous intensity
lux Unit of illuminance
The wavelength
mA Milliampere
manipulandum “That which is manipulated;” the experimenter’s
control for reinforcement (see operandum).
MANOVA Multivariate analysis of variance
mg Milligram
ML Medial-lateral axis
ml Milliliter
mL Millilambert (see fL)
monopolar In EEG, measurement on one hemisphere
ms Millisecond
MTF Modulation transfer function
mV Millivolt
“Mu” (Greek letter); the population mean
g Micrograms
V Microvolt

74
N Noise or population size
n Sample size
nit (alt.) cd/m2
NOR Logical Boolean operator; “not OR”
ns Nonsignificant
“Nu” (Greek letter), distinct for italic v
O, Os Observer(s)
ONEWAY The one way (one IV) ANOVA
operandum “That which is operated;” the bar or tilt rod or
other device that a Participant uses to make an
operant response (see manipulandum)
OR A logical Boolean operator
P, Ps Participant(s)
p Post hoc probability that a Type I occurred (e.g.,
“p < .05”)
paralog Nonsense syllable
post hoc After the fact (literally “after this”); usually an
inferential test made in the absence of a priori
hypotheses, such as the multiple range tests.
[x] A priori probability of occurrence of x
[x|y] A posteriori probability of x given y
R Response
nR Number of responses (Mechner operant notation)
RF Radio frequency
ROC Receiver-operating characteristic curve

75
“rho” (Greek letter); the statistic associated with the
Spearman rank-order “correlation coefficient;” also rrho
S Stimulus
S, Ss Subject(s)
s Sample standard deviation
ŝ “s hat;” unbiased estimate of sample standard
deviation
s2 Sample variance
SA Aversive or noxious stimulus; punishment
sc Subcutaneous (injection)
SD Standard deviation (alt)
SD Discriminative stimulus
S “S-delta;” an inappropriate discriminative stimulus
SDT Signal Detection Theory
SE Standard error of the mean
SN Substantia nigra (anat.); Signal/Noise distribution
SR+ Positive reinforcer
SR- Negative reinforcer
standardized Value of normally distributed variable expressed in
standard units, or number of standard deviations
from distribution mean
S0 Extinction contingency (no reinforcer)
Population standard deviation
2 Population variance
Time (Mechner notation)

76
t The t-statistic
TSD Theory of Signal Detection
nT Period of time; delay (Michner)
TTL Transistor-to-transistor logic
U Test statistic for the Mann-Whitney test
VZP Vertical zero point of de Groot
XOR Logical Boolean operator; exclusionary OR mask
z The z-statistic or distribution
(Return to Table of Contents)

77
This page is intentionally left blank.

78
APPENDIX G
Common Nomenclature

79
This page is intentionally left blank.

80
Common Nomenclature
You will frequently use laboratory apparatus for your experiments. Since this
will often be cited in your Method section, a list of common nomenclature for apparatus
is provided below by function.
Acoustic Chambers
All acoustic chambers in the laboratory are manufactured by Industrial Acoustics
Corporation (IAC). The two-room chamber in the acoustic lab (Thayer Hall, Room 268)
is an IAC-1200 ACT. The two-room chamber that contains the speech lab (Thayer Hall,
Room 262B) is an IAC-1000-ACT.
Auditory Instruments Auditory equipment used in the laboratory is made by KAY Elemetrics, ISAAC,
and Coulborn instruments. Common equipment includes; signal generators, pulse
generators, A/D and D/A converters by Isaac, voltage-controlled oscillators, attenuators
and bandpass filters.
Computers
Dell Dimension
Digital Celebris GL5100 (2)
EDS Model ASL 433, 486 (7)
Hewlett packard Vectra
MPC ClientPro
Hand Held Computers
Sony Clie PEG SJ22
Palm M515
Computer Software Packages
Aldus Photostyler
Aldus Superpaint 3.0
Altia design
Autocad R13
Autographics 1.00
Close-up 4.0
Computerized Speech lab
CPOF (Command Post of the Future)
DSN/Labsoft
Falcon
Fast Spectra Scanning System

81
Computer Software Packages (Cont.)
GW-Basic 3.2
HP Superstore
Image Analysis System software by Delta
Labview 5.0
MacBeth
Mannequin
MCL (manual control laboratory)
Mental Model Research
Memory by MicroExperimental Lab
Microsaint
Minitab
Perception by MicroExperimental Lab
Photofinish
Pizazz
Powerpoint
Sigmaplot by Jandel Scientific
SPSS for Windows
TiGR (Tactical Ground Reporting)
Turbo Pascal 7.0
Virtual World
Virtus Walkthrough Pro
Vision Lab 1.5
Vissim
Word
Microscopes
Fischer Scientific binocular
Meiji stereomicroscope
Unitron phase contrast microscope
Wolfe 1201 trinocular
Wolfe stereomicroscope
Wolfe/Teli microvideo system
Wolfe trinocular stereomicroscope
Photography
Olympus digital camera
Sony Digital Video Camera Recorder, Model DCR-TRV20

82
Physiological Measurement
Bio-oscilloscope (Phipps & Bird)
Physiograph (Tektronix)
Coulbourn Suite
Anthropometric Measurement Kit
Minimitter Actiwatch Sleep Measurement System (Model AW64)
Peak Performance Technologies 2D, Digital Motion Capture System
PMI FIT Series 2000 Workplace Safety Screener
Visual Stimulus Presentation, and Visual Measurement Apparatus
Armed Forces Vision Tester, Bausch & Lomb
ASL Series 5000 Head-mounted Eye Tracking System, with Ascension
Technology Corporation’s “Flock of Birds” Head Tracking System
Light discrimination apparatus, Lafayette Model 13014
Spatial frequency acuity tester, Vistech VCTS
Smart Technologies Corporation’s Rear Projection SmartBoard, Model 3000i
Pioneer Plasma Screen, Model PDP503CMX
(Return to Table of Contents)

83
This page is intentionally left blank.

84
Appendix H
Common Cadet Errors

85
This page is intentionally left blank.

86
Common Cadet Errors
General Comments 1. Do not use the words “prove” or “disprove.” Science can only provide evidence to
either support or reject a hypothesis.
2. Avoid passive voice whenever possible.
3. Avoid the use of first (we and I) and second person (you) whenever possible.
Although acceptable to use these voices in scientific writing, their overuse will detract
from the quality of the paper.
4. Data are plural; datum is singular. Do not say “the data is!”
5. Do not overuse the word “which.” Usually “that’ is more appropriate than “which.”
“Which” is generally only used to offset a clause. Also, do not use unnecessary “that’s.”
A common mistake is to use ‘that” when it is not needed. Go on a “which” and “that”
hunt with the search option on your word processor.
6. “Effect” is a noun and “affect” is usually a verb, unless you mean an emotion.
7. Use commas. People tend not to use enough commas. Put a comma at a natural pause
in a sentence or to offset a clause.
8. Avoid ambiguous pronoun references, such as “it,” “this,” “that,” “these,” and
“those;” especially to start a sentence. Use specific references instead. Also, do not use a
pronoun to tie a thought or idea in one paragraph to a similar idea in a previous
paragraph.
9. Be Concise!!!!
10. Avoid terms first-, second-, third-, fourth-class, cow, plebe, yearling, etc. These
terms are unfamiliar to a general audience. Use seniors, juniors, sophomores, and
freshmen instead. Likewise, the use of the term “cadet” should be introduced as “a
student (cadet) at a military college/university” to ensure complete understanding by a
general audience.
11. Avoid military jargon when possible. Your scientific audience is predominantly
military lay people. If needed, define the term when first introduced.
12. Periods and commas are always placed inside the quotation marks.
13. The Latin abbreviation i.e., stands for id est, which means that is, or in other words.
The letters e.g. stand for exempli gratia, which means for example. Use these
abbreviations appropriately. Also remember that e.g., and i.e., are always followed by a
comma.

87
Introduction 1. When you talk about a previous study’s findings use past tense, since the study is
over.
2. When you talk about a study supporting your line of reasoning, use present tense.
3. Be sure to develop the logic that underlies your hypothesis(es).
4. The title is on the first page of the introduction, not the word “Introduction.”
Method 1. Describe detailed tasks in a section of its own, not in the procedure section.
2. Statistical packages are considered to be part of the methods and are usually only
mentioned if they are not common.
References 1. Ensure all references in text are cited in the References section.
2. Ensure all references are alphabetical by first author’s last name.
Tables and Figures 1. Make sure you reference all figures and tables in text and place them as close to the
affected text as possible. Never put the figure or table in text before it is referenced.
2. Titles of tables and figures should be self-explanatory.
3. Title of a figure goes below the figure. Title of a table goes above the table.
4. When referring to a table and figure in text they are always capitalized (e.g., Figure 2,
Table 4, etc.).
(Return to Table of Contents)

88
Appendix I
Sample APA Style Paper

89
This page intentionally left blank.

UNITED STATES MILITARY ACADEMY
SITUATION AWARENESS AND THE LAND WARRIOR SOLDIER:
THE DEVELOPMENT AND IMPLEMENTATION OF METRICS TO TEST SA
PL490: ENGINEERING PSYCHOLOGY DESIGN AND APPLICATIONS
SECTION 1A
COL LAWRENCE G. SHATTUCK
BY
CADET BOYCE R. BUCKNER, 01, CO A2
BENJAMIN R. CROMBE, 01, CO F3
WEST POINT, NEW YORK
06 MAY 2001

SITUATION AWARENESS 2
Situation Awareness and the Land Warrior Soldier:
The Development and Implementation of Metrics to Test SA
Boyce R. Buckner and Benjamin R. Crombe
United States Military Academy
Author Note
[Author note & correspondence information would be added here, as shown in samples
provided within the handbook.]

SITUATION AWARENESS 3
Abstract
The present research deals with the testing of situation awareness (SA) and the Land
Warrior System. Metrics to test an infantry squad’s SA were developed by modifying
Endsley’s Situation Awareness Global Assessment Technique (SAGAT) for the
researchers’ purposes. The queries developed were asked during four breaks in a
computer based land warrior simulation to groups using Land Warrior displays and
groups using conventional information. The hypothesis was that groups using
conventional methods would perform just as well as groups using the land warrior
displays due to information overload and screen clutter of Land Warrior. In most cases,
participants using Land Warrior displays and those without performed the same, but for
locating their position or their enemy’s position, those using Land Warrior performed
better.

SITUATION AWARENESS 4
Situation Awareness and the Land Warrior Soldier:
The Development and Implementation of Metrics to Test SA
With the emergence of new technology, many system designers have been
attempting to incorporate these innovations into the workforce. Presently, there is a
challenge in incorporating this new technology into the weapon systems of the armed
forces of the United States. For example, the Land Warrior system is one of the latest
systems that have been developed by the military to help enhance situation awareness
(SA) on the battlefield for the infantry soldier. Since its creation, the system has
undergone rigorous testing and experimentation, which has resulted in numerous changes
and modifications from its initial design. Despite the many methods used by researchers
to test the Land Warrior system, there is currently no system to measure SA. This poses
a problem with the testing process of the system since there is only a limited ability to
measure the cognitive functions that the system is intended to enhance. Therefore,
present study attempted to help find a solution to this problem by creating metrics to
measure SA in the individual soldier. These metrics provide the researchers with the
ability to determine if SA is better in a soldier equipped with the Land Warrior than in a
soldier with no technologically advanced system.
The ability to provide an individual with large amounts of information often
results in information overload. A previous study on information overload found that
when a person receives too many pieces of information simultaneously, information
overload occurs (Radar, 1981). The study showed that a person could only mentally hold
five or six communication inputs at a time before their processing efficiency began to
decline. Expanding on this theory, Jacoby found that when tasking consumers to choose

SITUATION AWARENESS 5
the best product, the probability for consumers to choose the best product decreased as
the number of choices increased (Jacoby, 1984). Additional studies show that when a
participant is given a large quantity of information, as opposed to a smaller amount of
quality data, they are more likely to commit errors (e.g., Keller & Staelin, 1989). This
relates directly to how much information is displayed through the Land Warrior system.
If the Land Warrior displays too much information, the performance of the participants in
SA tests will decline when compared to a non Land Warrior equipped soldier.
Information overload does not only affect a person mentally, but also affects a person
physically, leading to poorer performance in long duration experiments (Lipowski, 1975).
Although these studies indicate that the presence of too much information results in
overload, other researchers found that the results are not always "clear cut and precise"
(Malhotra, Jain, & Lagakos, 1982). Malhotra examined research done on information
overload and found that not all results showed that information overload led to lower
performance. This is due to the lack of a fixed line for determining what constitutes
information overload, which indicates a possibility that different experiments could find
different results with essentially the same procedure.
These studies suggest that it is important for designers of the Land Warrior
system to reduce the potential for information overload occurring with the infantry
soldier. The researchers took these studies into account when developing their metrics by
recognizing that there are multiple echelons of infantry soldiers that require different
information to perform their duties, which indicate that one system of metrics will not
suffice for a thorough investigation of SA. Instead, these metrics must evaluate SA at
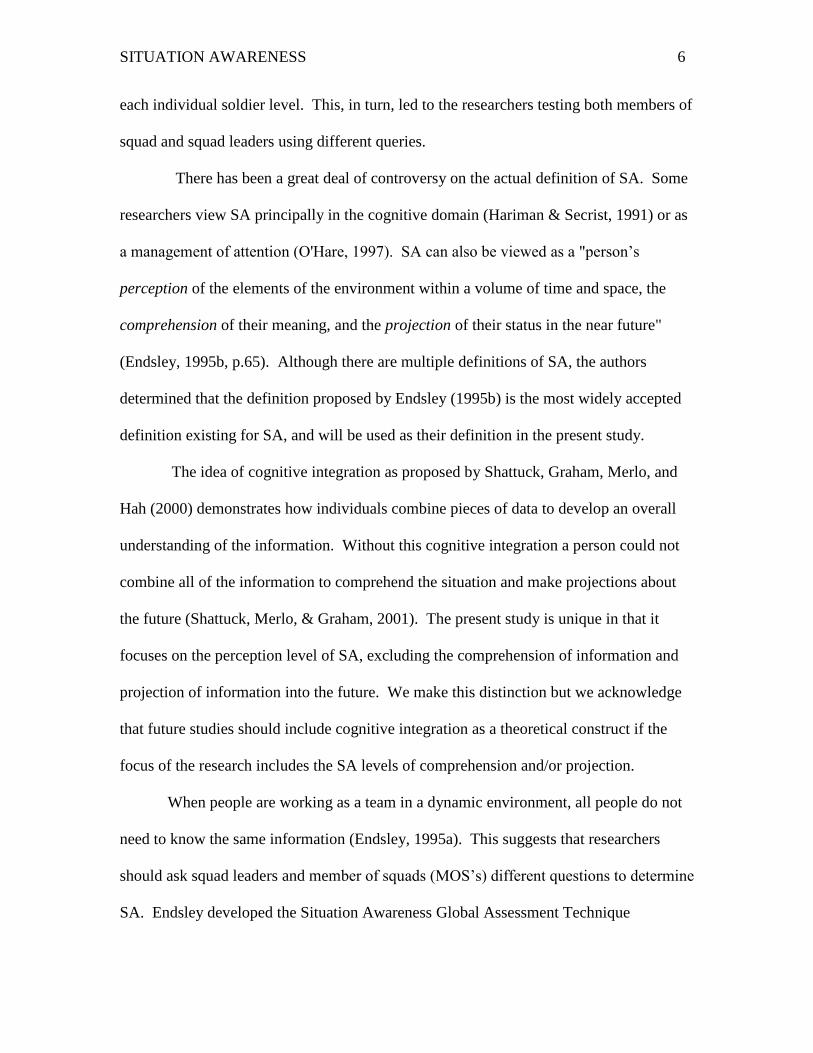
SITUATION AWARENESS 6
each individual soldier level. This, in turn, led to the researchers testing both members of
squad and squad leaders using different queries.
There has been a great deal of controversy on the actual definition of SA. Some
researchers view SA principally in the cognitive domain (Hariman & Secrist, 1991) or as
a management of attention (O'Hare, 1997). SA can also be viewed as a "person’s
perception of the elements of the environment within a volume of time and space, the
comprehension of their meaning, and the projection of their status in the near future"
(Endsley, 1995b, p.65). Although there are multiple definitions of SA, the authors
determined that the definition proposed by Endsley (1995b) is the most widely accepted
definition existing for SA, and will be used as their definition in the present study.
The idea of cognitive integration as proposed by Shattuck, Graham, Merlo, and
Hah (2000) demonstrates how individuals combine pieces of data to develop an overall
understanding of the information. Without this cognitive integration a person could not
combine all of the information to comprehend the situation and make projections about
the future (Shattuck, Merlo, & Graham, 2001). The present study is unique in that it
focuses on the perception level of SA, excluding the comprehension of information and
projection of information into the future. We make this distinction but we acknowledge
that future studies should include cognitive integration as a theoretical construct if the
focus of the research includes the SA levels of comprehension and/or projection.
When people are working as a team in a dynamic environment, all people do not
need to know the same information (Endsley, 1995a). This suggests that researchers
should ask squad leaders and member of squads (MOS’s) different questions to determine
SA. Endsley developed the Situation Awareness Global Assessment Technique

SITUATION AWARENESS 7
(SAGAT) to test individuals' SA in different dynamic environments. She validated the
effectiveness of the SAGAT technique by showing that stopping a scenario and the
length of the break did not affect performance or SA (Endsley, 1995b). Based on the
strengths found in Endsley's SAGAT technique, the researchers implemented a similar
method to evaluate SA (Vidulich, 1994).
The researchers of the present study had to adapt the SAGAT technique to their
purposes with the Land Warrior system. They followed the process that Matthews,
Pleban, Endsley, and Strater (2000) used to measure the SA of infantry soldiers in a
virtual MOUT environment in order to adapt SAGAT to their infantry scenario. In
addition, they also interviewed Endsley to determine how long the breaks in the scenario
should be and the number of questions to use (Endsley, Feb 2001). Furthermore, the
researchers discovered that using experts as a standard to compare the participants to is a
good method to rate SA (McCloskey, Feb 2001). The researchers believe they are
justified in using this approach. Experts perform at a greater level than novices because
they operate at the skill-based level and make quicker and more accurate decisions (Kass,
Herschler, & Companion, 1991).
It is important to test the SA of soldiers when they receive new systems such as
the Land Warrior because the technology may interfere with SA. These new systems
may unwittingly increase the amount information received or alter the format of the
information (Endsley, 1998). By developing and testing the metrics to assess SA the
researchers are proposing a method to determine if these proposed systems improve the
infantry soldiers’ SA.

SITUATION AWARENESS 8
The researchers do not believe that the Land Warrior system will improve the
SA of infantry soldier's at the squad level because of information overload and the
"clutter cost" of the Land Warrior display (Yeh, Merlo, & Wickens, 2001, p.29).
Therefore, the researchers hypothesize that there will be no difference in SA between a
group using the Land Warrior system and a group using the current system for SA.
Method
Participants
The authors of the present study used approximately 126 college freshmen
currently attending the United States Military Academy. These individuals signed-up for
the study on a voluntary basis to earn bonus points towards their grade in their General
Psychology course. The participants were randomly divided into two groups of 63. The
first group was the “Land Warrior” group, and the latter was the “Non-Land Warrior”
group. In order to assist the researchers in the experimentation, an additional volunteer
group was used to play the role of the opposition force during the experiment. No data
was collected from this group.
Participants were treated in accordance with ethical standards established by the
American Psychological Association. The research methods used in this experiment
were approved by the U.S. Military Academy Human Subjects Use Committee.
Apparatus
The participants viewed the scenario on a SV100 Super View Series Televideo
Monitor. All participants had their individual computer console to operate on, which
includes a keyboard and mouse to enter their commands for the role that they will play.
A list of commands was attached to the participant’s console.

SITUATION AWARENESS 9
Procedure
The scenario combat simulation was devised through the program, Delta Force:
Land Warrior. In this scenario, up to ten participants played interactively as an infantry
squad, with one squad leader and nine members of squad. The scenario placed the
participants into the “box” at the Joint Readiness Training Center, Ft Polk, LA. The
mission of the simulation was for the infantry squad to conduct movement to an objective
(an enemy bunker) and to attack/seize that objective. In this case, the squad conducted
movements to two checkpoints, reacted to an enemy patrol, and conclude with a planned
attack on an enemy bunker. The Land Warrior group had the Heads-up Display on the
upper left corner of their monitor, which in turn will provide them with all the capabilities
the Land Warrior System.
The metrics for measuring Situation Awareness were four different sets of
multiple choice questions designed for this experiment, a total of twenty (seventeen for
MOS’s) questions. Each set of metrics was given to every participant on four separate
occasions during the experiment. The participants received a test sheet with their
questions, and circled their responses on the sheet, which the researchers collected at the
end of the scenario.
The independent variable for this experiment was the information system used by
the participants to execute their mission, either with or without the Land Warrior display.
The dependent variable was the level of Situation Awareness determined by the
correctness of the participants’ responses to the researchers’ queries. The experiment
was and independent, or between groups, design.

SITUATION AWARENESS 10
The participants were randomly divided into two testing groups, the Land Warrior
group and Non-Land Warrior group. Each group was comprised of 63 participants.
From there, the researchers randomly selected seven participants from each testing group
to play the role of squad leader for their experiment. The remaining 56 participants in
each group played the role of members of an infantry squad. Additional participants that
signed-up after 126 participants were achieved were assigned the role of the opposition
force (OPFOR), and were tasked to attack and defend against the participants in the
experiment. No data was collected from this group. Once the researchers determined the
testing groups, they tested the Land Warrior group in seven separate sessions. Each
session tested one squad composed of one squad leader and up to ten members of squad.
The participants met in a computer lab, where they received their introductory briefing,
and completed all before-experiment paperwork. Once this administrative portion was
completed, the researchers then provided an operations order (OPORD) of the mission to
the squad leader and MOS’s. When the OPORD completed and all participants were
ready, the researchers began the simulation. One researcher was present in the computer
lab with the infantry squad, while the other researcher was in a different section of the
computer lab, leading the opposition force (OPFOR). During the simulation, the
researcher with the infantry squad froze the scenario and had the participants turn off
their screens four separate times. At each of the four breaks, the researcher then
administered the situation awareness queries. Each set of queries was different, and
given at checkpoints 1, after reacting to an enemy patrol, after killing the patrol, and
during the final battle of the simulation. When all data was collected for the Land
Warrior group, the researchers then repeated the same process for the Non-Land Warrior

SITUATION AWARENESS 11
group without the addition of the heads-up display and technology that the Land Warrior
system provides. Upon collection of all participant data, the researchers then recorded all
scores of each participant group, and prepared the data for statistical analysis.
Results
The main findings of the experiment are displayed in Figures 1 and 2, which show
SA scores for selected SAGAT probe questions for squad leaders (Figure 1) and MOS
queries (Figure 2). The effects of using the Land Warrior system appears to vary with
type of question posed, and also with level of analysis, i.e., squad leader vs. MOS.
Figure 1. Graph comparing significant query results of SL Data.
The mean scores for questions 1, 8, and 13 differed significantly between the
MOS Land Warrior and MOS non-Land Warrior group, t(56) = 3.95, p < .05; t(56) =
3.86, p < .05; and t(56) = 3.86, p < .05 respectively. Question 1 favored the non-Land
0.000
0.500
1.000
1.500
2.000
2.500
3.000
3.500
4.000
4.500
5.000
9 18
Sco
re (
1-5
)
Query Number
Land Warrior
Non-Land Warrior

SITUATION AWARENESS 12
Warrior group, while 8 and 13 favored the Land Warrior group. The mean score for
question 9 for the SL group differed significantly towards the non-Land Warrior group,
t(56) = 4.01, p < .05. Question 18 for the SL group and questions 2 and 5 for the MOS
group all approached significance in favor of the Land Warrior group. (See Figures 1 &
2 for graphs of significant query data.)
Figure 2. Graph comparing significant query results of MOS Data.
Discussion
The results showed that in most cases the SA of those using the Land Warrior and
those not using the Land Warrior was not significantly different. This supports the
researchers’ hypothesis. Four cases showed significance and three others approached
significance. Out of these seven cases, two showed that those not using the Land Warrior
display performed better while the other five showed that the Land Warrior group
performed better. Much debate exists on the potential benefit of the Land Warrior system
0.000 0.500 1.000 1.500 2.000 2.500 3.000 3.500 4.000 4.500
1 2 5 8 13
Score
(1-5
)
Query Number
Land Warrior
Non-Land Warrior

SITUATION AWARENESS 13
in facilitating warfighting, especially among infantry forces (Graham & Matthews, 1999).
The current results indicate that effects – either facilitative or inhibitive – may depend on
echelon and task assessed.
The squad leader group showed that the non-Land Warrior was significantly
better for question 9. This question dealt with the capabilities of the enemy. For the
MOS, question 1 was shown to be significantly better for the non-Land Warrior group.
This question was about the commander’s intent for the mission. What these two cases
do show though is that our idea that too much information given by the system would
overload the soldier may be correct because they did better on these two questions that
dealt with memory in the case of the commanders intent or observation/memory in the
case of the capabilities of the enemy.
The SL group showed that question 18 approached significance in favor of the
Land Warrior group. This question asked for the position of the enemy forces. For the
MOS groups, questions 8 and 13 were significant for the Land Warrior group. These
questions again asked for the positions of the enemy forces. Also, questions 2 and 5
approached significance for the Land Warrior group. These questions referred to their
position and the position of the enemy respectively.
These findings are interesting considering one of the main purposes of the Land
Warrior is to help navigation. These findings suggest that the Land Warrior system
actually does achieve one of its stated purposes of helping with navigation or position
location. This aid to the infantry soldier would be helpful in missions, accountability of
friendly soldiers, and finding the position of enemy soldiers.

SITUATION AWARENESS 14
The other questions showed no significant difference between the Land Warrior
and non Land Warrior group. This is important because if the system does not help a
soldier, the Army should not spend the money to equip units with it, train them on it, and
make them carry the extra weight.
As with any research, there exists the possibility of methodological problems that
may have affected on the outcome of the results. One primary methodological problem
that the researchers noted in the present study was the lack of equal skill level in each
participant with respect to the Delta Force Land Warrior game that the researchers used
to create their simulation. The researchers found that some of these individuals played an
earlier version of the game on a daily basis in addition to experience with the game from
their Military Science class. The unequal skill level created through the use of the Delta
Force simulation might have affected the outcome. The researchers did try to account for
this problem by randomly selecting the groups prior to experimentation, which provided
some balance of the skilled participants. However, they may have accounted for this
problem better by using a simulation that all participants had an equal initial skill level, or
by implementing training sessions with the Delta Force Land Warrior game to bring all
participants to the same skill level. Certainly, evidence exists that skill level or expertise
affects SA, decision-making, and related cognitive processes in tests involving simulated
(Shattuck, et al., 2001) and virtual (Pleban, Eakin, Salter, & Matthews, 2001) exercises.
Given that research in situation awareness metrics for the Land Warrior system is
relatively new, the researchers believe that further studies should be conducted to account
for areas that the present study did not address. The present study only evaluated level
one of situation awareness, an individual’s perception of the surrounding environment.

SITUATION AWARENESS 15
Future studies should consider the possibility of evaluating situation awareness of the
Land Warrior system at levels two and three, comprehension and projection. This would
be consistent with Endsley et al. (2000) who maintain that all three levels of SA must be
assessed to get a complete picture of a soldier or leader’s SA. This may add to the
support found in the present research that indicates there is no difference in situation
awareness, except for position location, when comparing the current system to the Land
Warrior System. Another consideration for future research ought to be focused on
navigation and position location, which the researchers found to be significant. One final
recommendation for future studies is to consider evaluating situation awareness in
individuals equipped with Land Warrior when the technology fails to function. The
researchers believe that it is important to recognize that given any type of advanced
technology, there exists the possibility that the technology may fail. By studying
situation awareness in this sense, not only may the researchers find additional support
that indicates the Land Warrior does not improve situation awareness, but they may also
find results that show negative impact in performance of situation awareness tasks should
an individual lose this technology during a field operation.

SITUATION AWARENESS 16
Notes
1. Mica R. Endsley, assistance given to author, verbal discussion, West Point, NY,
28 Feb 2001. Mica Endsley answered questions and made suggestions about length of
breaks and number of questions to ask during freezes using the SAGAT technique. She
also answered questions about whether our method was good or not.
2. Mike McCloskey, assistance given to author, verbal discussion, West Point,
NY,15 February 2001. Mike McCloskey answered questions and gave advice on using
experts as our measuring stick for the SAGAT queries and thought it was the best way to
go.

SITUATION AWARENESS 17
References
Endsley, M. R. (1995a). Toward a theory of situation awareness in dynamic systems.
Human Factors, 37, 32-64.
Endsley, M. R. (1995b). Measurements of situation awareness in dynamic systems.
Human Factors, 37, 65-84.
Endsley, M. R., & Kaber, D. B. (1999). Level of automation effects on performance,
situation awareness and workload in a dynamic task. Ergonomics, 42, 462-492
Endsley, M. R. (1998) Situation awareness for the individual soldier. In S.E. Graham
and M.D. Matthews (Eds.), Infantry situation awareness: Papers from the 1998
infantry situation awareness workshop (pp. 55-70). Alexandria, VA: U.S. Army
Research Institute for the Behavioral and Social Sciences.
Endsley, M.R., Holder, L. D., Leibrecht, B. C., Garland, D. J., Wampler, R. L., &
Matthews, M. D. (2000) Modeling and measuring situation awareness in the
infantry operational environment (Research Report No. 1753). Alexandria, VA:
US Army Research Institute for the Behavioral and Social Sciences.
Endsley, M.R.. (2001, Feb 28). [Discussion with author]. West Point, NY.
Graham, S. E. & Matthews, M. D., Eds. (1999). Infantry Situation Awareness: Papers
from the 1998 Infantry Situation Awareness Workshop. Alexandria, VA: U.S.
Army Research Institute for Behavioral and Social Sciences.
Hariman, B. O., & Secrist, G. E. (1991). Situational awareness is more than exceptional
vision. Aviation, Space, and Environmental Medicine, November, 1084-1089.
Jacoby, J. (1984). Perspectives on information overload. The Journal of Consumer
Research, 10, 432-435.

SITUATION AWARENESS 18
Kass, S. J., Herschler, D. A., & Companion, M. A. (1991). Training situation awareness
through pattern recognition in a battlefield environment. Military Psychology, 3,
105-112.
Keller, K. L., & Staelin, R. (1989) Assessing biases in measuring decision effectiveness
and information overload. Journal of Consumer Research, 15, 504-508.
Lipowski, Z.J. (1975). Sensory and information inputs overload: behavioral effects.
Comprehensive Psychiatry, 16, 199-221.
Malhotra, N. K., Jain, A. K., & Lagakos, S.W. (1982). The information overload
controversy: an alternative viewpoint. Journal of Marketing, 46, 27-37.
Matthews, M. D., Pleban, R. J., Endsley, M. R., & Strater, L. D. (2000). Measures of
infantry situation awareness for a virtual MOUT environment. Proceedings,
Human Performance, Situation Awareness and Automation: War-Centered
Design for the New Millennium (pp. 262 – 267). Savannah, GA: SA
Technologies, Inc.
McCloskey, M. (2001, Feb 15). [Discussion with author]. West Point, NY
O'Hare, D. (1997). Cognitive ability determinants of elite pilot performance. Human
Factors, 39, 540-552.
Pleban, R. J., Eakin, D. E., Salter, M., & Matthews, M. D. (2001). Training and
assessment of decision-making skills in virtual environments (Research Report
#1767). Alexandria, VA: U.S. Army Research Institute for the Behavioral and
Social Sciences.
Radar, Martha H. (1981). Dealing with information overload. Personal Journal, 373-
375.

SITUATION AWARENESS 19
Shattuck, L., Graham, J., Merlo, J., & Hah, S. (2000). Cognitive integration: An
investigation of how expert and novice commanders process battlefield data. In
Proceedings of the Fourth Annual Federated Lab Symposium on Advanced
Displays and interactive Displays (pp. 109 – 113). Adelphi, MD: Army Research
Laboratory.
Shattuck, L., Merlo, J., & Graham, J. (2001). Cognitive integration: Exploring
performance differences across varying types of military operations. Proceeding,
Advanced Display & Interactive Displays Consortium, 199 – 204.
Strater, L. D., Endsley, M. R., Pleban, R.J., & Matthews, M. D. (2001) Measures of
platoon leader situation awareness in virtual decision-making exercises.
(Research Report #1770). Alexandria, VA: US Army Research Institute for the
Behavioral and Social Sciences. Unpublished.
Vidulich, M. A., Stratton, M., Crabtree, M., & Wilson, G. (1994). Performance-based
and physiological measures of situational awareness. Aviation, Space, and
Environmental Medicine, A7-A12.
Yeh, M., Merlo, J. L., & Wickens, C.D. (2001). Examining the clutter-scan tradeoff with
high clutter imagery: A comparison of helmet-mounted versus hand-held display
presentation. Proceedings, Advanced Display & Interactive Displays
Consortium, 29 - 33.

SITUATION AWARENESS 20
Appendix A
P Value and Mean Matrix For Squad Leader Data
QUERY 1 2 3 4 5 6 7 8
LW:Mean 4.000 3.860 5.000 4.714 4.290 4.286 3.290 3.857
NLW:
Mean 4.000 3.290 4.857 5.000 3.860 4.143 4.000 3.714
p value 1.000 0.484 N/A N/A 0.477 0.718 0.261 0.552
QUERY 9 10 11 12 13 14 15 16
LW:Mean 3.430 5.000 4.714 4.429 4.857 5.000 4.429 3.710
NLW:
Mean 4.571 4.857 4.571 4.714 4.714 4.428 4.571 4.000
p value 0.049 N/A 0.735 0.430 0.552 N/A 0.698 0.646
QUERY 17 18 19 20
LW:Mean 3.286 4.429 3.710 4.286
NLW:
Mean 3.571 3.570 4.290 3.710
p value 0.430 0.183 0.410 0.410
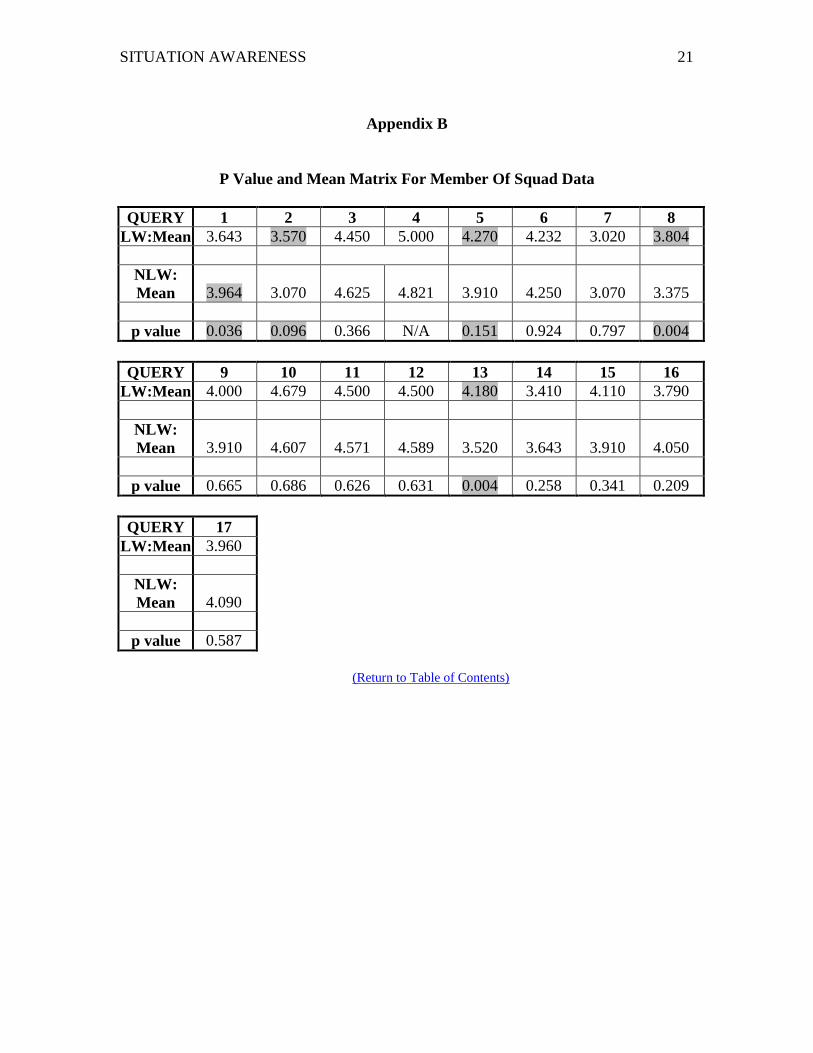
SITUATION AWARENESS 21
Appendix B
P Value and Mean Matrix For Member Of Squad Data
QUERY 1 2 3 4 5 6 7 8
LW:Mean 3.643 3.570 4.450 5.000 4.270 4.232 3.020 3.804
NLW:
Mean 3.964 3.070 4.625 4.821 3.910 4.250 3.070 3.375
p value 0.036 0.096 0.366 N/A 0.151 0.924 0.797 0.004
QUERY 9 10 11 12 13 14 15 16
LW:Mean 4.000 4.679 4.500 4.500 4.180 3.410 4.110 3.790
NLW:
Mean 3.910 4.607 4.571 4.589 3.520 3.643 3.910 4.050
p value 0.665 0.686 0.626 0.631 0.004 0.258 0.341 0.209
QUERY 17
LW:Mean 3.960
NLW:
Mean 4.090
p value 0.587
(Return to Table of Contents)


