6 Manufacturing - CAM/CNC, Hand Finishing and Quality Assurance 8 & 9
7 Final Design 10
CONTENTS
Research and Development 1
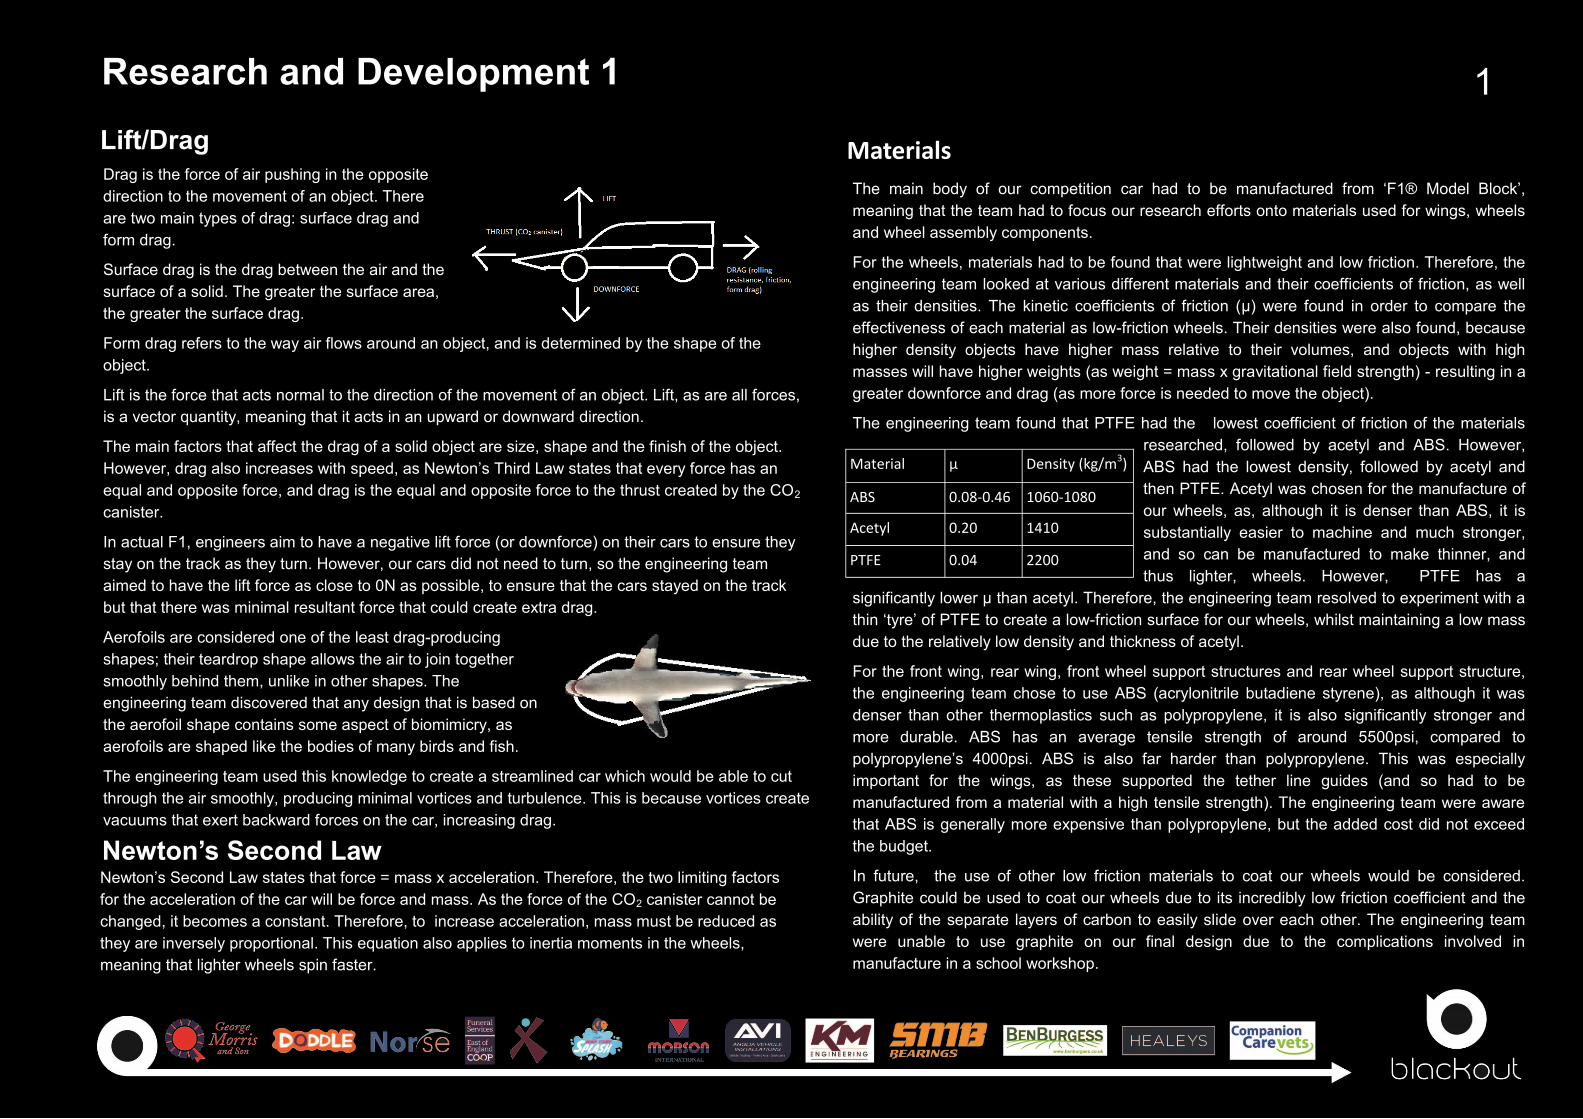
Drag is the force of air pushing in the opposite
direction to the movement of an object. There
are two main types of drag: surface drag and
form drag.
Surface drag is the drag between the air and the
surface of a solid. The greater the surface area,
the greater the surface drag.
Form drag refers to the way air flows around an object, and is determined by the shape of the
object.
Lift is the force that acts normal to the direction of the movement of an object. Lift, as are all forces,
is a vector quantity, meaning that it acts in an upward or downward direction.
The main factors that affect the drag of a solid object are size, shape and the finish of the object.
However, drag also increases with speed, as Newton’s Third Law states that every force has an
equal and opposite force, and drag is the equal and opposite force to the thrust created by the CO2
canister.
In actual F1, engineers aim to have a negative lift force (or downforce) on their cars to ensure they
stay on the track as they turn. However, our cars did not need to turn, so the engineering team
aimed to have the lift force as close to 0N as possible, to ensure that the cars stayed on the track
but that there was minimal resultant force that could create extra drag.
Aerofoils are considered one of the least drag-producing
shapes; their teardrop shape allows the air to join together
smoothly behind them, unlike in other shapes. The
engineering team discovered that any design that is based on
the aerofoil shape contains some aspect of biomimicry, as
aerofoils are shaped like the bodies of many birds and fish.
The engineering team used this knowledge to create a streamlined car which would be able to cut
through the air smoothly, producing minimal vortices and turbulence. This is because vortices create
vacuums that exert backward forces on the car, increasing drag.
Lift/Drag Materials
The main body of our competition car had to be manufactured from ‘F1® Model Block’,
meaning that the team had to focus our research efforts onto materials used for wings, wheels
and wheel assembly components.
For the wheels, materials had to be found that were lightweight and low friction. Therefore, the
engineering team looked at various different materials and their coefficients of friction, as well
as their densities. The kinetic coefficients of friction (μ) were found in order to compare the
effectiveness of each material as low-friction wheels. Their densities were also found, because
higher density objects have higher mass relative to their volumes, and objects with high
masses will have higher weights (as weight = mass x gravitational field strength) - resulting in a
greater downforce and drag (as more force is needed to move the object).
The engineering team found that PTFE had the lowest coefficient of friction of the materials
researched, followed by acetyl and ABS. However,
ABS had the lowest density, followed by acetyl and
then PTFE. Acetyl was chosen for the manufacture of
our wheels, as, although it is denser than ABS, it is
substantially easier to machine and much stronger,
and so can be manufactured to make thinner, and
thus lighter, wheels. However, PTFE has a
significantly lower μ than acetyl. Therefore, the engineering team resolved to experiment with a
thin ‘tyre’ of PTFE to create a low-friction surface for our wheels, whilst maintaining a low mass
due to the relatively low density and thickness of acetyl.
For the front wing, rear wing, front wheel support structures and rear wheel support structure,
the engineering team chose to use ABS (acrylonitrile butadiene styrene), as although it was
denser than other thermoplastics such as polypropylene, it is also significantly stronger and
more durable. ABS has an average tensile strength of around 5500psi, compared to
polypropylene’s 4000psi. ABS is also far harder than polypropylene. This was especially
important for the wings, as these supported the tether line guides (and so had to be
manufactured from a material with a high tensile strength). The engineering team were aware
that ABS is generally more expensive than polypropylene, but the added cost did not exceed
the budget.
In future, the use of other low friction materials to coat our wheels would be considered.
Graphite could be used to coat our wheels due to its incredibly low friction coefficient and the
ability of the separate layers of carbon to easily slide over each other. The engineering team
were unable to use graphite on our final design due to the complications involved in
manufacture in a school workshop.
Material μ Density (kg/m3)
ABS 0.08-0.46 1060-1080
Acetyl 0.20 1410
PTFE 0.04 2200
Newton’s Second Law Newton’s Second Law states that force = mass x acceleration. Therefore, the two limiting factors
for the acceleration of the car will be force and mass. As the force of the CO2 canister cannot be
changed, it becomes a constant. Therefore, to increase acceleration, mass must be reduced as
they are inversely proportional. This equation also applies to inertia moments in the wheels,
meaning that lighter wheels spin faster.
1
Research and Development 2
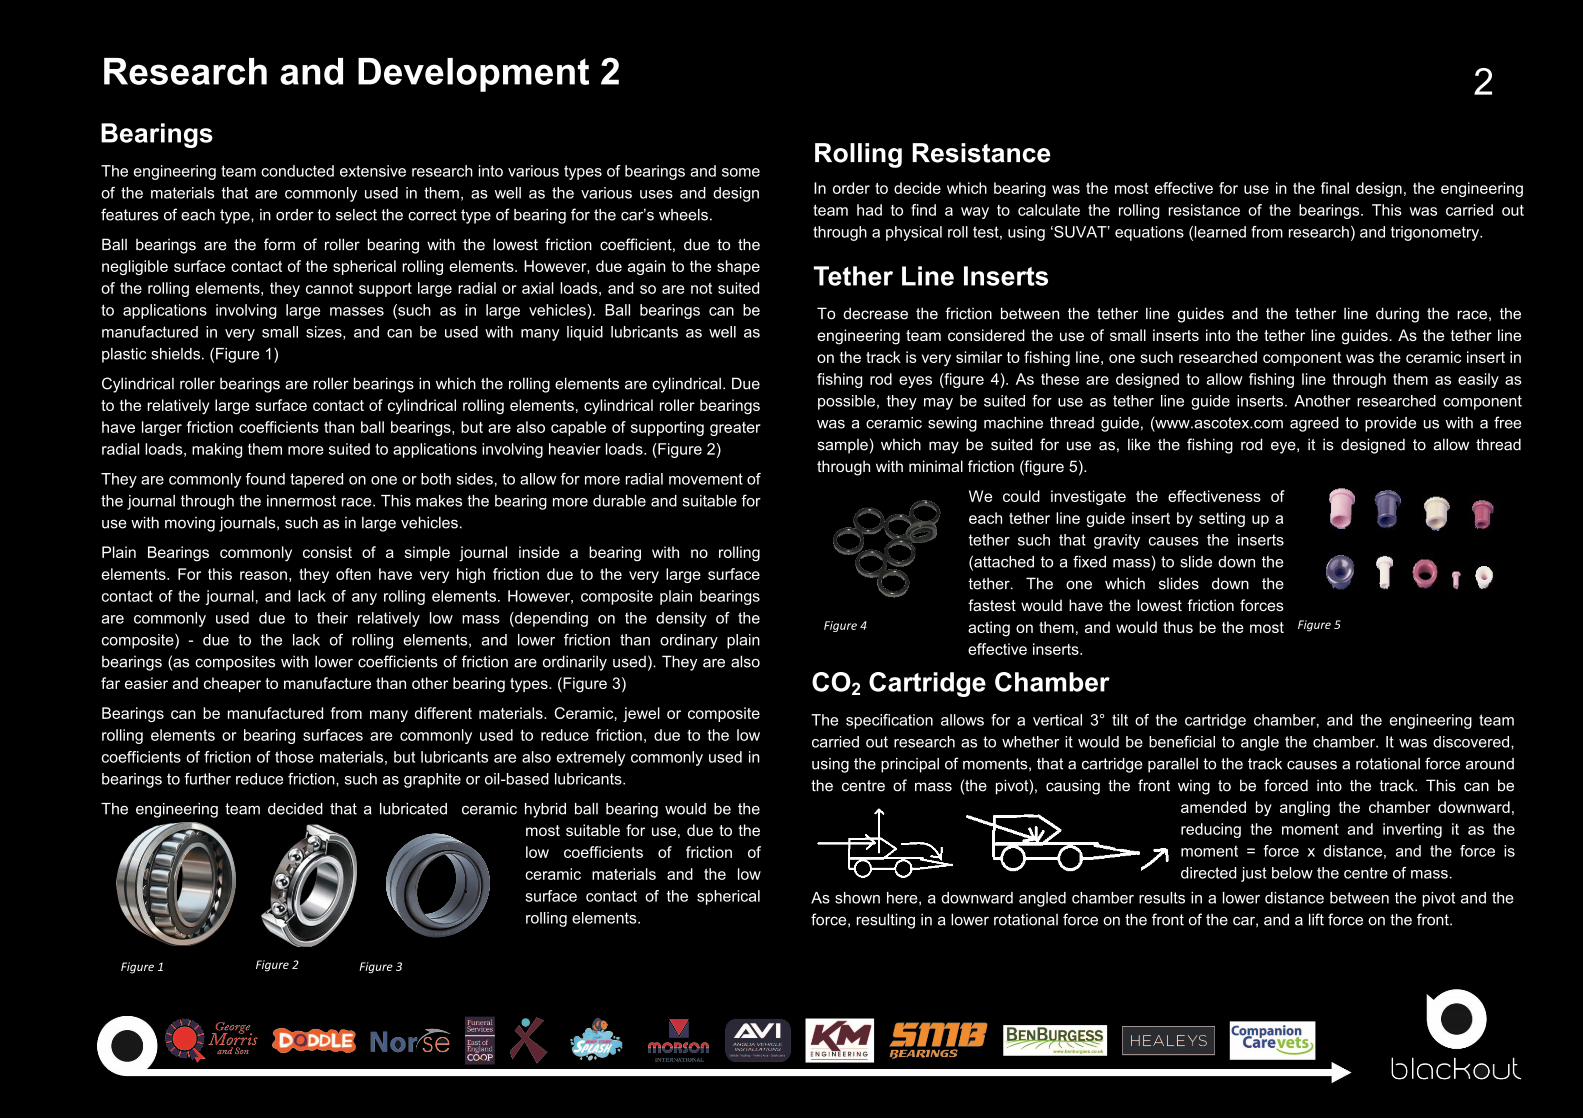
The engineering team conducted extensive research into various types of bearings and some
of the materials that are commonly used in them, as well as the various uses and design
features of each type, in order to select the correct type of bearing for the car’s wheels.
Ball bearings are the form of roller bearing with the lowest friction coefficient, due to the
negligible surface contact of the spherical rolling elements. However, due again to the shape
of the rolling elements, they cannot support large radial or axial loads, and so are not suited
to applications involving large masses (such as in large vehicles). Ball bearings can be
manufactured in very small sizes, and can be used with many liquid lubricants as well as
plastic shields. (Figure 1)
Cylindrical roller bearings are roller bearings in which the rolling elements are cylindrical. Due
to the relatively large surface contact of cylindrical rolling elements, cylindrical roller bearings
have larger friction coefficients than ball bearings, but are also capable of supporting greater
radial loads, making them more suited to applications involving heavier loads. (Figure 2)
They are commonly found tapered on one or both sides, to allow for more radial movement of
the journal through the innermost race. This makes the bearing more durable and suitable for
use with moving journals, such as in large vehicles.
Plain Bearings commonly consist of a simple journal inside a bearing with no rolling
elements. For this reason, they often have very high friction due to the very large surface
contact of the journal, and lack of any rolling elements. However, composite plain bearings
are commonly used due to their relatively low mass (depending on the density of the
composite) - due to the lack of rolling elements, and lower friction than ordinary plain
bearings (as composites with lower coefficients of friction are ordinarily used). They are also
far easier and cheaper to manufacture than other bearing types. (Figure 3)
Bearings can be manufactured from many different materials. Ceramic, jewel or composite
rolling elements or bearing surfaces are commonly used to reduce friction, due to the low
coefficients of friction of those materials, but lubricants are also extremely commonly used in
bearings to further reduce friction, such as graphite or oil-based lubricants.
The engineering team decided that a lubricated ceramic hybrid ball bearing would be the
most suitable for use, due to the
low coefficients of friction of
ceramic materials and the low
surface contact of the spherical
rolling elements.
Bearings
Tether Line Inserts
Rolling Resistance
To decrease the friction between the tether line guides and the tether line during the race, the
engineering team considered the use of small inserts into the tether line guides. As the tether line
on the track is very similar to fishing line, one such researched component was the ceramic insert in
fishing rod eyes (figure 4). As these are designed to allow fishing line through them as easily as
possible, they may be suited for use as tether line guide inserts. Another researched component
was a ceramic sewing machine thread guide, (www.ascotex.com agreed to provide us with a free
sample) which may be suited for use as, like the fishing rod eye, it is designed to allow thread
through with minimal friction (figure 5).
We could investigate the effectiveness of
each tether line guide insert by setting up a
tether such that gravity causes the inserts
(attached to a fixed mass) to slide down the
tether. The one which slides down the
fastest would have the lowest friction forces
acting on them, and would thus be the most
effective inserts.
Figure 5 Figure 4
Figure 2 Figure 3 Figure 1
In order to decide which bearing was the most effective for use in the final design, the engineering
team had to find a way to calculate the rolling resistance of the bearings. This was carried out
through a physical roll test, using ‘SUVAT’ equations (learned from research) and trigonometry.
CO2 Cartridge Chamber
The specification allows for a vertical 3° tilt of the cartridge chamber, and the engineering team
carried out research as to whether it would be beneficial to angle the chamber. It was discovered,
using the principal of moments, that a cartridge parallel to the track causes a rotational force around
the centre of mass (the pivot), causing the front wing to be forced into the track. This can be
amended by angling the chamber downward,
reducing the moment and inverting it as the
moment = force x distance, and the force is
directed just below the centre of mass.
As shown here, a downward angled chamber results in a lower distance between the pivot and the
force, resulting in a lower rotational force on the front of the car, and a lift force on the front.
2
Design Concepts 3
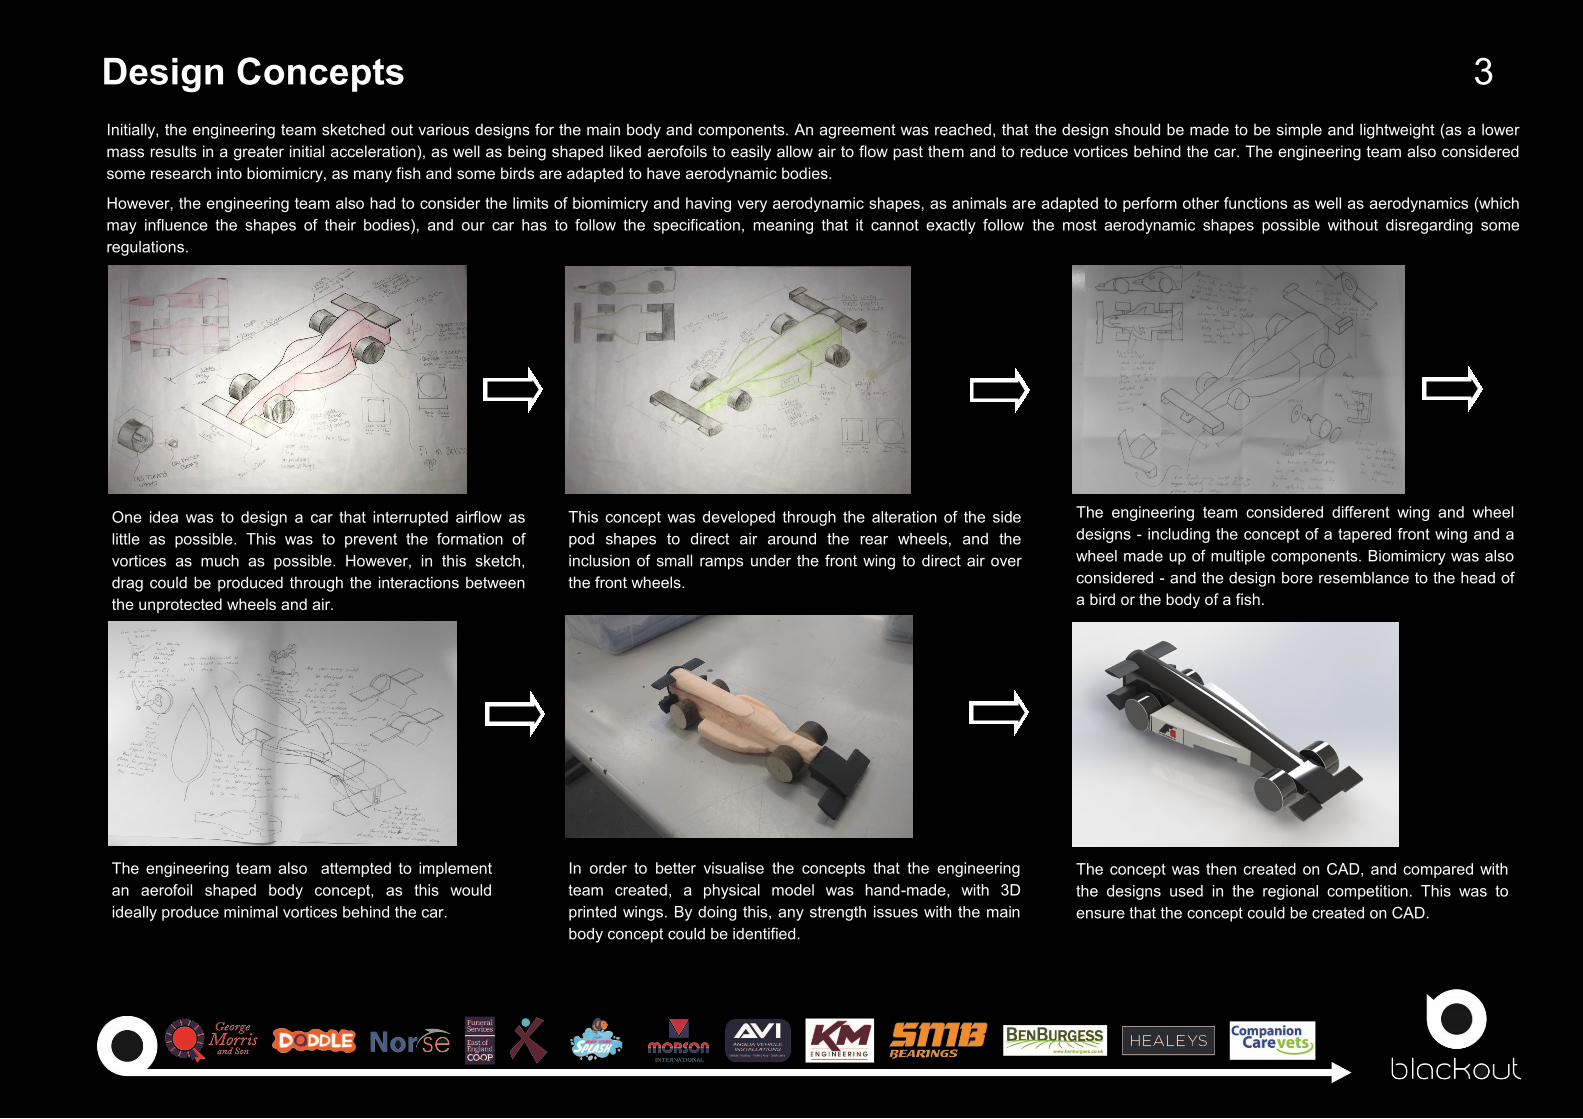
Initially, the engineering team sketched out various designs for the main body and components. An agreement was reached, that the design should be made to be simple and lightweight (as a lower
mass results in a greater initial acceleration), as well as being shaped liked aerofoils to easily allow air to flow past them and to reduce vortices behind the car. The engineering team also considered
some research into biomimicry, as many fish and some birds are adapted to have aerodynamic bodies.
However, the engineering team also had to consider the limits of biomimicry and having very aerodynamic shapes, as animals are adapted to perform other functions as well as aerodynamics (which
may influence the shapes of their bodies), and our car has to follow the specification, meaning that it cannot exactly follow the most aerodynamic shapes possible without disregarding some
regulations.
One idea was to design a car that interrupted airflow as
little as possible. This was to prevent the formation of
vortices as much as possible. However, in this sketch,
drag could be produced through the interactions between
the unprotected wheels and air.
This concept was developed through the alteration of the side
pod shapes to direct air around the rear wheels, and the
inclusion of small ramps under the front wing to direct air over
the front wheels.
The engineering team considered different wing and wheel
designs - including the concept of a tapered front wing and a
wheel made up of multiple components. Biomimicry was also
considered - and the design bore resemblance to the head of
a bird or the body of a fish.
The engineering team also attempted to implement
an aerofoil shaped body concept, as this would
ideally produce minimal vortices behind the car.
In order to better visualise the concepts that the engineering
team created, a physical model was hand-made, with 3D
printed wings. By doing this, any strength issues with the main
body concept could be identified.
The concept was then created on CAD, and compared with
the designs used in the regional competition. This was to
ensure that the concept could be created on CAD.
Design Development 1 - 3D Modelling and Computer Aided Analysis 4
Our team, Blackout Racing, was formed from the merging between the teams
Lightspeed Racing and Blackout Racing. Before the engineering team could fully
develop a new car design for the national final, the strengths and weaknesses of our
regional final cars had to be evaluated. To do this, the engineering team analysed their
performances on the track.
Lift/Drag and Flow Trajectories/Surface Plots
In the first two races, Lightspeed had the fastest
car. However, Blackout won the next two races
as Lightspeed did not finish the final races with
its car Intact. Three of the wheels and the rear
wing detached during the race. This was due to a
combination of factors: the height of the tether line
guide, the shape and size of the axle, and the
contact surface between the rear wing and the
main body. The tether line guides were very high
above the track surface - relative to the tether line - meaning that there was high friction on
the tether line guide and high strain on the rear wing, which supported it. This not only
slowed the car down, but increased the force on the rear wing, which was only fixed to the
car over a small surface area. This small surface area resulted in the combined strength of
the adhesive not being strong enough to hold the rear wing in place, so it detached under
the strain of the tether line guide. Blackout, on the other hand, had a very large surface
contact area between the rear wing and the main body, and so the wing did not detach
during the race.
Car Lightspeed Blackout
Time 1 (s) 1.248 1.250
Time 2 (s) 1.218 1.222
Time 3 (s) DNF 1.211
Time 4 (s) DNF 1.222
Track Performance Evaluation
Prototype CAD and Physical Modelling
Both cars had relatively high drag values from the computer
aided analysis, and
the surface plots and
flow trajectories
showed high frontal
pressure. However,
the vortices behind each car were relatively small. To improve
on these cars, the engineering team were aware that the
frontal pressure needed to be greatly reduced, and that the
vortices needed to be further reduced. This could be done by
reducing the frontal surface area of the front wing and reducing the cross-sectional area of
the cars.
Car Lightspeed Blackout
Lift (p) -11.248 -8.978
Drag (p) 46.798 47.236
A B C D Car
39.13 41.86 39.78 44.25 Drag (p)
1.59 10.41 6.00 3.54 Downforce (p)
Car A Car C Car B Car D
The engineering team then chose to develop these designs and create four prototypes for our national
final design. In each prototype, our regional finals designs were improved on in a different way. This
was done because although computer aided analysis is important, it does not provide as much
information regarding the car’s potential track performance as testing the car on the track.
The engineering team then manufactured these prototypes to test them against each other on the
track, in order to see which prototype was the most effective. All four cars were to be manufactured
completely, with the exception of paint and decals, but would all be brought to the same mass
(50.00g) in order to ensure that the aerodynamics of the cars were the only variables to be tested.
The fastest car would then be further refined to make it as aerodynamic and specification compliant
as possible, and then manufactured.
Car A Car C Car B Car D
Flow tests were conducted on the four
prototype designs, and from these flow tests it
was found that car A had the lowest drag,
downforce, frontal pressure and vortex size.
Therefore, it was predicted to be the fastest on
the track.
Testing - Physical Testing 5
Track Testing
Roll Testing
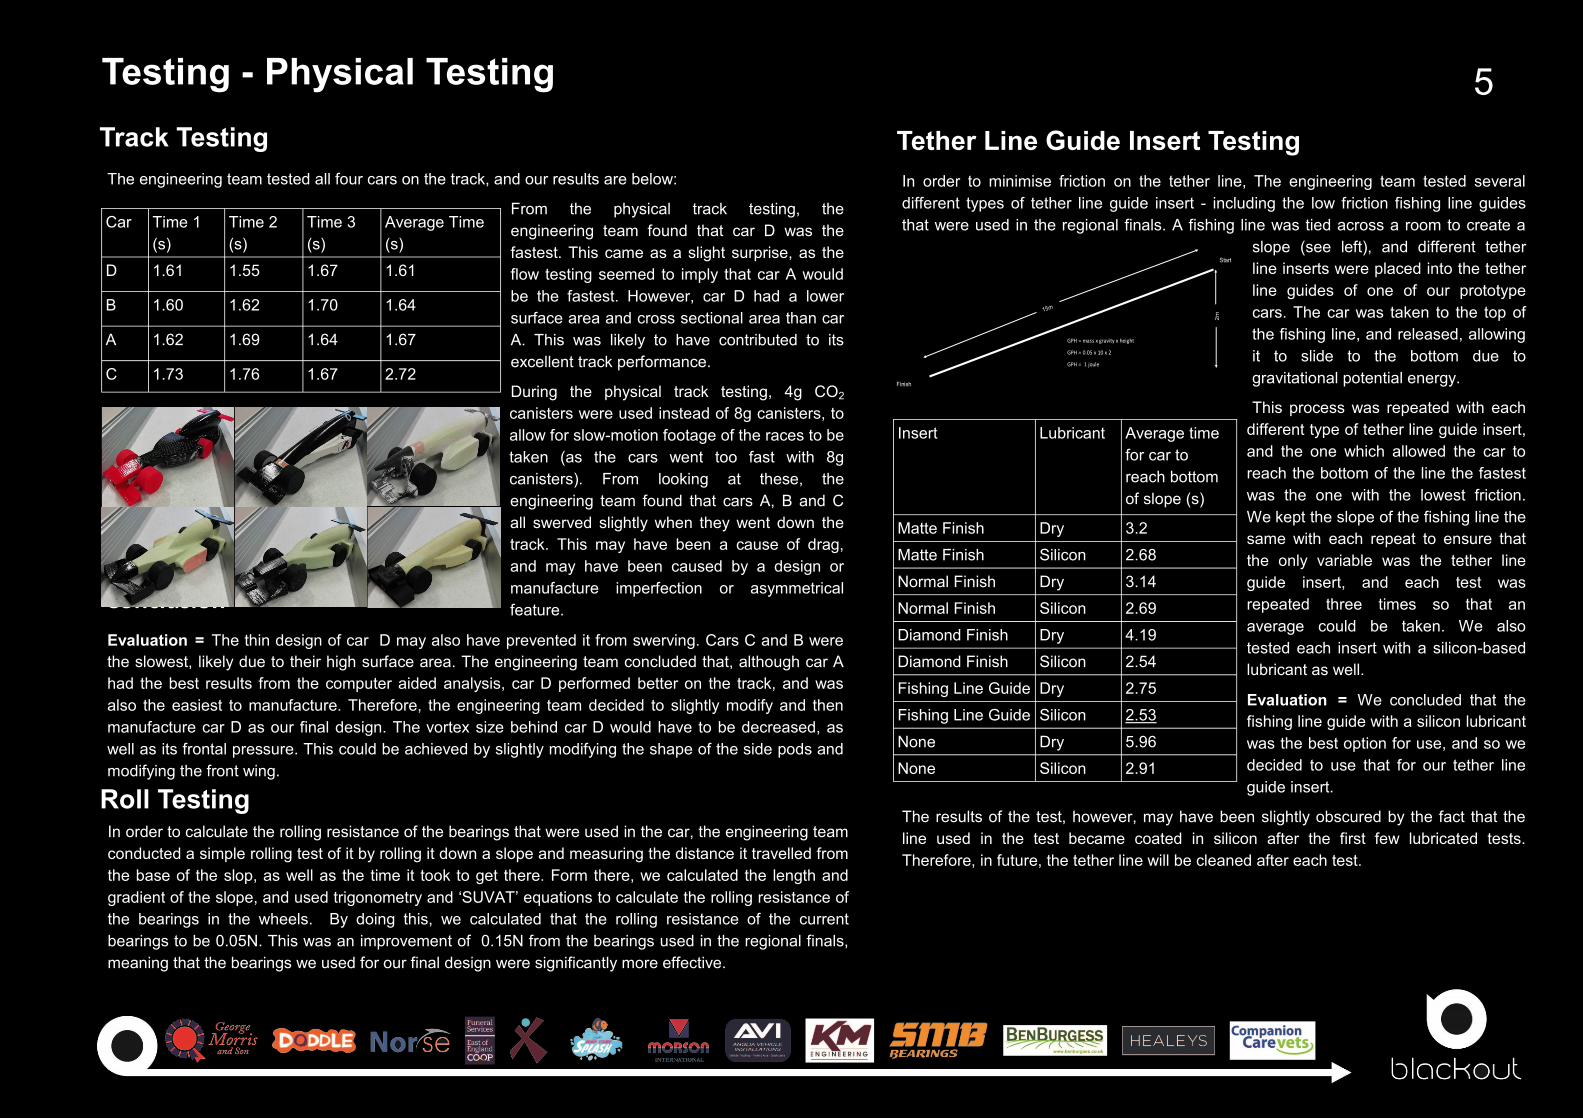
The engineering team tested all four cars on the track, and our results are below:
From the physical track testing, the
engineering team found that car D was the
fastest. This came as a slight surprise, as the
flow testing seemed to imply that car A would
be the fastest. However, car D had a lower
surface area and cross sectional area than car
A. This was likely to have contributed to its
excellent track performance.
During the physical track testing, 4g CO2
canisters were used instead of 8g canisters, to
allow for slow-motion footage of the races to be
taken (as the cars went too fast with 8g
canisters). From looking at these, the
engineering team found that cars A, B and C
all swerved slightly when they went down the
track. This may have been a cause of drag,
and may have been caused by a design or
manufacture imperfection or asymmetrical
feature.
Evaluation = The thin design of car D may also have prevented it from swerving. Cars C and B were
the slowest, likely due to their high surface area. The engineering team concluded that, although car A
had the best results from the computer aided analysis, car D performed better on the track, and was
also the easiest to manufacture. Therefore, the engineering team decided to slightly modify and then
manufacture car D as our final design. The vortex size behind car D would have to be decreased, as
well as its frontal pressure. This could be achieved by slightly modifying the shape of the side pods and
modifying the front wing.
Car Time 1
(s)
Time 2
(s)
Time 3
(s)
Average Time
(s)
D 1.61 1.55 1.67 1.61
B 1.60 1.62 1.70 1.64
A 1.62 1.69 1.64 1.67
C 1.73 1.76 1.67 2.72
In order to minimise friction on the tether line, The engineering team tested several
different types of tether line guide insert - including the low friction fishing line guides
that were used in the regional finals. A fishing line was tied across a room to create a
slope (see left), and different tether
line inserts were placed into the tether
line guides of one of our prototype
cars. The car was taken to the top of
the fishing line, and released, allowing
it to slide to the bottom due to
gravitational potential energy.
This process was repeated with each
different type of tether line guide insert,
and the one which allowed the car to
reach the bottom of the line the fastest
was the one with the lowest friction.
We kept the slope of the fishing line the
same with each repeat to ensure that
the only variable was the tether line
guide insert, and each test was
repeated three times so that an
average could be taken. We also
tested each insert with a silicon-based
lubricant as well.
Evaluation = We concluded that the
fishing line guide with a silicon lubricant
was the best option for use, and so we
decided to use that for our tether line
guide insert.
The results of the test, however, may have been slightly obscured by the fact that the
line used in the test became coated in silicon after the first few lubricated tests.
Therefore, in future, the tether line will be cleaned after each test.
Tether Line Guide Insert Testing
Insert Lubricant Average time
for car to
reach bottom
of slope (s)
Matte Finish Dry 3.2
Matte Finish Silicon 2.68
Normal Finish Dry 3.14
Normal Finish Silicon 2.69
Diamond Finish Dry 4.19
Diamond Finish Silicon 2.54
Fishing Line Guide Dry 2.75
Fishing Line Guide Silicon 2.53
None Dry 5.96
None Silicon 2.91
In order to calculate the rolling resistance of the bearings that were used in the car, the engineering team
conducted a simple rolling test of it by rolling it down a slope and measuring the distance it travelled from
the base of the slop, as well as the time it took to get there. Form there, we calculated the length and
gradient of the slope, and used trigonometry and ‘SUVAT’ equations to calculate the rolling resistance of
the bearings in the wheels. By doing this, we calculated that the rolling resistance of the current
bearings to be 0.05N. This was an improvement of 0.15N from the bearings used in the regional finals,
meaning that the bearings we used for our final design were significantly more effective.
Conclusion
Start
Finish
15m
2m
PH mass x gravity x height
PH 0.05 x 10 x 2
PH 1 oule
Testing 3 - Further Computational Fluid Dynamics
One issue that did arise, however, was found through the use of
flow trajectories by the rear side pod. These showed an area of
turbulence, which may have increased the drag of our car. This
turbulence was caused by air being driven out of the gap between
the rear wheel and side pod by the movement of the car and
rotation of the wheel. To amend this in future, the engineering team
would have to alter the shape of the side pod and cartridge
chamber slightly to prevent the air from becoming turbulent and to ensure that air is being
correctly directed to behind the car.
The front wing was designed to have slots to allow for easy airflow through it, to minimise
impact on airflow around the car. The engineering team conducted flow tests on it with the
rest of the car in comparison with the front wing without slots, and the conclusion was
reached that it reduced impact to air flow, but also reduced frontal pressure and downforce.
The drag value was reduced by 3.2p, and the lift value change was negligible.
Evaluation = The engineering team believe that our car’s flow tests were very successful, in
that it was discovered that, with the help of testing and research, the engineering team were
able to greatly improve our car design from the regional competition design, to the four
modelling prototypes, to our national competition final design. The computer aided analyses
that were carried out throughout the designing process have greatly assisted in the
development of the final design, as the engineering team were able to identify issues, such as
wings with high frontal pressure or large vortices behind the car, which then allowed them to
improve the design. In future, the performance of our final design on the track at the
competition will also be analysed (as the engineering team had done with the regional
competition designs), and carry out further research to ensure future designs continue to
improve on their predecessors. However, the engineering team realised the importance of
conducting physical tests as well as computational analysis, as physical testing is far more
likely to provide accurate information about the track performance of the cars than
computational testing, as previously mentioned.
6
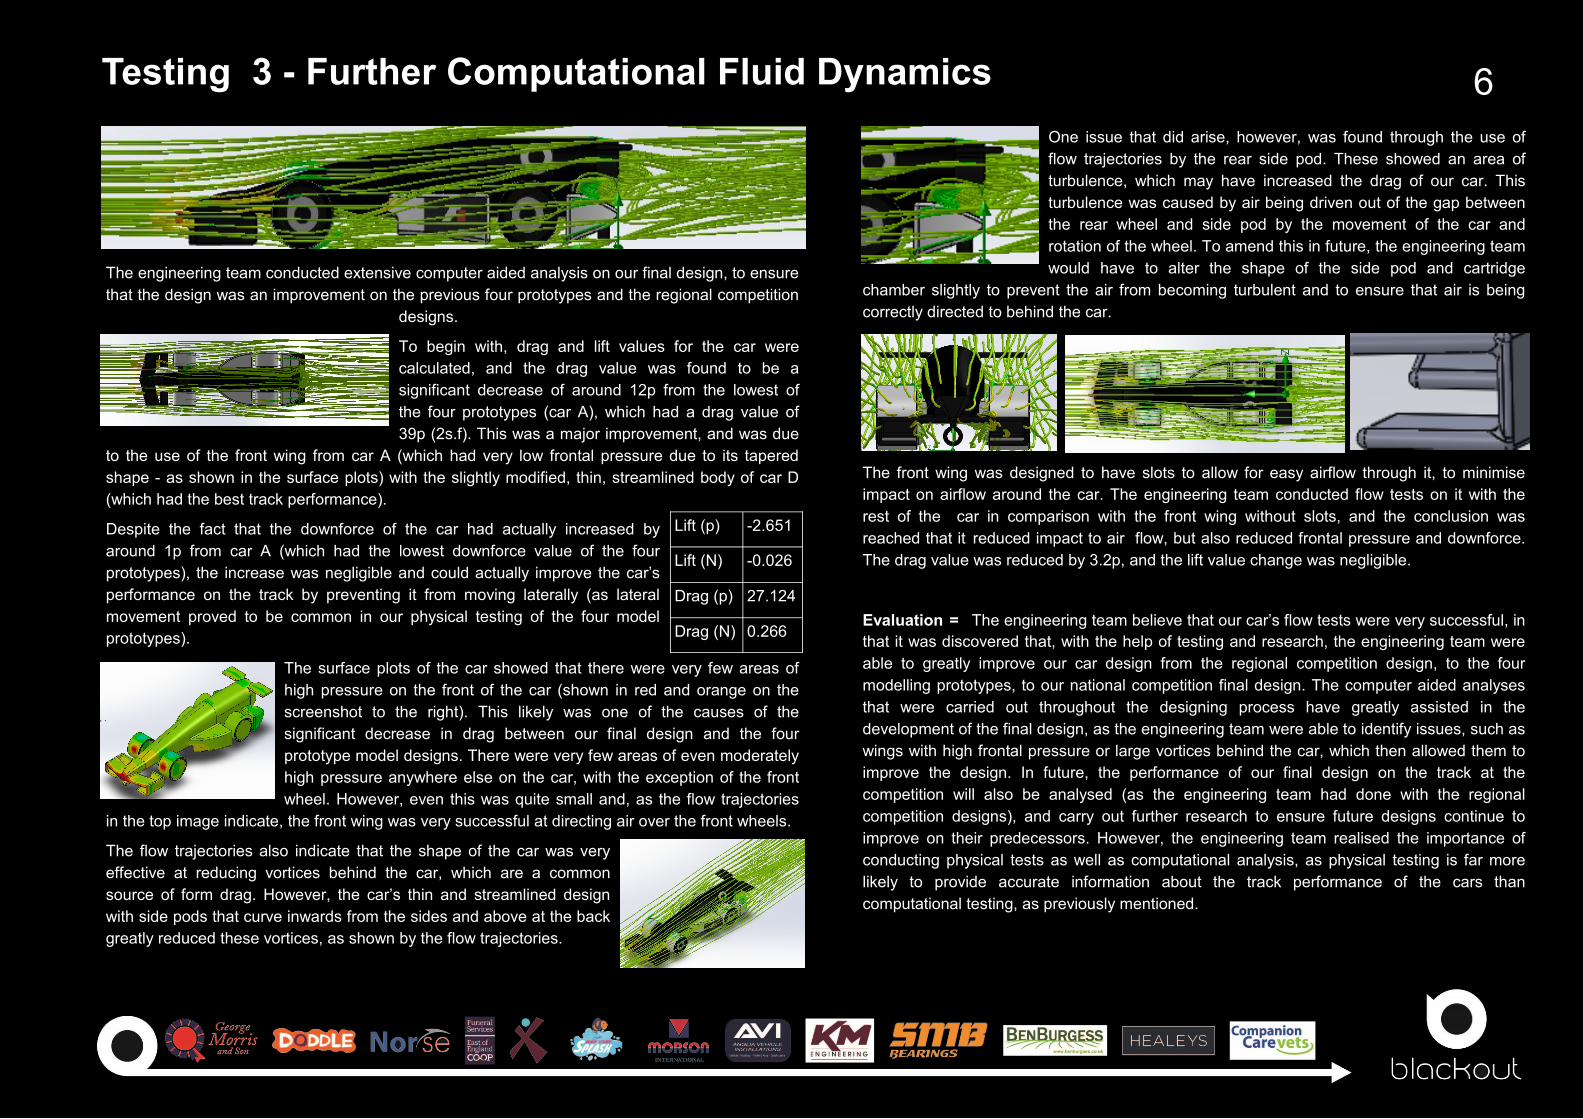
The engineering team conducted extensive computer aided analysis on our final design, to ensure
that the design was an improvement on the previous four prototypes and the regional competition
designs.
To begin with, drag and lift values for the car were
calculated, and the drag value was found to be a
significant decrease of around 12p from the lowest of
the four prototypes (car A), which had a drag value of
39p (2s.f). This was a major improvement, and was due
to the use of the front wing from car A (which had very low frontal pressure due to its tapered
shape - as shown in the surface plots) with the slightly modified, thin, streamlined body of car D
(which had the best track performance).
Despite the fact that the downforce of the car had actually increased by
around 1p from car A (which had the lowest downforce value of the four
prototypes), the increase was negligible and could actually improve the car’s
performance on the track by preventing it from moving laterally (as lateral
movement proved to be common in our physical testing of the four model
prototypes).
The surface plots of the car showed that there were very few areas of
high pressure on the front of the car (shown in red and orange on the
screenshot to the right). This likely was one of the causes of the
significant decrease in drag between our final design and the four
prototype model designs. There were very few areas of even moderately
high pressure anywhere else on the car, with the exception of the front
wheel. However, even this was quite small and, as the flow trajectories
in the top image indicate, the front wing was very successful at directing air over the front wheels.
The flow trajectories also indicate that the shape of the car was very
effective at reducing vortices behind the car, which are a common
source of form drag. However, the car’s thin and streamlined design
with side pods that curve inwards from the sides and above at the back
greatly reduced these vortices, as shown by the flow trajectories.
Lift (p) -2.651
Lift (N) -0.026
Drag (p) 27.124
Drag (N) 0.266
Design Development 2 —Further 3D Modelling and Modifications 7
Main Body
Car D was the most successful of the four prototypes during the physical
the track testing, so the engineering team chose to modify it slightly, and
use its main body for our final design. This also included an angled CO2
cartridge chamber, because research showed that this would prevent the
front wing from making contact with the track surface. The shapes of the
rear side pods were adapted to reduce vortices behind the car, as proved
effective by flow tests. Small slopes were also added to the underside of
the side pods to direct air into the bottom of the wheels rather than the
sides in order to further reduce drag.
The car was designed to a tolerance of +1mm and –0mm, in order to account for
coats of paint and lacquer. This is because, in the regional competition, regulations
were broken during to the increase of dimensions brought about by finish coats.
The main body design was centred around the CO2 cartridge chamber, so that it
could be angled by creating an angled reference plane and extruding a cylinder from
it. The shape of the continued cartridge chamber was then lofted from the front face
of the angled cylinder. The angled chamber was then cut out, and the two side pods
were extruded from the vertical reference plane. They were
then cut into shape from the horizontal plane. The side pods
were then filleted, and a protruding section was added to the front of the
car to make a stronger attachment to the front wing.
Finally, the half - car was mirrored, to ensure the design was symmetrical
and to prevent lateral movement on the track.
Wings The engineering team chose to use the front wing from car A in our final design, because our
surface plots and flow trajectories showed that it was the most effective at directing air over
the front wheels (below left). It also had the lowest frontal pressure and surface area, and
slots for air to flow through to reduce impact on air flow. When first manufactured, prototype
car A had a large mass, due to the very large rear wing. Therefore, the engineering team
resolved to reduce the size of the rear wing to that of car B, to reduce the mass of the car (but
also improve the form aerodynamics of the rear of the car). The wing designs had to be at
least 1.5mm thick at every point, as the 3D printer was later found to be unable to print
anything thinner that would remain intact.
Wheel Support Structure
Evaluation
The engineering team created a strong and innovative design for our wheel support
structures, involving 3 parts: a small plank, a disk and a stiff axle.
These parts would all be 3D printed from ABS and then attached together to create a wheel
support structure that would fit into a groove on the underside of the main body, without
obstructing airflow underneath the car. The disks served to prevent air from entering the
hollow wheels, while also providing support for the axles. Wheel Assembly
The engineering team believe that, using the results from the physical tests and
computational fluid dynamics, as well as research, appropriate modifications and
improvements were made to the prototypes to create a fast and effective final design. In
future, further research and testing will be carried out to inspire more modifications to make
future designs even more so.
The engineering team chose to create the wheel assembly in three sections: a
plate, a wheel and a tyre. This design was chosen as it creates a wheel that is
both lightweight an low-friction. It was also compliant with the specification in
that the PTFE tyre has a continuous surface but still provides the advantages of
a low coefficient of friction whilst supported by a lightweight and rigid acetyl
structure. This, ideally, would produce a lightweight wheel, which, as found
through research, has low inertia and spins quickly.
We also considered the
dimensional constraints of the
model block to ensure that the
milling machine could cut out the
design.
Manufacturing 1 - CAD/CAM & Quality Assurance 8
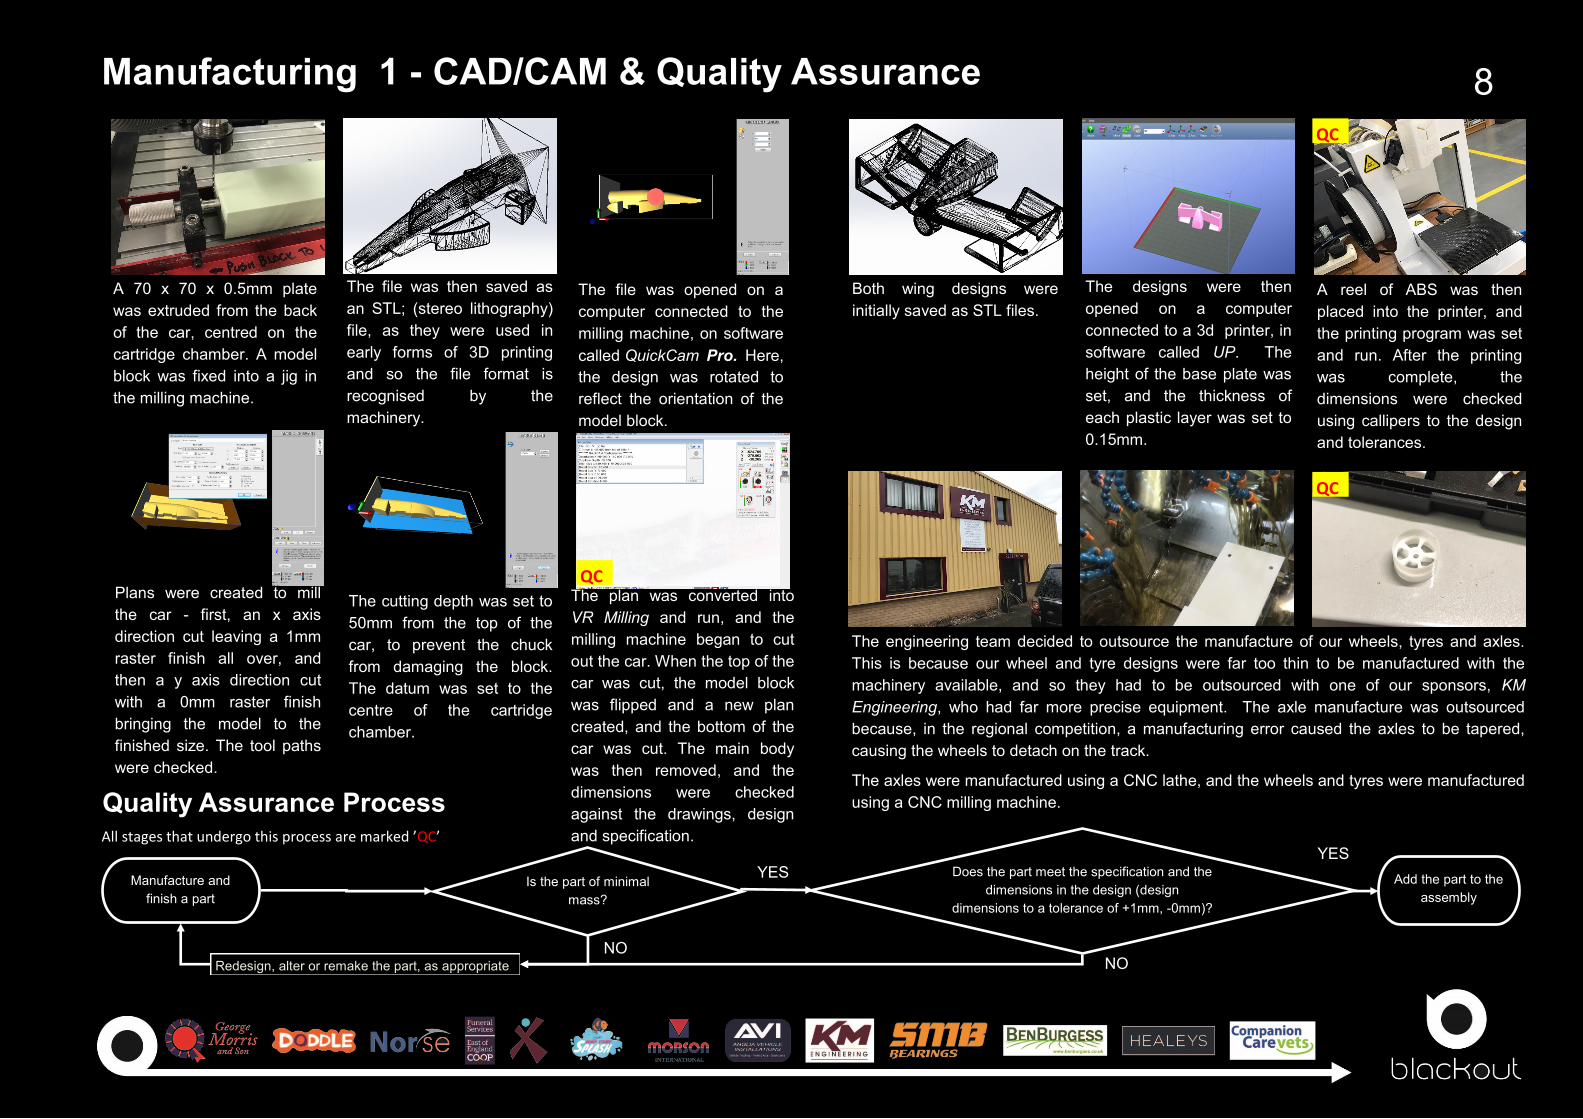
A 70 x 70 x 0.5mm plate
was extruded from the back
of the car, centred on the
cartridge chamber. A model
block was fixed into a jig in
the milling machine.
The file was then saved as
an STL; (stereo lithography)
file, as they were used in
early forms of 3D printing
and so the file format is
recognised by the
machinery.
The file was opened on a
computer connected to the
milling machine, on software
called QuickCam Pro. Here,
the design was rotated to
reflect the orientation of the
model block.
The cutting depth was set to
50mm from the top of the
car, to prevent the chuck
from damaging the block.
The datum was set to the
centre of the cartridge
chamber.
Quality Assurance Process
Plans were created to mill
the car - first, an x axis
direction cut leaving a 1mm
raster finish all over, and
then a y axis direction cut
with a 0mm raster finish
bringing the model to the
finished size. The tool paths
were checked.
The plan was converted into
VR Milling and run, and the
milling machine began to cut
out the car. When the top of the
car was cut, the model block
was flipped and a new plan
created, and the bottom of the
car was cut. The main body
was then removed, and the
dimensions were checked
against the drawings, design
and specification.
Both wing designs were
initially saved as STL files.
The designs were then
opened on a computer
connected to a 3d printer, in
software called UP. The
height of the base plate was
set, and the thickness of
each plastic layer was set to
0.15mm.
A reel of ABS was then
placed into the printer, and
the printing program was set
and run. After the printing
was complete, the
dimensions were checked
using callipers to the design
and tolerances.
The engineering team decided to outsource the manufacture of our wheels, tyres and axles.
This is because our wheel and tyre designs were far too thin to be manufactured with the
machinery available, and so they had to be outsourced with one of our sponsors, KM
Engineering, who had far more precise equipment. The axle manufacture was outsourced
because, in the regional competition, a manufacturing error caused the axles to be tapered,
causing the wheels to detach on the track.
The axles were manufactured using a CNC lathe, and the wheels and tyres were manufactured
using a CNC milling machine.
Manufacture and
finish a part
Does the part meet the specification and the
dimensions in the design (design
dimensions to a tolerance of +1mm, -0mm)?
Add the part to the
assembly
YES
NO Redesign, alter or remake the part, as appropriate
Is the part of minimal
mass?
NO
YES
QC
QC
QC
All stages that undergo this process are marked ’QC’
Manufacturing 2 - Hand Finishing 9
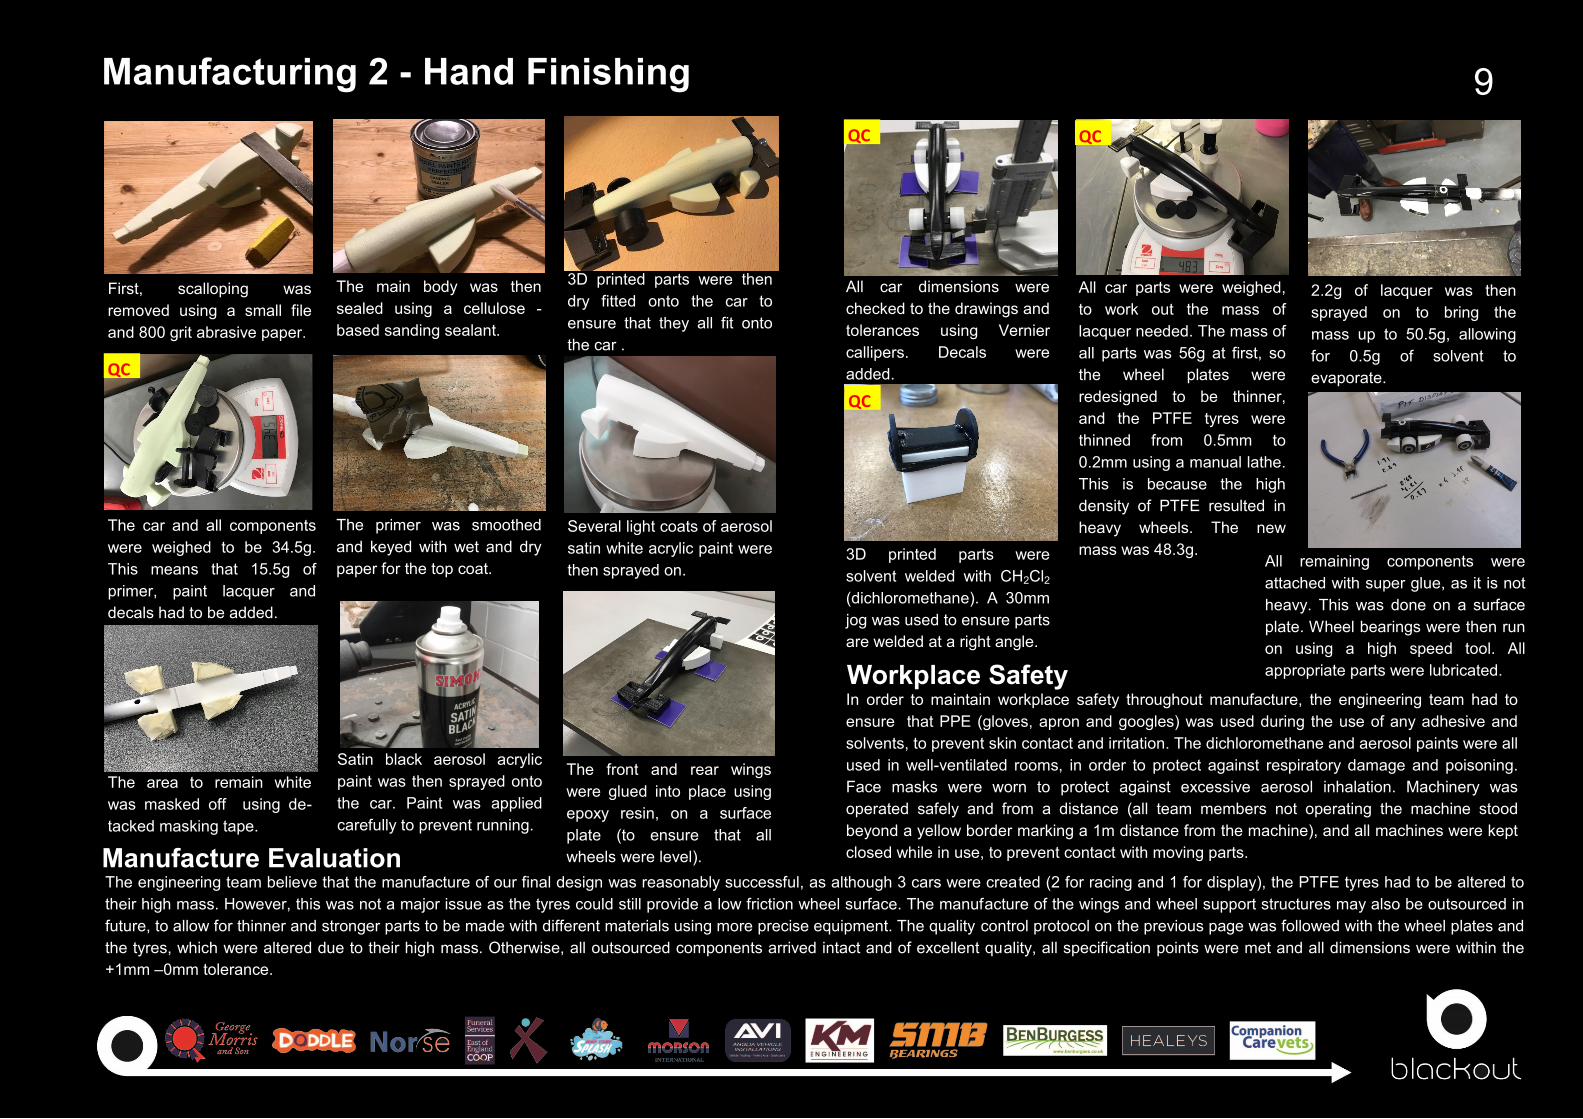
2.2g of lacquer was then
sprayed on to bring the
mass up to 50.5g, allowing
for 0.5g of solvent to
evaporate.
All car dimensions were
checked to the drawings and
tolerances using Vernier
callipers. Decals were
added.
All car parts were weighed,
to work out the mass of
lacquer needed. The mass of
all parts was 56g at first, so
the wheel plates were
redesigned to be thinner,
and the PTFE tyres were
thinned from 0.5mm to
0.2mm using a manual lathe.
This is because the high
density of PTFE resulted in
heavy wheels. The new
mass was 48.3g.
Workplace Safety
3D printed parts were
solvent welded with CH2Cl2
(dichloromethane). A 30mm
jog was used to ensure parts
are welded at a right angle.
All remaining components were
attached with super glue, as it is not
heavy. This was done on a surface
plate. Wheel bearings were then run
on using a high speed tool. All
appropriate parts were lubricated.
Manufacture Evaluation
In order to maintain workplace safety throughout manufacture, the engineering team had to
ensure that PPE (gloves, apron and googles) was used during the use of any adhesive and
solvents, to prevent skin contact and irritation. The dichloromethane and aerosol paints were all
used in well-ventilated rooms, in order to protect against respiratory damage and poisoning.
Face masks were worn to protect against excessive aerosol inhalation. Machinery was
operated safely and from a distance (all team members not operating the machine stood
beyond a yellow border marking a 1m distance from the machine), and all machines were kept
closed while in use, to prevent contact with moving parts.
First, scalloping was
removed using a small file
and 800 grit abrasive paper.
The main body was then
sealed using a cellulose -
based sanding sealant.
3D printed parts were then
dry fitted onto the car to
ensure that they all fit onto
the car .
The primer was smoothed
and keyed with wet and dry
paper for the top coat.
Several light coats of aerosol
satin white acrylic paint were
then sprayed on.
The car and all components
were weighed to be 34.5g.
This means that 15.5g of
primer, paint lacquer and
decals had to be added.
The area to remain white
was masked off using de-
tacked masking tape.
Satin black aerosol acrylic
paint was then sprayed onto
the car. Paint was applied
carefully to prevent running.
The front and rear wings
were glued into place using
epoxy resin, on a surface
plate (to ensure that all
wheels were level).
The engineering team believe that the manufacture of our final design was reasonably successful, as although 3 cars were created (2 for racing and 1 for display), the PTFE tyres had to be altered to
their high mass. However, this was not a major issue as the tyres could still provide a low friction wheel surface. The manufacture of the wings and wheel support structures may also be outsourced in
future, to allow for thinner and stronger parts to be made with different materials using more precise equipment. The quality control protocol on the previous page was followed with the wheel plates and
the tyres, which were altered due to their high mass. Otherwise, all outsourced components arrived intact and of excellent quality, all specification points were met and all dimensions were within the