1.1 S C O P E ................................................................................................................ 3....... 31.2 BACKGROUND .................................................................................................. 3
2.1 METER FACTOR DEFINITION .......................................................................... 52.2 FLATNESS RATIO DEFINITION ........................................................................ 52.3 SWIRL RATE DEFINITION ................................................................................. 5
3.0 INSTALLATION SITE MODEL ...................................................................... 7
3.1 LOOP A INFORMATION ...................................................................................... 73.2 LOOP B INFORMATION...................................................................................... 83.3 LOOP C INFORMATION ...................................................................................... 83.4 LOOP D INFORMATION ..................................................................................... 9
Trade Secret4.0 [ 1... 10 j & Confidentiz
Commercial4.1 CALIBRATION DATA USED FOR ANALYSIS .................................................... 10 Information
4.1.1 DATA SET SELECTION ...................................................................................... 104.1.2 DATA SET EVALUATION ................................................................................ 104.1.3 CALIBRATION DATA ........................................................................................ 10
4.2 PARAMETRIC TESTING ................................................................................... 114.3 HYDRAULIC SENSITIVITY COMPUTED FROM CALIBRATION DATA ....... 144.4 USING METRICS TO CALIBRATION DATA POPULATION ......................... 15
4.4.1 POPULATION ............................................................................... 15 Trade Secret& ConfidentiE
4.4.2 POPULATION [ ]...................................................................... 16 Commercial
4.5 METER FACTOR RELATIONSHIP [ ] ...... 17 Information
4.6 HYDRAULIC MODEL SENSITIVITY ............................................................... 19 Trade Secret4.7 HYDRAULIC SENSITIVITY WHEN IN [ ]................... 19 & ConfidentiU4.8 QUALITATIVE EXAMPLE [ Commercial
I ............................................................................ 20 Inform ation
5.0 METER FACTOR ACCURACY ASSESSMENT ........................................ 23
5.1 FACILITY UNCERTAINTY ............................................................................... 245.2 MEASUREMENT UNCERTAINTY ................................................................... 255.3 EXTRAPOLATION ALLOWANCE ................................................................... 255.4 DATA SCATTER - MEAN METER FACTOR UNCERTAINTY ..................... 27
Caldon Ultrasonics Page ii ER-1060 Rev ICaldon Ultrasonics Page ii ER-1060 Rev I
Preparer: DRA Reviewer: A
ER-1060 Rev 1, Meter Factor Calculation and Accuracy Assessment forSouth Texas Project Units 1 and 2
1.0 INTRODUCTION
1.1 Scope
This report documents the meter factor bounding uncertainty analysis for South Texas Project(STP) Units 1 and 2. Once the actual flow elements STP are made and calibrated, the actualcalibration data and parametric tests will be used to compute meter factor uncertainty for eachunit.
This report's approach is to use the body of calibration and parametric testing that Cameron hasperformed on 195 nuclear power plant flow meters.
Cameron will use the most conservative approach to compute a bounding uncertainty in themeter factor as applied to STP. Further, additional conservatisms are used such that theuncertainty can be considered to be bounding.
1.2 Background
The LEFM flow meter uses measurements of the fluid velocity projected onto acoustic paths todetermine the volumetric and mass flow. The LEFM makes the transit time measurements ofultrasonic energy pulses that travel between transducers and combines these with the distanceseparating the transducers to calculate the velocity. The flow meter uses eight acoustic paths thatare arranged as two crossing planes, each plane containing four chords (essentially two four pathmeters). The LEFM calculates volumetric flow by numerically integrating the fluid-velocitychord length product along the chords.
Trade
Secret &ConfidentialCommercialInformation
TradeSecret &ConfidentialCommercialInformation
1.2.1 Calibration Method
The calibration tests are performed at Alden Research Laboratories (Alden), an independenthydraulic laboratory. Alden provides flow rates up to -4500 m3/hr (-20,000 gpm). For mosthydraulic models, the piping pressure losses and cavitation does limit the calibration flow ratesto -3,400 m3/hr (-15,000 gpm) - depending on the pipe size and flow model components (e.g.,headers, nozzles etc.).
Caldon Ultrasonics Page 3 ER- 1060 Rev I
Preparer: DRA Reviewer: ±
During the calibration, reference flow rates are determined by Alden using a weigh tank, filltimes, fluid temperature and barometric pressure measurements. All elements of the labmeasurements including weigh tank scale, time measurements, thermometers and pressure gages,are traceable to NIST standards. In order to determine the meter factor, the flow meter outputsaire compared against the reference flow rates. Trade
An actual calibration for South Texas Project uses [Secret &ConfidentialCommercialInformation
1.3 Report Summary
Table 1 provides the South Texas Project meter factor uncertainties. Refer to Section 5 for adetailed summary.
TradeSecret &ConfidentialCommercialInformation
1- t
Table 1: Uncertainty Summary
[ICaldn Utraonic Pae 4ER-160 ev
TradeSecret &ConfidentialCommercialInformation
Caldon Ultrasonics Page 4 ER- 1060 Rev I
Preparer: DRA Reviewer: X"ik
2.0 DEFINITIONS
2.1 Meter Factor Definition
The meter factor accounts for (typically small) biases in the numerical integration due to thehydraulics, dimension measurements and acoustics of the application. The flow meter softwaremultiplies the result of the multi-path numerical integration by the product of the meter factor toobtain the flow rate.
The meter factor is calculated by the following equation:
MF - QAlden
Qmeter
Where:
Q meter = Volumetric flow rate from meter (with meter factor set to 1.000)
QAIden = Volumetric flow rate based on Alden weigh tank
2.2 Flatness Ratio DefinitionCameron uses the flatness ratio (FR) to quantify the flatness of the velocity profile. FR isdefined as:
FR= [V +V 4 + V+V8V2 + V3 + V6 + V7
Where:
V1 , V4, V5 , V8 = velocities measured along the outside chords (or short paths)V2, V3, V6. V7 = velocities measured along the inside chords (or long paths)
When a velocity profile is perfectly flat, then FR equals 1.0. When a velocity profile is laminar,then the FR equals approximately 0.38. The limits of 0.38 and 1.0 represent extremes. The FRis a function of Reynolds number but also is strongly influenced by the hydraulics upstream ofthe flow meter.
Typical feedwater applications have FR in the range of 0.78 to 0.95. Downstream of flowconditioners or long pipe runs > 30 diameters, the velocity profile tends to be pointier and the FRvalue is lower, 0.78 to 0.80. Downstream of elbows and tees the velocity profile tends to beflatter and the FR value is higher, 0.85 to 0.95. The actual range at a given plant is dependentupon site upstream conditions (for example the hydraulic fittings such as tees, elbows, etc.).Swirl typically flattens (increases FR) the velocity profile.
2.3 Swirl Rate DefinitionSwirl can be measured by the LEFM. Cameron quantifies swirl rate with a swirl rate calculation,as follows:
Caldon Ultrasonics Page 5 ER- 1060 Rev I
Preparer: DRA Reviewer: A~ftW
Where:
Swirl Rate = Average I-V5 V V4 V2 -V 6 V7 -V 3 ]Swirl Rat -Avrge s '.2"-ys 2. 2YL 2. 2"L
= Normalized velocities measured along outside chords= Normalized velocities measured along inside chords= Normalized chord location for short and long paths
V 1, V4 , V5, V8V 2 , V 3 , V 6 , V 7
Ys, YL
Swirl rates less than 3% are low and are typically observed in models with only planarconnections. Swirl rates greater than 3% are considered "swirling". Swirl rates greater than10% are considered to have strong swirl.
3.0 INSTALLATION SITE MODELThe STP installation sites will eventually be modelled during the calibration. The informationregarding location has been provided by STP engineers to Cameron.
The piping arrangements are shown in Figures 1 through 4 (Loops A, B, C and D). In thefollowing figures, the LEFM meter "section" is shown to be 12 feet long. Of that length, 72inches is upstream pipe (upstream of the flow meter itself). The nominal ID of feedwater pipingis 15.25 inches (OD is 18 inches).
3.1
Figure 1: Loop A Installation Site - Total distance is approximately 31 feet 7 1/8 inches(24.9 diameters) downstream of the UVT section (includes 6 feet inlet to meter)
Figure 2: Loop B Installation Site - Total distance is approximately 12 feet (9.4 diameters)downstream of the UVT section (includes 6 feet inlet to meter)
Reference drawing 7G369PFW833 Sheet 8 Rev 6
3.3 Loop C Information
12' LEFM 2CWindow
Figure 3: Loop C Installation Site - Total distance is approximately 9 feet (7.1 diameters)downstream Non-Planar Elbows (includes 6 feet inlet to meter)
Reference drawing 7G369PFW833 Sheet 3 Rev 6
Caldon Ultrasonics Page 8 ER- 1060 Rev I
Preparer: DRA Reviewer: 421-It
3.4 Loop D Information
Figure 4: Loop D Installation Site - Total distance is approximately 30 feet 7 1/8 inches(24.1 diameters) downstream of the UVT section (includes 6 feet inlet to meter)
4.1.1 Data Set SelectionThe data presented in this section include only ISO17025 traceable calibration data for 195 flowelements. The calibration data in this report were obtained in full scale models of nuclear powerplant feed water installations at Alden Research Laboratory. Each meter factor is obtained by Tradecomparing the Alden Labs flow to the LEFM measured flow. [ Secret &
ConfidentialCommercialInformation
TradeSecret &ConfidentialCommercialInformation
4.1.2 Data Set Evaluation
[
4.1.3 Calibration DataFigure 5 summarizes the nuclear feedwater UFM calibrations. The figure's vertical axis is theratio of ARL laboratory flow/volume to the UFM flow/volume, commonly known as the meterfactor. Note that the lab tested data is in the range of 0.99 to 1.01 or ± 1%.
These data in Figure 5 include not only the effects of hydraulic installation but also the effects ofmanufacturing and dimensional measurements (for example the path lengths and anglemeasurements). Therefore Figure 5 is the combination of both measurement/manufacturevariations and hydraulics.
Meters are typically installed downstream of elbows or other piping disturbances that distort the Tradevelocity profile. [ Secret &
ConfidentialCommercialInformation
TradeSecret &ConfidentialCommercialInformation
Caldon Ultrasonics Page 10 ER- 1060 Rev I
Preparer: DRA Reviewer: AL
ITradeSecret &ConfidentiECommerciEInformatiorI
1.025
1.020
1015
1.010
1.0050
LL 1.000
0.995
0990
0.985
0.980
0.975
Model Calibration Number
Figure 5- Population of Nuclear Meter Calibrations4
Inside diameters range from 12 inches to 32 inches. Each meter's MF has contributions due todimensional and angle measurement errors and machining differences.
]Figures 6 shows a diagram of the typical parametric tests, and Figures 7, 8 and 9 showsphotographs of some complex models of nuclear installations that have been built.
fQ MF= 1.0074
MF= 1.0070
MF= 1.0072 MF= 1.0072
Figure 6 - Example of Different parametrics for an Installation(Clockwise starting at top left - Test 1: Baseline, Test 2: Mitsubishi plate downstream of Tee,Test 3: Mitsubishi plate at inlet downstream of incoming elbow, Test 4: Rotate meter body 90
4.6 Hydraulic Model SensitivityIn Section 4.3, the variation in MF due to hydraulics (812 tests) had a standard deviation of[ A 95% confidence value for hydraulic sensitivity is computed to be [ ] It isnoted that of the 812 configurations used in the population, many may not be relevant to thehydraulics at STP. The population can be broken down into subsets by "key" characteristics.The following table shows different population breakdown with 95% confidence uncertainties .
TradeSecret &ConfidentialCommercialInformation
TradeSecret &ConfidentialCommercialInformation
TradeSecret &ConfidentialCommercialInformation
II
I
0 0
C)
COa)wE.0
4.7 Hydraulic Sensitivity when in [ INormally, the LEFM CheckPlus operates with two planes of velocity measurements each withfour acoustic paths. These two planes cross each other and provide natural cancellation of crossvelocities and making the meter nearly insensitive to upstream hydraulics. The efficacy of thismethod has been discussed in this report and more importantly in the Topical report andreferenced papers (see Section 6).
I TradeSecret &ConfidentialCommercialInformation
CIdnUtaoisPae1 R16 eCaldon Ultrasonics Page 19 ER- 1060 Rev I
Preparer: DRA Reviewer: .e!-
II TradeSecret &ConfidentiaCommerci,InformationI
ITradeSecret &ConfidentialCommerciaInformation
TradeSecret &
4.8 Qualitative Example [ConfidentialCommercia
The meter installation model shown in Figure 15 is a case that demonstrates the robustness of the Information8 path UFM to extreme changes in the upstream hydraulics. Clearly the hydraulics presented inthis section are much more extreme that those of the STP application (Section 3) and fail to havethe recommended 5 L/D between the meter and the upstream elbow.
Figure 15 - Meter Installation Model (Flow Right to Left)
(Arrow at Note 1 sight is where a Mitsubishi flow conditioner was installed)
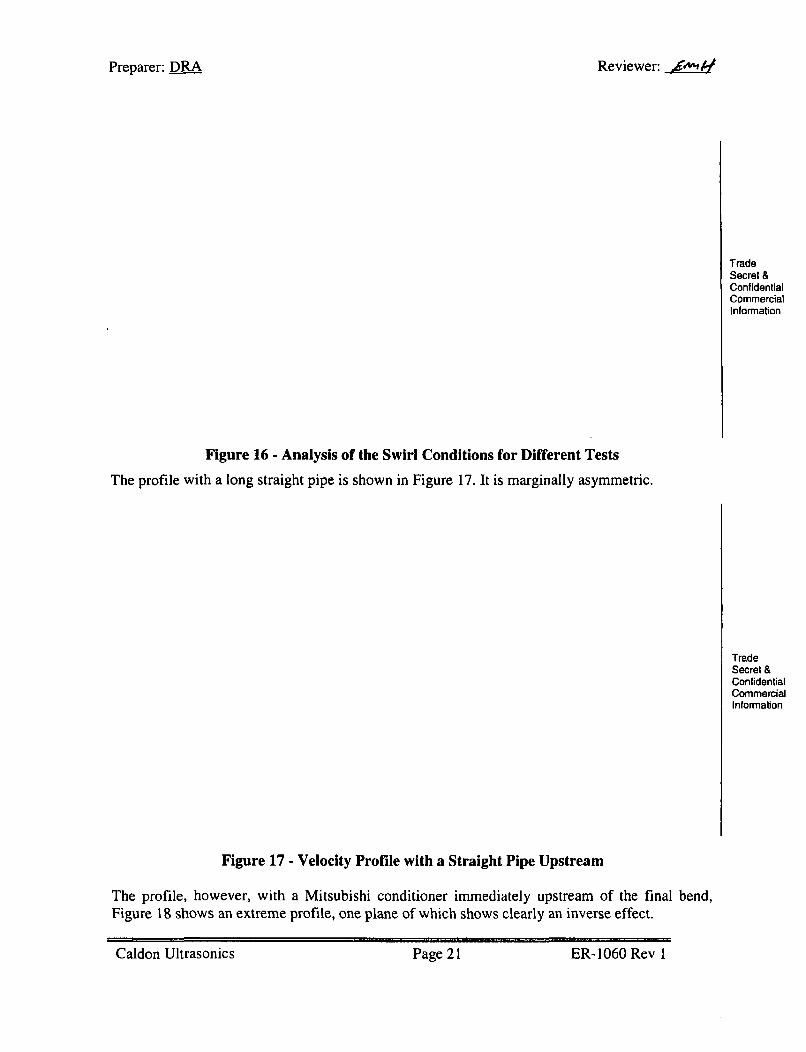
Not only is it a complex installation, but it has the opportunity for both a planar flow and strongswirling flow, depending on the flow paths and fittings. Figure 16 shows an analysis of differentswirls generated through tests (absolute values of swirl).
1o Clearly, individual planes can be calibrated to the two plane average - and this is done by procedure and software.
But, if in maintenance mode, the LEFM cannot calibrate the individual planes when hydraulic changes occur.
Figure 16 - Analysis of the Swirl Conditions for Different Tests
The profile with a long straight pipe is shown in Figure 17. It is marginally asymmetric.
Figure 17 - Velocity Profile with a Straight Pipe Upstream
The profile, however, with a Mitsubishi conditioner immediately upstream of the final bend,Figure I9 shows an extreme profile, one plane of which shows clearly an inverse effect.
CalonUlraonis ag 2 ER-06 Rvi
TradeSecret &ConfidentialCommercialInformation
Caldon Ultrasonics Page 21 ER-1060 Rev I
Preparer: DRA Reviewer: d
Figure 18 Flow Profile with Mitsubishi Plate Upstream of Last BendThe effects of the different conditions on both MF and FR are shown in Figure 19. Withstandingall these effects, a ±+0.15% bound covers all the data.
Figure 19 MF and FR - Highly Distorted Flow
TradeSecret &ConfidentialCommercialInformation
TradeSecret &ConfidentialCommercialInformation
Caldon Ultrasonics Page 22 ER- 1060 Rev I
Preparer: DRA Reviewer: AAV!5to
5.0 METER FACTOR ACCURACY ASSESSMENTThis section documents the methodology for calculating the uncertainty or accuracy of the meterfactor. This report was produced using a process and quality assurance consistent with therequirements of ASME PTC 19.1 and ANSI/NCSL Z540-2-1997 (see References 11, 16 and 17).The approach to determination of the set points is to combine the random (Type A) andsystematic (Type B) terms by the means of the RSS approach given that all the terms areindependent, zero-centered and normally distributed.
First, the sensitivity of the calculated flow to each independent variable or input is determined.Once the sensitivities to the independent variables have been calculated, then the independentvariables' uncertainties are calculated and multiplied with their sensitivity coefficient, such ascalibration facility, timing errors, etc. The 95% confidence level uncertainty bounds arecalculated for each element (uncertainty coverage for each term is 95%).
The evaluation of the sensitivity coefficients is performed by determining the independentvariables in the mass flow (and volumetric flow) calculation. For example, if volume flow is afunction of independent variables X1, X2, ..., X,, as follows:
Q = f(Xl,X2,..., Xn)
The uncertainty effect of specific independent variables on the flow measurement is calculatedby partial differentiation of the above equation. Expressing the result as a per unit sensitivity:
Where the terms in the brackets are the sensitivity coefficients for X1 , X2, ..., X". Themagnitudes and signs of each uncertainty for a given flow measurement are then bounded by95% confidence intervals.
ASME PTC 19.1 demonstrates that by combining the independent uncertainty contributions asthe root sum square, the overall uncertainty in volumetric flow is bounded by a 95% confidencelevel.
The allocation of uncertainties for meter factor for the flow meter (consistent with the CameronTopical report) is shown in Table 5 below. Using the data in Table 5 and the root mean squaresummation technique indicated for combining independent uncertainties of relatively the samemagnitude, the total uncertainty due to MF is computed.
(All terms are treated as normal distributions with k = 2, e.g., 95% coverage)
5.1 Facility UncertaintyTrade
A facility uncertainty of [ ] is typically budgeted based on the ISO 17025 traceable Secret &uncertainties of Alden Research Laboratories. The figure is increased conservatively to of Confidentla
Commerciain the table above. Information
This uncertainty term is considered to be systematic over all pipes.
See Reference 14.
Caldon Ultrasonics Page 24 EER--1060 Rev I
Preparer: DRA Reviewer: 4M&±
5.2 Measurement Uncertainty
For each calibration, an analysis is done to compute the uncertainties in the volumetric flowmeasurement (excluding meter factor) of the flow meters used. The dominant calibrationuncertainty is that due to the sensitivity of transducer installation [ I.
TradeSecret &ConfidentialCommercialInformation
TradeSecret &ConfidentialCommerciaInformation
Table 3: Uncertainties in Volumetric Flow Measurements(All Figures rounded to three decimal points)
(All terms are treated as normal distributions with k = 2, e.g., 95% coverage)
In order to be conservative, a combined uncertainty in any of the STP meters is considered to be[ ] This uncertainty term is random between meters - since the meters construction(differences in assembly and manufacturer) will drive this uncertainty.
5.3 Extrapolation Allowance
At the plant, it is likely that the hydraulic conditions will not equal those tested during thecalibration. In particular, the plant's Reynolds numbers are higher than that achievable at thelaboratory (approximately 20 million vs. -2 million). Further, the plant may have a lower wallroughness than the test pipes used at the laboratory.
[
TradeSecret &ConfidentialCommercialInformation
I
TradeSecret &ConfidentialCommercialInformation
TradeSecret &ConfidentialCommercialInformation
I
I
12 For this report, a typical average flow of 8,600 gpm (1953 CMH) is use. This is an expected average flow for
computing the delta T value.
Caldon Ultrasonics Page 25 ER- 1060 Rev I
Preparer: DRA Reviewer: 5
TradeSecret &ConfidentialCommercialInformation
Where:u = axial velocity (ft/s)u = shear velocity (ft/s)y. = Dimensionless distance from the pipe wall
The numerical calculation of meter factor is illustrated below.
TradeSecret &ConfidentialCommercialInformation
Figure 20: MF vs. Reynolds Number (Reichardt Profile)
Figure 21: FR vs. Reynolds Number (Reichardt Profile)
Using this analysis, a meter factor extrapolation of [ ] is predicted from the averagecalibration Reynolds number (-2e6) to the plant application (-20e6). The flatness ratioextrapolation is approximately [ I for the same range.
Nevertheless, in order to address potential uncertainties in using this methodology, the meterfactor extrapolation uncertainty budget is conservatively increased to [ I (e.g., doubled).
This uncertainty term is considered to be systematic over all pipes.
5.4 Data Scatter - Mean Meter Factor Uncertainty
Each meter factor is computed as the average (mean) of the meter factor measurements made forthat flow element. The uncertainty in mean meter factor must address the 95% confidence limitson the uncertainty in that mean.
A review of previous calibrations has shown that the typical uncertainty due to data scatter is[ ] In order to be conservative, an uncertainty of [ ] is used to allow for additionalscatter in the data.
This uncertainty term is random between meters.
TradeSecret &ConfidentialCommercialInformation
TradeSecret &ConfidentialCommercialInformation
TradeSecret &ConfidentialCommercialInformation
Caldon Ultrasonics Page 27 ER- 1060 Rev I
Preparer: DRA Reviewer: _12i
6.0 REFERENCES1. 2006 South East Asia Flow Workshop Paper, "The Relative Merits of Ultrasonic Meters
Employing Between Two and Eight Paths", Gregor Brown, Don Augenstein, TerryCousins, Herb Estrada
2. Moody, L. F., "Friction Factors for Pipe Flow," ASME Transactions, V. 66, 1944, pp.671-694
3. National Bureau of Standards and Technology, "Experimental Statistics Handbook 1991"
4. Murakamni, M., Shimizu, Y., and Shiragami, H., "Studies on Fluid Flow in Three-Dimensional Bend Conduits," Japan Society of Mechanical Engineering (JSME),Bulletin V. 12, No. 54, Dec. 1969, pp. 1369-1379.
8. Cameron Topical Report ER-80P Rev 0, "Improving Thermal Power Accuracy and PlantSafety While Increasing Operating Power Level Using the LEFM Check System"
9. ER-55 1, Transducer Replacement Sensitivity
11. ASME PTC 19.1-2005, Measurement Uncertainty
12. Cameron Engineering Report ER-160P Rev 0, "Supplement to Topical Report ER 80P:Basis for a Power Uprate with the LEFM System"
13. Cameron Engineering Report ER-157(P-A) Rev. 8 and Rev. 8 Errata, "Supplement toCaldon Topical Report ER-80P: Basis for Power Uprates with an LEFM Check or anLEFM CheckPlus"
14. Cameron Engineering Report ER 262 Rev 0, "Effects of Velocity Profile ChangesMeasured In-Plant on LEFM Feedwater Flow Measurement Systems", January 2002
15. ANSIINCSL Z540.3-2006, "U.S. Guide to the Expression of Uncertainty inMeasurement"
16. ISO "Guide to the Expression of Uncertainty in Measurement"
17. IGHEM Flow Paper 2008 Milan, Italy, "Accuracy Validation of Multiple Path TransitTime Flowmeters"
18. Westinghouse Research Laboratories Nov 3, 1972, "Integration Errors for TurbulentProfiles in Pipe Flow"