47
Engineering Report: Natural Gas Pipeline & Customer Gas Usage Analysis North Central Iowa Regional Economic & Port Authority WORTH AND MITCHELL COUNTIES, IOWA January 2019

Engineering Report: Natural Gas Pipeline & Customer Gas Usage AnalysisNorth Central Iowa Regional Economic & Port Authority
WORTH AND MITCHELL COUNTIES, IOWA
January 2019


January 2019
Executive Summary
The North Central Iowa Regional Economic & Port Authority (NCIREPA or Port Authority) is currently
evaluating their natural gas infrastructure needs to support economic development for Worth and
Michell Counties. As part of this evaluation, the Port Authority has retained Montana-Dakota Utilities
Co. (MDU), Bartlett & West, and ProSource Technologies, LLC (ProSource) to assist with their energy
infrastructure planning. The preparation of this Natural Gas Pipeline & Customer Gas Usage Analysis
Report is one component of the infrastructure planning process.
Opportunity
The potential to supply natural gas to multiple rural farming operations, small communities, and several
industrial sites within Worth and Mitchell Counties has led to the evaluation of a potential new natural
gas pipeline system (Port Authority Pipeline). The purpose of the proposed pipeline is to provide natural
gas service to existing potential consumers and to offer these services as a driver of economic
development for the area.
The proposed Port Authority Pipeline system consist of 3 segments that total approximately 34 miles of
welded steel pipe, originating from a Northern Natural Gas Transmission pipeline. An alternative route
from Northern Border interstate transmission pipeline was also considered as alternate source of
natural gas.
Figure 1.1: Master Layout Map

January 2019
Data
This analysis used data from the American Gas Association (AGA), the Energy Information Association
(EIA), the Iowa Utility Board, and information provided by the Port Authority to develop an average
annual consumption by customer types (residential, commercial, and Industrial). A schedule of
customers was developed to estimate a peak flow for determining the size and capacity required for the
pipeline(s) and revenue schedule. The peak load demand was determined for each segment to be
37,000 MCFD (million cubic feet per day) (Segment 1), 26,000 MCFD (Segment 2), and 10,500 MCFD
(Segment 3).
Recommendations
To support the peak load demands, we recommend a 12-inch diameter pipeline for Segments 1 and 2,
and a 10-inch diameter pipeline for Segment 3. It has been estimated that the upfront capital required
to design, permit, and construct the pipeline is approximately $36,328,000. According to the analysis
estimates, the Port Authority would need to charge between $0.50 and $0.60 per million cubic feet
(MCF) to make this a viable project. Using a simplified 30-year payback structure with a 7% rate of
return, the Port Authority would need to generate approximately $2,900,000 per year. The Port
Authority would need to secure approximately 16,500 MCFD in natural gas sales to support the project.
It could take many years for the pipeline system to reach its full potential. Because of this, it is
recommended that the Port Authority secure an anchor customer to justify the project. Additionally, a
phased approach is recommended for the construction of the Port Authority Pipeline. The first phase
should focus on delivering gas to the Manly Terminal, to target industrial development that would serve
as the base load for the pipeline. The second phase should focus on delivering natural gas to the St.
Ansgar region. The third phase would involve delivering natural gas to Mona, Riceville, and other sites in
the region. This analysis also recommends that the Port Authority have an exit strategy for the pipeline
operations. As part of the exit strategy, it is recommended that the pipeline be constructed in private
right of way. This would result in retaining a higher value for potential pipeline operators that may be
interested in acquiring the pipeline after it is in operation.

January 2019
Benefits
There are many benefits that will result from developing this much needed pipeline infrastructure. The
pipeline will provide safe, reliable energy to the surrounding counties, help attract new businesses,
create jobs, and offer cost savings for rural homes, farms, and communities currently being served by
liquid propane. Natural gas is one of the Nation’s most abundant and cost-effective energy resources.
On average, compared to propane, a residential home will save approximately $1,200/year, a
commercial business approximately $4,800/year, and an agricultural grain drying operation
approximately $24,000/year by using natural gas from this pipeline infrastructure.
Recap
To summarize, there are 3 key recommendations that will aid in the success of the Port Authority
Pipeline project:
1. Secure an anchor customer
2. Use a phased approach
3. Construct the pipeline in private easements
If these guidelines are considered, we believe this can be a self-sustaining infrastructure system that will
provide a revenue source for area counties, help stimulate the local economy, and increase the quality
of life for residents and businesses.

North Central Iowa Regional Economic & Port Authority
Natural Gas Pipeline & Customer Gas Usage Analysis
TABLE OF CONTENTS
Page
1.0 OVERVIEW .............................................................................................................................. 1
2.0 RIGHT OF WAY, ENVIRONMENTAL, & PERMITTING .............................................................. 5
2.1 right of way ...................................................................................................................... 5
2.2 environmental and permitting ......................................................................................... 6
2.3 regulatory and environmental permitting ....................................................................... 7
2.4 environmental field surveys ............................................................................................. 8
3.0 ROUTE SELECTION & OPTIONS .............................................................................................. 9
3.1 segment 1: scenario 1 ...................................................................................................... 9
3.1.1 segment 1: scenario 2 ................................................................................................. 11
3.2 segment 2....................................................................................................................... 12
3.3 segment 3....................................................................................................................... 13
3.4 alternative route ............................................................................................................ 14
4.0 NATURAL GAS USE SUMMARY ............................................................................................. 15
4.1 annual usage .................................................................................................................. 15
4.2 daily usage ..................................................................................................................... 18
5.0 SYSTEM ANALYSIS ................................................................................................................ 20
5.1 natural gas supply .......................................................................................................... 20
5.2 capacity and sizing analysis ............................................................................................ 20
5.3 pipeline design ............................................................................................................... 23

North Central Iowa Regional Economic & Port Authority
Natural Gas Pipeline & Customer Gas Usage Analysis
6.0 FINANCIAL ANALYSIS ............................................................................................................ 24
6.1 cost by segment ............................................................................................................. 24
6.2 total project cost ............................................................................................................ 25
6.2.1 cost for customer service connections (taps) ............................................................. 26
6.3 cost estimating ............................................................................................................... 27
6.4 rates basis ...................................................................................................................... 27
6.5 revenue schedule ........................................................................................................... 28
6.6 economic benefits .......................................................................................................... 30
7.0 RECOMMENDATIONS .......................................................................................................... 32
7.1 phasing ........................................................................................................................... 32
7.2 summary ........................................................................................................................ 32
APPENDIX A – ROUTE MAPS

North Central Iowa Regional Economic & Port Authority
Natural Gas Pipeline & Customer Gas Usage Analysis
1January 2019
1.0 OVERVIEW
Every business needs a plan in place to effectively guide investment decisions. Economic development
districts are no different than other businesses in that regard, particularly developments that serve a
rural region. Montana-Dakota Utilities Co. (MDU), along with Bartlett & West and ProSource
Technologies, LLC (ProSource), is pleased to have the opportunity to assist the North Central Iowa
Regional Economic & Port Authority (NCIREPA or Port Authority) with their infrastructure planning. We
have developed a flow analysis for a proposed natural gas supply system, called the Port Authority
Pipeline, to support the future energy needs of the region (see Section 4 for more details). The purpose
of this analysis is to establish a natural gas infrastructure strategic plan for the Port Authority that will
serve as a guide for their future energy development. Infrastructure improvement options are outlined
and correlated to growth projections. The immediate and future financial impacts are also illustrated.
The Port Authority Pipeline will have the potential to support multiple rural farming operations and two
small communities, as well as supply natural gas to several industrial sites within counties supported by
the Port Authority. The proposed natural gas pipeline system will consist of approximately 34 to 48 miles
of a welded steel pipeline.
Segment 1 of the proposed Port Authority Pipeline would originate at a Northern Natural Gas Interstate
Pipeline (NNG) connection approximately 0.5 miles east of Aspen Avenue on 400th Street SW (near the
City of Joice) and terminate approximately 0.5 miles east of the northwest corner of the intersection of
400th Street and Nuthatch Avenue, where it crosses an existing NNG pipeline. Segment 2 would begin at
the end of Segment 1 and continue south, paralleling an existing NNG pipeline to a point near the Manly
Terminal. Segment 3 would begin at the intersection of Segments 1 & 2, heading east to St. Ansgar.
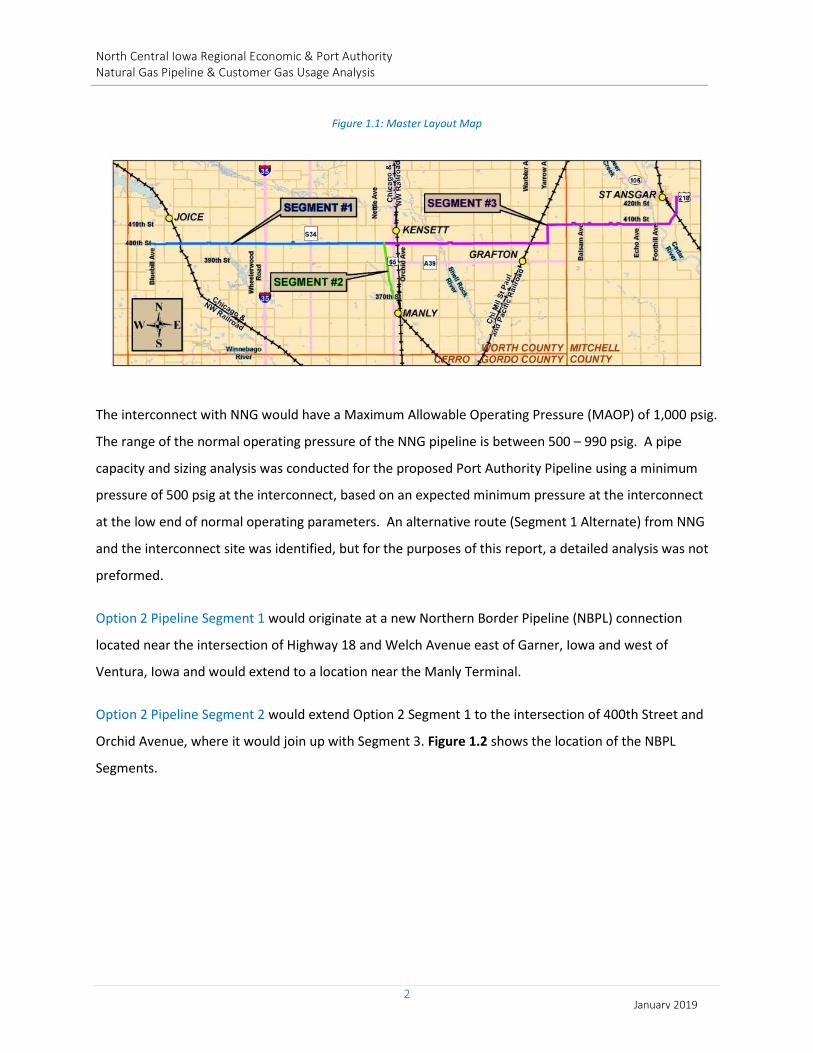
Figure 1.1 shows the locations of Segments 1, 2, and 3.
North Central Iowa Regional Economic & Port Authority
Natural Gas Pipeline & Customer Gas Usage Analysis
2January 2019
Figure 1.1: Master Layout Map
The interconnect with NNG would have a Maximum Allowable Operating Pressure (MAOP) of 1,000 psig.
The range of the normal operating pressure of the NNG pipeline is between 500 – 990 psig. A pipe
capacity and sizing analysis was conducted for the proposed Port Authority Pipeline using a minimum
pressure of 500 psig at the interconnect, based on an expected minimum pressure at the interconnect
at the low end of normal operating parameters. An alternative route (Segment 1 Alternate) from NNG
and the interconnect site was identified, but for the purposes of this report, a detailed analysis was not
preformed.
Option 2 Pipeline Segment 1 would originate at a new Northern Border Pipeline (NBPL) connection
located near the intersection of Highway 18 and Welch Avenue east of Garner, Iowa and west of
Ventura, Iowa and would extend to a location near the Manly Terminal.
Option 2 Pipeline Segment 2 would extend Option 2 Segment 1 to the intersection of 400th Street and
Orchid Avenue, where it would join up with Segment 3. Figure 1.2 shows the location of the NBPL
Segments.

North Central Iowa Regional Economic & Port Authority
Natural Gas Pipeline & Customer Gas Usage Analysis
3January 2019
Figure 1.2: Option 2, Segments 1 & 2
This Natural Gas Pipeline Analysis used data from the American Gas Association (AGA), the Energy
Information Association (EIA), and information provided by the Port Authority to develop an average
annual consumption by customer types (residential, commercial, and Industrial). A schedule of
customers was developed to estimate a peak flow for determining the size and capacity required for the
pipeline(s) and revenue schedule.
This planning document should be used by the Port Authority to address current natural gas
deficiencies and plan for future natural gas demand. The specific design of each pipeline segment
identified in this report should be re-evaluated prior to construction. The Port Authority should
understand that the recommended improvements are directly related to the growth projections
established during the analysis, and that actual future growth of the counties may not follow the
projected growth.

North Central Iowa Regional Economic & Port Authority
Natural Gas Pipeline & Customer Gas Usage Analysis
4January 2019
This analysis report includes 7 sections that focus on the development of the pipeline route segments,
natural gas supply and use, financial analysis, and recommendations. The following summarizes each of
the report sections:
• Section 1 - Overview. The overview presents the purpose of the analysis and provides general
location information for each route segment.
• Section 2 - Right of Way, Environmental, & Permitting. This section outlines the process and
criteria used for selecting the proposed pipeline route segments. It includes a description of the
environmental resources and permitting associated with each route segment.
• Section 3 - -Route Selection and Options. This section provides locations, details, and maps of
the proposed route segments.
• Section 4 - Natural Gas Use Summary. This section discusses the annual gas usage in Iowa and
the factors that drive the consumption of natural gas in the region.
• Section 5 - System Analysis. This section provides information related to the natural gas supply
options in the area. It includes an examination of the proposed pipeline system capacity and
sizing, as well as recommendations for the pipeline design characteristics.
• Section 6 - Financial Analysis. This section outlines various project cost scenarios and includes
discussions on rate basis and revenue scheduling.
• Section 7 - Recommendations. This section provides a summary of the analysis report findings
and outlines a strategy to create increased development marketability to drive long-term
economic growth for the region.

North Central Iowa Regional Economic & Port Authority
Natural Gas Pipeline & Customer Gas Usage Analysis
5January 2019
2.0 RIGHT OF WAY, ENVIRONMENTAL, & PERMITTING
2.1 Right of Way
The process for determining the location of a pipeline route is a critical component of the overall
project. We have considered many factors during the analysis of pipeline routes, including:
• Minimizing impacts to landowners, agricultural operations, public infrastructure, and future
development
• Avoiding and/or minimizing impacts to cultural and biological resources
• Safety
• Length of route
• Constructability
• Long-term operations and maintenance of the pipeline
• Governmental agency approvals and other recommendations
The location of the pipeline within the current road right of way or outside of the road right of way in
private easements is very important to the success of the project and affects operational risks to the
pipeline owner. It is recommended that the Port Authority conduct further research to determine the
number of existing utilities in the road right of way and consider future utilities that may locate in the
road right of way. In addition, a legal opinion is recommended regarding ownership of the road right of
way in the project area.
It is our recommendation that the pipeline be located adjacent to the road right of way in private
easements for the following reasons:
• Improved landowner relations - landowners will receive payment and there may also be a need
for workspace from the landowners.
• Increased resale value of the pipeline asset due to factors including:
a) creates a more valuable asset depending on easement terms
b) may allow additional rights to be sold or for additional facilities to be constructed by
the owner in the same corridor with nominal additional land rights costs
c) private easement terms are typically more protective and preserve more rights for a
pipeline operator (indemnification, rights to abandon, no interference with
easement rights granted, etc.) than permits from a public entity
• Minimizes future risk of relocating the pipeline at pipeline owner’s expense (road widening,
access roads, interchanges, etc. could all force the pipeline outside of the road right of way for
North Central Iowa Regional Economic & Port Authority
Natural Gas Pipeline & Customer Gas Usage Analysis
6January 2019
portions of or the entire route). This could double or triple the cost of the initial investment
because the new easements would need to be purchased at escalated prices, new pipe and
labor at inflation adjusted prices, cost of removing or abandoning old pipe, etc.
• Fewer requests for one call locates if located outside of the road right of way.
• Lower maintenance cost for the pipeline.
• Potentially lower construction costs with a wider work area and fewer existing utilities to avoid
during construction.
• Decreased odds of damage to the pipeline from third parties excavating over the pipeline in the
public right of way (new facilities, maintenance on existing facilities such a fiber optics/other
pipelines/water line, road and bridge maintenance or culvert work, etc.)
• Avoids reroutes around bridges and culverts that cross the road and eliminates the concern for
adequate pipeline depth if the pipeline is directionally drilled under bridges and culverts.
• Eliminates the risk that a landowner claims rights to the center of the road after substantial
work has been completed.
This route analysis also considered the option of locating the pipeline inside the existing road right of
way, however, it is our opinion that there are more benefits to private easements.
The advantages of locating the pipeline in the road right of way include:
• Easement cost savings (this may require payment to landowners for temporary workspace)
• Fewer landowner negotiations
• Minimal impacts to drain tile
• Working with county road authorities
2.2 Environmental & Permitting
Environmental Resources
A desktop review of environmental resources potentially impacted by the pipeline was conducted, in
addition to a limited field reconnaissance. The desktop information sources included aerial maps,
topographic maps, drainage data, National Wetland Inventory (NWI) maps, and county road maps. The
following is a list of resources identified along the proposed routes.
Segment 1
• Approximately 13.1 miles following 400th Street, to approximately 0.5 miles east of Nuthatch
Avenue
• 2 canal/river crossings

North Central Iowa Regional Economic & Port Authority
Natural Gas Pipeline & Customer Gas Usage Analysis
7January 2019
• 1 NWI wetland
Segment 2
• Approximately 3.1 miles long from 400th Street to Manly Terminal
• 2 creek/river crossings
Segment 3
• Approximately 18.8 miles long from 400th Street to Yarrow Avenue, then North to 410th
Avenue, then east to a point approximately 1 mile east of Foothill Avenue, then turning north
approximately 1.5 miles to Old Mill Road on the east side of St. Ansgar.
• 4 canal, creek, and river crossings
• 6 NWI wetlands
Option 2 Segments 1 and 2
• Approximately 26.4 miles long from an interconnect with Northern Border Interstate Pipeline.
• 10 canal/river crossings
• 2 NWI wetlands
2.3 Regulatory & Environmental Permitting
The regulatory and environmental permitting processes required for this project are achievable with
coordinated planning and timely implementation. Early agency coordination during the planning phase
is strongly encouraged. The following table includes a list of potential permits for construction.
Table 2.3: Permit Table
Title Tasks
Iowa Utilities Board Permit
• Public Informational Meetings (in each county) • IUB Permit Application • Data Responses • Pre-filed Testimony • Attendance at IUB Hearing
US Army COE • Desktop wetland review with National Wetland
Inventory Maps • If wetland impacts, 404 wetlands permit
Iowa Department of Natural Resources (IDNR) • Environmental Review • Construction Stormwater Permit • Stormwater Pollution Prevention Plan (SWPPP)
Iowa State Historic Preservation Office (SHPO) • Cultural resource consultation
County Permits • Permits for counties crossed by the pipeline

North Central Iowa Regional Economic & Port Authority
Natural Gas Pipeline & Customer Gas Usage Analysis
8January 2019
2.4 Environmental Field Surveys
The permitting agencies will presumably require environmental field surveys to identify wetland
impacts, potential impacts to protected animal or plant species, and the identification of cultural
resources. The selection of the final route, review of NWI maps, biological resource data, cultural
resources literature review, and consultations with state and federal agencies, will determine the scope
of the environmental surveys.
Table 2.4: Biological & Cultural Surveys
Survey Type Task
Wetland Delineation Wetland delineation, GPS mapping and report, to field verify wetland size,
types and locations.
Biological Survey Biological survey, GPS mapping and report, to identify potential protected
animal or plant species.
Cultural Resource Survey Phase I cultural resource pedestrian survey to identify and locate potential
cultural resources.

North Central Iowa Regional Economic & Port Authority
Natural Gas Pipeline & Customer Gas Usage Analysis
9January 2019
3.0 ROUTE SELECTION & OPTIONS
The following sections provide location descriptions of the proposed pipeline segments including counts
of the roads, railroads, and foreign transmission pipelines crossed by the routes. A review of the
landowners located along each route segment was conducted using Geographical Information System
(GIS) data provided by Worth County and Mitchell County. The landowner counts and crossing
inventory were based on locating the pipeline within private easements.
3.1 Segment 1 – 400th Street to 0.5 miles East of Nuthatch Avenue
The proposed route for Segment 1 starts from a new NNG interconnect located approximately 0.5 miles
east of Aspen Avenue, paralleling 400th Street to a location approximately 0.5 miles east of Nuthatch
Avenue. This segment is approximately 13.1 miles long, as shown in Figure 3.1. It was selected to
maximize the number of potential customers along the route. Additionally, the Port Authority can elect
to purchase private easements along the pipeline route, construct the pipeline in the county right of
way, or a combination of the two. It is our recommendation to place the pipeline in private easements
whenever possible, as discussed in Section 2.0. Private easements minimize the future risk to the
pipeline owner of paying to move the line for road widening or other improvements.
Figure 3.1: NNG Interconnect Site

North Central Iowa Regional Economic & Port Authority
Natural Gas Pipeline & Customer Gas Usage Analysis
10January 2019
Segment 1 Crossing Inventory
• Approximately 13.1 miles following 400th Street to 0.5 miles east of Nuthatch Avenue
• 61 parcels
• 30 landowners
• 8 minor road crossings
• 3 county road crossings
• 1 U.S. highway crossing
• 1 railroad crossing
• Estimated 7 foreign transmission pipeline crossings

North Central Iowa Regional Economic & Port Authority
Natural Gas Pipeline & Customer Gas Usage Analysis
11January 2019
3.2 Segment 2 – County Road 400th Street to Manly Terminal
The proposed route for Segment 2 parallels NNG’s existing pipeline to the Manly Terminal. This
segment is approximately 3.1 miles long. This route was selected to minimize the length of the line and
take advantage of the existing pipeline corridor. Obtaining private easements for this pipeline route is
the only option as shown in Figure 3.2.
Figure 3.2: Segment 2 Route Map
Segment 2 Crossing Inventory
• Approximately 3.1 miles long from 400th Street to Manly Terminal
• 17 parcels
• 11 landowners
• 1 minor road crossing
• 2 county road crossings
• 1 interstate highway crossing
• Estimated 2 foreign transmission pipeline crossings

North Central Iowa Regional Economic & Port Authority
Natural Gas Pipeline & Customer Gas Usage Analysis
12January 2019
3.3 Segment 3 – County Road 400th Street to St. Ansgar
The proposed route for Segment 3 parallels 400th Street heading east-north-east to St Ansgar. The
segment is approximately 18.8 miles long. It was selected to maximize the number of potential
customers along the route. As with Segment 1, the Port Authority can elect to purchase private
easements along the pipeline route, construct the pipeline in the County right of way, or a combination
of the two. It is our recommendation to place the pipeline in private easements whenever possible.
Figure 3.3: Segment 3 Route Map
Segment 3 Crossing Inventory
• Approximately 18.8 miles long from 400th Street to St. Ansgar
• 89 parcels
• 55 landowners
• 10 minor road crossings
• 6 county road crossings
• 1 US Highway
• 3 railroad crossings
• Estimated 1 foreign transmission pipeline crossing
North Central Iowa Regional Economic & Port Authority
Natural Gas Pipeline & Customer Gas Usage Analysis
13January 2019
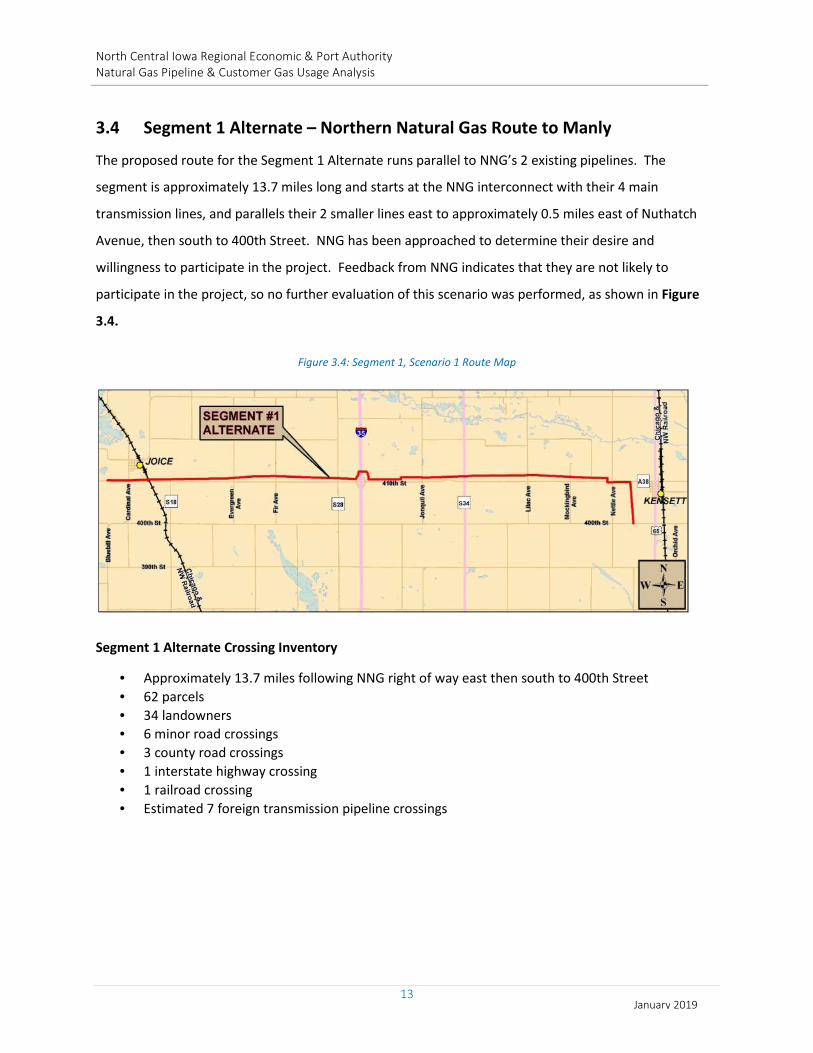
3.4 Segment 1 Alternate – Northern Natural Gas Route to Manly
The proposed route for the Segment 1 Alternate runs parallel to NNG’s 2 existing pipelines. The
segment is approximately 13.7 miles long and starts at the NNG interconnect with their 4 main
transmission lines, and parallels their 2 smaller lines east to approximately 0.5 miles east of Nuthatch
Avenue, then south to 400th Street. NNG has been approached to determine their desire and
willingness to participate in the project. Feedback from NNG indicates that they are not likely to
participate in the project, so no further evaluation of this scenario was performed, as shown in Figure
3.4.
Figure 3.4: Segment 1, Scenario 1 Route Map
Segment 1 Alternate Crossing Inventory
• Approximately 13.7 miles following NNG right of way east then south to 400th Street
• 62 parcels
• 34 landowners
• 6 minor road crossings
• 3 county road crossings
• 1 interstate highway crossing
• 1 railroad crossing
• Estimated 7 foreign transmission pipeline crossings

North Central Iowa Regional Economic & Port Authority
Natural Gas Pipeline & Customer Gas Usage Analysis
14January 2019
3.5 Alternative Route Option 2 – Northern Border Interconnect
The possibility of bringing a significant customer(s), who may require large loads and/or a high required
minimum pressure along this system was reviewed. This analysis also reviewed a route that connects
directly with Northern Border Pipeline (NBPL), which can supply higher pressures. This would
potentially eliminate the need to add compression at a prospective customer site. If this route were
selected, this could reduce the overall cost to the customer by offering a lower transportation tariff. The
pipeline interconnect would be approximately 3 miles east of Ventura along Highway 18, continuing
northwest to the Manly Terminal. Additional benefits of the alternative route would be to potentially
provide natural gas to other industrial and commercial customers along the route as shown in Figure
3.5.
Figure 3.5: Option 2, Segments 1 and 2 Route Map
Alternate Route Crossing Inventory
• Approximately 26.4 miles long from Northern Border Pipeline to 400th Street
• 155 parcels
• 80 landowners
• 26 minor road crossings
• 2 county road crossings
• 1 interstate highway crossing
• 2 railroad crossings
• Estimated 13 foreign transmission pipeline crossings

North Central Iowa Regional Economic & Port Authority
Natural Gas Pipeline & Customer Gas Usage Analysis
15January 2019
4.0 NATURAL GAS USE SUMMARY
4.1 Annual Usage
Natural gas demand criteria is necessary to accurately develop a flow analysis of any system. The
criteria used in the analysis of the Port Authority Pipeline was determined using American Gas
Association (AGA) and the Energy Information Administration (EIA) usage data from the past several
years. The usage data for the State of Iowa from the years 2002 to 2016 is summarized in Table 4.1.1.
Table 4.1.1: Historic Annual Natural Gas Usage in Iowa (AGA)
Year Residential
Volumes
Residential
Customers
Commercial
Volumes
Commercial
Customers
Industrial
Volumes
Industrial
Customers
2002 71,545,313 824,218 37,763,875 95,813 7,024,564 1,464
2003 74,024,406 832,230 37,480,544 95,444 7,428,131 1,439
2004 68,320,976 839,415 36,081,063 95,835 7,905,517 1,395
2005 67,271,229 850,095 35,325,705 96,494 9,414,158 1,391
2006 61,843,854 858,915 33,583,513 96,441 8,613,827 1,332
2007 67,754,401 865,553 36,009,474 96,550 9,187,272 1,294
2008 75,449,467 872,980 42,495,865 96,738 10,853,445 1,293
2009 70,111,285 875,781 41,123,713 97,036 10,491,788 1,250
2010 68,393,273 879,713 37,191,632 97,103 9,720,349 1,205
2011 67,096,738 883,733 37,399,831 97,075 9,217,865 1,110
2012 57,084,084 892,123 32,325,727 97,584 8,899,241 1,038
2013 72,519,162 895,414 41,035,725 97,334 9,738,027 1,074
2014 76,574,437 900,420 42,724,373 97,409 8,217,536 1,135
2015 62,738,781 908,058 34,839,376 97,834 6,291,188 1,130
2016 63,451,829 915,431 35,561,845 98,011 6,926,387 1,123
Avg. 68,278,616 872,939 37,396,151 96,847 8,661,953 1,245
Volumes are in MCF
It should be noted that the number of customers does not directly correlate to the amount of natural
gas consumed annually. Residential and commercial natural gas consumption is more closely tied to
climate temperature changes. Figure 4.1 represents how natural gas consumption for residential and
commercial use is closely tied to the temperature during winter months (December through February).
For example, in 2012, the average temperature was 29°, and gas consumption dropped. In 2013 and
2014, the gas consumption increased as the average temperature decreased by 9° over a 2-year period.

North Central Iowa Regional Economic & Port Authority
Natural Gas Pipeline & Customer Gas Usage Analysis
16January 2019
Figure 4.1: Historical Winter Natural Gas Consumption
Seasonal temperatures can significantly change gas demand, but not materially impact the number of
customers served. This could drastically impact sales and revenue, making it difficult to predict revenue.
Other factors that influence annual gas sales include increased agricultural and industrial usages. As
shown in Figure 4.1, unlike residential and commercial demand, industrial gas consumption remained
relatively consistent regardless of temperature. This is particularly important for rural areas, as there
are fewer residential and commercial customers. Although industrial gas consumption is relatively low
as an aggregate, the gas consumption per customer type shown in Table 4.1.2 for industrial usage far
exceeds residential and commercial usage.

North Central Iowa Regional Economic & Port Authority
Natural Gas Pipeline & Customer Gas Usage Analysis
17January 2019
Table 4.1.2: Annual Consumption per Customer Type
Year Residential Customer
Usage
Commercial Customer
Usage
Industrial Customer
Usage
2002 87 394 4,798
2003 89 393 5,162
2004 81 376 5,667
2005 79 366 6,768
2006 72 348 6,467
2007 78 373 7,100
2008 86 439 8,394
2009 80 424 8,393
2010 78 383 8,067
2011 76 385 8,304
2012 64 331 8,573
2013 81 422 9,067
2014 85 439 7,240
2015 69 356 5,567
2016 69 363 6,168
Avg. 78 386 7,049
Volumes are in MCF
Other factors that drive natural gas consumption are population density and location. Most of the
homes along the proposed route and the Town of Grafton are serviced by liquid propane (LP), due to
lack of natural gas infrastructure. According to the Propane Education & Research Council, 50% of rural
Americans utilize propane in their homes. Additionally, LP is also used for agricultural purposes where
natural gas is not readily available. Table 4.1.3 shows the natural gas equivalent for typical customers
that will be found along the proposed pipeline route currently being served by LP.
Table 4.1.3: Liquid Propane Equivalent
Customer Type
LP
Gallons per
Year
Energy
Equivalent
(MMBtu's)
Natural Gas
Equivalent
(MCF)
Residential Heating 1,500 137 132
Commercial Building Heating 6,000 547 528
Agricultural Grain Drying or Livestock Heating 30,000 2,739 2,642
Commercial Grain Drying 330,000 30,139 29,065
I-35 & 105 Interchange N/A 10,370 7,500
Methanol Plant N/A 16,939 16,335
High End User N/A 10,370 7,500

North Central Iowa Regional Economic & Port Authority
Natural Gas Pipeline & Customer Gas Usage Analysis
18January 2019
4.2 Daily Usage
When determining the capacity for a pipeline, it is necessary to establish the average daily usage per
customer. For this study, the data was analyzed by customer type to develop a realistic model to
generate a usage case basis. Using the data from Table 4.1.3, an Average Daily Usage (ADU) was
developed.
Table 4.2.1: Average Daily Usage by Customer Type
Customer Type
Average Daily
Usage
(MCFD)
Potential
Customers
Average
Natural Gas
Flow Rate
(MCFD)
Residential Heating 0.4 244 88
Commercial Building Heating 1.4 12 17
Agricultural Grain Drying or Livestock Heating 7.2 40 290
Commercial Grain Drying or Industrial User 80 12 956
I-35 & 105 Interchange 7,500 1 7,500
Methanol Plant 16,335 1 16,335
High End User 7,500 1 7,500
Totals 310 32,686
The values in Table 4.2.1 are derived by dividing the volume of natural gas equivalent consumed
annually by the number of days per year. To determine a more accurate value for the ADU of a “typical”
customer, it is necessary to account for the high-demand customers in the system. The number of
anticipated customers and customer types was derived by inventory of potential customers observed
along the proposed routes, census data, input from the County Economic Development Boards, and
input from the Port Authority. In Worth and Mitchell Counties, LP serves approximately 40 existing
agricultural customers, 7 commercial grain drying operations, and 3 small rural communities.
Consideration must also be given to the variation in demand over the course of a year for peak demand,
as variations in demand change daily.
As shown in Figure 4.1, energy consumption is not constant, therefore, consideration for peak demand
on the system must be factored into the analysis. According to the EIA, 50% of all residential and
commercial demand is captured between the months of November and March. Likewise, commercial
and agricultural customers will have peak demand during harvest, which can use between 50% and 70%
of the consumption in as little as 3 months. The flow rate utilized to size the pipeline system, as shown

North Central Iowa Regional Economic & Port Authority
Natural Gas Pipeline & Customer Gas Usage Analysis
19January 2019
in Table 4.2.2, was determined by taking the number of potential customers by customer type,
multiplying it by the ADU, and adjusting the results for peak demand.
Table 4.2.2: Peak Demand Flow
Customer Type Average
Daily Usage (MCFD)
Potential Customers
Natural Gas Flow Rate (4 Month) (MCFD)
Residential Heating 1.1 244 268
Commercial Building Heating 4.4 12 53
Agricultural Grain Drying or Livestock Heating 22.0 40 880
Commercial Grain Drying or Industrial User 242 12 2,904
I-35 & 105 Interchange 10,000 1 10,000
Methanol Plant 16,335 1 17,000
High End User 10,000 1 10,000
Totals 26,605 310 41,105
Based on reasonable assumptions and due to the peaking factor, the pipeline should be sized for an
average daily flow of 41,000 MCFD.

North Central Iowa Regional Economic & Port Authority
Natural Gas Pipeline & Customer Gas Usage Analysis
20January 2019
5.0 SYSTEM ANALYSIS
5.1 Natural Gas Supply
There are four NNG high pressure natural gas interstate transmission line interconnect options for the
Port Authority pipeline. NNG was approached to determine which of the lines has adequate gas
available to supply the Port Authority Pipeline. In the discussion, NNG stated that the location of the
proposed interconnect is at a prime location along their system, with abundant gas capacity. The
proposed interconnect with NNG has a MAOP of 1,000 psig. The normal operating pressure in the
summer is between 650 to 900 psig and between 500 to 990 psig in the winter. The pipe capacity and
sizing analysis was conducted using a design pressure of 500 psig at the interconnect, based on a
minimum pressure that would be expected at the interconnect during normal operating parameters in
the winter.
As stated in section 3.4, there is the potential for a significant customer(s) that may require year-round
large supplies of natural gas with a minimum supplied pressure in excess of 700 psig. In discussions with
NNG, they indicated that the proposed interconnect location has ample gas supply. Minimum pressure
requirements could possibly be an issue. However, if the Port Authority moves forward with the
development of this proposed pipeline, there will need to be further discussions with NNG and the
customer to validate the design parameters for the project.
5.2 Capacity & Sizing Analysis
To accurately determine the size and capacity needs of the pipeline system, it is important to examine
the location of the customers along the pipeline routes. For this purpose, the pipeline system was
divided into 3 segments:
• Segment 1 is a 13.1-mile pipeline that starts at the NNG interconnect, heading east along County
Road 400th Street to 0.5 miles east of Nuthatch Avenue.
• Segment 2 begins at the end of Segment 1 and continues south to the Manly Terminal, running
parallel to NNG’s existing pipeline.
• Segment 3 starts at the intersection of Segment 1 and 2 and continues east to St. Ansgar.
The route was selected by maximizing the number of potential users that could benefit from the project.
There are multiple farms with agricultural grain drying or livestock barn facilities along the proposed
route.

North Central Iowa Regional Economic & Port Authority
Natural Gas Pipeline & Customer Gas Usage Analysis
21January 2019
Table 5.2.1: Segments 1, 2 & 3 Potential Customers & Natural Gas Needs
Customer Type Average Daily Usage (MCFD)
Potential Customers
Natural Gas Flow Rate (MCFD)
Segment 1: 13.1 miles to 0.5 miles east of Nuthatch Avenue
Residential Heating 1.1 0 0
Commercial Building Heating 4.4 0 0
Agricultural Grain Drying or Livestock Heating 22.0 5 110
Commercial Grain Drying or Industrial User 242 0 0
I-35 & 105 Interchange 10,000 1 10,000
Subtotal - Segment 1 10,270 6 10,110
Segment 2: 3.1 miles to Manly Terminal
Residential Heating 1.1 0 0
Commercial Building Heating 4.4 0 0
Agricultural Grain Drying or Livestock Heating 22.0 0 0
Commercial Grain Drying or Industrial User 242 5 1,210
Methanol Plant 17,000 1 17,000
Subtotal - Segment 2 17,270 6 27,320
Segment 3: 18.8 miles to St. Ansgar
Residential Heating 1.1 244 268
Commercial Building Heating 4.4 12 53
Agricultural Grain Drying or Livestock Heating 22.0 35 770
Commercial Grain Drying or Industrial User 242 7 1,694
High-End User 10,000 1 10,000
Subtotal - Segment 3 10,270 299 12,785
Totals System 17,270 6 41,105
Segment 1 could be sized to carry the full natural gas demand on the system, approximately 41,105
million cubic feet per day (MCFD). Although it is unlikely that commercial and agricultural grain drying
will occur during the winter months (and unlikely that all farmers will be drying grain at the same time),
if necessary, the operator can restrict use in the agreement to keep firm commitments during the winter
months. It is reasonable to reduce the capacity requirements on the Segment 1 by 4,000 MCFD,
Segment 2 by 1,200 MCFD, and Segment 3 by 2,500 MCFD. This makes the peak load demand on each
segment approximately 37,000 MCFD, 26,000 MCFD, and 10,500 MCFD, respectively.
Following NNG’s engineering standards for onshore transmission lines, best practices would design for a
pressure drop of less than 5 psi per mile. Another general guideline is to maintain the gas velocity less
than 50 feet per second. Tables 5.2.2 and 5.2.3 show the summary for evaluating 3 pipe diameters.

North Central Iowa Regional Economic & Port Authority
Natural Gas Pipeline & Customer Gas Usage Analysis
22January 2019
Table 5.2.2: Capacity with Pressure Drop Limited
Segment Diameter Capacity MCFD Pressure Drop Velocity
Segment 1 8 13,900 5 16
Segment 1 10 25,500 5 19
Segment 1 12 41,100 5 21
Segment 2 8 13,300 5 16
Segment 2 10 24,500 5 19
Segment 2 12 39,500 5 21
Segment 3 8 12,700 5 19
Segment 3 10 23,400 5 22
Segment 3 12 37,600 5 24
Table 5.2.2 shows that neither an 8-inch nor 10-inch diameter pipeline meets the capacity needed for
Segments 1 or 2. Based on our calculations, a 12-inch diameter pipe meets the capacity needs for
Segments 1 & 2, and an 8-inch diameter pipe meets the capacity needed for Segment 3. However, actual
operating conditions and economic considerations should be factored in to evaluate the benefit of
having additional capacity for the pipeline system for future growth (covered in Section 6.0).
Similarly, Table 5.2.3 shows the calculations for evaluating 3 diameters using a natural gas velocity of 50
feet per second (fps) as the limiting criteria. In all cases, the 50 feet per second guideline exceeds the 5
psig pressure drop criteria. However, this is a guideline, and if needed, the pipeline does have excess
capacity for peak demand above and beyond the capacities shown in Table 5.2.2.
Table 5.2.3: Capacity with Velocity Limited
Segment Diameter Capacity MCFD Pressure Drop
(psig) Velocity
(fps)
Segment 1 8 24,800 20 50
Segment 1 10 43,500 17 50
Segment 1 12 67,500 16 50
Segment 2 8 22,700 23 50
Segment 2 10 38,000 19 50
Segment 2 12 57,000 16 50
Segment 3 8 13,350 10 50
Segment 3 10 23,600 9 50
Segment 3 12 37,000 8 50

North Central Iowa Regional Economic & Port Authority
Natural Gas Pipeline & Customer Gas Usage Analysis
23January 2019
Our analysis concluded that an 8-inch diameter pipeline does not meet the capacity needed for
Segments 1 & 2, using the 50 fps criteria or 5 psig per mile pressure drop. However, a 10-inch diameter
pipeline does meet the capacity for both criteria. The analysis also confirms that an 8-inch diameter
pipeline meets the capacity needed for Segment 3. As stated, economic considerations should be
factored in to evaluate the benefit of having extra capacity for the pipeline system (covered in Section
6.0). For the alternate route from Northern Border to the Manly Terminal, we determined that a 16-
inch pipeline would be needed from the interconnect to a point near Mason City and 12-inch pipeline
from Mason City to a point near the Manly Terminal.
5.3 Pipeline Design
It is our recommendation that the pipeline be designed and constructed to NNG’s specifications, with
the minimum standards in accordance with the Title 49 Code of Federal Regulations, Part 192,
"Transportation of Natural and Other Gas by Pipeline: Minimum Federal Safety Standards" (latest
edition). Provided all minimum federal safety standards have been met, ASME B31.8 "Gas Transmission
and Distribution Piping Systems" should also be used to supplement the requirements of 49 CFR, Part
192. Additional consideration will be incorporated into the design from permit conditions, right of way
agreements, and U.S. Industry Recommended Practices (ASME, API, NACE, ASTM, etc.). If a conflict
arises between the above-mentioned sources, the more stringent parameter should be implemented.

North Central Iowa Regional Economic & Port Authority
Natural Gas Pipeline & Customer Gas Usage Analysis
24January 2019
6.0 FINANCIAL ANALYSIS
6.1 Cost by Segment
The Port Authority faces a significant and immediate cost to construct these pipeline segments. Table
6.1 provides an estimate for the amount of carbon steel pipe, by diameter, and the estimated
installation cost. If phased, the Port Authority could reduce the upfront cost and initial investment.
Table 6.1: Total Installed Cost Per OD$/mile (based on August 2018 pricing)
Diameter (inches)
Pipeline Cost (OD$/mile)
8 $760,000
10 $950,000
12 $1,140,000
16 $1,520,000
Tables 6.1.1, 6.1.2 and 6.1.3 will show the different costs associated with each pipe segment in this
pipeline system.
Table 6.1.1: Segment 1 Cost by Pipe Diameter
Diameter (inches)
Segment Length (Miles)
Pipeline Cost (OD$/mile)
Total Cost
8 13.1 $760,000 $9,956,000
10 13.1 $950,000 $12,445,000
12 13.1 $1,140,000 $14,934,000
Table 6.1.2: Segment 2 Cost by Pipe Diameter
Diameter (inches)
Segment Length (Miles)
Pipeline Cost (OD$/mile)
Total Cost
8 3.1 $760,000 $2,356,000
10 3.1 $950,000 $2,945,000
12 3.1 $1,140,000 $3,534,000

North Central Iowa Regional Economic & Port Authority
Natural Gas Pipeline & Customer Gas Usage Analysis
25January 2019
Table 6.1.3: Segment 3 Cost by Pipe Diameter
Diameter (inches)
Segment Length (Miles)
Pipeline Cost (OD$/mile)
Total Cost
8 18.8 $760,000 $14,288,000
10 18.8 $950,000 $17,860,000
12 18.8 $1,140,000 $21,432,000
6.2 Total Project Installed Cost
It is our recommendation that the Port Authority consider phasing the construction to minimize the
initial investment and reduce overall risk. However, if the Port Authority is preparing to secure the
funds to develop pipeline Segments 1, 2, and 3 for a “shovel ready” site, the “all in” upfront investment
of approximately $36,328,000 should be budgeted for construction. This option is the most significant
financial burden facing the Port Authority. A detailed plan should be developed specifically to target
and aggressively market potential industrial development sites that could capitalize on both the financial
and operational benefits from this infrastructure.
Table 6.2.1: Total Installed Cost by Pipe Segment
Diameter (inches)
Pipeline Length (Miles)
Segment Pipeline Cost (OD$/mile)
Total Cost
12 13.1 1 $1,140,000 $14,934,000
12 3.1 2 $1,140,000 $3,534,000
10 18.8 3 $950,000 $17,860,000
Total 35.0 $36,328,000
For Option 2 NBPL route, the overall pipeline length increased by 11.8 miles and approximately
$21,432,000 in cost, for a total of approximately 46.8 miles and $57,760,000, respectively. This is a
significant increase in cost over the preferred route. However, there are also opportunities and benefits
associated with the NBPL route that we will review in sections 6.5 and 6.6.

North Central Iowa Regional Economic & Port Authority
Natural Gas Pipeline & Customer Gas Usage Analysis
26January 2019
Table 6.2.2: Total Installed Cost for Alternate Route
Diameter (inches)
Pipeline Length (Miles)
Segment Pipeline Cost (OD$/inch-ft)
Total Cost
16 21.0 Alt Route $1,520,000 $31,920,000
12 7.0 2 $1,140,000 $7,980,000
10 18.8 3 $950,000 $17,860,000
Total 46.8 57,760,000
6.2.1 Cost for Customer Service Connections (Taps)
The Port Authority and/or the customer will have to consider the cost to install a Customer Service
Connection to the pipeline. Based on the customer’s connected natural gas load, the following should be
considered as the estimated cost to provide a Customer Service Connection:
• Pipeline pressure regulation (cost to lower natural gas pressure from 800 PSIG pipeline pressure
to customer desired pressure):
o Small to medium loads (loads less than 45,000 SCFH): $10,000 to $30,000
o Large loads (loads greater than 45,000 SCFH): $25,000 to $60,000
• Service line costs (medium density polyethylene pipe):
Table 6.2.1.1 Pipe Material Cost (August 2018 Pricing)
Table 6.2.1.2 Pipe Installation Cost (August 2018 Pricing)
Service line costs will vary based on connected natural gas load and distance from the transmission
pipeline.
Pipe Size $/ft. SDR
2" 0.92 11
4" 2.88 11
6" 6.26 11
Pipe Size $/ft.
2" 10.00
4" 15.00
6" 20.00

North Central Iowa Regional Economic & Port Authority
Natural Gas Pipeline & Customer Gas Usage Analysis
27January 2019
For example, the cost for a service line to a commercial grain drying or industrial user with the grain
dryer located 500 ft. from the transmission pipeline would be approximately:
• Regulation: $15,000
• 2” Service line piping: 500 ft. x $0.92 $/ft. (pipe costs) x $10.00 /ft. (install cost) = $5,460
• Total service line cost (regulation and pipe installation): $20,460
6.3 Cost Estimating
The costs shown above are representative of a Class 3 estimate as defined by the AACE Classification
System for Budget Authorization/Control. This assumes approximately 10% to 40% of the project has
been defined, with an expected accuracy range between -20% to +50%. The construction cost for
pipelines varies greatly and factors such as price of steel, seasonal impacts, changing regulations, public
opposition, and other items must be considered. As the project develops, these factors will be identified
to better understand the risks and refine the estimate.
6.4 Rates Basis
There are many variables to consider when determining the rates for natural gas utilities. Before
customer rates are to be set, the utility must first understand these factors:
• Cost of the natural gas commodity
• Cost for transportation of the gas by NNG
• Cost of capital
• Cost of operations
• Return on investment
• Iowa Utilities Board Regulations
Ratemaking can be a laborious process and can take anywhere from a few months to more than a year
to be approved. According to the AGA: “Pipelines that transport or distribute natural gas, petroleum,
and other hazardous liquids are closely regulated in the United States. Pipeline companies commonly
have market power or operate as monopolies because it may not be cost-effective to have more than
one pipeline delivery system in the ground to serve a market or community. As a result, pipeline
operators are subject to comprehensive regulatory oversight by federal and state regulatory agencies, as
well as local community-based councils and boards.” AGA – Ratemaking for Energy Pipelines,
www.aga.org

North Central Iowa Regional Economic & Port Authority
Natural Gas Pipeline & Customer Gas Usage Analysis
28January 2019
As a utility, the Port Authority will be allowed to charge for the commodity, the transportation cost by
the Interstate pipeline, operations and maintenance costs, and a “reasonable” return on investment.
For this report, we analyzed 3 pipeline operator tariffs (Table 6.4).
Table 6.4 Tariff Analysis
Customer Volume
*Operator 1 $/therm
*Operator 2 $/therm
*Operator 3 $/therm
Average $/therm
Average $/MMBtu
Average $/Mcf
Small 0.11635 0.29700 0.17993 0.19776 1.97760 2.05077
Medium 0.05237 0.22360 0.07120 0.11572 1.15723 1.20005
Large 0.02364 0.04640 0.03012 0.03339 0.33387 0.34622
* Links to this information can be found on the Iowa Utility Board website
Each operator used different tariff rates depending on the ADU and could be categorized into small,
medium, and large customer types. We also reviewed a tariff of one Interstate Pipeline Operator, which
also had varying rates depending on the region, time of year, and the distance the commodity was
transported. Based on the calculations in this analysis, the Port Authority would need to charge
between $0.50 and $0.60 per Mcf. However, as stated above, the IUB will make the final determination
when evaluating the rate.
6.5 Revenue Schedule
Currently, the development of this pipeline system is based on speculation of future customers. Until
new customers are secured before or during pipeline construction, it is unlikely the Port Authority will
see an immediate return on its investment. Many of the existing potential customers are currently
serviced by LP and it may take several years for them to convert to natural gas. Some will likely stay
with LP, unless the Port Authority offers incentive packages to convert. Additionally, it is unlikely to
have firm commitments for new developments within the same year the pipeline is constructed.
Typically, there will be a 1 to 2 year time delay from when the pipeline is placed in-service, until the
developer’s site is ready for natural gas. The Port Authority should work with the customer to
coordinate construction of the pipeline with the developer’s construction schedule.

North Central Iowa Regional Economic & Port Authority
Natural Gas Pipeline & Customer Gas Usage Analysis
29January 2019
The key to the financial viability of the project is to secure an anchor customer such as a methanol,
ethanol, or fertilizer plant that has year-round natural gas demand. This will serve as a base load that
would generate revenue and drive the value of the pipeline asset once installed. The Port Authority will
have to negotiate rates and provide connections directly to new customers. Additionally, there will be
little to no value for an existing gas utility or customer to purchase gas from the Port Authority if they
are already being served by other interstate pipeline(s), as the existing customers will likely not accept
paying the extra cost burden from the Port Authority.
Table 6.5.1: Estimated Cost and Revenue
Years Annual Natural
Gas Usage (MCF) NNG Gas Charge
Gas Commodity Charge
Port Authority Transportation Charge
0-1 4,404 $2,422 $13,212 $2,202
2-5 6,532,921 $3,593,107 $19,598,763 $3,266,461
6-10 7,051,591 $3,878,375 $21,154,773 $3,525,796
11-20 8,084,441 $4,446,443 $24,253,323 $4,042,221
21+ 13,044,729 $7,174,601 $39,134,187 $6,522,365
Totals 13,044,729 $7,174,601 $39,134,187 $6,522,365
Table 6.5.2: Customer Growth Schedule
Years Residential
Heating
Commercial Building Heating
Agricultural Grain Drying or
Livestock Heating
Commercial Grain Drying or
Industrial User
Methanol Plant
High End User
0-1 0 0 2 0 0 0
2-5 25 1 3 1 1 0
6-10 50 2 5 2 0 0
11-20 70 3 10 4 0 0
21+ 99 6 20 5 0 1
Totals 244 12 40 12 1 1
The estimated cost and revenue schedule in Table 6.5.1 is speculative based on the customer growth
schedule in Table 6.5.2, and the charge rate to the customer is $0.50 per Mcf. This estimate does not
consider the rate of return on the investment or intermittent cost for repairs or replacements due to
third-party damages. The ROI will be dependent upon gas usages and final rates charged to the
customer. Additionally, because of the MAOP, this pipeline most likely will be classified as an intrastate
transmission pipeline, which will affect the cost of operations. However, the final determination of the

North Central Iowa Regional Economic & Port Authority
Natural Gas Pipeline & Customer Gas Usage Analysis
30January 2019
classification for this pipeline will made by the IUB. We are estimating between $100,000 - $150,000,
normal annual operating cost for all 3 Segments. The Port Authority will need to set aside capital for
abnormal conditions and replacements as the pipeline ages. We recommend retaining between 1% to
5% per year. For this analysis, we did not perform an in-depth financial model. However, using a
simplified 30-year payback structure with a 7% rate of return, the pipeline would need to generate
approximately $2,900,000 per year. This equates to approximately 16,000 MCFD in natural gas sales to
support the project.
Using that same financial model, the Option 2 route from NBPL will need to generate approximately
$4,700,000 per year or about 26,000 MCFD in natural gas sales. There are several opportunities in Cerro
Gordo County near Mason City that could be developed to make this a tangible option.
6.6 Economic Benefits
There are many benefits that will materialize from developing this much needed pipeline infrastructure.
This pipeline will provide safe, reliable energy to Port Authority customers, help attract businesses,
create jobs, and offer cost savings for rural homes, farms, and communities currently being served by
LP.
Table 6.6.1: Energy Saving Natural Gas vs. Liquid Propane
Customer Type LPUsage Per year
MMBtu Equivalent
NGSaving Per Year
Residential Heating 1,500 137 $1,203
Commercial Building Heating 6,000 548 $4,813
Agricultural Grain Drying or Livestock Heating 30,000 2,740 $24,063
Commercial Grain Drying 330,000 30,140 $264,695
Natural gas is one of our nation’s most abundant and cost-effective energy resources. Table 6.6.1
shows the potential energy savings per year for the customers that will benefit from this pipeline
infrastructure. In addition to stimulating the economy, the pipeline will provide a revenue source for
Port Authority counties that can help fund other infrastructure projects, county programs, and/or
reduce tax burdens on county residents.

North Central Iowa Regional Economic & Port Authority
Natural Gas Pipeline & Customer Gas Usage Analysis
31January 2019
If the Option 2 NBPL route is selected, the additional savings could be recognized by residents and
businesses along the system by reducing tariff costs to customers. Table 6.6.2 is the estimated annual
savings realized by the average customer.
Table 6.6.2: Energy Saving Alternate Route
Customer Type Alternate Route Saving Per Year
Residential Homes $73
Commercial Buildings $291
Agricultural Grain Drying or Livestock Operations $1,453
Commercial Grain Drying Operations $15,985
Industrial Operations (Methanol) $795,564

North Central Iowa Regional Economic & Port Authority
Natural Gas Pipeline & Customer Gas Usage Analysis
32January 2019
7.0 RECOMMENDATIONS
7.1 Project Phasing
As described in Section 6, it can take many years for the development across this pipeline system to be
fully realized. We recommend that the Port Authority secure an anchor customer commitment to justify
this infrastructure project.
We also recommend a phased approach for the development of the natural gas pipeline system. The
first phase should focus on developing Segment 1 and Segment 2, specifically targeting industrial
development with continued operations, to serve as the base load for the pipeline. Phase 2 should
focus on Segment 3, delivering natural gas to the St. Ansgar region. After the design of the Port
Authority Pipeline is complete, the pipe size can be modified without significant additional work, if a 12-
inch line is required to accommodate a larger customer. Note: Phase 2 can be constructed in parallel to
Phase 1. As stated above, there may be challenges associated with providing natural gas to St. Ansgar
and surrounding communities that are currently being served by other utilities. Phase 3 then involves
delivering natural gas to Mona, Riceville, and other sites along the pipeline route. Phase 3 has not been
addressed in this analysis and will need to be evaluated based on the success of Phase 1 and Phase 2.
7.2 Summary
This Analysis is meant to provide information that can be used by the Port Authority to supplement their
understanding of the economic climate and energy needs of the region. After securing an anchor
customer, we recommend continuing with detailed engineering design, permitting and right of way
acquisition of the selected pipeline routes. After the engineering plans are complete, the right of way is
secured, and permits are obtained, the pipeline will be ready for construction. The Port Authority can
make commitments to have the natural gas available before the customer’s development is complete.
We recommend the Port Authority convey to any large customer that is considering locating facilities
within their counties that a pipeline could be permitted, constructed, and in-service within
approximately 2 to 3 years.
According to our analysis, converting existing LP users to natural gas alone will not likely support the
cost to sustain the pipeline operations and maintenance and provide a return on investment (ROI) for
the pipeline system. We recommend that the Port Authority have at least one high-end natural gas user
with a minimum firm commitment of 10,000 MCFD before proceeding with the construction of this

North Central Iowa Regional Economic & Port Authority
Natural Gas Pipeline & Customer Gas Usage Analysis
33January 2019
pipeline system. The goal of the project is to stimulate economic development by providing the
necessary energy infrastructure to meet the demand of future customers. The development of this
project is centered around attracting new development and economic growth for the area. The success
of this project will be defined by the increase in new economic development in the region. This will be
seen through major investments that offer skilled employment, thereby stimulating residential and
commercial development.
The Port Authority has indicated that they do not have the expertise to operate the pipeline. If the Port
Authority decides to move forward with the project, they will need to consider who will operate the
pipeline and the associated cost. We also recommend that the Port Authority have an exit strategy for
the pipeline system. Once an anchor customer is secured, the Port Authority should approach several
operators that could find value in the asset. They may choose to participate in the project, as well as
operate the pipeline. The level and willingness to participate in the project will be driven by the secure
commitment from the natural gas customer(s). We recommend designing and constructing the pipeline
to meet NNG’s specifications. Furthermore, we recommend the pipeline be constructed in private right
of way. This will increase the value of the asset, making it more attractive for potential pipeline
companies that may want to participate in the project or eventually acquire the asset.
There are risks involved with any investment; however, with careful planning and due diligence, the risk
can be managed. Based on our industry experience and analysis of the potential demand for additional
sources of natural gas, we believe this to be a viable project, provided the Port Authority is able to
secure customers and attract development to their counties.

North Central Iowa Regional Economic & Port Authority
Natural Gas Pipeline & Customer Gas Usage Analysis
34January 2019
APPENDIX A
Route Maps

MITCHELL COUNTY
WORTH COUNTYCERRO GORDO COUNTY
400th St
§̈¦35
410th St
390th St
Whee
lerwo
od R
oad
Blueb
ill Ave
KENSETT
MANLY
GRAFTON£¤65
Chicago & NW Railroad
Chica
go &
NW
JOICE
Warb
ler Av
e
Chi M
il St P
aul
and P
acific
Railro
ad
Balsa
m Av
e
Echo
Ave
420th StCedar River
Shell Rock River
Winnebago River
§̈¦35
Footh
ill Ave
Yarro
w Ave
410th St
VENTURAMASON CITY
FERTILEWINNEBAGO COUNTY
HANCOCK COUNTY
020
032
011
019
027
034
018
033
013
008
022
032
024
022
017
009
015
024
008
034
017
026
009
036
028 025
008
012
027
010
013
023
012
014
035
017
007
033
032
029
014
035
023
002003
026
004005
019
006
018
007
005 004004 003 006001 005002
005 004 006002 001003005 004003
035034 031033034
002
033032 035 036
006
032
001
036031
005 004
034032 033
030 026029
003
036 034035 032
025 025028025
035 036
027
033 034
026
032
021
028 027
033
026029
009
029
016
031
030
031
019
030035
Source: Esri, DigitalGlobe, GeoEye, Earthstar Geographics, CNES/Airbus DS, USDA, USGS, AeroGRID, IGN, and the GIS User Community
Proposed Pipeline RoutesWorth, Mitchell, Cerro Gordo
& Hancock Counties, IowaJanuary 2019
NE
SW 0 2 4 6 8 101
Miles
SEGMENT #1ALTERNATE ST ANSGAR
INTERCONNECTSEGMENT #3
SEGMENT #1
SEGMENT #2
Joice
Northwood
Kensett St Ansgar
Osage§̈¦35
WORTH COUNTY, IA
MITCHELLCOUNTY, IA
PROJECT LOCATION
LegendProposed Segment #1 Alternate Pipeline RouteProposed Segment #1 Pipeline RouteProposed Segment #2 Pipeline RouteProposed Segment #3 Pipeline RouteProposed Northern Border Segments #1 & #2Parcel LinesRoadsRailroadsRivers, Streams, WetlandsCounty LinesPLSS Section Lines
NORTHERN BORDERSEGMENTS #1 & #2
CERRO GORDOCOUNTY, IA
HANCOCKCO. , IA
Proposed Segment #1 Alternate Pipeline Route72,789 Feet / 13.785 Miles(62) Parcels / (34) Owners(6) Minor Roads Crossed(3) County Roads Crossed(1) Interstate Highway Crossed(5) Canal,Creek,River Crossed(1) Railroad Crossed(1) NWI Assumed Wetland Crossed
Proposed Segment #1 Pipeline Route69,151 Feet / 13.096 Miles(61) Parcels / (30) Owners(8) Minor Roads Crossed(3) County Roads Crossed(1) Interstate Highway Crossed(2) Canal,Creek,River Crossed(1) Railroad Crossed(1) NWI Assumed Wetland CrossedProposed Segment #2 Pipeline Route16,435 Feet / 3.11 Miles(17) Parcels / (11) Owners(1) Minor Roads Crossed(2) County Roads Crossed(1) US Highway Crossed(2) Canal,Creek,River Crossed
Proposed Segment #3 Pipeline Route99,355 Feet / 18.816 Miles(89) Parcels / (55) Owners(10) Minor Roads Crossed(6) County Roads Crossed(1) US Highway Road Crossed(4) Canal,Creek,River Crossed(3) Railroad Crossed(6) NWI Assumed Wetland Crossed
Proposed Northern Border Segments #1 & #2 Pipeline Route139,376 Feet / 26.39 Miles(155) Parcels / (80) Owners(26) Minor Roads Crossed(2) County/State Roads Crossed(1) Interstate Highway Crossed(10) Canal,Creek,River Crossed(2) Railroad Crossed(2) NWI Assumed Wetland Crossed

400th St
§̈¦35
410th St
390th St Whee
lerwo
od R
oad
Blueb
ill Ave
KENSETT
Chicago & NW Railroad
JOICE
Cardi
nal A
ve
Everg
reen A
ve
Fir Av
e
")S28 Jonq
uil Av
e
")S34 Lilac
Ave
Mock
ingbir
d Ave
Nutha
tch Av
e
400th St
Sec: 005Twn: 098Rng: 022
Sec: 005Twn: 098Rng: 020
Sec: 004Twn: 098Rng: 022
Sec: 006Twn: 098Rng: 020
Sec: 002Twn: 098Rng: 021
Sec: 001Twn: 098Rng: 021
Sec: 003Twn: 098Rng: 021
Sec: 005Twn: 098Rng: 021
Sec: 004Twn: 098Rng: 021
Sec: 003Twn: 098Rng: 022
Sec: 035Twn: 099Rng: 021
Sec: 034Twn: 099Rng: 021 Sec: 031
Twn: 099Rng: 020
Sec: 033Twn: 099Rng: 021
Sec: 034Twn: 099Rng: 022
Sec: 002Twn: 098Rng: 022
Sec: 033Twn: 099Rng: 022Sec: 032
Twn: 099Rng: 022
Sec: 032Twn: 099Rng: 020
Sec: 035Twn: 099Rng: 022
Sec: 036Twn: 099Rng: 022
Sec: 006Twn: 098Rng: 021
Sec: 032Twn: 099Rng: 021
Sec: 001Twn: 098Rng: 022
Sec: 036Twn: 099Rng: 021
Sec: 031Twn: 099Rng: 021
Sec: 004Twn: 098Rng: 020
Source: Esri, DigitalGlobe, GeoEye, Earthstar Geographics, CNES/Airbus DS, USDA, USGS, AeroGRID, IGN, and the GIS User Community
Proposed Pipeline RouteWorth County, Iowa
January 2019
NE
SW 0 1 2 3 4 50.5
Miles
Joice
Northwood
Kensett St Ansgar
Osage
§̈¦35WORTH COUNTY, IA
MITCHELL COUNTY, IA
SEGMENT #1
LegendProposed Segment #1 Pipeline RouteParcel LinesRoadsRailroadsRivers, Streams, WetlandsCounty LinesPLSS Section Lines
Proposed Segment #1Pipeline Route
PROJECT LOCATION
Proposed Segment #1 Pipeline Route69,151 Feet / 13.096 Miles(61) Parcels / (30) Owners(8) Minor Roads Crossed(3) County Roads Crossed(1) Interstate Highway Crossed(2) Canal,Creek,River Crossed(1) Railroad Crossed(1) NWI Assumed Wetland Crossed

400th St
§̈¦35
410th St
390th St
Whee
lerwo
od R
oad
Blueb
ill Ave
KENSETT
Chicago & NW Railroad
JOICE
Cardi
nal A
ve
Everg
reen A
ve
Fir Av
e
")S28
Jonq
uil Av
e
")S34
Lilac
Ave
Mock
ingbir
d Ave
Nutha
tch Av
e
400th St
Sec: 005Twn: 098Rng: 020
Sec: 030Twn: 099Rng: 020
Sec: 029Twn: 099Rng: 020Sec: 025
Twn: 099Rng: 021
Sec: 028Twn: 099Rng: 021
Sec: 025Twn: 099Rng: 022
Sec: 027Twn: 099Rng: 022
Sec: 026Twn: 099Rng: 021
Sec: 032Twn: 099Rng: 020
Sec: 028Twn: 099Rng: 022
Sec: 027Twn: 099Rng: 021
Sec: 026Twn: 099Rng: 022
Sec: 029Twn: 099Rng: 021
Sec: 030Twn: 099Rng: 021
Sec: 029Twn: 099Rng: 022
Sec: 004Twn: 098Rng: 020
Sec: 009Twn: 098Rng: 020
Sec: 016Twn: 098Rng: 020
Source: Esri, DigitalGlobe, GeoEye, Earthstar Geographics, CNES/Airbus DS, USDA, USGS, AeroGRID, IGN, and the GIS User Community
Proposed Pipeline RouteWorth County, Iowa
January 2019
NE
SW 0 1 2 3 4 50.5
Miles
Joice
Northwood
Kensett St Ansgar
Osage
§̈¦35WORTH COUNTY, IA
MITCHELL COUNTY, IA
SEGMENT #1ALTERNATE
LegendProposed Segment #1 Alternate Pipeline RouteParcel LinesRoadsRailroadsRivers, Streams, WetlandsCounty LinesPLSS Section Lines
Proposed Segment #1Alternate
Pipeline Route
PROJECT LOCATION
Proposed Segment #1 Alternate Pipeline Route72,789 Feet / 13.785 Miles(62) Parcels / (34) Owners(6) Minor Roads Crossed(3) County Roads Crossed(1) Interstate Highway Crossed(5) Canal,Creek,River Crossed(1) Railroad Crossed(1) NWI Assumed Wetland Crossed

WORTH COUNTY
410th St
KENSETT
MANLY
£¤65
Chi M
il St P
aul
and P
acific
Railro
ad
Shell Rock River
020
017
008
029
006002 001003
035034 031036
004
033
005 004
032035 036033 034032
021
009
016
030027 029026 025028
031 033
Source: Esri, DigitalGlobe, GeoEye, Earthstar Geographics, CNES/Airbus DS, USDA, USGS, AeroGRID, IGN, and the GIS User Community
Proposed Pipeline RoutesWorth County, Iowa
January 2019
NE
SW 0 1 2 3 4 50.5
Miles
SEGMENT #2
Joice
Northwood
Kensett St Ansgar
Osage§̈¦35
WORTH COUNTY, IA
MITCHELLCOUNTY, IA
PROJECT LOCATION
LegendProposed Segment #1 Alternate Pipeline RouteProposed Segment #1 Pipeline RouteProposed Segment #2 Pipeline RouteProposed Segment #3 Pipeline RouteProposed Northern Border Segments #1 & #2Parcel LinesRoadsRailroadsRivers, Streams, WetlandsCounty LinesPLSS Section Lines
CERRO GORDOCOUNTY, IA
HANCOCKCO. , IA
Proposed Segment #2 Pipeline Route16,435 Feet / 3.11 Miles(17) Parcels / (11) Owners(1) Minor Roads Crossed(2) County Roads Crossed(1) US Highway Crossed(2) Canal,Creek,River Crossed

WORTH COUNTY MITCHELL COUNTY
KENSETT
MANLY
GRAFTON
ST ANSGAR
£¤65
Chica
go &
NW
Railro
ad
Warb
ler Av
e
Chi M
il St P
aul
and P
acific
Railro
ad
Balsa
m Av
e
Echo
Ave
420th St
UV105
Cedar River
Deer Creek
Shell Rock River
Footh
ill Ave
Yarro
w Ave
410th St
008
017
020
004
034032 033
026
035
003
036 034035 032
025
035 036033 034 033
009
016
031031
005
029
032
019
030
021 Source: Esri, DigitalGlobe, GeoEye, Earthstar Geographics, CNES/Airbus DS, USDA, USGS, AeroGRID, IGN, and the GIS User Community
Proposed Pipeline RoutesWorth & Mitchell Counties, Iowa
January 2019
NE
SW 0 1 2 3 4 50.5
Miles
ST ANSGARINTERCONNECT
SEGMENT #3
Joice
Northwood
Kensett St Ansgar
Osage§̈¦35
WORTH COUNTY, IA
MITCHELLCOUNTY, IA
PROJECT LOCATION
LegendProposed Segment #1 Alternate Pipeline RouteProposed Segment #1 Pipeline RouteProposed Segment #2 Pipeline RouteProposed Segment #3 Pipeline RouteProposed Northern Border Segments #1 & #2Parcel LinesRoadsRailroadsRivers, Streams, WetlandsCounty LinesPLSS Section Lines
CERRO GORDOCOUNTY, IA
HANCOCKCO. , IA
Proposed Segment #3 Pipeline Route99,355 Feet / 18.816 Miles(89) Parcels / (55) Owners(10) Minor Roads Crossed(6) County Roads Crossed(1) US Highway Road Crossed(4) Canal,Creek,River Crossed(3) Railroad Crossed(6) NWI Assumed Wetland Crossed

MITCHELL COUN
WORTH COUNTYCERRO GORDO COUNTY
400th St
§̈¦35
410th St
390th St
Whee
lerwo
od R
oad
Blueb
ill Ave
KENSETT
MANLY
GRAFTON£¤65
Chicago & NW Railroad
Chica
go &
JOICE
Warb
ler Av
e
Chi M
il St P
aul
and P
acific
Railro
ad
Balsa
m Av
e
420th St
Shell Rock River
Winnebago River
§̈¦35
Yarro
w Ave
410th St
VENTURAMASON CITY
FERTILEWINNEBAGO COUNTY
HANCOCK COUNTY
020
032
011
019
027
034
018
033
013
008
022
032
024
022
017
009
015
024
008
034
017
026
009
036
028 025
008
012
027
010
013
023
012
014
035
017
007
033
032
029
014
035
023
002003
026
004005
019
006
018
007
005 004004 003 006001 005002
005 004 006002 001003005 004003
035034 031033034
002
033032 035 036
006
032
001
036031
005 004
034032 033
030 029
003
036035032
025028025
035 036
027
033 034
026
032
021
028 027
033
026029
009
029
016
031
030
031 034
Source: Esri, DigitalGlobe, GeoEye, Earthstar Geographics, CNES/Airbus DS, USDA, USGS, AeroGRID, IGN, and the GIS User Community
Proposed Pipeline RoutesWorth, Cerro Gordo
& Hancock Counties, IowaJanuary 2019
NE
SW 0 2 4 6 8 101
Miles
Joice
Northwood
Kensett St Ansgar
Osage§̈¦35
WORTH COUNTY, IA
MITCHELLCOUNTY, IA
PROJECT LOCATION
LegendProposed Segment #1 Alternate Pipeline RouteProposed Segment #1 Pipeline RouteProposed Segment #2 Pipeline RouteProposed Segment #3 Pipeline RouteProposed Northern Border Segments #1 & #2Parcel LinesRoadsRailroadsRivers, Streams, WetlandsCounty LinesPLSS Section Lines
NORTHERN BORDERSEGMENTS #1 & #2
CERRO GORDOCOUNTY, IA
HANCOCKCO. , IA
Proposed Northern Border Segments #1 & #2 Pipeline Route139,376 Feet / 26.39 Miles(155) Parcels / (80) Owners(26) Minor Roads Crossed(2) County/State Roads Crossed(1) Interstate Highway Crossed(10) Canal,Creek,River Crossed(2) Railroad Crossed(2) NWI Assumed Wetland Crossed


