ENGLISH PUBLIC LIBRARIES RESEARCH REVIEW AND INITIAL STRATEGIC RECOMMENDATIONS DATE NOVEMBER 29 2004 CONSULTANT JOSHUA BLACKBURN CLIENT MLA COPYRIGHT MLA PREPARED FOR ANDREW STEVENS CONTACT [email protected]
Transcript
ENGLISH PUBLIC LIBRARIESRESEARCH REVIEW AND INITIAL STRATEGIC RECOMMENDATIONS
analysis of research relating to library usage, reading, lifestyle & UK demographics in order to
objectives
identify key issues within the current library offer
explore needs of principal target audiences
shape the strategic priorities for ongoing marketing & communications
What obstacles stand in the way of higher library usage?
key questions
Who are we trying to reach?
What messages do we need to communicate to key groups?
What is the best way of getting the message out there?
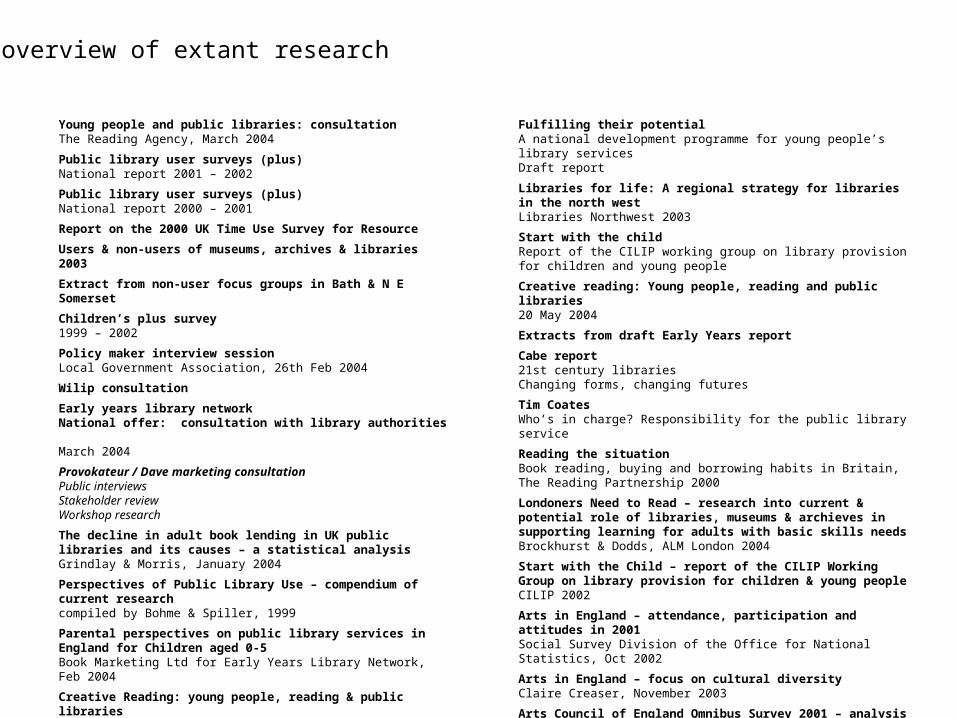
Young people and public libraries: consultationThe Reading Agency, March 2004
Public library user surveys (plus)National report 2001 – 2002
Public library user surveys (plus)National report 2000 – 2001
Report on the 2000 UK Time Use Survey for Resource
Users & non-users of museums, archives & libraries2003
Extract from non-user focus groups in Bath & N E Somerset
Children’s plus survey1999 – 2002
Policy maker interview sessionLocal Government Association, 26th Feb 2004
Wilip consultation
Early years library networkNational offer: consultation with library authorities March 2004
Provokateur / Dave marketing consultationPublic interviewsStakeholder reviewWorkshop research
The decline in adult book lending in UK public libraries and its causes – a statistical analysisGrindlay & Morris, January 2004
Perspectives of Public Library Use – compendium of current researchcompiled by Bohme & Spiller, 1999
Parental perspectives on public library services in England for Children aged 0-5Book Marketing Ltd for Early Years Library Network, Feb 2004
Creative Reading: young people, reading & public librariesDraft report, May 2005
Fulfilling their potentialA national development programme for young people’s library servicesDraft report
Libraries for life: A regional strategy for libraries in the north westLibraries Northwest 2003
Start with the childReport of the CILIP working group on library provision for children and young people
Creative reading: Young people, reading and public libraries 20 May 2004
Extracts from draft Early Years report
Cabe report21st century librariesChanging forms, changing futures
Tim CoatesWho’s in charge? Responsibility for the public library service
Reading the situationBook reading, buying and borrowing habits in Britain, The Reading Partnership 2000
Londoners Need to Read – research into current & potential role of libraries, museums & archieves in supporting learning for adults with basic skills needsBrockhurst & Dodds, ALM London 2004
Start with the Child – report of the CILIP Working Group on library provision for children & young peopleCILIP 2002
Arts in England – attendance, participation and attitudes in 2001Social Survey Division of the Office for National Statistics, Oct 2002
Arts in England – focus on cultural diversityClaire Creaser, November 2003
Arts Council of England Omnibus Survey 2001 – analysis for ResourceClaire Creaser & Sonya White, February 2003
overview of extant research
contents
findings
strategic issues & recommendations
next steps
overview
the wider context
library user profile
library usage
attitudes to libraries
trends in reading & learning
libraries & parents
young people & libraries
The wider context
Changing population
Average age will rise from 39.8 years in 2006 to 41.2 years in 2016
(1) Source: Government Actuary Department, September 2002
60% of the projected 4.3m increase in UK population between 2001-26 is attributed to inward migration
By 2007, the population of pensionable age is projected to exceed the number of children
By 2011 only 18% of the workforce will be white, male, under 35 and heterosexual (1)
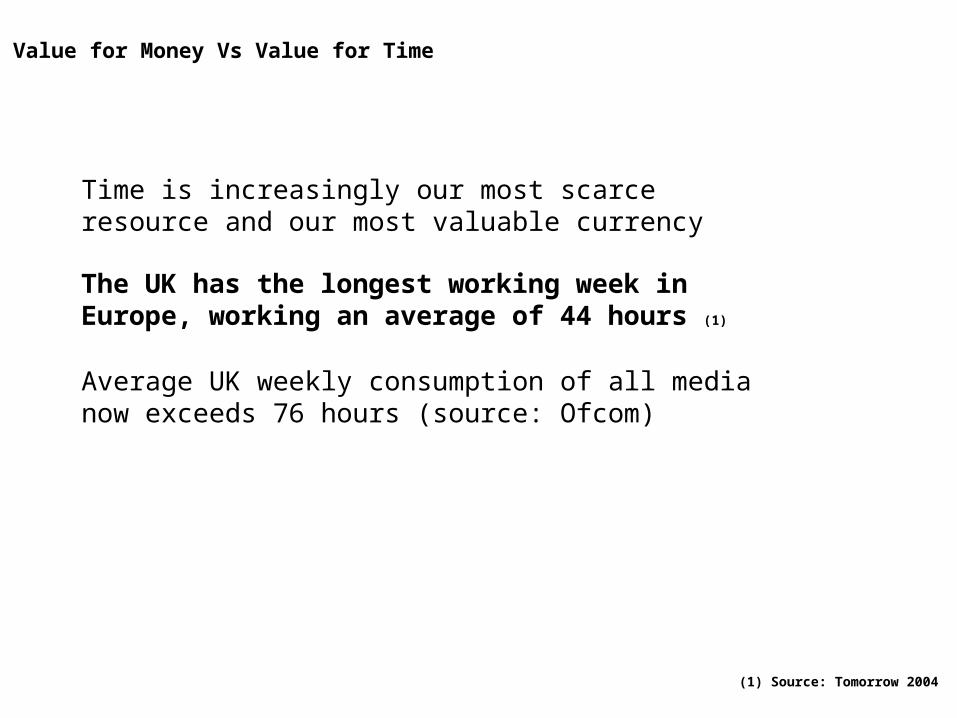
Value for Money Vs Value for Time
Time is increasingly our most scarce resource and our most valuable currency
(1) Source: Tomorrow 2004
The UK has the longest working week in Europe, working an average of 44 hours (1)
Average UK weekly consumption of all media now exceeds 76 hours (source: Ofcom)
The way we are learning is changing
Just in case learning Vs Just in time learning
(1) Source: Tomorrow 2004
Over 100,000 UK children are home taught, compared to just a few hundred 20 years ago
EQ Vs IQ
Source: Ofcom 2004
1999
41.2 hours
25.6 hours
91 Minutes
19 minutes
0 minutes
People are changing the way they consume media and information
2003
43.5 hours
26.1 hours
108 Minutes
94 minutes
180 minutes
Radio Listening
TV Viewing
Telephone calls
(mixed & mobile)
Dial up Internet
Broadband
The paradox of UK consumer behaviour
On the one hand
We’re earning more
More choice
We believe service is improving
We want more personal attention
We are more professional, informed and confident
(1) Source: Tomorrow 2004
On the other hand
Value for money is ever more important
Less time to choose
We complain more
We resent intrusion
We are more indecisive
Access to computers
Source: Start with the Child, Report of CILIP Working Group on library provision for children & young people, 2002
Computer ownership amongst 7 – 16 yr olds
54
61
64
72
11
14
19
27
0 20 40 60 80
5 to 7
7 to 11
11 to 14
14 to 16
computer in own room
access to internet
%
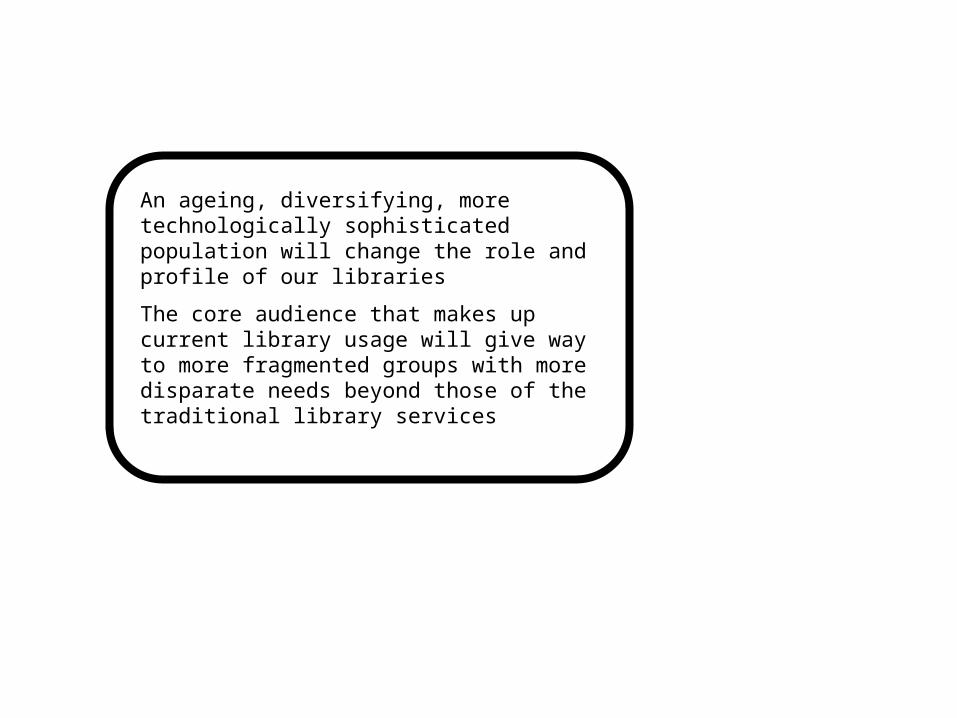
An ageing, diversifying, more technologically sophisticated population will change the role and profile of our libraries
The core audience that makes up current library usage will give way to more fragmented groups with more disparate needs beyond those of the traditional library services
Trends in reading & learning
Reading Hours spent reading
0
1
2
3
4
5
6
7
8
9
0 to 5 6 to 11 12 to 16 17 to 24 25 to 34 35 to 44 45 to 54 55 to 64 64+
Source: Reading the Situation: The Reading Partnership, 2000
Ave
rag
e h
ou
rs p
er
we
ek
Book borrowing habits
Reasons for changing library borrowing
0 20 40 60
more time
moreconvenient
betterbooks
buy lessbooks
0 20 40 60
less time
buy morebooks
lessconvenient
not enoughgood books
reasons for borrowing more books
reasons for borrowing less books
Source: Reading the Situation: The Reading Partnership, 2000
% %
Learning & libraries
Source: Londoners Need to Read, Report for ALM London, July 2004
Suitable venues for learning
86
79
53
35
9
5
3
1
0
0 20 40 60 80 100
college
library
community centre
primary or secondary school
museum
art gallery
café or restaurant
religious building
archive
%
Learning & libraries
Source: Londoners Need to Read, Report for ALM London, July 2004
Ability of libraries to deliver when it comes to learning
86
79
53
35
9
0 20 40 60 80 100
one to one help frommy tutor
friendly andwelcoming staff
I can choose what Iwant to learn
lots of resources tohelp me
I can come back forsupport
%
Current reading patterns relate popularity of reading to age
Borrowing & reading of books is most strongly related to perceived availability of time. Reading is competing with all other leisure activities for a share of our day
The library is regarded as a natural and supportive home of learning, across all age groups
Library user profile
The market
(1) Source: Public Library Statistics Library & Information Statistics Tables (2001)
58% of UK population are registered library borrowers (1)
Estimated user base of 27 million people (2)
Potential base of 33 million people (2)
(2) Source: Draft: Wider Information and Libraries Issues Project. Briefing Papers for the Steering Group
Regular usage of public libraries could be as low as 20% (3)
(3) Source: Comments from Public Library Policy & Social Exclusion Project Research Team (2000)
Library usage
10,000,000
12,000,000
14,000,000
16,000,000
18,000,000
20,000,000
22,000,000
24,000,000
97/98 98/99 99/00 00/01
Source: Public Library User Surveys National Report 2001-2
Number of active borrowers…
100,000
150,000
200,000
250,000
300,000
97/98 98/99 99/00 00/01
Number of borrowers requests not satisfied
Library visits
3
5
8
8
21
55
0 10 20 30 40 50 60
Once
Twice
3-5 times
6-10 times
11+ times
none
Source: Arts in England, attendance, participation and attitudes in 2001 (Arts Council of England)
Proportions visiting libraries in last 12 months
%
Library users
10
17.4
15.7
15.5
17.3
12.8
5.4
4.8
1.9
0 2 4 6 8 10 12 14 16 18 20
75+
65-74
55-64
45-54
35-44
25-34
20-24
15-19
14-
Source: Public Library User Surveys National Report 2001-2
By age
%
Library users
Source: Public Library User Surveys National Report 2001-2
White91%
All others9%
Male41%
Female59%
British86%
All others14%
By sex, colour & nationality
Library users
Source: Parental perspectives on public library services in England for children aged 0-5, Book Marketing Limited, February 2004
Use made of public library, by social grade
0
5
10
15
20
25
30
35
40
45
50
borrow items spend time reading attend story telling /activity session
borrow items for 6-15 child
borrow items for self
AB
C1
C2
DE
%
Library users
23.1
14.5
5.1
5.5
36.7
9.6
3.6
7.5
3.1
0 5 10 15 20 25 30 35 40
Full time employment
Part time employment
Self employed
Unemployed
Retired
Looking after home
Part time student
Full time student
Sick / disabled
Source: Public Library User Surveys National Report 2001-2
By employment
%
3744 43 42 45 46
50 49 46
0
10
20
30
40
50
60
70
80
90
100
North
Eas
t
North
Wes
t
Yorks
hire &
Hum
bersid
e
East M
idlan
ds
West
Mid
lands
Easte
rn
Lond
on
South
East
South
Wes
t
Library visits
Source: Arts in England, attendance, participation and attitudes in 2001 (Arts Council of England)
Percentage using a library by Government Office Region
(Solid line represents England average)
%
In market terms, the potential is there to substantially increase library usage, although tracking data indicates that libraries are a declining influence in our lives
Despite somewhat conflicting data, the typical reader profile would appear to be AB, 55+, female, white, British, retired & metropolitan
One aspect of declining library use can therefore be explained by a shifting demographic that does not reflect the current dominant user types and the wider social context that is changing British lifestyles and leisure choices
The challenge for marketing is therefore to begin telling a new story to a new audience – reflecting the lives they lead and the priorities they have
Library usage
Library usage
Source: Report on the 2000 UK Time Use Survey, July 2003
Library visits by time of day
Time of day
8-12am
12-3 pm
3-7 pm
7pm – 8am
% of visits
36%
37%
23%
5%
74%
Library usage
71
36
24
13.5
9.5
8
6
6
6
6
6
2
1.5
1
0 10 20 30 40 50 60 70 80
Books…
Browse
Seek information
Newspapers
Study
Videos…
CDs…
Cassettes…
Internet
Computer
Photocopier
Event / exhibition
DVD…
CD-roms…
Source: Public Library User Surveys National Report 2001-2
%
Library users
0 50 100
UK Average
-24
25-44
45-64
65+
0 5 10 15 20
UK Average
-24
25-44
45-64
65+
0 10 20 30 40
UK Average
-24
25-44
45-64
65+
0 10 20 30
UK Average
-24
25-44
45-64
65+
books… seek information…
videos… study…
% %
% %
0 20 40 60 80 100
White
Inidan
Pakistani
Bangladeshi
Black African
Black Caribbean
Chinese
%0 10 20 30 40
White
Inidan
Pakistani
Bangladeshi
Black African
Black Caribbean
Chinese
%
0 10 20 30 40 50
White
Inidan
Pakistani
Bangladeshi
Black African
Black Caribbean
Chinese
%0 2 4 6 8 10
White
Inidan
Pakistani
Bangladeshi
Black African
Black Caribbean
Chinese
%
Library usage
books… seek information…
videos… study…
Propensity to use different library services, by ethnic group
Source: CIPFA (2001) PLUS 2000-2001: National Report
Library usage
“Heavy borrowers of books are a minority of users but account for 70-80% of all traffic.” (1)
(1) Source: Public Library Use & Users: Statistical Explorations (2001)
Library usage
“Whilst older users tend to focus on book borrowing & reading newspapers & magazines, younger people are more likely to borrow CDs, videos, seek information & study.” (1)
(1) Source: Public Library Use & Users: Statistical Explorations (2001)
(1) Source: Public Library Use & Users: Statistical Explorations (2001)
Library usage
“Whilst white groups will predominantly use libraries to borrow or return books, other communities make greater use of the facilities to search for information, sit, study, read newspapers and to borrow CDs and videos.” (1)
(1) Source: Users & non users of museums, archives & libraries, 2003
Usage is still oriented around the traditional library service: books & reading
Loan rates indicate that the majority of library borrowing is focused on a minority of library users
An important opportunity is highlighted by the usage patterns of less traditional target audiences
Both young people and those from ethnic minorities demonstrate a far greater interest in the broader range of library services
These wider services relate far more to our changing society and should be a central part of any future communications
Attitudes to libraries
Library usage
39
22
17
14
12
8
6
5
4
0 10 20 30 40 50
no reason to go
too busy
buy books
not interested in books
borrow from friends, family
not interested in any of the services
too young
get info elsewhere
opening hours
Source: Book Marketing Limited (1998)
Reasons for not using libraries
%
Library perceptions
Source: Public Library User Surveys National Report 2001-2
64
53
47
46
45.5
43
38
31
28
29
29
29
28
0 10 20 30 40 50 60 70
Staff helpfulness
Staff knowledge
Building access
Information & enquiry service
Time spent waiting for service
Condition of interior
Children's servcies
Signs & guiding
Exterior condition
Computers
Layout
Hours of opening
Seating & tables
What do you think of this library? (those answering ‘very good’)
%
Library usage Buying vs borrowing books
54
50
19
20
13
12
4
42
45
48
37
22
21
11
0 10 20 30 40 50 60
have good idea ofwhat want beforehand
enjoy browsing
willing to experiment
get books hadn'tplanned
no idea what wantbeforehand
ask assistant for help
find it difficult to findbooks wanted
borrowing
buying
Source: Reading the Situation: The Reading Partnership, 2000
%
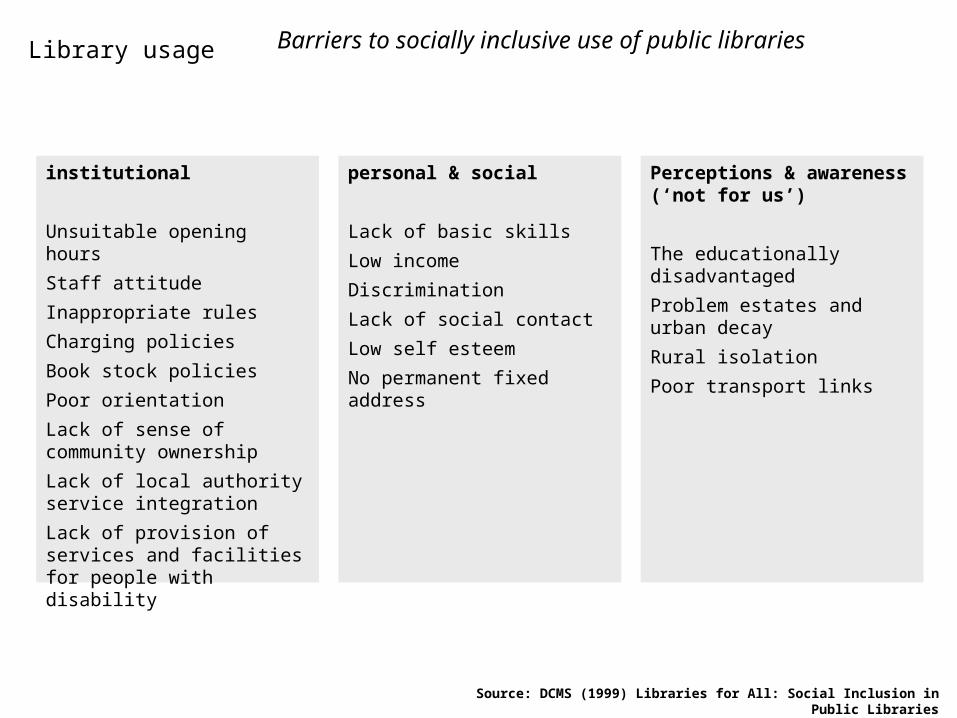
Library usage Barriers to socially inclusive use of public libraries
Source: DCMS (1999) Libraries for All: Social Inclusion in Public Libraries
institutional
Unsuitable opening hours
Staff attitude
Inappropriate rules
Charging policies
Book stock policies
Poor orientation
Lack of sense of community ownership
Lack of local authority service integration
Lack of provision of services and facilities for people with disability
personal & social
Lack of basic skills
Low income
Discrimination
Lack of social contact
Low self esteem
No permanent fixed address
Perceptions & awareness (‘not for us’)
The educationally disadvantaged
Problem estates and urban decay
Rural isolation
Poor transport links
Vision of libraries
Source: non user focus groups, Bath & NE Somerset
Suggested improvements to library service
Environment
ComfortableCoffee areaInspiringChild friendlyChildren’s areasSomething for young peopleBorders / WaterstonesQuiet areaLightCommunity servicesInformal areasReading areaLovely shelvingInternet cafépictures
Facilities
Careers adviceCaféNew, fresh stockFast internet accessMusic and filmsComputersListening stations for musicFurnitureLearning centreCrechePlay music?Late books remindersDelivery serviceMeeting roomsLarge print books
activities
Book groupsAuthor talksCreative writingStudy nightsStory clubsReadings from local guestsHost other eventsFilm clubTalks on healthComputer lessonsLocal referenceBook related fun (e.g. Scrabble)After school clubsHelping with form filling
Marketing ideas
Welcoming staffHelpful staffTheme daysSign postson line stock listsWork with schoolsUp to date displaysPublicityNotice boards‘in touch’Opening hoursPromote classics / modern classicsBus serviceBook fairs
Non library users are not being given a compelling reason to go to the library
For library users, staff and service are amongst the most significant strengths of the library service
A comparison of attitudes between those who borrow and buy books indicate an interest in experimenting and exploring
Both in terms of the barriers to entry and the suggested changes we how important the perceived library experience is to users
Young people & libraries
Changing behaviour amongst 7 to 14 year oldsChildren’s lifestyle choices
Source: Carrick James Child Tracker Feb 02
95
78
75
74
67
58
45
40
39
34
0 50 100
any sport
video / dvd
played with friends
cds / tapes
toys / games
computer games
books
shopping
park
cinema
%
87
78
64
74
54
71
43
33
29
32
0 50 100
1997 2001
- 8
- 11
- 13
+ 13
- 7
- 10
Source: Childwise Monitor 2001 / 2002
Access of the internet by age
03
24
52
72
9396
0
10
20
30
40
50
60
70
80
90
100
0 to 2 3 yrs 5 to 6 yrs 7 to 8 yrs 9 to 10 yrs 11 to 12 yrs 13 to 16 yrs
%
internet usage
Children’s lifestyle choices
Source: Carrick James Child Tracker Feb 02
Leisure activities, by age (5-8 and 9-12)
99
50
81
56
3
99
68 7073
29
0
10
20
30
40
50
60
70
80
90
100
TV Computer Print Audio Mobile
5 to 8
9 to 12%
Source: Carrick James Child Tracker Feb 02
Leisure activities, by sex
96
69 68
59
13
99
50
82
70
19
0
10
20
30
40
50
60
70
80
90
100
tv Computer Print Audio Mobile
boys
girls%
Children’s lifestyle choices
Source: Carrick James Child Tracker Feb 02
Computer uses amongst 8-15 year olds
84
59
39 38
29 2924 22
13
0
10
20
30
40
50
60
70
80
90
100
gam
ing
hom
ework
inte
rnet f
or inf
orm
ation
mus
ic
inte
rnet p
layin
g gam
es
art /
desig
n / d
rawin
g
email
lette
rs /
typi
ng
inte
rnet t
o chat
%
Children’s computer usage
Young people
Source: Social Focus on Young People, HMSO 2000
Libraries in relation to other social activities
8277
68 65 63
41 39
3127
24 2114
0
10
20
30
40
50
60
70
80
90
pub
fast
food
disc
o
cinem
a
rest
aura
nt
libra
ry
Short
break
hol
iday
Sports
eve
nt
Fun fa
ir
Histor
ic bu
ilding
Mus
eum o
r art
galle
ry
Theatre
% o
f p
eo
ple
18
-24
s w
ho
vis
it…
Young people & libraries
Source: Children’s Public Library User Survey 2002
What young people do in the library today
73
40.2
25.2
21.4
15.5
13.5
11.2
10
9.7
6.4
6.1
3.4
0 10 20 30 40 50 60 70 80
borrow books
look around
read books
borrow videos
look for information
use the games
schoolwork
cds / cassettes
computer / cd-roms
meet friends
event / activity
photocopier
%
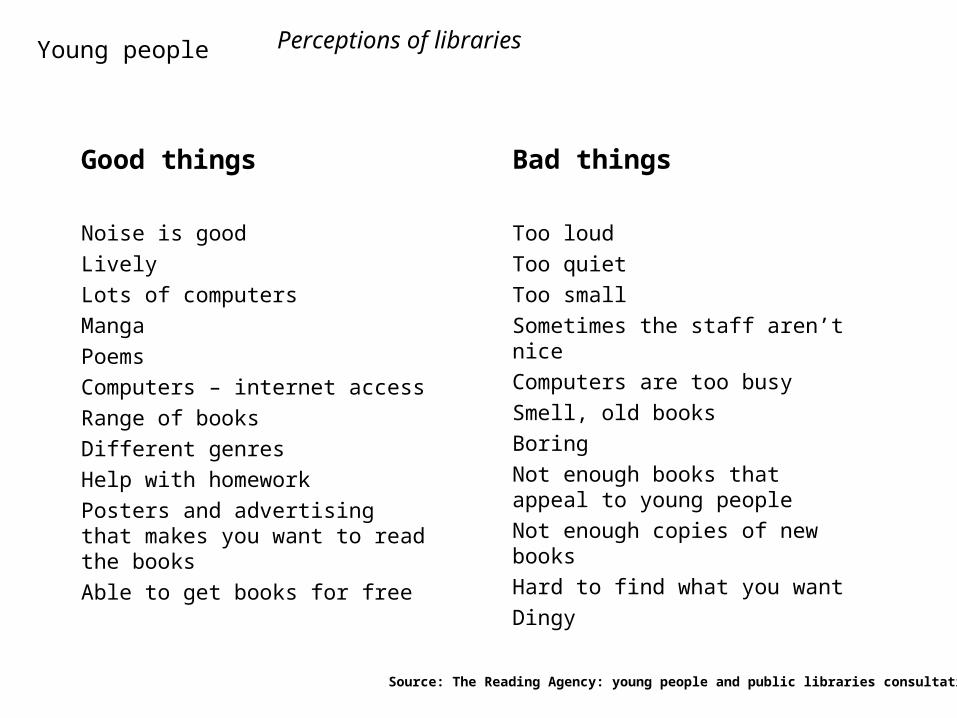
Young people
Source: The Reading Agency: young people and public libraries consultation
Perceptions of libraries
Good things
Noise is good
Lively
Lots of computers
Manga
Poems
Computers – internet access
Range of books
Different genres
Help with homework
Posters and advertising that makes you want to read the books
Able to get books for free
Bad things
Too loud
Too quiet
Too small
Sometimes the staff aren’t nice
Computers are too busy
Smell, old books
Boring
Not enough books that appeal to young people
Not enough copies of new books
Hard to find what you want
Dingy
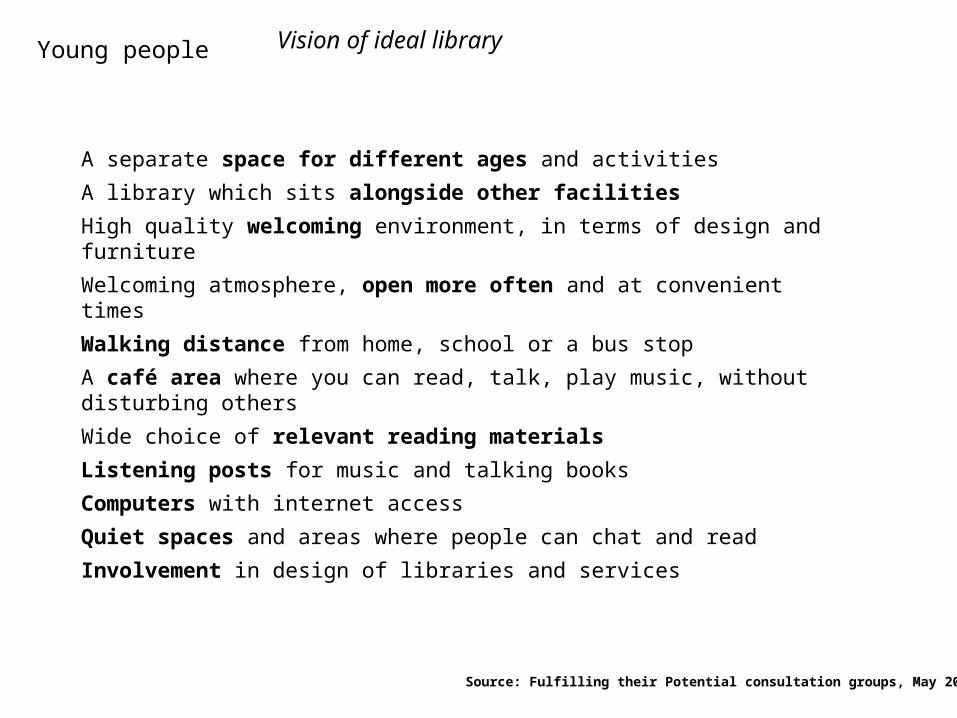
Young people
Source: Fulfilling their Potential consultation groups, May 2004
Vision of ideal library
A separate space for different ages and activities
A library which sits alongside other facilities
High quality welcoming environment, in terms of design and furniture
Welcoming atmosphere, open more often and at convenient times
Walking distance from home, school or a bus stop
A café area where you can read, talk, play music, without disturbing others
Wide choice of relevant reading materials
Listening posts for music and talking books
Computers with internet access
Quiet spaces and areas where people can chat and read
Involvement in design of libraries and services
There is well documented evidence of significant lifestyle changes amongst young people – more solitary, less active, less outdoor, more technology
These lifestyle changes are anticipated to become defining features of this generation as it continues to develop
Research regarding the difference between the ages and sexes would seem to indicate an inverse relationship between reading habits and computer usage
Both current library usage and expectations for the ideal library confirm a strong interest in a wider range of activities and a more engaging library experience
Libraries & parents
Reading Reading activities by presence of children
7175
16
8487
58
0
10
20
30
40
50
60
70
80
90
100
Books Newspapers & magazines CD rom / internet
No children
Children
Source: Reading the Situation: The Reading Partnership, 2000
%
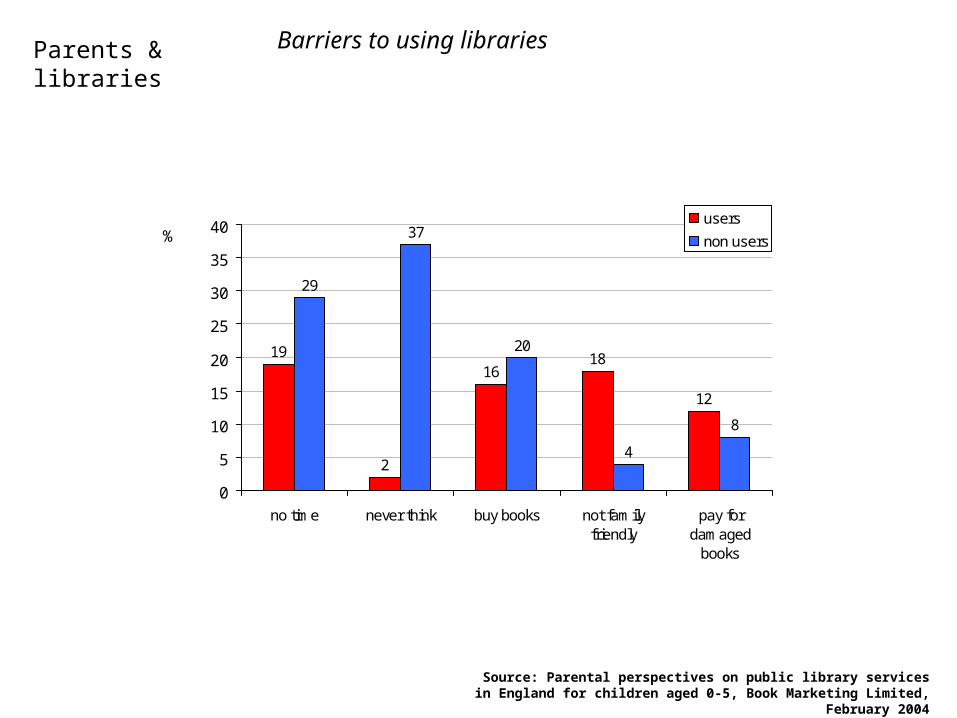
Parents & libraries
Source: Parental perspectives on public library services in England for children aged 0-5, Book Marketing Limited, February 2004
Barriers to using libraries
19
2
1618
12
29
37
20
4
8
0
5
10
15
20
25
30
35
40
no time never think buy books not familyfriendly
pay fordamaged
books
users
non users%
Parents & libraries
Source: Parental perspectives on public library services in England for children aged 0-5, Book Marketing Limited, February 2004
Source: Parental perspectives on public library services in England for children aged 0-5, Book Marketing Limited, February 2004
Perceptions of library buildings
1.5
2.52.8
4.5
3
1.9
2.5
3.3
2.5
4.2
3.8
3.4
0
0.5
1
1.5
2
2.5
3
3.5
4
4.5
5
hard to join old fashioned lots of activities in easy reach uninvitingoutside
no area foryoung
users
non users
Ag
ree
me
nt
ratin
g1
=d
isa
gre
e,
5=
ag
ree
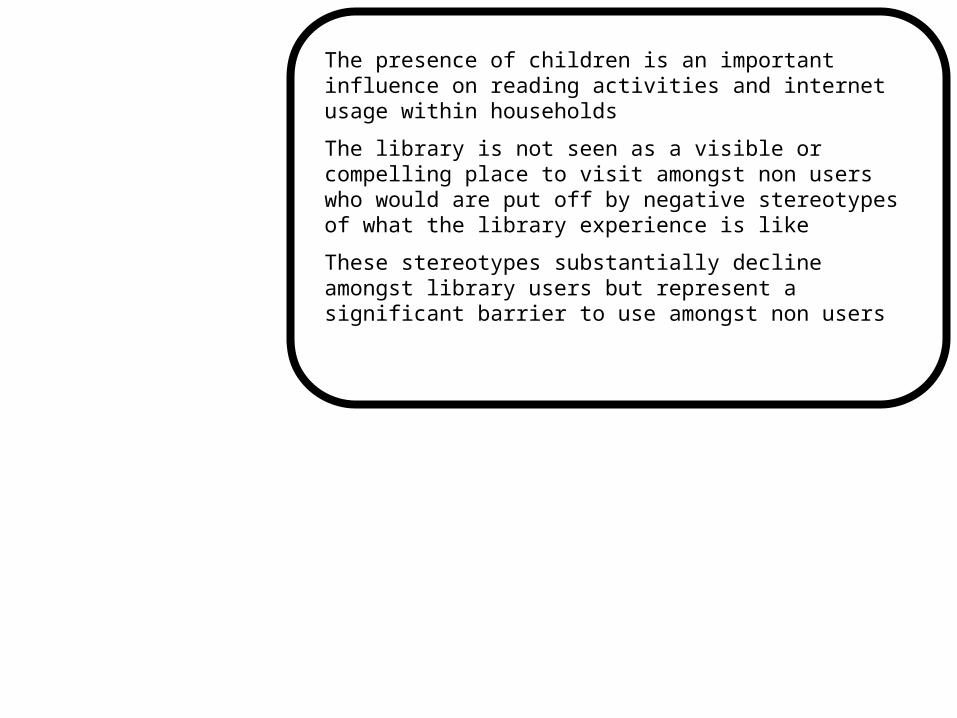
The presence of children is an important influence on reading activities and internet usage within households
The library is not seen as a visible or compelling place to visit amongst non users who would are put off by negative stereotypes of what the library experience is like
These stereotypes substantially decline amongst library users but represent a significant barrier to use amongst non users
contents
findings
strategic issues & recommendations
next steps
overview
What obstacles stand in the way of higher library usage?
key questions
Who are we trying to reach?
What messages do we need to communicate to key groups?
What is the best way of getting the message out there?
?who are we trying to reach?
London
retiredC2DE
families
ethnic minorities
students
professional / managerial
disabled
young people
female
British
ABC1
full time employment
unemployed
young people
metropolitan
rural
technical / semi routine
25-34
male
North East
35-44
who are we trying to reach?
Numerically significant…
Potential to engage…
Long term implications…
Wider consequences…
Current usage…
Targeting strategy must reflect a range of considerations
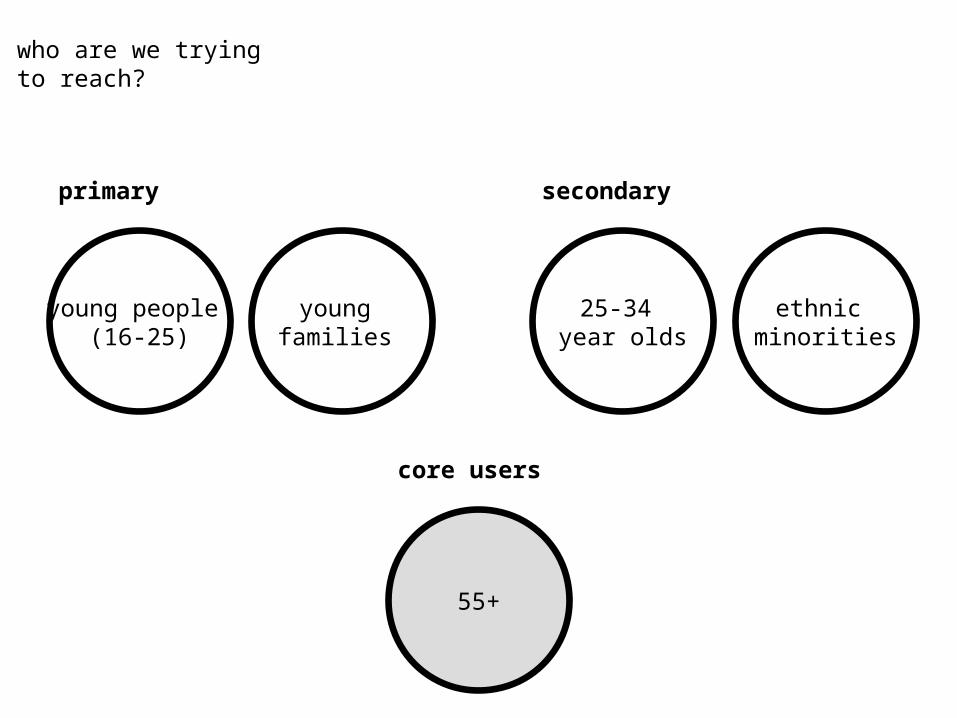
who are we trying to reach?
primary
young families
25-34 year olds
young people (16-25)
ethnic minorities
secondary
core users
55+
what obstacles stand in the way
young families
25-34 year olds
young people (16-25)
ethnic minorities
primary
secondary
Time – don’t have the time
Substitutes – I can go elsewhere
Relevance – it’s not for me
No interest in ‘just books’
Image – boring, dusty, intimidating, old fashioned