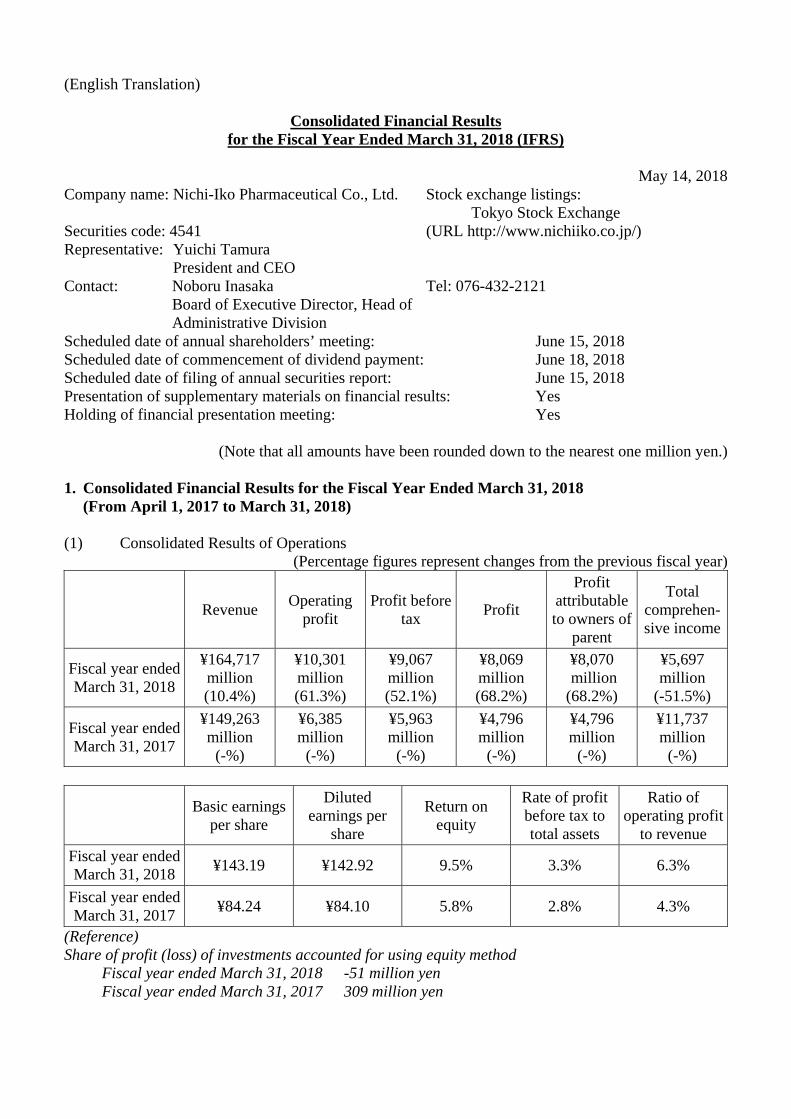
(English Translation) Consolidated Financial Results for the Fiscal Year Ended March 31, 2018 (IFRS) May 14, 2018 Company name: Nichi-Iko Pharmaceutical Co., Ltd. Stock exchange listings: Tokyo Stock Exchange Securities code: 4541 (URL http://www.nichiiko.co.jp/) Representative: Yuichi Tamura President and CEO Contact: Noboru Inasaka Board of Executive Director, Head of Administrative Division Tel: 076-432-2121 Scheduled date of annual shareholders’ meeting: June 15, 2018 Scheduled date of commencement of dividend payment: June 18, 2018 Scheduled date of filing of annual securities report: June 15, 2018 Presentation of supplementary materials on financial results: Yes Holding of financial presentation meeting: Yes (Note that all amounts have been rounded down to the nearest one million yen.) 1. Consolidated Financial Results for the Fiscal Year Ended March 31, 2018 (From April 1, 2017 to March 31, 2018) (1) Consolidated Results of Operations (Percentage figures represent changes from the previous fiscal year) Revenue Operating profit Profit before tax Profit Profit attributable to owners of parent Total comprehen- sive income Fiscal year ended March 31, 2018 ¥164,717 million (10.4%) ¥10,301 million (61.3%) ¥9,067 million (52.1%) ¥8,069 million (68.2%) ¥8,070 million (68.2%) ¥5,697 million (-51.5%) Fiscal year ended March 31, 2017 ¥149,263 million (-%) ¥6,385 million (-%) ¥5,963 million (-%) ¥4,796 million (-%) ¥4,796 million (-%) ¥11,737 million (-%) Basic earnings per share Diluted earnings per share Return on equity Rate of profit before tax to total assets Ratio of operating profit to revenue Fiscal year ended March 31, 2018 ¥143.19 ¥142.92 9.5% 3.3% 6.3% Fiscal year ended March 31, 2017 ¥84.24 ¥84.10 5.8% 2.8% 4.3% (Reference) Share of profit (loss) of investments accounted for using equity method Fiscal year ended March 31, 2018 -51 million yen Fiscal year ended March 31, 2017 309 million yen
Transcript
(English Translation)
Consolidated Financial Results for the Fiscal Year Ended March 31, 2018 (IFRS)
May 14, 2018
Company name: Nichi-Iko Pharmaceutical Co., Ltd. Stock exchange listings: Tokyo Stock Exchange
Contact: Noboru Inasaka Board of Executive Director, Head of Administrative Division
Tel: 076-432-2121
Scheduled date of annual shareholders’ meeting: June 15, 2018 Scheduled date of commencement of dividend payment: June 18, 2018 Scheduled date of filing of annual securities report: June 15, 2018 Presentation of supplementary materials on financial results: Yes Holding of financial presentation meeting: Yes
(Note that all amounts have been rounded down to the nearest one million yen.) 1. Consolidated Financial Results for the Fiscal Year Ended March 31, 2018
(From April 1, 2017 to March 31, 2018) (1) Consolidated Results of Operations
(Percentage figures represent changes from the previous fiscal year)
Revenue Operating
profit Profit before
tax Profit
Profit attributable to owners of
parent
Total comprehen-sive income
Fiscal year ended March 31, 2018
¥164,717 million (10.4%)
¥10,301 million (61.3%)
¥9,067 million (52.1%)
¥8,069 million (68.2%)
¥8,070 million (68.2%)
¥5,697 million
(-51.5%)
Fiscal year ended March 31, 2017
¥149,263 million
(-%)
¥6,385 million
(-%)
¥5,963 million
(-%)
¥4,796 million
(-%)
¥4,796 million
(-%)
¥11,737 million
(-%)
Basic earnings per share
Diluted earnings per
share
Return on equity
Rate of profit before tax to total assets
Ratio of operating profit
to revenue
Fiscal year ended March 31, 2018
¥143.19 ¥142.92 9.5% 3.3% 6.3%
Fiscal year ended March 31, 2017
¥84.24 ¥84.10 5.8% 2.8% 4.3%
(Reference) Share of profit (loss) of investments accounted for using equity method
Fiscal year ended March 31, 2018 -51 million yen Fiscal year ended March 31, 2017 309 million yen
(2) Consolidated Financial Position
Total assets Total equity
Equity attributable to
owners of parent
Ratio of total equity
attributable to owners of the parent to total
assets
Equity attributable to
owners of parent per
share
Fiscal year ended March 31, 2018
¥278,364 million
¥87,542 million
¥87,542 million
31.4% ¥1,550.65
Fiscal year ended March 31, 2017
¥268,900 million
¥83,171 million
¥83,171 million
30.9% ¥1,478.45
(3) Consolidated Cash Flows
Cash flows from
operating activities Cash flows from
investing activitiesCash flows from
financing activities
Cash and cash equivalents at end
of period
Fiscal year ended March 31, 2018
¥18,925 million - ¥15,896 million ¥3,206 million ¥18,529 million
Fiscal year ended March 31, 2017
- ¥4,076 million - ¥82,251 million ¥70,727 million ¥12,457 million
2. Dividends
Annual dividends per share
Total amount of cash
dividends (annual)
Payout ratio (consolidated)
Ratio of dividends to
equity attributable to
owners of parent
(consolidated)
First quarter
Second quarter
Third quarter
Year-end
Total
Fiscal year ended March
31, 2017 ¥- ¥15.00 ¥- ¥15.00 ¥30.00
¥1,710 million
35.6% 2.1%
Fiscal year ended March
31, 2018 ¥- ¥15.00 ¥- ¥15.00 ¥30.00
¥1,711 million
21.0% 2.0%
Fiscal year ending
March 31, 2019 (forecast)
¥- ¥15.00 ¥- ¥15.00 ¥30.00 34.1%
3. Forecast of Consolidated Financial Results for the Fiscal Year Ending March 31, 2019
(From April 1, 2018 to March 31, 2019)
(Percentage figures represent changes from the same period of the previous fiscal year)
Revenue Operating profit Profit attributable to owners of parent
Basic earnings per share
Second quarter (cumulative
total)
¥82,000 million (-%)
¥2,500 million (-%)
¥1,600 million (-%)
¥28.21
Annual ¥172,000 million (4.4%)
¥8,000 million (-22.3%)
¥5,000 million (-38.0%)
¥88.08
*Notes (1) Changes in significant subsidiaries during the fiscal year under review (changes in specified
subsidiaries resulting in change in scope of consolidation): No
(2) Changes in accounting policies and changes in accounting estimates
(i) Changes in accounting policies required by IFRS: No (ii) Changes in accounting policies due to other reasons: No (iii) Changes in accounting estimates: No
(3) Total number of issued shares (common stock)
(i) Total number of issued shares as of the end of the period (including treasury shares): As of March 31, 2018 60,662,652 shares As of March 31, 2017 60,662,652 shares
(ii) Number of treasury shares as of the end of the period:
As of March 31, 2018 4,207,195 shares As of March 31, 2017 4,407,030 shares
(iii) Average number of shares during the period:
Fiscal year ended March 31, 2018 56,362,385 shares Fiscal year ended March 31, 2017 56,944,810 shares
(Note) Number of treasury shares as of the end of the period includes shares held by the Employee Shareholding Incentive Plan.
* Financial results reports are exempt from audit conducted by certified public accountants or
an audit corporation. * Explanation on the appropriate usage of forecast of financial results, and other specific matters
(Considerations on forward-looking statements) The forward-looking statements including forecast of financial results contained in these materials are based on the information currently available to the Company and certain assumptions which are regarded as legitimate. As such, they do not constitute the Company’s guarantee that such results would be achieved. Actual business and other results may differ substantially from the forecasts provided in these materials as a result of various factors. (How to obtain supplementary materials for financial results) Supplementary materials for financial results will be provided on the website of the Company on Monday, May 14, 2018. (Application of International Financial Reporting Standards (IFRS)) The Group has applied International Financial Reporting Standards (hereinafter referred to as “IFRS”) from the end of the year ended March 31, 2018. Furthermore, consolidated financial figures for the previous fiscal year are stated in accordance with IFRS. Please refer to “(1) Overview of Operating Results for the Current Fiscal Year (Operating Results for the Current Fiscal Year)” in “1. Overview of Operating Results, etc.” on page 2 of the Attachment and “(5) Notes to Consolidated
Financial Statements (First-time adoption)” in “3. Consolidated Financial Statements and Primary Notes” on page 32 of the Attachment for information on the difference between IFRS and Japan GAAP pertaining to consolidated financial figures.
- 1 -
Attachment – Contents 1. Overview of Operating Results, etc. ...................................................................................................... 2
(1) Overview of Operating Results for the Current Fiscal Year ............................................................ 2 (2) Overview of Financial Position for the Current Fiscal Year ........................................................... 4
2. Basic Stance Regarding the Selection of Accounting Standards ........................................................... 5 3. Consolidated Financial Statements and Primary Notes ......................................................................... 6
(1) Consolidated Statement of Financial Position ................................................................................. 6 (2) Consolidated Statement of Income and Consolidated Statement of Comprehensive
Income.............................................................................................................................................. 8 (Consolidated Statement of Income) .............................................................................................. 8 (Consolidated Statement of Comprehensive Income) .................................................................... 9
(3) Consolidated Statement of Changes in Equity ............................................................................... 10 (4) Consolidated Statement of Cash Flows ......................................................................................... 14 (5) Notes to Consolidated Financial Statements .................................................................................. 16
The Group has applied IFRS in place of previous Japan GAAP, effective from the current fiscal year (from April 1, 2017 to March 31, 2018) and has conducted comparative analysis by reclassifying figures for the previous fiscal year in accordance with IFRS.
(1) Overview of Operating Results for the Current Fiscal Year
(Operating Results for the Current Fiscal Year)
In the current fiscal year, the tone of economic recovery in Japan continued with an increasing tightening of the employment environment backed by steady growth in exports and production. Meanwhile, looking abroad, a shift toward the strengthening of the yen has been seen in the exchange rate against the dollar due to increasing awareness in geopolitical risk.
In the generic drug industry, the Cabinet decision in June 2017 clearly set forth a timeline by stating to aim “at an 80% usage rate of generic drugs by September 2020” while it was announced that the quantitative share of generic drugs was 70.9% in the period from October to December 2017 according to the data on Prescription in Pharmacy in the Survey on the Trend of Medical Care Expenditures announced by the Health Insurance Bureau of the Ministry of Health, Labour and Welfare. Furthermore, while the revision of drug prices implemented in April 2018 will significantly lower prices by 7.48% on a drug cost basis, initiatives have been strengthen to promote the use of generic drugs, as enhancements have been made to the medical fee points to promote the use of generic drugs such as premiums for generics dispensing systems, premiums for generics use systems, and premiums for generic name prescription.
Under such circumstances, during the fiscal year ended March 31, 2018, the Company steadily implemented the basic policies of “Expansion,” “Production” and “Development” set forth under the 7th Medium-term Business Plan “Obelisk,” which positions the three years from April 2016 to March 2019 as a period for launch to new business fields from the preparatory stage to embark on entering global markets.
As part of the implementation of “Expansion,” the Company launched sales of 7 products with 19 strengths, including Telmisartan Tablets 40mg “Nichi-Iko” in June 2017, 5 products and 16 strengths, including Olmesartan OD Tablets 20mg “Nichi-Iko” in December 2017. The Company also engaged in efforts to obtain the approvals for additional indications, dosages and administrations for drugs such as Olanzapine OD Tablets 2.5mg “Nichi-Iko” and Famciclovir Tablets 250mg “Nichi-Iko” so that patients and their families and medical professionals can use them.
As an implementation of “Development,” the Company obtained a marketing approval in September 2017 for the biosimilar product Infliximab BS for I.V. Infusion 100mg “Nichi-Iko” of which the Company has been committed to the development, and launched it in November 2017. Out-licensing of the product is being conducted through the Company’s subsidiary Yakuhan Pharmaceutical Co., Ltd. to AYUMI Pharmaceutical Corporation, and joint promotion is being conducted with Zeria Pharmaceutical Co., Ltd. in an effort to maximize product value with partners who have strengths in different specialized areas.
As an implementation of “Production,” regarding the manufacturing infrastructure, in response to the rapidly expanding generic pharmaceutical market, the Company completed the construction and started operation of the Obelisk Building in January 2018, which is a manufacturing facility at Toyama Plant 1, and is aimed to establish a production system capable of supplying 18.5 billion tablets, which is the target for the fiscal year ending March 31, 2019.
- 3 -
Furthermore, in March 2018, the Company entered into a strategic alliance agreement and a share transfer agreement for a capital and business alliance with Eisai Co., Ltd. The goal is to “expand and grow the generic pharmaceutical business and bring about increased profit for both companies by leveraging the assets and strengths of both companies to their full potential and maximizing synergies.”
By entering into the agreement, the Company’s rich product lineup and power of production will be combined with the techniques of Elmed Eisai Co., Ltd. for manufacturing value-added generic drugs, and through further “Expansion” and increased scale, the Company will lower costs. In addition, participation in the total inclusive ecosystem being promoted by Eisai Co., Ltd. will lead to strengthening of “Development” into new markets such as Regional Public Healthcare and cost reductions by receiving supply of high-quality and price-competitive API from Eisai Co., Ltd.’s Vizag Plant in India.
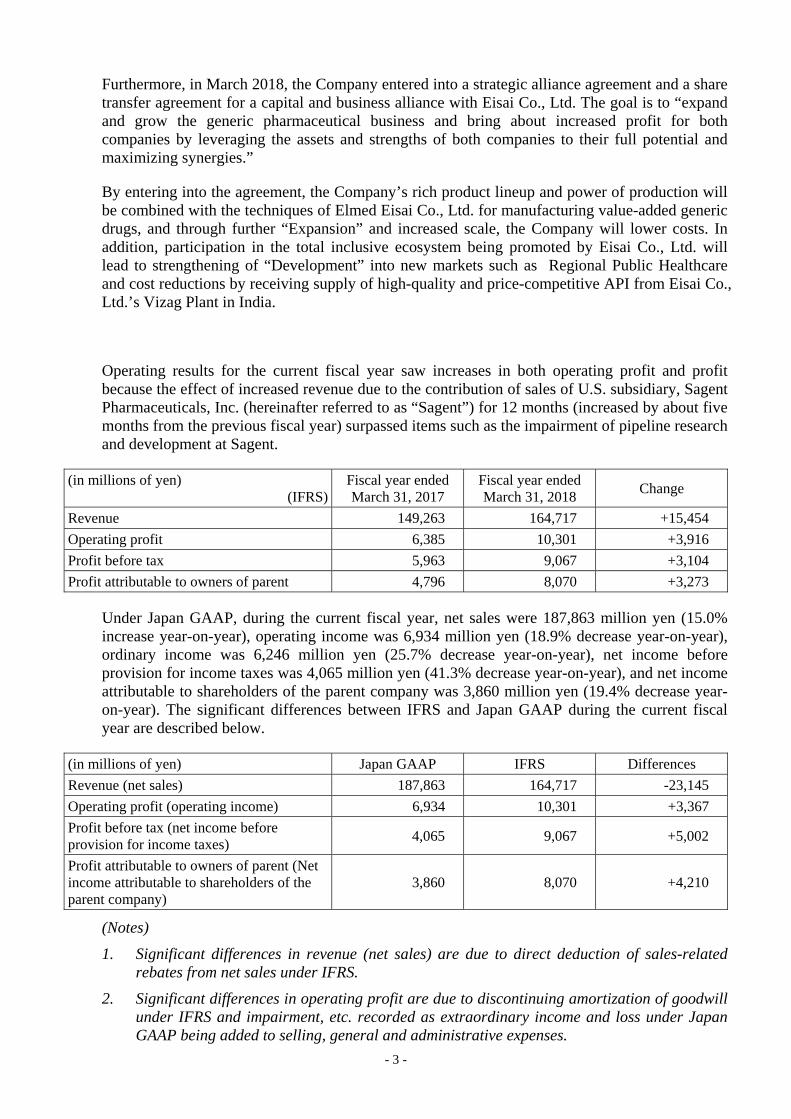
Operating results for the current fiscal year saw increases in both operating profit and profit because the effect of increased revenue due to the contribution of sales of U.S. subsidiary, Sagent Pharmaceuticals, Inc. (hereinafter referred to as “Sagent”) for 12 months (increased by about five months from the previous fiscal year) surpassed items such as the impairment of pipeline research and development at Sagent.
(in millions of yen) (IFRS)
Fiscal year ended March 31, 2017
Fiscal year ended March 31, 2018
Change
Revenue 149,263 164,717 +15,454
Operating profit 6,385 10,301 +3,916
Profit before tax 5,963 9,067 +3,104
Profit attributable to owners of parent 4,796 8,070 +3,273
Under Japan GAAP, during the current fiscal year, net sales were 187,863 million yen (15.0% increase year-on-year), operating income was 6,934 million yen (18.9% decrease year-on-year), ordinary income was 6,246 million yen (25.7% decrease year-on-year), net income before provision for income taxes was 4,065 million yen (41.3% decrease year-on-year), and net income attributable to shareholders of the parent company was 3,860 million yen (19.4% decrease year-on-year). The significant differences between IFRS and Japan GAAP during the current fiscal year are described below.
Profit before tax (net income before provision for income taxes)
4,065 9,067 +5,002
Profit attributable to owners of parent (Net income attributable to shareholders of the parent company)
3,860 8,070 +4,210
(Notes)
1. Significant differences in revenue (net sales) are due to direct deduction of sales-related rebates from net sales under IFRS.
2. Significant differences in operating profit are due to discontinuing amortization of goodwill under IFRS and impairment, etc. recorded as extraordinary income and loss under Japan GAAP being added to selling, general and administrative expenses.
- 4 -
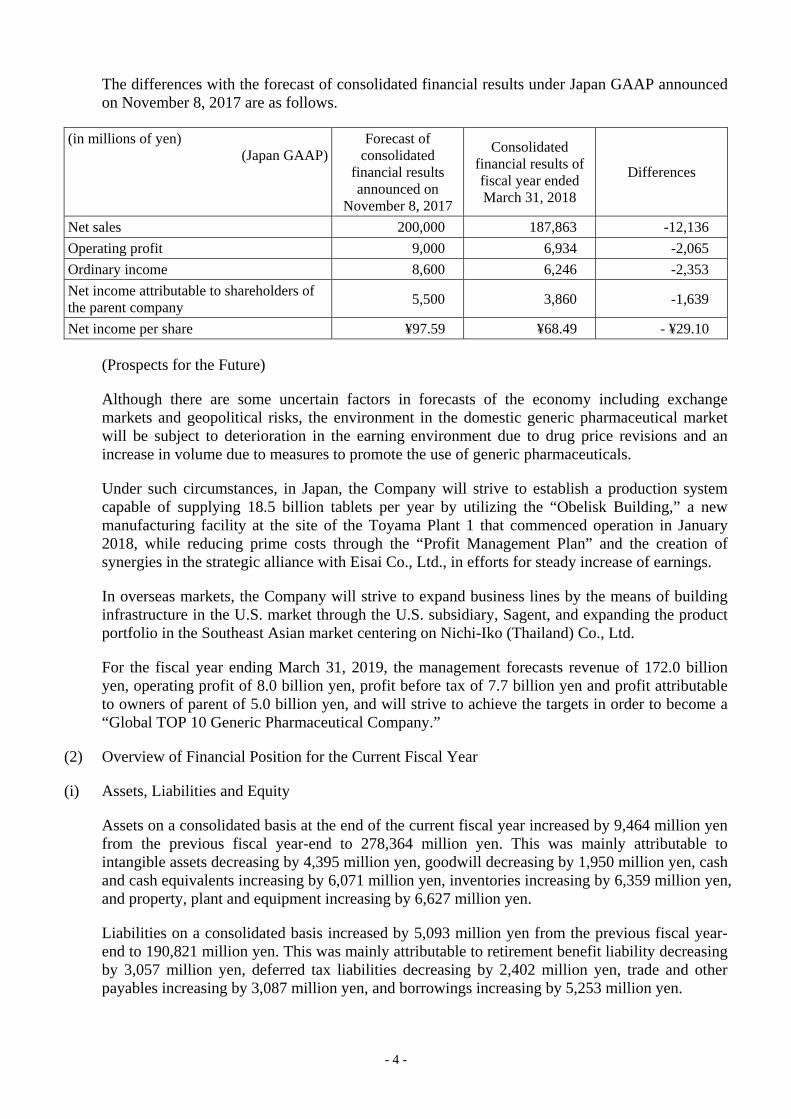
The differences with the forecast of consolidated financial results under Japan GAAP announced on November 8, 2017 are as follows.
(in millions of yen) (Japan GAAP)
Forecast of consolidated
financial results announced on
November 8, 2017
Consolidated financial results of fiscal year ended March 31, 2018
Differences
Net sales 200,000 187,863 -12,136
Operating profit 9,000 6,934 -2,065
Ordinary income 8,600 6,246 -2,353
Net income attributable to shareholders of the parent company
5,500 3,860 -1,639
Net income per share ¥97.59 ¥68.49 - ¥29.10
(Prospects for the Future)
Although there are some uncertain factors in forecasts of the economy including exchange markets and geopolitical risks, the environment in the domestic generic pharmaceutical market will be subject to deterioration in the earning environment due to drug price revisions and an increase in volume due to measures to promote the use of generic pharmaceuticals.
Under such circumstances, in Japan, the Company will strive to establish a production system capable of supplying 18.5 billion tablets per year by utilizing the “Obelisk Building,” a new manufacturing facility at the site of the Toyama Plant 1 that commenced operation in January 2018, while reducing prime costs through the “Profit Management Plan” and the creation of synergies in the strategic alliance with Eisai Co., Ltd., in efforts for steady increase of earnings.
In overseas markets, the Company will strive to expand business lines by the means of building infrastructure in the U.S. market through the U.S. subsidiary, Sagent, and expanding the product portfolio in the Southeast Asian market centering on Nichi-Iko (Thailand) Co., Ltd.
For the fiscal year ending March 31, 2019, the management forecasts revenue of 172.0 billion yen, operating profit of 8.0 billion yen, profit before tax of 7.7 billion yen and profit attributable to owners of parent of 5.0 billion yen, and will strive to achieve the targets in order to become a “Global TOP 10 Generic Pharmaceutical Company.”
(2) Overview of Financial Position for the Current Fiscal Year
(i) Assets, Liabilities and Equity
Assets on a consolidated basis at the end of the current fiscal year increased by 9,464 million yen from the previous fiscal year-end to 278,364 million yen. This was mainly attributable to intangible assets decreasing by 4,395 million yen, goodwill decreasing by 1,950 million yen, cash and cash equivalents increasing by 6,071 million yen, inventories increasing by 6,359 million yen, and property, plant and equipment increasing by 6,627 million yen.
Liabilities on a consolidated basis increased by 5,093 million yen from the previous fiscal year-end to 190,821 million yen. This was mainly attributable to retirement benefit liability decreasing by 3,057 million yen, deferred tax liabilities decreasing by 2,402 million yen, trade and other payables increasing by 3,087 million yen, and borrowings increasing by 5,253 million yen.
- 5 -
Equity on a consolidated basis increased by 4,371 million yen from the previous fiscal year-end to 87,542 million yen. This was mainly attributable to an increase in retained earnings such as profit attributable to owners of parent of 8,070 million yen.
(ii) Cash Flows
At the end of the current fiscal year, cash and cash equivalents on a consolidated basis increased by 6,071 million yen from the previous fiscal year-end to 18,529 million yen.
Details of cash flows from each of the three activities for the current fiscal year are described below.
(Cash flows from operating activities)
Net cash provided by operating activities on a consolidated basis for the current fiscal year amounted to income over expenditure of 18,925 million yen. The main outflows included an increase in inventories of 7,061 million yen. In terms of inflows, there were profit before tax of 9,067 million yen, depreciation and amortization of 8,659 million yen, and impairment losses of 4,067 million yen.
(Cash flows from investing activities)
Net cash used in investing activities on a consolidated basis for the current fiscal year amounted to expenditure over income of 15,896 million yen. This was due to outflows such as 8,360 million yen in purchase of property, plant and equipment and 5,940 million yen in purchase of intangible assets.
(Cash flows from financing activities)
Net cash provided by financing activities on a consolidated basis for the current fiscal year amounted to income over expenditure of 3,206 million yen. The main outflows were 9,408 million yen in repayments of long-term borrowings and 1,686 million yen in dividends paid, while the main inflows were 15,200 million yen in proceeds from long-term borrowings.
2. Basic Stance Regarding the Selection of Accounting Standards
Aiming at improved international comparability of financial information in capital markets, the Group has applied International Financial Reporting Standards (IFRS) from the current fiscal year.
- 6 -
3. Consolidated Financial Statements and Primary Notes
(1) Consolidated Statement of Financial Position
(in millions of yen)
Transition date to
IFRS (as of April 1, 2016)
Fiscal year ended March 31, 2017 (as of March 31,
2017)
Fiscal year ended March 31, 2018 (as of March 31,
2018)
Assets
Current assets
Cash and cash equivalents 28,144 12,457 18,529
Trade and other receivables 26,147 31,956 32,087
Inventories 45,335 67,962 74,321
Income taxes receivable - 741 -
Other financial assets 529 366 974
Other current assets 532 2,074 2,365
Total current assets 100,689 115,558 128,278
Non-current assets
Property, plant and equipment 38,547 47,417 54,045
Goodwill 634 40,486 38,536
Intangible assets 5,840 50,131 45,735
Investments accounted for using equity method
4,540 4,657 6,380
Other financial assets 8,439 7,769 3,962
Deferred tax assets 2,468 2,765 1,326
Other non-current assets 139 114 99
Total non-current assets 60,610 153,341 150,086
Total assets 161,300 268,900 278,364
- 7 -
(in millions of yen)
Transition date to
IFRS (as of April 1, 2016)
Fiscal year ended March 31, 2017 (as of March 31,
2017)
Fiscal year ended March 31, 2018 (as of March 31,
2018)
Liabilities and equity
Liabilities
Current liabilities
Trade and other payables 36,520 47,598 50,686
Borrowings 18,301 37,196 35,499
Other financial liabilities 964 993 994
Income taxes payable 3,888 339 1,676
Provisions 1,239 2,451 2,928
Other current liabilities 4,820 4,784 5,608
Total current liabilities 65,735 93,363 97,394
Non-current liabilities
Borrowings 9,035 78,674 85,625
Other financial liabilities 1,503 2,062 2,232
Retirement benefit liability 3,442 3,523 465
Provisions 54 55 56
Deferred tax liabilities 29 5,226 2,823
Other non-current liabilities 227 2,822 2,224
Total non-current liabilities 14,293 92,365 93,427
Total liabilities 80,029 185,728 190,821
Equity
Share capital 19,976 19,976 19,976
Capital surplus 18,796 18,845 18,827
Treasury shares (1,397) (9,401) (9,046)
Retained earnings 42,140 45,050 51,912
Other components of equity 1,754 8,701 5,872
Total equity attributable to owners of parent
81,270 83,171 87,542
Non-controlling interests 0 0 0
Total equity 81,271 83,171 87,542
Total liabilities and equity 161,300 268,900 278,364
- 8 -
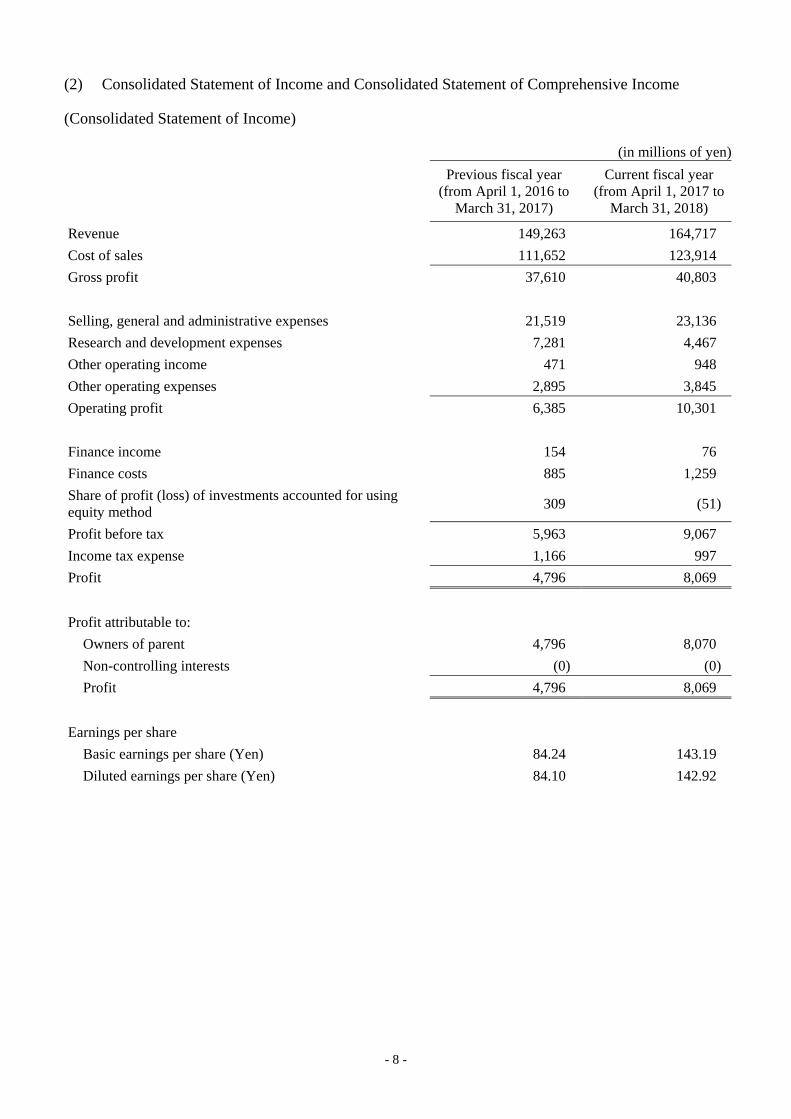
(2) Consolidated Statement of Income and Consolidated Statement of Comprehensive Income
(Consolidated Statement of Income)
(in millions of yen)
Previous fiscal year
(from April 1, 2016 to March 31, 2017)
Current fiscal year (from April 1, 2017 to
March 31, 2018)
Revenue 149,263 164,717
Cost of sales 111,652 123,914
Gross profit 37,610 40,803
Selling, general and administrative expenses 21,519 23,136
Research and development expenses 7,281 4,467
Other operating income 471 948
Other operating expenses 2,895 3,845
Operating profit 6,385 10,301
Finance income 154 76
Finance costs 885 1,259
Share of profit (loss) of investments accounted for using equity method
309 (51)
Profit before tax 5,963 9,067
Income tax expense 1,166 997
Profit 4,796 8,069
Profit attributable to:
Owners of parent 4,796 8,070
Non-controlling interests (0) (0)
Profit 4,796 8,069
Earnings per share
Basic earnings per share (Yen) 84.24 143.19
Diluted earnings per share (Yen) 84.10 142.92
- 9 -
(Consolidated Statement of Comprehensive Income)
(in millions of yen)
Previous fiscal year
(from April 1, 2016 to March 31, 2017)
Current fiscal year (from April 1, 2017 to
March 31, 2018)
Profit 4,796 8,069
Other comprehensive income
Items that will not be reclassified to profit or loss
Financial assets measured at fair value through other comprehensive income
(136) 800
Remeasurements of defined benefit plans 0 478
Share of other comprehensive income of investments accounted for using equity method
(190) 167
Total of items that will not be reclassified to profit or loss
(326) 1,446
Items that may be reclassified to profit or loss
Exchange differences on translation of foreign operations
7,206 (3,810)
Share of other comprehensive income of investments accounted for using equity method
60 (8)
Total of items that may be reclassified to profit or loss 7,267 (3,818)
Other comprehensive income (net of tax) 6,940 (2,372)
Comprehensive income 11,737 5,697
Comprehensive income attributable to:
Owners of parent 11,737 5,698
Non-controlling interests (0) (0)
Comprehensive income 11,737 5,697
- 10 -
(3) Consolidated Statement of Changes in Equity
Previous Fiscal Year (from April 1, 2016 to March 31, 2017)
(in millions of yen)
Equity attributable to owners of parent
Share capital
Capital surplus
Treasury shares
Retained earnings
Other components of equity
Exchange differences
on translation of foreign operations
Financial assets
measured at fair value through
other comprehen-sive income
Balance as of April 1, 2016
19,976 18,796 (1,397) 42,140 - 1,494
Profit (loss) 4,796
Other comprehensive income
7,267 (320)
Total comprehensive income
- - - 4,796 7,267 (320)
Purchase of treasury shares
(8,396)
Disposal of treasury shares 48 392
Dividends (1,854)
Share-based payment transactions
Transfer from other components
(32) 26
Total transactions with owners
- 48 (8,004) (1,887) - 26
Balance as of March 31, 2017
19,976 18,845 (9,401) 45,050 7,267 1,200
- 11 -
Equity attributable to owners of parent
Non-controlling
interests Total equity
Other components of equity
Total Remeasure-
ments of defined
benefit plans
Other Total
Balance as of April 1, 2016
- 260 1,754 81,270 0 81,271
Profit (loss) 4,796 (0) 4,796
Other comprehensive income
(6) 6,940 6,940 (0) 6,940
Total comprehensive income
(6) - 6,940 11,737 (0) 11,737
Purchase of treasury shares
(8,396) (8,396)
Disposal of treasury shares (255) (255) 185 185
Dividends (1,854) (1,854)
Share-based payment transactions
228 228 228 228
Transfer from other components
6 32 - -
Total transactions with owners
6 (26) 6 (9,836) - (9,836)
Balance as of March 31, 2017
- 234 8,701 83,171 0 83,171
- 12 -
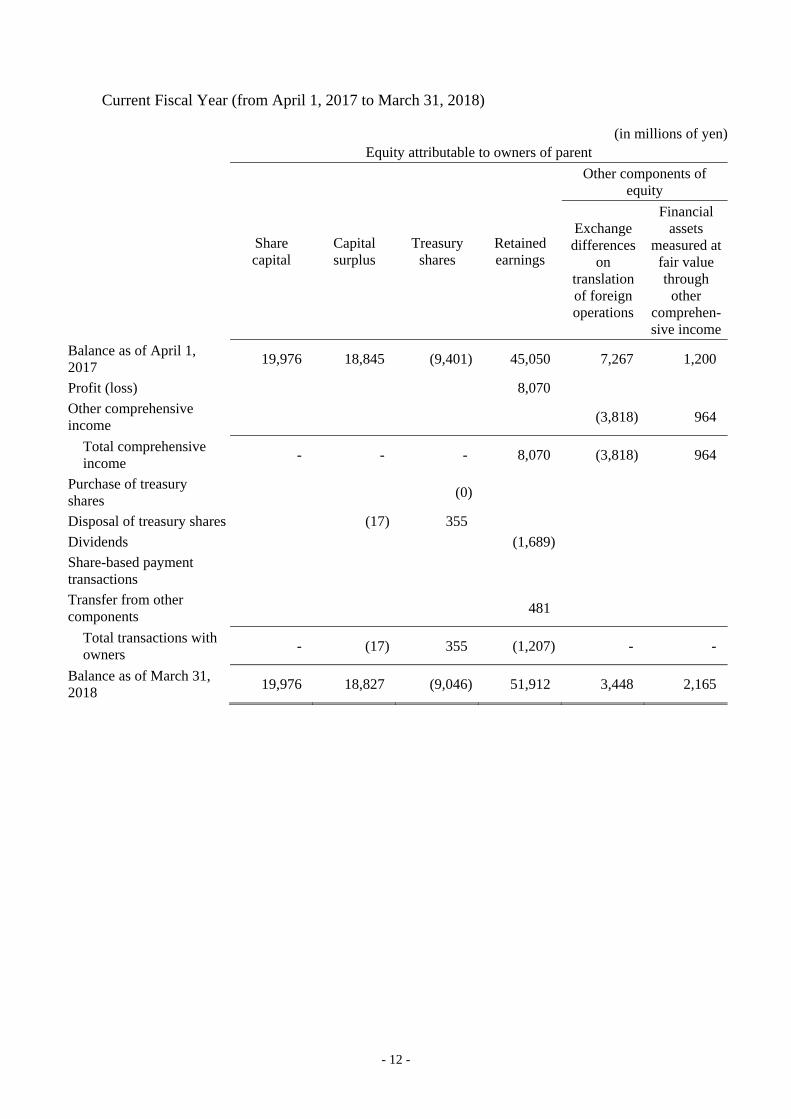
Current Fiscal Year (from April 1, 2017 to March 31, 2018)
(in millions of yen)
Equity attributable to owners of parent
Share capital
Capital surplus
Treasury shares
Retained earnings
Other components of equity
Exchange differences
on translation of foreign operations
Financial assets
measured at fair value through
other comprehen-sive income
Balance as of April 1, 2017
19,976 18,845 (9,401) 45,050 7,267 1,200
Profit (loss) 8,070
Other comprehensive income
(3,818) 964
Total comprehensive income
- - - 8,070 (3,818) 964
Purchase of treasury shares
(0)
Disposal of treasury shares (17) 355
Dividends (1,689)
Share-based payment transactions
Transfer from other components
481
Total transactions with owners
- (17) 355 (1,207) - -
Balance as of March 31, 2018
19,976 18,827 (9,046) 51,912 3,448 2,165
- 13 -
Equity attributable to owners of parent
Non-controlling
interests Total equity
Other components of equity
Total Remeasure-
ments of defined
benefit plans
Other Total
Balance as of April 1, 2017
- 234 8,701 83,171 0 83,171
Profit (loss) 8,070 (0) 8,069
Other comprehensive income
481 (2,372) (2,372) 0 (2,372)
Total comprehensive income
481 - (2,372) 5,698 (0) 5,697
Purchase of treasury shares
(0) (0)
Disposal of treasury shares (102) (102) 236 236
Dividends (1,689) (1,689)
Share-based payment transactions
127 127 127 127
Transfer from other components
(481) (481) - -
Total transactions with owners
(481) 24 (456) (1,326) - (1,326)
Balance as of March 31, 2018
- 258 5,872 87,542 0 87,542
(Note)
The amount of dividends does not include the amount of dividends to the Employee Shareholding Incentive Plan.
- 14 -
(4) Consolidated Statement of Cash Flows
(in millions of yen)
Previous fiscal year
(from April 1, 2016 to March 31, 2017)
Current fiscal year (from April 1, 2017 to
March 31, 2018)
Cash flows from operating activities
Profit before tax 5,963 9,067
Depreciation and amortization 7,065 8,659
Impairment losses 363 4,067
Interest and dividend income (153) (73)
Interest expenses 388 627
Share of loss (profit) of investments accounted for using equity method
(309) 51
Foreign exchange loss (gain) 235 59
Loss (gain) on sales and retirement of property, plant and equipment
281 187
Decrease (increase) in trade and other receivables (2,393) 383
Decrease (increase) in inventories (10,746) (7,061)
Increase (decrease) in trade and other payables 3,045 2,179
Increase (decrease) in provisions 574 603
Other (1,808) 1,165
Subtotal 2,508 19,916
Dividends received 278 80
Interest received 172 18
Interest paid (398) (608)
Income taxes paid (6,636) (1,358)
Income taxes refund - 877
Net cash provided by (used in) operating activities (4,076) 18,925
Cash flows from investing activities
Proceeds from withdrawal of time deposits 15 64
Purchase of property, plant and equipment (9,245) (8,360)
Purchase of intangible assets (3,018) (5,940)
Purchase of investments accounted for using equity method
- (1,665)
Purchase of investments in subsidiaries resulting in change in scope of consolidation
(69,557) -
Proceeds from withdrawal of investments accounted for using equity method
605 -
Other (1,051) 4
Net cash provided by (used in) investing activities (82,251) (15,896)
- 15 -
(in millions of yen)
Previous fiscal year
(from April 1, 2016 to March 31, 2017)
Current fiscal year (from April 1, 2017 to
March 31, 2018)
Cash flows from financing activities
Net increase (decrease) in short-term borrowings 8,958 (123)
Proceeds from long-term borrowings 76,922 15,200
Repayments of long-term borrowings (3,876) (9,408)
Payments for purchase of treasury shares (8,396) (0)
Proceeds from sale of treasury shares 174 235
Repayments of finance lease obligations (1,206) (1,010)
Dividends paid (1,853) (1,686)
Other 4 0
Net cash provided by (used in) financing activities 70,727 3,206
Effect of exchange rate changes on cash and cash equivalents (87) (163)
Net increase (decrease) in cash and cash equivalents (15,687) 6,071
Cash and cash equivalents at beginning of period 28,144 12,457
Cash and cash equivalents at end of period 12,457 18,529
- 16 -
(5) Notes to Consolidated Financial Statements
(Notes on premise of going concern)
Not applicable.
(Reporting entity)
Nichi-Iko Pharmaceutical Co., Ltd. (hereinafter referred to as the “Company”) is a company incorporated in Japan. The consolidated financial statements of the Company and its subsidiaries (hereinafter referred to as “the Group”) with the fiscal closing date at March 31, 2018 are composed of the Company, its subsidiaries and ownership interests in its associates. The Group is mainly engaged in the manufacture and sale of pharmaceuticals.
(Basis of preparation)
1 Compliance with IFRS and first-time adoption
Pursuant to the provision of Article 93 of the Ordinance on Terminology, Forms, and Preparation Methods of Consolidated Financial Statements (Ordinance of the Ministry of Finance No. 28 of 1976; hereinafter referred to as “Ordinance on Consolidated Financial Statements”), the consolidated financial statements of the Group have been prepared in compliance with IFRS since the Group qualifies as a “Specified Company under Designated International Accounting Standards” prescribed in Article 1-2 of the Ordinance on Consolidated Financial Statements.
The Group has applied IFRS from the current fiscal year (from April 1, 2017 to March 31, 2018) and the annual consolidated financial statements for the current fiscal year are the initial consolidated financial statements prepared in accordance with IFRS. The date of transition to IFRS is April 1, 2016.
Except for accounting policies that the Group has early adopted, the Group’s accounting policies have complied with IFRS effective as of March 31, 2018.
2 Basis of measurement
The consolidated financial statements have been prepared on a historical cost basis except for financial instruments, etc. measured at fair value and liabilities and assets pertaining to defined benefit plans calculated by deducting the fair value of plan assets from the present value of net defined benefit liability, as noted in “(Significant accounting policies).”
3 Presentation currency
The consolidated financial statements of the Group are presented in Japanese yen, which is the Company’s functional currency, and figures are rounded down to the nearest million yen.
4 Accounting judgments, estimates and assumptions
In preparing consolidated financial statements, the management is obligated to make judgments, estimates and assumptions that may affect the application of accounting policies and the reported amounts of assets, liabilities, revenue and expenses. Actual results may differ from these estimates.
- 17 -
The main accounting judgments, estimates and assumptions are as follows.
Significant assumptions used for calculation of discounted cash flows in impairment test of property, plant and equipment, goodwill and intangible assets
Recognition of intangible assets arising from development
Recoverability of deferred tax assets
Measurement of net defined benefit liability
Accounting and valuation of provisions
Probability of outflow of future economic benefits on contingent liabilities
5 Early adoption of new standards
The Group has early adopted IFRS 9 “Financial Instruments” (issued in November 2009 and amended in July 2014) from the date of transition to IFRS.
- 18 -
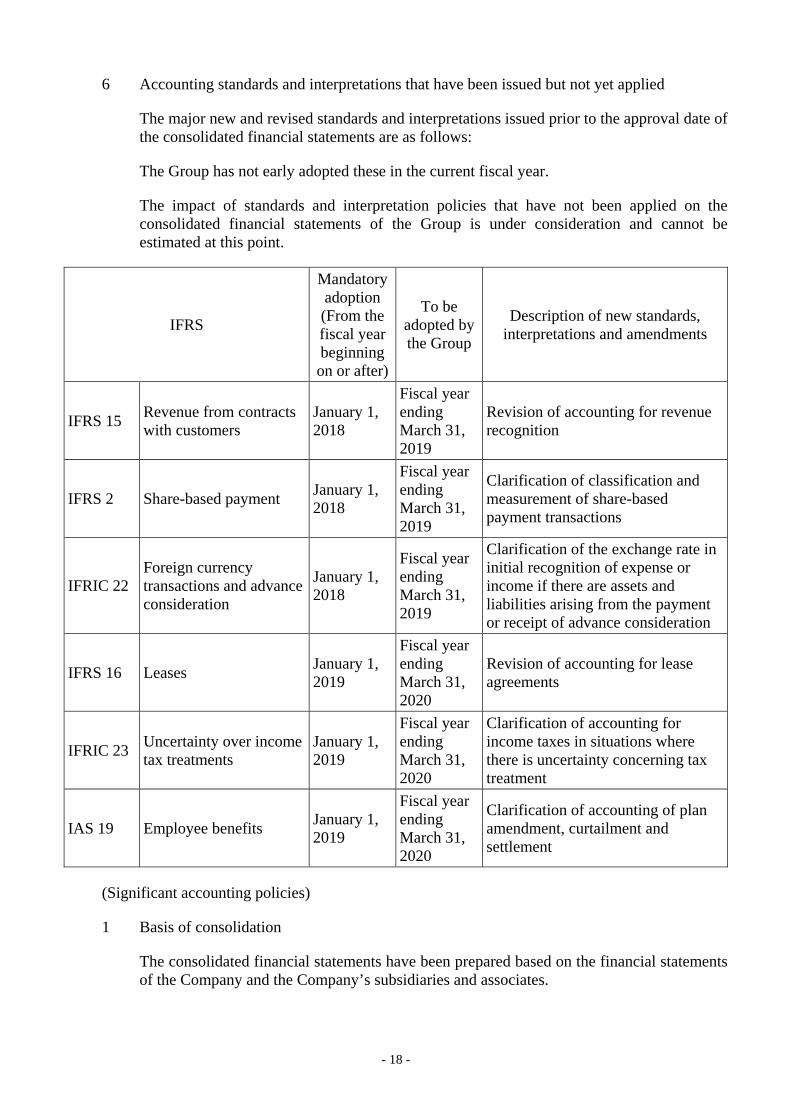
6 Accounting standards and interpretations that have been issued but not yet applied
The major new and revised standards and interpretations issued prior to the approval date of the consolidated financial statements are as follows:
The Group has not early adopted these in the current fiscal year.
The impact of standards and interpretation policies that have not been applied on the consolidated financial statements of the Group is under consideration and cannot be estimated at this point.
IFRS
Mandatory adoption (From the fiscal year beginning on or after)
To be adopted by the Group
Description of new standards, interpretations and amendments
IFRS 15 Revenue from contracts with customers
January 1, 2018
Fiscal year ending March 31, 2019
Revision of accounting for revenue recognition
IFRS 2 Share-based payment January 1, 2018
Fiscal year ending March 31, 2019
Clarification of classification and measurement of share-based payment transactions
IFRIC 22 Foreign currency transactions and advance consideration
January 1, 2018
Fiscal year ending March 31, 2019
Clarification of the exchange rate in initial recognition of expense or income if there are assets and liabilities arising from the payment or receipt of advance consideration
IFRS 16 Leases January 1, 2019
Fiscal year ending March 31, 2020
Revision of accounting for lease agreements
IFRIC 23 Uncertainty over income tax treatments
January 1, 2019
Fiscal year ending March 31, 2020
Clarification of accounting for income taxes in situations where there is uncertainty concerning tax treatment
IAS 19 Employee benefits January 1, 2019
Fiscal year ending March 31, 2020
Clarification of accounting of plan amendment, curtailment and settlement
(Significant accounting policies)
1 Basis of consolidation
The consolidated financial statements have been prepared based on the financial statements of the Company and the Company’s subsidiaries and associates.
- 19 -
(1) Subsidiaries
Subsidiaries are entities that are controlled by the Group. The Group controls an investee when the Group has power over the investee, is exposed to variable returns from its involvement with the investee, and has the ability to affect those returns through its power over the investee.
Financial statements of the subsidiaries are consolidated into the Group’s consolidated financial statements from the date of commencement of control to the date of termination of control. Changes in ownership interests in subsidiaries that do not result in a loss of control are accounted for as equity transactions.
Any difference between the amount of adjustment to the non-controlling interests and the fair value of the consideration is recognized directly in equity attributable to owners of parent. The intergroup balances of receivables and payables and transactions, as well as unrealized gains and losses arising from intergroup transactions are eliminated in preparing the consolidated financial statements.
(2) Associates
Associates are entities over which the Group has significant influence over the financial and operating policies but does not have control. Investments in associates are accounted for using the equity method and recognized as cost on the acquisition. Unrealized gains arising from transactions with entities accounted for using equity method has been deducted from investment up to the Group’s interest in the investees. Unrealized losses are deducted from investment using a similar method to unrealized gains unless there is evidence that impairment loss has occurred.
(3) Business combinations
Business combinations are accounted for by applying the acquisition method. Acquiree’s identifiable assets and liabilities are measured at the acquisition-date fair values. Goodwill is measured as the excess of the aggregate of the consideration transferred in a business combination, the amount of the non-controlling interest in the acquiree and the fair value of the equity interest in the acquiree previously held by the acquirer over the net of the acquisition-date value of the identifiable assets acquired and the liabilities assumed. The consideration transferred in a business combination is calculated as the sum of the acquisition-date fair values of the assets transferred by the acquirer, the liabilities incurred by the acquirer to former owners of the acquiree and the equity interests issued by the acquirer. The Group chooses whether to measure non-controlling interests using fair value or based on the amount of identifiable net assets of the acquiree corresponding to non-controlling interests for each business combination. Acquisition-related costs are expensed in the period in which the costs are incurred. Acquisition of additional non-controlling interests after the acquisition of control is accounted for as an equity transaction, and goodwill is not recognized with respect to such transaction.
2 Foreign currency translation
(1) Foreign currency transactions
Foreign currency transactions are translated to functional currencies at exchange rates on the transaction dates or exchange rates which are close to the actual rate on the transaction dates. Foreign currency monetary items on the closing date are retranslated to functional currencies at exchange rates on the closing date, and foreign currency non-monetary items
- 20 -
measured at fair value are retranslated to functional currencies at exchange rates on the date when fair value is calculated. Exchange differences arising from the translation and settlement are recognized in profit or loss. However, translation differences resulting from financial assets measured through other comprehensive income are recognized in other comprehensive income.
(2) Foreign operations
Assets and liabilities of foreign operations in the statement of financial position are translated at the exchange rate on the closing date, and income and expenses in each statement presenting profit and loss and other comprehensive income are translated at the exchange rate on the transaction date or the average exchange rate except for cases where the exchange rate fluctuates significantly. Translation differences resulting from such translation are recognized in other comprehensive income. If foreign operations are disposed of, the cumulative translation differences related to the operations are transferred to profit or loss in the period of disposition.
3 Revenue
(1) Sale of goods
Revenue from the sale of goods is recognized when the Group has transferred to the buyer the significant risks and rewards of ownership of the goods, the Group retains neither continuous managerial involvement to the degree usually associated with ownership nor effective control over the goods sold, the amount of revenue can be measured reliably, it is probable that the economic benefits associated with the transaction will flow to the Group, and the costs incurred or to be incurred in respect to the transaction can be measured reliably. These conditions are normally satisfied at the time goods are delivered to the customer.
Revenue is measured at fair value of the consideration that is received or can be received after deducting discounts, rebates, etc.
(2) Revenue from intellectual property rights
Revenue from intellectual property rights is revenue from upfront payments and milestones received based on license agreements, etc. related to the rights to develop and sell products, and is recognized at the time contractual obligations are fulfilled. Liabilities are recorded if not all contractual obligations are fulfilled, and revenue is recognized over the contractual period, etc.
4 Income taxes
Income taxes are the aggregate amount of current tax and deferred tax.
(1) Current tax
Current tax is measured at the amount of expected tax payment to or expected tax refund from tax authorities. The tax rates and tax laws used to determine the amount of taxes are tax rates and tax laws that have been enacted or substantially enacted by the closing date. Current tax recognized as profit or loss do not include taxes arising from items directly recognized in other comprehensive income or equity or taxes arising from business combinations.
- 21 -
Income taxes payable and income taxes receivable for the current fiscal year and past fiscal years are calculated using the statutory tax rate and tax law in effect or substantively in effect on the closing date, and the estimated amount to be paid to or refunded by the tax authorities is calculated by rationally taking into account uncertainties concerning income taxes.
(2) Deferred tax
Deferred tax is calculated based on the temporary difference between the tax base of assets and liabilities and the carrying amount for accounting purposes on the closing date. Deferred tax assets are recognized to the extent that it is expected that taxable profit will be available against which deductible temporary differences, unused tax credits carried forward and tax losses carried forward can be utilized. In principle, deferred tax liabilities are recognized for taxable temporary differences.
In the following cases, deferred tax assets and liabilities are not recorded.
When there is a temporary difference from the initial recognition of goodwill
When there is a temporary difference from the initial recognition of assets or liabilities in transactions other than business combinations that do not have an impact on profit for accounting purposes or taxable profit (tax loss) at the time of the transaction
When it is likely that deductible temporary differences pertaining to investment in subsidiaries or associates will not reverse in the foreseeable future, or it is unlikely that taxable profits will be available against which the deductible temporary differences can be utilized
When the Company can control the timing of the reverse of the deductible temporary differences pertaining to investment in subsidiaries or associate and it is likely that the temporary differences will not reverse in the foreseeable future
Deferred tax assets and liabilities are calculated using the tax rate expected to be applied at the time temporary differences reverse based on the statutory tax rate or effective statutory tax rate and tax law on the closing date. Deferred tax assets and deferred tax liabilities are offset if the Group has a legally enforceable right to set off current tax assets against current tax liabilities, and they relate to income taxes levied by the same taxation authority on the same taxable entity.
5 Earnings per share
Basic earnings per share are calculated by dividing profit attributable to common shareholders of the Company by the weighted average number of shares of common stock outstanding during the period that is adjusted by the number of treasury shares. Diluted earnings per share are calculated reflecting the adjustment of the impact from all potential shares with dilutive effect.
6 Cash and cash equivalents
Cash and cash equivalents comprises cash on hand, readily available deposits and short-term investments that are readily convertible into cash, and subject to an insignificant risk of changes in value and due within three months of the acquisition date.
- 22 -
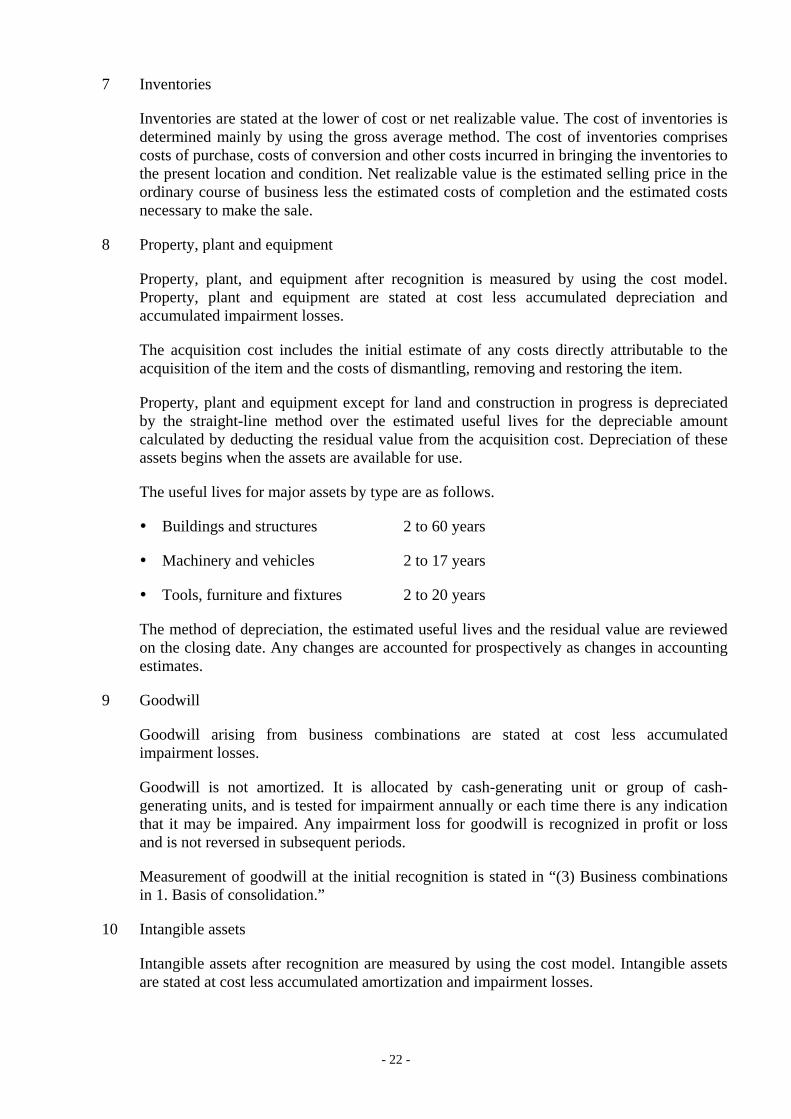
7 Inventories
Inventories are stated at the lower of cost or net realizable value. The cost of inventories is determined mainly by using the gross average method. The cost of inventories comprises costs of purchase, costs of conversion and other costs incurred in bringing the inventories to the present location and condition. Net realizable value is the estimated selling price in the ordinary course of business less the estimated costs of completion and the estimated costs necessary to make the sale.
8 Property, plant and equipment
Property, plant, and equipment after recognition is measured by using the cost model. Property, plant and equipment are stated at cost less accumulated depreciation and accumulated impairment losses.
The acquisition cost includes the initial estimate of any costs directly attributable to the acquisition of the item and the costs of dismantling, removing and restoring the item.
Property, plant and equipment except for land and construction in progress is depreciated by the straight-line method over the estimated useful lives for the depreciable amount calculated by deducting the residual value from the acquisition cost. Depreciation of these assets begins when the assets are available for use.
The useful lives for major assets by type are as follows.
Buildings and structures 2 to 60 years
Machinery and vehicles 2 to 17 years
Tools, furniture and fixtures 2 to 20 years
The method of depreciation, the estimated useful lives and the residual value are reviewed on the closing date. Any changes are accounted for prospectively as changes in accounting estimates.
9 Goodwill
Goodwill arising from business combinations are stated at cost less accumulated impairment losses.
Goodwill is not amortized. It is allocated by cash-generating unit or group of cash-generating units, and is tested for impairment annually or each time there is any indication that it may be impaired. Any impairment loss for goodwill is recognized in profit or loss and is not reversed in subsequent periods.
Measurement of goodwill at the initial recognition is stated in “(3) Business combinations in 1. Basis of consolidation.”
10 Intangible assets
Intangible assets after recognition are measured by using the cost model. Intangible assets are stated at cost less accumulated amortization and impairment losses.
- 23 -
(1) Separately acquired intangible assets
Separately acquired intangible assets are measured at cost on initial recognition.
(2) Intangible assets acquired in business combinations
Intangible assets acquired in business combinations are measured at the acquisition-date fair value.
(3) Internally generated intangible assets
Expenditures incurred for development (or the development phase of an internal project) are recognized as asset only if all of the following can be demonstrated, and all other expenditures are expensed as incurred.
(i) The technical feasibility of completing the intangible asset so that it will be available for use or sale
(ii) Intention to complete the intangible asset and use or sell it
(iii) The ability to use or sell the intangible asset
(iv) Method for the intangible asset to generate probable future economic benefits
(v) The availability of adequate technical, financial and other resources to complete the development of the intangible asset and to use or sell it
(vi) Ability to measure reliably the expenditure attributable to the intangible asset during its development
After initial recognition, intangible assets except for intangible assets in progress is amortized by the straight-line method over the estimated useful lives for the depreciable amount obtained by deducting the residual value from the acquisition cost. The estimated useful lives of major intangible assets are as follows. The Group has no intangible assets with indefinite useful lives.
Capitalized development costs 10 years
Marketing rights 5 to 10 years
Software 3 to 5 years
Amortization of these assets begins when the assets are available for use.
The method of amortization, the estimated useful lives and the residual value are reviewed on the closing date. Any changes are accounted for prospectively as changes in accounting estimates.
Furthermore, intangible assets unavailable for use are tested for impairment annually or each time there is any indication that it may be impaired.
11 Borrowing costs
Borrowing costs that are directly attributable to the acquisition, construction or production of an asset that necessarily takes a substantial period of time to get ready for its intended
- 24 -
use are capitalized as part of the cost of that asset. Any other borrowing costs are recognized in profit or loss in the period in which the costs are incurred.
12 Leases
Leases are classified as finance leases if substantially all the risks and rewards incidental to ownership are transferred to the Group, and leases other than finance leases are classified as operating leases.
Finance leases are recognized as assets and liabilities on the consolidated statement of financial position at the commencement of the lease term at the lower of the fair value of the lease property estimated on the inception of the lease or the present value of the total amount of minimum lease payments estimated on the inception of the lease. Depreciation of leased assets is recorded using the straight-line method over the shorter of the lease term or the estimated useful life except when it is reasonably certain that ownership will be acquired before the end of the lease term. The total amount of minimum lease payments is allocated to financial costs and the amount of repayment of lease obligations. Financial costs are allocated to each fiscal year over the lease term to provide a fixed interest rate on outstanding obligations, and are recognized on the consolidated statement of profit or loss.
With regard to operating leases, lease payments are recorded as expenses using the straight-line method over the lease term, unless the time pattern of benefits to the user is better presented by another regular method.
13 Impairment of non-financial assets
The Group determines whether there is any indication that it may be impaired in non-financial assets other than inventories and deferred tax assets as of the closing date.
If there is any indication of impairment or if annual impairment test is required, the recoverable amount of each asset is estimated. If the recoverable amount of individual assets cannot be estimated, the recoverable amount of the cash-generating unit to which the assets are attributable is estimated.
The recoverable amount of an asset or a cash-generating unit is measured at the higher of its fair value less costs to sell and its value in use. The value in use is estimated by discounting estimated future cash flows to present value, and the discount rate used reflects the time value of money and the risks inherent to the relevant assets.
Only if the recoverable amount of an asset or a cash-generating unit is lower than the carrying amount, the carrying amount of the asset is reduced to the recoverable amount, and is recognized as profit or loss.
With regard to assets and cash-generating units other than goodwill for which impairment losses were recognized in previous years, the Company determines whether there is any indication that impairment losses recognized in previous fiscal years may be reduced or eliminated on the closing date. If there is any indication, the recoverable amount of the asset or the cash-generating unit is estimated, and if the recoverable amount exceeds the carrying amount, impairment losses are reversed up to the lower of the estimated recoverable amount or carrying amount after deduction of depreciation if impairment losses were not recognized in previous years. Reversals of impairment losses are immediately recognized in profit or loss.
- 25 -
14 Post-employment benefits
(1) Defined benefit plans
The present value of net defined benefit liability, related current service cost and past service cost are determined using the projected unit credit method for each plan. The discount rate is determined by reference to market yields on trusted corporate bonds on the closing date. Liabilities and assets pertaining to defined benefit plans are calculated by deducting the fair value of plan assets from the present value of defined benefit liability. However, if the defined benefit plan is overfunded, the asset ceiling of the net amount of defined benefit assets is the present value of economic benefits available in the form of refunds from the plan or reduction in future contributions to the plan.
Remeasurement of net defined benefit assets and liabilities is recognized collectively in other comprehensive income for the period in which they are incurred, and is transferred to retained earnings.
(2) Defined contribution plans
Expenses related to defined contribution post-employment benefits are recognized when related services are rendered by employees.
15 Share-based payment
(1) Equity-settled payment
Equity-settled share-based payment is recognized as an expense over the vesting period, and the same amount is recognized as an increase in equity by estimating the fair value of services received using the fair value of the equity instruments granted on the grant date.
(2) Cash-settled payment
Cash-settled share-based payment is recognized as an expense over the vesting period, and the same amount is recognized as an increase in liabilities by measuring the services received and liabilities incurred at the fair value of the liability.
Furthermore, the fair value of the liabilities is re-measured on the closing date and the settlement date, and changes in the fair value are recognized in profit or loss.
16 Provisions
Provisions are recognized if there is a present legal obligation or estimated obligation as a result of past events, it is probable that an outflow of resources embodying economic benefits will be required to settle the obligation, and a reliable estimate of the obligation can be made.
If the time value of money is significant, estimated future cash flows are discounted to present value using pre-tax discount rate reflecting the time value of money and risks inherent to liabilities. Reversals of the discount amount associated with the passage of time are recognized as financial costs.
17 Government grants
Government grants are recognized when the Group meets the conditions attaching to the grants and that there is reasonable assurance that the grants will be received. Government
- 26 -
grants for acquisition of assets are recorded as deferred income and recognized as revenue on a systematic basis over the useful life of the assets. Government grants for expenses incurred are recognized as other operating revenue on a systematic basis over the periods in which the related costs for which the grants are intended to compensate are recognized.
18 Financial instruments
(1) Financial assets
(i) Initial recognition and measurement
Financial assets are classified on initial recognition into financial assets measured at fair value through profit or loss, financial assets measured at fair value through other comprehensive income and financial assets measured at amortized cost. These financial assets are initially recognized on the trade date when the Group becomes a party to the contractual provisions.
Financial assets other than financial assets measured at fair value through profit or loss are measured at fair value plus transaction expenses, except for trade receivables not containing a significant financial component.
Financial assets are classified as financial assets measured at amortized cost if both of the following conditions are met.
Assets are held based on a business model for the purpose of holding assets to collect contractual cash flows.
The contractual terms of the financial asset give rise on specified dates to cash flows that are solely payments of principal and interest on the principal amount outstanding.
Financial assets other than financial assets measured at amortized cost are classified as financial assets measured at fair value.
Equity instruments are designated as being measured at fair value through profit or loss, or measured at fair value through other comprehensive income for individual equity instruments, and the designation is continuously applied, with the exception of equity instruments held for trading purpose that must be measured at fair value through profit or loss.
(ii) Subsequent measurements
Measurements after initial recognition of financial assets are measured according to the classification as follows.
(a) Financial assets measured at amortized cost
These are measured at amortized cost based on the effective interest method. Interest revenue using the effective interest method is recognized in profit or loss.
(b) Financial assets measured at fair value
Changes in the fair value are recognized in profit or loss.
However, for equity instruments designated as being measured at fair value through other comprehensive income, changes in the fair value are recognized in other comprehensive
- 27 -
income. Cumulative gains and losses recognized as other comprehensive income are transferred to retained earnings if the equity instruments are disposed of or their fair value decreases significantly. Dividends on the equity instruments are recognized in profit or loss.
(iii) Derecognition
Financial assets are derecognized on the trade date if the contractual rights to the cash flows from the financial assets expire, or if the contractual rights to receive the cash flows of those financial assets are transferred and substantially all the risks and rewards of ownership of the financial assets are transferred.
If the Group continues to control the transferred assets, it recognizes retained interests in the financial assets and liabilities that might be payable in association therewith, to the extent of its continuing involvement in the financial assets.
(iv) Impairment
For financial assets measured at amortized cost, a loss allowance against expected credit losses is recognized.
The Group determines whether the credit risk pertaining to each financial asset has significantly increased on the closing date since the time of initial recognition, and recognizes expected credit losses for 12 months as loss allowance if the credit risk has not increased significantly, or recognizes the amount equivalent to expected credit losses throughout the entire period as loss allowance if credit risk has increased significantly. The provision or reversal of loss allowance is recognized in profit or loss.
Expected credit losses are measured based on the present value of the difference between all contractual cash flows to be paid to an entity under the contract and all cash flows expected to be received by an entity under the contract, and are estimated using the method reflecting the following items.
Unbiased probability-weighted amount that is calculated by evaluating a specific range of possible outcomes
Time value of money
Reasonable and supportable information that is available without excessive cost or labor on the reporting date about past events, current conditions and forecasts on future economic conditions
The Company determines whether there has been a significant increase in credit risk based on changes in the risk of default occurrence since initial recognition.
In principle, a significant increase in credit risk is deemed to occur if more than 30 days have elapsed since the contractual payment due. However, when determining whether there has been a change in the risk of default occurrence and a significant increase in credit risk, information such as deterioration of operating results of the debtor is considered in addition to information on payments past the contractual due date.
If all or part of financial assets cannot be recovered, or it is deemed that recovery is extremely difficult, it is judged that default has occurred.
If it is deemed that the credit risk is low as of the closing date, the credit risk pertaining to the financial asset is determined not to have increased significantly since initial recognition.
- 28 -
However, for trade and other receivables, a loss allowance is always recognized at the same amount as expected credit losses for the entire period regardless of whether or not there is a significant increase in credit risk from the time of initial recognition.
It is determined that credit impairment has occurred if there are objective evidence such as significant financial difficulty of a debtor, a default or delinquency in payment of interest or principal, or bankruptcy of a debtor.
If the recovery of all or part of the contractual cash flows of a certain financial asset cannot be reasonably estimated, the carrying amount is directly reduced in the total amount of financial assets.
(2) Financial liabilities
(i) Initial recognition and measurement
Financial liabilities are classified as financial liabilities measured at amortized cost. They are initially recognized on the trade date when the Group becomes a party to the contractual provisions, and are measured at the amount after deducting transaction costs directly attributable to the financial liabilities.
(ii) Subsequent measurements
These are measured at amortized cost based on the effective interest method.
(iii) Derecognition
Financial liabilities are derecognized when they are extinguished, i.e., when the obligation specified in the contract is discharged, cancelled or expired.
(3) Derivatives
Derivatives are initially recognized at fair value. After initial recognition, derivatives are measured at fair value and subsequent changes in fair value are recognized in profit or loss.
Hedge accounting is not applied to the above derivatives.
(Segment information, etc.)
1. Segment information
The Group conducts business by concentrating management resources on a single segment of the manufacture and sale of generic pharmaceuticals. For this reason, descriptions by reportable segments have been omitted.
- 29 -
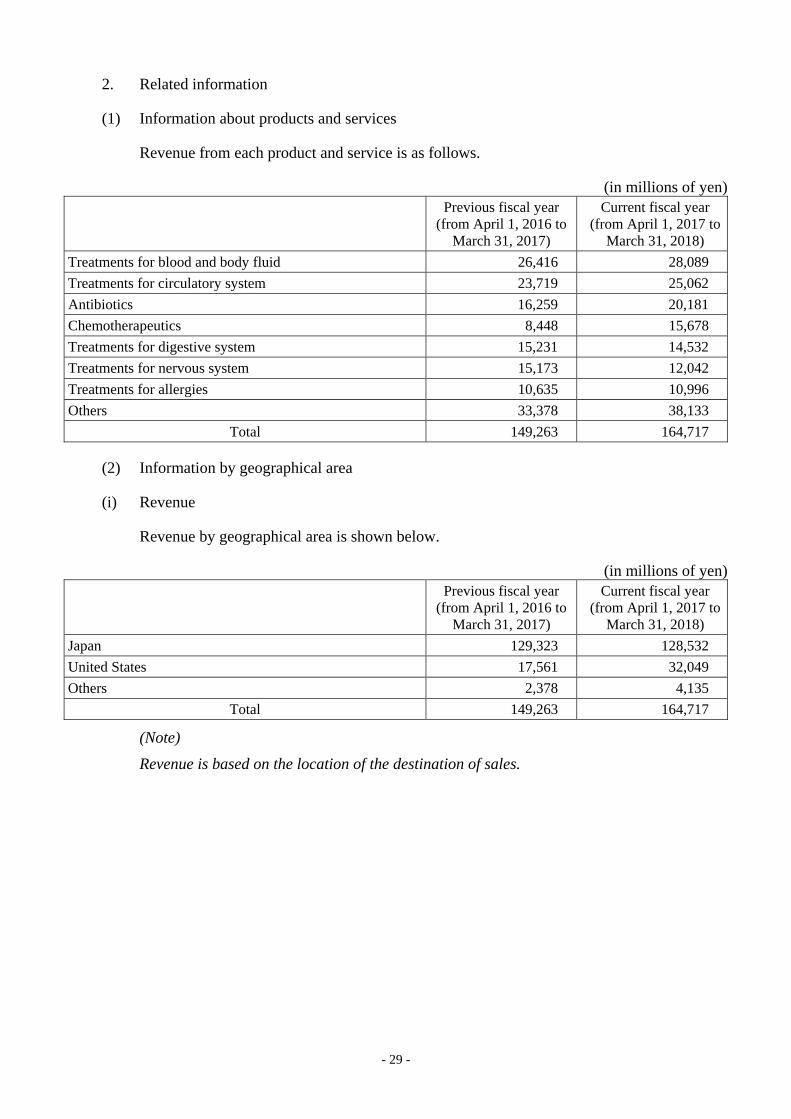
2. Related information
(1) Information about products and services
Revenue from each product and service is as follows.
(in millions of yen) Previous fiscal year
(from April 1, 2016 to March 31, 2017)
Current fiscal year (from April 1, 2017 to
March 31, 2018)
Treatments for blood and body fluid 26,416 28,089
Treatments for circulatory system 23,719 25,062
Antibiotics 16,259 20,181
Chemotherapeutics 8,448 15,678
Treatments for digestive system 15,231 14,532
Treatments for nervous system 15,173 12,042
Treatments for allergies 10,635 10,996
Others 33,378 38,133
Total 149,263 164,717
(2) Information by geographical area
(i) Revenue
Revenue by geographical area is shown below.
(in millions of yen) Previous fiscal year
(from April 1, 2016 to March 31, 2017)
Current fiscal year (from April 1, 2017 to
March 31, 2018)
Japan 129,323 128,532
United States 17,561 32,049
Others 2,378 4,135
Total 149,263 164,717
(Note)
Revenue is based on the location of the destination of sales.
- 30 -
(ii) Non-current assets
The breakdown of the carrying amount of non-current assets (excluding financial assets and deferred tax assets) by geographical area is shown below.
(in millions of yen)
Transition date to
IFRS (as of April 1, 2016)
Fiscal year ended March 31, 2017
(as of March 31, 2017)
Fiscal year ended March 31, 2018
(as of March 31, 2018)
Japan 46,500 52,199 61,717
United States 0 73,887 64,974
Canada - 13,627 14,807
Others 3,201 3,092 3,297
Total 49,702 142,806 144,797
(3) Information about major customers
Revenue to external customers accounting for 10% or more of the Group’s revenue is shown below.
(in millions of yen)
Name of customer Related segment Previous fiscal year
(from April 1, 2016 to March 31, 2017)
Current fiscal year (from April 1, 2017 to
March 31, 2018)
Mediceo Corporation Pharmaceutical business 30,471 31,996
Suzuken Co., Ltd. Pharmaceutical business 23,302 24,002
Alfresa Corporation Pharmaceutical business 18,579 19,331
(Per share information)
The basis for the calculation of basic earnings per share attributed to owners of parent and diluted earnings per share is as follows:
(in millions of yen)
Previous fiscal year
(from April 1, 2016 to March 31, 2017)
Current fiscal year (from April 1, 2017 to
March 31, 2018)
Profit attributable to owners of parent
Profit attributable to owners of parent (in millions of yen) 4,796 8,070
Profit not attributable to common shareholders of parent (in millions of yen)
- -
Profit used in calculation of earnings per share (in millions of yen)
4,796 8,070
Weighted average number of shares of common stock (shares)
56,944,811 56,362,385
Dilutive effect of stock options (shares) 95,113 103,820
After adjustment for the impact of dilutive effect (shares) 57,039,924 56,466,205
Earnings per share
Basic earnings per share (Yen) 84.24 143.19
Diluted earnings per share (Yen) 84.10 142.92
- 31 -
(Significant subsequent events)
(Purchase of shares)
The Company entered into a strategic alliance agreement and a share transfer agreement for a capital and business alliance with Eisai Co., Ltd. (hereinafter referred to as “Eisai”) on March 28, 2018, and acquired 20% of the issued shares of Elmed Eisai Co., Ltd. (hereinafter referred to as “Elmed Eisai”) for the purpose of making Elmed Eisai a subsidiary on April 2, 2018.
(Issuance of share acquisition rights by third-party allotment)
In the meeting of the Board of Directors held on April 4, 2018, the Company resolved to issue share acquisition rights by third-party allotment to be allotted to SMBC Nikko Securities Inc. (hereinafter referred to as “SMBC Nikko Securities”), and issued share acquisition rights allocated to SMBC Nikko Securities on May 8, 2018.
- 32 -
(First-time adoption)
The Group disclosed the consolidated financial statements in accordance with IFRS from the fiscal year ended March 31, 2018. The latest consolidated financial statements prepared in accordance with Japan GAAP are for the fiscal year ended March 31, 2017. The date of transition is April 1, 2016.
The Group has made necessary adjustments to the previously disclosed consolidated financial statements in accordance with Japan GAAP when preparing the consolidated financial statements in accordance with IFRS on the date of transition to IFRS and for the previous fiscal year.
A table of the reconciliations requiring disclosure for the fiscal year in which IFRS is first adopted is as shown in “3. Reconciliations of equity as of the date of transition to IFRS (April 1, 2016)” and thereafter. “Reclassifications” in the table of reconciliations show items that do not have an impact on retained earnings and comprehensive income, and “Adjustments of recognition and measurement” show items that have an impact on retained earnings and comprehensive income.
1. Exemptions under IFRS 1
In principle, IFRS requires an entity adopting IFRS for the first time to retrospectively apply the standards required under IFRS. However, IFRS 1 “First-time Adoption of International Financial Reporting Standards” allows certain exemptions from the retrospective application of certain standards required under IFRS. The exemptions adopted by the Group in transitioning from Japan GAAP to IFRS are as follows.
(1) Business combinations
IFRS 1 permits to elect not to apply IFRS 3 “Business Combinations” retrospectively to business combinations that were implemented before the date of transition to IFRS. The Group has applied the exemptions and elected not to apply IFRS 3 retrospectively to business combinations that were implemented before the date of transition to IFRS. As a result, goodwill arising from the business combinations that were implemented before the date of transition is recorded at the carrying amount on the date of transition under Japan GAAP. Goodwill was tested for impairment as of the date of transition to IFRS, irrespective of whether there is any indication that it may be impaired.
(2) Exchange differences on translation of foreign operations
IFRS 1 permits to elect to deem the cumulative translation differences for foreign operations at the date of transition to IFRS to be zero. The Group elected to deem the cumulative translation differences for foreign operations to IFRS to be zero at the date of transition.
2. Mandatory exceptions to retrospective application of IFRS 1
IFRS 1 prohibits retrospective application of FIRS for “estimates,” “derecognition of financial assets and financial liabilities,” “non-controlling interests” and “classification and measurement of financial assets.” The Group applies these items prospectively from the date of transition to IFRS.
- 33 -
3. Reconciliations of equity as of the date of transition to IFRS (April 1, 2016)
(in millions of yen)
Accounts under Japan GAAP
Japan GAAP Reclassifi-
cation
Differences in recognition
and measurement
Change in scope of
consolidation and closing
date
IFRS Notes Accounts under IFRS
Assets Assets
Current assets Current assets
Cash and deposits 28,182 (425) - 387 28,144 Cash and cash equivalents
Notes and accounts receivable
25,217 1,097 (273) 105 26,147 Trade and other receivables
Electronically recorded monetary claims
919 (919) - -
Allowance for doubtful accounts
(1,731) 1,731 - -
Merchandise and finished goods
26,092 19,249 (57) 51 45,335 Inventories
Work in process 9,177 (9,177) - -
Raw materials and supplies
10,071 (10,071) - -
Deferred tax assets 1,458 (1,458) - -
Other current assets 2,073 (1,920) 293 83 529 Other financial assets
435 (2) 99 532 Other current assets
101,461 (1,458) (40) 726 100,689 Total current assets
Fixed assets Non-current assets
Property, plant and equipment, net
38,786 - (443) 204 38,547 A Property, plant and equipment
Goodwill 634 - - - 634 F Goodwill
Other intangible assets 5,845 - (5) 0 5,840 Intangible assets
4,984 (14) (429) 4,540 Investments accounted for using equity method
Investment securities 8,699 (95) 154 (318) 8,439 Other financial assets
Long-term loans receivable
4,619 (4,619) - -
Deferred tax assets (investments and other assets)
490 1,304 663 10 2,468 B Deferred tax assets
Other assets (investments and other assets)
514 (358) (17) 0 139 Other non-current assets
Allowance for doubtful accounts (investments and other assets)
(89) 89 - -
Total fixed assets 59,502 1,304 336 (532) 60,610 Total non-current assets
Total assets 160,963 (154) 296 194 161,300 Total assets
- 34 -
(in millions of yen)
Accounts under Japan GAAP
Japan GAAP Reclassifi-
cation
Differences in recognition
and measurement
Change in scope of
consolidation and closing
date
IFRS Notes Accounts under IFRS
Liabilities and equity
Liabilities Liabilities
Current liabilities Current liabilities
Notes and accounts payable
15,993 20,208 340 (20) 36,520 Trade and other payables
Total net assets 82,432 - (1,406) 244 81,271 Total equity
Total liabilities and net assets
160,963 (154) 296 194 161,300 Total liabilities and equity
- 35 -
(Note)
The amounts under Japan GAAP include the assets, liabilities and net assets of subsidiaries newly included in the scope of consolidation on April 1, 2016.
- 36 -
4. Reconciliations of equity as of the end of the previous fiscal year (March 31, 2017)
(in millions of yen)
Accounts under Japan GAAP
Japan GAAP Reclassifi-
cation
Differences in recognition
and measurement
Change in scope of
consolidation and closing
date
IFRS Notes Accounts under IFRS
Assets Assets
Current assets Current assets
Cash and deposits 14,894 (425) - (2,011) 12,457 Cash and cash equivalents
Notes and accounts receivable
26,304 2,647 4,073 (1,068) 31,956 Trade and other receivables
Electronically recorded monetary claims
1,680 (1,680) - -
Allowance for doubtful accounts
(433) 433 - -
Merchandise and finished goods
41,632 25,955 (58) 432 67,962 Inventories
Work in process 9,143 (9,143) - -
Raw materials and supplies
16,811 (16,811) - -
718 - 23 741 Income taxes receivable
Deferred tax assets 838 (838) - -
Other current assets 3,842 (3,804) 263 64 366 Other financial assets
2,111 (22) (14) 2,074 Other current assets
Total current assets 114,714 (838) 4,256 (2,574) 115,558 Total current assets
Fixed assets Non-current assets
Property, plant and equipment, net
47,439 - (430) 408 47,417 A Property, plant and equipment
Goodwill 41,152 - 842 (1,508) 40,486 F Goodwill
Other intangible assets 51,958 - (5) (1,822) 50,131 Intangible assets
5,417 301 (1,061) 4,657 Investments accounted for using equity method
Investment securities 9,954 (983) (29) (1,171) 7,769 Other financial assets
Long-term loans receivable
2,971 (2,971) - -
Deferred tax assets (investments and other assets)
866 777 816 304 2,765 B Deferred tax assets
Other assets (investments and other assets)
3,452 (3,081) (256) 0 114 Other non-current assets
Allowance for doubtful accounts (investments and other assets)
(1,620) 1,620 - -
Total fixed assets 156,175 777 1,239 (4,850) 153,341 Total non-current assets
Total assets 270,890 (60) 5,495 (7,425) 268,900 Total assets
- 37 -
(in millions of yen)
Accounts under Japan GAAP
Japan GAAP Reclassifi-
cation
Differences in recognition
and measurement
Change in scope of
consolidation and closing
date
IFRS Notes Accounts under IFRS
Liabilities and equity
Liabilities Liabilities
Current liabilities Current liabilities
Notes and accounts payable
22,853 25,936 368 (1,560) 47,598 Trade and other payables
Total net assets 87,580 - (557) (3,851) 83,171 Total equity
Total liabilities and net assets
270,890 (60) 5,495 (7,425) 268,900 Total liabilities and equity
- 38 -
5. Notes on reconciliations of equity
The main details of reconciliations of equity are as follows.
(1) Reclassifications
Reclassifications are made to comply with IFRS provisions. The main details are as follows.
Deferred tax assets and deferred tax liabilities are classified as non-current assets.
Financial assets and financial liabilities are presented separately.
Investments accounted for using equity method are presented separately.
(2) Adjustments of recognition and measurement
(A) Property, plant and equipment
Under Japan GAAP, and land for business use was revalued pursuant to the Act on Revaluation of Land (Act No. 34 of March 31, 1998), but the revaluation has been reversed under IFRS.
This adjustment resulted in property, plant and equipment decreasing by 552 million yen on the transition date and for the previous fiscal year.
(B) Deferred tax
Under Japan GAAP, the tax effect associated with eliminations of unrealized gains and losses was calculated using the effective tax rate of the seller, but under IFRS, this is calculated using the effective tax rate of the buyer. Furthermore, deferred tax assets have changed due to reconsideration of the recoverability of deferred tax assets.
This adjustment resulted in retained earnings increasing by 93 million yen on the transition date and 100 million yen for the previous fiscal year.
Deferred tax assets and deferred tax liabilities have been adjusted due to the temporary difference resulting from the adjustments from Japan GAAP to IFRS, and the impact on retained earnings is presented by inclusion in other items.
(C) Levies
While property tax was recognized as an expense at the time of payment under Japan GAAP, they are recognized as an expense in one lump-sum on the payment date of levies and the corresponding liabilities are recognized under IFRS.
This adjustment resulted in retained earnings decreasing by 235 million yen on the transition date and 19 million yen for the previous fiscal year.
(D) Government grants
Under Japan GAAP, government grants related to assets were recognized collectively as income, but they are recorded under liabilities as deferred income under IFRS.
This adjustment resulted in retained earnings decreasing by 106 million yen on the
- 39 -
transition date and 19 million yen for the previous fiscal year.
(E) Reset of the foreign currency translation adjustment
Electing the exemptions provided for under IFRS 1, the cumulative exchange differences on foreign operations on the date of transition to IFRS have all been transferred to retained earnings.
This adjustment resulted in retained earnings increasing by 897 million yen.
(F) Goodwill
While goodwill was amortized on a systematic basis over the period it was reasonably expected to have an effect under Japan GAAP, its amortization has discontinued since the transition date under IFRS and an adjustment has been reflected in retained earnings.
(G) Change of closing date and change in scope of consolidation
Under Japan GAAP, the consolidated financial statements were prepared based on the financial statements of affiliates accounted for by the equity method on the closing dates even if some affiliates accounted for by the equity method had different closing dates from the Company’s closing date.
Under IFRS, they are prepared based on the financial statements of subsidiaries and affiliates accounted for by the equity method using the same date as the Company’s closing date, unless this is impracticable.
Furthermore, immaterial subsidiaries were excluded from the scope of consolidation and assessed by the cost method or equity method under Japan GAAP, but such subsidiaries are included in the scope of consolidation under IFRS.
- 40 -
6. Reconciliations of comprehensive income for the previous fiscal year (from April 1, 2016 to March 31, 2017)
(in millions of yen)
Accounts under Japan GAAP
Japan GAAP Reclassifi-
cation
Differences in recognition
and measurement
Change in scope of
consolidation and closing
date
IFRS Notes Accounts under IFRS
Net sales 163,378 (21,815) (282) 7,983 149,263 Revenue
Cost of sales 106,637 (1,709) 39 6,685 111,652 Cost of sales
Net income attributable to shareholders of the parent company
4,788 - 1,064 (1,056) 4,796 Owners of parent (profit attribution)
Other comprehensive income
Other comprehensive income
Items that will not be reclassified to profit or loss
Valuation difference on available-for-sale securities
1 - (111) (26) (136) B Financial assets measured at fair value through other comprehensive income
Adjustments in retirement benefits
29 - (28) - 0 Remeasurements of defined benefit plans
101 - (292) (190)
Share of other comprehensive income of investments accounted for using equity method
Items that may be reclassified to profit or loss
Foreign currency translation adjustment
10,254 - 9 (3,057) 7,206 Exchange differences on translation of foreign operations
Share of other comprehensive income of affiliates accounted for using equity method
(83) (101) - 245 60 A
Share of other comprehensive income of investments accounted for using equity method
Total other comprehensive income
10,202 - (130) (3,130) 6,940 Total other comprehensive income
Comprehensive income 14,990 - 934 (4,187) 11,737 Comprehensive income
- 41 -
7. Notes on reconciliations of comprehensive income
The main details of reconciliations of comprehensive income are as follows.
(1) Reclassifications
Reclassifications are made to comply with IFRS provisions. The main details are as follows.
Under Japan GAAP, payments of certain rebates were presented to be included in “selling, general and administrative expenses” but these are presented to be deducted from “revenue” under IFRS. Furthermore, the transactions presented on a gross basis under Japan GAAP that the Group was acting as an agent are presented in net amounts of revenue and cost of sales under IFRS.
Under Japan GAAP, research and development expenses were presented to be included in “selling, general and administrative expenses” but these are independently presented as “research and development expenses” under IFRS.
The items presented as “non-operating income,” “non-operating expenses,” “extraordinary income” and “extraordinary losses” under Japan GAAP are presented as “financial income” or “financial costs” for financial items and “other operating revenue” or “other operating expenses” for other items under IFRS.
Under Japan GAAP, equity in losses (earnings) of affiliates was presented to be included in “non-operating income” or “non-operating expenses,” but these are independently presented as “share of profit (loss) of investments accounted for using equity method” under IFRS.
(2) Adjustments of recognition and measurement
(A) Goodwill
While goodwill was amortized on a systematic basis over the period it was reasonably expected to have an effect under Japan GAAP, its amortization has discontinued since the transition date under IFRS and an adjustment has been reflected in comprehensive income.
This adjustment resulted in comprehensive income increasing by 864 million yen.
(B) Measurement of unlisted shares at fair value
Under Japan GAAP, unlisted shares were mainly measured by the cost method using the moving-average method, but they are measured at fair value under IFRS.
This adjustment resulted in comprehensive income decreasing by 138 million yen.
(C) Tax effect of elimination of unrealized gains on inventories
Under Japan GAAP, the tax effect associated with eliminations of unrealized gains and losses was calculated using the effective tax rate of the seller, but this is calculated using the effective tax rate of the buyer under IFRS.
This adjustment resulted in comprehensive income increasing by 84 million yen.
- 42 -
(D) Change of closing date and change in scope of consolidation
Please refer to “5. Notes on reconciliations of equity, (2) Adjustments of recognition and measurement, (G) Change of closing date and change in scope of consolidation.”
8. Adjustments to cash flows
There are no material differences between the consolidated statement of cash flows that is disclosed in accordance with Japan GAAP and the consolidated statement of cash flows that is disclosed in accordance with IFRS.