Manual for ENGR 435 PROCESS SYSTEMS LABORATORY Web site http://chem.engr.utc.edu/435 Dr. Jim Henry 425-4398 [email protected]Dr. Jim Cunningham 755-4361 [email protected]College of Engineering and Computer Science University of Tennessee at Chattanooga Fall, 1998 Contents 1: Schedule 2 2: Grading 3 3: Objectives & Guidelines 4 4: Project Information 5
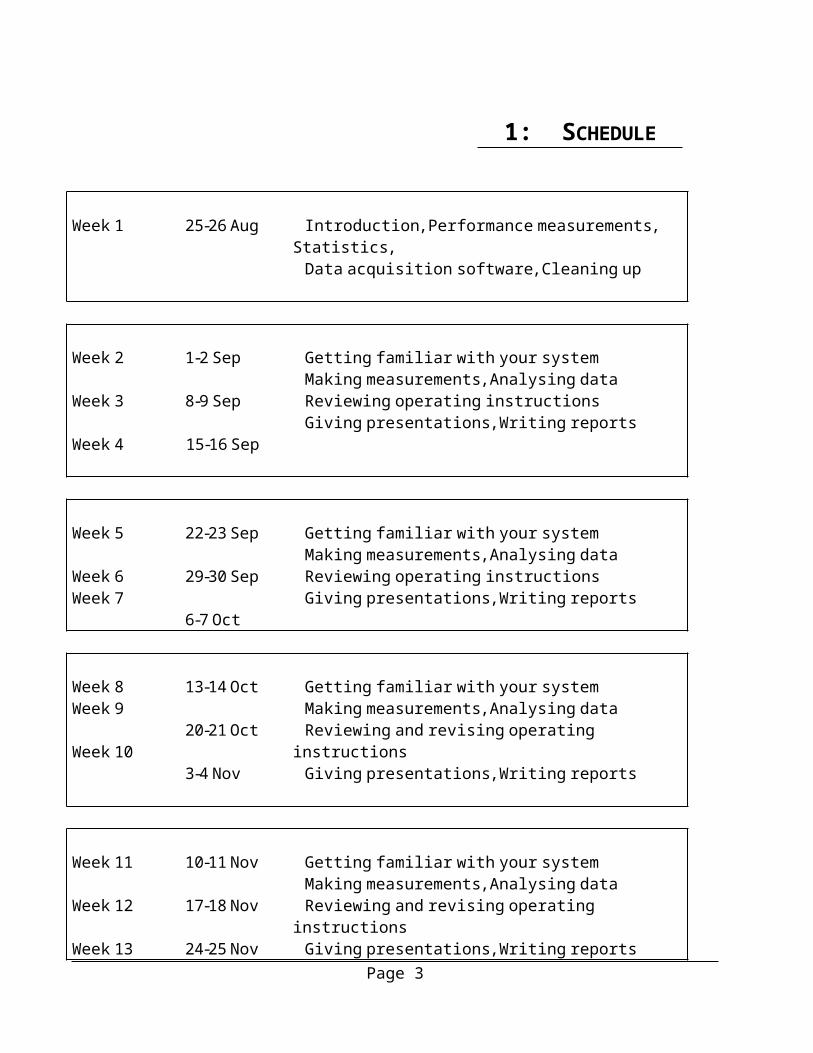
Week 1 25-26 Aug Introduction, Performance measurements, Statistics,Data acquisition software, Cleaning up
Week 2
Week 3
Week 4
1-2 Sep
8-9 Sep
15-16 Sep
Getting familiar with your systemMaking measurements, Analysing dataReviewing operating instructionsGiving presentations, Writing reports
Week 5
Week 6Week 7
22-23 Sep
29-30 Sep
6-7 Oct
Getting familiar with your systemMaking measurements, Analysing dataReviewing operating instructionsGiving presentations, Writing reports
Week 8Week 9
Week 10
13-14 Oct
20-21 Oct
3-4 Nov
Getting familiar with your systemMaking measurements, Analysing dataReviewing and revising operating instructionsGiving presentations, Writing reports
Week 11
Week 12
Week 13
10-11 Nov
17-18 Nov
24-25 Nov
Getting familiar with your systemMaking measurements, Analysing dataReviewing and revising operating instructionsGiving presentations, Writing reports
Week 14 1-2 Dec Giving presentations, Turning in reports, Cleaning up
If I treat you as you are, I will make you worse.If I treat you as though you are what you are capable of becoming, I help you become that.
Page 2
2: Grading Page 3
--Goethe
2: Grading Page 4
2: GRADING
The grading in ENGR 435 will reflect what is observed of your understanding of process systems operation. Evidence of this understanding can be observed in your
• ability to apply the principles to a physical system (performance in the laboratory and quality of results)
• ability to interpret, describe and explain experimental and modeling work (reports and presentations)
The weights given will be40 points Physical laboratory
Lab work will be graded on this scalepoints for Leadership Contributions
Participation CreativityCooperation Teamwork
0 points Absent
The semester grade will be determined by your point total90-up A80-89 B70-79 C65-69 D0-64 F
The following must be completed to receive a passing grade in the lab:2 reports, 3 presentations, performance descriptions and a submitted report notebook.
All work done will receive credit if it is submitted before the last scheduled lab meeting of the semester.
3: OBJECTIVES & GUIDELINES
ObjectivesThe main objectives of the laboratory experiences are to help you sharpen your skill in observing what happens to an engineering system and to accurately and completely describe what you observe.
Guidelines on Safety, Cleanliness, Conservation, Citizenship
We have had over three years of experience with no lost-time injuries in this lab. Let's all do our part to make this year another one. In the event that someone is injured in the lab and is bleeding, before you help them, put on latex gloves that are available in the lab. Have someone show you where they are.
These labs are not routinely cleaned by the custodial workers. We have to keep them clean ourselves. Always leave the lab cleaner when you leave than when you arrived. If the trash cans are full, set them in the hall to be emptied. If an empty trash can is outside the door, bring it into the lab.
Around computer workstations, do not have food or drink. If you have food or drink elsewhere, please clean up your stuff. Recycle aluminum cans and Styrofoam containers. Rinse them first if there's grunge in them.
Conserve resources and money by printing only what is necessary for effective learning. If you print something that you don't need, place the paper in the "one-side-good" recycle stack to be reused. (Put the good side up.) If you are printing a draft, please use paper from the "one-side-good" stack.
Printers are not instantaneous. This lab has one printer and many users. During heavy use times, plan twice and print once. This will reduce frustrations. In the event you don't get a printout instantly, re-read this paragraph.
If you have any suggestions to improve this lab, pass it on to an instructor or assistant.
Page 5
4: PROJECT INFORMATION
Room 303, Administration Building
Absorption column
(significant, but not all, data acquisition with computer)
∆p vs air flow & water flowMaterial balanceFlooding behaviorCO2 absorptionFlow meter installationDesign of experiments
Gas outLiquid in
Gas inLiquid out
Drying furnace
Drying rate for wet materialsDesign of experimentsMaterial balanceEnergy balanceAdding data acquisitionDrying history curveDrying Rate curveMatch experiments with theory in McCabe, Smith
& HarriotExpress drying rates in g/min or lh/hr, flux in
g/min/cm2 or lb/hr/ft2
Moist air out
Dry air in
Heat in
Page 6
4. Project Information Page 7
4. Project Information Page 8
Particulate studies
Sieve analysis equipment
Ahlstrom Filtration participation (?)
Design of experiments
Filter Press
Set-up & operationMaterial balanceWater-only operationSlurry operationFlow meter installationDesign of experimentsAdding data acquisition
Filtrate out
Slurry in Filter cake
out
4. Project Information Page 9
4. Project Information Page 10
Flow through Packed Beds
Flow rate vs. pressure dropDispersion of concentration functionsDesign of experimentsAdding data acquisition
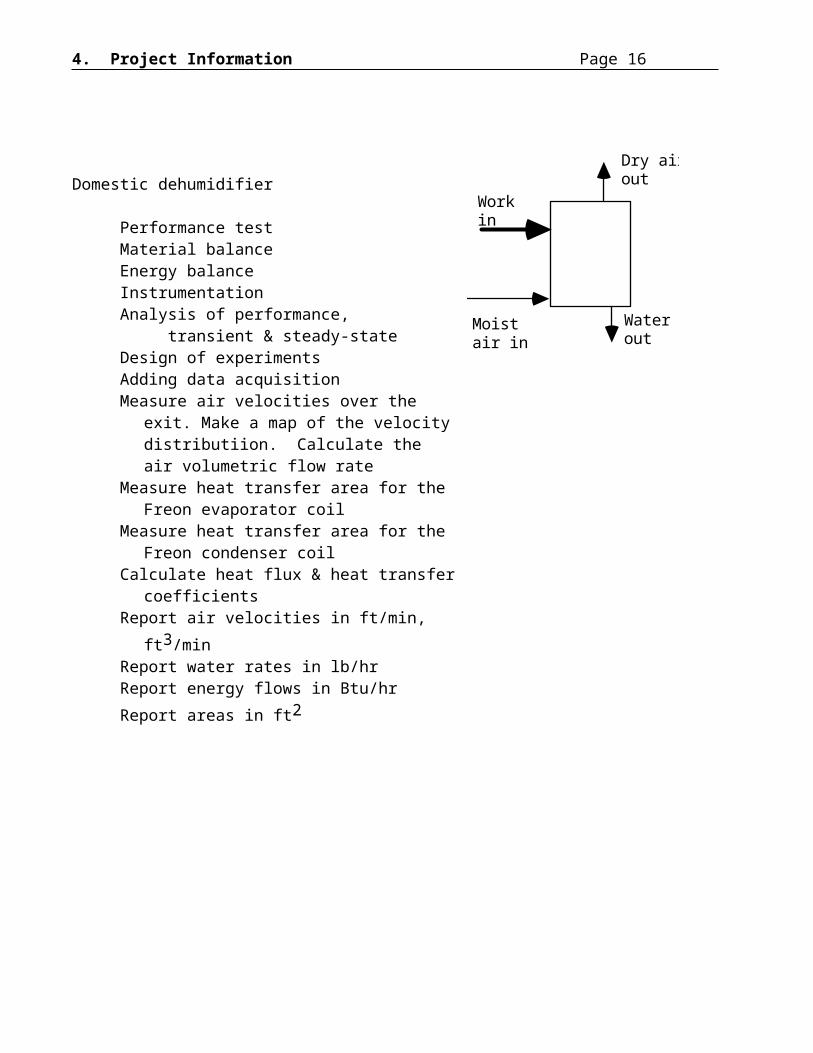
Performance testMaterial balanceEnergy balanceInstrumentationAnalysis of performance,
transient & steady-stateDesign of experimentsAdding data acquisitionMeasure air velocities over the exit. Make a map of
the velocity distributiion. Calculate the air volumetric flow rate
Measure heat transfer area for the Freon evaporator coil
Measure heat transfer area for the Freon condenser coil
Calculate heat flux & heat transfer coefficientsReport air velocities in ft/min, ft3/minReport water rates in lb/hrReport energy flows in Btu/hrReport areas in ft2
Dry air out
Moist air in
Work in
Water out
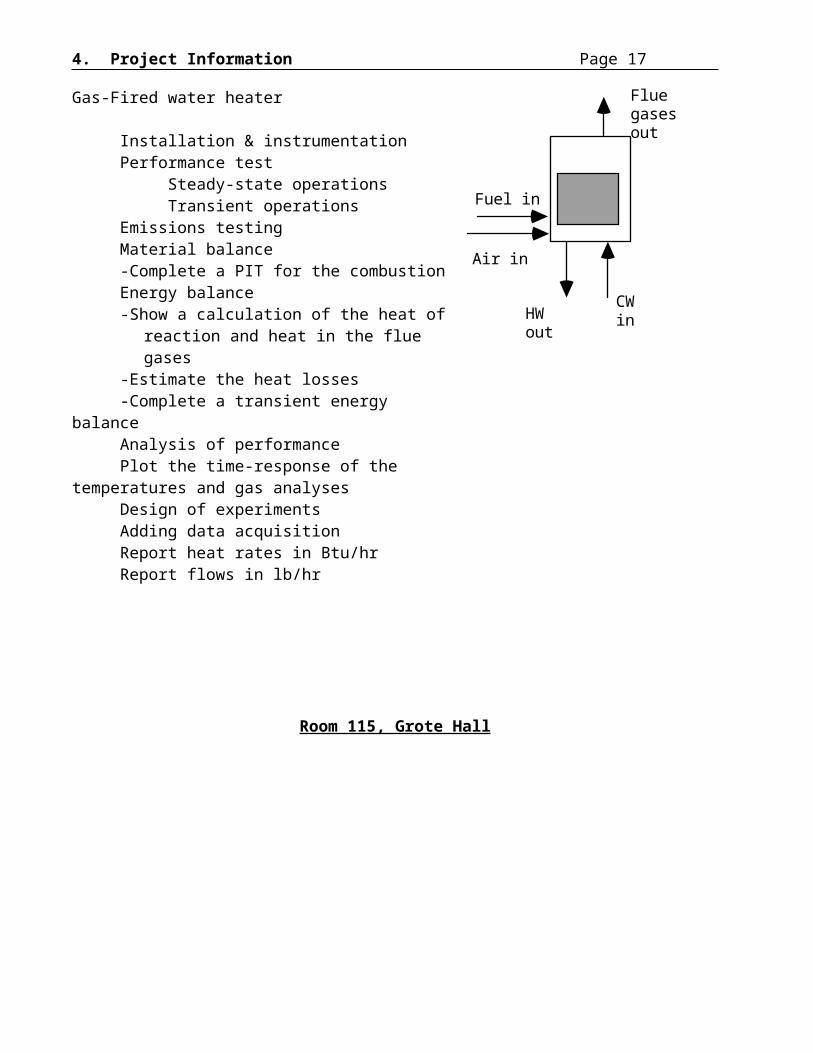
Gas-Fired water heater
Installation & instrumentationPerformance test
Steady-state operationsTransient operations
Emissions testingMaterial balance-Complete a PIT for the combustionEnergy balance-Show a calculation of the heat of reaction and heat
in the flue gases-Estimate the heat losses-Complete a transient energy balanceAnalysis of performance
Flue gases out
Air in
Fuel in
HW out
CW in
4. Project Information Page 13
Plot the time-response of the temperatures and gas analyses
Design of experimentsAdding data acquisitionReport heat rates in Btu/hrReport flows in lb/hr
Room 115, Grote Hall
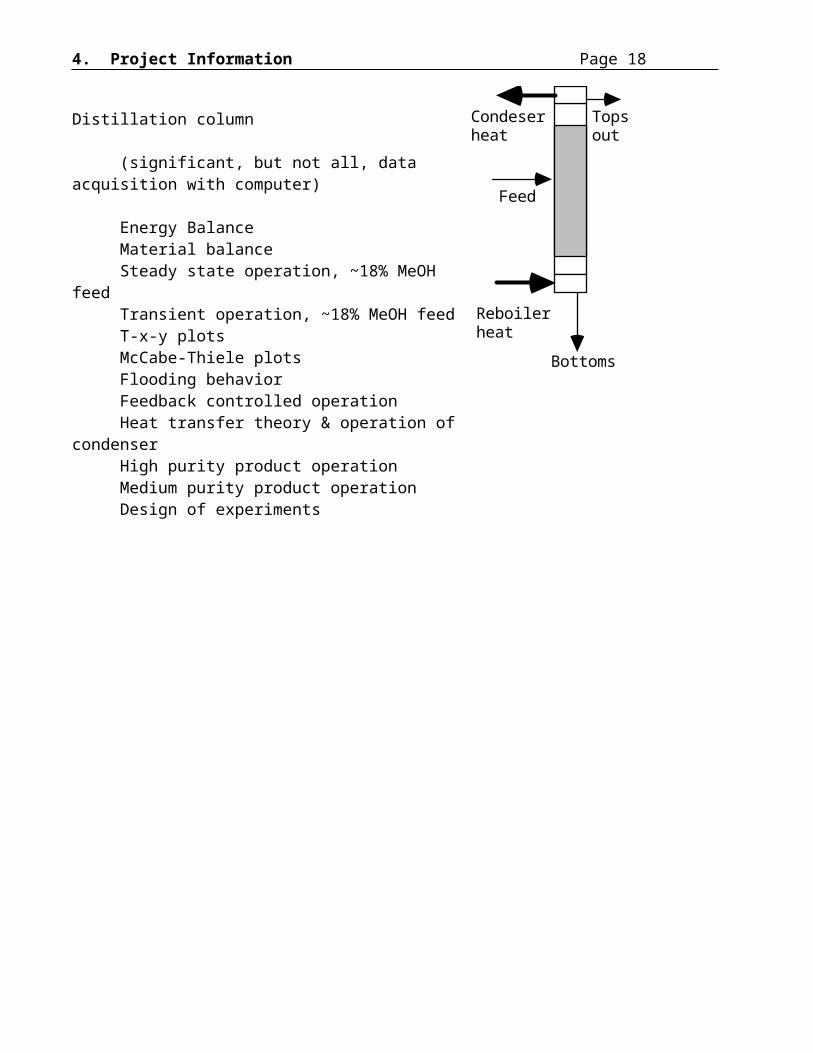
Distillation column
(significant, but not all, data acquisition with computer)
Energy BalanceMaterial balanceSteady state operation, ~18% MeOH feedTransient operation, ~18% MeOH feedT-x-y plotsMcCabe-Thiele plotsFlooding behaviorFeedback controlled operationHeat transfer theory & operation of condenserHigh purity product operationMedium purity product operationDesign of experiments
Tops out
Condeser heat
Feed
Bottoms
Reboiler heat
4. Project Information Page 14
4. Project Information Page 15
Cooling towers
Laboratory, 3-ton unit(significant, but not all, data
acquisition with computer)Hot, dry day operation
Cool, wet day operationMaterial balance-Air balance-Water balanceEnergy balance-Air side energy balance (heat gained)-Water side energy balance (heat lost)
-Estimate the heat losses-Complete a transient energy balance
Steady state operationTransient operationDesign of experimentsReport heat flow in Btu/hr and tons of coolingReport flows in lb/hrReport air velocities in ft/minShow air velocity distributions & averagesShow impact of ambient conditions
Demonstrate on a psychro-chart the calculation procedure
Administration Building cooling tower
Energy balanceMaterial balanceSteady state operationDesign of experimentsAdding data acquisition
(More as above under Lab Cooling Tower)
Central Energy Plant cooling tower
Energy balanceMaterial balanceSteady state operationDesign of experimentsAdding data acquisition
(More as above under Lab Cooling Tower) Hotwaterin
Cooledwaterout
Ambientair in
Moist air out
4. Project Information Page 16
Coffee maker
Energy Balance
Material Balance
Transient operation
Fluid flow theory & operation
Heat transfer theory & operation
Product concentration
Grinding impact
Design of experiments
Adding data acquisition
Room 213, Grote Hall
4. Project Information Page 17
Chemical reactor w/ spectrophotometer
(significant, but not all, data acquisition with computer)
Batch reactor
CSTR reactor
Tubular ("plug flow") reactor
Seady-state and transient operation
Design of experiments
ReactantNaOH
Reactoroutlet
ReactantCV
4. Project Information Page 18
4. Project Information Page 19
Plant visit
BASF/Amnicola
Velsicol
W.R. Grace
Alco Chemicals
Bowater Paper
Moccasin Bend Waste Water Treatment Plant
Tennessee-American Water Treatment Plant
DuPont Plant
Bunge Foods
4. Project Information Page 20
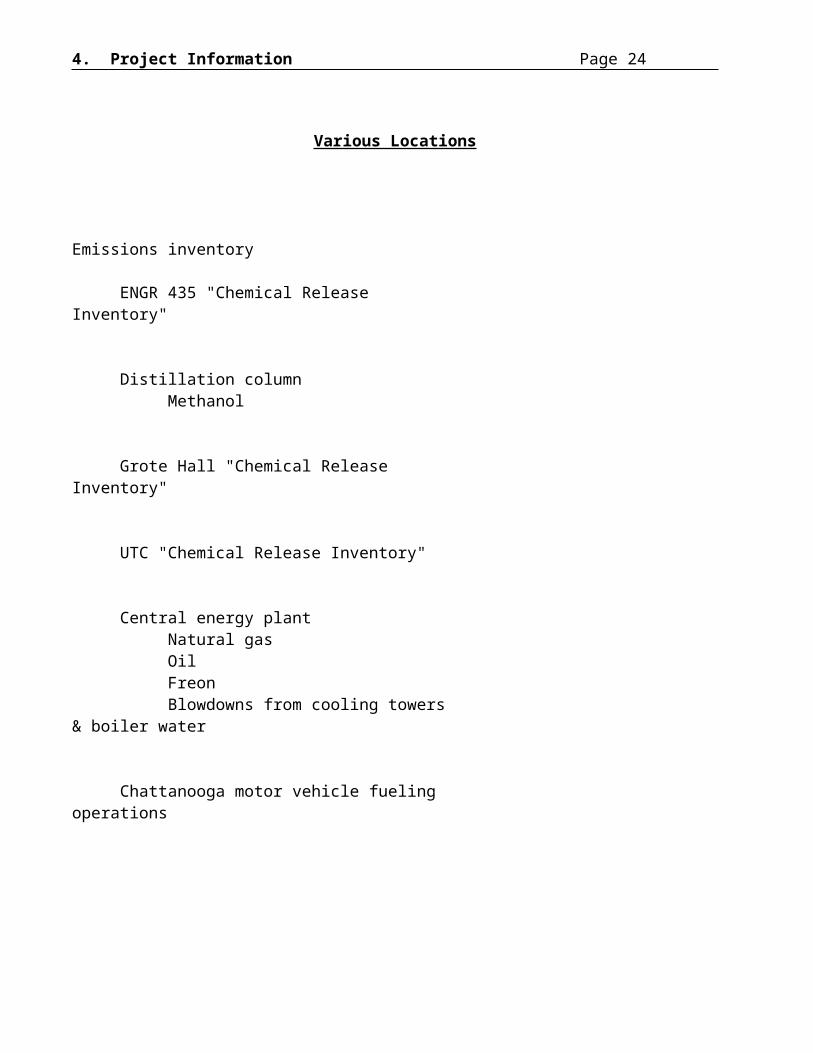
Various Locations
Emissions inventory
ENGR 435 "Chemical Release Inventory"
Distillation columnMethanol
Grote Hall "Chemical Release Inventory"
UTC "Chemical Release Inventory"
Central energy plantNatural gasOilFreonBlowdowns from cooling towers & boiler
water
Chattanooga motor vehicle fueling operations
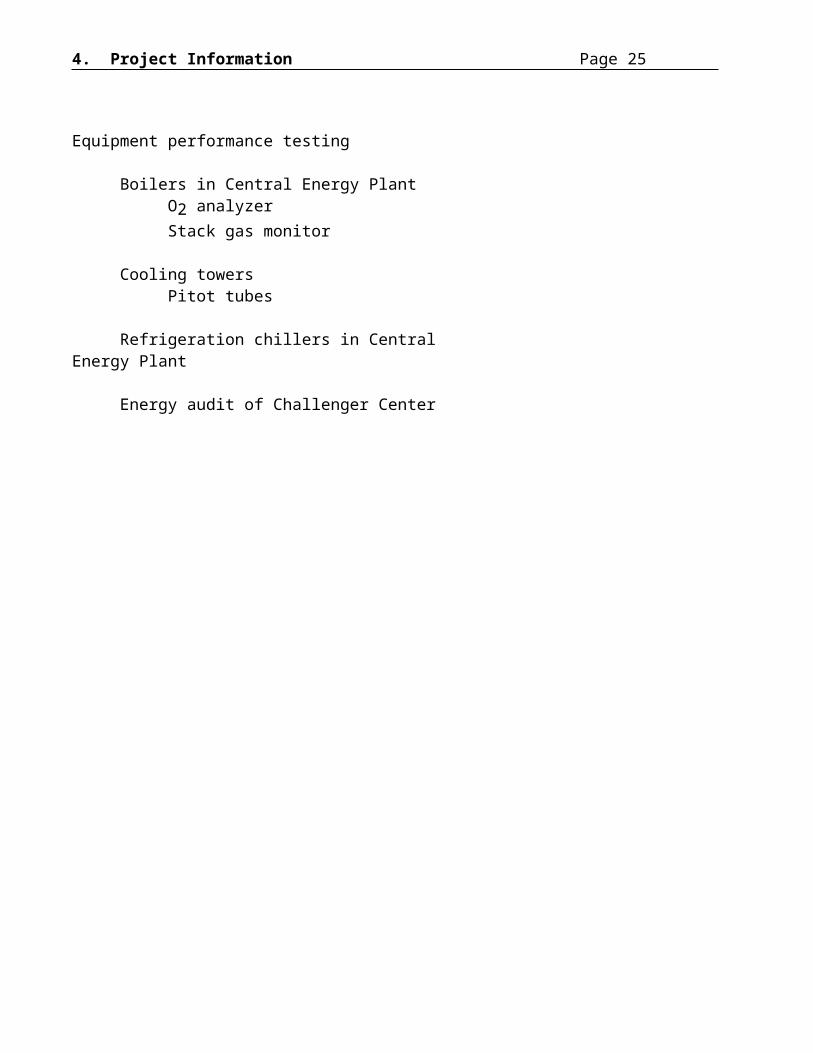
Equipment performance testing
Boilers in Central Energy PlantO2 analyzerStack gas monitor
Cooling towersPitot tubes
Refrigeration chillers in Central Energy Plant
4. Project Information Page 21
Energy audit of Challenger Center
4. Project Information Page 22
Computer Simulations
Chemical plant simulator (ProII)
Flash tank
Distillation, 18% MeOH in water
Design of simulation runs
Air pollution monitoring & modelling
Air Pollution Control Board participation (?)
ALOHA & CAMEO dispersion modelling
Simulated Methanol spill
Design of simulation runs
5: ASSIGNMENTS
WEEK 1 INTRODUCTION
Describe how to determine the fuel usage (miles per gallon) of your car or truck.
Page 23
5. Assignments Page 24
Here are some data for gasoline purchaes. Calculate the miles per gallon for these. List the things that might need to be considered in describing why the results are not all the same.
5. Assignments Page 25
EACH WEEK WORK STATEMENT
Each week that the lab meets, you are to submit a weekly Statement by noon on Friday. If you submit the statement on paper, you are to submit two copies of the statement; one each to Dr. Cunningham and to Dr, Henry. You may submit the statement electronically from the 435 Web Site (http://chem.engr.utc.edu/435) and no need to duplicate it.
List the Project you were assigned and the Objective that you plan to accomplish in your project. Describe what you view as the first task to accomplish on your project. Describe what method of approach you plan to use. Also describe any resources that you will require to accomplish you goals.
The Work Statement is to describe your activities in the lab and following the lab. It is to include the data you collected. The data must be presented clearly so that another engineer can understand it. It is to include any calculations and/or graphs that you have completed. Again, these must be presented clearly.
5. Assignments Page 26
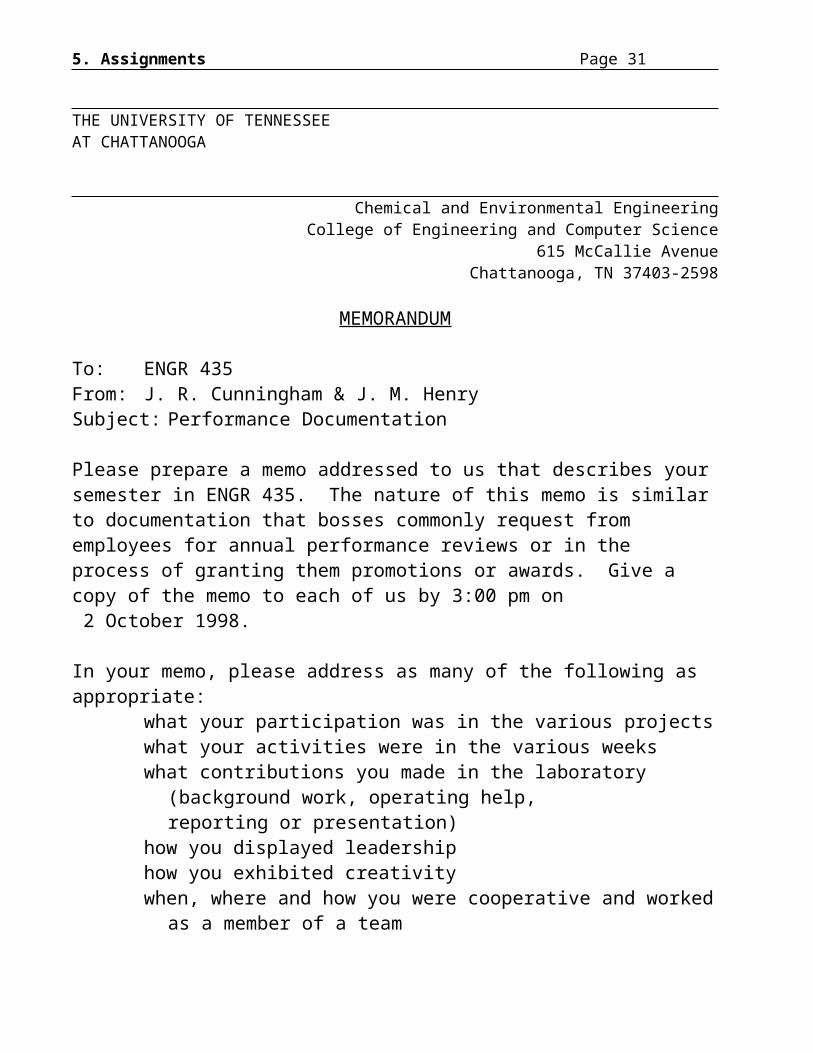
THE UNIVERSITY OF TENNESSEEAT CHATTANOOGA
Chemical and Environmental EngineeringCollege of Engineering and Computer Science
615 McCallie AvenueChattanooga, TN 37403-2598
MEMORANDUM
To: ENGR 435From: J. R. Cunningham & J. M. HenrySubject: Performance Documentation
Please prepare a memo addressed to us that describes your semester in ENGR 435. The nature of this memo is similar to documentation that bosses commonly request from employees for annual performance reviews or in the process of granting them promotions or awards. Give a copy of the memo to each of us by 3:00 pm on 2 October 1998.
In your memo, please address as many of the following as appropriate:what your participation was in the various projectswhat your activities were in the various weekswhat contributions you made in the laboratory
(background work, operating help, reporting or presentation)
how you displayed leadershiphow you exhibited creativitywhen, where and how you were cooperative and worked as a member of a
teamMake the last paragraph a summary of the earlier parts of the memo.
Your memo should deal almost exclusively with specifics. In the last paragraph, and only in the last paragraph, you may make general statements about your part in ENGR 435.
Here are suggested first sentences:
This memo is in response to your request. In here is a description and documentation of my part in ENGR 435 so far this semester. For each
5. Assignments Page 27
project I was involved with, I describe my participation, leadership, contributions, creativity and team work.
THE UNIVERSITY OF TENNESSEEAT CHATTANOOGA
Chemical and Environmental EngineeringCollege of Engineering and Computer Science
615 McCallie AvenueChattanooga, TN 37403-2598
MEMORANDUM
To: ENGR 435From: J. R. Cunningham & J. M. HenrySubject: Performance Documentation
Please prepare a memo addressed to us that describes your semester in ENGR 435. The nature of this memo is similar to documentation that bosses commonly request from employees for annual performance reviews or in the process of granting them promotions or awards. Give a copy of the memo to each of us by 3:00 pm on 4 December 1998.
In your memo, please address as many of the following as appropriate:what your participation was in the various projectswhat your activities were in the various weekswhat contributions you made in the laboratory
(background work, operating help, reporting or presentation)
how you displayed leadershiphow you exhibited creativitywhen, where and how you were cooperative and worked as a member of a
teamMake the last paragraph a summary of the earlier parts of the memo.
Your memo should deal almost exclusively with specifics. In the last paragraph, and only in the last paragraph, you may make general statements about your part in ENGR 435.
Here are suggested first sentences:
This memo is in response to your request. In here is a description and documentation of my part in ENGR 435 this semester. For each project I
was involved with, I describe my participation, leadership, contributions, creativity and team work.
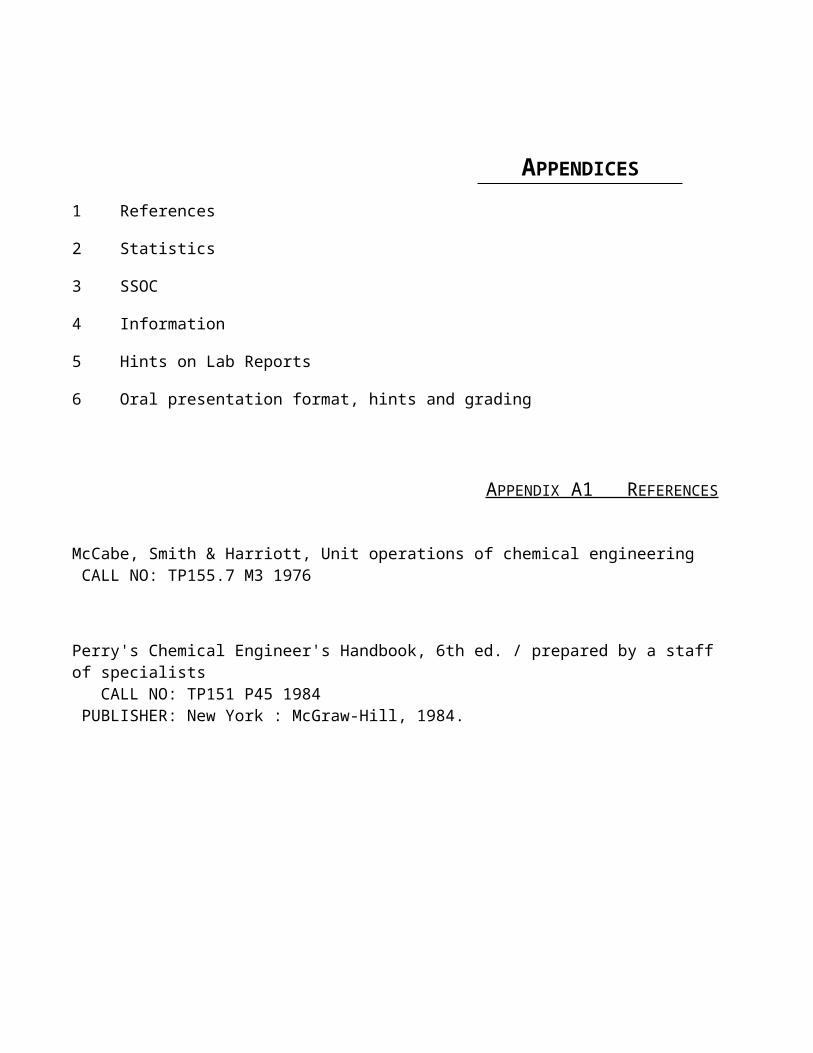
APPENDICES
1 References
2 Statistics
3 SSOC
4 Information
5 Hints on Lab Reports
6 Oral presentation format, hints and grading
APPENDIX A1 REFERENCES
McCabe, Smith & Harriott, Unit operations of chemical engineering CALL NO: TP155.7 M3 1976
Perry's Chemical Engineer's Handbook, 6th ed. / prepared by a staff of specialists CALL NO: TP151 P45 1984 PUBLISHER: New York : McGraw-Hill, 1984.
APPENDIX A2 STATISTICS
Variations in Measured Quantities(ENGR 322)
Every time an experimental measurement is taken, there is some error associated with the measurement. Today you are to determine the error in measurements in your system. Do this by taking steady-state measurements of the output function, C(t), for a number of data points. Find the mean and standard deviation of the measurements you make. Report your results as mean±2x(standard deviation). This range will include the true value of the function at a confidence level of 95%. Be aware that the standard deviation may be different at different operating points. Software packages like Excel or Kaleidagraph can help a lot with the statistics.
The following graph shows how this statistical analysis could look. This graph is the measured output for a steady input.
15
16
17
18
100 105 110 115 120Time
Output = 16.08 ± 0.27
Variation in Output Data
Figure 3. Output data varying with time
APPENDIX A3 SSOC
System Operating Curve
For each value of a constant value of the input function, there will be a value of the output function; this is called the steady-state value of the output for that value of the input. A graph of the output function (on the ordinate) versus the input function (on the abscissa) is called a steady-state operating curve.
An example of what steady-state operating curves look like is in Figure 4.
0
5
10
15
20
0 20 40 60 80 100Input
Figure 4. Example of Steady-State Operating Curve
APPENDIX A4 INFORMATION
Information Flow
In Figure 7 is a diagram that depicts the flow of information is the LabVIEW environment. The computer operator and the equipment transmitters provide inputs into the program. The program provides outputs to the pieces of equipment, the computer monitor and to data files on computer disks.
After using LabVIEW, the controller program, the data can be read by other programs, such as spread sheet programs (Excel or Lotus, for examples) or graphing programs (KaleidaGraph or DeltaGraph, for examples). Excel is available on the computers at UTC.
LabVIEWControllerProgram
OperatorInputs
Outputs toEquipment
Outputs to Data Files
Data PlotsSpread Sheetor Graphingprograms
Equipment inputs
Figure 7. Information paths in laboratory experiments
APPENDIX A5 HINTS ON LAB REPORT
Diagrams, Graphs, & Tables:The reason for putting diagrams, graphs and tables in a report is to organize information so that
it can be easily understood. However, the point that you want to convey in a diagram, graph or table may not be obvious to the reader or grader. You have to tell the reader or the grader what point you want him or her to see in the diagram, graph or table so that he or she doesn't miss that point. A good rule of thumb is to write 2 or 3 sentences for each diagram, graph or table to explain or describe the diagram, graph or table.
Figures:Try to size figures so they fit upright on the page. If you have to turn them sideways, remember
that the top of the figure goes to the left of the page.
See the examples below.
Top
BEST
axis
O.K. BAD
Binder:The reports submitted are to have all your group's reports included in a binder. Put the newest in the front. Include the grading sheet with each report. Separate the reports with tabbed separators that are labeled to identify the reports.
"TJe":This is known as the "Thomas Jefferson Error." This is marked when you
write it's when you mean its. Both words are legitimate words, but they mean different things. It's is the contraction of the two words it is; its is a possessive pronoun that refers to an object.
Contents of "Theory & Background"(by Jay Ware)
Brief review of systemThis should include a schematic diagram of your system with control elements labeled using the standard symbols in the appendix of S&C. The schematic diagram does not have to be pictorial, but is to show the functional relationships among the various components of the system. The block diagram and governing equations or FOPDT equations should be included. Both time-domain and Laplace-domain equations are appropriate. The input and output functions should be clearly defined.
Discussion of Principles behind experimentThis should include the theoretical output for a given input. For examples, the step response for the step input and the steady oscillation response for a sine input. For the control experiments, discuss the theory of P-only or PI control and discuss typical responses. Include tuning parameter equations and discuss how changes in parameters affect the typical response.
Discussion of theory as applied to systemAll variables for your system should be defined. Where you know the values of parameters (from previous measurements or reports) these are to be described in this section. You should clearly point out what are the manipulated variable and the controlled variables.
Brief summary of theoretical responseThis should consist of an explanation of how the system should respond based on theory. In the "Discussion" section, this theoretical response should be compared with experimental and/or approximate modeling response.
Informal ReportReport is due when the instructor specifies.
REPORT CONTENTS
Title PageIncludes "UTC," "Engineering 435," Title, Your Name, Your partners' names, Date
Introduction In the first paragraph, it tells briefly what was done and for what purpose. In the second paragraph, it tells how the report is organized.
Background and Theory Describes the engineering background of the lab, including equations and schematic diagrams
ProcedureDescribes what was done in the physical lab
ResultsDescribes what you observed, the data. Includes tables and graphs. Each table and graph must be explained.It builds on the "Procedure;" the "Procedure" section must describe how all the results in this section were obtained.It includes results of experiments: estimates of errors of the results, SSOC
Discussion Tells the significance of the experiment and the results. It builds on the "Results;" the "Results" section must include all the results that are discussed in this section. "No surprises"
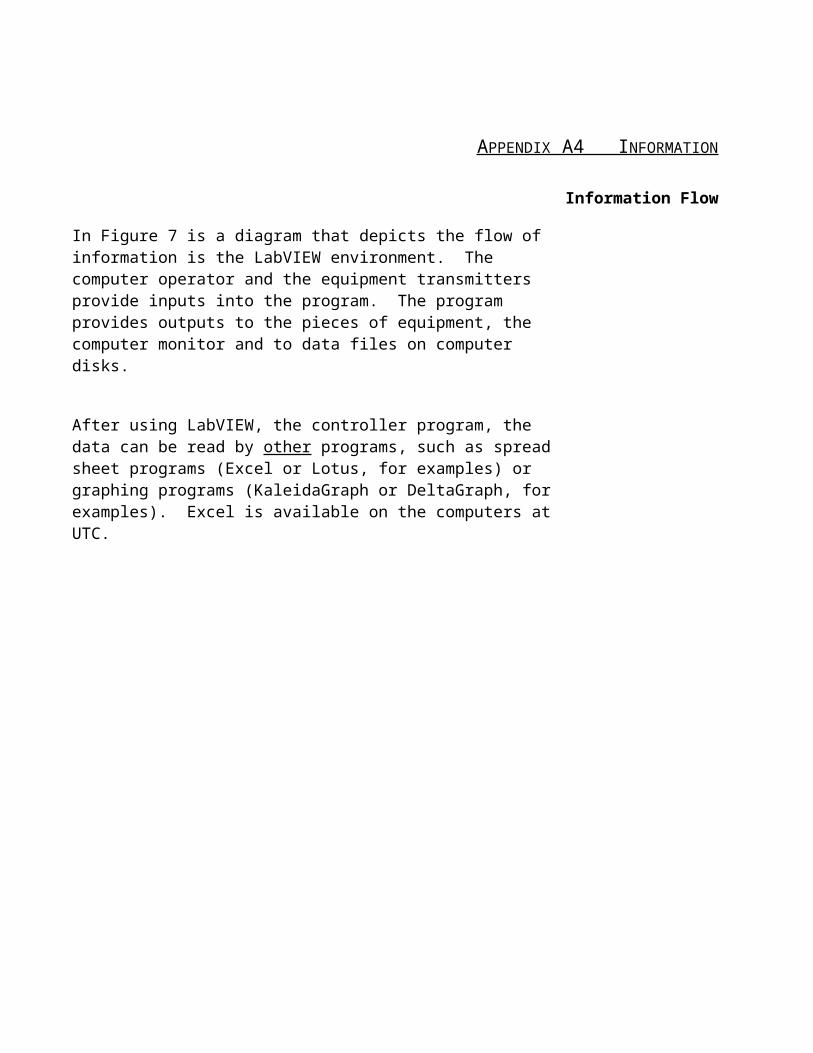
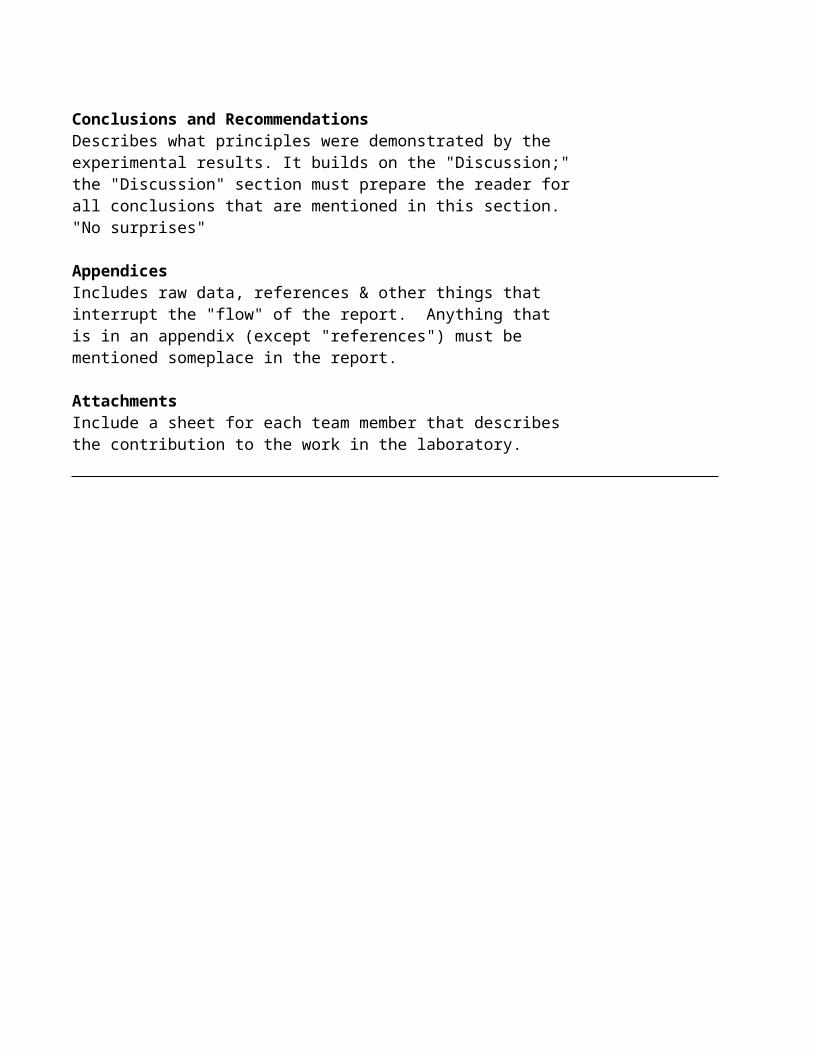
Conclusions and RecommendationsDescribes what principles were demonstrated by the experimental results. It builds on the "Discussion;" the "Discussion" section must prepare the reader for all conclusions that are mentioned in this section. "No surprises"
AppendicesIncludes raw data, references & other things that interrupt the "flow" of the report. Anything that is in an appendix (except "references") must be mentioned someplace in the report.
AttachmentsInclude a sheet for each team member that describes the contribution to the work in the laboratory.
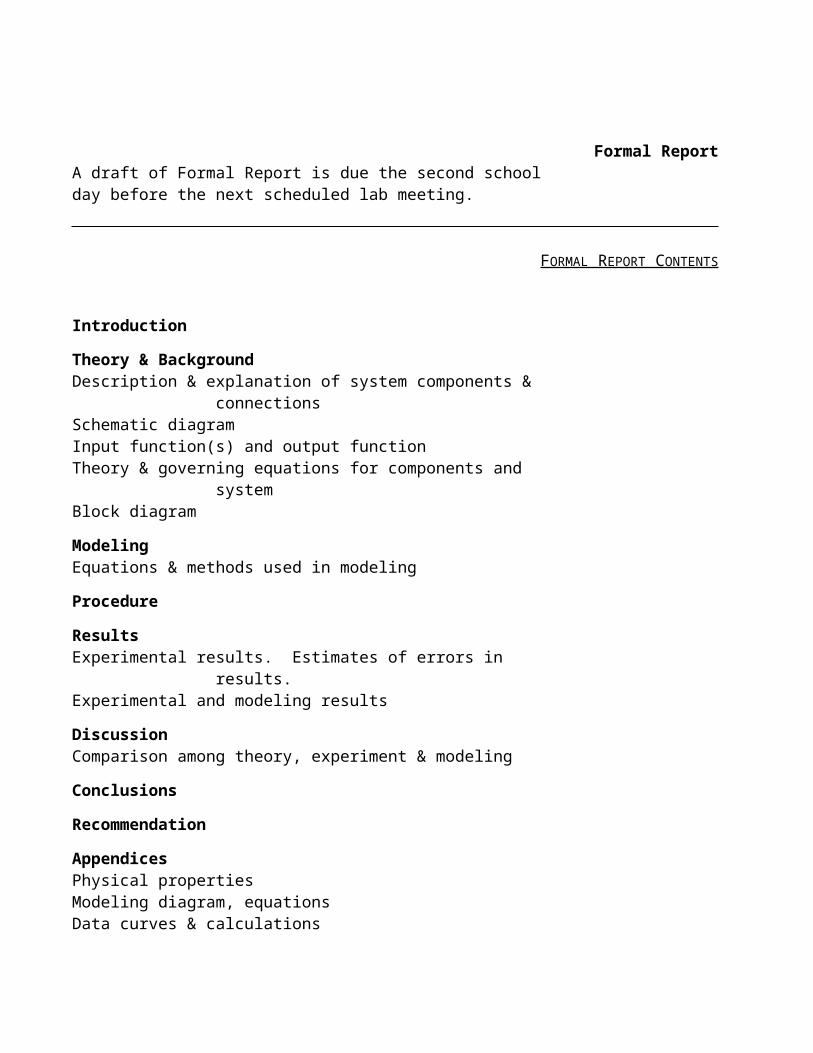
Formal ReportA draft of Formal Report is due the second school day before the next scheduled lab meeting.
FORMAL REPORT CONTENTS
Introduction
Theory & BackgroundDescription & explanation of system components & connectionsSchematic diagramInput function(s) and output functionTheory & governing equations for components and systemBlock diagram
ModelingEquations & methods used in modeling
Procedure
ResultsExperimental results. Estimates of errors in results.Experimental and modeling results
DiscussionComparison among theory, experiment & modeling
ORGANIZATIONEstablish Purpose: What is your objective in making presentation?Assume your audience does not know anything about your subject.Write Conclusion FirstOutline:
IntroductionName and name of team members State reason for presentationBackground-provide enough to follow talk
BodyPresent ideas Include strengths and weaknesses
SummarySummarize briefly State conclusion
Questions-be preparedSelect Information Based on Support of Conclusion-KISS
PREPARATIONVisual aids
Overhead, charts etc. - approximately 1/minute of talkone idea/slide
Include -title slide outline of talk conclusionDo not have complete sentences on your slidesMake your letters on the overheads at least 1/4 inch high.
If you can't get a printer to do that for you, do it by handor use the copy machine to enlarge your copy.
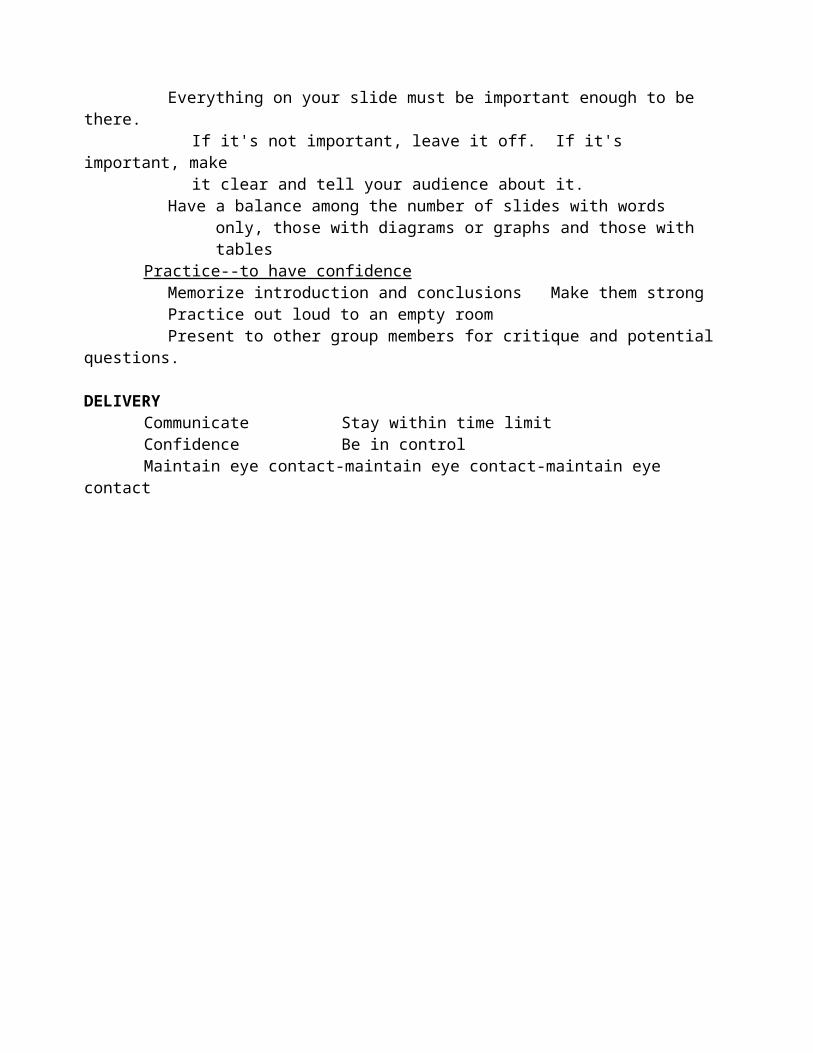
Everything on your slide must be important enough to be there.If it's not important, leave it off. If it's important, makeit clear and tell your audience about it.
Have a balance among the number of slides with words only, those with diagrams or graphs and those with tables
Practice--to have confidenceMemorize introduction and conclusions Make them strongPractice out loud to an empty roomPresent to other group members for critique and potential questions.
DELIVERYCommunicate Stay within time limitConfidence Be in controlMaintain eye contact-maintain eye contact-maintain eye contact
FORMAL ORAL PRESENTATION CONTENTS
Brief system description, including input & output functionsReview of performance curves (SSOC)Description of frequency response experimentsSample time response graph: Transients, steady operationModeling approachComparison of results of experiment & approximate modelComparisons of experimental results and approximate modeling resultsConclusion(s) about systemConclusion(s) about approximate model
Some suggested slides for Week 8 ReportBackgroundPrevious WorkModelingResultsConclusions
Previous WorkTransfer function
Parameters
ResultsTime response Experimental
Approximate model
BackgroundSystem
InputOutput
SSOCOperating Range
ModelingModel equations
Parameters
Conclusions
ORAL PRESENTATION GRADE
NAME: DATE GROUP: SUBJECT:
CONTENT (50%)Introduction
Name and name of team members?_______State reason for presentation?______Background-enough to follow talk?_______
Body Summary
Summarize briefly?
State conclusion? Questions?
VISUAL AIDS (20%)Overhead?
Include -title slide? outline of talk? conclusion? # Text slides # Graphic slides # Tabular slides
DELIVERY (30%)Confidence Stay within time limit? start________end______time_____ Delivery In control/evidence of practice? Maintain eye contact?
OVERALL COMMENTS
EVALUATOR OVERALL GRADE
GRADE RECORD STUDENT
PHONE
WEEK TOPIC GRADE DATE INITIALS
1 INTRO /52 /53 /5
FIRST REPORT /1045 /56 /5
MID-TERM TOTAL POINTS /35
GRADE A | B | C | D | F31 28 24 23
7 /58 PLANT VISIT
9 /510 /511 /512 /513 /5
SECOND REPORT /10ORAL REPORT #1 /10ORAL REPORT #2 /10