Enhanced cellular sensitivity from partitioning the integrin receptors into multiple clusters
Federico Felizzi* and Dagmar Iber†
Department of Biosystems Science and Engineering, Swiss Federal Institute of Technology (ETH) Zurich,Mattenstrasse 26, CH-4058 Basel, Switzerland
(Received 3 October 2012; revised manuscript received 6 December 2012; published 3 January 2013)
Integrins are essential receptors for the development and functioning of multicellular organisms because theymediate cell adhesion and migration, and regulate cell proliferation and apoptosis. In response to cues in theextracellular matrix, they are observed to organize into many clusters. The number and size of such clusters areobserved to vary according to the concentration of and affinity for the extracellular ligand. The realization ofa cluster point pattern is governed by a doubly stochastic process, controlling the number of clusters and thenumber of points per cluster. We construct entropy measures for the separation of two doubly stochastic processesand demonstrate how the self-organization of integrins in multiple clusters contributes to the accuracy in sensingthe extracellular environment.
Integrins are large membrane-spanning molecules that bindto ligands outside the cell and to a variety of regulatory proteinsinside the cell [1]. They are allosteric proteins that can respondto extracellular and intracellular stimuli, which change theiraffinity for ligand [2] and are key receptors in regulating acellular phenomenon known as haptotaxis [3]. Depending onthe availability of extracellular ligands, cells are observed tomigrate at different speeds [4]. In the process of adhesionand migration, integrins are observed to form large clusters[5–7]. It has been suggested that integrin clustering mayresult from interactions of the transmembrane domains [8],but later studies have questioned this [9]. Based on theoreticalconsiderations, it has been noted that a positive feedbackloop could result in integrin clustering [10]. The effect ofimmobile ligands and such a positive feedback loop, whichresults in a high concentration of integrins in their activeconformation, have recently been studied in spatial modelson integrin clustering [11,12].
The ability of cells to robustly detect differences in the ex-tracellular matrix (ECM) density and structure is fundamentalin directing their motion according to the concentration ofextracellular ligand molecules [5,13,14]. Previous studies onthe mechanism that cells employ to sense the environmentand to direct their motion accordingly have been carried outin the more general context of chemotaxis. Here the ligandcues need not be immobile, but could be diffusive [15]. Earlywork in sensing in chemotaxis focused on bacteria [16]. Morerecent work on eukaryotic chemotaxis showed that in the caseof homogeneously distributed receptors, the accuracy of sens-ing could be increased by introducing cooperative couplingbetween contiguous receptors for ligand concentrations closeenough to the receptor-ligand binding affinity [17]. Anotherstudy considered the effects of the elongation of the cell, whichoccurs in the context of polarized cell migration [18]. Theauthors studied the effects of the cell’s eccentricity in sensing.
They observed that high eccentricities significantly alter thephysical limits of sensing, but that the elongation does notimprove the cell’s capacity to simultaneously sense both thedirection and steepness of a chemoattracting gradient in whichit is immersed. Furthermore, an internal asymmetry, due tocell polarization, can improve sensing only if such asymmetryis aligned with the gradient direction [18].
The analysis presented in this paper aims at quantifyingthe role of integrin clustering in sensing the extracellularenvironment, consisting of immobile ligands. For this purpose,we rely on recent experimental observations on the extent ofintegrin clustering in response to different ECM conditions,namely, substrate ligands having different binding affinitiesfor integrins [5] and different concentrations of ligand [6]. Thefirst type of experiment used two types of adhesion ligands,namely, linear and cyclic RGD peptides, exhibiting low andhigh affinity for integrins, respectively [5]. In quantifying theextent of integrin clustering under the experimental conditions,the authors observed that cells exposed to cyclic RGD peptideshad about twice as many clusters as those cells exposedto linear peptides, and those clusters were—on average—smaller. This phenomenon has been shown to likely depend onthermodynamic competition between cluster nucleation andgrowth [19]. Unlike other receptors that need to accuratelysense the strength of binding, as, for instance, in the contextof immunology [20], integrins function as transducers ofmechanical forces exerted by the actin cytoskeleton [21]. Theorganization into larger structures is thus fundamental not onlyin perceiving environmental changes [5], but also in deliveringforces according to the strength of extracellular binding.The second type of experiment investigated the role of theECM density in integrin clustering [6]. For that purpose, theyimplemented a technique to identify ligand-bound integrinsspecifically and could determine macroscopic properties ofintegrin clusters, namely, size, number, shape, and locationwith respect to the cell edge, in response to different ECMdensities. Due to variability within a single cell and amonga population of cells because of extrinsic noise [6,22], theauthors quantified the heterogeneity in the integrin clustersproperties with a probabilistic modeling approach, wherethe probability distributions of the macroscopic quantitiescharacterized the response to the ECM concentration [6].
FEDERICO FELIZZI AND DAGMAR IBER PHYSICAL REVIEW E 87, 012701 (2013)
Given the observed spatial heterogeneity in the macroscopicorganization of integrins with respect to different extracellularstimuli, we explore the possibility that the cell may drive theaggregation of surface integrins as a mechanism to decode theextracellular environment. Each spatial pattern is obtained inresponse to a different stimulus. By combining the relativeentropy [23] of the probability distributions determining thecluster centers and those determining the sizes of the cluster,we seek to construct a measure for the cellular abilityto discriminate robustly the structure of the extracellularenvironment.
In information theory, the concept of relative entropyquantifies the distance between probability distributions [24].The relative entropy can be thought of as the difficulty ofimpersonating a probability distribution by the other [25], oras the reliability of rejecting a hypothesis when the otherone is true, based on observed samples from a probabilitydistribution [26].
Cluster processes are point processes widely used torepresent spatial patterns [27]. They naturally occur whenthe phenomenon under investigation results from a two-stageprocess, namely, the formation of early nucleation points(parent process) and the recruitment of additional points intheir vicinity (daughter process). The use of cluster pointprocesses in modeling the patterns described by integrinscomes naturally from the nucleation and growth processes thatgovern the formation of large integrin aggregates. In clusterprocesses, the observed pattern results from the superpositionof the elements of the clusters; the locations of the cluster“centers,” i.e., the points where the clusters are nucleated, aregenerally unobserved.
In our model, we neglect the causes that drive the formationof integrin clusters, typically early nucleation, force inducedanisotropic growth, and disassembly [7], and instead focus onthe realization of a point pattern at a given time.
Our work is organized as follows. In Sec. II, we rigorouslyformalize the point process governing the clustering ofintegrins, translating the notion of point processes definingclustering to the context of integrin aggregation. In Sec. III,we present the relative entropy between the processes drivingthe organization of integrins into distinct patches and discussthe way the spatial configuration can increase significantly theaccuracy in sensing different extracellular cues.
II. MODEL
Spatial point patterns are observed in a variety of scientificfields. The spatial organization of integrins on the membranecan be thought of as the realization of a point process. Formallyspeaking, a point process is a finite sequence of points � ={Xi}i located at random in the Euclidean space according tosome probability law [28]. Such probability law is a countingmeasure. In other words, given a set B in a simulation domain,�(B) counts the number of points {Xi}i which belong to B.Poisson point processes are widely use for modeling the spatialdistribution of points whose location is independent of theother points. The probability that in a given region B of thesimulation domain there are exactly k points is given by
FIG. 1. Sample realizations of the Neyman-Scott processes out-lined in Sec. II. (a) Sample realization of a parent process with lowintensity and daughter processes having a high number of points perdaughter; (b) parent process with high intensity and daughter processpresenting a small number of points.
where
μ(B) = E(�(B)), (2)
namely, the mean number of points that fall within a regionB. Clustering is an operation done on point processes. Itconsists of replacing each point x belonging to a point process�p (the parent process) with a cluster of Nx points (thedaughter process). With this notation, the entire point processis described by the union (Fig. 1)
� := ∪x∈�pNx. (3)
Cluster processes are treated differently according to thelaw governing the parent process �p and the daughterprocesses. For ease of treatment and with analogy to previousobservations [5,6,19], we consider the process � governingintegrin cluster as a Neyman-Scott process [29]. Neyman-Scottprocesses were originally proposed to model galaxies. Thesimplest version of a Neyman-Scott process is given by theparent process as a homogeneous Poisson point process anda daughter process for which the number of points nc areindependent and identically distributed, and independent ofthe parent process. In biological processes, clusters of integrinsare observed to form preferentially close to the edge of a cell(Fig. 2) [5,6].
A. Distribution of the size of the clusters
According to previous analyses and observations [5,6], weconsider the size of the clusters to follow a log-normal distribu-tion. Note that the number of points per cluster is discrete. We
FIG. 2. Spatial distribution of the cluster centers over an idealizedcell, assumed to be circular. (a) The distribution of the clusters isassumed to follow a distribution favoring their appearance towards theedge of the cell; (b) complete spatial randomness, i.e., a homogeneousPoisson parent process is assumed.
012701-2
ENHANCED CELLULAR SENSITIVITY FROM . . . PHYSICAL REVIEW E 87, 012701 (2013)
use the log-normal distribution as a continuous approximation.For this purpose, we refer to the correspondence betweenthe number of integrins and the size of focal adhesion areasoutlined in [30]. It is reported that ∼700–1200 integrins perμm2 are located in the high-luminescence intensity regions ofthe images [30]. The random variables describing the size ofthe clusters take values in the continuous range of 0–10 μm2.In our model, we deal with point processes, thus we considerthe sizes of the clusters being represented by the number ofintegrins within a cluster. Thus, for our purposes, we considerthe random variable describing the size of the clusters havingthe form
P (n = k) = 1
C
1
k√
2πσ 2e− (ln k−μ)2
2σ2 , (4)
where C is a normalizing constant ensuring that∑
k P (n =k) = 1, and μ and σ are the parameters of the log-normaldistribution. Clusters are alternatively characterized to followan exponential distribution, following the analysis of the forcesinvolved in the growth process [31].
B. Relative entropy
In this section, we focus on the separation between theprobability distributions (p and q) governing the parentand the daughter processes of two distinct cluster processes�p and �q . For this purpose, we use the Kullback-Leibler(KL) divergence [23] and its symmetrization, the Jensen-Shannon (JS) divergence [32]. The KL divergence betweentwo probability density functions p and q is defined as
DKL(p||q) =∫
p(x) lnp(x)
q(x)dx, (5)
where the integral is replaced by a sum if the randomvariables whose densities are p and q take discrete values.A characterization of the relative entropy has been outlined inRef. [33], following arguments from statistical mechanics. Itrepresents the asymptotic behavior of minus logarithm of theprobability of observing samples having frequencies p whenthe actual data was sampled with probability q. Thus, the closerits value is to 0, the closer are the probability distributions p
and q. The JS divergence [32] is defined as
DJS(p||q) = 12 [DKL(p||q) + DKL(q||p)] . (6)
1. Alternative representation of relative entropy
The concept of relative entropy becomes important inthe context of estimation theory, where one seeks to inferthe parameters that gave rise to observed samples. Supposethat the cell is exposed to two distinct extracellular stimuliθp and θq , corresponding to different ligand concentrations(sensitivity) or different ligand structures, resulting in differ-ent integrin-ligand binding affinities (specificity). Typically,different extracellular stimuli give rise to different outcomes.The likelihood of the parameter θ given a set of outcomes{x1, . . . ,xn} is
The reliability of rejecting the stimulus θq when the stimulusθp was presented is given by the likelihood ratio
L[θp|(x1, . . . ,xn)]
L[θq |(x1, . . . ,xn)]. (8)
It was shown ([26]) that the KL divergence can be expressedas
limn→∞
1
nln
L[θp|(x1, . . . ,xn)]
L[θq |(x1, . . . ,xn)]= DKL(p||q), (9)
i.e., the average log-likelihood ratio converges to the KLdivergence as the number of samples approaches infinity. Thischaracterization of the relative entropy will be used to interpretthe numerical results.
C. Relative entropy of the joint parent and daughter processes
For our purposes, the KL divergence is to be computedbetween the joint probability distributions p(c,nt
c), where c isthe number of clusters and nt
c is the total number of pointsin the clusters. Under the assumptions for a Neyman-Scottprocess, the total number of clustered points nt
c is modeled asthe joint distribution of c clusters, i.e.,
ntc|c = (nc, . . . ,nc) , (10)
where nc is the random variable describing the number ofpoints per cluster. We recall the chain rule for the conditionalentropy defined as [24]
DKL(p(c,nt
c
)∥∥q(c,nt
c
))= DKL(p(c)||q(c)) + DKL
(p(nt
c
∣∣c)∥∥q
(nt
c
∣∣c)). (11)
The last term of the sum in Eq. (11) is the average of theconditional probability densities p(nc|c) and q(nc|c) over theprobability density function p(c), i.e.,
DKL(p(nt
c
∣∣c)∥∥q(nt
c
∣∣c))
=∫
p(c)∫
p(nt
c
∣∣c) lnp(nt
c
∣∣c)q(nt
c
∣∣c) dncdc. (12)
Given the number of clusters c, the distributions of the daughterprocesses are independent of each other and identicallydistributed, thus the conditional density p(nt
c|c) factors as
p(nt
c|c) =
c∏i=1
p(nc). (13)
Hence, Eq. (12) rewrites as
DKL(p(c,nt
c
)∥∥q(c,nt
c
)) = DKL(p(nc)‖q(nc)) · E(c). (14)
D. Including spatial information
Here we discuss the procedure to compute the relativeentropy between two spatial processes when the intensity ofthe parent process is not uniform over the spatial domain.For this purpose, we assume a cell to be circular and that theintensity of the parent process is nonhomogeneous over theradial coordinate, but is homogeneous over the angular one(Fig. 2). Under these assumptions, we consider the realization
012701-3
FEDERICO FELIZZI AND DAGMAR IBER PHYSICAL REVIEW E 87, 012701 (2013)
of a parent process in a circle of radius R,
p(c,r) = P [N (r + dr) − N (r) = c] = [λp(r)dr]k
k!e−λp(r)dr ,
(15)
where λp(r) is the radial-dependent intensity of the parentprocess, satisfying
∫ R
0πr2λp(r)dr = λp, (16)
where λp is the mean number of parent points. We considerthe KL divergence between two homogeneous Poisson distri-butions,
DKL(p(c)‖q(c)) =∞∑
c=0
p(c) lnp(c)
q(c)= λp ln
λp
λq
+ λq − λp,
(17)
where λp and λq are the means of the distributions p andq, respectively, and construct the KL divergence between thedistributions driving two nonhomogeneous parent processes—defined as in Eq. (15)—as
DKL(p(c,r)||q(c,r)) =∫ R
0
∞∑c=0
p(c,r) ln
[p(c,r)
q(c,r)
]
=∫ R
0dr
{λp(r) ln
[λp(r)
λq(r)
]
+ λq(r) − λp(r)
}, (18)
where the last integral contains the closed form expression forthe KL divergence between Poisson distributions with meansλp(r) and λq(r), respectively [Eq. (17)]. We include in theabove analysis the distributions for the sizes of the daughterclusters, thus we consider probability distributions of the formp(nt
c,c,r). In constructing the KL divergence between two suchprobability distributions p(nt
c,c,r) and q(ntc,c,r), we apply
the chain rule for the conditional relative entropy defined inEq. (11) as
DKL(p(nt
c,c,r)∥∥q
(nt
c,c,r))
= DKL(p(c,r)‖q(c,r))+DKL(p(nt
c
∣∣c,r)∥∥q(nt
c
∣∣c,r)).(19)
Here, the first term of the sum represents the KL divergencebetween two nonhomogeneous parent processes, as in Eq. (15),whereas the second term of the sum can be further manipulated.Specifically, in our case, the total number of clustered pointsis conditionally independent of the spatial location r given thenumber of clusters c, thus
where we substituted Eq. (14) for the expression in Eq. (20).
(b)(a)
FIG. 3. (Color online) Circular sectors responding to differentexternal stimuli. (a) Front and rear sectors only, as, e.g., when the cellis migrating towards higher ECM concentrations. (b) Restriction ofthe decision on the angular sectors presenting different concentrationsof ligand in the extracellular matrix or different ligand structures(integrin-ligand binding affinity).
E. Directional sensing
The above analysis provides an interpretation for differentcellular responses based on the spatial organization of integrinclusters over the entire cell. In practice, the cell sensesdifferent ECM structures and performs a decision regardingin which direction to continue its movement [34–36]. Forthis purpose, we consider the cell to be divided into angularsectors [Figs. 3(a) and 3(b)] and consider the behavior of theKL divergence for different values of the angles. Assuminghomogeneity over the angular coordinate, the mean numberof parent points in an angular sector varies proportionally tothe size of the angle, according to properties of the Poissondistribution [37]; the Poisson distribution restricted to anangular sector with angle α has parameter α
2πλp, where λp
is the mean number of parent points over the entire circle.Similarly, the expression for the KL divergence in Eq. (14)rescales by a factor α/2π , and so does the one betweenprocesses with nonhomogeneous parents [Eq. (21)].
III. RESULTS AND DISCUSSION
In the following sections, we present the insights gainedfrom our model for two distinct biological processes, with onerelated to different types of patterns forming upon altering theaffinity between integrins and the ECM, and one related toalterations of the concentration of ligands in the ECM. In thefirst case, we rely on the experimental observations outlined inRef. [5]. For the second case, we use the explicit form of theprobability distributions fitted to experimental data presentedin Ref. [6].
A. Specificity: Homogeneous parent and homogeneousdaughters
In this section, we analyze the relative entropy betweenthe distributions governing the clusters resulting from twotypes of extracellular stimuli, namely, linear and cyclic RGDpeptides [5]. We start with the most basic assumption aboutthe distribution of the number of parent points (number ofclusters), i.e., a homogeneous Poisson point process, and wemodel the daughter points (number of integrins per cluster) tofollow a log-normal distribution, as outlined in Sec. II A. In thissection, we focus on the variations of the spatial organization ofintegrins by altering the affinity to external ligand molecules.It was reported that cells adhering to linear RGD peptides
012701-4
ENHANCED CELLULAR SENSITIVITY FROM . . . PHYSICAL REVIEW E 87, 012701 (2013)
0 200 4000
0.005
0.01
0.015
0.02
0.025
0.03
0.035
No. of clusters
pd
f
Parent process
0 2 4 60
0.2
0.4
0.6
0.8
1
1.2
1.4x 10
−3
(a) (b)
size of the cluster (µ m2)
pd
f
Daughter process
linear RGDcyclic RGD
Ligand
FIG. 4. (Color online) (a) Distribution of the number of parentpoints and (b) size of the daughter process for the high affinitycyclic RGD peptides (solid • line) and the low affinity linear RGDpeptides (dashed line). The values of the parameters governingthese distributions are reported in Table I.
(lower affinity) presented about 121 focal adhesion sites andthe average size of a focal adhesion complex was 1.14 μm2 [5].Cells adhering to cyclic RGD peptides (higher affinity) showedabout twice as many focal contacts (231) and the average focaladhesion site was 0.78 μm2 [5] (Fig. 4, Table I).
In the mentioned work, the authors fitted a sigmoid functionas a cumulative density function for the distribution of clustersizes. We follow the discussion outlined in Ref. [6], wherethe formation of clusters is described as the product of alarge number of independent identically distributed randomvariables, thus suggesting the use of a log-normal probabilitydistribution to model their size. While the study presented inRef. [5] delivers information on the median size of the clusters(eμ), little is given about the shape parameter (σ ). The studyshowed that for both the cyclic and linear RGD peptide, theclusters were almost surely smaller than 7 μm2. Thus, wedetermine the shape parameter σ by using the expression forthe cumulative density function of a log-normal distribution[37],
FX(x) = 1
2+ 1
2erf
[ln(x) − μ
σ√
2
], (22)
TABLE I. Parameters of the distribution of the parent anddaughter points for the point processes when the affinity betweenintegrins and ligand is altered. The μ parameter is extracted from [5].The σ parameter is computed according to Eq. (23). The meanand variance for the cluster size are the compact expression for alog-normal distribution [37].
and we report the values of σ for the two conditions as (Table I)
σ = ln xmax − μ√2Ymax
, (23)
where xmax = 7 ( [5]) and Ymax = 1 − ε, with ε as the floating-point relative accuracy of the MATLAB package [38].
1. Analysis of the JS divergence
Here, we compute the values of the JS divergence betweenthe distributions driving the point processes when the RGDpeptides are altered. The distribution of the parent pointsis more significantly separated than the distributions of thedaughter processes (Table II, Fig. 4). We seek to determinewhether the separations into distinct signaling units is essentialto achieve a higher discrimination ability if compared togrouping all of the units into a large cluster. The sum oflog-normally distributed random variables cannot be computedanalytically and approximations are needed [39]. For thispurpose, we use the central limit theorem and approximate thesum of the mean number of parents, caff (Table I) log-normalprobability distributions with a Gaussian distribution, whosemean μ and variance σ 2 are reported in Table I. Thus, therandom variables describing the number of points aggregatedinto a unique cluster are
nc ∼ N (caff · μ,caff · σ 2). (24)
The KL divergence between univariate Gaussian distributionsp and q with means μp,μq and variances σp,σq reads [40]
DKL(p||q) = lnσq
σp
+ σ 2p + (μp − μq)2
2σ 2q
− 1
2. (25)
Note that the above-mentioned approximation [Eq. (24)] holdstrue only when caff is large. In considering the reliability ofligand detection limited to small angular sectors [Fig. 3(b)], weneed to take convolutions of the log-normal probability densityfunction. In Table II, we outline the nonsymmetric, numericalresults for the KL divergence, as well as the symmetrizationvia the JS divergence, between the distributions governing theparent processes, the daughter processes [Eq. (5)], the sum ofthe daughter processes [Eq. (25)], and the joint distributionsof parent and daughter processes [Eq. (12)] according to theassumptions made in Sec. II. The columns in Table II are a
TABLE II. KL and JS divergence between the distributions gov-erning the parent and daughter processes [Eq. (5)], the distributionsrepresenting the total number of clustered points [Eq. (25), Sumof daughters], and the joint distribution governing the Neyman-Scottprocess controlling the aggregation of integrins into distinct signalingunits [Eq. (12), Sec. II]. The separation of the clusters gives asignificant increase in the JS divergence when compared to the totalnumber of clustered points.
Parent process 25.69 31.03 28.36Daughter process 1.02 1.48 1.25Sum of daughters 90.33 122.19 106.26Joint 159.31 372.91 266.11
012701-5
FEDERICO FELIZZI AND DAGMAR IBER PHYSICAL REVIEW E 87, 012701 (2013)
3 30 90 180 360−2
0
2
4
6
angle
ln o
f JS
−div
Sum of daughters
Joint
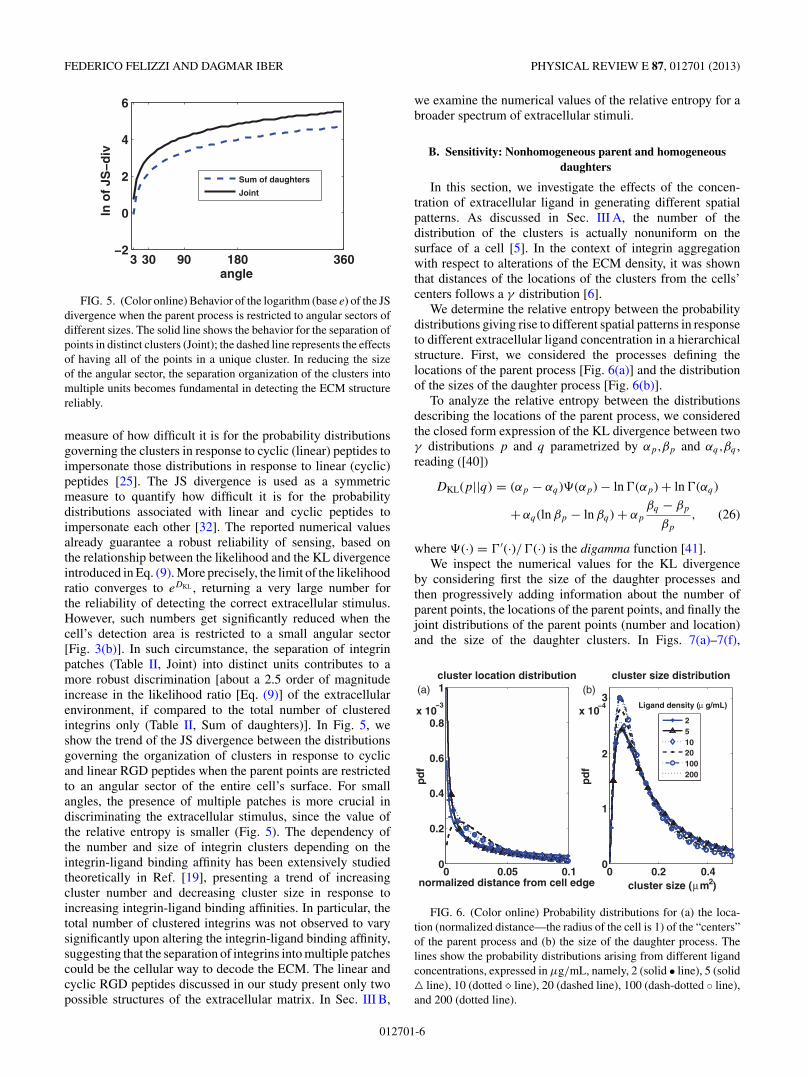
FIG. 5. (Color online) Behavior of the logarithm (base e) of the JSdivergence when the parent process is restricted to angular sectors ofdifferent sizes. The solid line shows the behavior for the separation ofpoints in distinct clusters (Joint); the dashed line represents the effectsof having all of the points in a unique cluster. In reducing the sizeof the angular sector, the separation organization of the clusters intomultiple units becomes fundamental in detecting the ECM structurereliably.
measure of how difficult it is for the probability distributionsgoverning the clusters in response to cyclic (linear) peptides toimpersonate those distributions in response to linear (cyclic)peptides [25]. The JS divergence is used as a symmetricmeasure to quantify how difficult it is for the probabilitydistributions associated with linear and cyclic peptides toimpersonate each other [32]. The reported numerical valuesalready guarantee a robust reliability of sensing, based onthe relationship between the likelihood and the KL divergenceintroduced in Eq. (9). More precisely, the limit of the likelihoodratio converges to eDKL , returning a very large number forthe reliability of detecting the correct extracellular stimulus.However, such numbers get significantly reduced when thecell’s detection area is restricted to a small angular sector[Fig. 3(b)]. In such circumstance, the separation of integrinpatches (Table II, Joint) into distinct units contributes to amore robust discrimination [about a 2.5 order of magnitudeincrease in the likelihood ratio [Eq. (9)] of the extracellularenvironment, if compared to the total number of clusteredintegrins only (Table II, Sum of daughters)]. In Fig. 5, weshow the trend of the JS divergence between the distributionsgoverning the organization of clusters in response to cyclicand linear RGD peptides when the parent points are restrictedto an angular sector of the entire cell’s surface. For smallangles, the presence of multiple patches is more crucial indiscriminating the extracellular stimulus, since the value ofthe relative entropy is smaller (Fig. 5). The dependency ofthe number and size of integrin clusters depending on theintegrin-ligand binding affinity has been extensively studiedtheoretically in Ref. [19], presenting a trend of increasingcluster number and decreasing cluster size in response toincreasing integrin-ligand binding affinities. In particular, thetotal number of clustered integrins was not observed to varysignificantly upon altering the integrin-ligand binding affinity,suggesting that the separation of integrins into multiple patchescould be the cellular way to decode the ECM. The linear andcyclic RGD peptides discussed in our study present only twopossible structures of the extracellular matrix. In Sec. III B,
we examine the numerical values of the relative entropy for abroader spectrum of extracellular stimuli.
B. Sensitivity: Nonhomogeneous parent and homogeneousdaughters
In this section, we investigate the effects of the concen-tration of extracellular ligand in generating different spatialpatterns. As discussed in Sec. III A, the number of thedistribution of the clusters is actually nonuniform on thesurface of a cell [5]. In the context of integrin aggregationwith respect to alterations of the ECM density, it was shownthat distances of the locations of the clusters from the cells’centers follows a γ distribution [6].
We determine the relative entropy between the probabilitydistributions giving rise to different spatial patterns in responseto different extracellular ligand concentration in a hierarchicalstructure. First, we considered the processes defining thelocations of the parent process [Fig. 6(a)] and the distributionof the sizes of the daughter process [Fig. 6(b)].
To analyze the relative entropy between the distributionsdescribing the locations of the parent process, we consideredthe closed form expression of the KL divergence between twoγ distributions p and q parametrized by αp,βp and αq,βq ,reading ([40])
DKL(p||q) = (αp − αq)�(αp) − ln �(αp) + ln �(αq)
+αq(ln βp − ln βq) + αp
βq − βp
βp
, (26)
where �(·) = �′(·)/�(·) is the digamma function [41].We inspect the numerical values for the KL divergence
by considering first the size of the daughter processes andthen progressively adding information about the number ofparent points, the locations of the parent points, and finally thejoint distributions of the parent points (number and location)and the size of the daughter clusters. In Figs. 7(a)–7(f),
0 0.2 0.40
1
2
3x 10
−4
cluster size (µ m2)
pd
f
cluster size distribution(a) (b)
0 0.05 0.10
0.2
0.4
0.6
0.8
1
x 10−3
normalized distance from cell edge
pd
f
cluster location distribution
251020100200
Ligand density (µ g/mL)
FIG. 6. (Color online) Probability distributions for (a) the loca-tion (normalized distance—the radius of the cell is 1) of the “centers”of the parent process and (b) the size of the daughter process. Thelines show the probability distributions arising from different ligandconcentrations, expressed in μg/mL, namely, 2 (solid • line), 5 (solid line), 10 (dotted � line), 20 (dashed line), 100 (dash-dotted ◦ line),and 200 (dotted line).
012701-6
ENHANCED CELLULAR SENSITIVITY FROM . . . PHYSICAL REVIEW E 87, 012701 (2013)
Fg conc.
Fg
co
nc.
daughter process
2 5 10 20 100200
25
1020
100200
Fg conc.
Fg
co
nc.
parent number
2 5 10 20 100200
25
1020
100200
Fg conc.
Fg
co
nc.
joint parent daughter
2 5 10 20 100200
25
1020
100200
Fg conc.
Fg
co
nc.
parent number/location
2 5 10 20 100200
25
1020
100200
Fg conc.
Fg
co
nc.
parent location
2 5 10 20 100200
25
1020
100200
Fg conc.
Fg
co
nc.
parent location multi
2 5 10 20 100200
25
1020
100200
0
5
0
5
0
5
0
5
0
5
0
5
(a) (b)
(c) (d)
(e) (f)
FIG. 7. Behavior of the logarithm (base e) of the JS divergencefor discrimination between pairs of ligand concentrations (reportedon the x andy axis under the following conditions: (a) only thedaughter processes are considered; (b) only the locations of theparent process are considered; (c) multiple locations of the parentprocess are considered, according to the number of parents presentedin Table III; attention is restricted to the parent process, considered(d) homogeneous and (e) inhomogeneous over the idealized cell’ssurface; (f) both the inhomogeneous Poisson process and thedistribution of the daughter process are considered). The diagonalvalues are to be interpreted as −∞.
we observe a substantial separation between the probabilitydensity functions for ligand concentrations belonging to eitherthe set S1 = {2,5,10} or the set S2 = {20,100,200}, whereasthe probability distributions for fibrinogen (Fg) concentrationvalues within each set are closer. Thus, our attention falls onthe numerical values of the JS divergence for Fg concentrationswithin each set.
Initially, we analyzed the behavior of the JS divergencefor the daughter process and the spatial locations of thecluster centers [Figs. 7(a)–7(b)]. In Fig. 7(a), we presentthe logarithm of the JS divergence for all of the pairs ofprobability distributions describing the size of integrin clusters.The numerical values show that the discrimination amongconcentrations in the two sets S1 and S2 at the level of asingle cluster alone may not be sufficient. Analogously, thedistributions of the clusters locations alone [Fig. 7(a)] fail togenerate high numerical values for the relative entropy forthe distributions in each set [Fig. 7(b)]. In particular, theJS divergence between the distributions arising for a ligandconcentration of 2 and 5 μg/mL are of the order of magnitudeof 10−3, mapping to a likelihood ratio [Eq. (9)] close to 1 andsuggesting that alternative mechanisms need to be consideredin order for the cell to produce different cellular responses.Such limitation for the separation of the spatial processesarising for the mentioned concentrations [Fig. 6(a)] is partiallyovercome when the separation of the spatial distribution of theparent points is enhanced by considering a number (reportedin Table III, Mean no. of cluster column) of independentrealizations of the radial location of the parent points. Thus,
TABLE III. Parameters for the location and size of the clustersupon altering the concentration of fibrinogen (Fg). The parameters forthe log-normal distribution of the size of the cluster (μ,σ ), those ofthe γ distribution defining the locations of the clusters (α,β), and themean number of clusters are taken from the measurements presentedin Ref. [6].
Fg conc. Cluster size Cluster location Mean no.(μg/mL) dist. (μ, σ ) dist. (α, β) of clusters
the overall JS divergence for all of the pairs significantlyincreases, yet the processes arising from the concentrations2 and 5 μg/mL are still not significantly separated [Fig. 7(c)].Next, we computed the extent of the all-pairs separations byconsidering the effects of the spatial intensity of the parentprocess only, neglecting the inhomogeneity of the parentlocations in the real scenario [Fig. 7(d)] [6].
In Sec. II, we presented the assumptions made on thecluster process and showed how they resulted in a compactexpression for the KL divergence [Eqs. (18) and (21)]. Thus,we compute the KL divergence between two inhomogeneousPoisson distributions, where the space-dependent intensityfollows a γ distribution [Eq. (15)]. In Fig. 7(e), we showhow the integration of the spatial inhomogeneity in drivingthe nucleation of integrin clusters can result in the valuesof the relative entropy among the sets S1 and S2 aboveincreasing by twofold with respect to realizations of the spatialdistribution of the parent process only [Fig. 7(c)]. In addition,the introduction of the spatial inhomogeneity contributes toa further separation of two spatial processes if compared toconsidering the number of clusters only [Fig. 7(d)]. Finally,we present how the amount of information contained in thedaughter process further contributes to an increase in therelative entropy, according to Eq. (21). In Fig. 7(f), we showhow the discrimination ability for all of the pairs of ligandconcentration is significantly higher than any other resultingfrom the partial assumptions outlined in Figs. 7(a)–7(e).
In summary, our analysis reveals that partitioning integrinsinto multiple clusters enhances the cell’s sensitivity to stimuli.In the results outlined, the numerical values are not to beinterpreted in absolute terms. The likelihood ratio [Eq. (8)]and its limit [Eq. (9)] are used to compare two hypotheses onthe ECM input, say θp and θq . Choosing whether the input wasθp or θq depends on the thresholds for the values of the ratio[Eq. (8)]. Such thresholds are arbitrary [42]. Moreover, theabsolute values are computed over the entire cell surface andought to be rescaled proportionally to the number of parentsin an angular sector [Sec. II E, Figs. 3(a) and 3(b)] whenthe cellular decision consists of selecting a moving directionaccording to the ECM environment [36].
Importantly, we showed that a spatial organization ofintegrins that combines several macroscopic patterns [number
012701-7
FEDERICO FELIZZI AND DAGMAR IBER PHYSICAL REVIEW E 87, 012701 (2013)
of clusters, size of the clusters, locations of the clusters;Fig. 7(f)] results in an increase in the reliability of sensingcompared to considering each quantity alone [Figs. 7(a), 7(b),and 7(d)], or partial combinations [Figs. 7(c) and 7(e)]. Thus,our work suggests that the organization of integrins intodistinct patterns is seen as a cellular mechanism to enhancesensitivity to the extracellular environment [17,18].
IV. CONCLUSION AND OUTLOOK
Cell surface receptors mediate the communication betweena cell and the extracellular matrix [43]. Among those, integrinsare observed to form large aggregates in response to extracel-lular stimuli [5,6]. In this work, we analyzed the implicationsof the formation of large integrin aggregates in helping thecell discriminating different extracellular environments, bothin the context of sensitivity (variations in the concentration ofextracellular ligands) and specificity (strength of binding toextracellular ligands). Our attention was not limited to the sizeof integrin aggregates, but we rather focused on the interplaybetween the size, the number, and the location of the clusters asdiscriminative features to help the cell sense the extracellularenvironment. The two-stage process defining the formation ofintegrin clusters [7] suggested the formulation of a cluster pointprocess model to cast the organization of integrins into distinctpatches in a rigorous mathematical framework. Cluster pointprocess models have been used extensively to model variousgeographical and cosmological phenomena [28,29]. Here, thecluster point process formalism is applied to the organizationof cell membrane receptors.
We made the assumptions of independence between thedistributions governing the size of the daughter processes(Sec. II), as well as between the cluster size and the locationof the clusters within a cell [Eq. (20)], which allowed usto exploit the factorization of the KL divergence for thejoint distributions involving the parent intensity and daughterlocations [Eq. (14)] and the parent intensity and location andthe daughter size [Eq. (21)]. We stress that our interest is not
in the locational entropy, associated with the realization ofa specific point process [44], since two processes governedby the same intensity may produce distinct spatial patterns.Instead, we focused on the probability distributions of thenumber of points that fall within a certain region [Eq. (15)]and those governing the dimension of the clusters [Eq. (4)]. Inthe context of specificity, we neglected the spatial location ofclusters and focused on the increase of the relative entropyby splitting the aggregated integrins in multiple patcheswhen compared to the relative entropy of the distributionsgoverning the total number of aggregated integrins. Followingthe implications of Ref. [5], we analyzed the importance of thismechanism for cells to perceive environmental changes. Theeffects of the different distributions of integrin clusters for themechanobiological activities involved in cell migration [45],such as forces transmitted from the actin cytoskeleton tothe ECM and mediated by integrins, are not discussed inthe current study, nor is the role of lipid rafts in receptororganization [46].
Another result of our model concerns the counterintuitiveobservation discussed in Ref. [6], where the total numberof ligated integrins was observed to decrease in responseto increasing extracellular ligand concentration. We have notmodeled directly the receptor-ligand binding and unbindingevents, nor have we introduced early signaling molecules[21,45,47] that may further contribute to the amplification ofthe signal at the integrins’ tails [10], as outlined in kineticproofreading models [48] and shown elsewhere in the contextof specificity [49].
In conclusion, we have presented a rigorous formulationof a well-studied phenomenon—the organization of integrinsin clusters—and proposed a way to quantify the informationcontained in distinct spatial patterns.
ACKNOWLEDGMENT
This research was supported by a SystemsX grant to theRTD InfectX.
[1] I. D. Campbell and M. H. Ginsberg, Trends Biochem. Sci. 29,429 (2004).
[2] R. O. Hynes, Cell 110, 673 (2002).[3] S. B. Carter, Nature (London) 213, 256 (1967).[4] P. A. DiMilla, J. A. Stone, J. A. Quinn, S. M. Albelda, and
D. A. Lauffenburger, J. Cell Biol. 122, 729 (1993).[5] M. Kato and M. Mrksich, Biochemistry 43, 2699 (2004).[6] E. S. Welf, U. P. Naik, and B. A. Ogunnaike, BMC Biophys. 4,
15 (2011).[7] O. Ali, H. Guillou, O. Destaing, C. Albiges-Rizo, M. R. Block,
and B. Fourcade, Biophys. J. 100, 2595 (2011).[8] R. Li, N. Mitra, H. Gratkowski, G. Vilaire, R. Litvinov,
C. Nagasami, J. W. Weisel, J. D. Lear, W. F. DeGrado, andJ. S. Bennett, Science 300, 795 (2003).
[9] B.-H. Luo, C. V. Carman, J. Takagi, and T. A. Springer, Proc.Natl. Acad. Sci. USA 102, 3679 (2005).
[10] D. Iber and I. Campbell, Bull. Math. Biol. 68, 945 (2006).
[11] E. S. Welf, U. P. Naik, and B. A. Ogunnaike, Biophys. J. 103,1379 (2012).
[12] F. Felizzi and D. Iber (unpublished).[13] J. T. Smith, J. T. Elkin, and W. M. Reichert, Expt. Cell. Res. 312,
2424 (2006).[14] A. S. Sarvestani and E. Jabbari, Biotechnol. Bioeng. 103, 429
(2009).[15] K. F. Swaney, C.-H. Huang, and P. N Devreotes, Ann. Rev.
Biophys. 39, 265 (2010).[16] D. Bray, M. D. Levin, and C. J. Morton-Firth, Nature (London)
393, 85 (1998).[17] B. Hu, W. Chen, W. J. Rappel, and H. Levine, Phys. Rev. Lett.
105, 048104 (2010).[18] B. Hu, W. Chen, W. J. Rappel, and H. Levine, Phys. Rev. E 83,
021917 (2011).[19] T. Zhao, Y. Li, and A. R. Dinner, Langmuir 25, 1540
ENHANCED CELLULAR SENSITIVITY FROM . . . PHYSICAL REVIEW E 87, 012701 (2013)
[20] B. Alberts, A. Johnson, J. Lewis, M. Raff, K. Roberts, andP. Walter, Molecular Biology of the Cell, 5th ed. (GarlandScience/Taylor & Francis, New York, 2007).
[21] D. S. Harburger and D. A. Calderwood, J. Cell Sci. 122, 159(2009).
[22] G. Aquino, D. Clausznitzer, S. Tollis, and R. G. Endres, Phys.Rev. E 83, 021914 (2011).
[23] S. Kullback and R. A. Leibler, Ann. Math. Stat. 22, 79 (1951).[24] T. M. Cover and J. A. Thomas, Elements of Information Theory
(Wiley-Interscience, New York, 1991).[25] H. Chernoff, Ann. Math. Stat. 27, 1 (1956).[26] S. Verdu, IEEE International Symposium on Information
Theory, 2007, ISIT 2007 (IEEE, New York, 2007).[27] D. J. Daley and D. Vere-Jones, An Introduction to the Theory of
Point Processes (Springer-Verlag, New York, 2003).[28] E. Villa and P. R. Rios, Acta Mater. 57, 3714 (2009).[29] J. Neyman and E. L. Scott, J. R. Stat. Soc. B 20, 1 (1958).[30] P. Wiseman, C. M. Brown, D. J. Webb, B. Hebert, N. L. Johnson,
J. A. Squier, M. H. Ellisman, and A. F. Horwitz, J. Cell Sci. 117,5521 (2004).
[31] N. S. Gov, Biophys. J. 91, 2844 (2006).[32] J. Lin, IEEE Trans. Inf. Theory 37, 145 (1991).[33] D. W. Robinson, Entropy 10, 493 (2008).[34] B. Hu, W. Chen, H. Levine, and W. J. Rappel, J. Stat. Phys. 142,
1167 (2011).
[35] B. W. Andrews and P. A. Iglesias, PLoS Comp. Biol. 3, e153(2007).
[36] D. Wu and F. Lin, PLoS One 6, e18805 (2011).[37] G. R. Grimmett and D. R. Stirzaker, Probability and Random
Processes (Oxford University Press, New York, 2001).[38] MATLAB, version 7.14.0 (R2012a) (The MathWorks Inc., Natick,
Massachusetts, 2012).[39] L. Fenton, IRE Trans. Comm. Sys. 8, 57 (1960).[40] W. D. Penny, University College London, Tech. Report No.,
2001 (unpublished).[41] M. Abramowitz and I. A. Stegun, Handbook of Mathematical
Functions with Formulas, Graphs, and Mathematical Tables(Dover, New York, 1965).
[42] E. L. Lehmann, Testing Statistical Hypotheses (Wiley, NewYork, 1986), pp. 18–22.
[43] P. Cuatrecasas, Annu. Rev. Biochem. 43, 169 (1974).[44] J. McFadden, J. Soc. Indust. Appl. Math. 13, 988 (1965).[45] C. Yu, W. Luo, and M. P. Sheetz, Cell Adhes. Migration 6, 280
(2012).[46] B. Leitinger and N. Hogg, J. Cell Sci. 115, 963 (2002).[47] F. Geier, G. Fengos, and D. A. Iber, PLoS One 6, e24808
(2011).[48] T. Mckeithan, Proc. Natl. Acad. Sci. USA 92, 5042
(1995).[49] F. Felizzi and F. Comoglio, Phys. Rev. E 85, 061926 (2012).