Eugene A. Krejsa and James R. Stone Diversitech, Inc., Cincinnati, Ohio Enhanced Fan Noise Modeling for Turbofan Engines NASA/CR—2014-218421 December 2014 https://ntrs.nasa.gov/search.jsp?R=20150000884 2018-08-29T13:53:25+00:00Z
Transcript
Eugene A. Krejsa and James R. StoneDiversitech, Inc., Cincinnati, Ohio
Since its founding, NASA has been dedicated to the advancement of aeronautics and space science. The NASA Scienti c and Technical Information (STI) program plays a key part in helping NASA maintain this important role.
The NASA STI Program operates under the auspices of the Agency Chief Information Of cer. It collects, organizes, provides for archiving, and disseminates NASA’s STI. The NASA STI program provides access to the NASA Aeronautics and Space Database and its public interface, the NASA Technical Reports Server, thus providing one of the largest collections of aeronautical and space science STI in the world. Results are published in both non-NASA channels and by NASA in the NASA STI Report Series, which includes the following report types: • TECHNICAL PUBLICATION. Reports of
completed research or a major signi cant phase of research that present the results of NASA programs and include extensive data or theoretical analysis. Includes compilations of signi cant scienti c and technical data and information deemed to be of continuing reference value. NASA counterpart of peer-reviewed formal professional papers but has less stringent limitations on manuscript length and extent of graphic presentations.
• TECHNICAL MEMORANDUM. Scienti c
and technical ndings that are preliminary or of specialized interest, e.g., quick release reports, working papers, and bibliographies that contain minimal annotation. Does not contain extensive analysis.
• CONTRACTOR REPORT. Scienti c and
technical ndings by NASA-sponsored contractors and grantees.
• CONFERENCE PUBLICATION. Collected papers from scienti c and technical conferences, symposia, seminars, or other meetings sponsored or cosponsored by NASA.
• SPECIAL PUBLICATION. Scienti c,
technical, or historical information from NASA programs, projects, and missions, often concerned with subjects having substantial public interest.
• TECHNICAL TRANSLATION. English-
language translations of foreign scienti c and technical material pertinent to NASA’s mission.
Specialized services also include organizing and publishing research results, distributing specialized research announcements and feeds, providing information desk and personal search support, and enabling data exchange services.
For more information about the NASA STI program, see the following:
• Access the NASA STI program home page at http://www.sti.nasa.gov
• E-mail your question to [email protected] • Phone the NASA STI Information Desk at 757-864-9658 • Write to:
NASA STI Information DeskMail Stop 148NASA Langley Research CenterHampton, VA 23681-2199
Eugene A. Krejsa and James R. StoneDiversitech, Inc., Cincinnati, Ohio
Enhanced Fan Noise Modeling for Turbofan Engines
NASA/CR—2014-218421
December 2014
National Aeronautics andSpace Administration
Glenn Research CenterCleveland, Ohio 44135
Prepared under Contract NNC05VD49P
Available from
NASA STI Information DeskMail Stop 148NASA Langley Research CenterHampton, VA 23681-2199
National Technical Information Service5301 Shawnee Road
Alexandria, VA 22312
Available electronically at http://www.sti.nasa.gov
Trade names and trademarks are used in this report for identi cation only. Their usage does not constitute an of cial endorsement, either expressed or implied, by the National Aeronautics and
Space Administration.
Level of Review: This material has been technically reviewed by NASA technical management OR expert reviewer(s).
This report is a formal draft or working paper, intended to solicit comments and
ideas from a technical peer group.
This report contains preliminary ndings, subject to revision as analysis proceeds.
NASA/CR—2014-218421 1
Enhanced Fan Noise Modeling for Turbofan Engines
Eugene A. Krejsa and James R. Stone Diversitech, Inc.
Cincinnati, Ohio 45246
Abstract This report describes work by consultants to Diversitech Inc. for the NASA Glenn Research Center
(GRC) to revise the fan noise prediction procedure based on fan noise data obtained in the 9- by 15 Foot Low-Speed Wind Tunnel at GRC.
The purpose of this task is to begin development of an enhanced, analytical, more physics-based, fan noise prediction method applicable to commercial turbofan propulsion systems. The method is to be suitable for programming into a computational model for eventual incorporation into NASA’s current aircraft system noise prediction computer codes. The scope of this task is in alignment with the mission of the Propulsion 21 research effort conducted by the coalition of NASA, state government, industry, and academia to develop aeropropulsion technologies.
A model for fan noise prediction was developed based on measured noise levels for the R4 rotor with several outlet guide vane variations and three fan exhaust areas. The model predicts the complete fan noise spectrum, including broadband noise, tones, and for supersonic tip speeds, combination tones. Both spectra and directivity are predicted. Good agreement with data was achieved for all fan geometries. Comparisons with data from a second fan, the ADP fan, also showed good agreement.
Introduction An important aspect of aircraft system noise studies is the prediction of the noise from the aircraft
propulsion system. The major sources of noise associated with the propulsion system are the jet exhaust, the fan, the combustor and the turbine. Depending on the engine cycle, the noise signature is usually dominated by either fan or jet noise. Noise from the combustor and the turbine can also contribute and often limit the overall benefit resulting from reductions in fan and jet noise. Within NASA, the methodologies used to predict aircraft noise rely on the routines developed in the 1970s (and their updates) in the support of the ANOPP noise prediction program (Ref. 1). These routines are also incorporated in the FOOTPR noise prediction program (Ref. 2).
While much work has been done recently to update the jet noise prediction methods, References 3 to 7, only limited updates have been done for the other components. The updates to the jet noise model have emphasized developing the prediction capability for newer jet noise reduction concepts such as mixer/ejectors and conventional nozzles with tabs and/or chevrons. These advances to the jet noise prediction capabilities will allow systems studies to properly assess the impact of these jet noise reduction concepts. Similar to the progress in reducing jet noise, much progress has been made in the reduction of fan noise. Vane sweep and lean have resulted in several decibel (dB) of fan noise reduction, Reference 8.
More modern test facilities, which allow for fan noise measurement under simulated flight conditions, have generated a significant amount of high quality fan noise data. The original fan noise prediction procedure, developed by Heidmann, Reference 9, was based primarily on data from static fan tests. It is now known that such data are often contaminated by noise resulting from the ingestion of vortices or other turbulence from the test stand or other nearby structures. Even data from well designed static test facilities can be influenced by noise resulting from the ingestion of ground vortices, although the use of inlet flow control devices minimizes this effect. Likewise, fan noise levels inferred from engine tests are often tainted by the difficulty in separating the various engine noise sources from each other.
NASA/CR—2014-218421 2
As a result of the use of improved experimental diagnostics techniques and theoretical advances, a much improved understanding of the nature of fan noise generation currently exists. This improved understanding of the physics of fan noise generation can easily be incorporated into empirical models by properly dividing the total fan noise into its appropriate sources and by modeling each of these sources with the proper physical parameters. The purpose of the current effort is to develop an improved fan noise prediction procedure based on recent fan noise data and an improved understanding of fan noise generation.
Fan Noise Generation Fan noise is characterized by both tones and broadband noise. At subsonic fan tip speeds, the tones
occur at harmonics of the blade passage frequency, whereas for supersonic fan tip speeds the tones are at multiples of 1/rev. (Envia, Ref. 10, using time domain averaging, did observe the existence of tones at multiples of 1/rev. in the analysis of vane unsteady pressure signals for a subsonic operating condition.) A description of fan noise generation can be found in Reference 11.
At subsonic tip speeds, fan tones for modern turbofan engines, without inlet guide vanes, can be generated by inlet flow distortions and by blade/exit guide vane interaction. Groeneweg, Reference 12, Huff, Reference 13, and Envia et al., Reference 14, all agree that blade/vane interaction is the principal source of fan tones for fans with subsonic tip speeds. Blade/vane interaction noise is due to the unsteady response of the stator vanes to the periodic wakes from the fan blades, resulting in spinning pressure modes within the duct. Tyler and Sofrin, Reference 15, show that only those modes with a sonic or supersonic circumferential Mach number at the duct outer wall will propagate. These modes are referred to as “cut-on” modes. Modes with a subsonic circumferential Mach are “cut-off” and decay exponentially within the duct.
At supersonic tip speeds, an additional noise source exists. This source is referred to as combination tone noise, or multiple pure tones, or “buzz-saw” noise. It is generally thought that this noise results from shock waves that form on the rotor blade leading edges. Ideally, tones resulting from these shock waves would be at multiples of the blade passage frequency. However, due to blade-to-blade differences, tones are generated at multiples of once per rev. Combination tones propagate only out of the engine inlet.
The nature of fan broadband noise is less understood than that of tone noise, although significant progress is being made in the modeling of fan broadband noise. It is generally agreed that one source of fan broadband noise is the interaction of the turbulence in the fan wakes with the stator vanes. Physics based models of this mechanism require the prediction of the turbulence intensity, spectra, and scales. Another potential source of fan broadband noise is the interaction of inlet turbulence with the fan blades. The modeling of this source also requires detailed prediction of the turbulence characteristics.
Current Prediction Procedures While significant progress is being made in the prediction of fan noise from basic principles, more
effort in this area is still needed. In addition, this approach does not lend itself easily to system studies where it may be required to evaluate many different engine cycles and designs at various operating conditions. For this type of study, simpler empirical models are more appropriate. However the results from the physics based models can be very valuable in developing these empirical approaches.
Several empirical procedures currently exist for the prediction of fan noise. The original ANOPP method was developed by Heidmann, Reference 9, in 1979. This method is based on a methodology developed by the Boeing Company under contract with the NASA Ames Research Center, Reference 16. Since then several updates and modifications have been reported. In Reference 17, Kontos compared the Heidmann methodology against data from GE engines and recommended several modifications to the method to better predict the fan noise from the GE engines. Likewise in Reference 18, Hough and Weir of Allied Signal modified the Heidmann methodology to better predict the fan noise from three smaller Allied Signal engines. An earlier modification to the Heidmann method was also developed by Allied
NASA/CR—2014-218421 3
Signal as part of the General Aviation Synthesis Program (GASP) program. Boeing, Reference 19, has also developed a fan noise correlation based on data from The Boeing Company, GE Aircraft Engines, Pratt and Whitney, and NASA. The methodology is described in Reference 20.
All of the empirical methods consider five sources: inlet fan tones, inlet fan broadband noise, inlet combination tones, aft tones, and aft broadband noise. Relations, either in the form of equations, tables or plots, are provided for the source strength, directivity, and spectra. The effect of flight is also usually included in the methodologies.
Current Task The objective of the current task is to update the empirical fan noise prediction methodology based on
more recent fan noise data obtained in the NASA Glenn 9- by 15-Foot Low-Speed Wind Tunnel. The tunnel test section walls, floor, and ceiling are acoustically treated to produce an anechoic test environment. Acoustic data is obtained on a 93 in. (measured from fan centerline) sideline using a translating microphone probe. Data is obtained at geometric angles ranging from 27.2 to 134.6 degrees relative to the fan rotor plane.
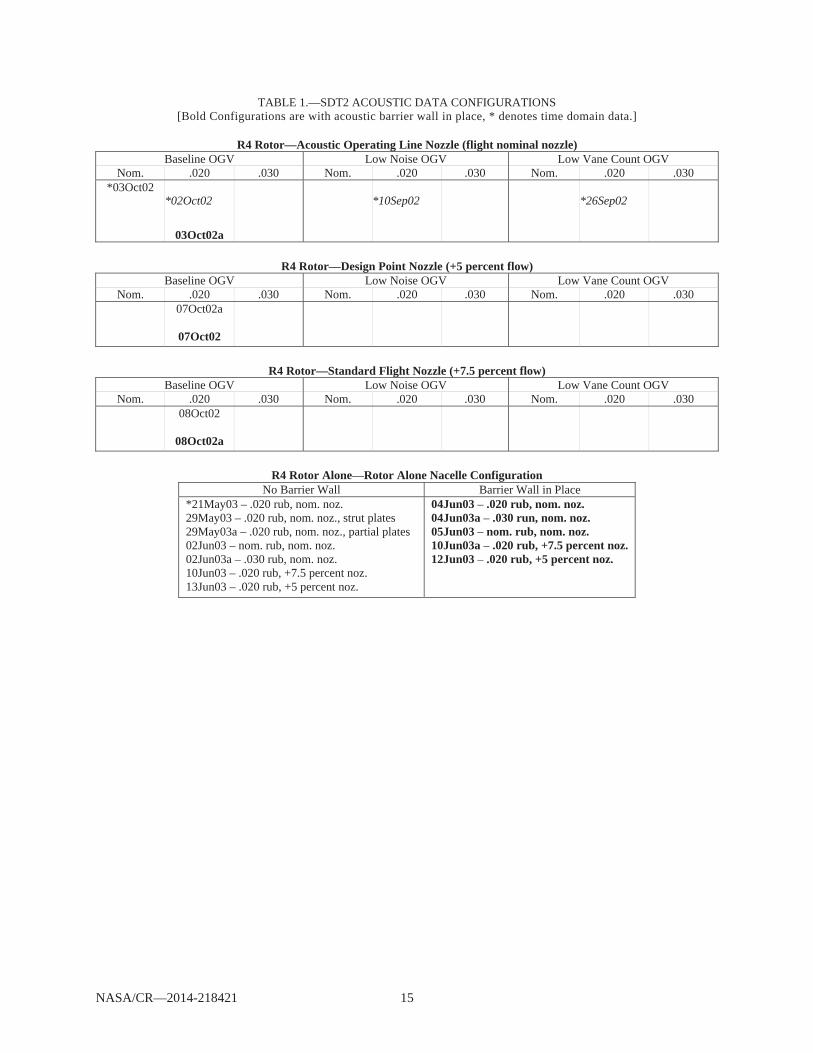
In recent years a series of fan noise tests were conducted to study the effect of stator vane sweep and fan nozzle area variation on fan noise. Data from the tests with the R4 rotor are used for this task. This rotor has 22 blades with a design tip speed of 1,215 ft/sec. and a design pressure ratio of 1.47. Three stator sets were used. The baseline stator was designed for cut-off of the fundamental tone with 54 vanes. Two other stators with 26 vanes were also used. For one of these two sets, the vanes were swept 30 degrees. In addition to the variation in stator design, the R4 rotor and baseline, 54 vane, stator were tested with three fan nozzle areas and two tip clearances. Also as part of these tests, diagnostic measurements were made including laser Doppler velocimetry measurements taken between the rotor and stator and barriers were used to separate inlet and aft fan noise. Tests were also conducted with no stator, i.e., rotor alone tests, to determine the significance of noise sources other than rotor/stator interaction noise. Table 1 lists the test configurations.
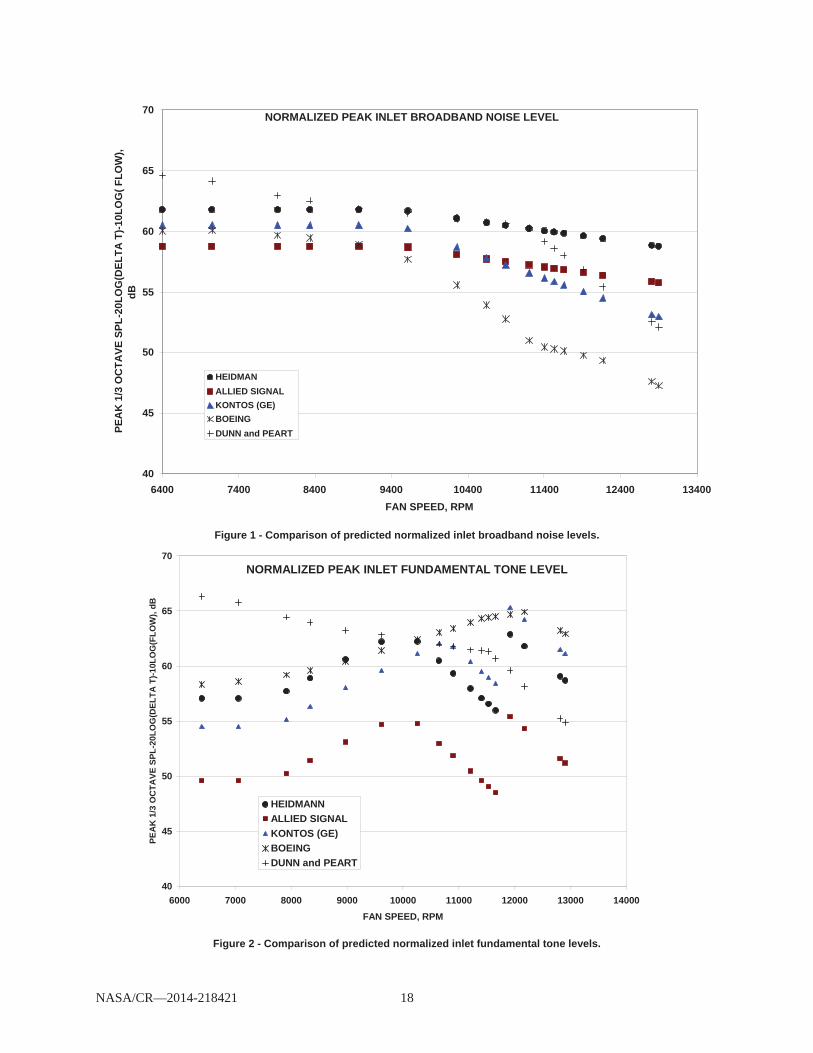
Comparison of Current Prediction Methods In Figures 1 to 4, the normalized predicted peak levels for the R4 fan with the baseline outlet guide
vane set are shown comparing the five prediction methodologies. In Figure 1, levels for inlet broadband noise are plotted. Predicted levels using the method developed by Allied Signal are 3 dB lower than the Heidmann prediction at all fan speeds. Predicted levels using the method developed by Kontos at GE are lower due to the lack of the rotor-stator spacing effect used in the Heidmann method and a steeper slope with tip relative Mach number at relative Mach numbers greater than 0.9. The levels predicted using the Boeing method are slightly lower then those predicted by Kontos at low speeds but are significantly lower than all other methods at high speeds. Levels predicted by the Dunn and Peart method are higher than all other methods at low speeds, agree with Heidmann at intermediate speeds and are lower than Heidmann, with a more rapid decrease, at high speeds.
Predicted inlet tone levels are shown in Figure 2. Here, more variation in predicted levels exists than existed for inlet broadband levels, with the difference exceeding 15 dB at low speeds and about 20 dB at high speeds. The levels predicted by the Allied Signal method are the lowest at all speeds, being 7.5 dB lower at all speeds. The jump in level at about 1200 rpm in the Heidmann, Kontos, and Allied Signal methods results from the lack of the cut-off effect as the tip speed goes supersonic. No such effect is included in either the Dunn and Peart or the Boeing method.
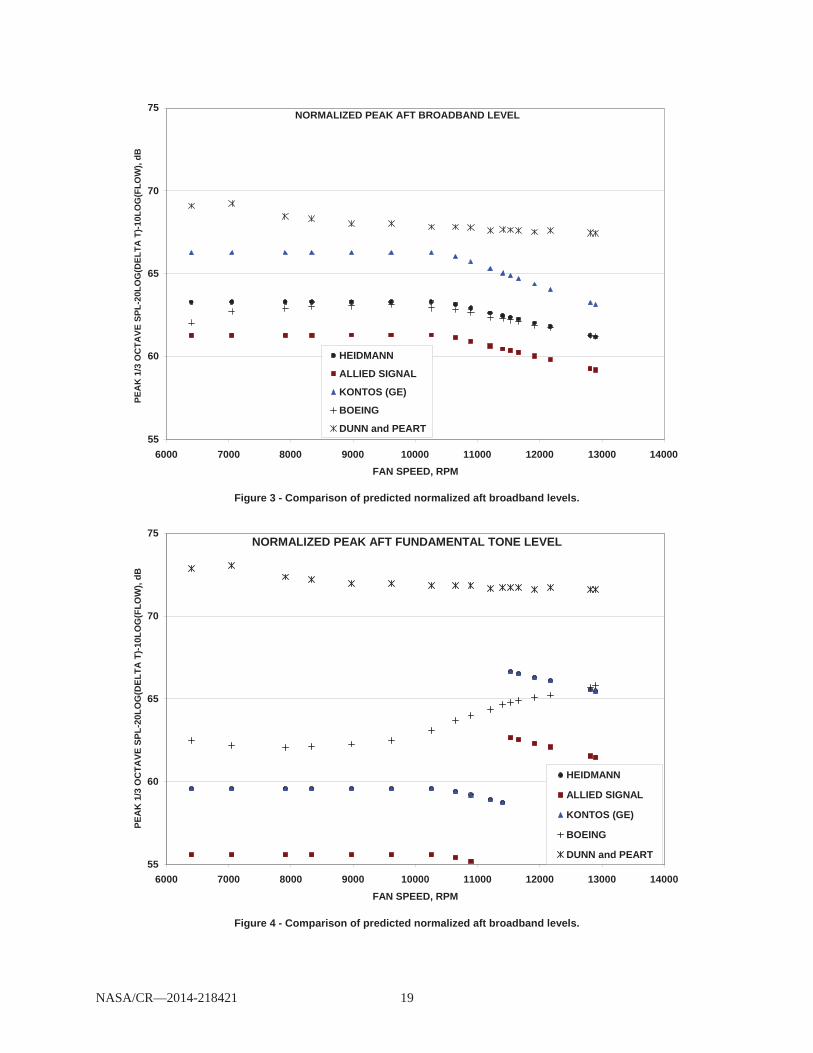
In Figures 3 and 4 predicted aft noise levels are shown. Again, significant difference exist with levels predicted by the Dunn and Peart method being the highest for both broadband and tone noises. The trend with fan speed is similar for aft broadband noise for the five methodologies.
NASA/CR—2014-218421 4
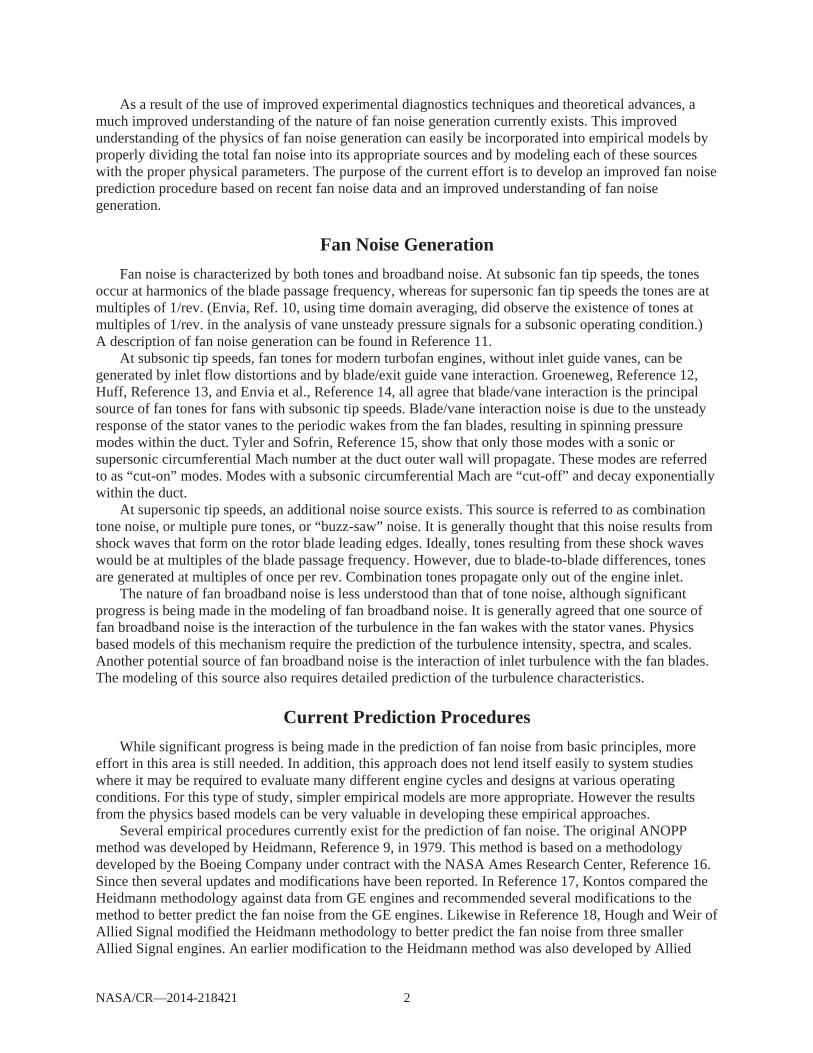
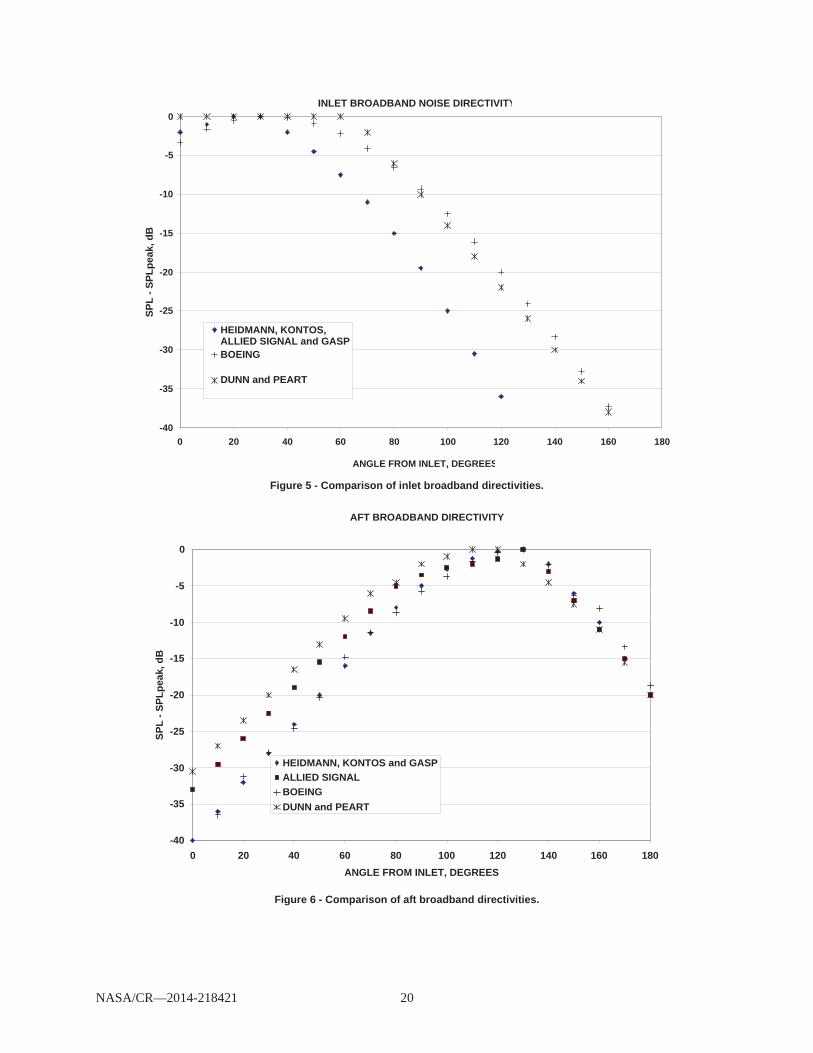
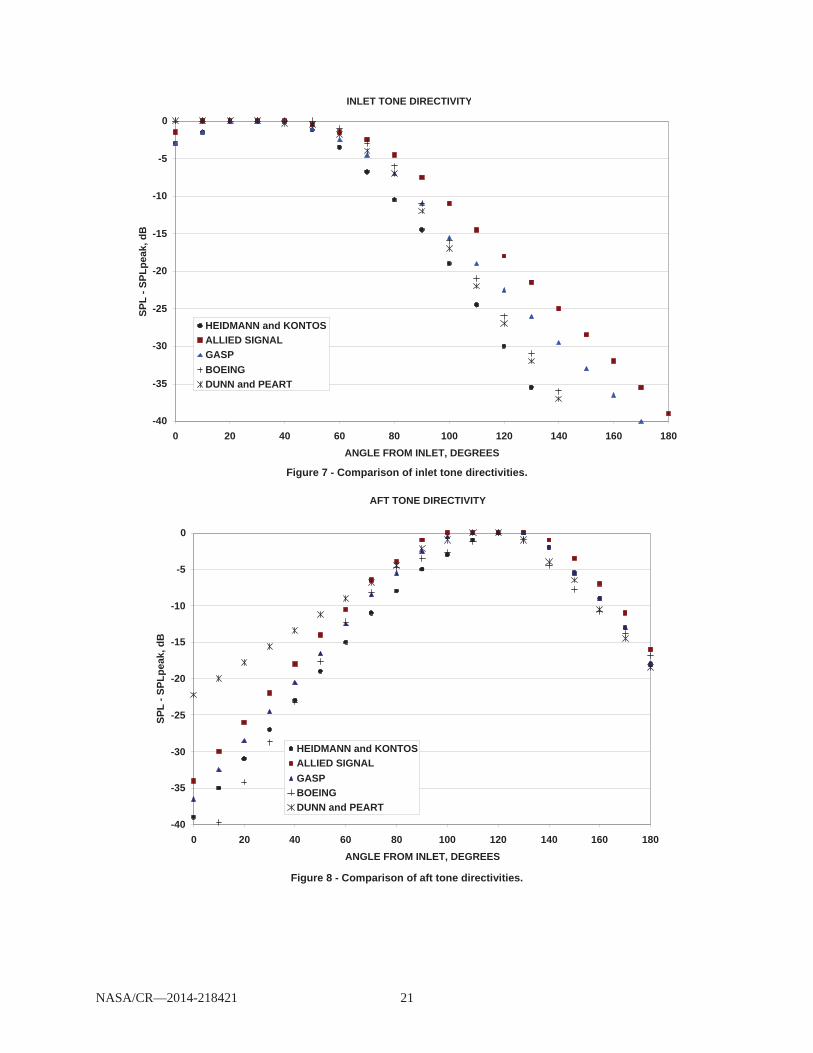
Directivities are compared in Figures 5 and 6 for inlet and aft broadband noise and in Figures 7 and 8 for inlet and aft tone noise. The methods of Heidmann and Kontos agree on the directivity for all four sources. The methodology developed in the GASP program agrees with the Heidmann directivity for both inlet and aft broadband sources, while the Allied Signal methodology agrees with the Heidmann inlet broadband directivity. For all other cases, the methods agree on the location of the peak levels within 10 degrees although differences in excess of 5 dB quickly exist aft of the peak for inlet broadband and tone noise and forward of the aft noise peaks.
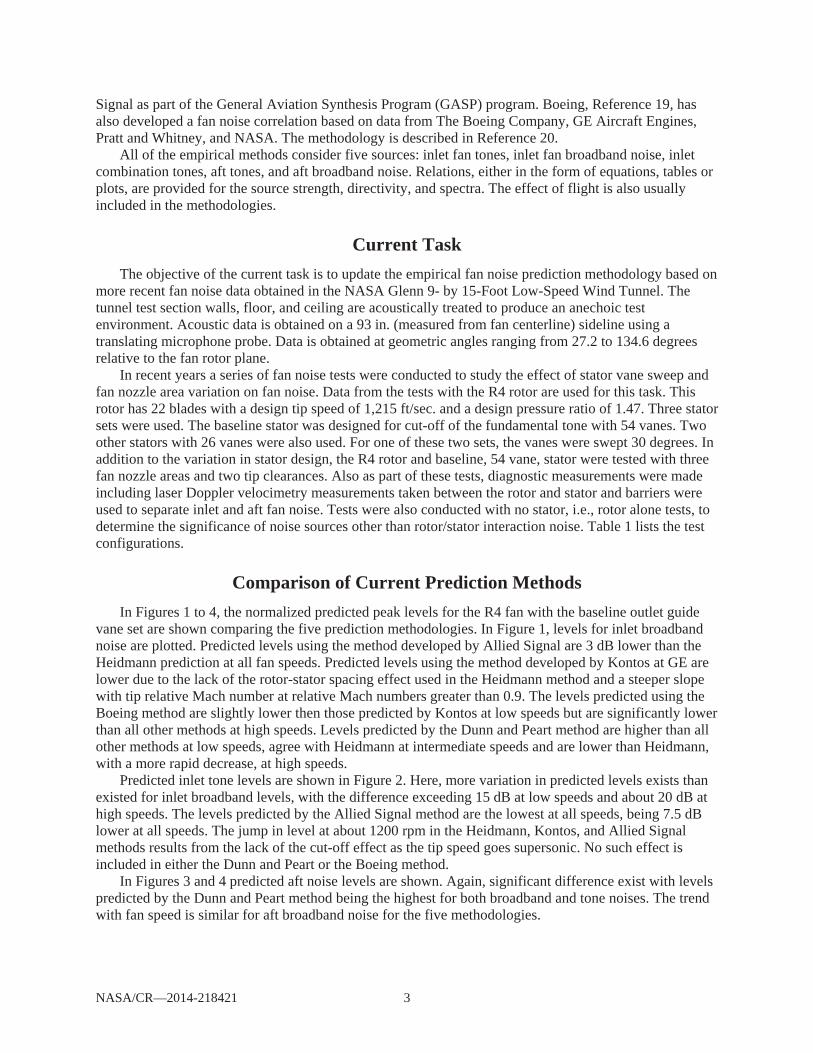
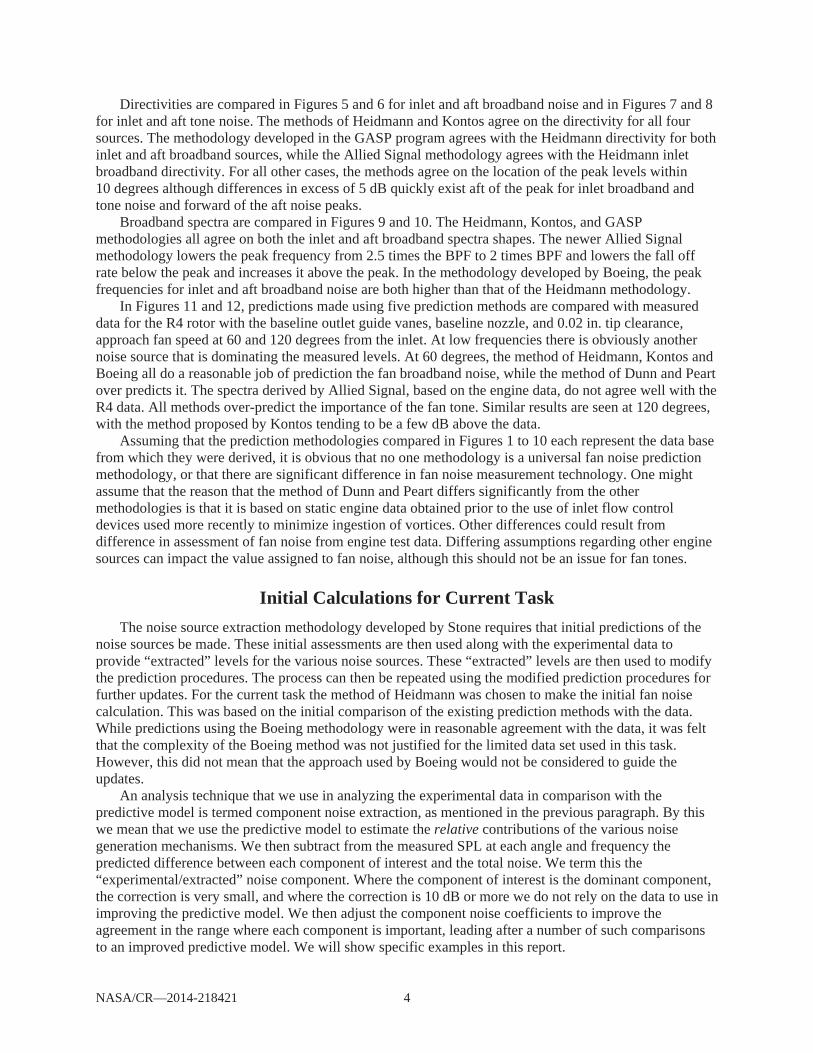
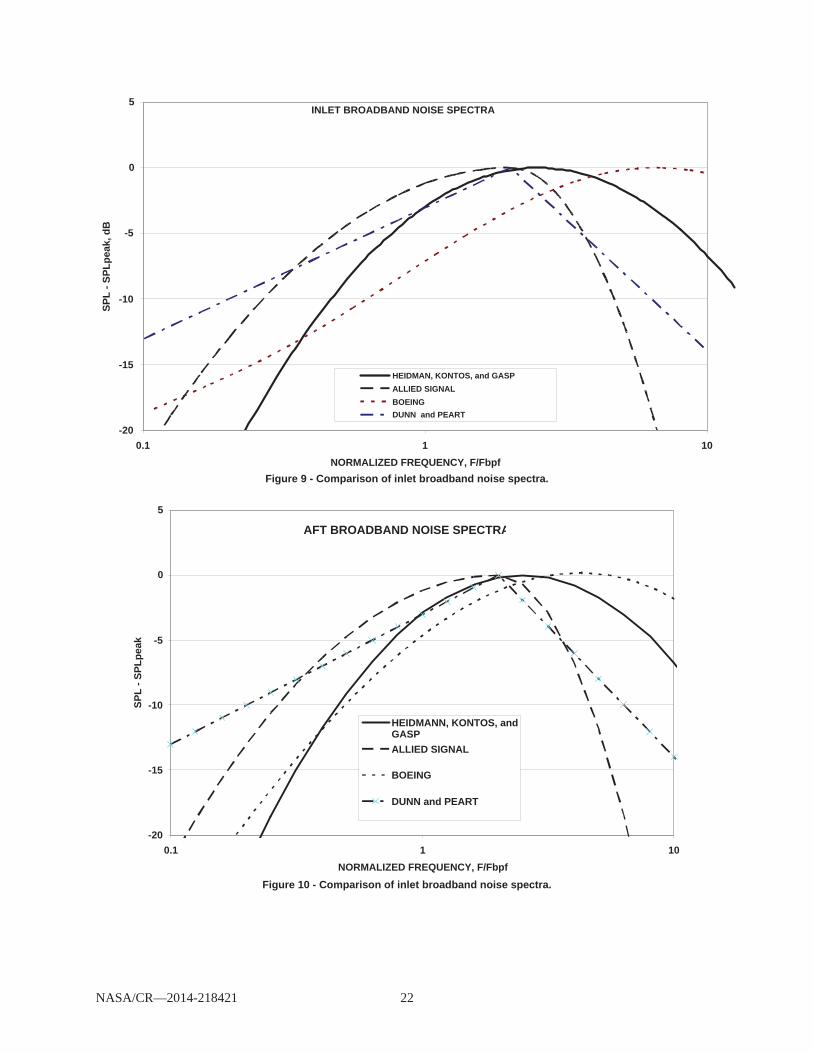
Broadband spectra are compared in Figures 9 and 10. The Heidmann, Kontos, and GASP methodologies all agree on both the inlet and aft broadband spectra shapes. The newer Allied Signal methodology lowers the peak frequency from 2.5 times the BPF to 2 times BPF and lowers the fall off rate below the peak and increases it above the peak. In the methodology developed by Boeing, the peak frequencies for inlet and aft broadband noise are both higher than that of the Heidmann methodology.
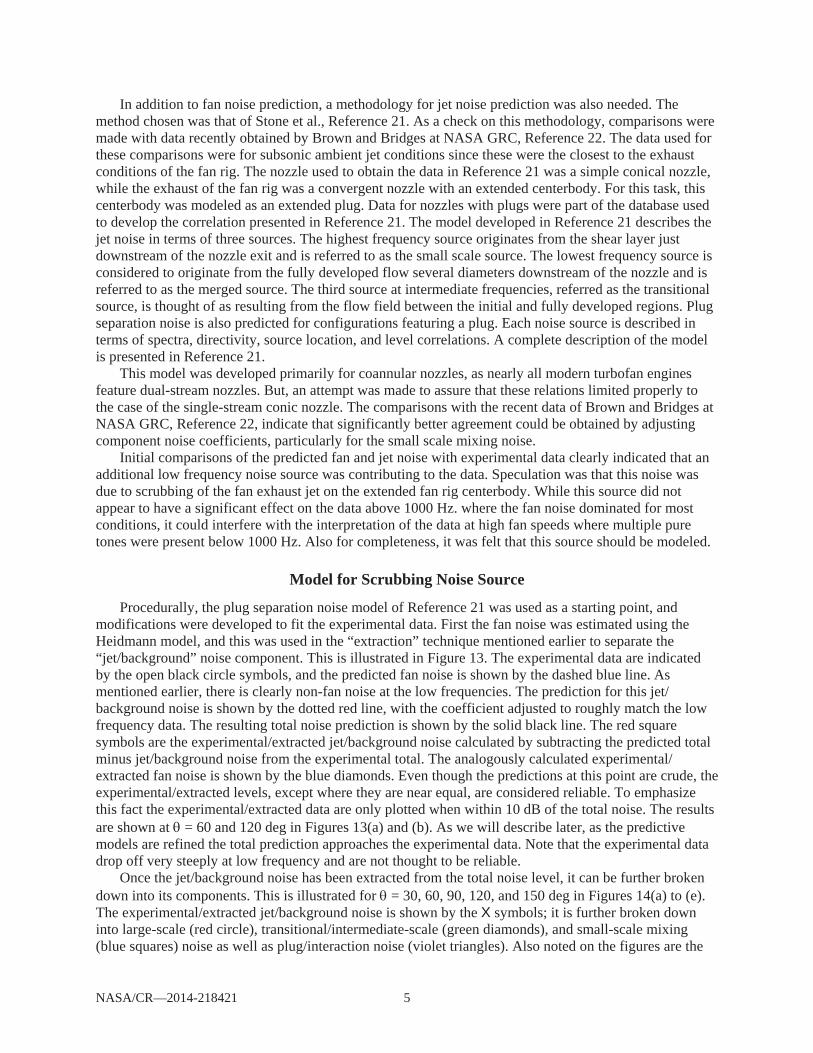
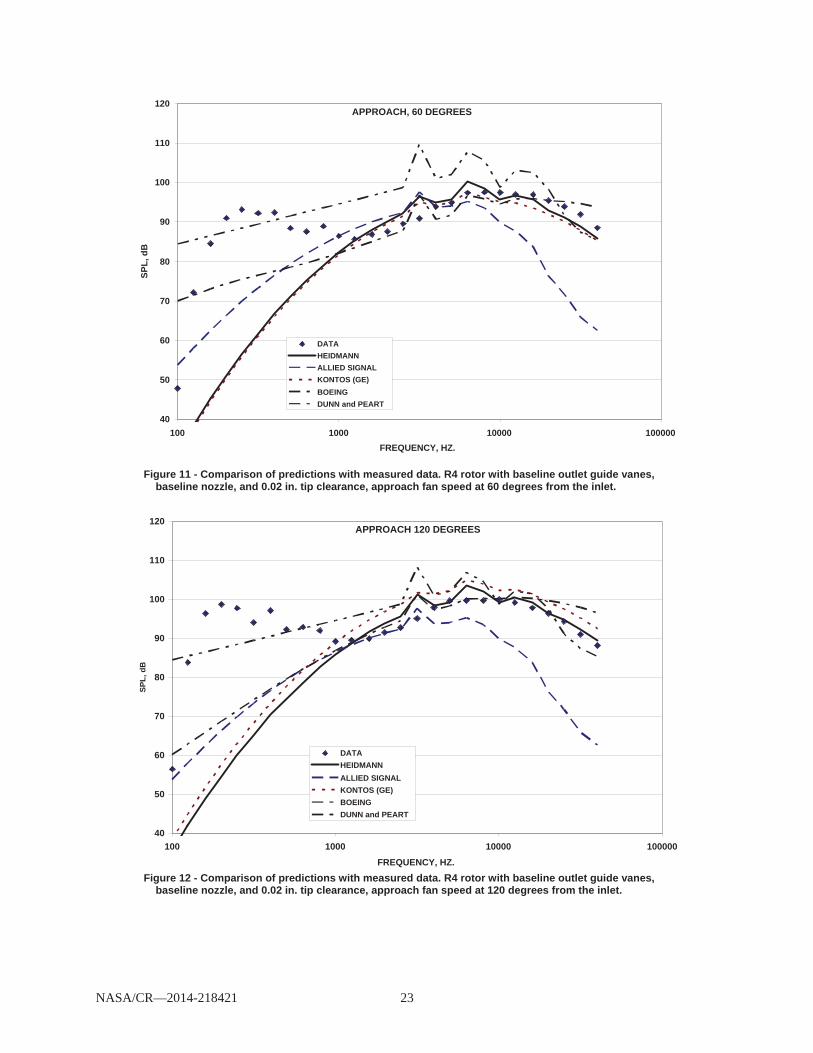
In Figures 11 and 12, predictions made using five prediction methods are compared with measured data for the R4 rotor with the baseline outlet guide vanes, baseline nozzle, and 0.02 in. tip clearance, approach fan speed at 60 and 120 degrees from the inlet. At low frequencies there is obviously another noise source that is dominating the measured levels. At 60 degrees, the method of Heidmann, Kontos and Boeing all do a reasonable job of prediction the fan broadband noise, while the method of Dunn and Peart over predicts it. The spectra derived by Allied Signal, based on the engine data, do not agree well with the R4 data. All methods over-predict the importance of the fan tone. Similar results are seen at 120 degrees, with the method proposed by Kontos tending to be a few dB above the data.
Assuming that the prediction methodologies compared in Figures 1 to 10 each represent the data base from which they were derived, it is obvious that no one methodology is a universal fan noise prediction methodology, or that there are significant difference in fan noise measurement technology. One might assume that the reason that the method of Dunn and Peart differs significantly from the other methodologies is that it is based on static engine data obtained prior to the use of inlet flow control devices used more recently to minimize ingestion of vortices. Other differences could result from difference in assessment of fan noise from engine test data. Differing assumptions regarding other engine sources can impact the value assigned to fan noise, although this should not be an issue for fan tones.
Initial Calculations for Current Task The noise source extraction methodology developed by Stone requires that initial predictions of the
noise sources be made. These initial assessments are then used along with the experimental data to provide “extracted” levels for the various noise sources. These “extracted” levels are then used to modify the prediction procedures. The process can then be repeated using the modified prediction procedures for further updates. For the current task the method of Heidmann was chosen to make the initial fan noise calculation. This was based on the initial comparison of the existing prediction methods with the data. While predictions using the Boeing methodology were in reasonable agreement with the data, it was felt that the complexity of the Boeing method was not justified for the limited data set used in this task. However, this did not mean that the approach used by Boeing would not be considered to guide the updates.
An analysis technique that we use in analyzing the experimental data in comparison with the predictive model is termed component noise extraction, as mentioned in the previous paragraph. By this we mean that we use the predictive model to estimate the relative contributions of the various noise generation mechanisms. We then subtract from the measured SPL at each angle and frequency the predicted difference between each component of interest and the total noise. We term this the “experimental/extracted” noise component. Where the component of interest is the dominant component, the correction is very small, and where the correction is 10 dB or more we do not rely on the data to use in improving the predictive model. We then adjust the component noise coefficients to improve the agreement in the range where each component is important, leading after a number of such comparisons to an improved predictive model. We will show specific examples in this report.
NASA/CR—2014-218421 5
In addition to fan noise prediction, a methodology for jet noise prediction was also needed. The method chosen was that of Stone et al., Reference 21. As a check on this methodology, comparisons were made with data recently obtained by Brown and Bridges at NASA GRC, Reference 22. The data used for these comparisons were for subsonic ambient jet conditions since these were the closest to the exhaust conditions of the fan rig. The nozzle used to obtain the data in Reference 21 was a simple conical nozzle, while the exhaust of the fan rig was a convergent nozzle with an extended centerbody. For this task, this centerbody was modeled as an extended plug. Data for nozzles with plugs were part of the database used to develop the correlation presented in Reference 21. The model developed in Reference 21 describes the jet noise in terms of three sources. The highest frequency source originates from the shear layer just downstream of the nozzle exit and is referred to as the small scale source. The lowest frequency source is considered to originate from the fully developed flow several diameters downstream of the nozzle and is referred to as the merged source. The third source at intermediate frequencies, referred as the transitional source, is thought of as resulting from the flow field between the initial and fully developed regions. Plug separation noise is also predicted for configurations featuring a plug. Each noise source is described in terms of spectra, directivity, source location, and level correlations. A complete description of the model is presented in Reference 21.
This model was developed primarily for coannular nozzles, as nearly all modern turbofan engines feature dual-stream nozzles. But, an attempt was made to assure that these relations limited properly to the case of the single-stream conic nozzle. The comparisons with the recent data of Brown and Bridges at NASA GRC, Reference 22, indicate that significantly better agreement could be obtained by adjusting component noise coefficients, particularly for the small scale mixing noise.
Initial comparisons of the predicted fan and jet noise with experimental data clearly indicated that an additional low frequency noise source was contributing to the data. Speculation was that this noise was due to scrubbing of the fan exhaust jet on the extended fan rig centerbody. While this source did not appear to have a significant effect on the data above 1000 Hz. where the fan noise dominated for most conditions, it could interfere with the interpretation of the data at high fan speeds where multiple pure tones were present below 1000 Hz. Also for completeness, it was felt that this source should be modeled.
Model for Scrubbing Noise Source
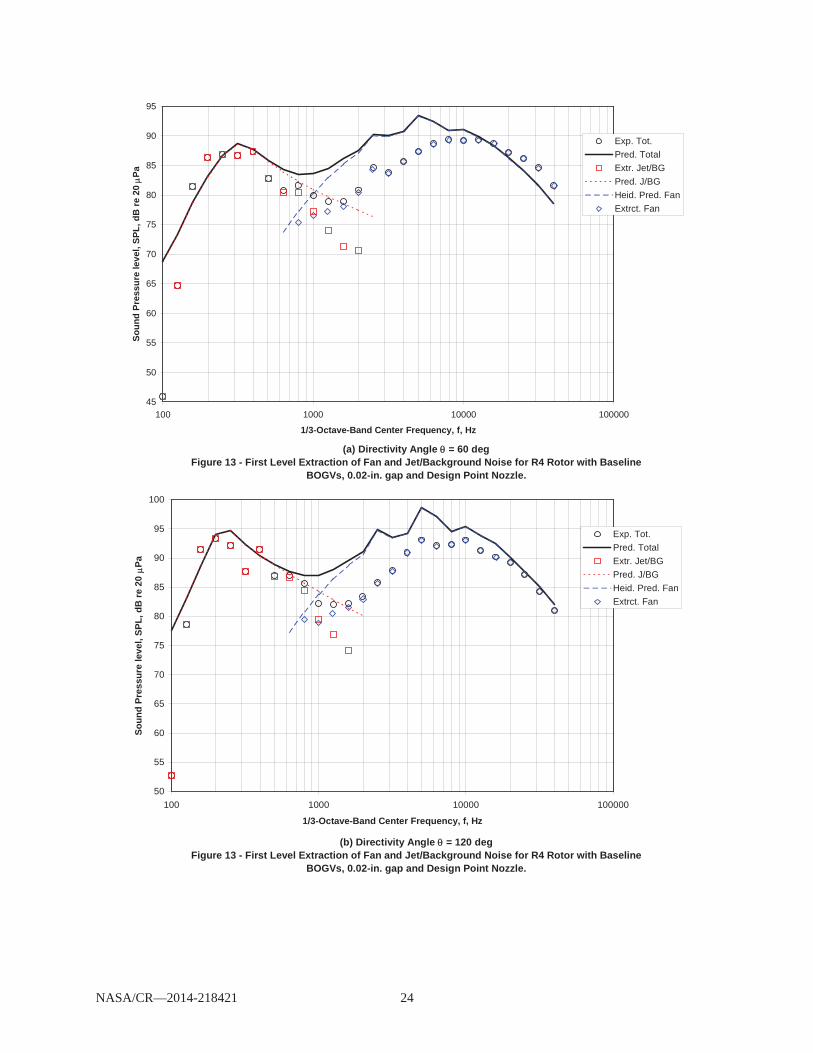
Procedurally, the plug separation noise model of Reference 21 was used as a starting point, and modifications were developed to fit the experimental data. First the fan noise was estimated using the Heidmann model, and this was used in the “extraction” technique mentioned earlier to separate the “jet/background” noise component. This is illustrated in Figure 13. The experimental data are indicated by the open black circle symbols, and the predicted fan noise is shown by the dashed blue line. As mentioned earlier, there is clearly non-fan noise at the low frequencies. The prediction for this jet/ background noise is shown by the dotted red line, with the coefficient adjusted to roughly match the low frequency data. The resulting total noise prediction is shown by the solid black line. The red square symbols are the experimental/extracted jet/background noise calculated by subtracting the predicted total minus jet/background noise from the experimental total. The analogously calculated experimental/ extracted fan noise is shown by the blue diamonds. Even though the predictions at this point are crude, the experimental/extracted levels, except where they are near equal, are considered reliable. To emphasize this fact the experimental/extracted data are only plotted when within 10 dB of the total noise. The results are shown at = 60 and 120 deg in Figures 13(a) and (b). As we will describe later, as the predictive models are refined the total prediction approaches the experimental data. Note that the experimental data drop off very steeply at low frequency and are not thought to be reliable.
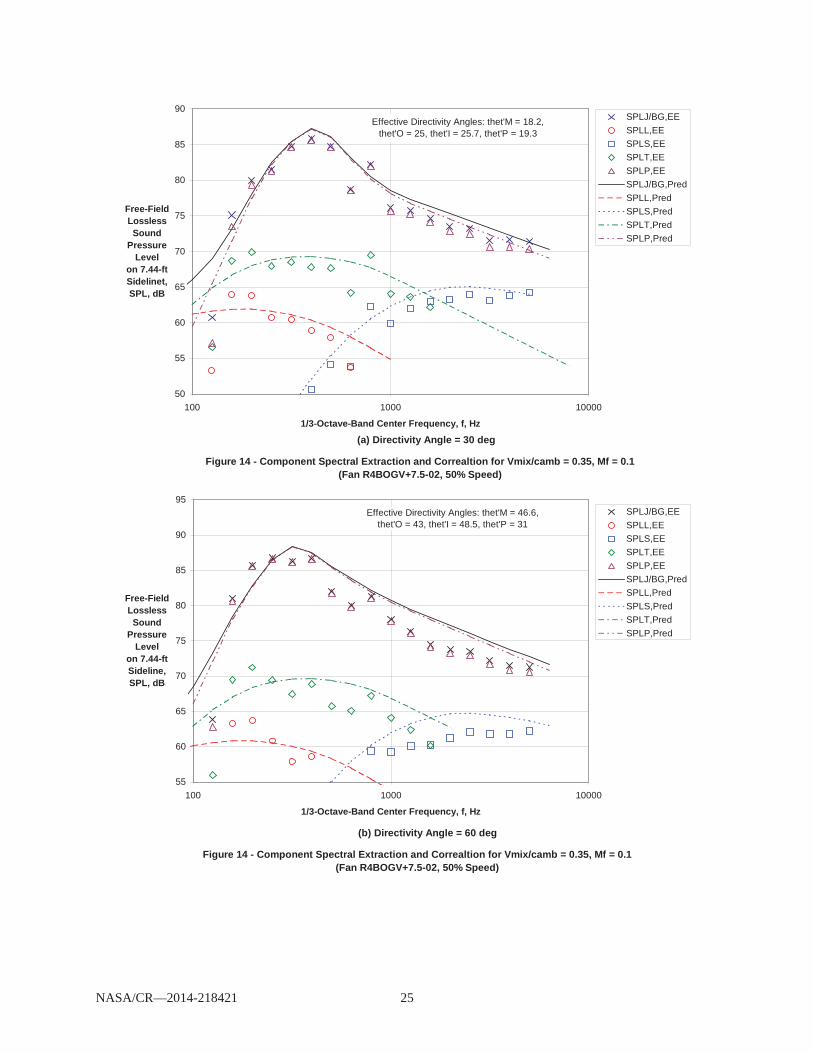
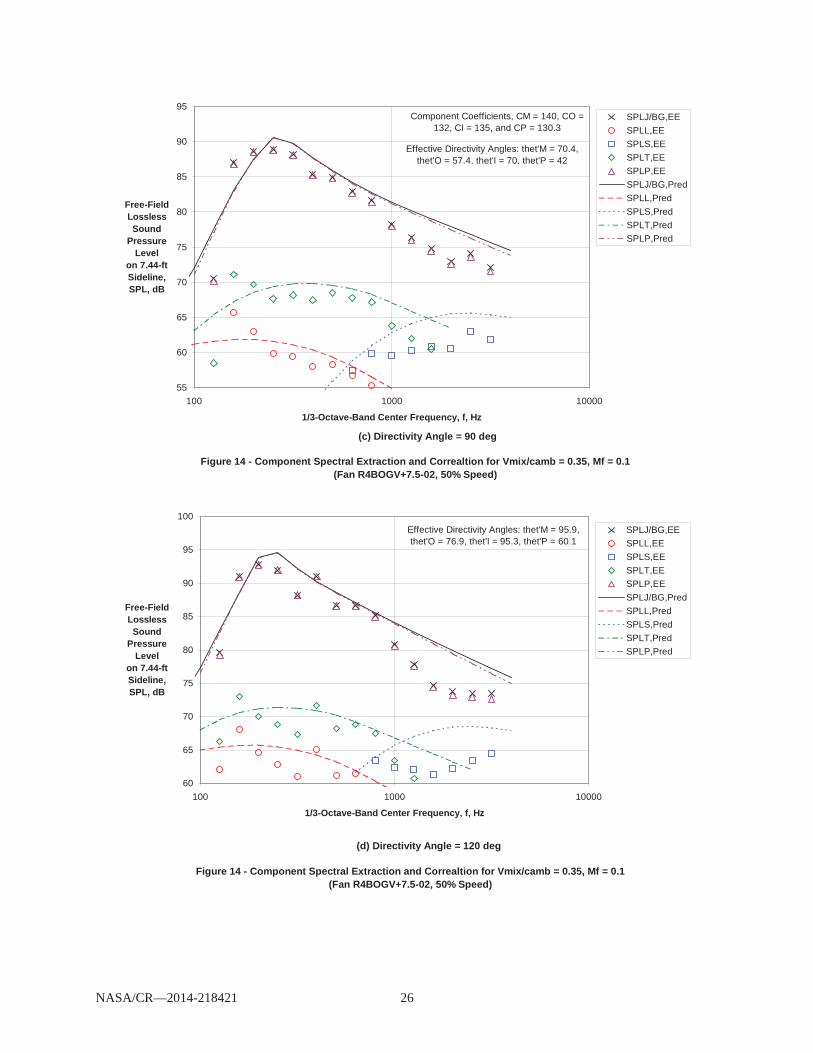
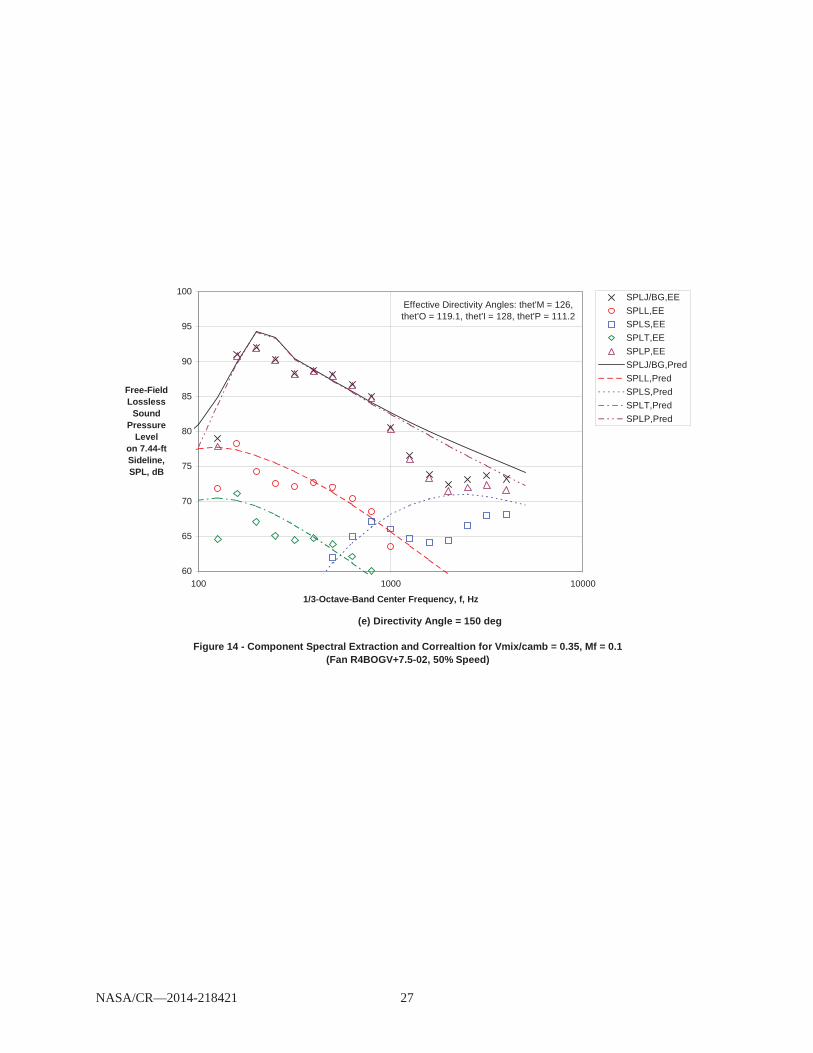
Once the jet/background noise has been extracted from the total noise level, it can be further broken down into its components. This is illustrated for = 30, 60, 90, 120, and 150 deg in Figures 14(a) to (e). The experimental/extracted jet/background noise is shown by the X symbols; it is further broken down into large-scale (red circle), transitional/intermediate-scale (green diamonds), and small-scale mixing (blue squares) noise as well as plug/interaction noise (violet triangles). Also noted on the figures are the
NASA/CR—2014-218421 6
effective directivity angles for each component (Ref. 21), which indicate the very near geometric field of these sources. Here the iteration process has progressed and the “predicted” values are based on the final jet/background and fan noise models, so the differences seen are with respect to the finalized models. Since the plug/interaction noise is so far above the other components, comparisons of the other constituents with their predicted values are meaningless. Note that at = 150 deg (Fig. 14(e)), the small-scale mixing noise is predicted to come close to the plug noise, so it is important to note that the coefficient for small-scale mixing noise has been reduced by 4 dB from Reference 21, based on the comparisons with the data of Reference 22. As the jet velocity increases, this noise component increases with the fifth power of jet velocity; so at higher fan speed, and consequently jet velocity, the large-scale mixing noise can also become important at aft angles, as will be shown later herein.
The spectral directivity relations developed for this plug/interaction noise are purely empirical, with the peak frequency at each angle not changing as a function of jet velocity, as would generally be expected.
Comparison of Initial Predictions With Data Comparison of Low Frequency Noise Source With Fan Rig Data
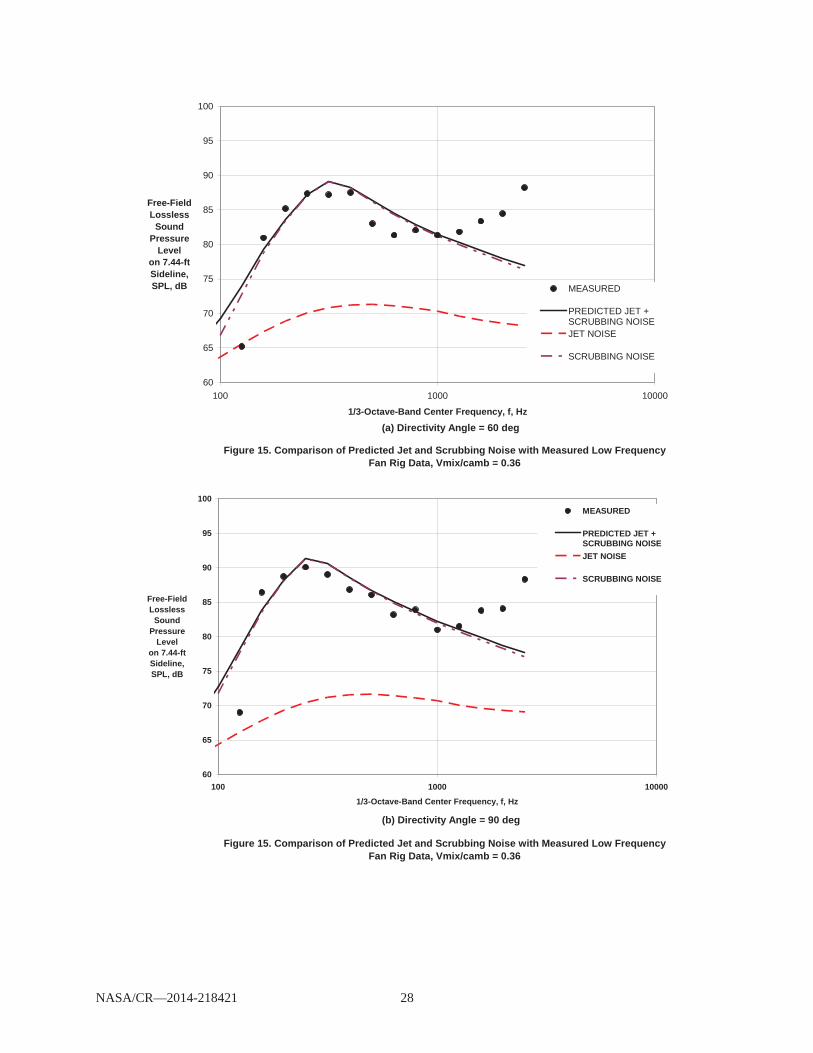
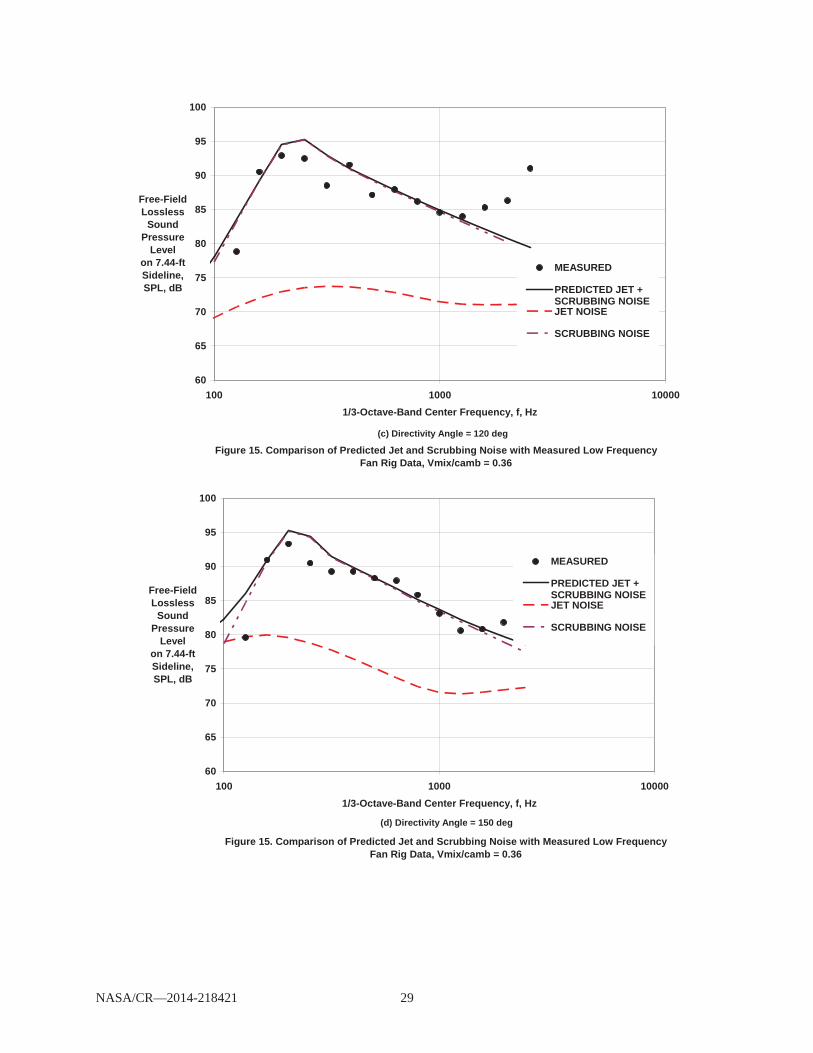
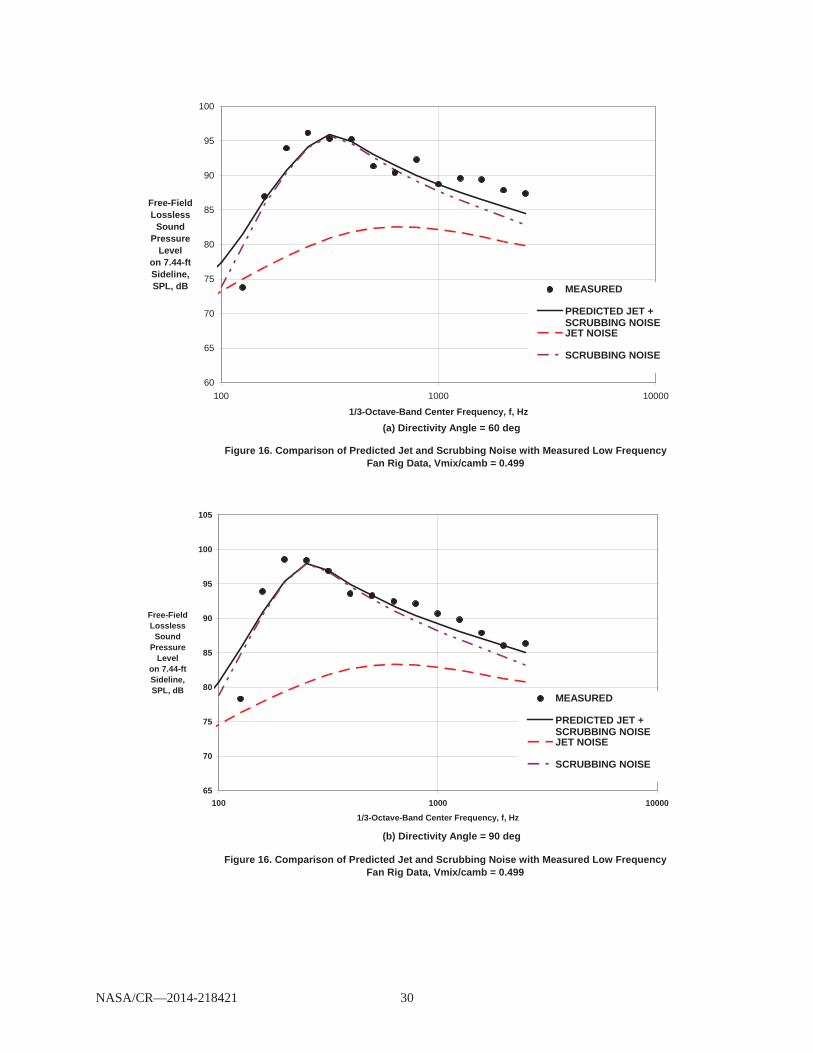
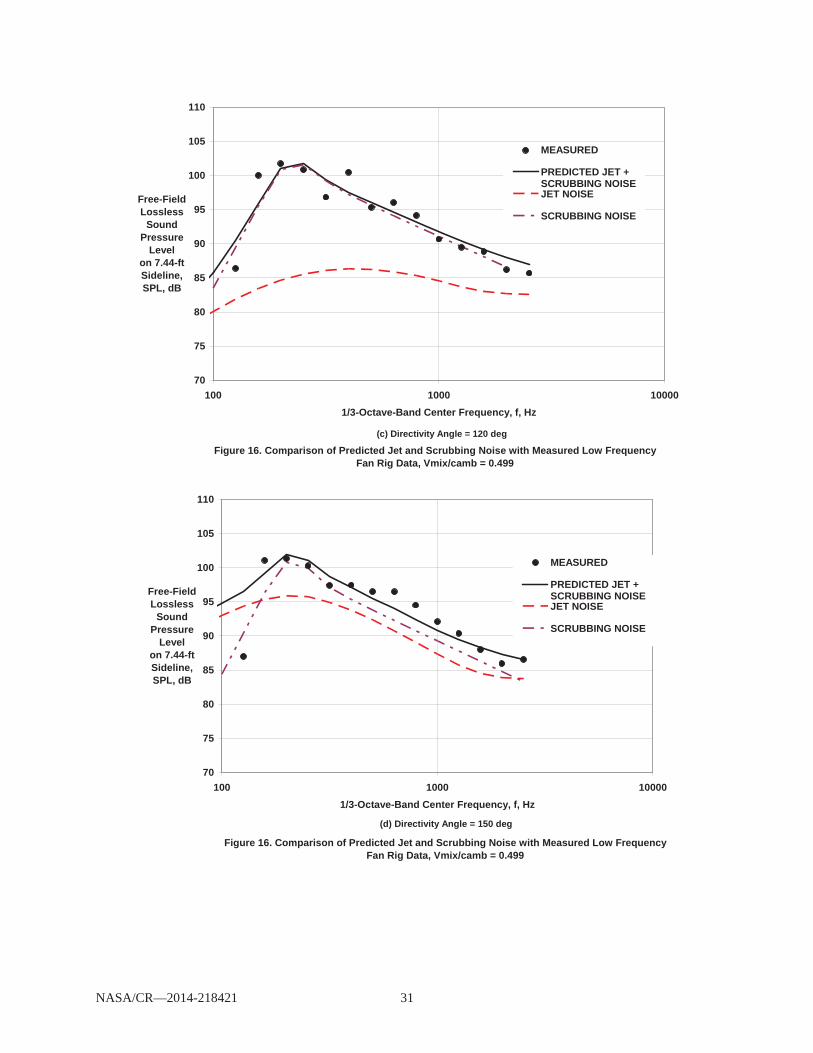
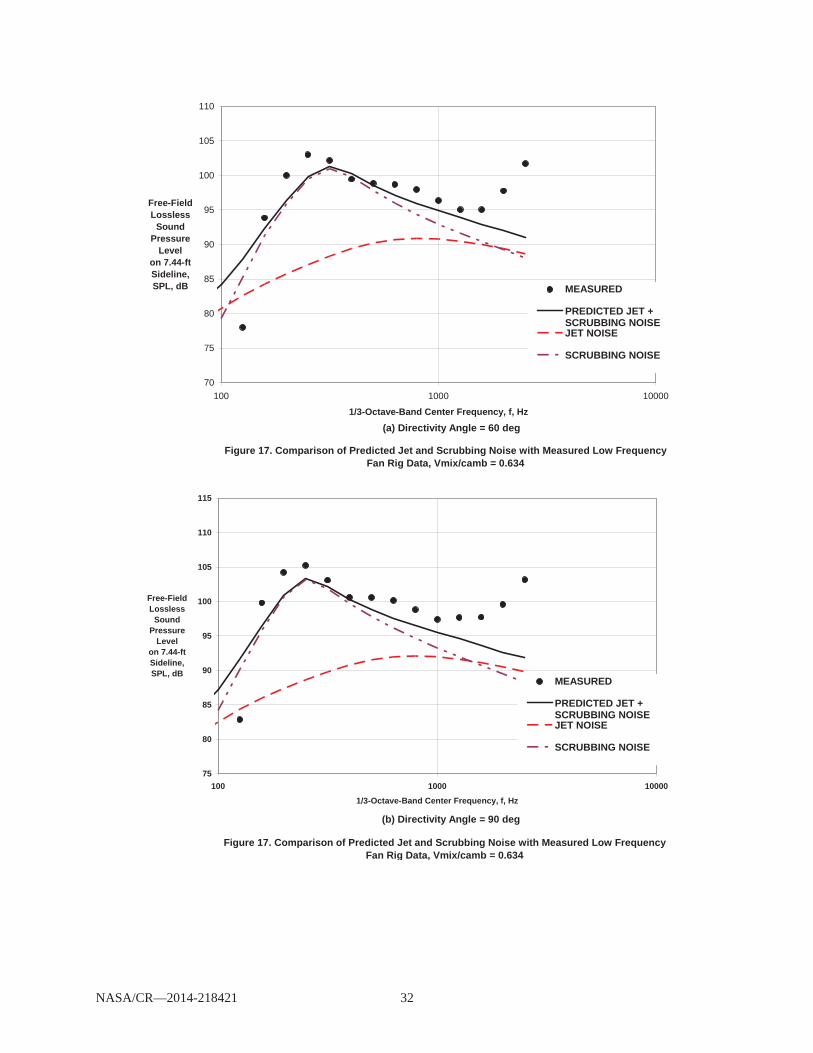
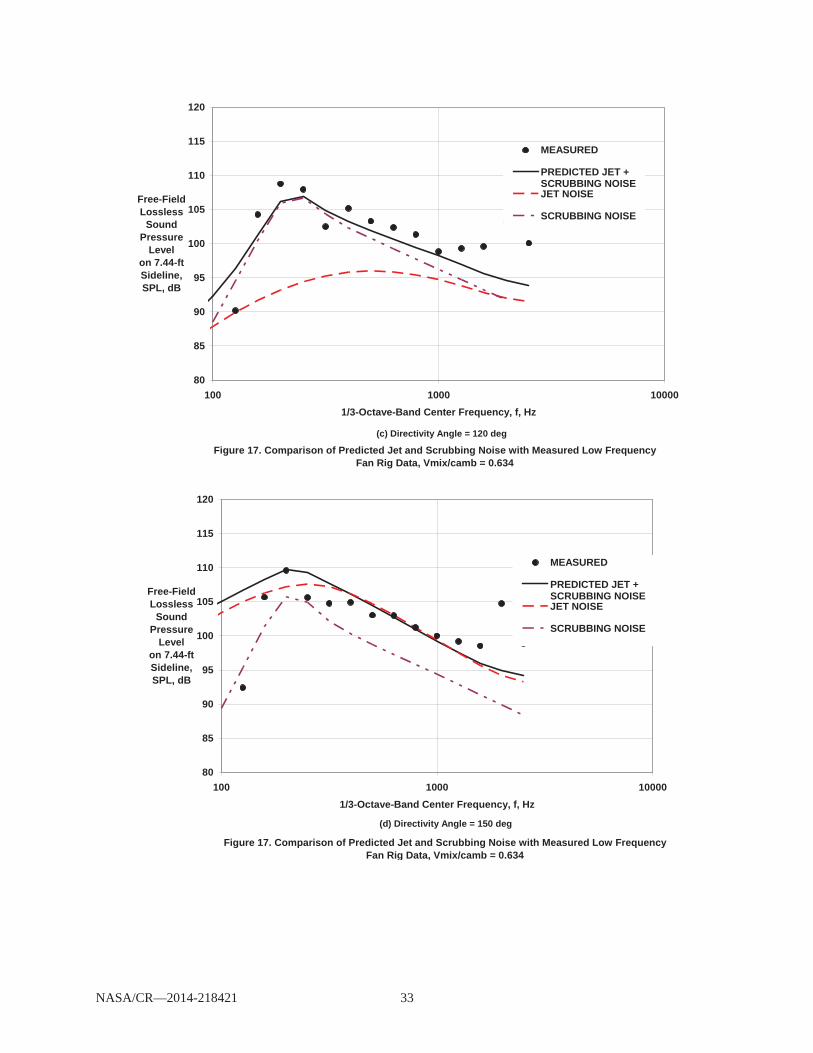
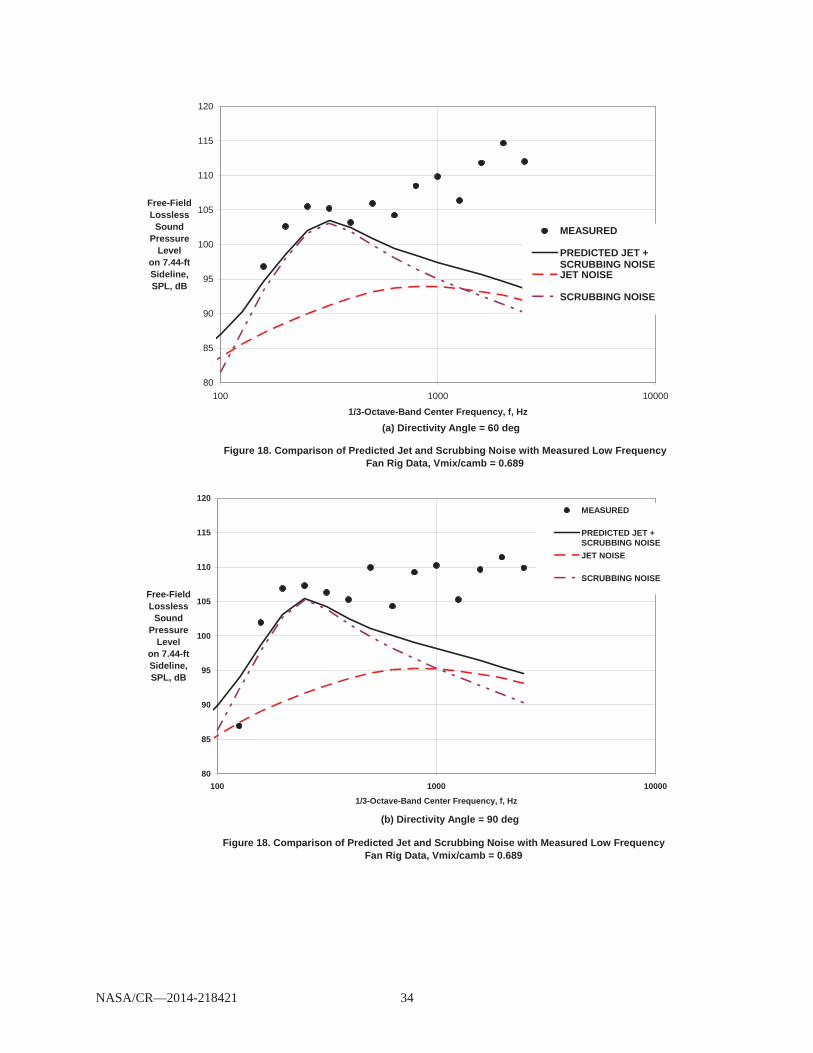
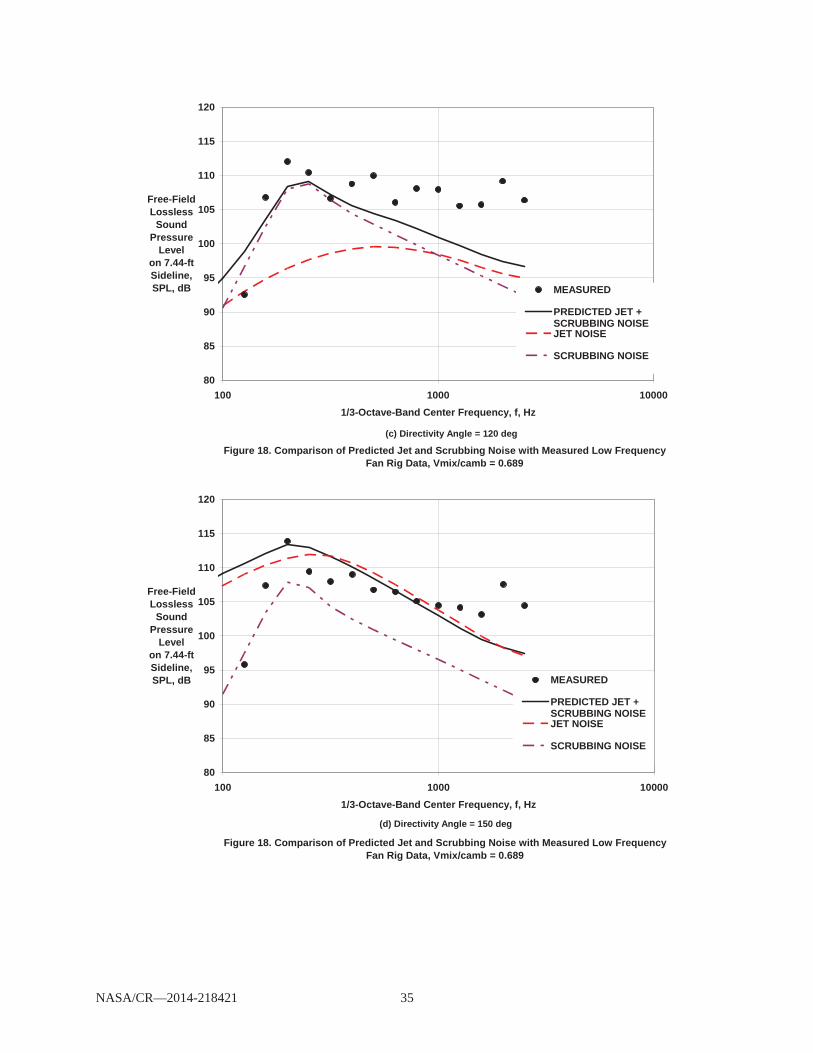
Predicted jet mixing plus scrubbing noise are compared with data from the fan rig for a range of jet exhaust velocities in Figures 15 to 18. At the lowest jet velocity, Figure 15, the scrubbing noise dominates the jet mixing noise at all angles and frequencies. As the jet velocity increases, the jet mixing noise becomes more important especially at aft angles near 1000 Hz. At 150 degrees at the highest jet velocity, corresponding to 100 percent fan speed, the jet mixing noise is higher then the scrubbing noise. In all cases the predicted jet mixing plus scrubbing noise agrees reasonably well with the data where fan noise is not expected. At the highest speed, combination tones are the likely cause of the difference between the data and predictions at frequencies above 500 Hz.
Comparison of Initial Total Noise Predictions With Fan Data
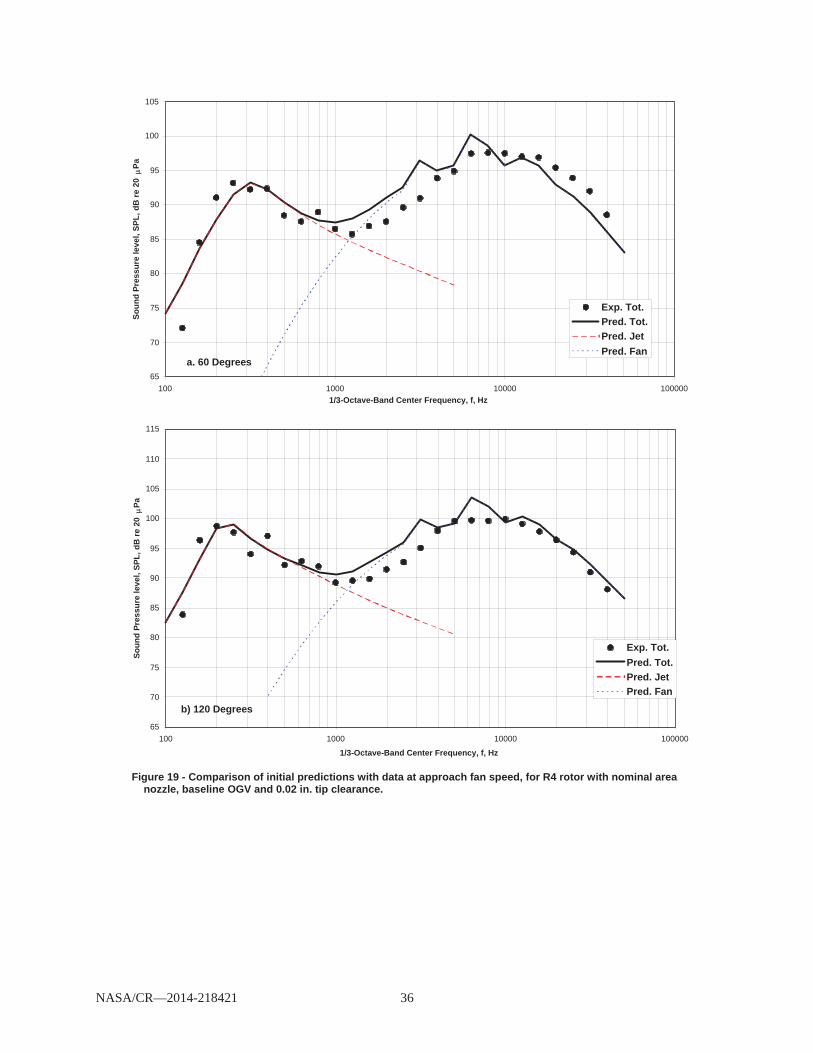
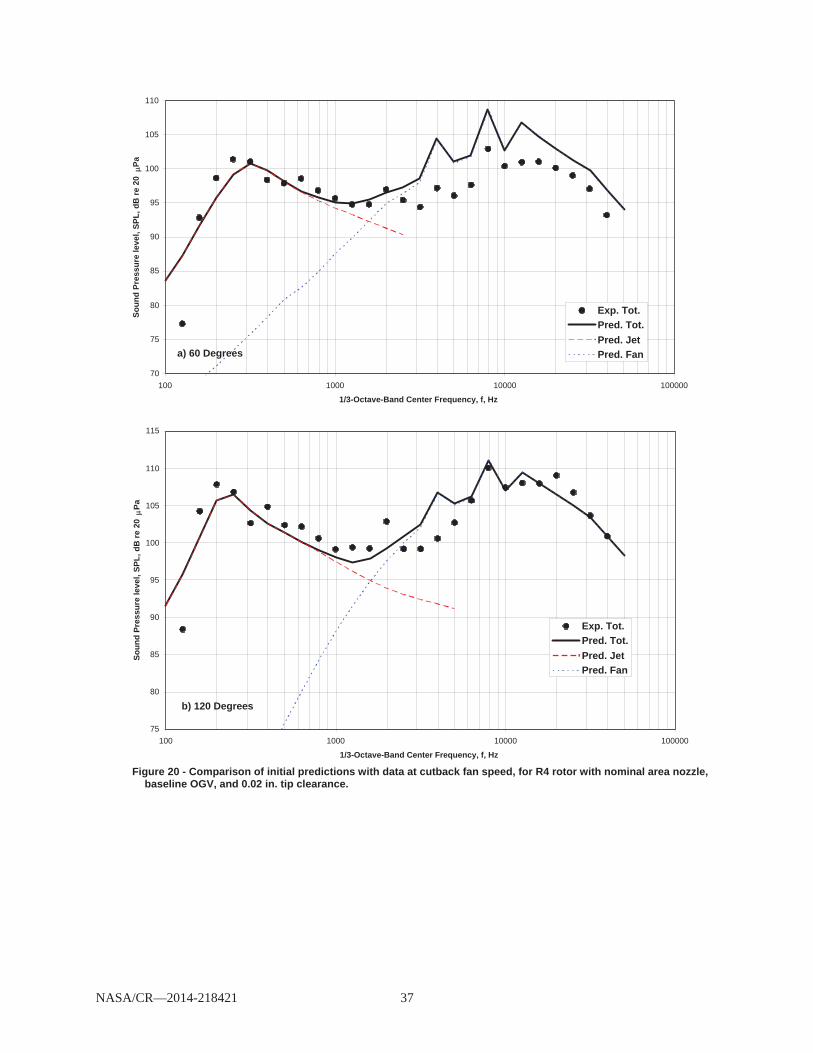
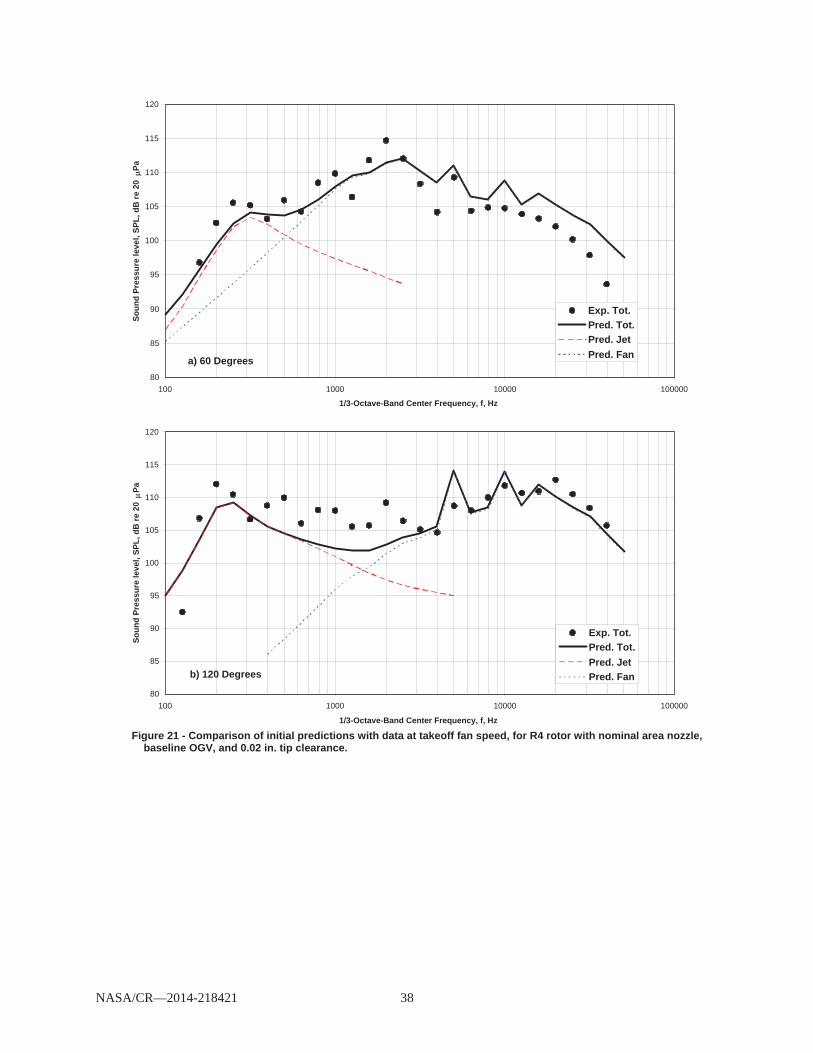
As mentioned above initial predictions are made with existing methodologies. This is true with the exception that the new model for the scrubbing noise was included in the initial prediction. Thus for this step, the low frequency noise scrubbing source and jet noise models described above are used along with the current Heidmann fan noise prediction methodology. The only adjustment made to the existing Heidmann prediction method, Reference 9, was to lower the level of the combination tones by 12 dB. It has been commonly accepted that Fan C on which Heidmann’s combination tone correlation was based, had unusually high levels of combination tones. Comparisons with data are shown in Figures 19 to 21 for the baseline fan with the nominal exhaust nozzle, baseline outlet guide vanes, and 0.02 in. tip clearance for fan speeds of 61.7, 87.5, and 100 percent. These speeds correspond to approach, cutback, and takeoff respectively. At the approach speed, Figure 19, the first and second harmonic are both over-predicted. The broadband levels appear to be about right, but the inlet spectrum needs to be shifted higher by one or two one-third octave bands. At the cutback fan speed, Figure 20, the over-prediction of the fan tones is even greater. The value of the fan tip relative Mach number at this speed is in the range where the Heidmann methodology predicts a sharp increase in inlet fan tone level with tip relative Mach number. Although the aft tone prediction does not include a sharp rise in level, the aft tones are still over-predicted. The inlet broadband noise is also over-predicted as are the broadband levels in the aft below the second harmonic. At takeoff condition, Figure 21, the aft tone and the inlet broadband noises are over-predicted. It also appears that combination tone noise is increasing the levels at the aft angle above that which is predicted.
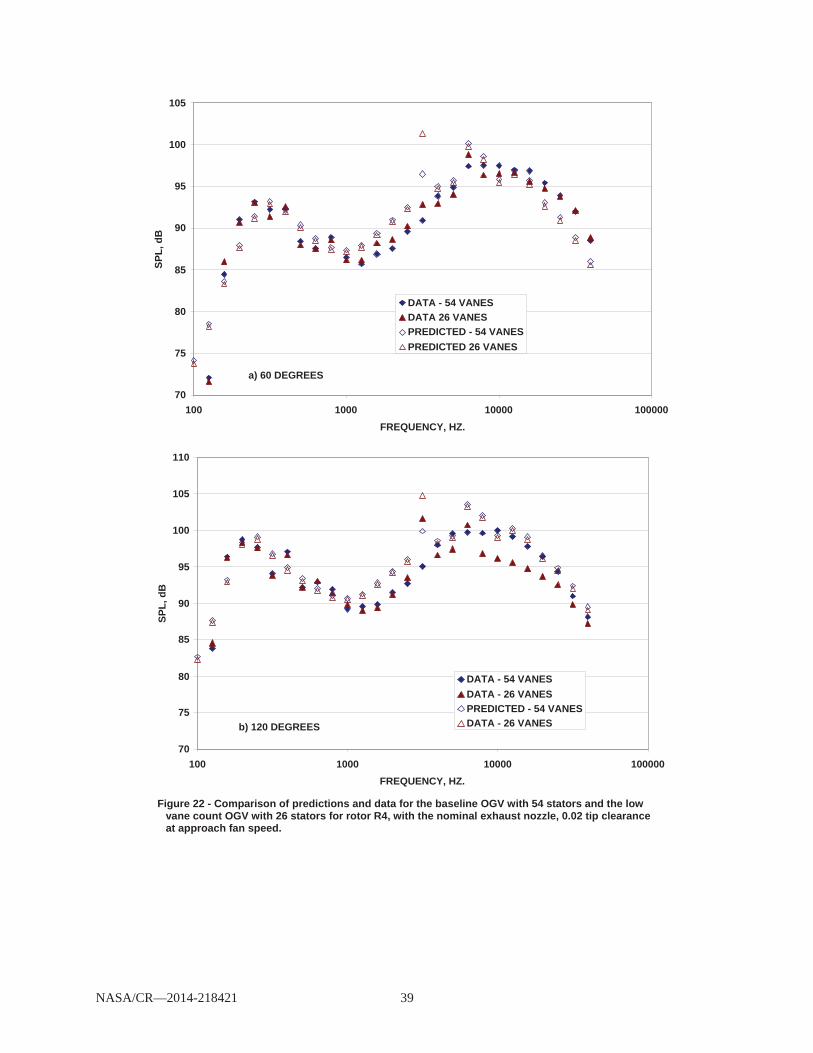
Among the objectives of the current task was to ensure that the fan noise prediction procedure is capable of predicting noise changes due to changes in fan geometry such as vane count, vane sweep and lean, and fan exhaust area. Figure 22 compares results from the current Heidmann prediction procedure
NASA/CR—2014-218421 7
with data from two tests with differing vane counts at the approach fan speed condition. The data show a decrease in broadband level at the aft angle. No such decrease is predicted by the Heidmann method. Examination of the other existing prediction procedures indicated that they would likewise not predict the measured difference in aft broadband level.
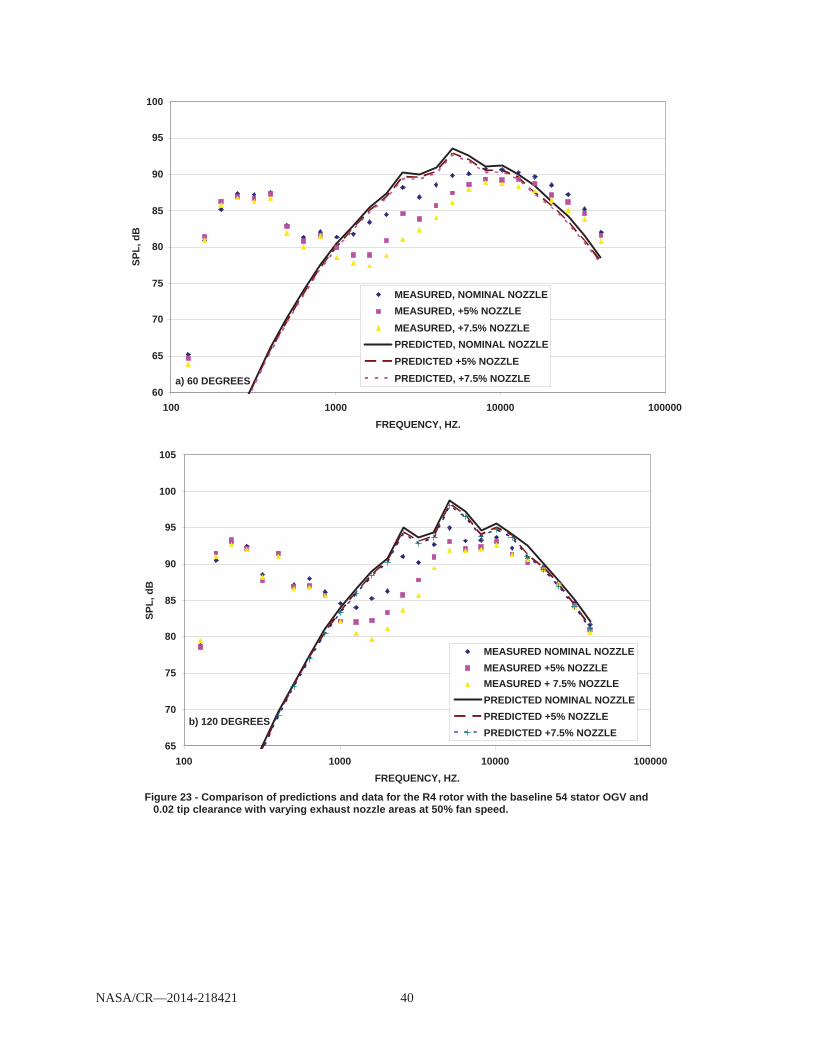
Figure 23 shows measured and predicted levels for three exhaust nozzle areas at 50 percent fan speed. The predictions are made using the Heidmann methodology and only fan noise predictions are shown. The data clearly show a decrease in levels with increasing exhaust areas. The predictions show very little change in level.
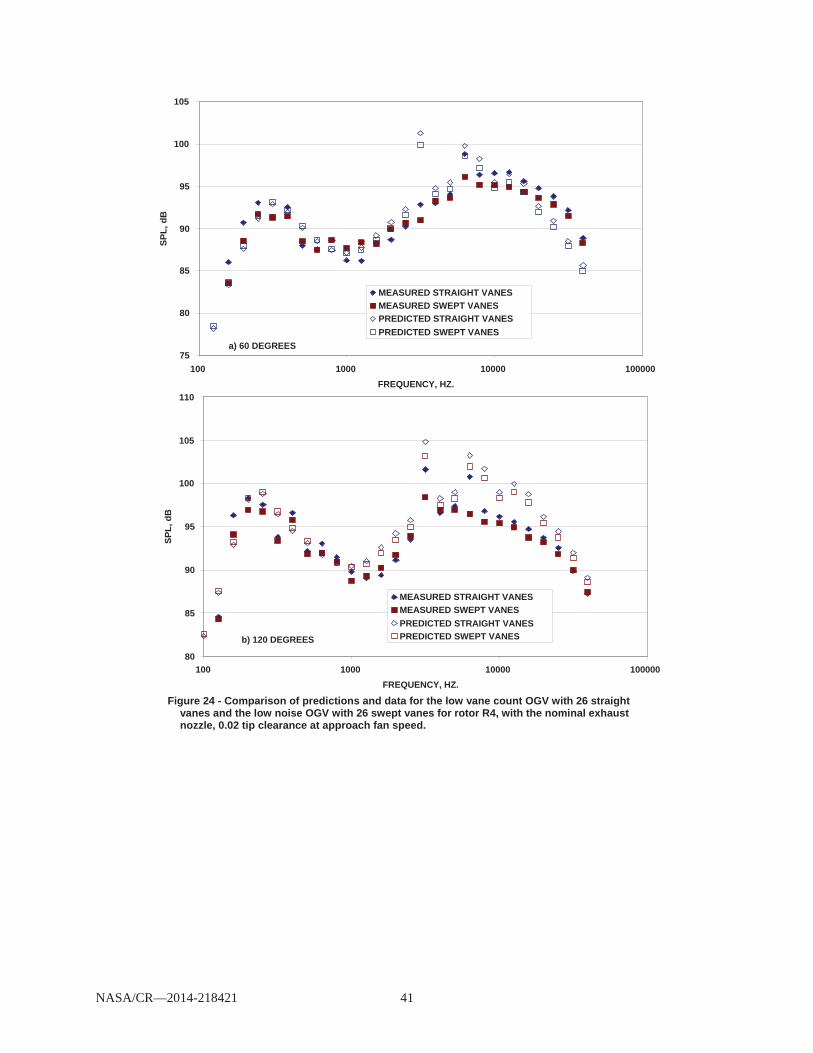
Figure 24 shows the effect of vane sweep on measured and predicted levels. The predictions for the swept vanes were made assuming the 30 degrees of sweep added one rotor chord to the rotor stator spacing. While the prediction show a reduction at all frequencies the same is not true for the data. In fact at the range of the fan noise spectrum the data actually shows a slight increase in level with vane sweep.
Extracted Fan Noise Levels, Spectra, and Directivities Just as we broke down the jet/background noise into its constituent terms by the extraction process,
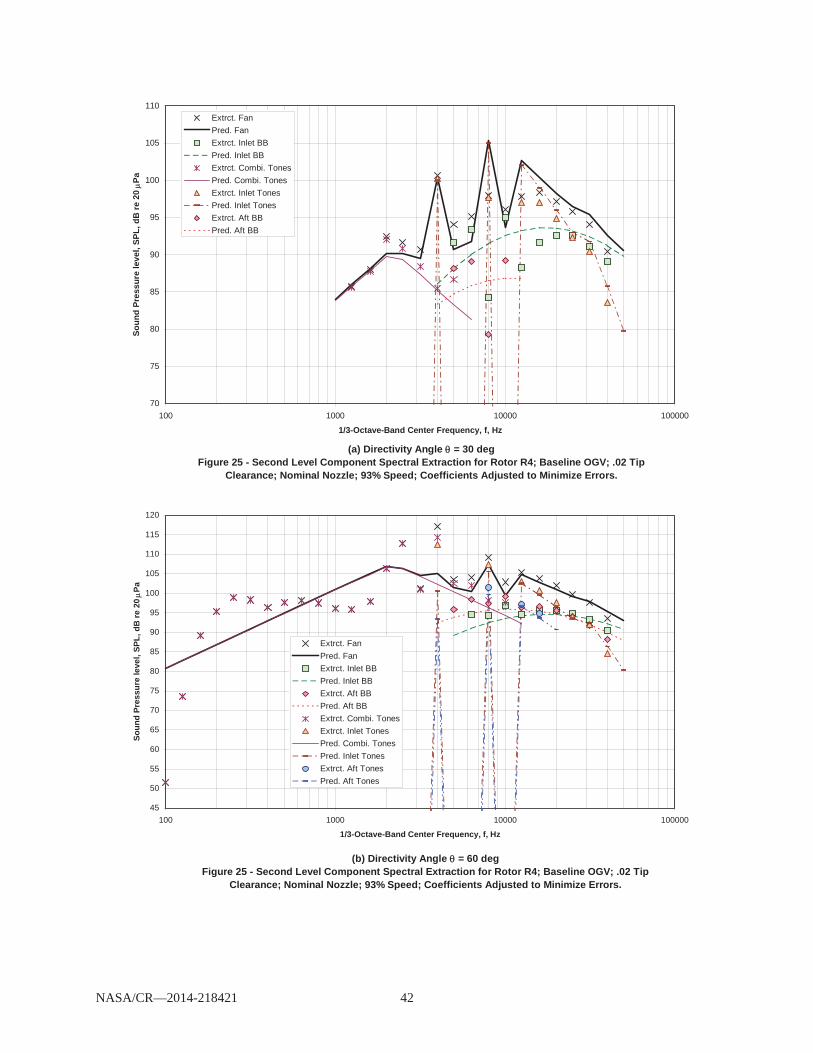
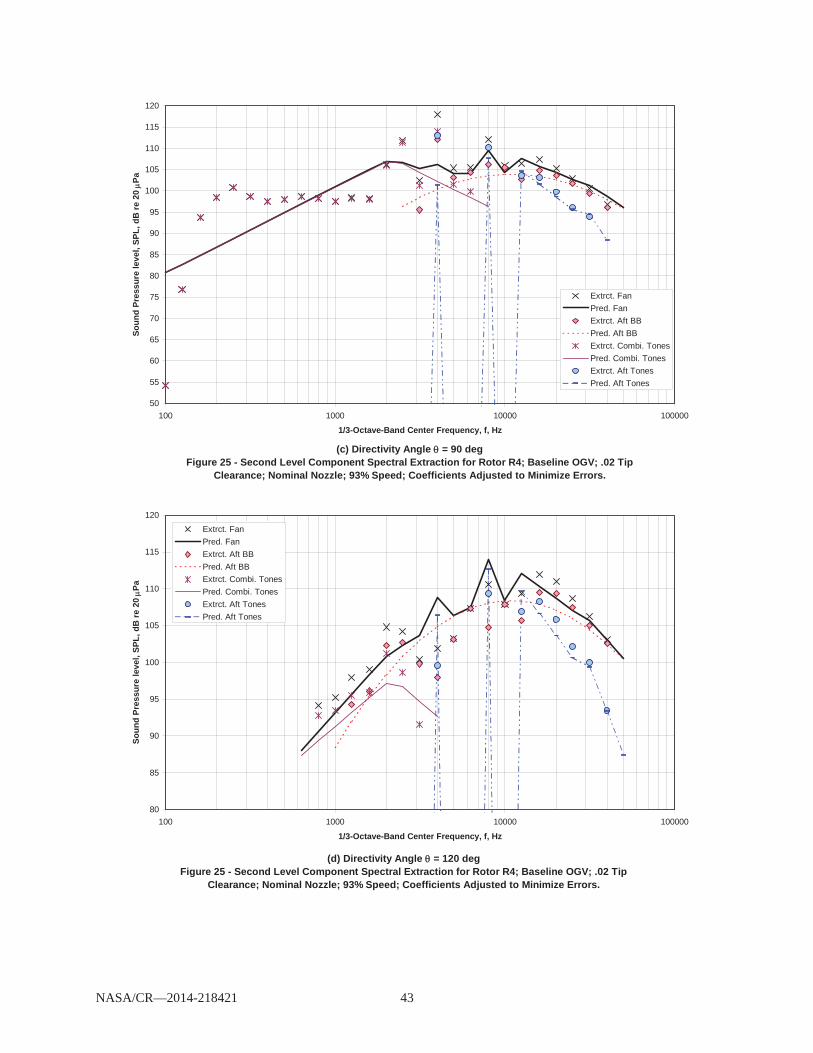
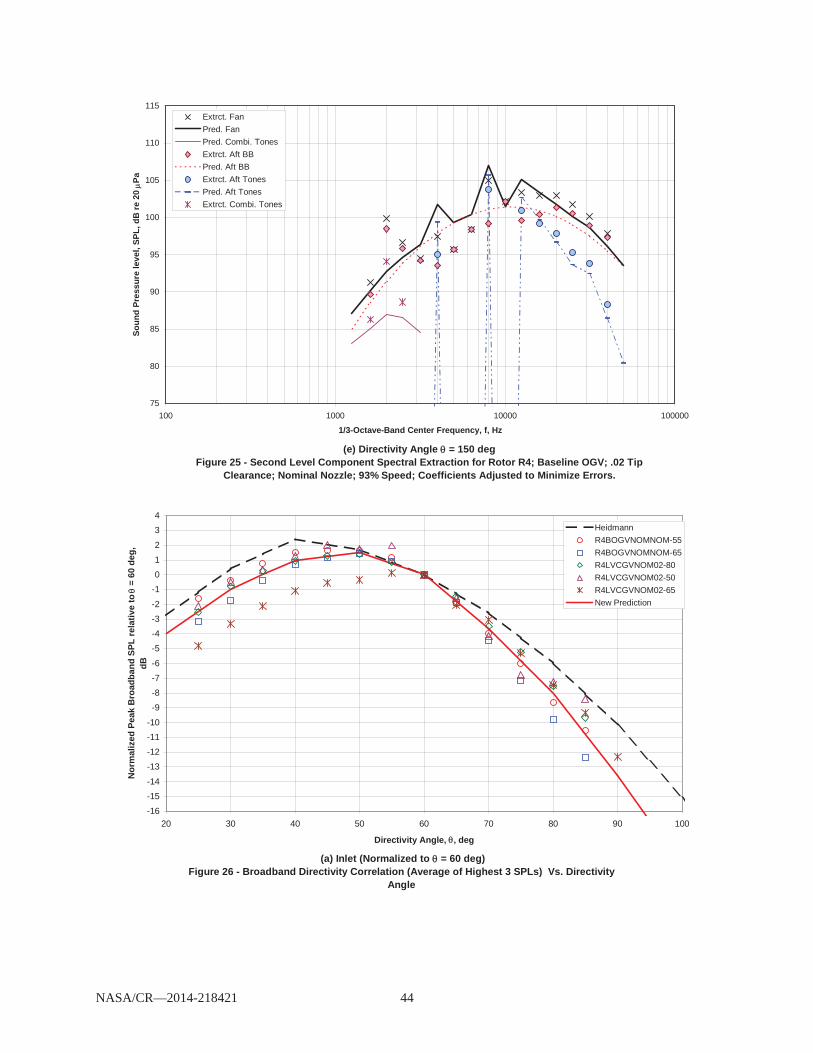
we can break down the experimental/extracted fan noise into inlet broadband, aft broadband, inlet tone, aft tone and combination tone constituents. This is illustrated in Figure 25. At = 30 deg (Fig. 25(a)) the extraction process has established that fan noise is significant at above 1000 Hz. Below the blade passage frequency, combination tones are evident. The first harmonic tone is predicted accurately, but the higher harmonics are over-predicted. (In adjusting the various component levels it is attempted to find the combination of coefficients that minimizes average errors at all angles for each component at all frequencies where it is important, so exact agreement with the first harmonic is coincidental.) Because of the strong pure and multiple tone contributions, it is difficult to judge the agreement of the broadband noise here. At = 60 deg (Fig. 25(b)) the combination tones are predicted to become stronger, and while this is observed the quantitative agreement is not good. Here, the second and higher harmonics are in reasonably good agreement with prediction, while the fundamental is significantly under-predicted. The agreement at frequencies beyond the band containing the fundamental is rather good with the predicted mix of tones and broadband contributions. At = 90 (Fig. 25(c)) essentially the same observations can be made as at = 60 deg. At = 120 deg (Fig. 25(d)) the overall agreement is fairly good, but the first three harmonic tones are somewhat over-predicted. At = 150 deg (Fig. 25(e)) there is reasonable agreement except at the fundamental tone, which is significantly over-predicted and at 200 Hz there is a significant under-prediction of a sharp combination tone.
As can be judged from this discussion, it would be very difficult to develop improved predictive models by looking at a number of isolated cases. Instead we bring together the component data for a number of test conditions in normalized form, after having gone through the extraction and adjustment process.
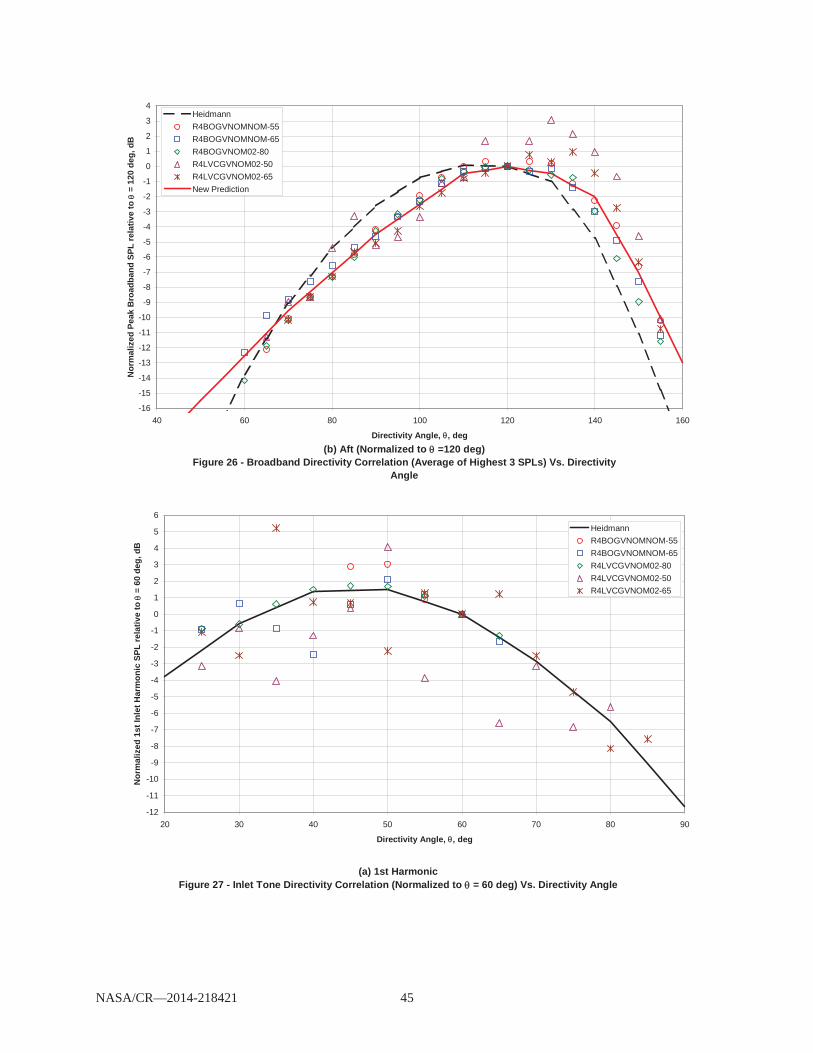
First we addressed the directivities of the fan noise components. For broadband noise we averaged the highest 3 experimental/extracted SPLs at each angle as an approximation to the peak of the spectrum. We then plotted these values normalized to the value at = 60 deg for inlet noise and = 120 deg for aft noise against angle, using only data for cases where tip speed is subsonic to avoid possible interference from combination tones. The results are shown in Figure 26(a) for inlet broadband noise and in Figure 26(b) for aft broadband noise. In both cases it can be seen that the experimental results differ from the Heidmann model. We therefore developed new empirical relations for use in our subsequent modeling that agree more closely with the experimental/extracted data.
NASA/CR—2014-218421 8
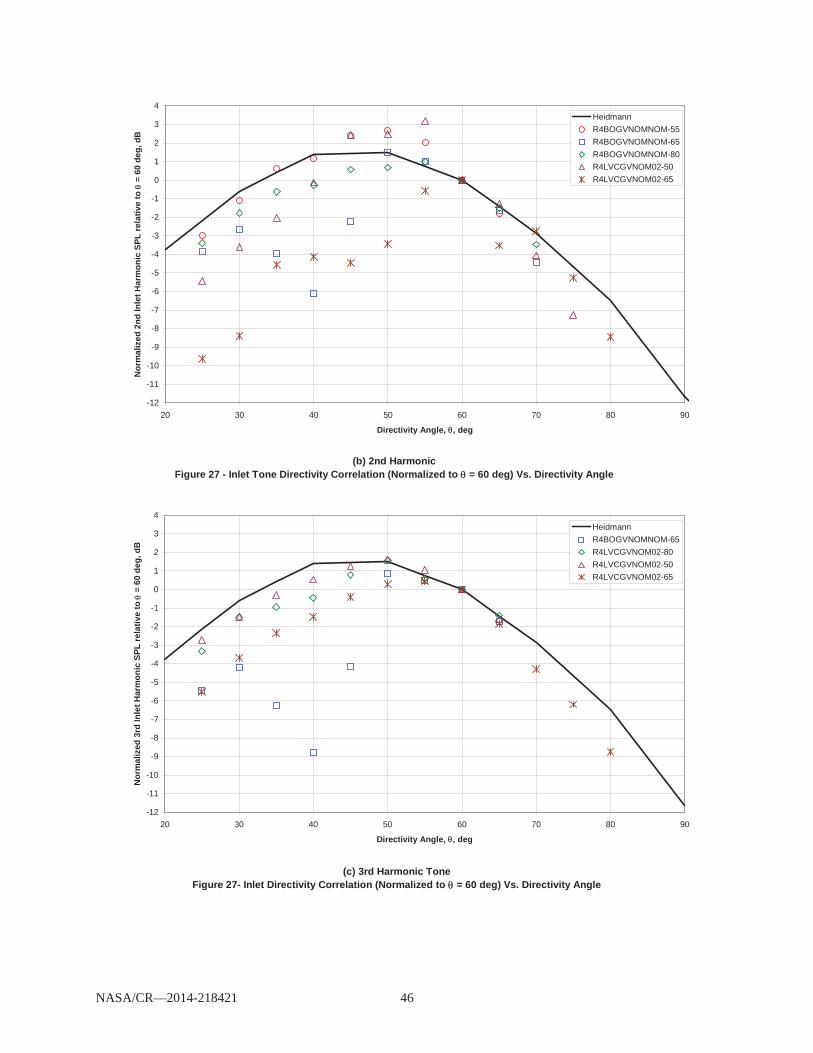
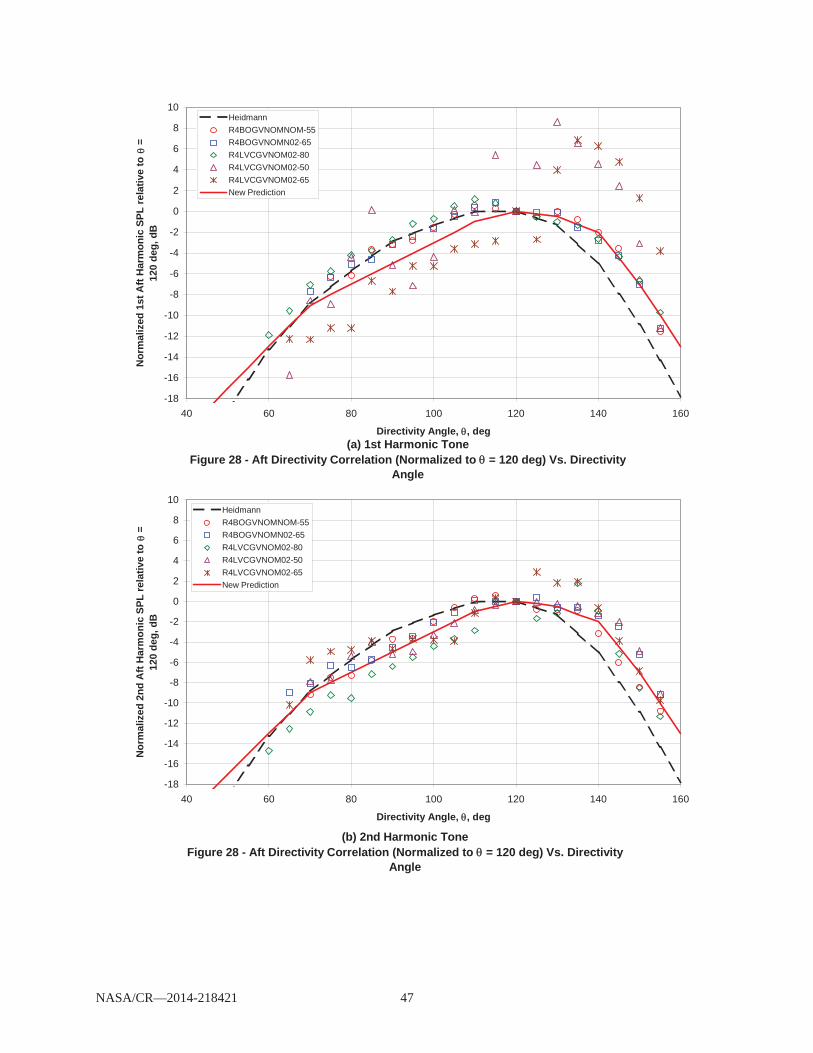
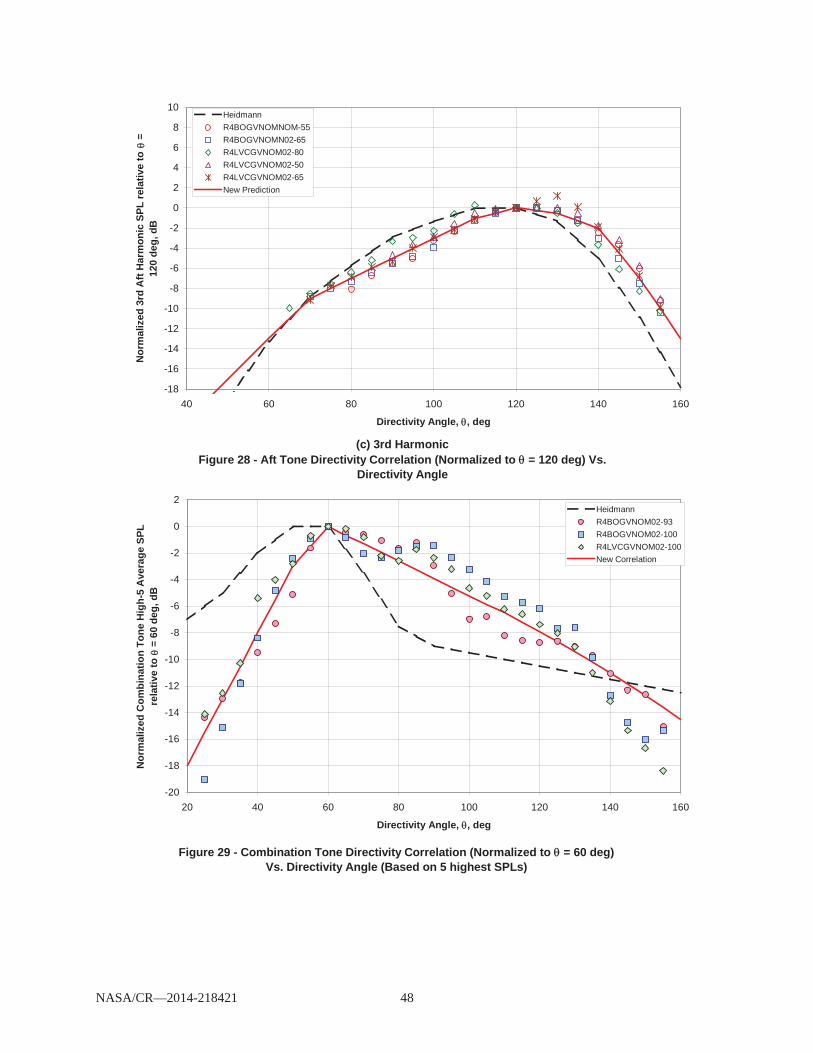
For the harmonic tones a similar approach was tried, plotting the experimental/extracted SPL, normalized to its value at = 60 deg for inlet noise and = 120 deg for aft noise against angle, using only data for cases where tip speed is subsonic to avoid possible interference from combination tones. The results for the inlet tones are shown in Figure 27(a) to (c) for the first, second and third harmonics, in comparison with the Heidmann prediction. There is a lot of scatter, and the results change from one harmonic to another; because of the lack of any definitive trends, we retained the Heidmann directivity relations. For the aft tones, the situation is more promising, as can be seen in Figures 28(a) to (c) for the first, second and third harmonics. Although the first harmonic shows some scatter, the second and third behave in a more regular manner. All three harmonics agree better with the new relation than with that of Heidmann, although the difference is not as great as it was for broadband noise.
For combination tones, our directivity plots were made by averaging the highest five experimental/ extracted SPLs at each angle. These values, normalized to the value at = 60 deg, are plotted against angle in Figure 29. The trends exhibited by the experimental/extracted data differ significantly from the Heidmann prediction, so we developed a new relation, as shown in the figure.
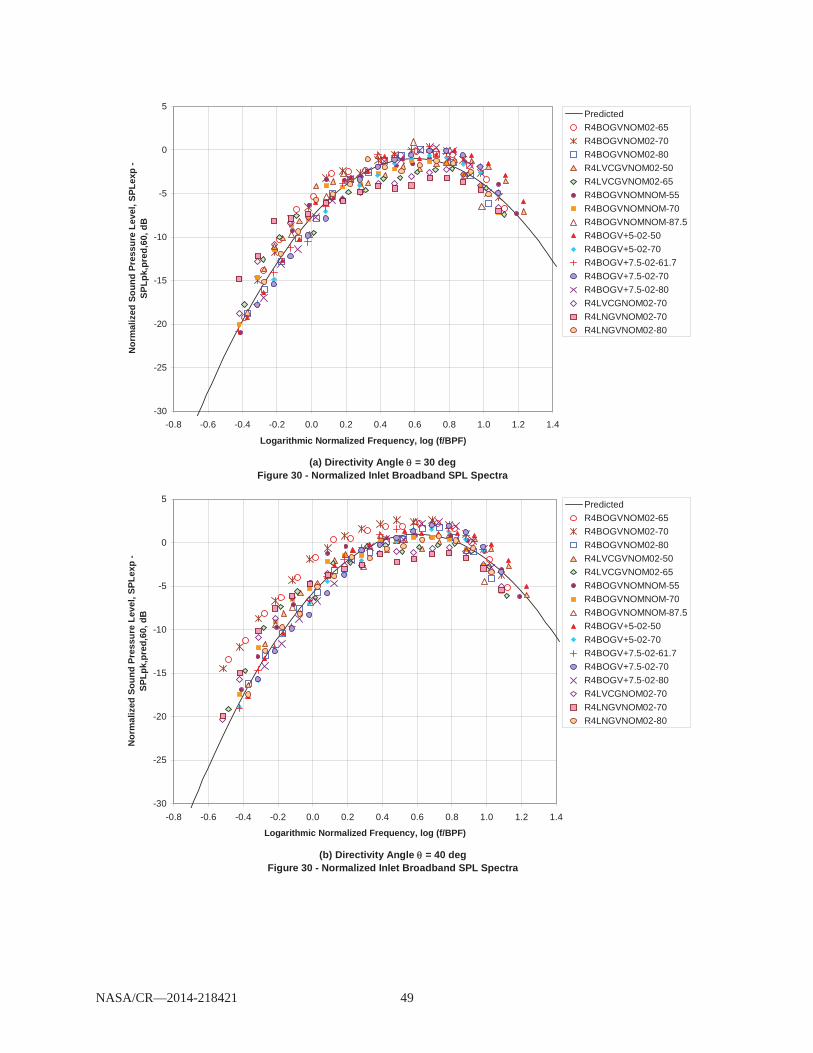
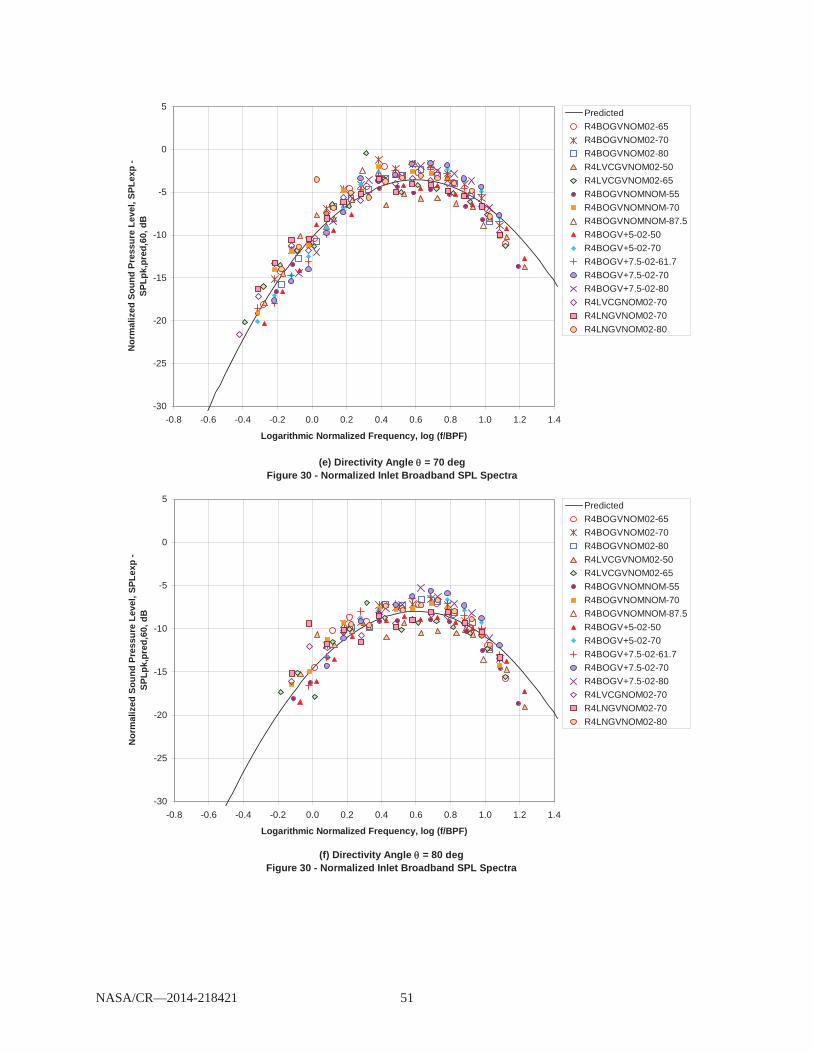
Using these new directivity relations, we next evaluated the spectra. First, the normalized spectra at several angles for inlet broadband noise were considered. The experimental/ extracted SPL is normalized to the predicted peak SPL at = 60 deg is plotted against the non-dimensional logarithmic frequency parameter, log (f/BPF), at = 30, 40, 50, 60, 70 and 80 deg Figures 30(a) to (f). At higher angles the aft broadband noise is dominant; it even contributes significantly at 50 to 60 deg in some cases. Generally, although there is scatter the experimental/extracted spectra have the predicted shape, but the peak frequency was shifted higher by two 1/3 octave bands, and the directivity effects (angle to angle) are adequately modeled. On some charts there are points at near log (f/BPF) = 0.0 that deviate significantly due to under or over prediction of the fundamental tone.
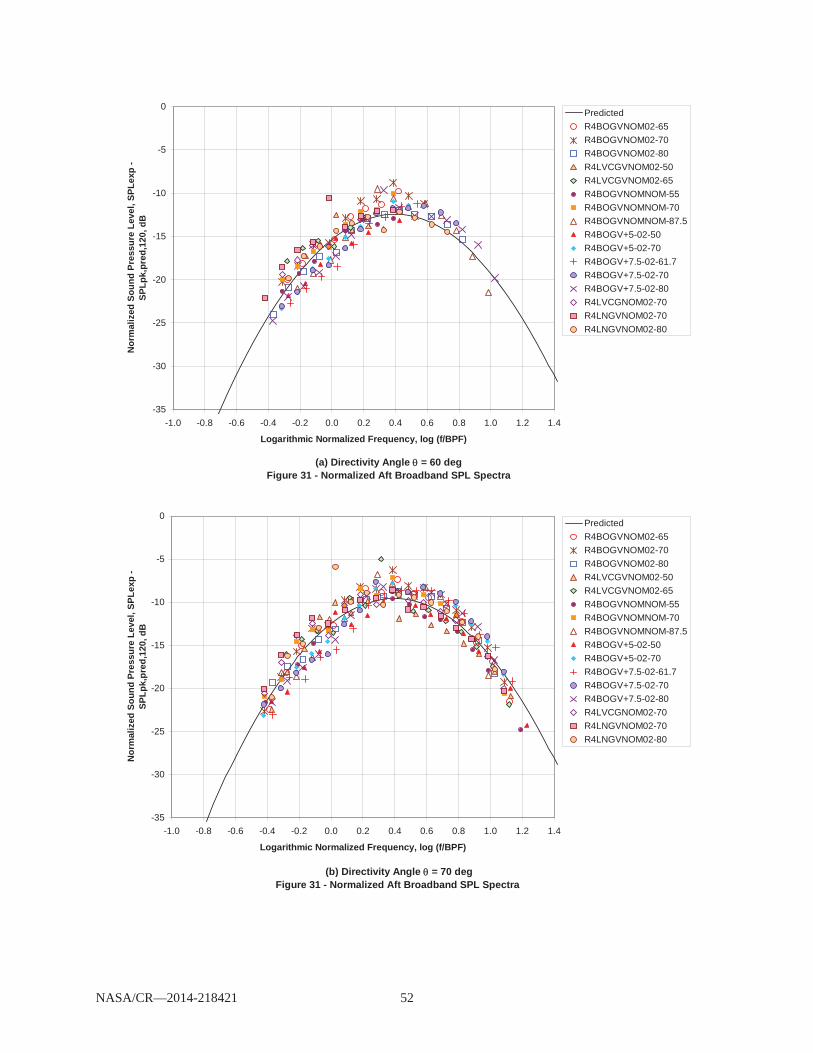
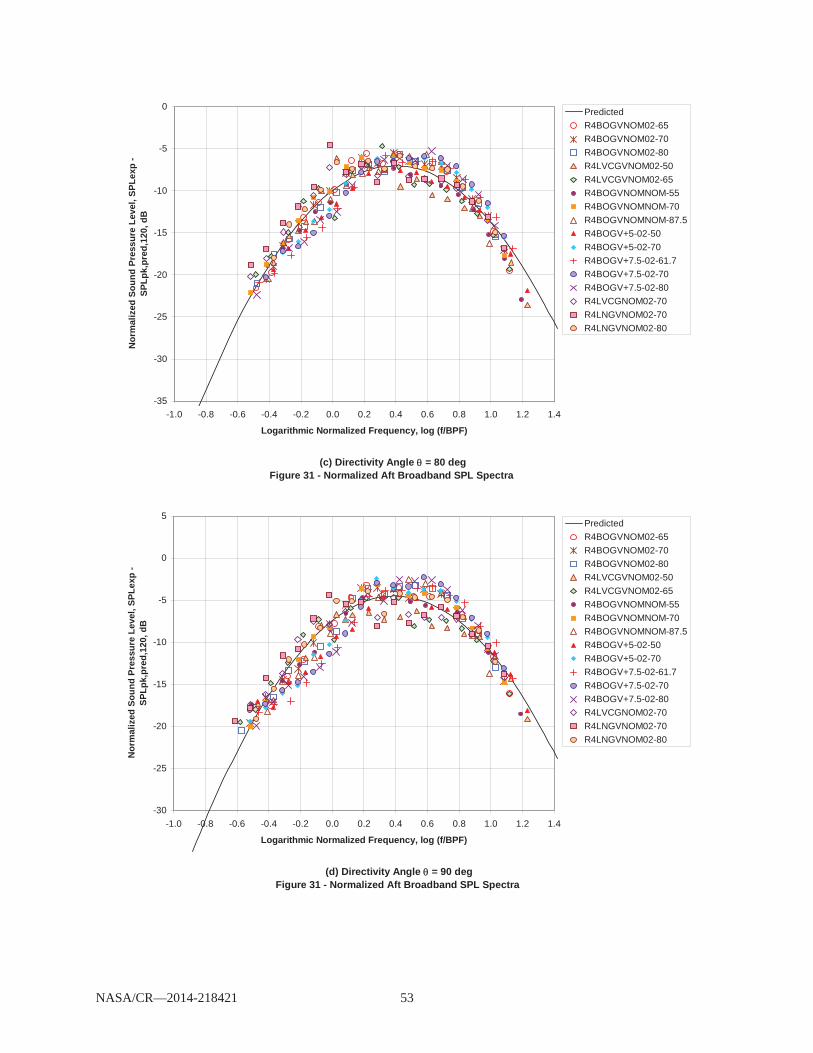
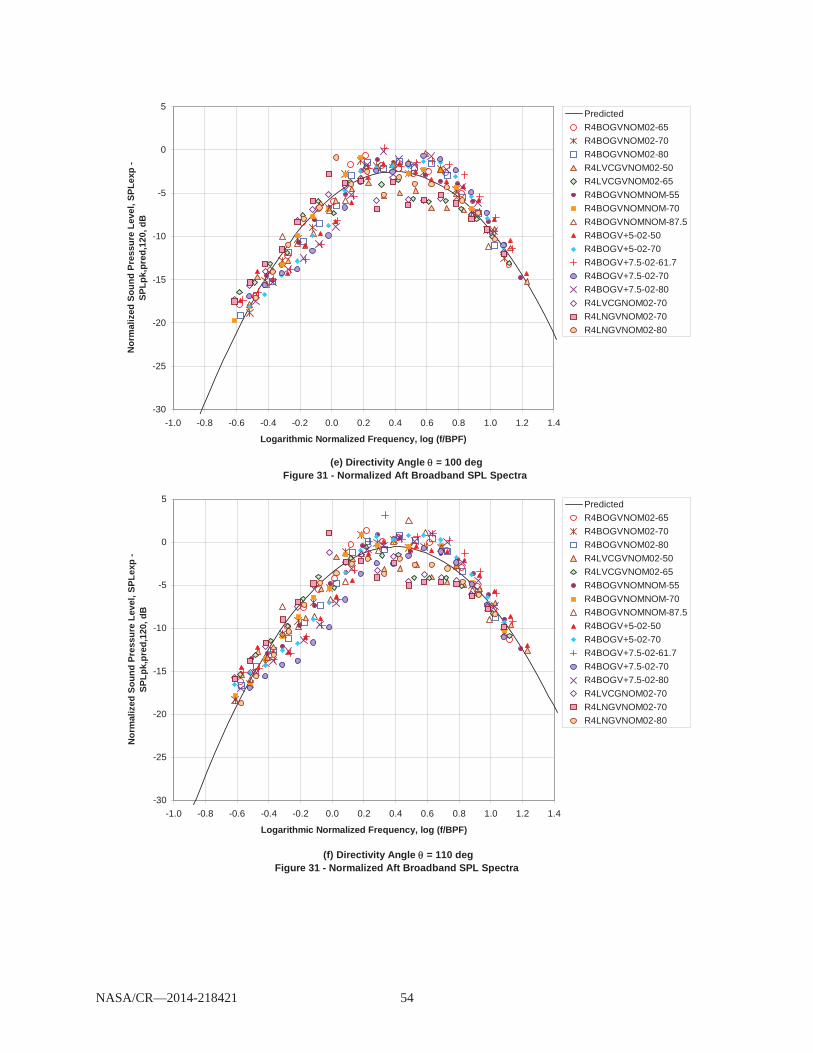
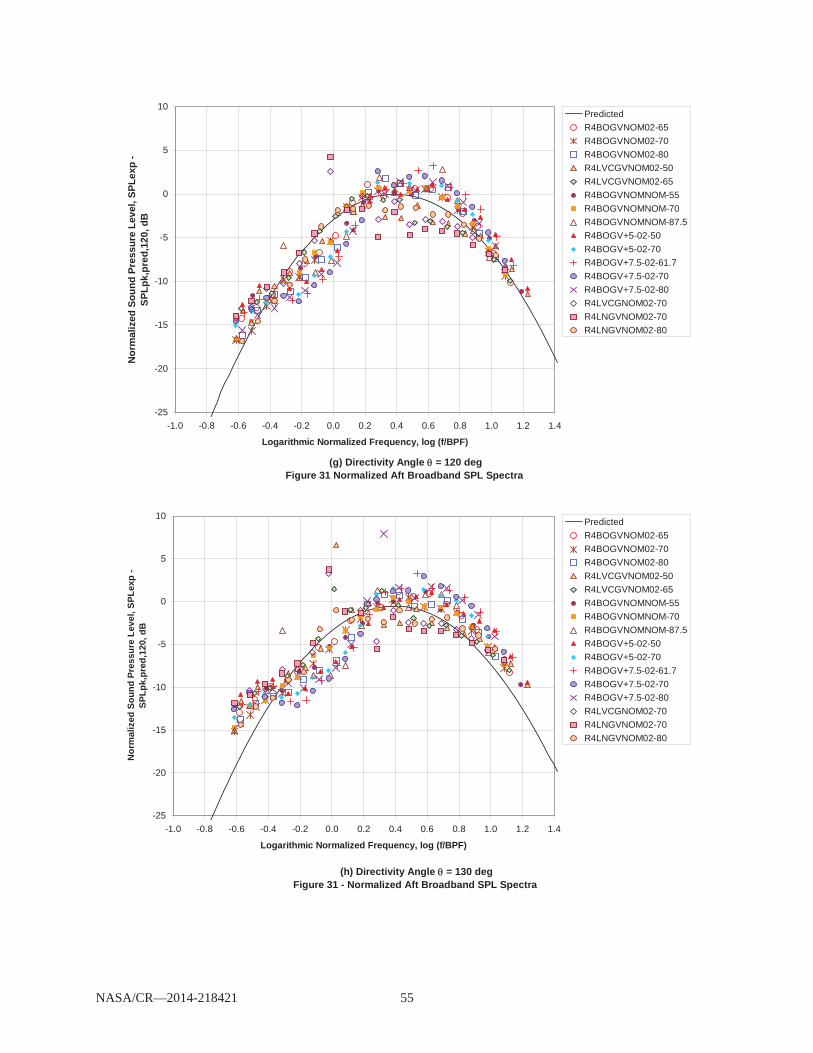
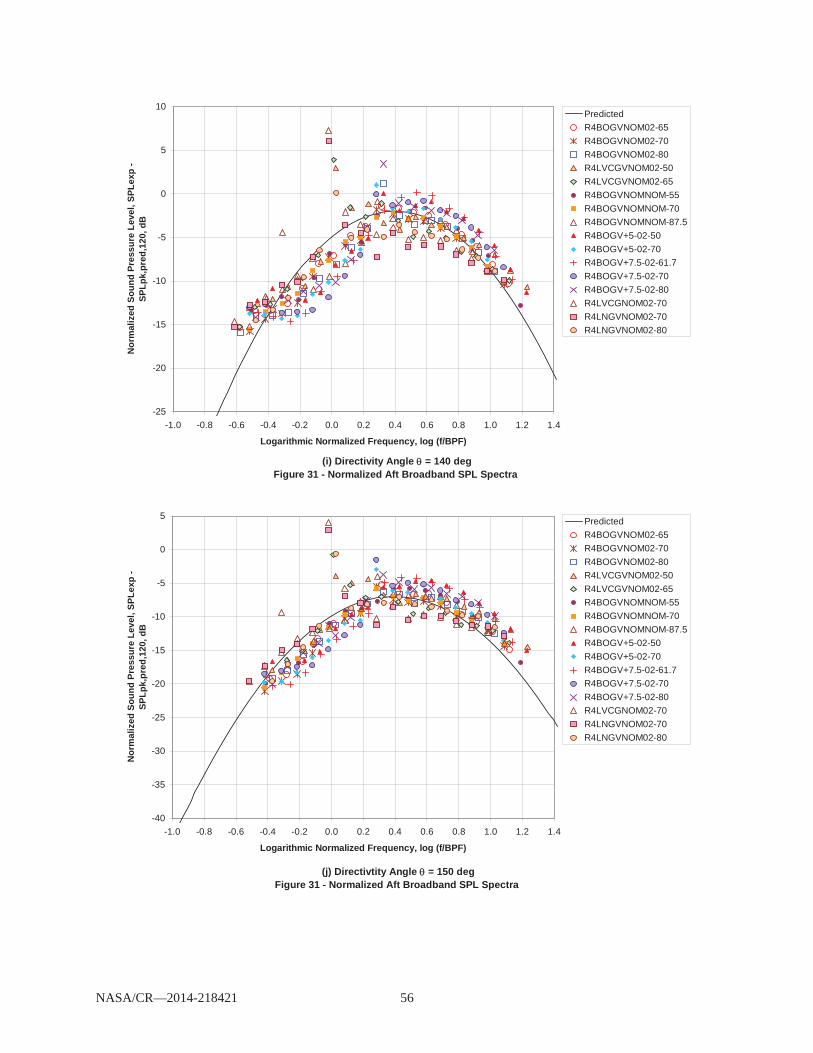
The analogous plots for the aft broadband noise are shown in Figure 31. Here the experimental/ extracted SPL is normalized to the predicted peak at = 120 deg. Particularly at the more aft angles, it appears that a linear low frequency roll-off might be more appropriate, but we did not make such a change at present. No adjustment was made to the peak frequency for the aft broadband noise. There are also significant problems with tones not adequately predicted at the aft angles.
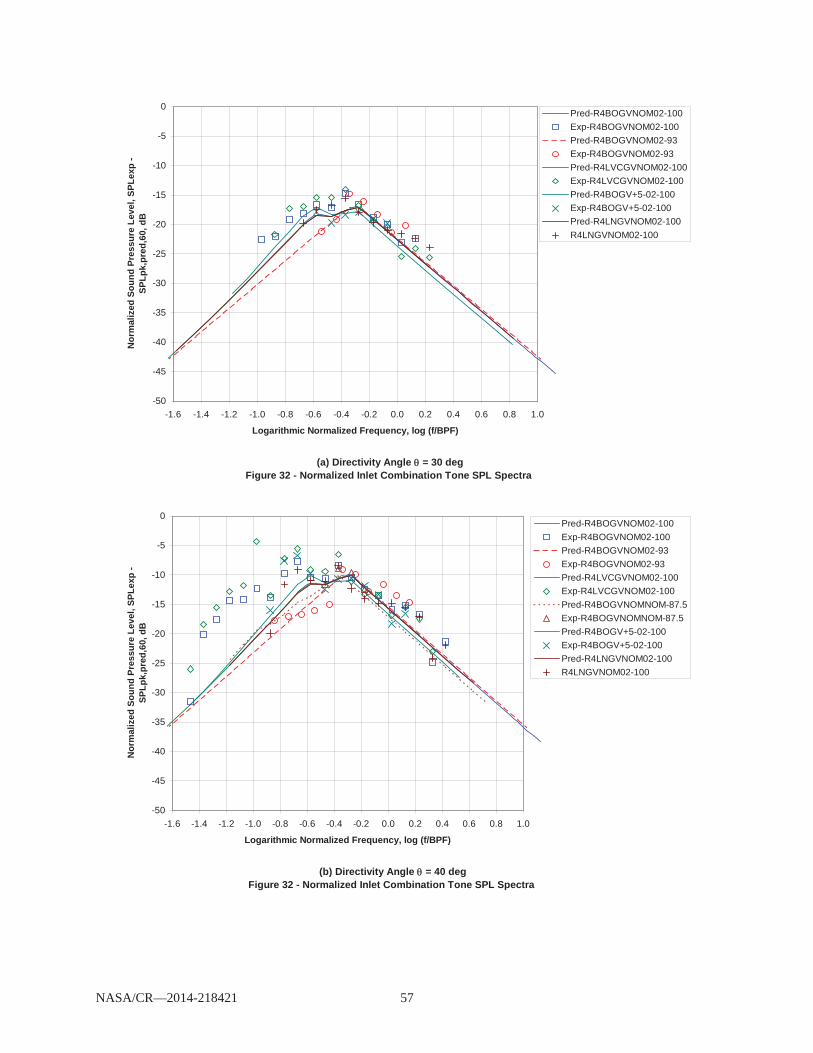
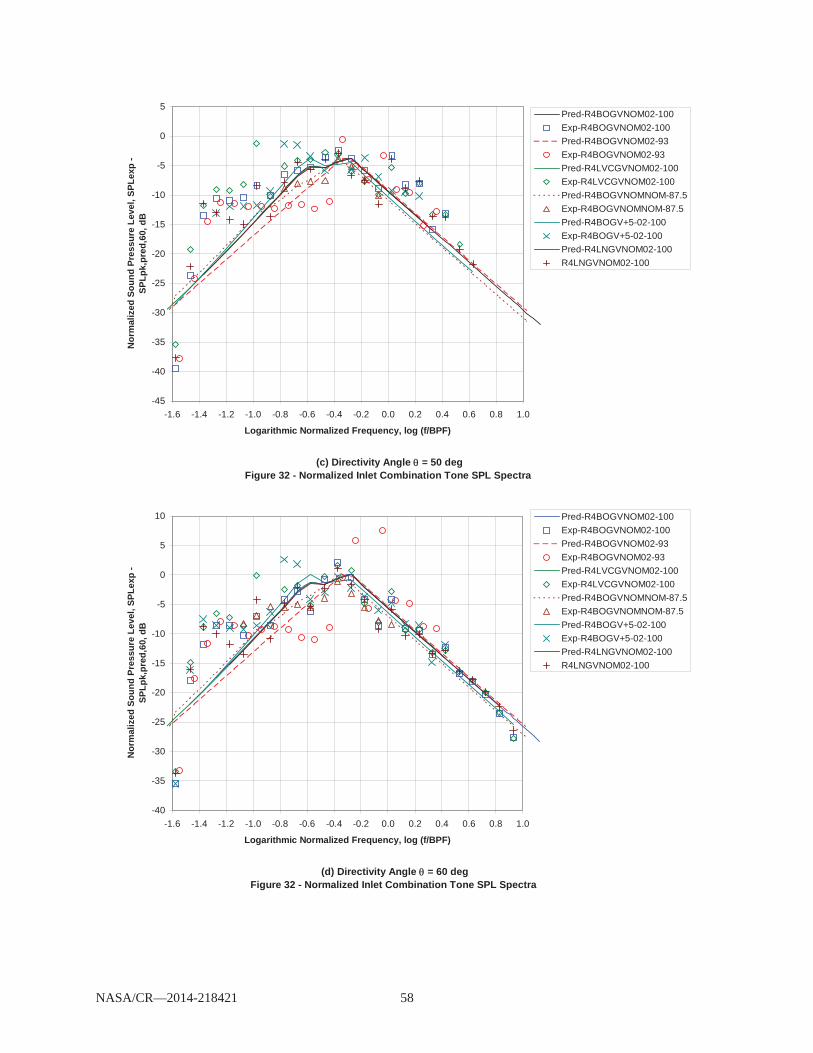
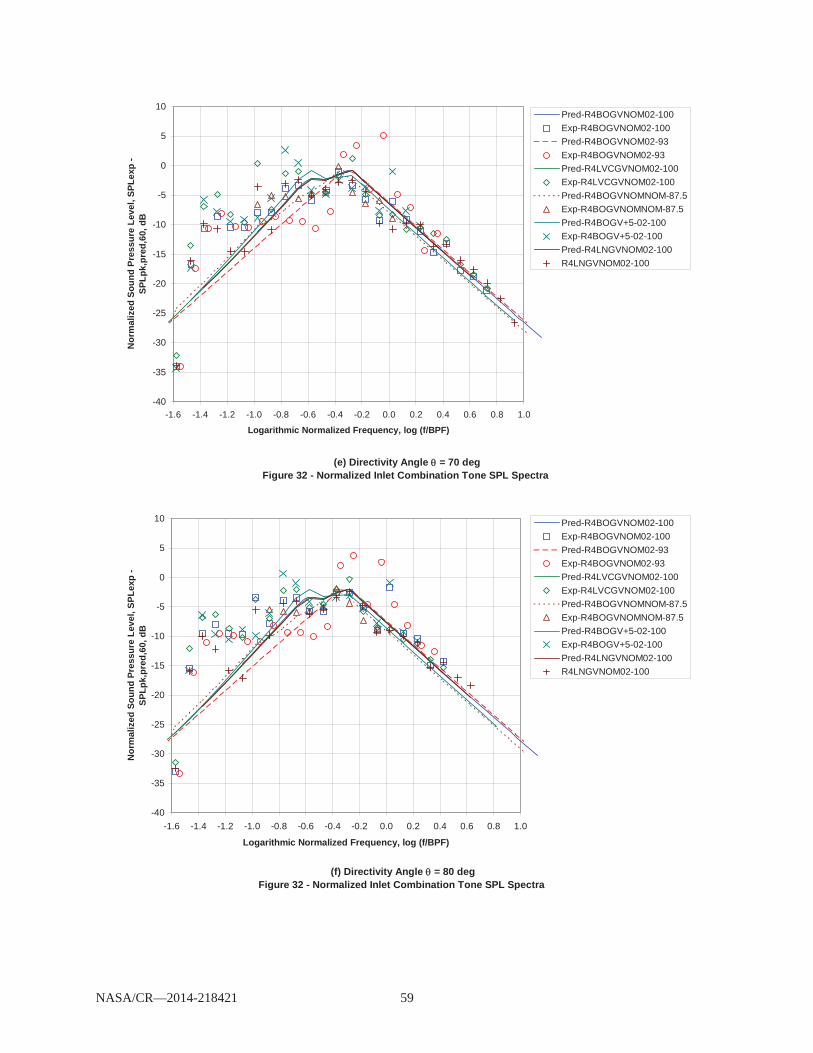
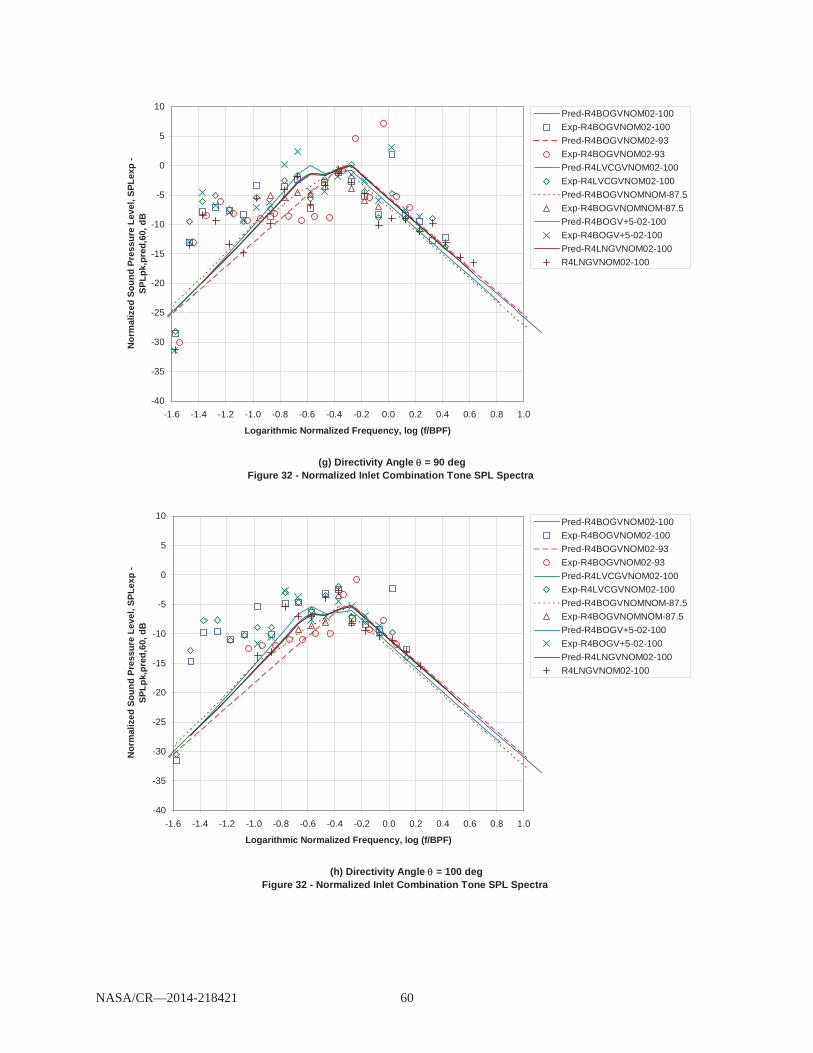
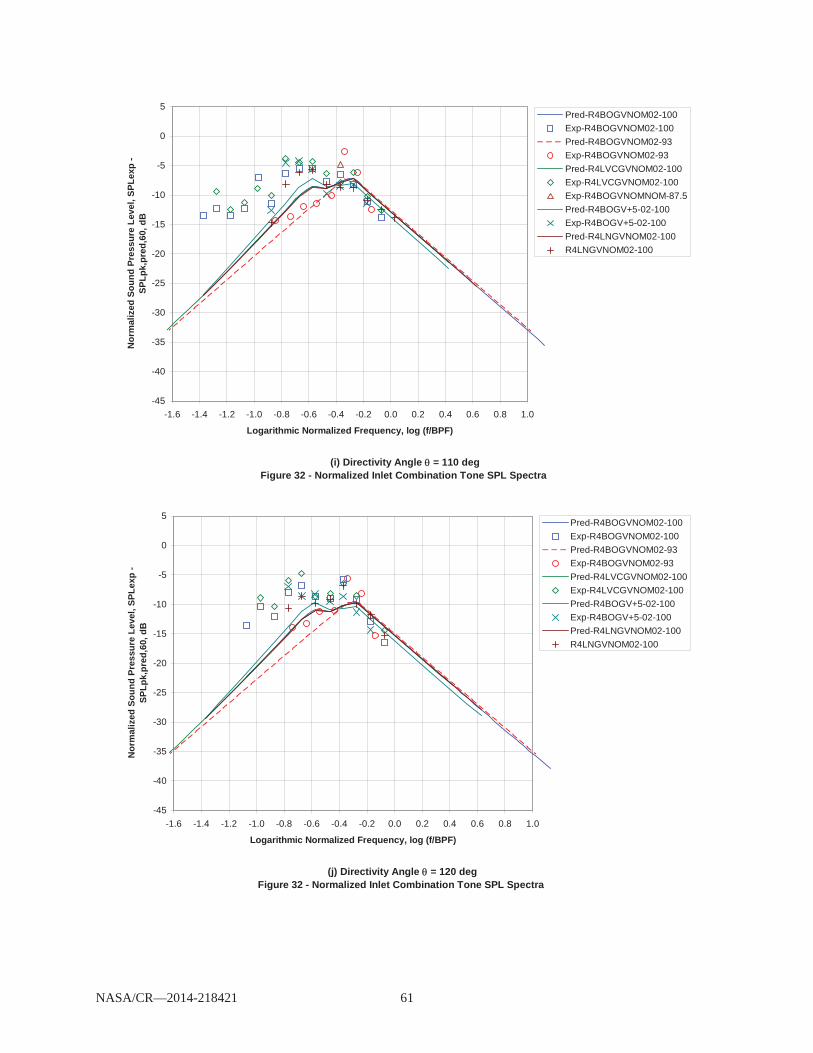
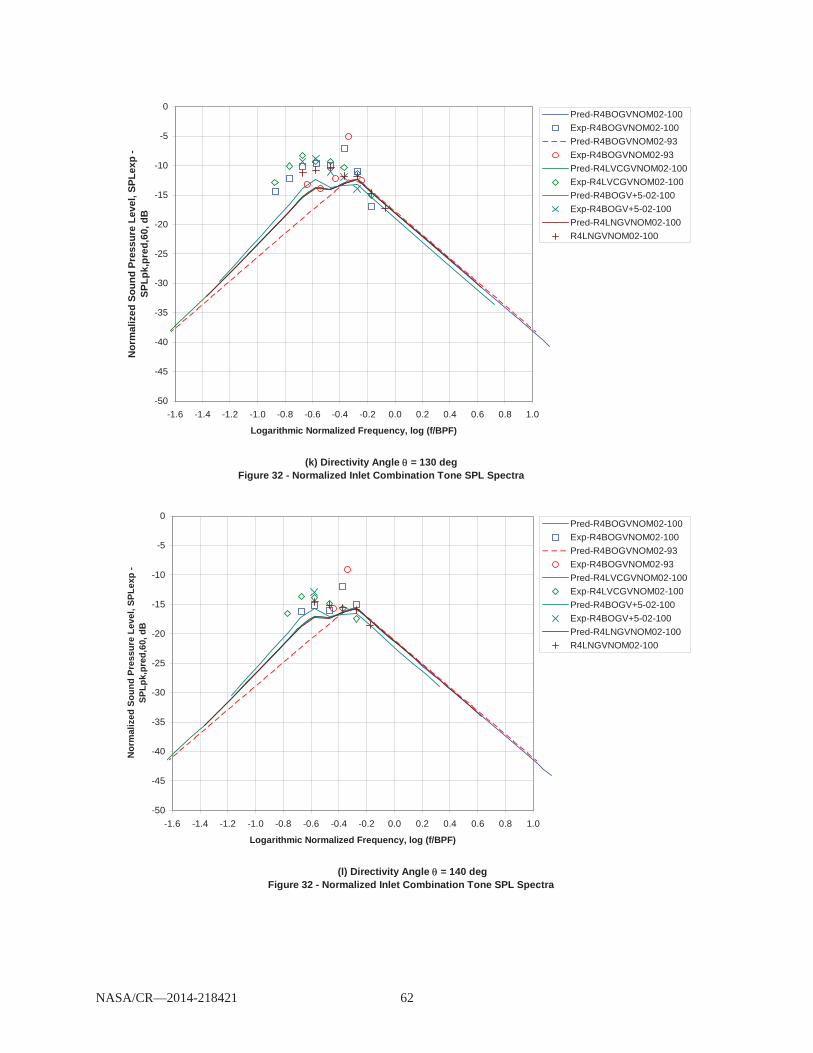
Similar plots for combination tones are shown in Figures 32(a) to (l). For this component the spectral shape varies with conditions due differing relative levels of the 1/2, 1/4 and 1/8 BPF peaks, so for each set of experimental extracted data there is a corresponding prediction. These relative contributions were adjusted from Heidmann to better agree with the data. Even with the increased predicted contribution of the 1/4 and 1/8 BPF peaks, it appears within the scatter that these sub-peaks are under-predicted, and the peaks do not always fall at the predicted 1/2, 1/4, and 1/8 BPF. However, the trends predicted with operating conditions are predicted roughly.
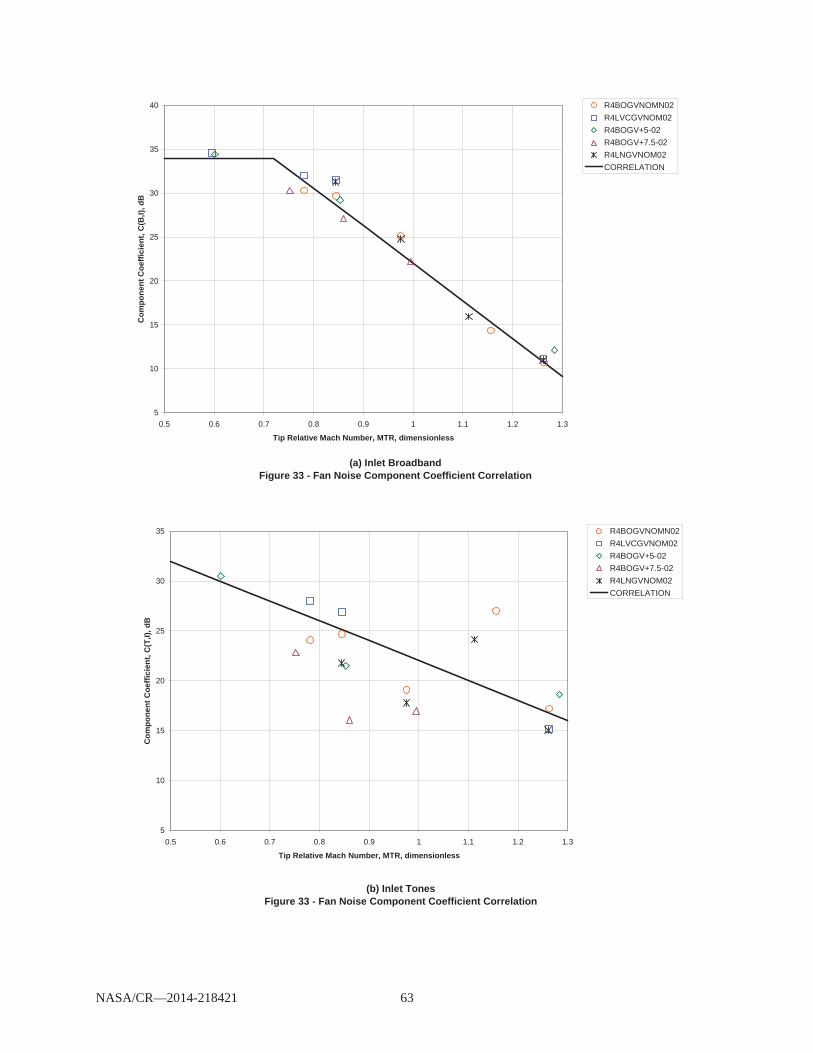
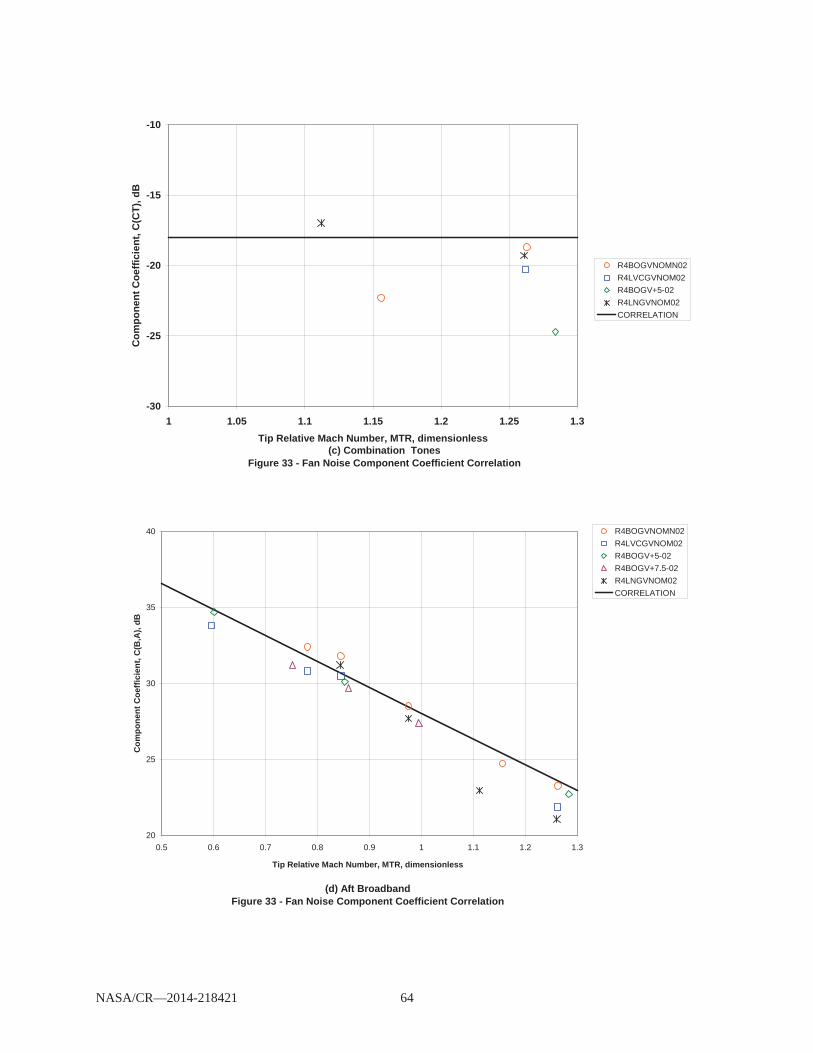
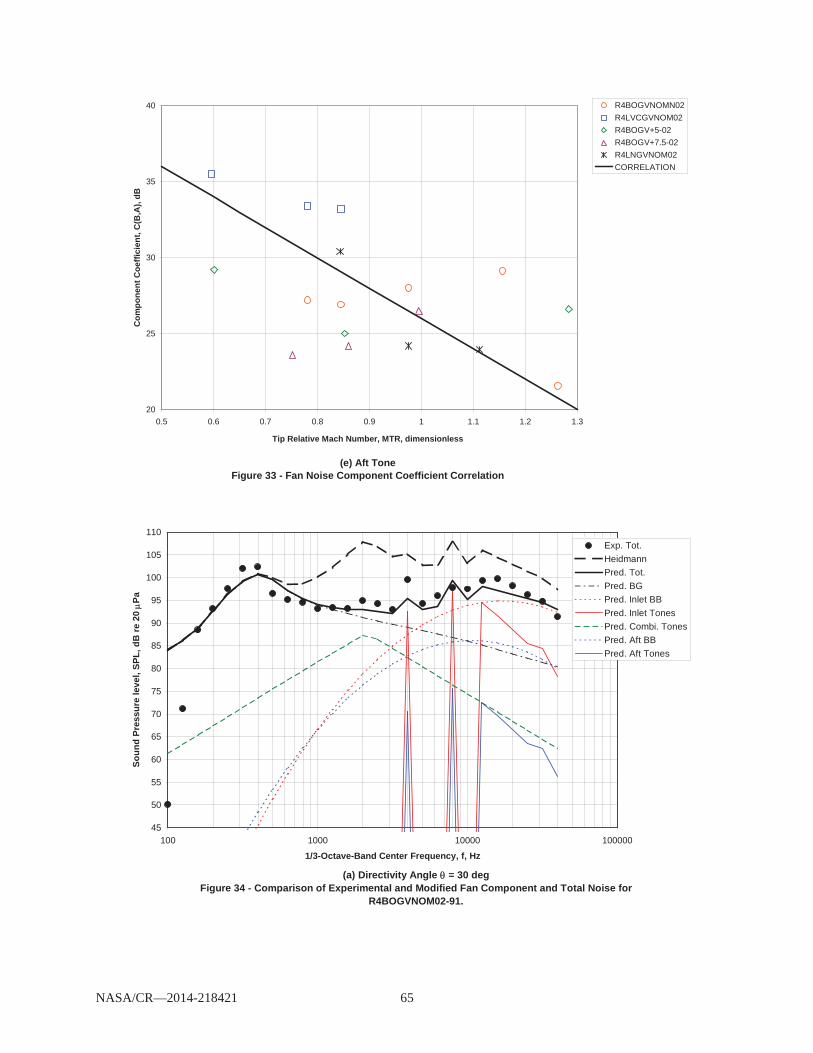
Having modified the spectral directivity relations for the fan noise components, the final step to developing the new predictive model is to determine the coefficients (actually logarithmic intercepts) for the level relations. The numerical values are dependent on changes made to the correlating equations. The results shown in Figure 33 for each component are consistent with the final relations. The coefficient, obtained by minimizing the error over the range this component is important, is plotted against tip relative Mach number, and the final correlating expressions are obtained by a an “eye-ball” simplified relation that agrees reasonably with the experimental results. The inlet broadband coefficients are plotted against tip relative Mach number in Figure 33(a); the correlating expression starts from a constant value at low MTR changing to a linear decrease with increasing MTR at higher speed. For inlet tones (Fig. 33(b)) a linear decrease across the full range is seen. For combination tones (Fig. 33(c)) there does not appear to be any systematic variation, so a constant is used. For the aft broadband (Fig. 33(d)) and tones (Fig. 33(e)), linearly decreasing relations are found.
NASA/CR—2014-218421 9
Revised Fan Noise Prediction The revised predictive relations evolved in the preceding section, along with changes to the basic
relations found to be appropriate, led to the new predictive procedure. Like the other prediction procedures, predictions are made for each of the fan noise components, i.e., inlet broadband, inlet tones, aft broadband, aft tones, and combination tones for supersonic fan tip speeds. For each component relations are derived for level, spectra and directivity. The 1/3 octave spectra at 1 Meter radius are given as a function of angle by the following equation where F1, F2, F3, F4, and F5 are defined for each component. SPL(f, ) @1 M. = 10 log10(m/mo) + 40 log10( T/ To)
+ F1(MTR) + F2(RSS) + F3( ) + F4(f/fb) Where: f = 1/3 octave center frequency, Hz. fb = blade passage frequency, Hz.
m = mass flow rate lb/sec (kg/sec) mo = reference flow rate. 1 lb/sec (.453 kg/sec) MTR = tip relative Mach number RSS = rotor stator spacing divided by fan blade chord, % SPL = 1/3 octave sound pressure level, re. 20 Pa T = total temperature rise across the fan, R, K To = reference fan total temperature rise, 1 R (.555 K) = angle from inlet axis, degrees. Inlet Broadband Noise: F1 = 34; MTR < .72 F1 = 34 -43(MTR - .72); MTR >= .72 F2 = - 5 log10RSS/300); For no inlet distortion present,
F2 = - 5 log10(RSS/300); For RSS < 100 and inlet distortion present, F2 = - 5 log10(100/300); For RSS >= 100 and inlet distortion present
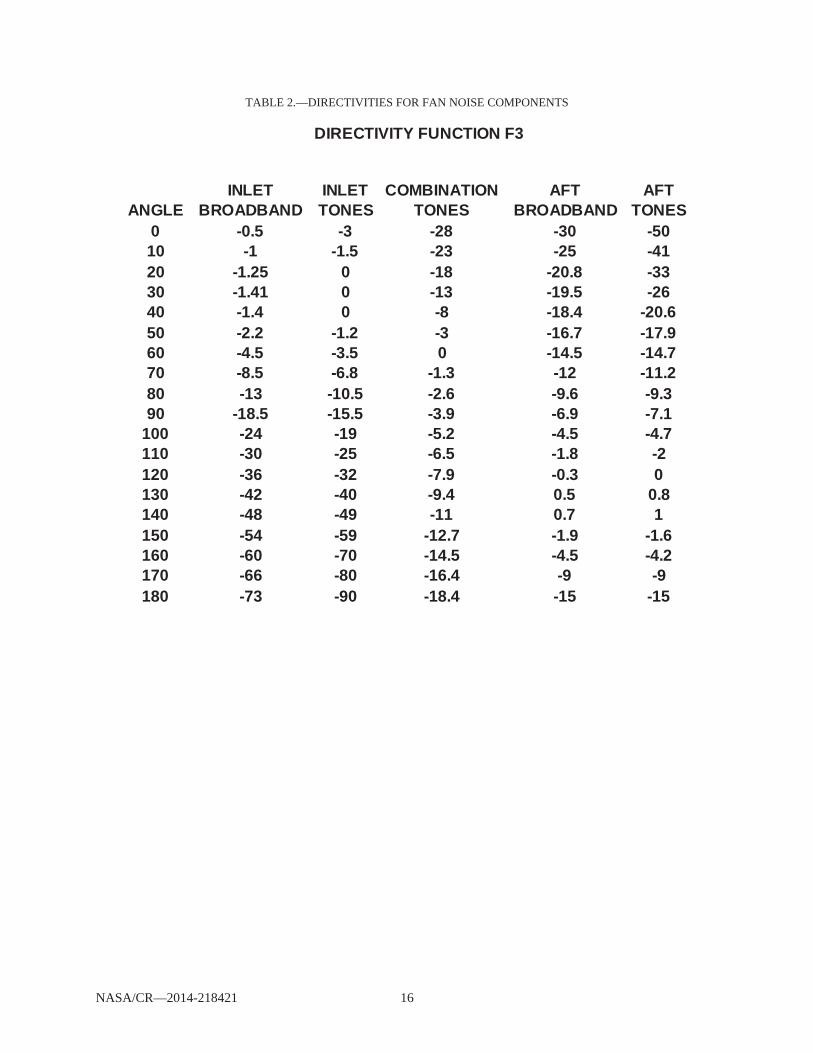
F2 = - 10 log10(RSS/300); For no inlet distortion present, F2 = - 10 log10(RSS/300); For RSS < 100 and inlet distortion present, F2 = - 10 log10(100/300); For RSS >= 100 and inlet distortion present F3 = Directivity (See Table 2) F4 = 0; k = 1, cut-on MTip /(1- VNumber/BNumber) > 1.05 or MTip > 1.05 = -8; k = 1, cut-off MTip /(1- VNumber/BNumber) < 1.05 and MTip < 1.05 = 3- 3k; k > 1
Where k is harmonic number
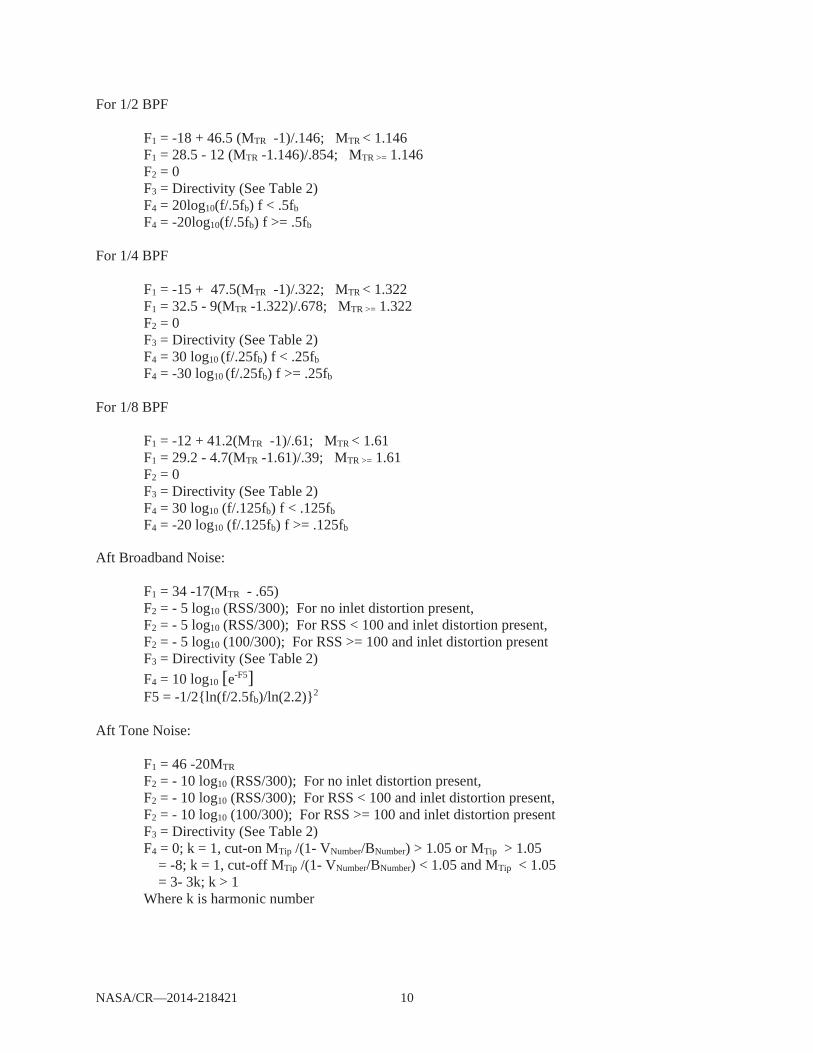
Combination Tones: The combination tone model consists of three spectra, one peaking at 1/2 BPF, one at 1/4 BPF, and one at 1/8 BPF.
NASA/CR—2014-218421 10
For 1/2 BPF F1 = -18 + 46.5 (MTR -1)/.146; MTR < 1.146 F1 = 28.5 - 12 (MTR -1.146)/.854; MTR >= 1.146
F2 = 0 F3 = Directivity (See Table 2) F4 = 20log10(f/.5fb) f < .5fb F4 = -20log10(f/.5fb) f >= .5fb For 1/4 BPF F1 = -15 + 47.5(MTR -1)/.322; MTR < 1.322 F1 = 32.5 - 9(MTR -1.322)/.678; MTR >= 1.322
F2 = 0 F3 = Directivity (See Table 2) F4 = 30 log10 (f/.25fb) f < .25fb F4 = -30 log10 (f/.25fb) f >= .25fb For 1/8 BPF F1 = -12 + 41.2(MTR -1)/.61; MTR < 1.61 F1 = 29.2 - 4.7(MTR -1.61)/.39; MTR >= 1.61
F2 = 0 F3 = Directivity (See Table 2) F4 = 30 log10 (f/.125fb) f < .125fb F4 = -20 log10 (f/.125fb) f >= .125fb
Aft Broadband Noise: F1 = 34 -17(MTR - .65) F2 = - 5 log10 (RSS/300); For no inlet distortion present, F2 = - 5 log10 (RSS/300); For RSS < 100 and inlet distortion present, F2 = - 5 log10 (100/300); For RSS >= 100 and inlet distortion present F3 = Directivity (See Table 2) F4 = 10 log10 [e-F5] F5 = -1/2{ln(f/2.5fb)/ln(2.2)}2
Aft Tone Noise: F1 = 46 -20MTR
F2 = - 10 log10 (RSS/300); For no inlet distortion present, F2 = - 10 log10 (RSS/300); For RSS < 100 and inlet distortion present, F2 = - 10 log10 (100/300); For RSS >= 100 and inlet distortion present F3 = Directivity (See Table 2)
F4 = 0; k = 1, cut-on MTip /(1- VNumber/BNumber) > 1.05 or MTip > 1.05 = -8; k = 1, cut-off MTip /(1- VNumber/BNumber) < 1.05 and MTip < 1.05 = 3- 3k; k > 1
Where k is harmonic number
NASA/CR—2014-218421 11
While the measured aft broadband levels for the low vane count (26 vane) stator appear to be lower then those measured for the baseline (54 vane) stator at some frequencies, including a reduction based on vane count increases the average difference between the data and the predictions. Obviously the effect of vane count is more complex then a simple level adjustment. Thus no adjustment for vane count is included in the model. This prediction procedure is based on data from fans without inlet guide vanes and the data is assumed to be free of contributions due to inlet distortion. For fans with inlet guide vanes and/or distortions, Heidmann’s equations for rotor-stator spacing and the effect of distortion on tones should be used.
Comparison of Revised Model With Data Comparison With R4 Rotor Data
Comparisons were made with five different configurations of the R4 rotor, all with 0.02-in. tip clearance: (1) The baseline OGV (54 vanes) with the nominal nozzle (labeled R4BOGVNOM02) (2) The baseline OGV (54 vanes) with the design point nozzle (area increased 5 percent over the nominal
nozzle (labeled R4BOGV+5-02)) (3) The baseline OGV (54 vanes) with the high flow nozzle (area increased 7.5 percent over the nominal
nozzle (labeled R4BOGV+75-02)) (4) The low vane count OGV (26 vanes) with the nominal nozzle (labeled R4LVCGVNOM02) (5) The low noise OGV (26 swept vanes) with the nominal nozzle (labeled R4LNGVNOM02)
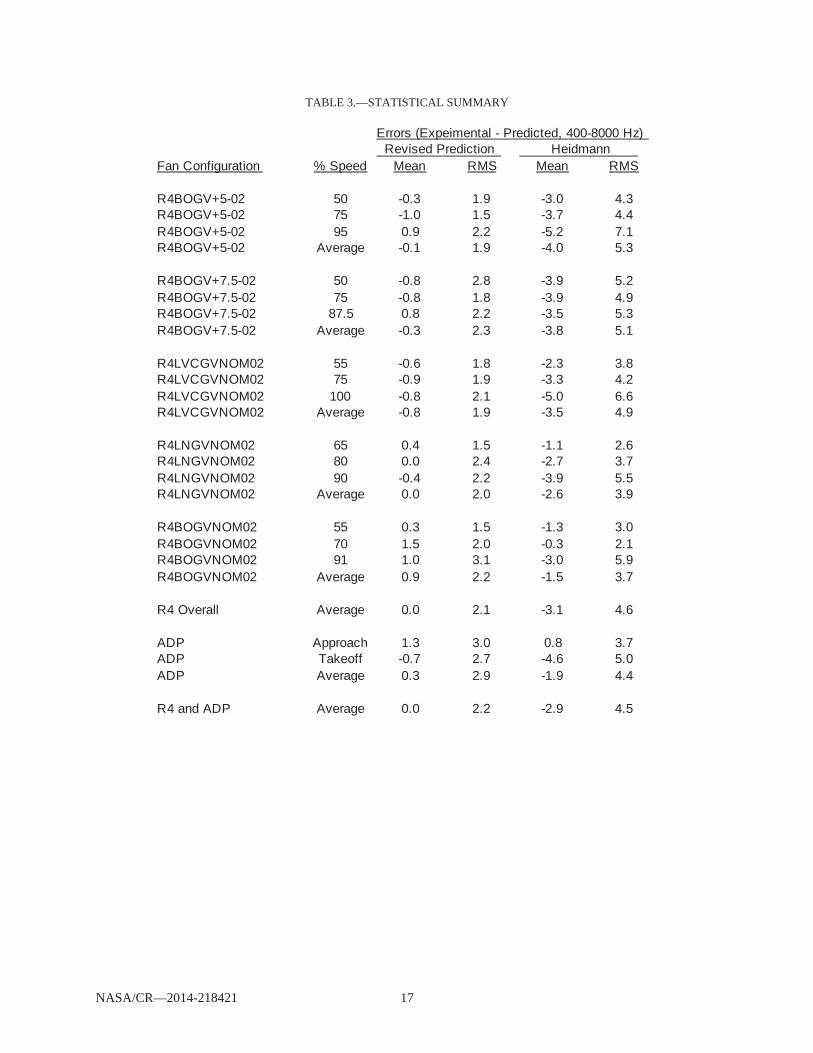
One sample is shown for each configuration, but more comparisons were made, as summarized statistically in Table 3. In these comparisons the experimental spectra are compared with total predicted from the jet/background noise model plus the revised model or the Heidmann model. For the revised models, the predicted contributions of all the fan noise constituents are also shown.
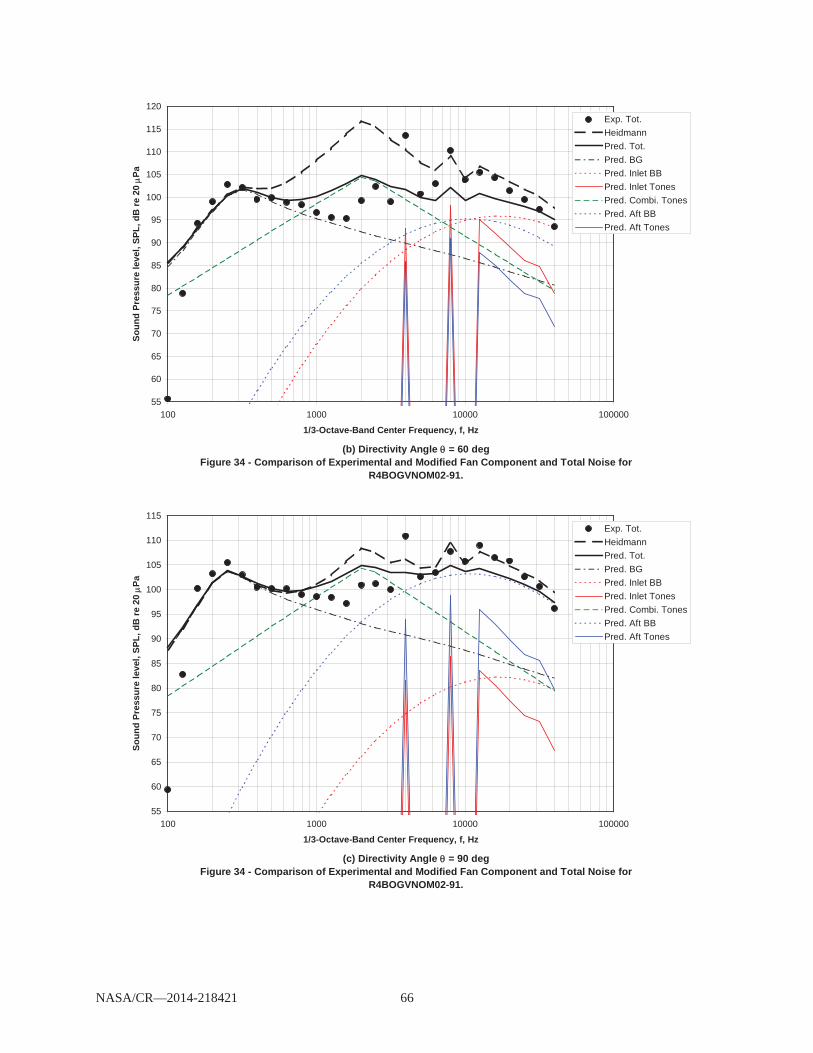
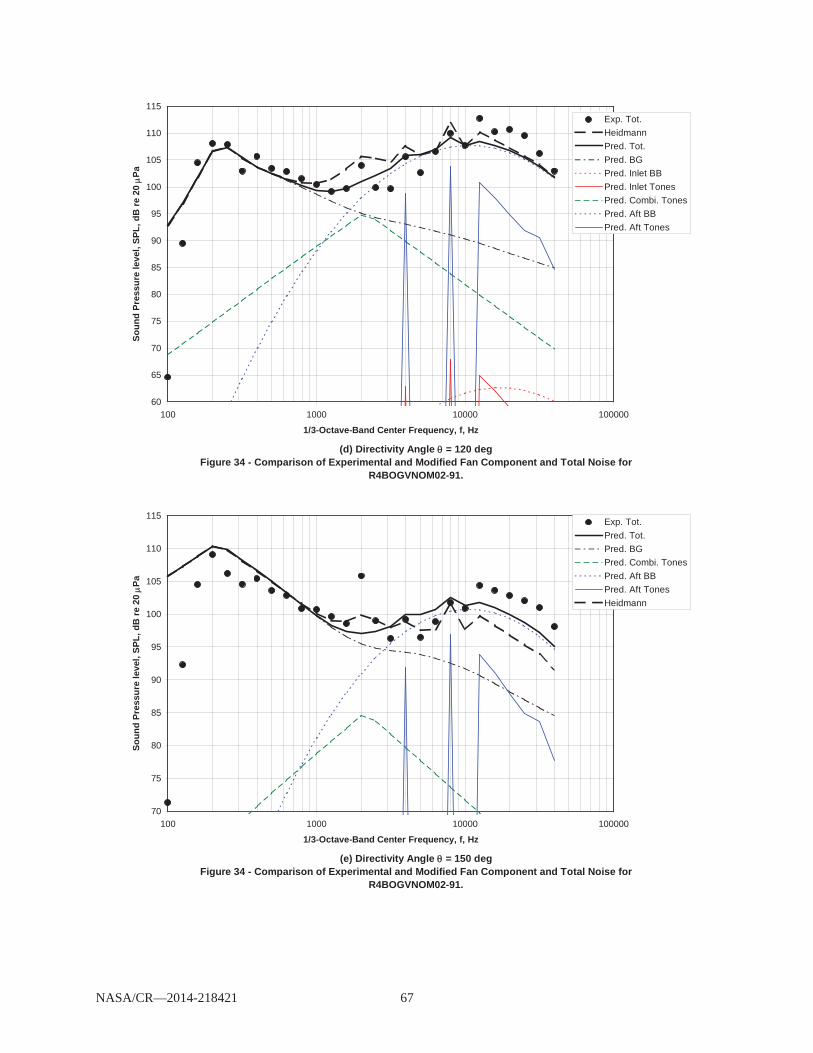
The first comparison shown is for R4BOGVNOM02 at 91 percent speed, a high enough tip speed for combination tones to be present, in Figures 34(a) to (e) at angles of 30, 60, 90, 120 and 150 deg. At
= 30 deg (Fig. 34(a)) the 100 and 125 Hz experimental SPLs appear quite low, as will be seen in all comparisons, so they will not be further considered. At about 1000 Hz and below the jet/background noise is clearly dominant. The revised model agrees very well with the data except that the fundamental tone at 4000 Hz. is under-predicted by about 4 dB, whereas the Heidmann model over-predicts across the spectrum. At = 60 deg (Fig. 34(b)) the agreement is not as good. The first and second harmonic are on the order of 10 dB higher than predicted. The combination tone noise is somewhat over-predicted, and the broadband plus tone noise is under-predicted. The Heidmann model agrees better with the high frequency data, but greatly over-predicts combination tones. Similar observations, though not quite so pronounced, can be made at = 90 deg (Fig. 34(c)). In the aft quadrant, = 120 deg and 150 (Figs. 34(d) and (e)) the agreement is better, although not as good as desired, and the sharp tone at = 150 and 2000 Hz is well above either the revised or Heidmann predictions. Overall, in comparison with the revised model the SPLs at all angles and frequencies of 400 Hz and higher, the experimental data are 1.0 dB above predicted with an RMS error of 3.1 dB. This is the worst agreement seen in these comparisons. The Heidmann model over-predicts the experimental data by an average of 3.0 dB with an RMS error of 5.9 dB, so even in this worst case, the errors are about half those seen with the Heidmann model.
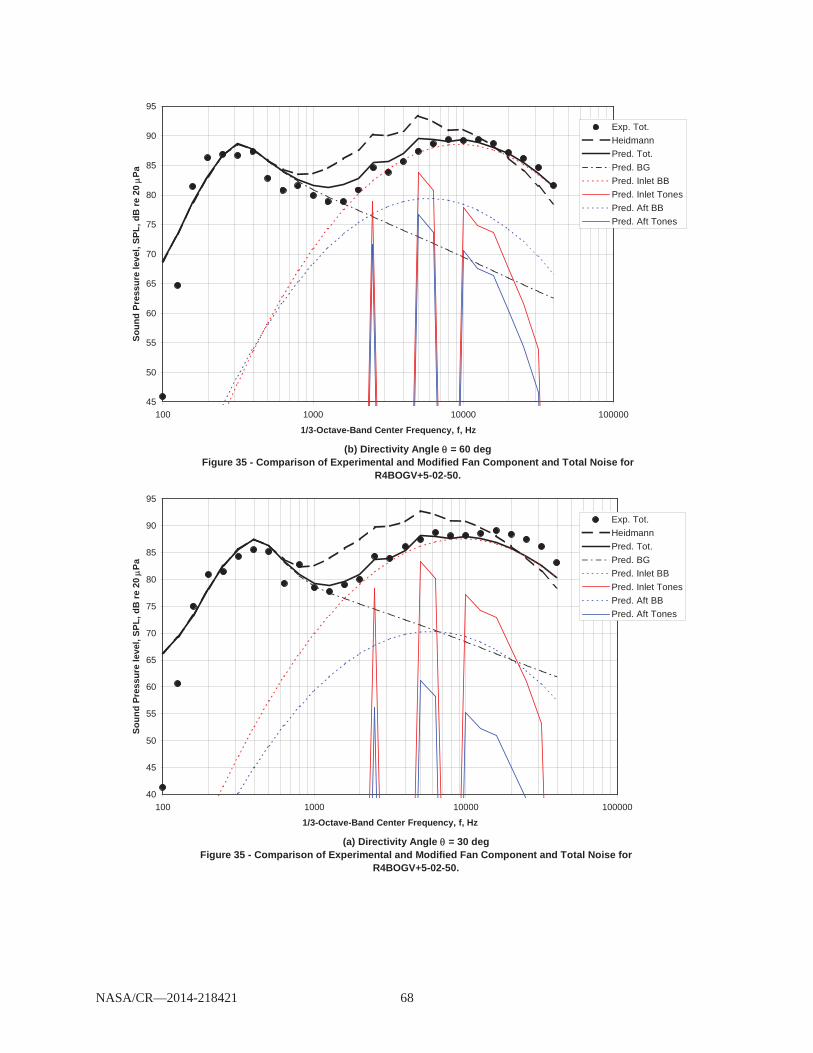
For R4BOGV+5-02, comparison is made at the very low speed of 50 percent in Figure 35 at the same angles as the previous figure. At = 30 deg (Fig. 35(a)) the agreement is excellent up to 10,000 Hz, with the higher frequency broadband noise slightly under-predicted. The Heidmann model significantly over-predicts for around 10,000 Hz and below. At = 60 deg (Fig. 35(b)) the revised model slightly over-predicts below 8,000 Hz and agrees almost perfectly at higher frequencies. The Heidmann model again under-predicts over most of the spectrum, but under-predicts somewhat at the highest frequencies.
NASA/CR—2014-218421 12
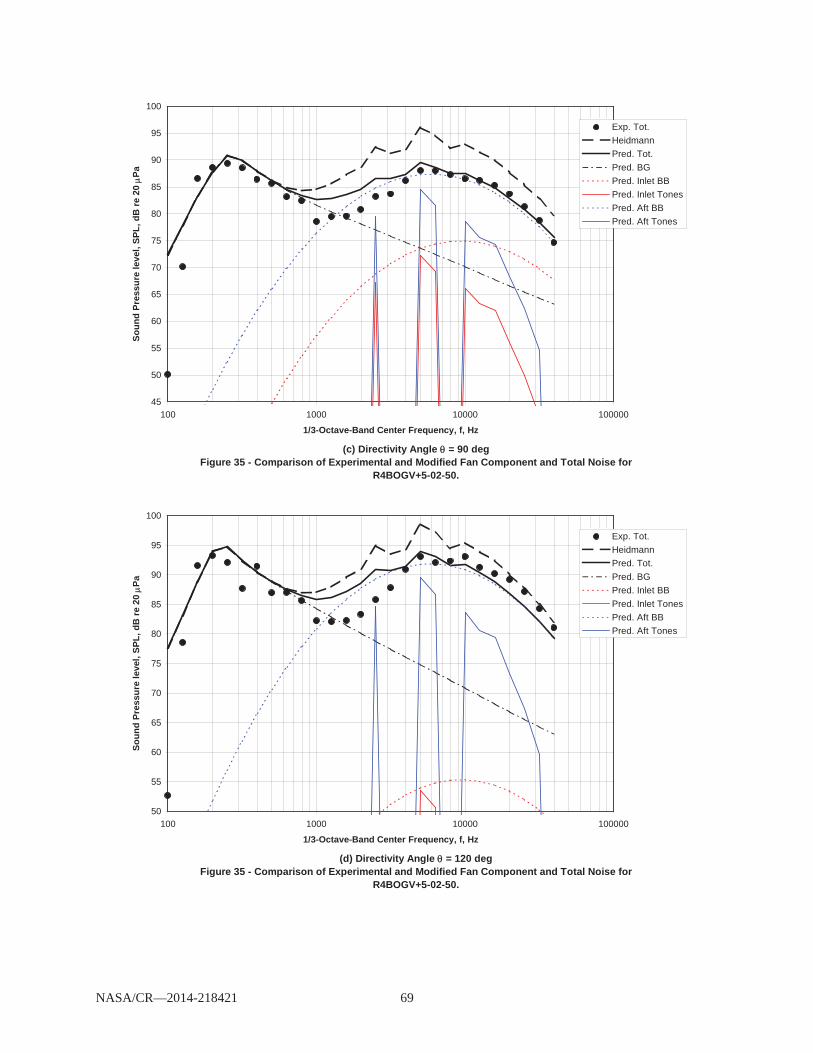
At = 90 deg (Fig. 35(c)) similar comments can be made regarding the revised model, but he Heidmann model over-predicts at all frequencies. At = 120 deg (Fig. 35(d)) the agreement is not as good, with as much as a 5 dB over-prediction in the vicinity of 2,000 Hz, whereas the Heidmann model over-predicts except at the highest frequencies. At = 150 deg (Fig. 35(e)) the two predictive models give similar results and only rough agreement with the experimental data. For the revised model the average over-prediction is 0.3 dB and the RMS error is 1.9 dB, while for the Heidmann model the over-prediction is 3.0 dB and the RMS error is 4.3 dB.
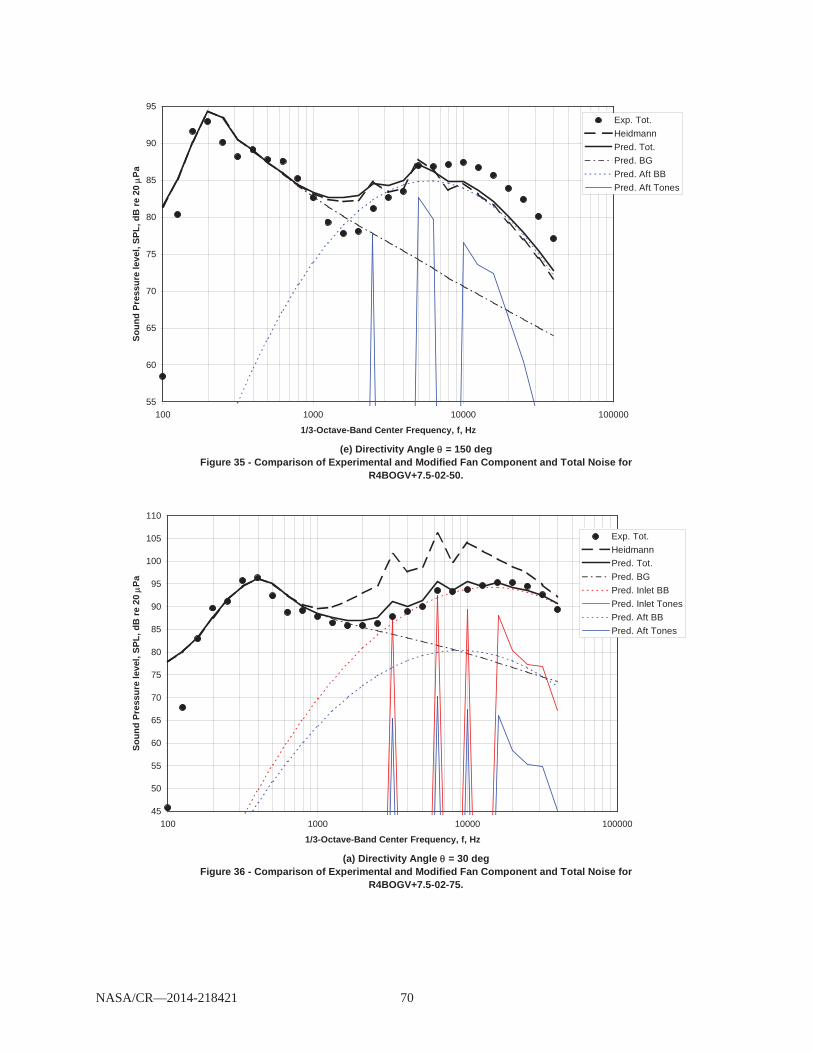
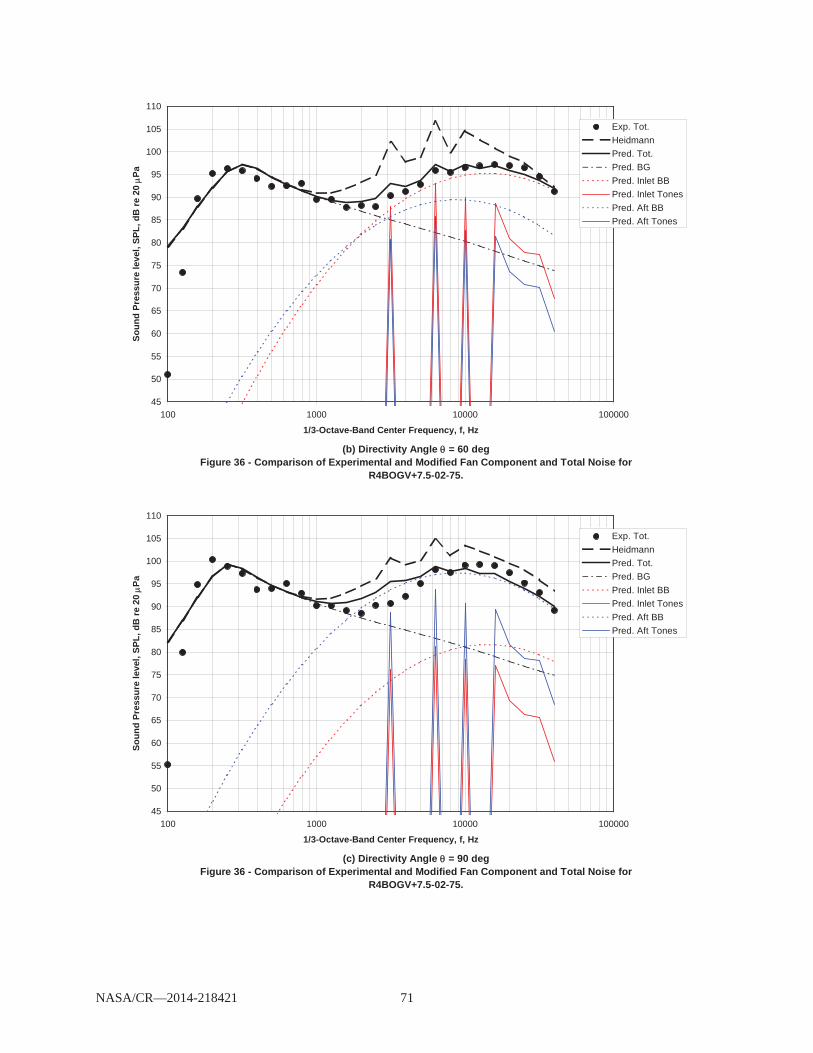
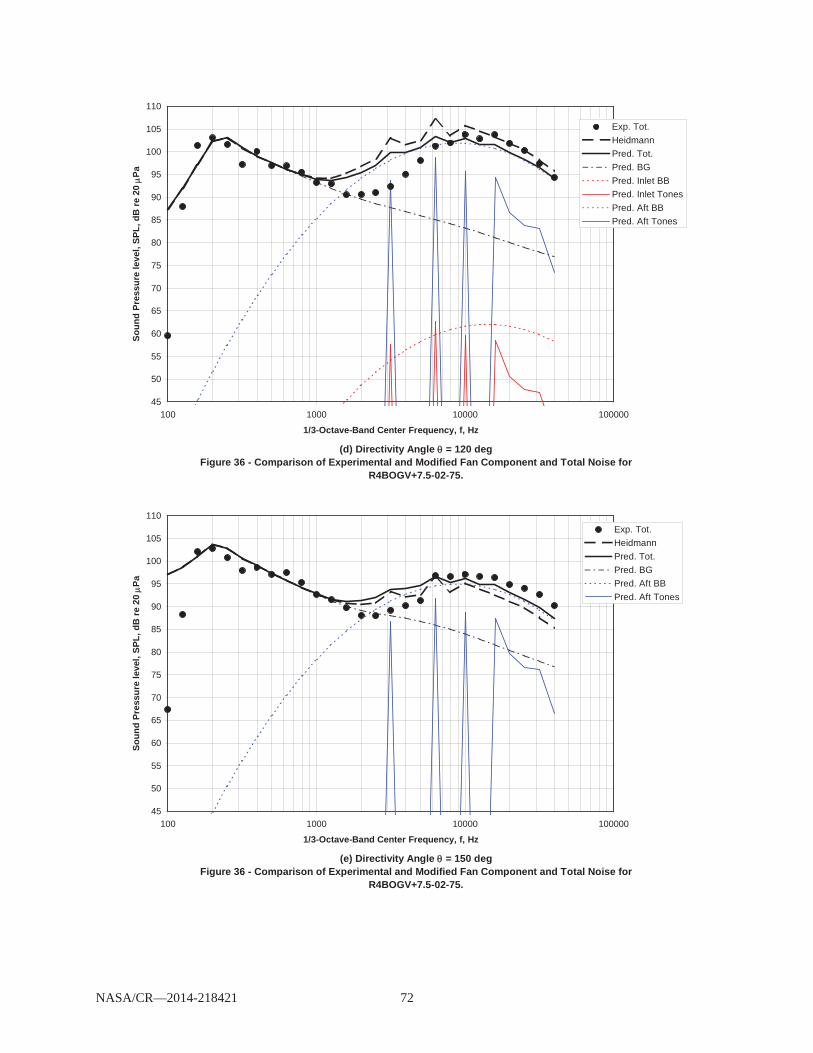
For R4BOGV+7.5-02, comparison is made at the intermediate 75 percent speed in Figure 36. At = 30 deg (Fig. 36(a)) the agreement with the revised model is rather good, except for modest over-
prediction of the first and second harmonics, while the Heidmann model significantly over-predicts both tone and broad-band levels. Very similar observations can be made at = 60 deg (Fig. 36(b)). At
= 90 deg (Fig. 36(c)) the revised model over-predicts the broadband noise at lower frequencies and under-predicts it at high frequency with reasonable agreement in the middle range, while again the Heidmann model over-predicts across the spectrum. At = 120 deg (Fig. 36(d)) the same qualitative comments can be made for the revised model, but the magnitude of the disagreement is greater, especially in the lower frequency range. The Heidmann model continues to over-predict more than the revised model at low to middle frequencies, but at high frequencies it agrees better. At = 150 deg (Fig. 36(e)) the agreement with both models is fair, with the Heidmann model agreeing better in the lower frequency range and the revised model doing better at higher frequencies. For the revised model the average over-prediction is 0.8 dB and The RMS error is 1.8 dB, while for the Heidmann model the corresponding measures are 3.9 and 4.9 dB.
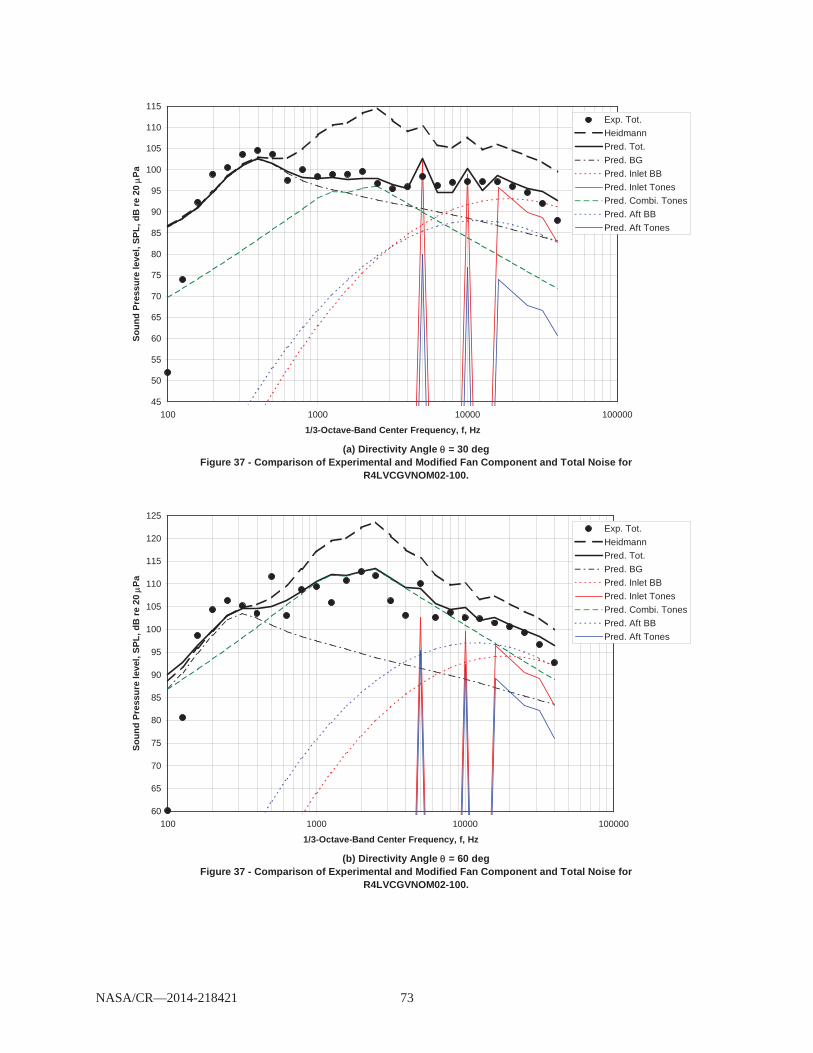
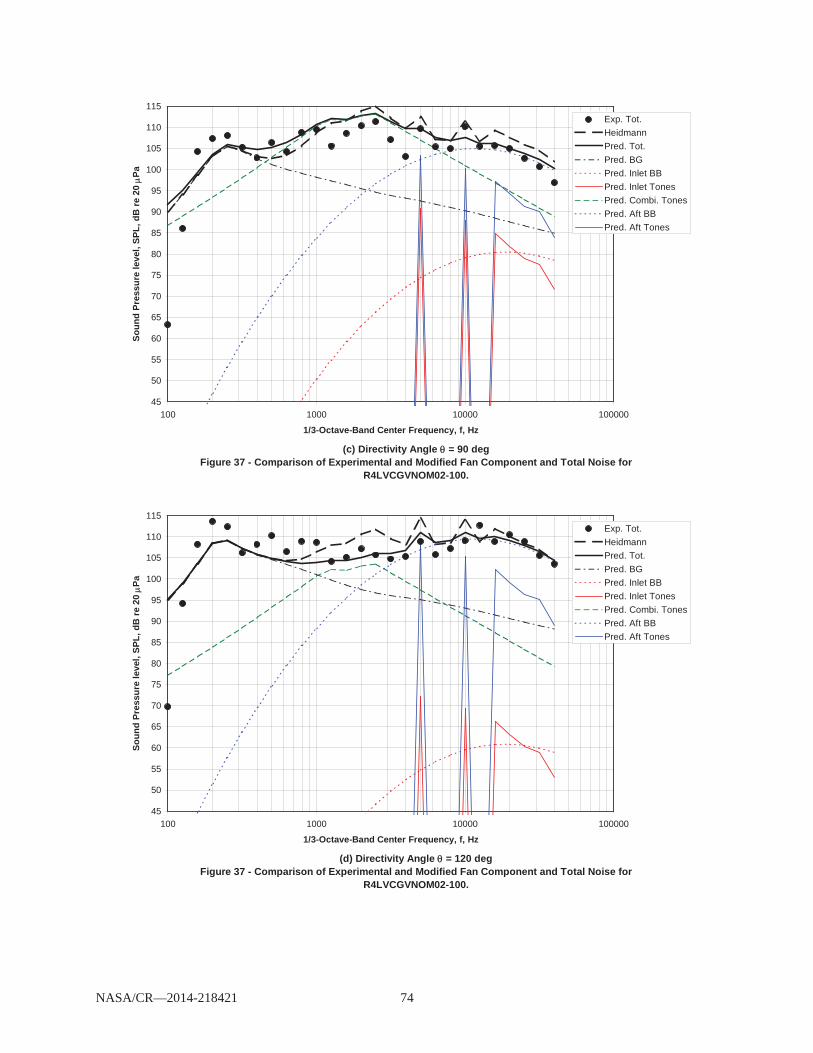
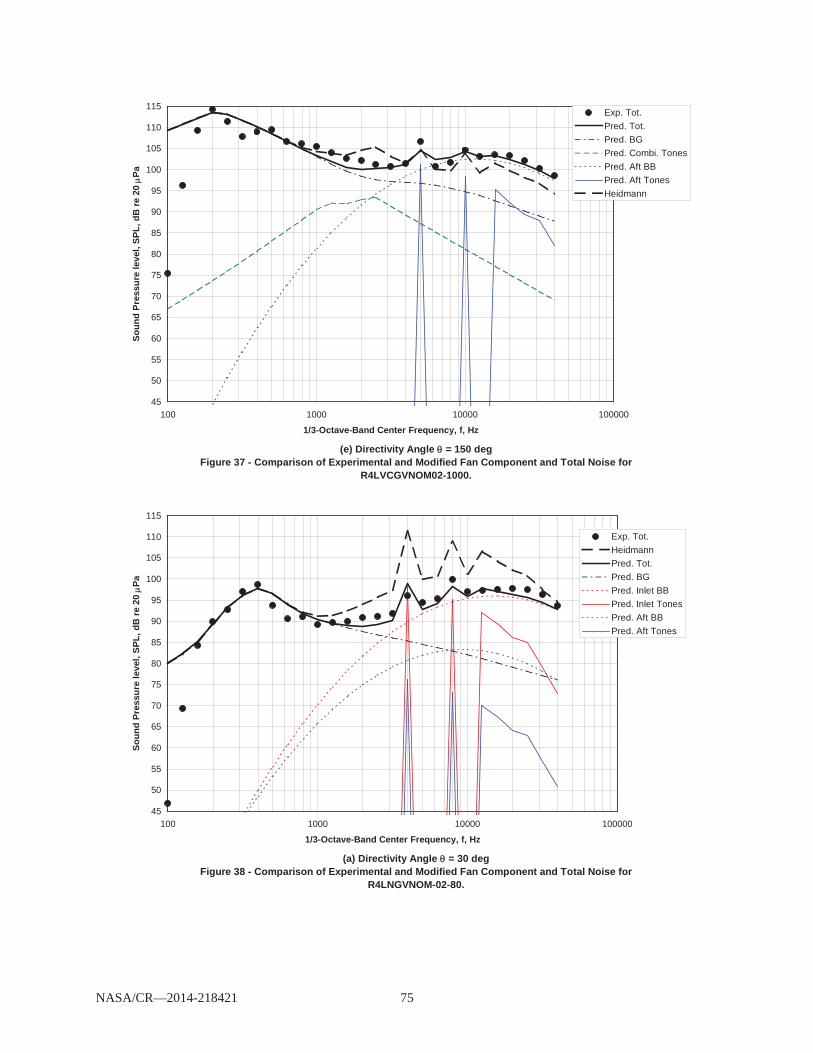
For R4LVCGVNOM02, comparison is made at 100 percent speed, where combination tones are dominant over much the spectral directivity range. At = 30 deg (Fig. 37(a)) the agreement with the revised model is very good, but with a slight over-prediction of the tones, while the Heidmann model over-predicts across the spectrum. At = 60 deg (Fig. 37(b)) the agreement with the revised model is fairly good considering difficulty in dealing with the combination tones, and again the Heidmann model over-predicts across the spectrum. At = 90 deg (Fig. 37(c)) there is rough agreement with both models, probably slightly better for the revised model. At = 120 deg (Fig. 37(d)) there is rather good agreement with the revised model and slightly less-good agreement with the Heidmann model. At = 150 deg (Fig. 37(e)) there is very good agreement with the revised model and, again, slightly less-good agreement with the Heidmann model. For the revised model the average over-prediction is 0.8 dB and the RMS error is 2.1 dB, while for the Heidmann model the corresponding measures are 5.0 and 6.6 dB.
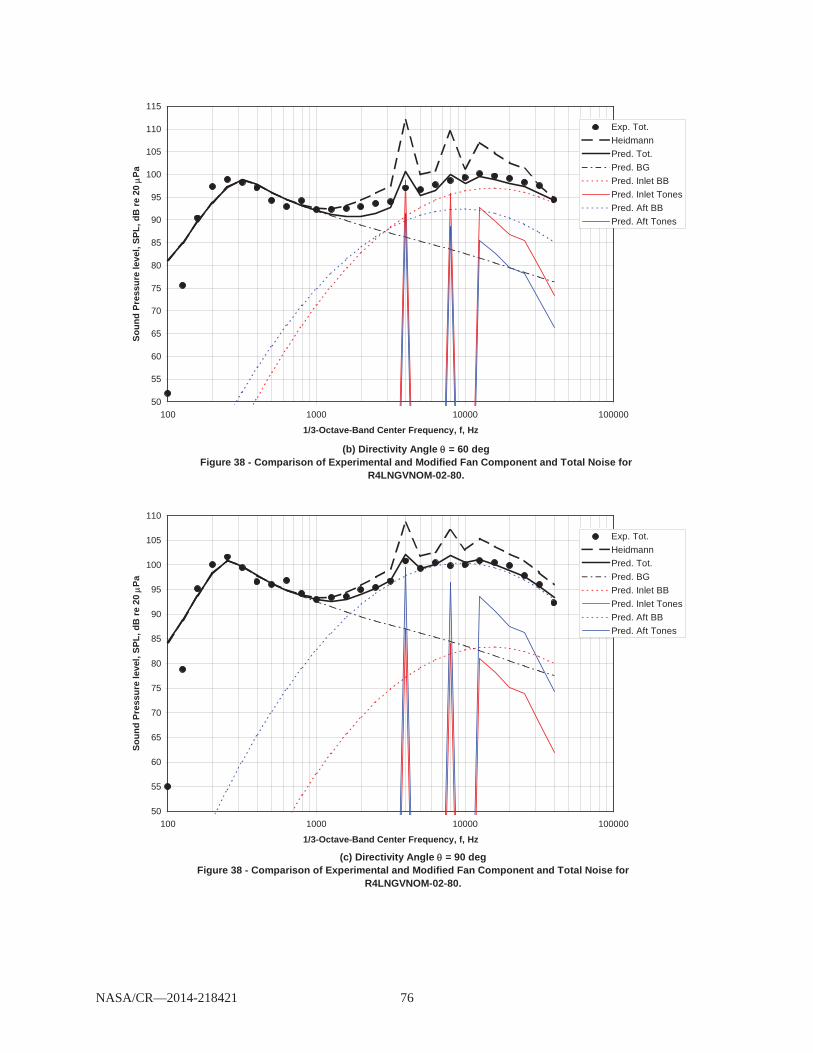
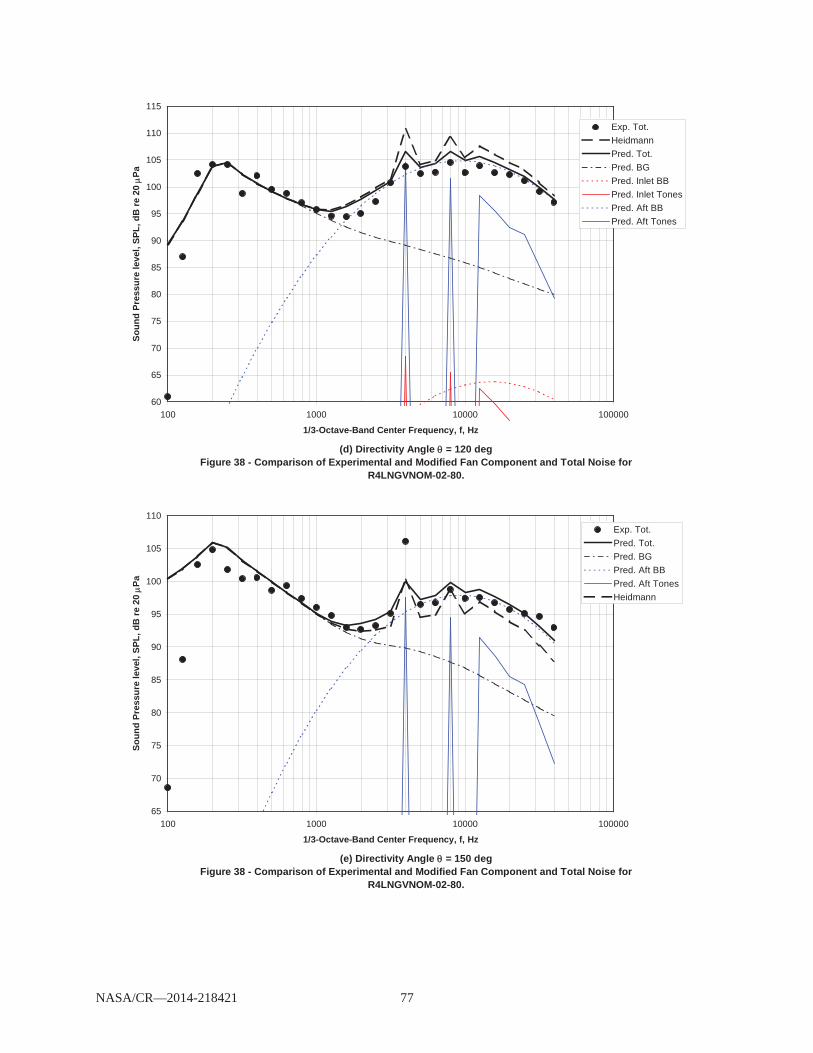
For R4LNGVNOM02, the comparison is made at 80 percent speed in Figure 38. At = 30 deg (Fig. 38(a)) the agreement with the revised model is very good, while the Heidmann model over-predicts across the spectrum. At = 60 deg (Fig. 38(b)) the agreement, while still good with the revised model, is not quite so good, and again the Heidmann model over-predicts except at the highest frequency. At
= 90 deg (Fig. 38(c)) the agreement with the revised model is excellent, while the Heidmann model over-predicts across the spectrum. At = 120 deg (Fig. 38(d)) there is a slight over-prediction for the revised model, but not as great as for the Heidmann model. At = 150 deg (Fig. 38(e)) falls mainly between the two predictive models, except for the fundamental tone which is about 6 dB above both predictions. For the revised model the average over/under-prediction is 0.0 dB and the RMS error is 2.4 dB, while for the Heidmann model the corresponding measures are 2.7 dB (over-prediction) and 3.7 dB.
The statistical results are summarized in Table 3. For each comparison the mean and RMS errors are given for both the revised model and the Heidmann model. Comparisons with ADP fan data are also included. It is clear that the revised model offers a significant advancement in statistical accuracy, which is not surprising in view of the many problems influencing the experimental data available to Heidmann.
NASA/CR—2014-218421 13
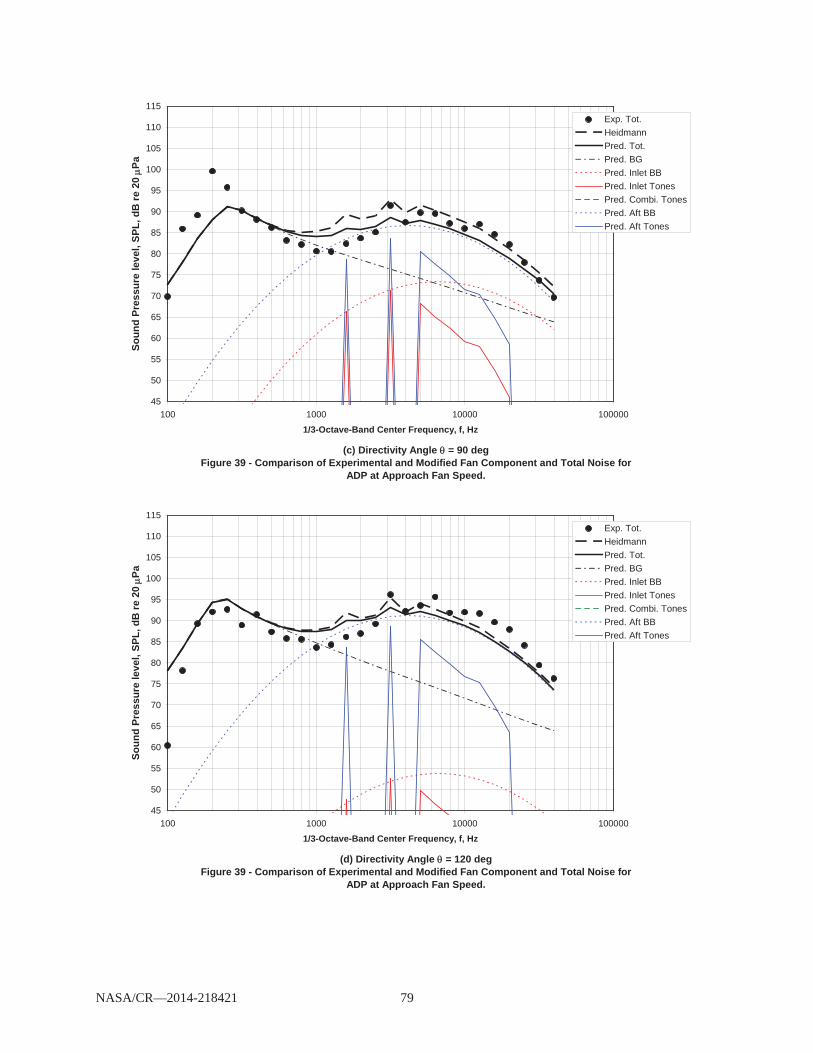
Comparison With ADP Data
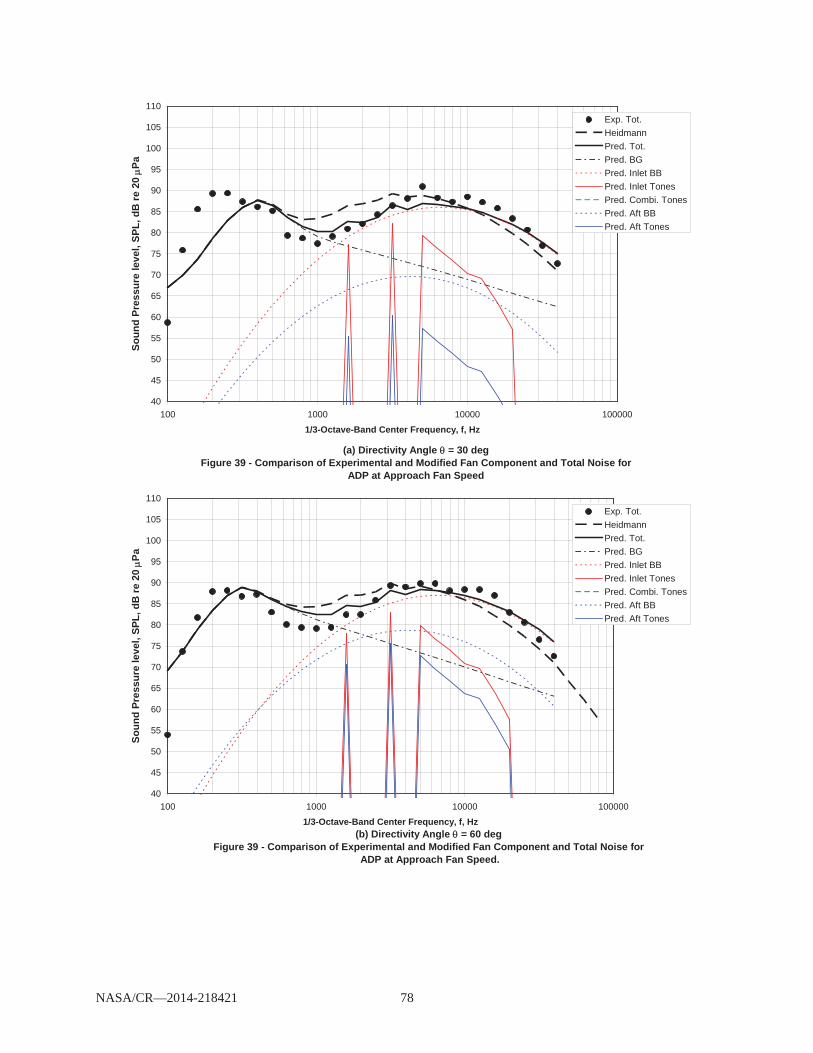
To check on the generality of the revised fan noise prediction model, comparisons were made with data from a different fan. This fan, referred to as ADP or Advanced Ducted Propeller, was designed by Pratt and Whitney with a fan pressure ratio of 1.285 at takeoff and a design tip relative Mach number of 0.91. This compares with the R4 fan which was designed by General Electric with a fan pressure ratio of 1.51 at takeoff and a design tip relative Mach number 1.26.
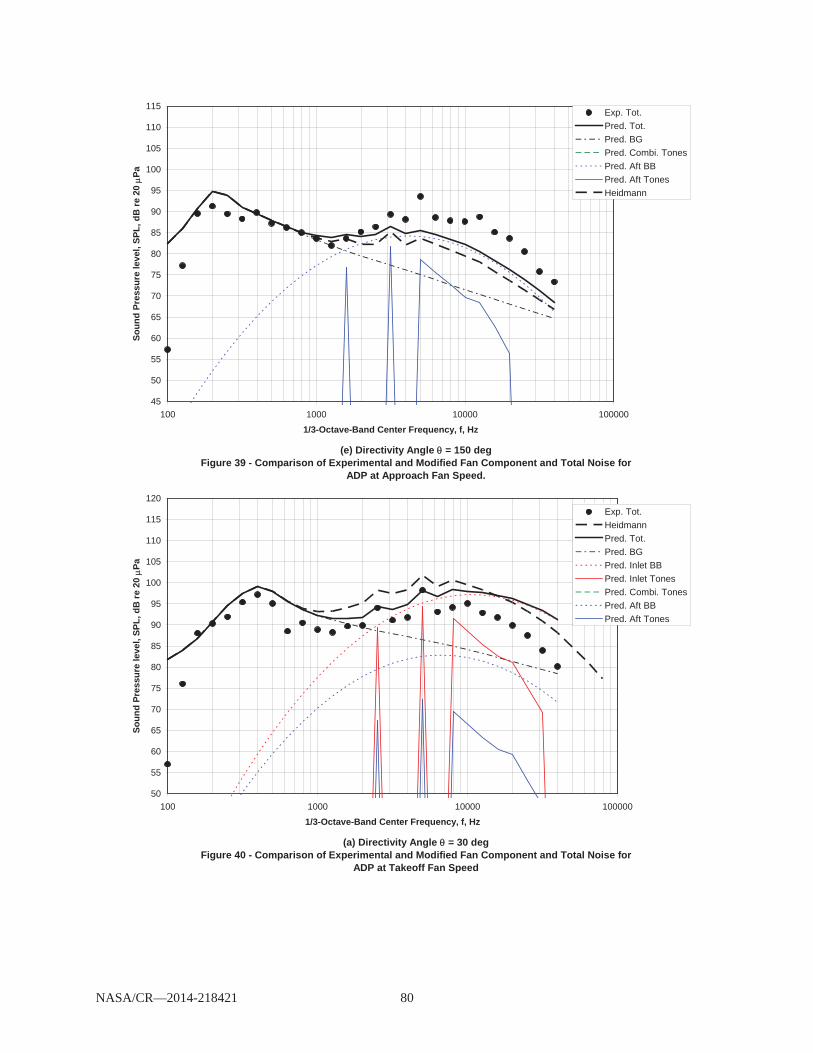
Comparison of measured and predicted levels are shown in Figure 39 at approach conditions. Predicted total levels with both the current method and the Heidmann method are shown. The jet and scrubbing noise models are the same for both fan noise models, thus the identical results at low frequencies. The curve labeled pred. fan is the predicted fan noise using the current model. At 30 degrees the current model is in better agreement with the data at frequencies at and below the 2nd fan harmonic. At mid frequencies, the Heidmann method provides a better prediction but the current model is better at high frequencies.
At 60 degrees the current model does a better job over most of the frequency range. At 90 degrees the current model is better below the second harmonic and the Heidmann model ids better above the third harmonic. At 120 degrees the Heidmann model is slightly better over most of the frequency range. At 150 degrees both models under-predict the measured levels with the current model being slightly better.
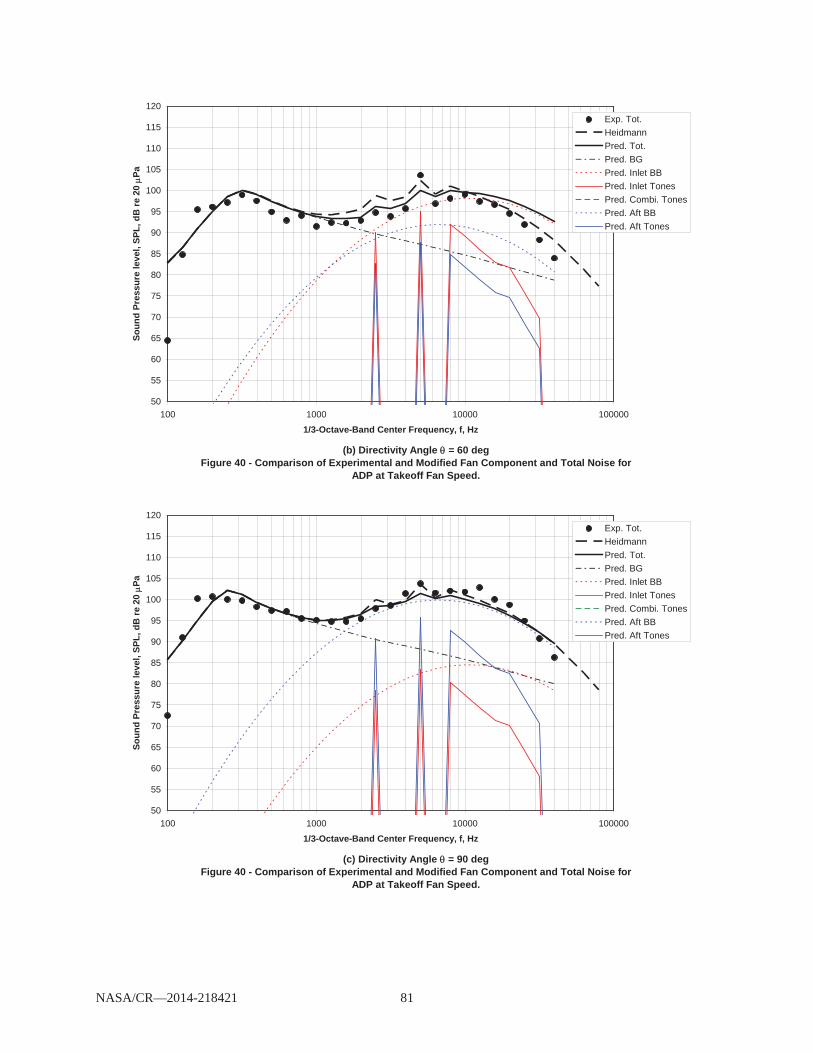
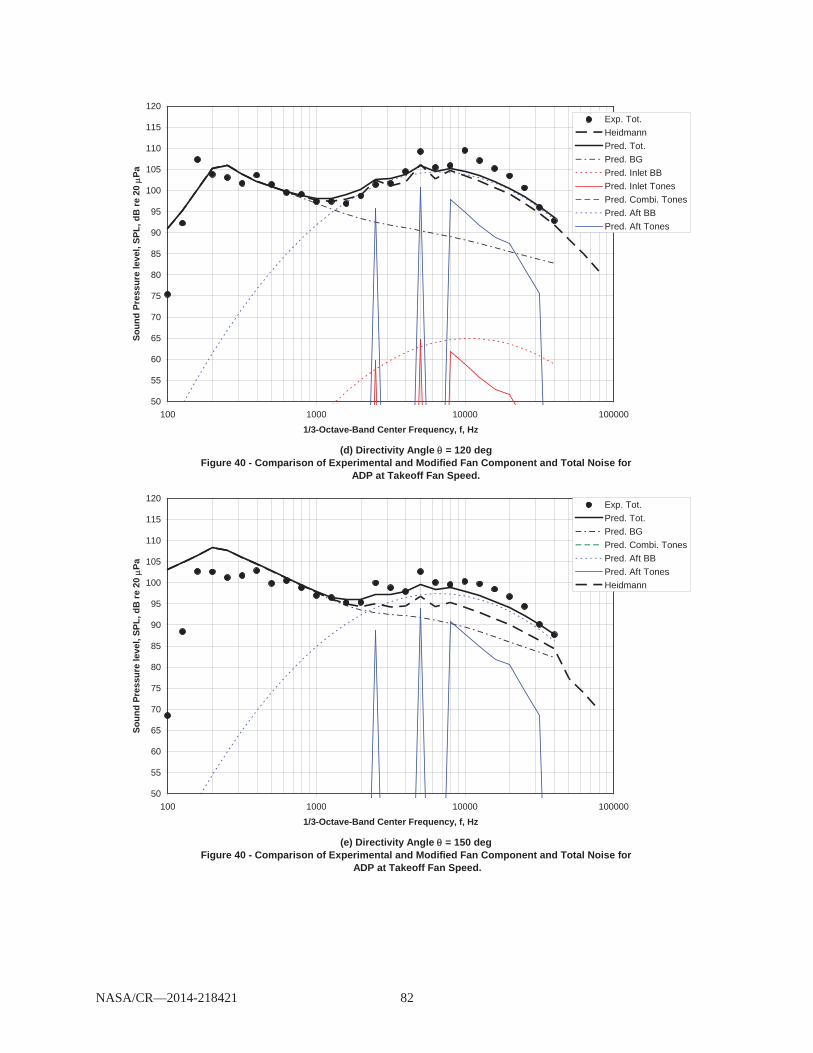
In Figure 40 comparisons with ADP data at takeoff are shown. At 30 degrees, both models over-predict the broadband fan noise levels At 60 degrees both models predict levels reasonably close to the data with the current model doing better at frequencies below the second harmonic and the Heidmann model doing better above the third harmonic. At 90 degrees, again both models agree reasonably well with the data, with the Heidmann model being slightly better. At 120 degrees the two models predict nearly identical levels with both under-predicting the higher frequency levels. At 150 degrees, the current predictions are closer to the data but are several dB low at intermediate frequencies.
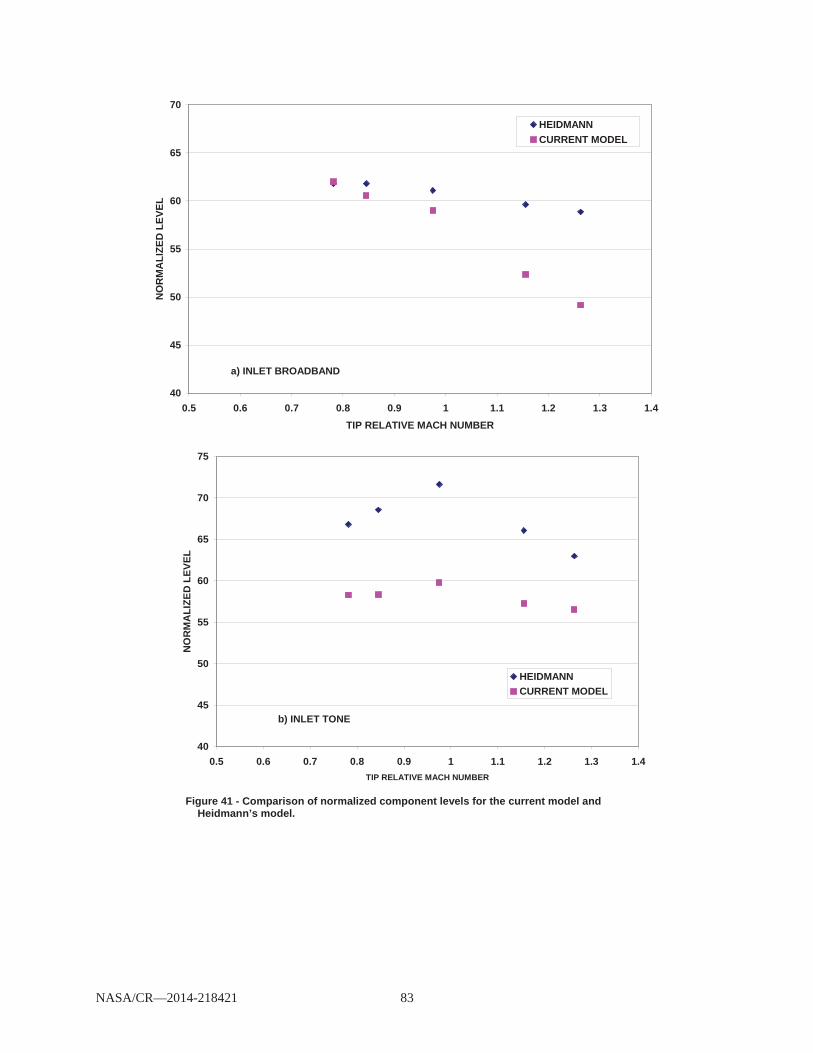
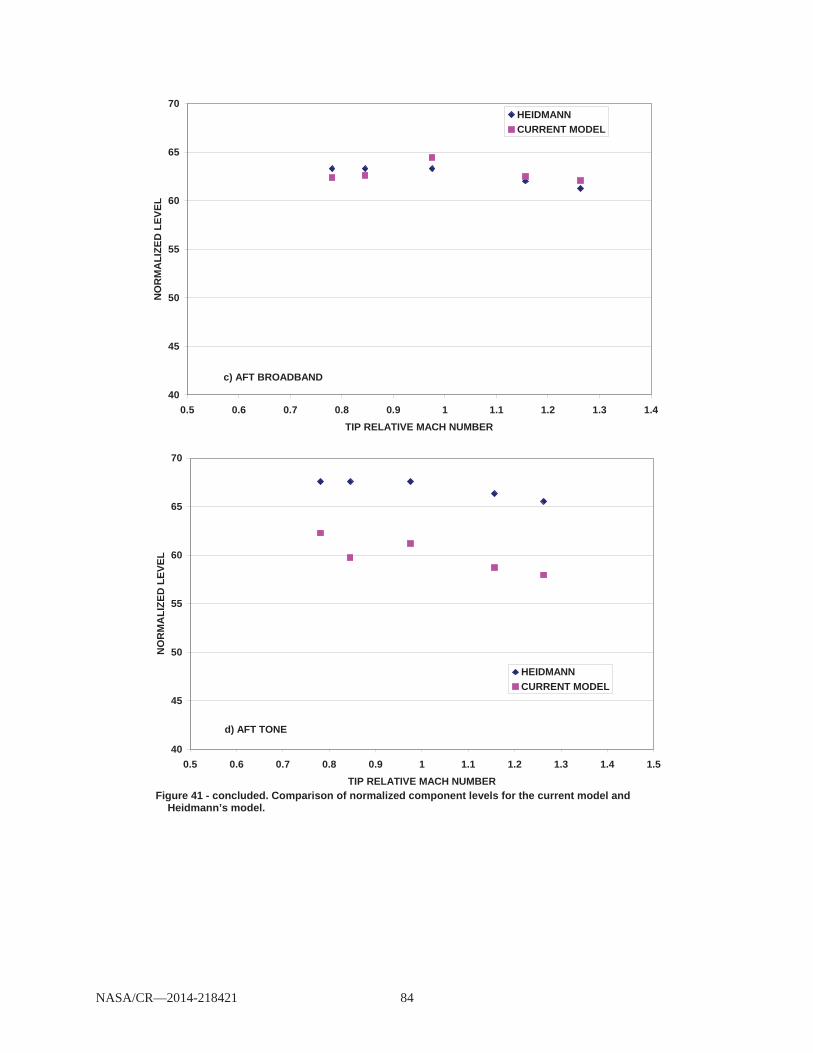
Comparison of Model With Heidmann While the plots comparing the predictions using the current model also show predicted levels using
the Heidmann model, differences in the models are not obvious since the apparent difference in prediction can result from differences in level correlations, differences in directivity, and differences in spectra. In this section plots comparing these three elements of the prediction procedures will be discussed. In Figure 41, normalized component levels for the two models are compared. The inlet broadband levels, Figure 41(a), start out nearly equal, but the new model shows a much steeper decrease with tip relative Mach number. Kontos et al., Reference in there revision of the Heidmann model also increased the decrease for the in inlet broadband coefficient but not as severely as the current model. This steeper decrease of the current resembles that of the Boeing prediction, Reference 20.
The inlet and aft tone levels, Figures 41(b) and (d), are reduced significantly relative to the Heidmann model. Both the Kontos et al. and Allied Signal models reduced the inlet tone levels and the Boeing and Allied Signal models reduced the aft tone levels.
Aft broadband levels, Figure 41(c), in the current model are relatively close to those of the Heidmann model as were those of the Boeing model.
Directivities used in the two models are compared in Figures 25 to 28. Except for the combination tone directivity, only modest changes were made with no change made in the inlet tone directivity. The inlet broadband spectrum was shifted to peak at four times the blade passage frequency rather then 2.5 times as in the Heidmann model. No change in the peak frequency was made for the aft broadband noise and no change in the shape of the spectra was made for either inlet or aft broadband noise. The cut-off effect on the tones was unchanged as was the harmonic fall off rate.
NASA/CR—2014-218421 14
Summary and Concluding Remarks A model for fan noise prediction was developed based on measured noise levels for the R4 rotor with
several outlet guide vane variations and three fan exhaust areas. The fan test was part of a Source Diagnostic Test series conducted in the NASA Glenn Research Center 9- by 15-Foot Low-Speed Wind Tunnel. The fan was a 22 in. diameter fan with 22 blades with a design tip speed of 1215 ft/sec. Data from three stator sets were used in the development of the model. These are: the baseline 54 radial vane OGV designed to “cut-off” the blade passage frequency tone; the 26 radial vanes OGV which did not cut off the blade passage tone; and the 26 swept vane OGV which also did not cut off the blade passage tone but had the potential to reduce the fan tones. Data for these three OGV’s were obtained withy the nominal exhaust nozzle. For the baseline OGV data were obtained with two exhaust nozzles with increased area.
The model predicts the complete fan noise spectrum, including broadband noise, tones, and for supersonic tip speeds, combination tones. Both spectra and directivity are predicted. Comparison with data shows the model is capable of predicting the effect of outlet guide vane number, exhaust area change, and vane sweep. Comparisons with data from a second fan, the ADP fan, also showed good agreement.
Although reasonable agreement with data was obtained, the model was developed primarily based on data from one fan. Even though extensive data for that fan, including the above mentioned geometry variations, was used, the model needs to be tested over a much wider range of fan designs. Examination of data obtained without exit guide vanes present (Results not included in this report.) showed that the rotor alone noise levels were usually with 10 dB, and occasionally within 3 dB, of the results with the stator present. Future models should include the rotor alone noise as a separate source, even though limited data is available to generalize such a model.
NASA/CR—2014-218421 15
TABLE 1.—SDT2 ACOUSTIC DATA CONFIGURATIONS [Bold Configurations are with acoustic barrier wall in place, * denotes time domain data.]
HEIDMANN and KONTOSALLIED SIGNALGASPBOEINGDUNN and PEART
Figure 8 - Comparison of aft tone directivities.
NASA/CR—2014-218421 22
INLET BROADBAND NOISE SPECTRA
-20
-15
-10
-5
0
5
0.1 1 10NORMALIZED FREQUENCY, F/Fbpf
SPL
- SPL
peak
, dB
HEIDMAN, KONTOS, and GASPALLIED SIGNALBOEINGDUNN and PEART
Figure 9 - Comparison of inlet broadband noise spectra.
AFT BROADBAND NOISE SPECTRA
-20
-15
-10
-5
0
5
0.1 1 10NORMALIZED FREQUENCY, F/Fbpf
SPL
- SPL
peak
HEIDMANN, KONTOS, andGASPALLIED SIGNAL
BOEING
DUNN and PEART
Figure 10 - Comparison of inlet broadband noise spectra.
NASA/CR—2014-218421 23
APPROACH, 60 DEGREES
40
50
60
70
80
90
100
110
120
100 1000 10000 100000FREQUENCY, HZ.
SPL,
dB
DATAHEIDMANNALLIED SIGNALKONTOS (GE)BOEINGDUNN and PEART
Figure 11 - Comparison of predictions with measured data. R4 rotor with baseline outlet guide vanes, baseline nozzle, and 0.02 in. tip clearance, approach fan speed at 60 degrees from the inlet.
APPROACH 120 DEGREES
40
50
60
70
80
90
100
110
120
100 1000 10000 100000FREQUENCY, HZ.
SPL,
dB
DATAHEIDMANNALLIED SIGNALKONTOS (GE)BOEINGDUNN and PEART
Figure 12 - Comparison of predictions with measured data. R4 rotor with baseline outlet guide vanes, baseline nozzle, and 0.02 in. tip clearance, approach fan speed at 120 degrees from the inlet.
NASA/CR—2014-218421 24
(a) Directivity Angle = 60 degFigure 13 - First Level Extraction of Fan and Jet/Background Noise for R4 Rotor with Baseline
BOGVs, 0.02-in. gap and Design Point Nozzle.
45
50
55
60
65
70
75
80
85
90
95
100 1000 10000 100000
1/3-Octave-Band Center Frequency, f, Hz
Soun
d Pr
essu
re le
vel,
SPL,
dB
re 2
0 Pa
Exp. Tot.Pred. TotalExtr. Jet/BGPred. J/BGHeid. Pred. FanExtrct. Fan
(b) Directivity Angle = 120 degFigure 13 - First Level Extraction of Fan and Jet/Background Noise for R4 Rotor with Baseline
BOGVs, 0.02-in. gap and Design Point Nozzle.
50
55
60
65
70
75
80
85
90
95
100
100 1000 10000 100000
1/3-Octave-Band Center Frequency, f, Hz
Soun
d Pr
essu
re le
vel,
SPL,
dB
re 2
0 Pa
Exp. Tot.Pred. TotalExtr. Jet/BGPred. J/BGHeid. Pred. FanExtrct. Fan
NASA/CR—2014-218421 25
Figure 14 - Component Spectral Extraction and Correaltion for Vmix/camb = 0.35, Mf = 0.1 (Fan R4BOGV+7.5-02, 50% Speed)
Figure 15. Comparison of Predicted Jet and Scrubbing Noise with Measured Low Frequency Fan Rig Data, Vmix/camb = 0.36
60
65
70
75
80
85
90
95
100
100 1000 10000
1/3-Octave-Band Center Frequency, f, Hz
Free-FieldLossless
SoundPressure
Levelon 7.44-ftSideline,SPL, dB MEASURED
PREDICTED JET +SCRUBBING NOISEJET NOISE
SCRUBBING NOISE
(a) Directivity Angle = 60 deg
Figure 15. Comparison of Predicted Jet and Scrubbing Noise with Measured Low Frequency Fan Rig Data, Vmix/camb = 0.36
60
65
70
75
80
85
90
95
100
100 1000 10000
1/3-Octave-Band Center Frequency, f, Hz
Free-FieldLossless
SoundPressure
Levelon 7.44-ftSideline,SPL, dB
MEASURED
PREDICTED JET +SCRUBBING NOISEJET NOISE
SCRUBBING NOISE
(b) Directivity Angle = 90 deg
NASA/CR—2014-218421 29
Figure 15. Comparison of Predicted Jet and Scrubbing Noise with Measured Low Frequency Fan Rig Data, Vmix/camb = 0.36
60
65
70
75
80
85
90
95
100
100 1000 100001/3-Octave-Band Center Frequency, f, Hz
Free-FieldLossless
SoundPressure
Levelon 7.44-ftSideline,SPL, dB
MEASURED
PREDICTED JET +SCRUBBING NOISEJET NOISE
SCRUBBING NOISE
(c) Directivity Angle = 120 deg
Figure 15. Comparison of Predicted Jet and Scrubbing Noise with Measured Low Frequency Fan Rig Data, Vmix/camb = 0.36
60
65
70
75
80
85
90
95
100
100 1000 100001/3-Octave-Band Center Frequency, f, Hz
Free-FieldLossless
SoundPressure
Levelon 7.44-ftSideline,SPL, dB
MEASURED
PREDICTED JET +SCRUBBING NOISEJET NOISE
SCRUBBING NOISE
(d) Directivity Angle = 150 deg
NASA/CR—2014-218421 30
Figure 16. Comparison of Predicted Jet and Scrubbing Noise with Measured Low Frequency Fan Rig Data, Vmix/camb = 0.499
60
65
70
75
80
85
90
95
100
100 1000 10000
1/3-Octave-Band Center Frequency, f, Hz
Free-FieldLossless
SoundPressure
Levelon 7.44-ftSideline,SPL, dB MEASURED
PREDICTED JET +SCRUBBING NOISEJET NOISE
SCRUBBING NOISE
(a) Directivity Angle = 60 deg
Figure 16. Comparison of Predicted Jet and Scrubbing Noise with Measured Low Frequency Fan Rig Data, Vmix/camb = 0.499
65
70
75
80
85
90
95
100
105
100 1000 10000
1/3-Octave-Band Center Frequency, f, Hz
Free-FieldLossless
SoundPressure
Levelon 7.44-ftSideline,SPL, dB
MEASURED
PREDICTED JET +SCRUBBING NOISEJET NOISE
SCRUBBING NOISE
(b) Directivity Angle = 90 deg
NASA/CR—2014-218421 31
Figure 16. Comparison of Predicted Jet and Scrubbing Noise with Measured Low Frequency Fan Rig Data, Vmix/camb = 0.499
70
75
80
85
90
95
100
105
110
100 1000 100001/3-Octave-Band Center Frequency, f, Hz
Free-FieldLossless
SoundPressure
Levelon 7.44-ftSideline,SPL, dB
MEASURED
PREDICTED JET +SCRUBBING NOISEJET NOISE
SCRUBBING NOISE
(c) Directivity Angle = 120 deg
Figure 16. Comparison of Predicted Jet and Scrubbing Noise with Measured Low Frequency Fan Rig Data, Vmix/camb = 0.499
70
75
80
85
90
95
100
105
110
100 1000 100001/3-Octave-Band Center Frequency, f, Hz
Free-FieldLossless
SoundPressure
Levelon 7.44-ftSideline,SPL, dB
MEASURED
PREDICTED JET +SCRUBBING NOISEJET NOISE
SCRUBBING NOISE
(d) Directivity Angle = 150 deg
NASA/CR—2014-218421 32
Figure 17. Comparison of Predicted Jet and Scrubbing Noise with Measured Low Frequency Fan Rig Data, Vmix/camb = 0.634
70
75
80
85
90
95
100
105
110
100 1000 10000
1/3-Octave-Band Center Frequency, f, Hz
Free-FieldLossless
SoundPressure
Levelon 7.44-ftSideline,SPL, dB MEASURED
PREDICTED JET +SCRUBBING NOISEJET NOISE
SCRUBBING NOISE
(a) Directivity Angle = 60 deg
Figure 17. Comparison of Predicted Jet and Scrubbing Noise with Measured Low Frequency Fan Rig Data, Vmix/camb = 0.634
75
80
85
90
95
100
105
110
115
100 1000 10000
1/3-Octave-Band Center Frequency, f, Hz
Free-FieldLossless
SoundPressure
Levelon 7.44-ftSideline,SPL, dB
MEASURED
PREDICTED JET +SCRUBBING NOISEJET NOISE
SCRUBBING NOISE
(b) Directivity Angle = 90 deg
NASA/CR—2014-218421 33
Figure 17. Comparison of Predicted Jet and Scrubbing Noise with Measured Low Frequency Fan Rig Data, Vmix/camb = 0.634
80
85
90
95
100
105
110
115
120
100 1000 100001/3-Octave-Band Center Frequency, f, Hz
Free-FieldLossless
SoundPressure
Levelon 7.44-ftSideline,SPL, dB
MEASURED
PREDICTED JET +SCRUBBING NOISEJET NOISE
SCRUBBING NOISE
(c) Directivity Angle = 120 deg
Figure 17. Comparison of Predicted Jet and Scrubbing Noise with Measured Low Frequency Fan Rig Data, Vmix/camb = 0.634
80
85
90
95
100
105
110
115
120
100 1000 100001/3-Octave-Band Center Frequency, f, Hz
Free-FieldLossless
SoundPressure
Levelon 7.44-ftSideline,SPL, dB
MEASURED
PREDICTED JET +SCRUBBING NOISEJET NOISE
SCRUBBING NOISE
(d) Directivity Angle = 150 deg
NASA/CR—2014-218421 34
Figure 18. Comparison of Predicted Jet and Scrubbing Noise with Measured Low Frequency Fan Rig Data, Vmix/camb = 0.689
80
85
90
95
100
105
110
115
120
100 1000 10000
1/3-Octave-Band Center Frequency, f, Hz
Free-FieldLossless
SoundPressure
Levelon 7.44-ftSideline,SPL, dB
MEASURED
PREDICTED JET +SCRUBBING NOISEJET NOISE
SCRUBBING NOISE
(a) Directivity Angle = 60 deg
Figure 18. Comparison of Predicted Jet and Scrubbing Noise with Measured Low Frequency Fan Rig Data, Vmix/camb = 0.689
80
85
90
95
100
105
110
115
120
100 1000 10000
1/3-Octave-Band Center Frequency, f, Hz
Free-FieldLossless
SoundPressure
Levelon 7.44-ftSideline,SPL, dB
MEASURED
PREDICTED JET +SCRUBBING NOISEJET NOISE
SCRUBBING NOISE
(b) Directivity Angle = 90 deg
NASA/CR—2014-218421 35
Figure 18. Comparison of Predicted Jet and Scrubbing Noise with Measured Low Frequency Fan Rig Data, Vmix/camb = 0.689
80
85
90
95
100
105
110
115
120
100 1000 100001/3-Octave-Band Center Frequency, f, Hz
Free-FieldLossless
SoundPressure
Levelon 7.44-ftSideline,SPL, dB MEASURED
PREDICTED JET +SCRUBBING NOISEJET NOISE
SCRUBBING NOISE
(c) Directivity Angle = 120 deg
Figure 18. Comparison of Predicted Jet and Scrubbing Noise with Measured Low Frequency Fan Rig Data, Vmix/camb = 0.689
80
85
90
95
100
105
110
115
120
100 1000 100001/3-Octave-Band Center Frequency, f, Hz
Free-FieldLossless
SoundPressure
Levelon 7.44-ftSideline,SPL, dB MEASURED
PREDICTED JET +SCRUBBING NOISEJET NOISE
SCRUBBING NOISE
(d) Directivity Angle = 150 deg
NASA/CR—2014-218421 36
a. 60 Degrees65
70
75
80
85
90
95
100
105
100 1000 10000 1000001/3-Octave-Band Center Frequency, f, Hz
Soun
d Pr
essu
re le
vel,
SPL,
dB
re 2
0 Pa
Exp. Tot.Pred. Tot.Pred. JetPred. Fan
b) 120 Degrees65
70
75
80
85
90
95
100
105
110
115
100 1000 10000 100000
1/3-Octave-Band Center Frequency, f, Hz
Soun
d Pr
essu
re le
vel,
SPL,
dB
re 2
0 Pa
Exp. Tot.Pred. Tot.Pred. JetPred. Fan
Figure 19 - Comparison of initial predictions with data at approach fan speed, for R4 rotor with nominal area
nozzle, baseline OGV and 0.02 in. tip clearance.
NASA/CR—2014-218421 37
a) 60 Degrees
70
75
80
85
90
95
100
105
110
100 1000 10000 100000
1/3-Octave-Band Center Frequency, f, Hz
Soun
d Pr
essu
re le
vel,
SPL,
dB
re 2
0 Pa
Exp. Tot.Pred. Tot.Pred. JetPred. Fan
b) 120 Degrees
75
80
85
90
95
100
105
110
115
100 1000 10000 100000
1/3-Octave-Band Center Frequency, f, Hz
Soun
d Pr
essu
re le
vel,
SPL,
dB
re 2
0 Pa
Exp. Tot.Pred. Tot.Pred. JetPred. Fan
Figure 20 - Comparison of initial predictions with data at cutback fan speed, for R4 rotor with nominal area nozzle, baseline OGV, and 0.02 in. tip clearance.
NASA/CR—2014-218421 38
a) 60 Degrees80
85
90
95
100
105
110
115
120
100 1000 10000 100000
1/3-Octave-Band Center Frequency, f, Hz
Soun
d Pr
essu
re le
vel,
SPL,
dB
re 2
0 Pa
Exp. Tot.Pred. Tot.Pred. JetPred. Fan
b) 120 Degrees
80
85
90
95
100
105
110
115
120
100 1000 10000 100000
1/3-Octave-Band Center Frequency, f, Hz
Soun
d Pr
essu
re le
vel,
SPL,
dB
re 2
0 Pa
Exp. Tot.Pred. Tot.Pred. JetPred. Fan
Figure 21 - Comparison of initial predictions with data at takeoff fan speed, for R4 rotor with nominal area nozzle,
Figure 22 - Comparison of predictions and data for the baseline OGV with 54 stators and the low vane count OGV with 26 stators for rotor R4, with the nominal exhaust nozzle, 0.02 tip clearance at approach fan speed.
Figure 23 - Comparison of predictions and data for the R4 rotor with the baseline 54 stator OGV and 0.02 tip clearance with varying exhaust nozzle areas at 50% fan speed.
Figure 24 - Comparison of predictions and data for the low vane count OGV with 26 straight vanes and the low noise OGV with 26 swept vanes for rotor R4, with the nominal exhaust nozzle, 0.02 tip clearance at approach fan speed.
NASA/CR—2014-218421 42
(a) Directivity Angle = 30 deg Figure 25 - Second Level Component Spectral Extraction for Rotor R4; Baseline OGV; .02 Tip
Clearance; Nominal Nozzle; 93% Speed; Coefficients Adjusted to Minimize Errors.
Figure 41 - concluded. Comparison of normalized component levels for the current model and
Heidmann’s model.
NASA/CR—2014-218421 85
References 1. Zorumski, W.E., “Aircraft Noise Prediction Program Theoretical Manual,” NASA TM-83199,
Parts 1 and 2, 1982. 2. Clark, B.J., “Computer Program to Predict Aircraft Noise Levels,” NASA TP-1913, September 1981. 3. Stone, J.R., “Interim Prediction Method for Jet Noise,” NASA TM X-71618, November 1974. 4. Stone, J.R., Zola, C.L. and Clark, B.J., “An Improved Model for Conventional and Inverted-Velocity-
Profile Coannular Jet Noise,” AIAA-99-0078, January 1999. 5. Stone, J.R., Clark, B.J. and Krejsa, E.A., “Multiple-Source Semi-Empirical Model for 2D Mixer
Ejector Noise Prediction,” AIAA-2003-3168, May 2003. 6. Stone, J.R., Krejsa, E.A. and Clark, B.J., “Jet Noise Modeling for Coannular Nozzles Including the
Effects of Chevrons,” NASA/CR-2003-212522, September 2003. 7. Stone, J.R., Krejsa, E.A. and Clark, B.J., “Semi-Empirical Model for Coannular Nozzle Component
Noise Extraction and Correlation Including the Effects of Noise Reduction Devices,” AIAA-2003-1060, January 2003.
8. Woodward, Richard P., Gazzaniga, John A., Bartos, Linda J., and Hughes, Christopher E., “Acoustic Benefits of Stator Sweep and Lean for a High Tip Speed Fan,” NASA/TM-2002-211345, AIAA-2002-1034, January 2002.
9. Heidmann, Marcus F., “Interim Prediction Method for Fan and Compressor Source Noise,” NASA TM X-71773, 1979.
10. Envia, Edmane, “Fan Noise Source Diagnostic Test – Vane Unsteady Pressure Results,” AIAA-2002-2430, NASA/TM-2002-211808, August 2002.
11. Groeneweg, J.F., Sofrin, T.G., Rice \, E.J., and Gliebe, P.R., “Turbomachinery Noise,” in Aeroacoustics of Flight Vehicles: Theory and Practice, Volume 1: Noise Sources. Edited by H.H. Hubbard, NASA RP-1258, Volume 1, WRDC Technical Report 90-3052, August, 1991.
12. Groeneweg, John. F., “Fan Noise Research at NASA,” NASA TM-106512, May, 1994. 13. Huff, Dennis L., “Fan Noise Prediction: Status and Needs,” AIAA-98-0177, NASA TM-97-206533,
December 1997. 14. Envia, E., Huff, D.L., and Morrison, C.R., “Analytical Assessment of Stator Sweep and Lean in
Reducing Rotor-Stator Tone Noise,” AIAA 96-1791. May 1996. 15. Tyler, J.M. and Sofrin T.G., “Axial Flow Compressor Noise Studies,” SAE Transactions, Vol. 70,
1962, pp. 309-332. 16. Dunn, D.G., and Peart, N.A., “Aircraft Noise Source and Contour Estimation,” NASA CR-114649,
1973. 17. Kontos, K.B., Janardan B.A., and Gliebe, P.R., “Improved NASA-ANOPP Noise Prediction Code for
Advanced Subsonic Propulsion Systems, Vol. 1: ANOPP Evaluation and Fan Noise Model Improvement,” NASA CR 195480, August 1996.
18. Hough, J.W. and Weir D.S., “Aircraft Noise Prediction Program (ANOPP) Fan Noise Prediction for Small Engines,” NASA CR 108300, April 1996.
19. Herkes, W., “Modular Engine Noise Component Prediction System (MCP) Technical Description and Assessment Document,” The Boeing Company, NASA Contract NAS1-97040, August 2001.
20. Russell, James W., “Boeing Fan Noise Module” 21. Stone, James R., Krejsa, Eugene A., and Clark, Bruce J., “Jet Noise Modeling for Suppressed and
Unsuppressed Aircraft in Flight,” Final Report, NASA Contract NAS3-00178, Task Order 10, Sept. 2003.
22. Brown, Cliff and Bridges, James, “Small Hot Jet Acoustic Rig Validation,” NASA/TM-2006-214234, April 2006.