CAHIER SCIENTIFIQUE LOTA D. TAMINI IBRAHIMA BOCOUM GHISLAIN AUGER KOTCHIKPA GABRIEL LAWIN ARAHAMA TRAORÉ Enhanced Microfinance Services and Agricultural Best Management Practices: What Benefits for Smallholders Farmers? An Evidence from Burkina Faso CS 2019S-11
Transcript
CAHIER SCIENTIFIQUE
LOTA D. TAMINI
IBRAHIMA BOCOUM
GHISLAIN AUGER
KOTCHIKPA GABRIEL LAWIN
ARAHAMA TRAORÉ
Enhanced Microfinance Services and Agricultural Best Management Practices: What Benefits for Smallholders Farmers? An Evidence from Burkina Faso
Enhanced Microfinance Services and Agricultural Best Management
Practices: What Benefits for Smallholders Farmers?
An Evidence from Burkina Faso
Lota D. Tamini, Ibrahima Bocoum, Ghislain Auger,
Kotchikpa Gabriel Lawin, Arahama Traoré
CIRANO Le CIRANO est un organisme sans but lucratif constitué en vertu de la Loi des compagnies du Québec. Le financement de son infrastructure et de ses activités de recherche provient des cotisations de ses organisations-membres, d’une subvention d’infrastructure du gouvernement du Québec, de même que des subventions et mandats obtenus par ses équipes de recherche.
CIRANO is a private non-profit organization incorporated under the Quebec Companies Act. Its infrastructure and research activities are funded through fees paid by member organizations, an infrastructure grant from the government of Quebec, and grants and research mandates obtained by its research teams.
Les partenaires du CIRANO
Partenaires corporatifs
Autorité des marchés financiers Banque de développement du Canada Banque du Canada Banque Laurentienne Banque Nationale du Canada Bell Canada BMO Groupe financier Caisse de dépôt et placement du Québec Canada Manuvie Énergir Hydro-Québec
Innovation, Sciences et Développement économique Canada Intact Corporation Financière Investissements PSP
Ministère de l'Économie, de la Science et de l'Innovation Ministère des Finances du Québec Mouvement Desjardins Power Corporation du Canada Rio Tinto Ville de Montréal Partenaires universitaires
École de technologie supérieure École nationale d’administration publique
HEC Montréal Institut national de la recherche scientifique Polytechnique Montréal Université Concordia Université de Montréal Université de Sherbrooke Université du Québec Université du Québec à Montréal Université Laval Université McGill
Le CIRANO collabore avec de nombreux centres et chaires de recherche universitaires dont on peut consulter la liste sur son site web.
ISSN 2292-0838 (en ligne)
Les cahiers de la série scientifique (CS) visent à rendre accessibles des résultats de recherche effectuée au CIRANO afin de susciter échanges et commentaires. Ces cahiers sont écrits dans le style des publications scientifiques. Les idées et les opinions émises sont sous l’unique responsabilité des auteurs et ne représentent pas nécessairement les positions du CIRANO ou de ses partenaires. This paper presents research carried out at CIRANO and aims at encouraging discussion and comment. The observations and viewpoints expressed are the sole responsibility of the authors. They do not necessarily represent positions of CIRANO or its partners.
Enhanced Microfinance Services and Agricultural Best Management
Practices: What Benefits for Smallholders Farmers?
An Evidence from Burkina Faso
Lota D. Tamini *, †, Ibrahima Bocoum ‡, Ghislain Auger § Kotchikpa Gabriel Lawin **, Arahama Traoré ††
Abstract
This paper analyses the crop production intensification credit [Crédit d’Intensification de la Production Agricole] (CIPA) and its impact on smallholders farmers in Burkina Faso. The methodological approach of the evaluation is based on a randomized experiment coupled to propensity score matching. For the latter, the strategy was to use the observable characteristics of producers and their farms to identify, in non-CIPA areas, producers who have characteristics that have an impact on the propensity to take a credit similar to the CIPA beneficiary producers. We used a Difference-in-Difference approach and analysed the changes in the results between the baseline (2015) and final (2017) surveys witch result in a total of 955 observations in the northern of Burkina Faso and 1,311 in the southern part. The results show that CIPA has a positive effect on area planted, yield, production and sales. However, there is heterogeneity regarding gender, province and perceived quality of services to producers (provided by extension agents, producers’ organization and input suppliers). Development projects should therefore consider this heterogeneity in the design of their interventions. Keywords: Burkina Faso, Microcredit, Agricultural Production, Agricultural Productivity, Impact Evaluation JEL Codes: O13, Q14
* Université Laval, Département d’Économie Agroalimentaire et des Sciences de la Consommation, Centre de Recherche en économie de l’Environnement, de l’Agroalimentaire, des Transports et de l’Énergie (CREATE) et Groupe de recherche Agriculture, Territoires et Développement. † Fellow CIRANO. Corresponding author: Pavillon Paul-Comtois, 2425, rue de l’Agriculture, local 4426, Québec (QC), G1V 0A6, Canada. Email: [email protected]. ‡ Université Laval, Département d’Économie Agroalimentaire et des Sciences de la Consommation et Centre de Recherche en économie de l’Environnement, de l’Agroalimentaire, des Transports et de l’Énergie (CREATE). § Développement international Desjardins, Lévis, Canada. ** Université Laval, Département d’Économie Agroalimentaire et des Sciences de la Consommation, Centre de Recherche en économie de l’Environnement, de l’Agroalimentaire, des Transports et de l’Énergie (CREATE) et Groupe de recherche Agriculture, Territoires et Développement. †† Institute of Environment and Agricultural Research of Burkina Faso (INERA).
2
1 Introduction
In the past fourteen years, African countries’ stakeholders introduced several innovations to
improve agricultural productivity. Examples include the use of improved seeds and organic
manure and better use of mineral fertilizers, water and soil conservation techniques, etc.
(Ouedraogo, 2005; Sawadogo et al., 2008; Liniger et al., 2011; Debalke, 2014). Therefore, to
increase farmers’ adoption of these practices, conventional banks and microfinance institutions
encouraged access to credit (AGRA, 2014; FAO, 2016). Indeed, the effects of microcredit have
been the subject of several studies over the last fifteen years (Lawin, Tamini and Bocoum, 2018),
and the results converge towards a positive effect of access to microcredit on the adoption of
agricultural technology. Examples in African countries are Zeller, Diagne and Mataya (1998)
in Malawi, Isham (2002) in Tanzania, Croppenstedt Demeke and Meschi (2003) in Ethiopia,
Abdulai and Huffman (2005) in Tanzania, Dercon and Christiaensen (2011) in Ethiopia, Girabi
and Mwakaje (2013) in Tanzania, Odozi and Omonona (2013) in Nigeria, Lambrecht et al.
(2014) in the Democratic Republic of Congo and Tadesse (2014), Tigist et al. (2015) and Abate
et al. (2015) in Ethiopia. Indeed, we should expect that access to microcredit has a positive
impact on investment in agricultural activities, encourages a better-input use and favors adoption
of new technologies. Moreover, potentially, because of better investment and/or inputs use
and/or access to new technologies, access to microcredit has a positive impact on farms technical
efficiency and productivity, which in turn improves the profitability of farms activities. Figure
1 summarizes the hypothesized impacts of the microcredit (Barnajee et al., 2015a; Lawin et al.,
2018).
3
Figure 1. Impacts – postulated - of microcredit on farms and rural households (Source: Lawin et al., 2018).
However, the convergence of the literature on the positive impact of access to microcredit on
the adoption of new agricultural technologies could hide methodological problems. As shown
by Beaman et al. (2014), Attanasio et al. (2015) and Crépon et al. (2015), very often, farmers
self-select to participate in microcredit programmes. The failure to account for this potential
selection bias may result in inconsistent estimates of the impact of access to microcredit on the
adoption of new technologies. Very few studies in the literature have made an explicit attempt
in this direction, which implies that the above-mentioned results could suffer from sample
selection bias. The double-hurdle approach used by Croppenstedt et al. (2003) and Hazarika,
Bezbaruah and Goswami (2016), the Heckman’s (1979) selection probit models in Lambrecht
Revenues of farm household
Profitability of agricultural Activities
Investments Intensification of input use
Non-farm activities
Access to microcredit
Adoption of new technologies
Technical efficiency and productivity
4
et al. (2014) or the instrumental variable regressions in Tadesse (2014) have the advantage of
accommodating for selectivity bias. However, such techniques do not mitigate biases stemming
from observed variables that could explain the differences in adoption between beneficiaries
and non-beneficiaries of microcredit. These difficulties in estimating the real causal effect led
to the development of experimental studies that allow having a group of non-beneficiaries with
similar characteristics to the group of beneficiaries to serve as counterfactual. The literature on
experimental methods of impact evaluations shows that one of the best methods for the
construction of the counterfactual is random assignment (Duflo, Glennerster and Kremer, 2007;
Imbens and Wooldridge, 2009).5 However, Banerjee et al. (2015a) identify three important
elements to consider when designing experimental studies on microcredit, namely low demand
for credit in general, weak demand for the form of credit offered by the experiment and the
presence of close substitutes that may be formal or informal (loans between producers or from
a local merchant). The literature then suggests using additional methods to encourage credit
demand if it is too low (Banerjee, 2013). However, one concern that could be introduced by this
practice is that of external validity (see Deaton, 2010).
In 2015, The International Development Research Center (IDRC) allowed funding to
Développement International Desjardins (DID) for the implementation of the Financial
Services and Deployment of Agricultural Innovations in Burkina Faso [Services Financiers et
Déploiement d’Innovations Agricoles au Burkina Faso] (SFDIAB) project. This project
5 However, there are ongoing discussions on the limitations of the experimental methods (see e.g. Deaton, 2010; Shaffer, 2013) and the best way for strong impact evaluation using them (see e.g. Imbens, 2014; Athley and Imbens, 2016).
5
intended to develop and test a financial service model for deploying and scaling up innovative
practices designed to increase the productivity of agricultural smallholders in Burkina Faso.
More precisely, the SFDIAB attempted to answer the following research question: to what
extent is it possible to use adapted financial services to stimulate innovation deployment
intended for smallholder farmers? Using the value chain approach, DID and the Réseau des
Caisses Populaires du Burkina (RCPB)6 designed the crop production intensification credit
[Crédit d’Intensification de la Production Agricole] (CIPA) to improve services proximity and
timely access to good inputs. This is done while allowing RCPB to meet its business objectives
in terms of risk management, profitability and customer satisfaction and without additional
incentives to encourage credit demand and intake, the latter being intended to insure external
validity of the CIPA.
The objective of the present paper is to analyse the CIPA and its impact on smallholder farmers’
well-being outcomes while controlling for selection bias as well as taking gender, the producers’
organizations performances and the quality of services into account. Indeed, Abate et al. (2015)
show that the impact of access to institutional finance is heterogeneous. The effect is significant
on large farms, while there is no statistical difference for smallholders owning less than two
hectares of land. Abate et al. (2015) explain it by the fact that the adoption of new, improved
varieties may entail considerable risks. Fear of welfare repercussions if the improved seeds
result in a poor harvest push small farmers to stick with conventional, low-risk practices even if
their return is low (Dercon and Christiaensen, 2011). Lawin and Tamini (2019) show that this
6 See the website at http://www.rcpb.bf/en/. Accessed March 21, 2019.
6
is also the case in Burkina Faso when considering production diversification. Risk-averse
farmers tend to focus more on traditional crops to avoid risks associated with the production of
other crops. We analysed the impact of the crop production intensification credit on the size of
plots, the yield and production, the food available in the household and finally, the sale of
cowpeas and maize. Even if positive, our results show that the impact of the CIPA is
heterogeneous.
The rest of the paper is organized as follows. Section 2 presents the SFDIAB, and section 3
presents the experimental design. In section 4, we describe the empirical approach and analyse
the results in section 5. The last section concludes the paper.
2 Crop Production Intensification Credit (CIPA) for the deployment of agricultural
innovations in Burkina Faso
DID implemented the project in partnership with the RCPB and the Institute of Environment
and Agricultural Research of Burkina Faso (INERA). RCPB was responsible for providing the
financial services to producers, while INERA was involved in the design and implementation
of extension activities.
The SFDIAB project followed a value chain approach and selected maize and cowpea given
their high potential for food security and poverty reduction in Burkina Faso.7 It included four
major axes: first, the supply of adapted financial services; second, the technical capacity
building activities to extension services for farmers; third, the capacity building of producers
7 Maize is the primary cereal produced, while cowpea production follows that of cereals. See at https://www.agriculture.bf/jcms/c_5044/fr/accueil (Accessed November 11, 2018).
7
organizations’ (PO) officers on governance and crop marketing; and fourth, the removal of
supply chain bottlenecks and building of partnerships with the private sector (input suppliers)
in order to ensure timely delivery of quality inputs in sufficient quantity to farmers.
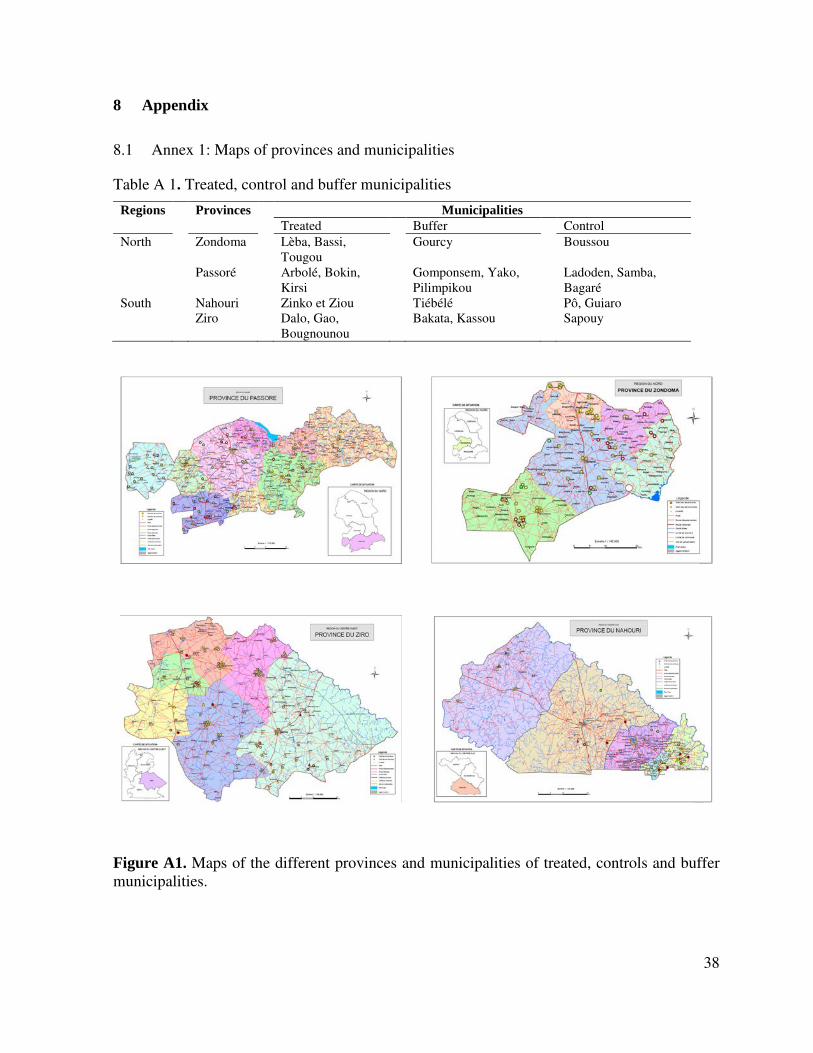
The provinces of Nahouri and Ziro in southern Burkina Faso and the provinces of Zondoma and
Passoré in northern Burkina Faso were the sites of the project (See Figure 2 and Appendix 1).
In the southern region, the research project targeted maize production mostly done by men,
while in the northern region, the project targeted cowpea production mostly cultivated on
Figure 2. Intervention area of the research project
2.1 Financial products
2.1.1 The design of the CIPA
CIPA is a short-term credit scheme allowing smallholder producers to buy an input kit (quality
seed, fertilizers, adapted pesticides and conservation bags) specific to each crop (maize or
8
cowpea) and enough for the area cultivated. The minimum credit was 50,000 FCFA8 and
maximum was set at 500,000 FCFA. Those loans were reimbursed in one repayment (capital
plus interest) when the crop was sold. The procedures for granting and monitoring of loans were
reviewed to:
• offer proximity services to producers near their farm rather than asking borrowers to
come to the RCPB branch;
• simplify procedures for granting and disbursement of the loan; and
• control the distribution of inputs to limit the diversion of the funds to be used for
agricultural production.
To reduce management costs and facilitate follow-up, CIPA used a group methodology. This
allowed consolidating small individual loan applications into a more important credit to their
producers' organization. The risk of misappropriation of funds was limited by providing
producers with direct inputs rather than an amount of funding.
Because DID and RCPB expected that the overall risk of the CIPA portfolio should be reduced
by better lending methodology9 and by the use of quality inputs available on time it was possible
to reduce the guaranty requirements to get a loan. To qualify for CIPA, the borrowers had to
deposit the equivalent of 15% of the value of the loan in the PO's account to create a mutual
credit guaranty fund. This deposit serves to cover any default of one of the members of the PO
81 FCFA=0.001672 USD (See at https://business.westernunion.com/fr-ca/Resources/Tools/Currency-Converter , Accessed February 20, 2019).
9 Also see Barnajee (2013).
9
and would be given back in full to the members if not used. Otherwise, it was refunded in pro
rata of the initial deposit. Therefore, PO members will all have an advantage in ensuring that
each member follows the technical path and does not divert inputs for other purposes. Finally,
in the event of non-compliance of one member with the grant conditions, the PO is authorized
to exploit that member’s plot to ensure the full repayment of the loan and protect the assets of
the other members. Beside the mutual credit guaranty fund, no other guaranty was requested.
Figure 3 illustrates how the CIPA works.
Money ; Information ; Inputs
Figure 3. The CIPA system
Farmers
RCPB
Inputs suppliers
o Delivery confirmation; o Loan disbursement o Suppliers payment by
direct money transfer
o Delivery of products in various drop-off points; Advices on the use of products and best management practices (by INERA);
o Loan approval; o Input requirement
confirmed to the suppliers ; o Scheduling of deliveries by
the input suppliers 1
2
3
4
o Loan repayment;
10
2.1.2 The CIPA portfolio
The CIPA credit scheme was offered for the crop season 2016 and 2017, during which 93% of
the credit requested was granted. Even with this high rate of credit granted, the delinquency rate
was near to zero. In fact, aside from a few delays of one to three months, all CIPA loans were
repaid. Considering an overall loan loss ratio of 1.29% in 2016 for the microfinance sector in
Burkina Faso10, the CIPA portfolio showed a strong performance. The average loan was lower
for women than men were because women usually have smaller cultivated area and specialize
in the cowpea value chain that requires less inputs.
Table 1 presents the main statistics of the CIPA granted for the seasons 2016 and 2017.
10 See Rapport 2016 de performance financière et sociale des membres del’AP/SFD-BF: http://www.apsfd-burkina.bf/IMG/pdf/rapport_d_analyse_des_performances_financieres_et_sociales_des_membres_de_l_apsfd-bf_2016_vf-3.pdf. Accessed March 29, 2019.
11
Table 1. CIPA granted for the 2016 and 2017 crop seasons
2016
Provinces (site)
Number
of PO
Number of credit Granted Amount Granted (in FCFA)
Total
By gender By age Total
By gender By age Male Female <=35 >35 Male Female <=35 >35
The timely application of quality fertilizers, pesticides and improved seeds are the best
production practices targeted by the project. The project disseminated these practices as part of
a value chain approach to foster the development of partnerships, the technical capacities of
farmers and the communication between actors in the value chain. The SFDIAB also included
capacity building of input suppliers, producers’ organizations leaders and extension agents.
These activities were (i) information and training of farmers in agricultural production practices
through school fields; (ii) support for the development and management of producer
organizations; and (iii) information and training of input suppliers for improving the quality of
services offered to producers.
3 Experimental design
The methodological approach of the evaluation is based on the construction of a counterfactual
to the beneficiaries of CIPA. The strategy was to use the observable characteristics of producers
and their farms to identify, in non-CIPA areas, producers with characteristics that have an impact
on the propensity to take credit similar to the CIPA beneficiary producers. Figure 4 presents the
experimental design.
Two elements are important in the operationalization of the intervention in the field: the
commune and the producers' organizations (PO). The commune is the administrative structure
used by the RCPB and the technical services (agriculture support, extension,…) of Burkina Faso
to organize their interventions in the field. The assignment of treated and control areas was done
at the commune level (see discussion below). The RCPB was involved in financial services in
13
the treated as well as the control communes as are the inputs suppliers. POs are also already
part of the national agricultural sector support strategy. Based on the POs, communication and
extension activities were conducted in the treated as well as in control communes. Then as
summarized in Figure 4, inputs suppliers, RCPB “classical” financial services, and
communication and extension activities were present in the treated as well as the control
communes. However, in the treated communes, the supply of financial services and those of
inputs and capacity building were integrated as depicted in Figure 3. Then, what distinguishes
the CIPA is the close integration of finance, inputs supply and training.
Figure 4. Schematic representation of the experimental design of the SFIAB
Region
Communes
Producers' organisation
Farmers
Communes
Producers' organisation
Farmers
Treatment Control
Random assignment
Access to inputs Access to "classic" credit services
Communication and extension on innovations
Access to inputs Access to "classic" credit services
Communication and extension on innovations
Access to CIPA
Access to approved suppliers of inputs
Post-hoc matching
14
Preliminary characterization study of POs
The preliminary characterization of the POs was done in 2 steps. In the first step, the project
team conducted meetings with producers’ organizations to identify those meeting the eligibility
criteria of the research project. Using secondary data (from organizations, technical institutions,
financial institutions, etc.), the most detailed information possible was collected on these POs.
At this stage, the project team selected approximately 260 farmers' organizations. In the second
step, the project team met PO leaders and collected information on their PO. On this basis, the
team carried out a mapping of the communes under study and generated random assignments of
the treated and control communes.11 Because the assignment unit was the commune, when a
commune was assigned to the treatment group, all the producers who are members of the eligible
POs of that commune were included in the treatment. The random assignment generated at the
producer level would have made it possible to increase the power of the statistical tests because
having a good control for the profile of the producers present in both the control and treated
groups (Banerjee et al., 2015a; Banerjee, Karlana and Zinman, 2015b). However, in the context
of this study, this would involve rejecting or accepting loan files not only based on their quality
but also on a random basis. We choose not to take this approach. However, as shown in section
4, we made an a posteriori assignment of producers of control and treatment groups.
11 Crépon et al. (2015), in their impact assessment study of microcredit in Morocco, adopted a methodology based on random assignment of treatments at the community level. Beaman et al. (2014), Angelucci, Karlan and Zinman (2015) and Attanasio et al. (2015) also used assignment at the community level (cluster). However, unlike Crépon et al. (2015), these studies randomly selected individuals or households regardless of their propensity to borrow.
15
To minimize the risk of mixing between treated and control areas, the project team defined
buffer zones to ensure a minimum distance between the treated and control communes.
Assignment at the commune level has the advantage of guaranteeing the integrity of the
intervention and corresponds to the administrative structure chosen by the technical services of
Burkina Faso to organize their extension activities in the field. All producers who are members
of eligible POs in the treated and control areas were included in the baseline survey. Appendix
1 presents the municipalities included in the treated, control and buffer zones.
Baseline survey
The objective of the baseline survey was to identify the profiles of the POs and their members
in the control and treatment groups. On this basis, we inferred their behaviour with respect to
formal credit; we surveyed 5,583 producers. Correcting for outliers and missing data results in
a final database of 1,662 and 1,581 producers for the northern and southern regions respectively.
Final evaluation survey
After two seasons of production, we implemented the final survey that targeted all the producers
of the control and the treatment groups. Data from the survey questionnaire were supplemented
by credit data whenever available.
4 Empirical approach
4.1 The outcomes
We analysed seven outcomes. The first one is the plot size measured in hectares (ha). While we
did not have any expectation on the impact of the CIPA on the plot size, the availability of inputs
16
can lead to an increase in the areas planted with maize or cowpeas. On the other hand, the
difficulties of access to land, especially in the north and for women, can make the intensification
of production have no effect on the areas planted or even have a negative effect. Indeed, it is
possible that producers reallocate part of the area to other crops. The second and third outcomes
are production measured in kilograms (kg) and yield measured in kg per ha (kg/ha). We expect
a positive impact because of the timely application of quality fertilizers and improved seeds.
The fourth outcome analysed is food available in the household measured in kg per adult
equivalent of all production. We analysed the sales in kg and in FCFA of cowpeas in the northern
part of the project, and maize in the southern part of the project. However, we do not expect a
positive or negative impact of the project on the latter outcome. In fact, it is possible that
producers would wait for better market conditions before deciding to sell their crops.
17
Table 2. Mean of the outcomes
Provinces of the north of Burkina Faso
2016 2018
Outcomes Control group Treatment group Control group Treatment group
Plot size 1.112
0.970 (<) 0.514
0.781 (>)
Yield 291.643
372.170 (>) 464.207
356.483 (<)
Production 262.868
272.557 (!≠) 205.837
260.665 (>)
Food 41.217
37.115 (!≠) 39.850
42.920 (!≠)
Sales (kg) 158.874
119.000 (<) 29.885
88.167 (>)
Sales (FCFA) 37,567.630
30,911.270 (!≠) 7,942.073
21,543.960 (>)
Livestock 1.780
2.193 (>) 1.669
2.634 (>)
Provinces of the south of Burkina Faso
2016 2018
Outcomes Control group Treatment group Control group Treatment group
Results of the two-sample t-tests (percentage represents the probability to reject null hypothesis, i.e. no difference, wrongly): (!≠): mean of the treatment group is not different at 5% and less. (<): mean of the treatment group is smaller at 5% and less. (>): mean of the treatment group is higher at 5% and less.
presents the descriptive statistics of the outcomes and shows some heterogeneity between the
results of the statistical tests on the means when comparing the control group to the treatment
group. This implies that a methodological approach that takes into account potential
heterogeneity within the groups should be selected.
18
Table 2. Mean of the outcomes
Provinces of the north of Burkina Faso
2016 2018
Outcomes Control group Treatment group Control group Treatment group
Plot size 1.112
0.970 (<) 0.514
0.781 (>)
Yield 291.643
372.170 (>) 464.207
356.483 (<)
Production 262.868
272.557 (!≠) 205.837
260.665 (>)
Food 41.217
37.115 (!≠) 39.850
42.920 (!≠)
Sales (kg) 158.874
119.000 (<) 29.885
88.167 (>)
Sales (FCFA) 37,567.630
30,911.270 (!≠) 7,942.073
21,543.960 (>)
Livestock 1.780
2.193 (>) 1.669
2.634 (>)
Provinces of the south of Burkina Faso
2016 2018
Outcomes Control group Treatment group Control group Treatment group
Results of the two-sample t-tests (percentage represents the probability to reject null hypothesis, i.e. no difference, wrongly): (!≠): mean of the treatment group is not different at 5% and less. (<): mean of the treatment group is smaller at 5% and less. (>): mean of the treatment group is higher at 5% and less.
4.2 Propensity score matching (PSM)
As indicated above, assignment to the treatment/control group were done at the commune level.
There is no guarantee, however, that the producers are identical in terms of their propensity to
take credit. Therefore, we also made an a posteriori assignment at the producer level using
matching methods to help delivering a precise estimate of the causal effect (Deaton and
Cartwright, 2018), Matching methods allow identifying individuals who are not beneficiaries
of the programme but who have the same observable characteristics as the beneficiary
individuals to serve as a counterfactual. In other words, we matched the participants of the
19
programme to the non-participants who are a priori similar regarding some observable
characteristics, using propensity score matching. Rosenbaum and Rubin (1983) show that under
some assumptions, propensity score matching is as good as direct matching to observable
characteristics. The propensity score is estimated using a logit model that uses the programme
participation as the dependent variable. In our matching process, we considered access to formal
credit as a treatment variable. In other words, we built a sample of producers in the CIPA and
non-CIPA zones who have the same propensity to take formal credit. In the reference survey,
we defined formal credit as credit that has been taken from a formal institution. We used the
baseline survey data for matching and selected the explanatory variables of the probabilistic
models based on a review of literature on credit taking in Africa and its role in the deployment
of innovations (See Lawin et al., 2018). Due to certain differences (such as agro-ecological
zones, agricultural production, interactions between agricultural activities and other income-
generating activities, gender representation, etc.), we estimated the propensity scores and paired
the producers for each zone separately. We adopted the nearest neighbour method in which each
treated individual is matched with five control individuals who have the closest propensity
scores.
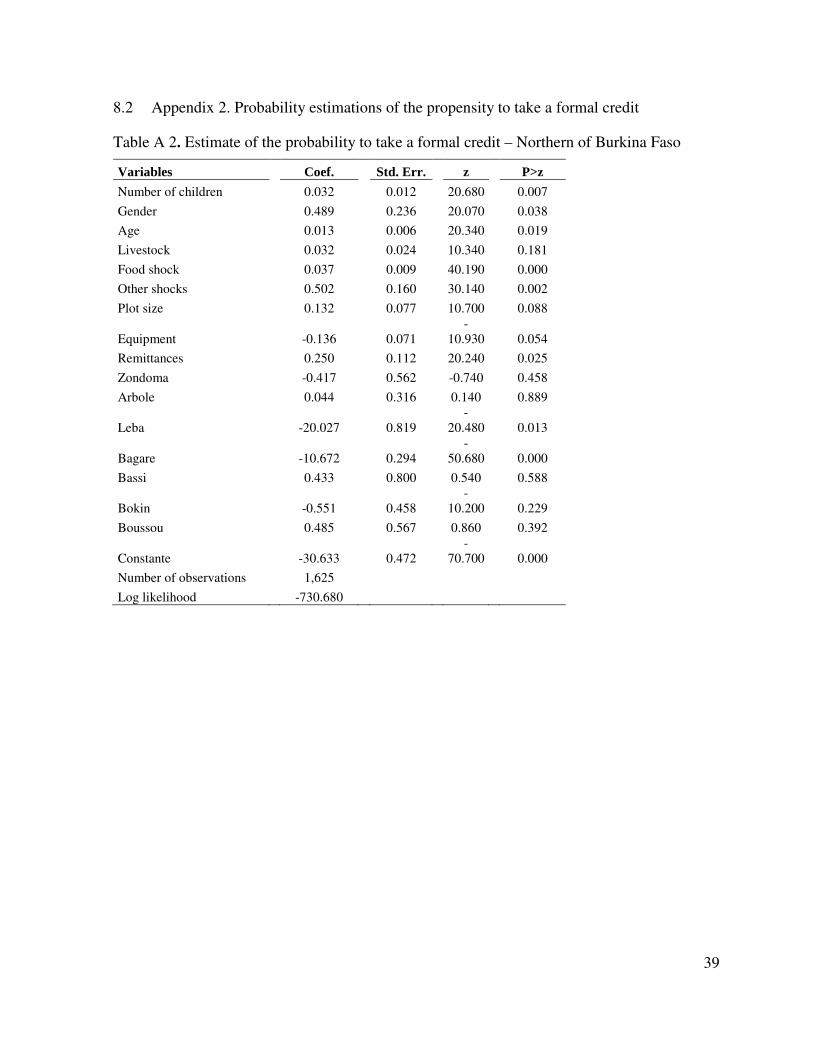
Appendix 2 presents the results of the probability estimates. Figure 5 presents the distribution
of propensity scores after elimination of unmatched observations for the north and south zones.
It shows that we have substantial common support and that we can match the propensity scores
of the treatment and comparison groups, as suggested by Smith and Todd (2005).
20
Northern region Southern region
Figure 5. Common support of the treated and control groups
After the matching, we performed balancing tests (see Appendix 3) to ensure that the averages
of the producers in the treatment group are similar to those in the comparison group for each of
the observable characteristics and in all cases. The matching process resulted in 955
observations for the northern region and 1,311 observations for the southern. Erreur ! Source
du renvoi introuvable. presents the mean of the outcomes after the PSM. However, these are
the arithmetic means and the observed differences should not be confused with the impacts of
the project.
.1 .2 .3 .4 .5Propensity Score
Untreated Treated
21
Table 3. Mean of the outcomes after matching
Provinces of the north of Burkina Faso
2016 2018
Outcomes Control group Treatment group Control group Treatment group
Plot size 1.074 1.011 (!≠) 0.475 0.776 (>)
Yield 292.778 367.744 (>) 468.572 334.948 (<)
Production 253.567 283.992 (!≠) 199.471 235.727 (!≠)
Results of the two-sample t-tests (percentage represents the probability to reject null hypothesis, i.e. no difference,
wrongly): (!≠): mean of the treatment group is not different at 5% and less. (<): mean of the treatment group is
smaller at 5% and less. (>): mean of the treatment group is higher at 5% and less.
4.3 Causal effect identification
The used estimator measures the effect on the entire population. Individuals in the treatment
group (treated or not) are compared to individuals in the control group to evaluate the effect of
the microcredit programme. The estimates take into account all the observations and we estimate
the average treatment effect of microfinance programmes on the entire population (Karlan and
Zinman, 2011; Beaman et al., 2014; Takahashi et al., 2014; Angelucci et al., 2015; Attanasio et
al., 2015; Banerjee et al., 2015; Basu and Wong, 2015; Crépon et al., 2015; Tarozzi, Desai and
Johnson, 2015). We based our analysis on changes in the results between the baseline and final
22
surveys in both groups. In doing so, we mitigated biases related to unobservable characteristics
that are invariant over time. Following Lechner (2011) and Puhani (2012), we estimated the
effect of access to CIPA on outcome through linear regressions described by the following
equation:
(1) ( )
( ) ( )
0 1 2 3
4, 5, 6,1 1 1
i EF EF EF
n n n
i EF i i i i j ii i j
Y T
T Z T Z G
λ λ λ λ
λ λ λ ε= = =
= + Λ + Λ + × Λ
+ × Λ × + × + +
where i
Y is the outcome variable of producer i measured in log, which implies that the impact
of the CIPA is measured in percentage of change. T is a treatment variable that is equal to 1 if
the producer has benefited from CIPA and 0 otherwise. We consider baseline (2016) and final
(2018) year data. The variable EF
Λ takes the value of 1 if the data relates to the final year and 0
otherwise, and i
Z is a vector of variables used to capture heterogeneity of the treatment effect.
We hypothesize a different effect depending on the (1) gender of the respondent, (2) province,
(3) perceived performance of the extension services, (4) POs and (5) input suppliers. The
variable regarding the extension services takes the value of 1 if the answer to the question “How
often do you contact an extension agent to discuss your cornfield or cowpea?” is less than or
equal to 3 months. For PO perceived efficiency, we constructed an index using a factor analysis
(Cameron and Trivedi, 2010) based on three questions. The first question is, “In your opinion
do the services provided by your farmer organization have a positive effect on the improvement
of your agricultural production?” (No=1; Yes=2). The second question is, “Do these services
facilitate access to agricultural inputs?” (Always=4; Often=3; Rarely=2; Never=1). Finally, the
third question is, “Do these services make it easier for you to manage your agricultural
23
products?” (Always=4; Often=3; Rarely=2; Never=1). We based the input suppliers’ perceived
quality on two questions: the first question is “Are you able to get inputs on time from your
suppliers?” (1=Always or often and 0 otherwise), and the second is “In your opinion, are your
suppliers' inputs of good quality?” (1=Yes; 0=No). The perceived quality takes the value of 1 if
the value of the two variables is 1 and 0 otherwise. jG is a vector of control variables. Because
of the interest in credit, we introduce the perceived quality of credit as a control variable. We
used a factor analysis to construct this index and based it on the following questions. “Does the
RCPB network make it easier for you to access credit?” (2=Yes; 1=No); “How do you
appreciate the requirements of this network to obtain credit?” (1=Too hard; 2=Hard; 3=Fair;
4=Very acceptable); “Have you had difficulty accessing credit?” (1= Yes; 2=No); and “Does
access to credit improve your agricultural production?” (2= Yes; 1=No). Finally, the variable
iε is an error term.
The average treatment effect (access to CIPA) is:
(2) 1 2,1
nATE
PSM iiZτ λ λ
== +
Standard deviations were estimated by correcting for a heteroskedasticity of the error term using
White's corrector. Table A6 and Table A7 in the appendix present the descriptive statistics of
the variables used in the estimations.
24
5 Estimated results
5.1 Main results
Tables 4 and 5 present the estimated impact of the CIPA. The detailed tables of results are
reported in the appendix (Table A 8 and Table A 9). Because the outcome variables are in log,
the estimated coefficient multiplied by 100 gives the percentage of increase following the CIPA.
Plot size
As mentioned before, we did not have any expectation of the impact of the CIPA on the plot
size. In the northern part of Burkina Faso, the “generic” impact of the CIPA is positive but not
significant at 10%. For women who in the province of Zondoma, the impact is positive, with an
increase of 113.9% in comparison to men. Note that the mean of the plot size for women in the
province of Zondoma (Passoré) is 0.805 ha (0.866 ha), while it is 1.287 ha (1.342 ha) for men.
The results contrasted for southern Burkina Faso. For the women, the impact is positive and
significant at less than 1% if belonging to Ziro while it is negative for those in Nahouri.12 In the
province of Ziro, the impact is positive (=0.545) if the services of the POs are perceived as of
quality, while it is negative at -0.875 (=0.545-1.420) in the province of Nahouri. This result
suggests that there is a reallocation of area to other crops because of smaller available area, the
means of plot sizes being 1.736 ha and 2.164 ha in the provinces of Nahouri and Ziro,
respectively.13 It could also be because of more diversified agricultural activities. In 2016, the
12 The test of the equality of the coefficients of CIPA X Female and CIPA X Nahouri X Female (F=7.44; Prob > F = 0.007).
13 The density of the population in Nahouri is about 24% higher than the population of Ziro (INSD, 2016).
25
base year, the share of plot used in the production of maize was 49% in Nahouri, while it was
64% in Ziro. There is ongoing discussion about the relationship between plot size and
productivity [see e.g., Kimhi (2006) and Barrett, Bellemare and Hou (2010)], which is explained
by imperfection of the inputs market and the quality of soil. The first explanation could apply
to the present study, as the positive impact of CIPA may occur if the suppliers of inputs are
perceived to be of good quality in the province of Nahouri.14 However, it is not significant in
the province of Ziro.
Yield
We expected a positive and significant impact of the CIPA on the yield, which was the case for
women in northern Burkina Faso. The perceived quality of the services of the PO and extension
activities have a positive, significant impact at 1.194 and 0.906, respectively. These results
confirm that to be efficient in enhancing producers’ performance, the deployment of agricultural
financial services must include capacity building of PO and good extension activities. 15
In southern Burkina Faso, the “generic” impact of the CIPA is positive but not significant at
10%. Extension activities are important in the impact of the CIPA with an increase of yield by
253.5% and 14%16 if they are perceived to be of good quality in the provinces of Ziro and
14 We test the following null hypothesis: (Input suppliers) + (Inputs suppliers X Nahouri) = 0 (F = 3.84; Prob > F = 0.050).
15 As indicated by Zongo et al. (2016) and Dabat, Lahmar and Guissou (2012), the production of cowpeas is mostly done in association with other crops. It is possible to speculate that the impact on the yield of other crops is also positive.
16 We test the null hypothesis: Extension = Extension X Nahouri (F= 21.08; Prob > F = 0.000).
26
Nahouri, respectively. The negative result for the perceived quality of input suppliers is
puzzling.
Overall, these results are in line with the literature on the impact of microcredit on agricultural
productivity (e.g., Girabi and Mwakaje, 2013). However, they highlight the heterogeneity of the
results, which must be taken into account. The availability of contraband inputs due to the
proximity of Ghana could explain this puzzling result of the perceived quality of input suppliers.
The province of Nahouri is also characterized by the presence of several gold panning sites
being a source of revenue and thus competing with agricultural production (Ouédraogo and
Mundler, 2019; Sangaré, Mundler and Ouédraogo, 2016).
Production and food availability
We also expected a positive impact on production because of the positive impact of the CIPA
on plot size and yield. This is the case for women, who showed a 62.5% increase of the
production in the province of Passoré and higher impact in Zondoma at 290% (=0.625+2.281).
Extension activities, input suppliers and PO service quality have a positive effect on the impact
of the CIPA. Because of this increase of production, there is also an improvement in food
available at the household level.
In southern Burkina Faso, especially in Ziro, the impact of CIPA on production and food
availability is positive if the PO and the extension activities are perceived to be of good quality.
However, the impact is negative in the province of Nahouri when producers are female. In
addition, the puzzling negative impact on plot size of CIPA when input suppliers are perceived
to be of good quality are observed in production and food quality.
27
Sales
In the northern part of Burkina Faso, CIPA has a positive impact on sales for women, with an
increase of 334.1% of sales in kg in the province of Zondoma (compared to men). Moreover,
the impact is higher when the extension activities are considered to be of good quality. When
considering sales in FCFA, the impact is higher when POs are of good quality. These results are
interesting because they indicate that CIPA allows women to generate additional income from
their agricultural activities and is therefore a factor in their empowerment. Indeed, Malapit and
Quisumbing (2015) found that women’s empowerment by access to credit has a strong impact
on child nutrition. Moreover, Wouterse (2019) found that enhancing the empowerment of
women leads to important productivity gains.
In the southern part of Burkina Faso, as indicated in Table 5, the impact of the CIPA on sales in
kg as well as in FCFA is positive and significant at less than 1%. This is also the case for
producers in the province of Ziro and perceiving extension activities to be of good quality. In
the province of Nahouri, the impacts are also positive but smaller than those of Ziro: 274%
versus 40% 17 for the sales in kg, respectively, and 265.7% versus 7.5%18 for sales in FCFA,
respectively.
17 We test the null hypothesis: Extension = Extension X Nahouri (F = 20.97; Prob > F = 0.000).
18 We test the null hypothesis: Extension = Extension X Nahouri (F = 19.52; Prob > F = 0.000).
28
Table 4. Estimated impact of the CIPA in the Northern of Burkina Faso using nearest neighbor matching
Variables Plot size Yield Production Food Sales (kg) Sales (FCFA)
CIPA 0.053 -0.539 0.003 -0.086 0 5.213
(0.82) (1.089) (1.135) (1.049) (.) (5.603)
CIPA X Female 0.164 0.927** 0.625* 0.269 0.932 2.116
(0.377) (0.517) (0.43) (0.412) (0.702) (3.212)
CIPA X Zondoma - - - - - -
- - - - - -
CIPA X Zondoma X Female 1.139** 0.902 2.281*** 1.987*** 3.341*** 3.341
(0.636) (0.79) (0.714) (0.691) (1.416) (4.819) CIPA X Perceived quality of Extension 0.046 1.194*** 1.186*** 1.142*** 1.832*** 11.828***
(0.389) (0.529) (0.516) (0.482) (0.868) (2.807)
Extension X Zondoma - - - -
- -
- - - -
- -
PO -0.358 0.906*** 0.524*** 0.595*** 0.382 3.991***
Probability to reject null hypothesis (i.e. no effect) wrongly: ***: 01% and less; **: 05% and less; *:10% and less. Robust standard errors in parentheses. - : dropped because of collinearity.
29
Table 5. Estimated impact of the CIPA in the Southern of Burkina Faso using nearest neighbor matching
Variables Plot size Yield Production Food Sales (kg) Sales (FCFA)
CIPA -0.197 0.221 0.023 0.000 4.063*** 3.555***
(0.298) (0.318) (0.281) (0.279) (0.583) (0.572)
CIPA X Female 1.092*** 0.653 1.744** 1.869** -0.648 -0.564
(0.412) (0.538) (0.727) (0.748) (0.550) (0.591)
CIPA X Nahouri - - - - - -
- - - - - -
CIPA X Nahouri X Female -1.323** -0.801 -2.121** -2.408*** - -
Probability to reject null hypothesis (i.e. no effect) wrongly: ***: 01% and less; **: 05% and less; *:10% and less. Robust standard errors in parentheses. - : dropped because of collinearity.
30
5.2 Robustness check
To check for robustness, we made our estimations using Radius and Kernel matching methods
(Appendix 8.5). Overall, our results are constant with the matching approach used. Specifically,
when producers are women and when the extension services and PO are perceived to be of good
quality, the impacts of CIPA are robust. The puzzling result for the performant input suppliers
is also robust when analysing the results of the southern part of Burkina Faso.
6 Conclusions
In 2015, The International Development Research Center funded Développement International
Desjardins to implement the Financial Services and Deployment of Agricultural Innovations in
Burkina Faso project. This project intended to develop and test a financial service model for
deploying and scaling up innovative practices designed to increase the productivity of
agricultural smallholders in Burkina Faso.
For DID, access to finance is essential but not sufficient to insure agricultural development. The
objective of this research was therefore to validate if an improved financial scheme, the CIPA,
based on improved and integrated access to credit, inputs and capacity building program have
an impact on smallholder farmers’ well-being while controlling for selection bias and taking
gender, producers’ organizations and the quality of services into account.
The methodological approach of the evaluation is based on the construction of a counterfactual
to the beneficiaries of CIPA. The strategy was to use the observable characteristics of producers
and their farms to identify, in non-CIPA areas, producers who have characteristics that have an
impact on the propensity to take a credit similar to the CIPA beneficiary producers. In non-
31
CIPA areas, producers have access to conventional credit, inputs available on the market and
training separately
We used a Difference-in-Difference approach and based our analysis on changes in the results
between the baseline and final surveys in both groups. In doing so, we mitigated biases related
to unobservable characteristics that are invariant over time.
The results show that CIPA has a positive effect on area planted, yield, production and sales.
CIPA was successful at improving agricultural performances, because the project addressed at
the same time the financial constraints of small farmers, the problem of limited access to
improved and timely available inputs and the lack of supervision and coordination of the
different agricultural stakeholders (credit suppliers, input suppliers, POs, farmers, extension
agents). The results then suggest that support to smallholder farmers works best when a more
integrated approach is taken.
However, there is heterogeneity regarding gender, province and perceived quality of services to
producers (provided by extension agents, producers’ organization and input suppliers). The
perceived quality of services is important to ensure the ability of financial services to encourage
innovations in cowpea and maize production in Burkina Faso; scaling up this intervention has
to consider perceived quality. On the other hand, there is a higher positive impact for women
than for men, which shows that intervention with women is more effective in improving the
living conditions of rural households. Development projects should therefore be more
supportive of women. Finally, in the southern provinces, the smaller impacts of CIPA are likely
the result of a lack of producer interest due to factors such as easy access to contraband inputs
and the presence and competition of gold panning. There is a need to better understand and
32
integrate contextual factors into decisions and intervention choices to ensure that the desired
goals are achieved.
7 References
Abate, G. T., Rashid, S., Borzaga, C., & Getnet, K. (2015). Rural Finance and
Agricultural Technology Adoption in Ethiopia. Does Institutional Design Matter? IFPRI
Discussion Paper 01422.
Abdulai, A., & Huffman, W.E. (2005). The Diffusion of New Agricultural Technologies:
The Case of Crossbred-Cow Technology in Tanzania. American Journal of Agricultural
Economics, 87 (3), 645-659.
AGRA (2014). Achieving pro-poor green revolution in dry lands of Africa: Linking
fertilizer micro dosing with input-output markets to boost smallholder farmers’ livelihoods in
Burkina Faso. Final report AGRA-Microdose project. 72 p.
Angelucci, M., Karlan, D., & Zinman, J. (2015). Microcredit Impacts: Evidence from a
Randomized Microcredit Program Placement Experiment by Compartamos Banco. American
Probability to reject null hypothesis (i.e. no effect) wrongly: ***: 01% and less; **: 05% and less; *:10% and less. Robust standard errors in parentheses. - : dropped because of collinearity.
52
Table A 11. Estimated impact of the CIPA in the Northern region using Radius matching
Variables Plot size Yield Production Food Sales (kg) Sales (FCFA)
CIPA 0.399 -0.402 0.236 0.209 0.739 0.722
(0.421) (0.436) (0.467) (0.451) (0.556) (3.406)
CIPA X Female -0.103 1.044*** 0.834* 0.704* 1.153* 1.5
(0.395) (0.423) (0.515) (0.465) (0.721) (3.260)
CIPA X Zondoma - - - - - -
- - - - - -
CIPA X Zondoma X Female 1.555*** -1.150** 1.203** 1.115** 1.832* 2.974
(0.534) (0.639) (0.684) (0.639) (1.118) (4.087) CIPA X Perceived quality of Extension 0.234 0.558 0.749** 0.657** 0.525 7.711***
(0.302) (0.423) (0.391) (0.369) (0.540) (2.260)
Extension X Zondoma -0.212 0.319 0.173 0.171 0.264 -1.224
(0.382) (0.656) (0.658) (0.607) (0.781) (4.348)
PO -0.119 0.444*** 0.320*** 0.379*** -0.688 2.658***
Probability to reject null hypothesis (i.e. no effect) wrongly: ***: 01% and less; **: 05% and less; *:10% and less. Robust standard errors in parentheses. - : dropped because of collinearity.
53
Table A 12. Estimated impact of the CIPA in the Southern region using Kernel matching
Variables Plot size Yield Production Food Sales (kg) Sales (FCFA)
CIPA -0.299 0.384 0.084 0.025 3.822*** 3.311***
(0.307) (0.370) (0.351) (0.353) (0.535) (0.528)
CIPA X Female 1.037*** 0.443 1.478** 1.583** 0.888 1.257
(0.339) (0.579) (0.624) (0.629) (0.878) (0.862)
CIPA X Zondoma 0.247* -0.286 -0.038 -0.006 -3.969*** -3.798***
(0.149) (0.208) (0.229) (0.233) (0.763) (0.736)
CIPA X Zondoma X Female -1.201*** -0.464 -1.662** -1.927** -1.33 -1.607
(0.449) (0.736) (0.765) (0.780) (0.997) (1.023) CIPA X Perceived quality of Extension 0.631** 1.762*** 2.390*** 2.288*** -0.535 0.218
(0.264) (0.582) (0.559) (0.557) (0.640) (0.678)
Extension X Zondoma -1.199*** -1.344** -2.538*** -2.337*** 0.66 0.182
(0.348) (0.678) (0.727) (0.751) (0.744) (0.755)
PO -0.4 -0.446 -0.845* -0.875* -0.052 0.202
(0.271) (0.401) (0.506) (0.513) (0.825) (0.771)
PO X Zondoma 1.047** 0.655 1.697 1.639 1.809* 1.547*
Probability to reject null hypothesis (i.e. no effect) wrongly: ***: 01% and less; **: 05% and less; *:10% and less. Robust standard errors in parentheses. - : dropped because of collinearity.
54
Table A 13. Estimated impact of the CIPA in the Southern region using Radius matching
Variables Plot size Yield Production Food Sales (kg) Sales (FCFA)
CIPA -0.299 0.384 0.084 0.025 3.822*** 3.311***
(0.307) (0.370) (0.351) (0.353) (0.535) (0.528)
CIPA X Female 1.037*** 0.443 1.478** 1.583** 0.888 1.257
(0.339) (0.579) (0.624) (0.629) (0.878) (0.862)
CIPA X Zondoma 0.247* -0.286 -0.038 -0.006 -3.969*** -3.798***
(0.149) (0.208) (0.229) (0.233) (0.763) (0.736)
CIPA X Zondoma X Female -1.201*** -0.464 -1.662** -1.927** -1.33 -1.607
(0.449) (0.736) (0.765) (0.780) (0.997) (1.023) CIPA X Perceived quality of Extension 0.631** 1.762*** 2.390*** 2.288*** -0.535 0.218
(0.264) (0.582) (0.559) (0.557) (0.640) (0.678)
Extension X Zondoma -1.199*** -1.344** -2.538*** -2.337*** 0.66 0.182
(0.348) (0.678) (0.727) (0.751) (0.744) (0.755)
PO -0.4 -0.446 -0.845* -0.875* -0.052 0.202
(0.271) (0.401) (0.506) (0.513) (0.825) (0.771)
PO X Zondoma 1.047** 0.655 1.697 1.639 1.809* 1.547*
Probability to reject null hypothesis (i.e. no effect) wrongly: ***: 01% and less; **: 05% and less; *:10% and less. Robust standard errors in parentheses. - : dropped because of collinearity.


![Study on Rural Microfinance from the Perspective of ......of agricultural microfinance mostly comes from the information asymmetry.[4] Inefficient management and lack of market information](https://static.documents.pub/doc/80x56/6077ab3f6ed9a24c8524c187/study-on-rural-microfinance-from-the-perspective-of-of-agricultural-microfinance.jpg)


