AbstractWe explore the predictive power of historical news sentiments based on financial market performance to forecast financial news sentiments. We define news sen-timents based on stock price returns averaged over one minute right after a news article has been released. If the stock price exhibits positive (negative) return, we classify the news article released just prior to the observed stock return as positive (negative). We use Wikipedia and Gigaword five corpus articles from 2014 and we apply the global vectors for word representation method to this corpus to cre-ate word vectors to use as inputs into the deep learning TensorFlow network. We analyze high-frequency (intraday) Thompson Reuters News Archive as well as the high-frequency price tick history of the Dow Jones Industrial Average (DJIA 30) Index individual stocks for the period between 1/1/2003 and 12/30/2013. We apply a combination of deep learning methodologies of recurrent neural network with long short-term memory units to train the Thompson Reuters News Archive Data from 2003 to 2012, and we test the forecasting power of our method on 2013 News Archive data. We find that the forecasting accuracy of our methodology improves when we switch from random selection of positive and negative news to selecting the news with highest positive scores as positive news and news with highest nega-tive scores as negative news to create our training data set.
Keywords Sentiment analysis · Deep learning · Forecasting
This work was supported by MEXT as Exploratory Challenges on Post-K computer (Studies of Multi-level Spatiotemporal Simulation of Socioeconomic Phenomena, Macroeconomic Simulations) and JSPS KAKENHI Grant Number 17H02041.
1 College of Science and Technology, Nihon University, Chiba 274-8501, Japan2 Metropolitan College, Boston University, Boston, MA 02215, USA3 Center for Polymer Studies, Boston University, Boston, MA 02215, USA4 Graduate School of Science, Kyoto University, Kyoto 606-8502, Japan5 Research Institute of Economy, Trade and Industry, Tokyo 100-8901, Japan
34 Journal of Computational Social Science (2019) 2:33–46
1 3
Introduction
With the latest technological developments and advancement in data analytics, financial professionals and economists have increasingly explored new artificial intelligence and machine learning approaches to enhance financial market fore-casting results. Qualitative inputs such as the news, corporate earnings’ reports, corporate press releases, and regulatory announcements play an important role in shaping the decisions of central bankers, economic strategists, investment pro-fessionals, securities traders, and portfolio managers regarding global investment decisions, portfolio re-balancing, as well as exploring new investment products and opportunities. The amount of streaming news and information that financial professionals and market participants need to read on daily basis is of proportions that surpass a human capability to process and utilize such information in real time decision making processes. To overcome human limitations, the application of deep learning approaches to finance research has received a great deal of atten-tion from both practitioners and academicians.
Forecasting financial time-series is probably one of the most challenging problems in financial market analysis. Researchers have analyzed vast amount of financial market transactions to detect repeated patterns of price movements using statistical and econometric models. The noisy and stochastic nature of mar-kets, however, adversely affects the forecasting accuracy of the aforementioned models. Hence, the promising results obtained using artificial intelligence and deep learning have attracted the attention of the finance and economics research-ers in a quest to improve economic forecasting results.
In a study using deep learning for portfolio construction, Lee and Yoo (2018) use recurrent neural network (RNN) [9] with long short-term memory (LSTM) units [8], to predict potential returns of a collection of investments [13]. They construct diver-sified portfolios by giving thresholds for the potential returns and examine the return and risk levels of the portfolios. These results show that it is possible to build a port-folio given a desired degree of return and risk by adjusting the thresholds, which is promising in asset allocations reflecting investors risk preference. In another study, Bao and Rao (2017) present a novel deep learning framework where wavelet trans-forms (WT), stacked autoencoders (SAEs) and LSTM are combined for stock price forecasting [1]. They introduce SAEs for hierarchically extracted deep features into stock price forecasting. Results show that the proposed model outperforms other similar models in both predictive accuracy and profitability performance.
Deep learning has successfully been used for choosing and pricing securities, constructing investment portfolios, and active risk management [7] and natural lan-guage processing (NLP) or computational linguistics has become increasingly pow-erful due to increased data availability. Recently developed NLP techniques enable capturing sentiments more accurately and extracting text semantics more effectively. Articles that utilize NLP techniques to predict financial markets are establishing a research field of natural language based financial forecasting (NLFF). Xing et al. (2018) offer a summary of NLFF methodologies in a review study, ordering and structuring techniques and applications from related work [23].
35
1 3
Journal of Computational Social Science (2019) 2:33–46
RNNs have also been applied to stock return predictions and portfolio re-balanc-ing by adjusting potential return threshold levels used to classify assets, based on risk-return trade-offs [12]. Using deep learning methodology, based on convolu-tional neural networks (CNNs) and high-frequency time series extracted from limit order books, to predict future stock price movements, for example, has achieved bet-ter results compared to results obtained by multilayer neural networks and support vector machines (SVM) [21, 22].
The ability of deep learning to extract features from a large set of raw data without relying on prior knowledge of predictors makes these methodologies very attractive for stock market prediction at high frequencies. The algorithms vary con-siderably in the choice of network structure, activation function, and other model parameters, and their performance strongly depends on the method of data repre-sentation. Researchers have explored both the advantages and drawbacks of deep learning algorithms for stock market analysis and prediction. Using high-frequency intraday stock returns as input data, the authors in [3] study the effects of three unsu-pervised feature extraction methods: (1) principal component analysis, (2) autoen-coder, and the (3) restricted Boltzmann machine, and their ability to predict future market behavior. Results show that deep neural networks can extract additional information from the residuals of the autoregressive model and can improve model prediction performance.
One of the major advantages in using deep learning for finance is to embed a large collection of information into investment decisions and portfolio construc-tion. This can be accomplished by information compression into a smaller feature space. Studies have reported that non-linear feature reduction performed by deep learning tools is effective in price trend prediction [20]. Deep learning could offer remedies for natural language complexity and ambiguity, not present in traditional methods of text mining. For instance, RNN with LSTM units employs hierarchical structures including large number of hidden layers, to automatically extract features from ordered sequences of words and capture non-linear relationships or context-dependent meanings of words. Kraus and Feuerriegel (2017) study the use of deep neural networks for financial decision making and report higher accuracy in predict-ing stock price movements based on financial disclosures, compared to traditional machine learning techniques [11].
We explore the use of deep learning hierarchical models for financial prediction and classification. Our hypothesis is that applying deep learning methods to financial forecasting can enhance the results by complementing standard methods in finance. In particular, deep learning can detect and exploit interactions in the data that might be invisible to economic models. We build our research on multi-agent simulation models of sentiments that include influences of market trends, neighbours’ agents, and the propensity of the market [18].
Stock trader models in the multi-agent simulation have mainly modeled agents monitoring the stock price only. However, in the real world, traders trade stocks based on both the price change of stocks and news. In this paper, we combine the NLP machine learning approach, extracting news with positive and negative senti-ments, with the use of deep learning hierarchical models to explore financial predic-tion and classification. We consider whether agents can predict the change of stock
36 Journal of Computational Social Science (2019) 2:33–46
1 3
prices, arising from sentiments of financial and economic news, by training the model (agent) using RNN with LSTM units. We find that the approach of choosing training data plays a significant role in the performance of the deep learning algo-rithms. In other words, if we choose the training data randomly from a large corpus of news, the results are inferior to the ones where we select the positive and negative classes of news hierarchically.
The rest of this paper is organized as follows: in Sect. 2, we describe the data we use and present basic statistics. Section 3 is on the methods we use. In Sect. 4, we present our results, and in Sect. 5 we offer our discussion and concluding remarks. In particular, we discuss the application of deep learning in NLP to multi-agent sim-ulation in relation to high performance computing.
Data
We use two data sets in this paper. One is the Thomson Reuters News Archive (TRNA) and the other is the Thomson Reuters Tick History (TRTH) for the DJIA 30 Index for the period between 2003 and 2013. Since DowDuPont Inc. (DWDP) is added to the DJIA 30 on September 1st, 2017, it is not included in our data and the analysis in this paper. Hence, we hereafter refer to the pricing data as “DJ29” instead of DJ30.
TRNA is a news archive provided by Thompson Reuters and it is a collection of third party news stories, organized and ordered by the time when the news were published. The time stamps of the news documents include time precision up to mil-liseconds, and each news item contains all sequencing and control data. The news archive contains many types of news (e.g., financial markets or sports news) in 128 languages.
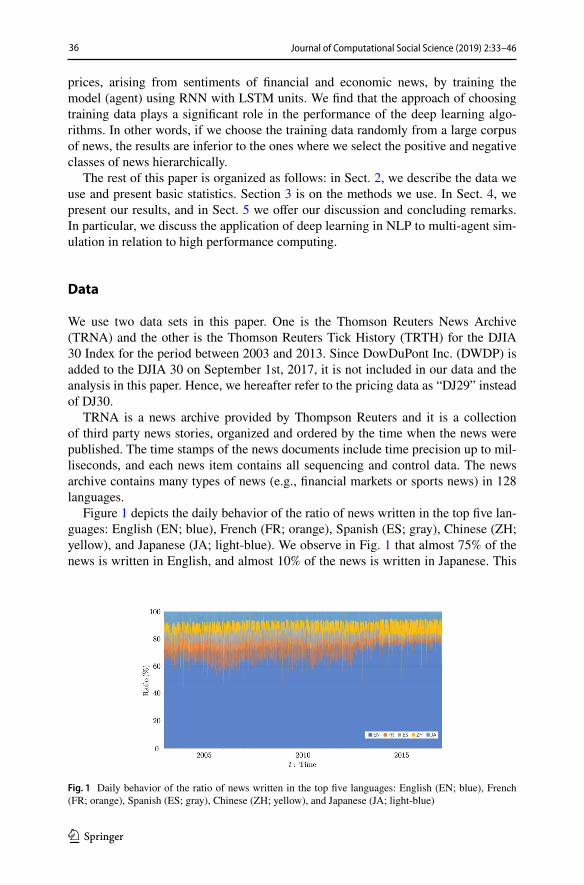
Figure 1 depicts the daily behavior of the ratio of news written in the top five lan-guages: English (EN; blue), French (FR; orange), Spanish (ES; gray), Chinese (ZH; yellow), and Japanese (JA; light-blue). We observe in Fig. 1 that almost 75% of the news is written in English, and almost 10% of the news is written in Japanese. This
Fig. 1 Daily behavior of the ratio of news written in the top five languages: English (EN; blue), French (FR; orange), Spanish (ES; gray), Chinese (ZH; yellow), and Japanese (JA; light-blue)
37
1 3
Journal of Computational Social Science (2019) 2:33–46
behavior is stable during the period that we analyze in this paper. Although almost 15% of the news is written in French and Spanish until 2014, news articles written in these languages decrease afterwards. On the other hand, the news written in Chinese is increasing. In this paper, we investigate the news written in English, because of its strong presence in the data.
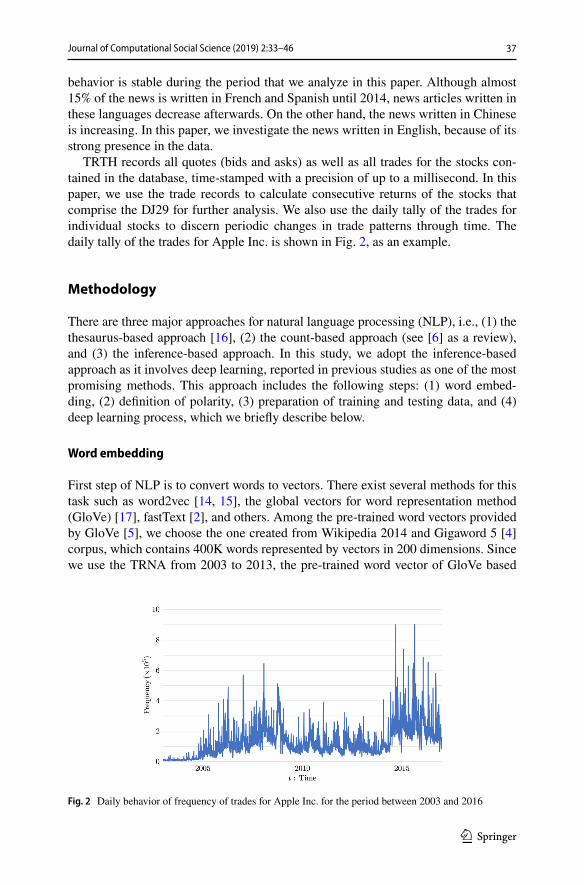
TRTH records all quotes (bids and asks) as well as all trades for the stocks con-tained in the database, time-stamped with a precision of up to a millisecond. In this paper, we use the trade records to calculate consecutive returns of the stocks that comprise the DJ29 for further analysis. We also use the daily tally of the trades for individual stocks to discern periodic changes in trade patterns through time. The daily tally of the trades for Apple Inc. is shown in Fig. 2, as an example.
Methodology
There are three major approaches for natural language processing (NLP), i.e., (1) the thesaurus-based approach [16], (2) the count-based approach (see [6] as a review), and (3) the inference-based approach. In this study, we adopt the inference-based approach as it involves deep learning, reported in previous studies as one of the most promising methods. This approach includes the following steps: (1) word embed-ding, (2) definition of polarity, (3) preparation of training and testing data, and (4) deep learning process, which we briefly describe below.
Word embedding
First step of NLP is to convert words to vectors. There exist several methods for this task such as word2vec [14, 15], the global vectors for word representation method (GloVe) [17], fastText [2], and others. Among the pre-trained word vectors provided by GloVe [5], we choose the one created from Wikipedia 2014 and Gigaword 5 [4] corpus, which contains 400K words represented by vectors in 200 dimensions. Since we use the TRNA from 2003 to 2013, the pre-trained word vector of GloVe based
Fig. 2 Daily behavior of frequency of trades for Apple Inc. for the period between 2003 and 2016
38 Journal of Computational Social Science (2019) 2:33–46
1 3
on Wikipedia 2014, contains words that have commonly been used during the same period.
Polarity
We define the polarity (i.e., positive or negative) of articles based on stock price changes. We consider the news of asset i at time t, and denote the average of the stock prices over a one minute period prior to the news being published by p̄b,i . Sim-ilarly, we denote the average of the stock price over the one minute period after the news has been published by p̄a,i . Then, we define the polarity of the news based on the observed stock log return:
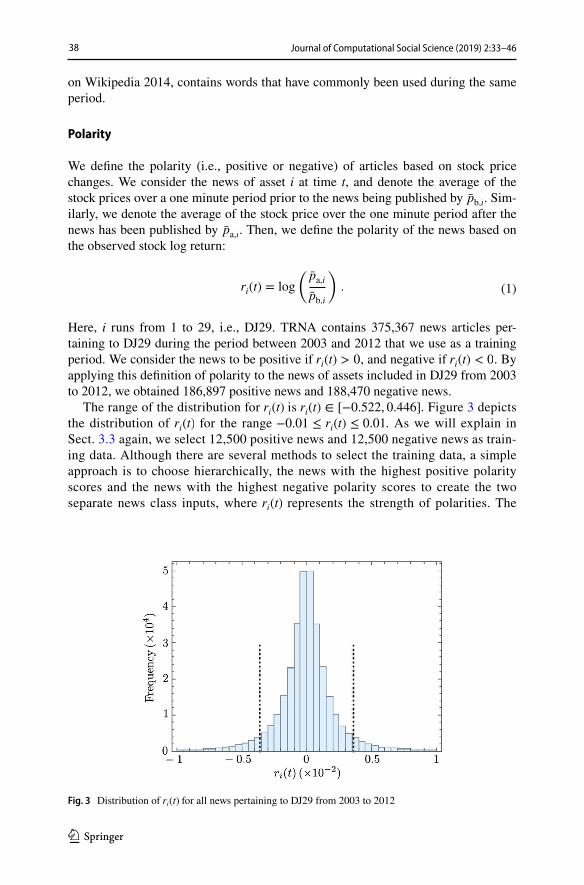
Here, i runs from 1 to 29, i.e., DJ29. TRNA contains 375,367 news articles per-taining to DJ29 during the period between 2003 and 2012 that we use as a training period. We consider the news to be positive if ri(t) > 0 , and negative if ri(t) < 0 . By applying this definition of polarity to the news of assets included in DJ29 from 2003 to 2012, we obtained 186,897 positive news and 188,470 negative news.
The range of the distribution for ri(t) is ri(t) ∈ [−0.522, 0.446] . Figure 3 depicts the distribution of ri(t) for the range −0.01 ≤ ri(t) ≤ 0.01 . As we will explain in Sect. 3.3 again, we select 12,500 positive news and 12,500 negative news as train-ing data. Although there are several methods to select the training data, a simple approach is to choose hierarchically, the news with the highest positive polarity scores and the news with the highest negative polarity scores to create the two separate news class inputs, where ri(t) represents the strength of polarities. The
(1)ri(t) = log
(
p̄a,i
p̄b,i
)
.
Fig. 3 Distribution of ri(t) for all news pertaining to DJ29 from 2003 to 2012
39
1 3
Journal of Computational Social Science (2019) 2:33–46
right dotted line in Fig. 3 is at ri(t) = 0.00354 corresponding to the polarity of the top 12,500th news. On the other hand, the left dotted line is at ri(t) = −0.00364 corresponding to the polarity of bottom 12,500th news or the polarity or the 12,500th highest negative polarity.
Training data
The distribution of the length of the initial set of news articles, li(t) is shown in the left panel of Fig. 4. The peak near the origin in this figure represents mostly news headlines. When we construct a natural language processing model, upon review of the positive and negative article classes, we find that the longer arti-cles are classified more appropriately compared to the short articles including the headlines. Moreover, in the training of RNN with LSTM units, short documents are problematic for the methodology, invoking many zero elements of the vec-tored word matrix, and hence contributing to difficulties in applying the meth-odology. Thus, in our analysis, we use documents with minimum length of 50 words. As we explain in Sect. 3.4, we also set the maximum article length that we analyze at 550 words.
The distribution of length of these articles is shown in the right panel of Fig. 4. The average length of these articles is l̄ ≃ 550 , which corresponds to the maxi-mum sequence length in the training. By introducing this restriction, we obtain 163,538 positive and 168,425 negative news articles for a population of the train-ing data.
In our analysis, we consider two approaches of selecting the training data: (1) random, and (2) hierarchical. The random approach consists of randomly select-ing 12,500 positive news articles from the positive article population and 12,500 negative articles from the negative article population to construct the training news article sets. The hierarchical approach selects the 12,500 news articles with highest positive polarity (top) and the 12,500 news articles with the highest nega-tive polarity (bottom), selected from a list ordered by ri(t) as explained in Fig. 3.
Fig. 4 Distribution of the length of all article (Left). Distribution of the length of articles with length longer than 50 (Right)
40 Journal of Computational Social Science (2019) 2:33–46
1 3
Deep learning
In this study, we use an RNN [9] composed of LSTM units [deep learning] approach to investigate the predictive power of historical news for future news sentiments [8] (see [19] for short review of sentiment analysis and deep learning). Following the RNN methodology, we consider the document as a time series of words. If we denote the order from the beginning of the text as t, the word in the text is denoted by a vector wt as explained in Sect. 3.1. Here, t runs from 0 to a max sequence length that we define. We introduce a vector of a hidden state as ht , and define a recursion formula as follows:
where f (⋅) is an activation function (normally a sigmoid function or tanh function), and Wh and Wx are weighting matrices. We repeat Eq. (2) as many times as the max sequence length, and finally apply a softmax function that outputs values between 0 and 1, effectively giving us the probabilities of positive and negative sentiment. By repeating this procedure, we fine-tune the weight matrices Wh and Wx . However, the RNN has the problem of vanishing or divergence of gradients. The LSTM solves this problem by introducing the gated cells that decide whether to remove or store information. There are four types of gated cells, i.e., an input gate, a neuron with a self-recurrent connection, a forget gate, and an output gate.
Test data
As was explained in Sect. 3.3, we consider the news to be positive if ri(t) > 0 , and negative if ri(t) < 0 . By applying this definition to the news with length longer or equal to 50 pertaining to stocks included in DJ29 in 2013, we obtain 16,856 positive news and 17,213 negative news. We apply our model based on the training dataset from 2003 to 2012 to the test data from 2013.
Results
The values of the hyperparameters are set as follows: the batch size is 24, the num-ber of LSTM units is 64, the number of output classes is 2 (positive and negative), the max sequence length is 550 (average length of news), and the number of train-ing iterations is 400 k. Here, we adopted numbers, which are frequently used in the study of movie reviews, for the batch size and the number of LSTM units.
Training: convergence of accuracy and loss
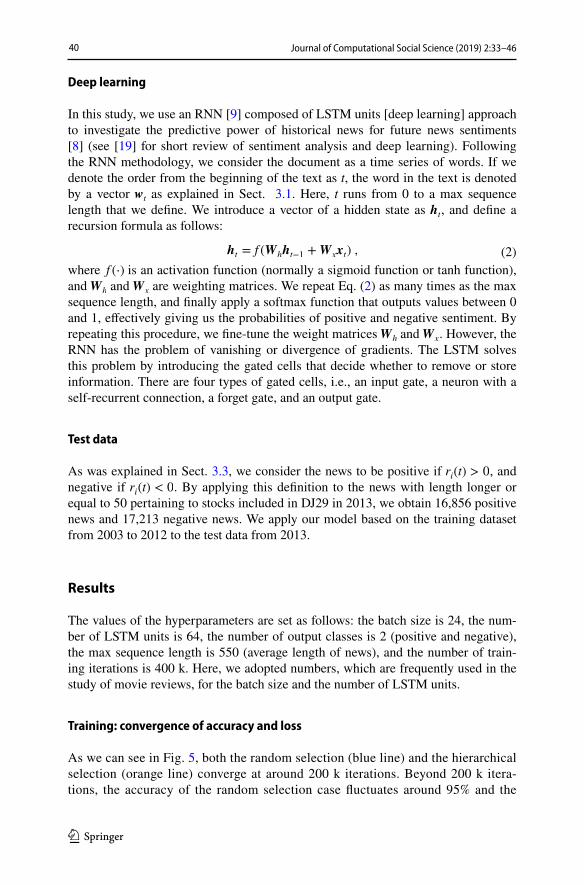
As we can see in Fig. 5, both the random selection (blue line) and the hierarchical selection (orange line) converge at around 200 k iterations. Beyond 200 k itera-tions, the accuracy of the random selection case fluctuates around 95% and the
(2)ht = f (Whht−1 +Wxxt) ,
41
1 3
Journal of Computational Social Science (2019) 2:33–46
accuracy of the hierarchical selection case fluctuates around 97.5%. These results infer that the hierarchical selection case performs better when compared to the random selection case.
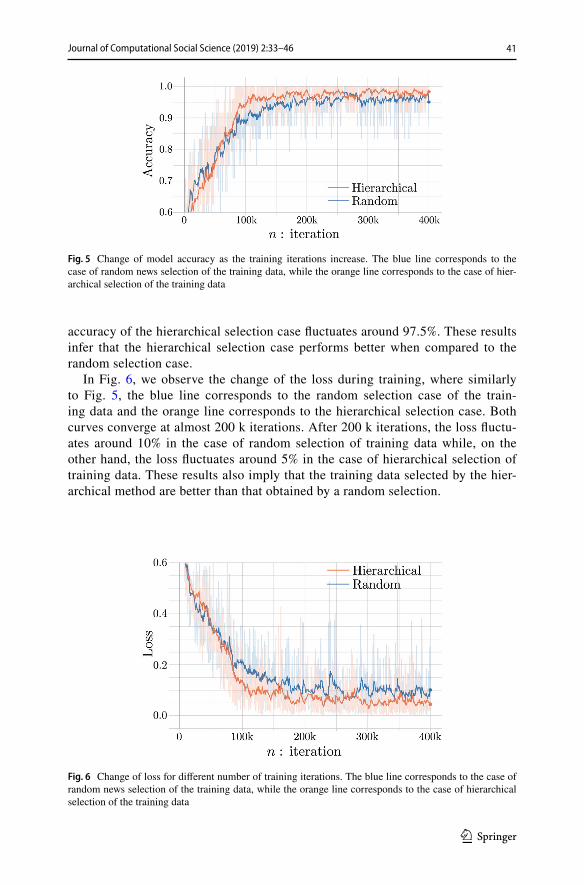
In Fig. 6, we observe the change of the loss during training, where similarly to Fig. 5, the blue line corresponds to the random selection case of the train-ing data and the orange line corresponds to the hierarchical selection case. Both curves converge at almost 200 k iterations. After 200 k iterations, the loss fluctu-ates around 10% in the case of random selection of training data while, on the other hand, the loss fluctuates around 5% in the case of hierarchical selection of training data. These results also imply that the training data selected by the hier-archical method are better than that obtained by a random selection.
Fig. 5 Change of model accuracy as the training iterations increase. The blue line corresponds to the case of random news selection of the training data, while the orange line corresponds to the case of hier-archical selection of the training data
Fig. 6 Change of loss for different number of training iterations. The blue line corresponds to the case of random news selection of the training data, while the orange line corresponds to the case of hierarchical selection of the training data
42 Journal of Computational Social Science (2019) 2:33–46
1 3
Test: predictability of the model
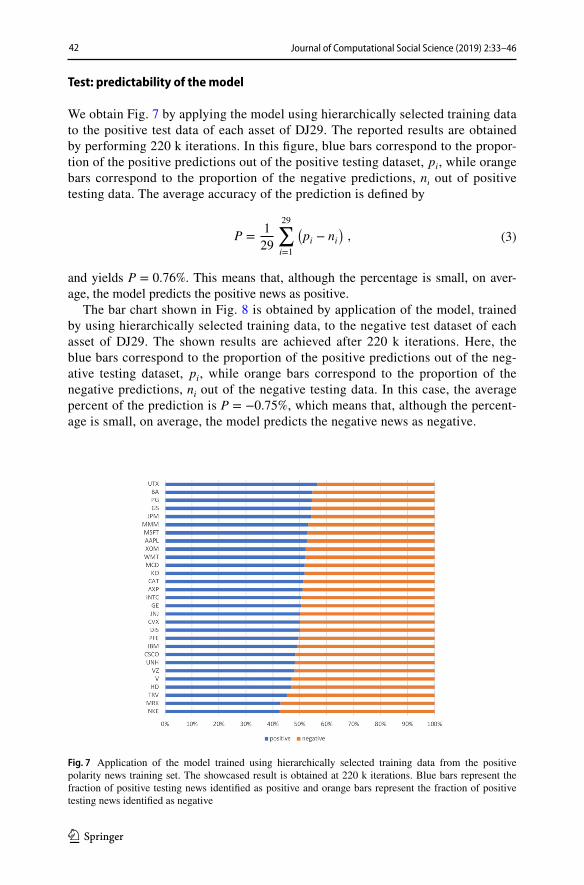
We obtain Fig. 7 by applying the model using hierarchically selected training data to the positive test data of each asset of DJ29. The reported results are obtained by performing 220 k iterations. In this figure, blue bars correspond to the propor-tion of the positive predictions out of the positive testing dataset, pi , while orange bars correspond to the proportion of the negative predictions, ni out of positive testing data. The average accuracy of the prediction is defined by
and yields P = 0.76% . This means that, although the percentage is small, on aver-age, the model predicts the positive news as positive.
The bar chart shown in Fig. 8 is obtained by application of the model, trained by using hierarchically selected training data, to the negative test dataset of each asset of DJ29. The shown results are achieved after 220 k iterations. Here, the blue bars correspond to the proportion of the positive predictions out of the neg-ative testing dataset, pi , while orange bars correspond to the proportion of the negative predictions, ni out of the negative testing data. In this case, the average percent of the prediction is P = −0.75% , which means that, although the percent-age is small, on average, the model predicts the negative news as negative.
(3)P =1
29
29∑
i=1
(
pi − ni)
,
Fig. 7 Application of the model trained using hierarchically selected training data from the positive polarity news training set. The showcased result is obtained at 220 k iterations. Blue bars represent the fraction of positive testing news identified as positive and orange bars represent the fraction of positive testing news identified as negative
43
1 3
Journal of Computational Social Science (2019) 2:33–46
Application of the model trained using randomly selected training data to the positive test data yields P at every 10 k iterations depicted by blue dots in Fig. 9. On the other hand, orange dots in this figure represent the application of the model using randomly selected training data to the negative test data. We connect the dots at same iteration levels with green line when the prediction of the positive test data is better than the prediction of the negative test data. On the other hand, we connect the two dots by a red line when the prediction of the positive test data is worse than
Fig. 8 Application of the model trained by using hierarchically selected training data from the negative polarity news training set. The showcased result is obtained at 220 k iterations. Blue bars represent the fraction of negative testing news identified as positive and orange bars represent the fraction of negative testing news identified as negative by the model
Fig. 9 Change of P for different training iterations in the case of randomly selected training data
44 Journal of Computational Social Science (2019) 2:33–46
1 3
the prediction of the negative test data. This figure shows that the model trained using randomly selected training data predicts the test data as positive on average. When the iteration is n = 340 k, the blue dots are located in the range P > 0 and the orange dots are located in the range P < 0 . Thus, we expect, although the percentage is small, that the model will predict the positive news as positive and the negative news as negative, on average. In general, however, we consider that the iteration range around n = 340 k corresponds to the over-fitting training range, and the results might not be very significant.
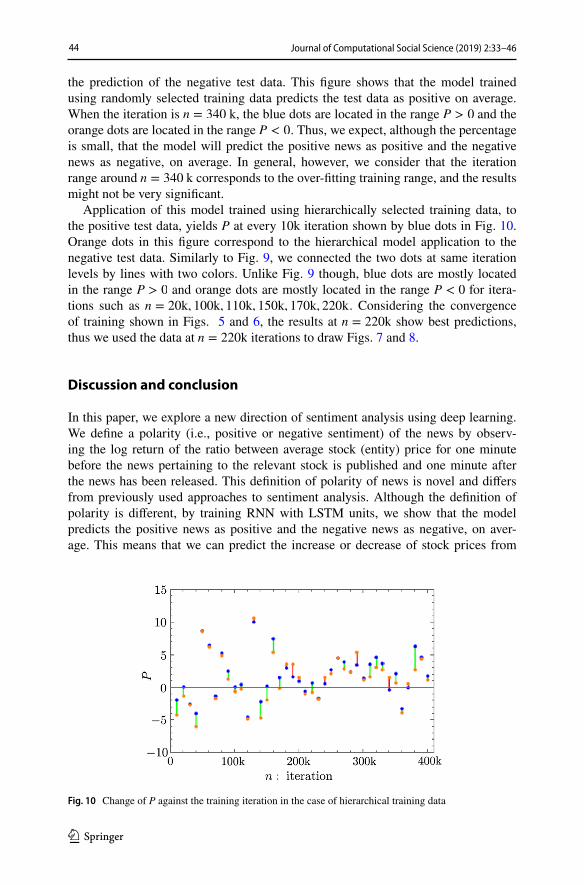
Application of this model trained using hierarchically selected training data, to the positive test data, yields P at every 10k iteration shown by blue dots in Fig. 10. Orange dots in this figure correspond to the hierarchical model application to the negative test data. Similarly to Fig. 9, we connected the two dots at same iteration levels by lines with two colors. Unlike Fig. 9 though, blue dots are mostly located in the range P > 0 and orange dots are mostly located in the range P < 0 for itera-tions such as n = 20k, 100k, 110k, 150k, 170k, 220k . Considering the convergence of training shown in Figs. 5 and 6, the results at n = 220k show best predictions, thus we used the data at n = 220k iterations to draw Figs. 7 and 8.
Discussion and conclusion
In this paper, we explore a new direction of sentiment analysis using deep learning. We define a polarity (i.e., positive or negative sentiment) of the news by observ-ing the log return of the ratio between average stock (entity) price for one minute before the news pertaining to the relevant stock is published and one minute after the news has been released. This definition of polarity of news is novel and differs from previously used approaches to sentiment analysis. Although the definition of polarity is different, by training RNN with LSTM units, we show that the model predicts the positive news as positive and the negative news as negative, on aver-age. This means that we can predict the increase or decrease of stock prices from
Fig. 10 Change of P against the training iteration in the case of hierarchical training data
45
1 3
Journal of Computational Social Science (2019) 2:33–46
observing and investigating the news sentiments. To increase the level of predict-ability, however, as future work, we need to include different approaches and com-binations of methodologies. For this purpose, we consider the following changes to our methodologies: (1) Train the model with different values of the hyperparameters to obtain better results. In order to explore this possibility and use significant num-ber of parameter combinations to improve the forecasting results, we consider utiliz-ing high performance computing.
(2) The second improvement consideration includes different approaches to word embedding in addition to GloVe that we used in this study. To accomplish this, we consider using existing pre-trained word vectors distributed by Google and fastText. Moreover, we can also create word vectors by ourselves by applying the word2vec or fastText algorithms to TRNA. Applying different word vectors to the deep learn-ing approach for news sentiment forecasting may allow us to identify a promising avenue for improving the forecasting power of our model.
(3) The third improvement concerns with the definition of polarity. We defined the polarity of news based on the change of stock price, i.e., ri(t) . Thus, it was dif-ficult to classify news into three polarity groups: i.e., positive, neutral, negative. One solution to overcome this problem is introduction of threshold to ri(t) to ana-lyze truly positive and truly negative news reducing the noise of positive or negative sentiment news that are close to neutral. We consider using a hybrid approach to the definition of polarity including our current methodology and adding information from another dataset with already assigned polarity to news, such as Thomson Reu-ters News Analytics or Thomson Reuters MarketPsych.
(4) The last improvement is concerned with using different deep learning meth-odologies. Although we used the RNN with LSTM units in this paper, the applica-tion of CNN to sentiment analysis is also extensively studied (for example, see [10, 19]). Moreover, the application of seq2seq or Attention to the sentiment analysis is also a consideration.
Stock trader models in a multi-agent simulation framework have mainly modeled agents monitoring the stock price only. However, in the real world, market partici-pants make decisions based on both the price change of stocks and news about the stocks. Hence, in this study, we are introducing the possibility that agents interpret the polarity of news and predict the price change before taking action. Thus, We consider that the application of sentiment analysis to the agent simulation will pro-vide new direction of the field of agent-based modeling and simulation.
Acknowledgements We would like to thank Hiroshi Iyetomi, Yuichi Ikeda, and Yoshi Fujiwara. This work was supported by MEXT as Exploratory Challenges on Post-K computer (Studies of Multi-level Spatiotemporal Simulation of Socioeconomic Phenomena, Macroeconomic Simulations) and JSPS KAK-ENHI Grant Number 17H02041.
Open Access This article is distributed under the terms of the Creative Commons Attribution 4.0 Interna-tional License (http://creat iveco mmons .org/licen ses/by/4.0/), which permits unrestricted use, distribution, and reproduction in any medium, provided you give appropriate credit to the original author(s) and the source, provide a link to the Creative Commons license, and indicate if changes were made.
46 Journal of Computational Social Science (2019) 2:33–46
1 3
References
1. Bao, W., Yue, J., & Rao, Y. (2017). A deep learning framework for financial time series using stacked autoencoders and long-short term memory. PloS one, 12(7), e0180944.
2. Bojanowski, P., Grave, E., Joulin, A., & Mikolov, T. (2016). Enriching word vectors with subword information. CoRR (abs/1607.04606) arXiv :abs/1607.04606
3. Chong, E., Han, C., & Park, F. C. (2017). Deep learning networks for stock market analysis and prediction: methodology, data representations, and case studies. Expert Systems with Applications, 83, 187–205.
(2018). A corpus of corporate annual and social responsibility reports: 280 million tokens of bal-anced organizational writing. ACL, 2018, 20.
7. Heaton, J., Polson, N., & Witte, J. H. (2017). Deep learning for finance: deep portfolios. Applied Stochastic Models in Business and Industry, 33(1), 3–12.
8. Hochreiter, S., & Schmidhuber, J. (1997). Long short-term memory. Neural computation, 9(8), 1735–1780.
9. Kilgarriff, A., & Grefenstette, G. (2003). Introduction to the special issue on the web as corpus. Computational linguistics, 29(3), 333–347.
10. Kim, Y. (2014). Convolutional neural networks for sentence classification. arXiv preprint arXiv :1408.5882
11. Kraus, M., & Feuerriegel, S. (2017). Decision support from financial disclosures with deep neural networks and transfer learning. Decision Support Systems, 104, 38–48.
12. Lee, S. I., & Yoo, S. J. (2017). A deep efficient frontier method for optimal investments. arXiv pre-print arXiv :1709.09822
13. Lee, S. I., & Yoo, S. J. (2018). A new method for portfolio construction using a deep predictive model. In: Proceedings of the 7th International Conference on Emerging Databases (pp. 260–266). Springer
14. Mikolov, T., Chen, K., Corrado, G., & Dean, J. (2013). Efficient estimation of word representations in vector space. CoRR (abs/1301.3781), arxiv :1301.3781
15. Mikolov, T., Sutskever, I., Chen, K., Corrado, G. S., & Dean, J. (2013). Distributed representations of words and phrases and their compositionality. In: C. J. C. Burges, L. Bottou, M. Welling, Z. Ghahramani, & K. Q. Weinberger (Eds.), Advances in neural information processing systems (vol. 26, pp. 3111–3119). Curran Associates, Inc. http://paper s.nips.cc/paper /5021-distr ibute d-repre senta tions -of-words -and-phras es-and-their -compo sitio nalit y.pdf.
16. Miller, G. A. (1995). Wordnet: a lexical database for english. Communications of the ACM, 38(11), 39. 17. Pennington, J., Socher, R., & Manning, C. D. (2014). Glove: Global vectors for word representa-
tion. In: Proceedings of the 2014 conference on empirical methods in natural language processing (EMNLP) (pp. 1532–1543).
18. Ponta, L., & Cincotti, S. (2018). Traders networks of interactions and structural proper-ties of financial markets: an agent-based approach. Complexity, 2018, 9072948. https ://doi.org/10.1155/2018/90729 48.
19. Sohangir, S., Wang, D., Pomeranets, A., & Khoshgoftaar, T. M. (2018). Big data: deep learn-ing for financial sentiment analysis. Journal of Big Data, 5(1), 3. https ://doi.org/10.1186/s4053 7-017-0111-6.
20. Troiano, L., Mejuto, E., & Kriplani, P. (2017). On feature reduction using deep learning for trend prediction in finance. arXiv preprint arXiv :1704.03205
21. Tsantekidis, A., Passalis, N., Tefas, A., Kanniainen, J., Gabbouj, M., & Iosifidis, A. (2017). Fore-casting stock prices from the limit order book using convolutional neural networks. In: Business informatics (CBI), 2017 IEEE 19th conference on. vol. 1, pp. 7–12. IEEE
22. Tsantekidis, A., Passalis, N., Tefas, A., Kanniainen, J., Gabbouj, M., & Iosifidis, A. (2017). Using deep learning to detect price change indications in financial markets. In: Signal processing confer-ence (EUSIPCO), 2017 25th European. pp. 2511–2515. IEEE
23. Xing, F. Z., Cambria, E., & Welsch, R. E. (2018). Natural language based financial forecasting: a survey. Artificial Intelligence Review, 50(1), 49–73.
Publisher’s Note Springer Nature remains neutral with regard to jurisdictional claims in published maps and institutional affiliations.