Enhanced oxidative phosphorylation in NKT cells is essential for their survival and function Ajay Kumar a , Kalyani Pyaram a , Emily L. Yarosz b , Hanna Hong b , Costas A. Lyssiotis c , Shailendra Giri d , and Cheong-Hee Chang a,1 a Department of Microbiology and Immunology, University of Michigan Medical School, Ann Arbor, MI 48109; b Immunology Graduate Program, University of Michigan Medical School, Ann Arbor, MI 48109; c Department of Molecular and Integrative Physiology, University of Michigan Medical School, Ann Arbor, MI 48109; and d Department of Neurology, Henry Ford Health System, Detroit, MI 48202 Edited by Richard A. Flavell, Howard Hughes Medical Institute and Yale School of Medicine, New Haven, CT, and approved March 6, 2019 (received for review January 24, 2019) Cellular metabolism and signaling pathways are key regulators to determine conventional T cell fate and function, but little is understood about the role of cell metabolism for natural killer T (NKT) cell survival, proliferation, and function. We found that NKT cells operate distinct metabolic programming from CD4 T cells. NKT cells are less efficient in glucose uptake than CD4 T cells with or without activation. Gene- expression data revealed that, in NKT cells, glucose is preferentially metabolized by the pentose phosphate pathway and mitochondria, as opposed to being converted into lactate. In fact, glucose is essen- tial for the effector functions of NKT cells and a high lactate environ- ment is detrimental for NKT cell survival and proliferation. Increased glucose uptake and IFN-γ expression in NKT cells is inversely corre- lated with bacterial loads in response to bacterial infection, further supporting the significance of glucose metabolism for NKT cell func- tion. We also found that promyelocytic leukemia zinc finger seemed to play a role in regulating NKT cells’ glucose metabolism. Overall, our study reveals that NKT cells use distinct arms of glucose metabolism for their survival and function. NKT | glucose | OXPHOS | PLZF I nvariant natural killer T (NKT) cells are lymphocytes sharing characteristics of innate and adaptive immune cells and acting as a bridge between the two immune responses. The hallmark of NKT cells is their ability to produce a copious amount of proinflammatory and immune modulatory cytokines very rapidly after antigenic stimulation (1, 2). NKT cells are CD1d-restricted T cells that respond to a variety of glycolipids (3). These cells express a highly restricted T cell receptor (TCR) repertoire and develop in the thymus from a common precursor of CD4 CD8 double-positive thymocytes (4). Compared with conventional T cells, NKT cells require distinct signaling for development in the thymus (5, 6). NKT cells develop to produce IFN-γ, IL-4, and IL-17, designated as NKT1, NKT2, and NKT17 subsets, respectively, which can be distinguished based on the expression of the transcription factors promyelocytic leukemia zinc finger (PLZF), T-bet, and RORγt (7–9). In the peripheral organs like liver, spleen, lymph node, and adipose tissue, NKT cells differentiate further and gain specific functional characteristics to become proinflammatory or immunomodulatory (10). Thus, NKT cells are a heterogeneous population that show a high degree of pheno- typic and functional specialization and their role in autoimmune diseases (11, 12), infectious diseases (13–15), asthma (16), and antitumor immune responses in both experimental models and humans (10, 17–19) has been well established. PLZF (encoded by Zbtb16) is a BTB-zinc finger transcription factor expressed by innate-like T cells, including NKT cells but not by conventional T cells or NK cells (20, 21). PLZF regulates early developmental and functional differentiation of NKT cells. Zbtb16 mutation or deletion leads to abrogation of expansion and effector-memory differentiation of NKT cells, resulting in re- versal to a naive phenotype (22). Similarly, the ectopic expression of PLZF in CD4 T cells induces the phenotype and functions similar to those of NKT cells (21, 23). We have recently shown that PLZF also regulates the level of reactive oxygen species (ROS) in NKT cells, suggesting its role in cellular metabolism in NKT cells (24). The signaling pathways that control cellular metabolism play a critical role in dictating the outcome of T cell activation and effector functions (25–30). Antigen-dependent T cell activation triggers the PI3K pathway and subsequently activates the mam- malian target of rapamycin (mTOR) complex 1 (C1) and complex 2 (C2) (31). mTORC1, a serine-threonine kinase, integrates various environmental cues and regulates cell growth, cell proliferation, and metabolism (31). mTORC1 and mTORC2 deletions lead to defective NKT cell development at an early stage and impair their functions (5, 6, 32). Additionally, myelocytomatosis onco- gene (c-myc), which is downstream of mTORC1, has been shown to play a role in early NKT cell development and in progression beyond the immature NKT stage (33, 34). Furthermore, unlike CD4 T cells, NKT cells are sensitive to changes in signaling pathways mediated by CD28 (35), ICOS (36), PI3K (37, 38), and Wnt/β-Catenin (39); most of them are known to regulate the metabolic pathways. Upon activation, T cells proliferate and increase their biomass for which they not only require an increased amount of energy but also need to facilitate nutrient uptake for the generation of daughter cells (40). To fulfill these high demands of activated cells, T cell metabolism is reprogramming from preferentially utilizing OXPHOSto glycolysis (27, 41). Glycolysis produces biosynthetic Significance The role of cellular metabolism in conventional T cell fate and functions has been established, but little is understood about how metabolic pathways and nutrient requirements are con- trolled in natural killer T (NKT) cells. The present study shows that, unlike CD4 T cells, activation of NKT cells metabolize glucose to the pentose phosphate pathway and TCA cycle in- stead of converting into lactate. In line with this, a high lactate microenvironment is detrimental for NKT cell homeostasis and effector function. Glucose metabolism and IFN-γ expression is increased in NKT cells in response to bacterial infection. Taking these data together, our study demonstrates unique glucose metabolic regulation necessary for NKT cell survival, pro- liferation and cytokine expression. Author contributions: A.K. and C.-H.C. designed research and analyzed the data; A.K., K.P., E.L.Y., and H.H. performed research; C.A.L. and S.G. contributed new reagents/ana- lytic tools and oversaw metabolic data; and A.K., K.P., E.L.Y., C.A.L., and C.-H.C. wrote the paper. The authors declare no conflict of interest. This article is a PNAS Direct Submission. Published under the PNAS license. 1 To whom correspondence should be addressed. Email: [email protected]. This article contains supporting information online at www.pnas.org/lookup/suppl/doi:10. 1073/pnas.1901376116/-/DCSupplemental. Published online March 25, 2019. www.pnas.org/cgi/doi/10.1073/pnas.1901376116 PNAS | April 9, 2019 | vol. 116 | no. 15 | 7439–7448 IMMUNOLOGY AND INFLAMMATION Downloaded by guest on April 20, 2020
Transcript
Enhanced oxidative phosphorylation in NKT cells isessential for their survival and functionAjay Kumara, Kalyani Pyarama, Emily L. Yaroszb, Hanna Hongb, Costas A. Lyssiotisc, Shailendra Girid,and Cheong-Hee Changa,1
aDepartment of Microbiology and Immunology, University of Michigan Medical School, Ann Arbor, MI 48109; bImmunology Graduate Program, Universityof Michigan Medical School, Ann Arbor, MI 48109; cDepartment of Molecular and Integrative Physiology, University of Michigan Medical School, Ann Arbor,MI 48109; and dDepartment of Neurology, Henry Ford Health System, Detroit, MI 48202
Edited by Richard A. Flavell, Howard Hughes Medical Institute and Yale School of Medicine, New Haven, CT, and approved March 6, 2019 (received for reviewJanuary 24, 2019)
Cellular metabolism and signaling pathways are key regulators todetermine conventional T cell fate and function, but little is understoodabout the role of cell metabolism for natural killer T (NKT) cell survival,proliferation, and function. We found that NKT cells operate distinctmetabolic programming from CD4 T cells. NKT cells are less efficientin glucose uptake than CD4 T cells with or without activation. Gene-expression data revealed that, in NKT cells, glucose is preferentiallymetabolized by the pentose phosphate pathway and mitochondria,as opposed to being converted into lactate. In fact, glucose is essen-tial for the effector functions of NKT cells and a high lactate environ-ment is detrimental for NKT cell survival and proliferation. Increasedglucose uptake and IFN-γ expression in NKT cells is inversely corre-lated with bacterial loads in response to bacterial infection, furthersupporting the significance of glucose metabolism for NKT cell func-tion. We also found that promyelocytic leukemia zinc finger seemedto play a role in regulating NKT cells’ glucose metabolism. Overall,our study reveals that NKT cells use distinct arms of glucosemetabolismfor their survival and function.
NKT | glucose | OXPHOS | PLZF
Invariant natural killer T (NKT) cells are lymphocytes sharingcharacteristics of innate and adaptive immune cells and acting
as a bridge between the two immune responses. The hallmark ofNKT cells is their ability to produce a copious amount ofproinflammatory and immune modulatory cytokines very rapidlyafter antigenic stimulation (1, 2). NKT cells are CD1d-restrictedT cells that respond to a variety of glycolipids (3). These cellsexpress a highly restricted T cell receptor (TCR) repertoire anddevelop in the thymus from a common precursor of CD4 CD8double-positive thymocytes (4). Compared with conventionalT cells, NKT cells require distinct signaling for development inthe thymus (5, 6). NKT cells develop to produce IFN-γ, IL-4, andIL-17, designated as NKT1, NKT2, and NKT17 subsets, respectively,which can be distinguished based on the expression of thetranscription factors promyelocytic leukemia zinc finger (PLZF),T-bet, and RORγt (7–9). In the peripheral organs like liver,spleen, lymph node, and adipose tissue, NKT cells differentiatefurther and gain specific functional characteristics to becomeproinflammatory or immunomodulatory (10). Thus, NKT cellsare a heterogeneous population that show a high degree of pheno-typic and functional specialization and their role in autoimmunediseases (11, 12), infectious diseases (13–15), asthma (16), andantitumor immune responses in both experimental models andhumans (10, 17–19) has been well established.PLZF (encoded by Zbtb16) is a BTB-zinc finger transcription
factor expressed by innate-like T cells, including NKT cells butnot by conventional T cells or NK cells (20, 21). PLZF regulatesearly developmental and functional differentiation of NKT cells.Zbtb16 mutation or deletion leads to abrogation of expansionand effector-memory differentiation of NKT cells, resulting in re-versal to a naive phenotype (22). Similarly, the ectopic expression ofPLZF in CD4 T cells induces the phenotype and functions similar
to those of NKT cells (21, 23). We have recently shown that PLZFalso regulates the level of reactive oxygen species (ROS) in NKTcells, suggesting its role in cellular metabolism in NKT cells (24).The signaling pathways that control cellular metabolism play a
critical role in dictating the outcome of T cell activation andeffector functions (25–30). Antigen-dependent T cell activationtriggers the PI3K pathway and subsequently activates the mam-malian target of rapamycin (mTOR) complex 1 (C1) and complex2 (C2) (31). mTORC1, a serine-threonine kinase, integrates variousenvironmental cues and regulates cell growth, cell proliferation, andmetabolism (31). mTORC1 and mTORC2 deletions lead todefective NKT cell development at an early stage and impairtheir functions (5, 6, 32). Additionally, myelocytomatosis onco-gene (c-myc), which is downstream of mTORC1, has been shownto play a role in early NKT cell development and in progressionbeyond the immature NKT stage (33, 34). Furthermore, unlikeCD4 T cells, NKT cells are sensitive to changes in signalingpathways mediated by CD28 (35), ICOS (36), PI3K (37, 38), andWnt/β-Catenin (39); most of them are known to regulate themetabolic pathways.Upon activation, T cells proliferate and increase their biomass
for which they not only require an increased amount of energybut also need to facilitate nutrient uptake for the generation ofdaughter cells (40). To fulfill these high demands of activatedcells, T cell metabolism is reprogramming from preferentiallyutilizing OXPHOSto glycolysis (27, 41). Glycolysis produces biosynthetic
Significance
The role of cellular metabolism in conventional T cell fate andfunctions has been established, but little is understood abouthow metabolic pathways and nutrient requirements are con-trolled in natural killer T (NKT) cells. The present study showsthat, unlike CD4 T cells, activation of NKT cells metabolizeglucose to the pentose phosphate pathway and TCA cycle in-stead of converting into lactate. In line with this, a high lactatemicroenvironment is detrimental for NKT cell homeostasis andeffector function. Glucose metabolism and IFN-γ expression isincreased in NKT cells in response to bacterial infection. Takingthese data together, our study demonstrates unique glucosemetabolic regulation necessary for NKT cell survival, pro-liferation and cytokine expression.
Author contributions: A.K. and C.-H.C. designed research and analyzed the data; A.K.,K.P., E.L.Y., and H.H. performed research; C.A.L. and S.G. contributed new reagents/ana-lytic tools and oversaw metabolic data; and A.K., K.P., E.L.Y., C.A.L., and C.-H.C. wrote thepaper.
The authors declare no conflict of interest.
This article is a PNAS Direct Submission.
Published under the PNAS license.1To whom correspondence should be addressed. Email: [email protected].
This article contains supporting information online at www.pnas.org/lookup/suppl/doi:10.1073/pnas.1901376116/-/DCSupplemental.
materials to support proliferation and this shift regulates theacquisition of effector function in certain T cell subsets (25, 42).Despite the fact that activated T cells primarily use glycolysis,mitochondrial metabolism is also important for T cell activation(43). Decreasing the metabolic rate in T cells leads to immu-nological anergy that is associated with diminished cytokineproduction, growth, and proliferation (44, 45).In contrast to classic T cells, little is known about the metabolic
needs of NKT cells. A study has shown that during thymic devel-opment, NKT cells increase glucose uptake and expression ofglucose transporter 1 (Glut1) at stages 0 and 1, the highly pro-liferating cells, but decreases subsequently at stages 2 and 3, thelow proliferating cells (46). Recently, we have shown thatNKT cells have lower mitochondrial ROS during steady statethan CD4 T cells, suggesting distinct metabolic requirements inNKT cells (24). However, none of these studies have yet demon-strated a succinct overview of cellular metabolism in NKT cells.In the present study, we report that resting NKT cells are less
efficient in glucose uptake than resting CD4 T cells. Even afteractivation, NKT cells remain less glycolytic than CD4 T cells andrely more on oxidative phosphorylation (OXPHOS) for theirsurvival, and the repurposed glucose carbon is used for optimalcytokine expression. Furthermore, we demonstrated that highlactate environment is detrimental for NKT cell growth andhomeostasis. Finally, PLZF correlates negatively with glycolyticpotential in NKT cells. Taken together, these data show thtdistinct cellular metabolism governs NKT cells’ homeostasis andimmune functions.
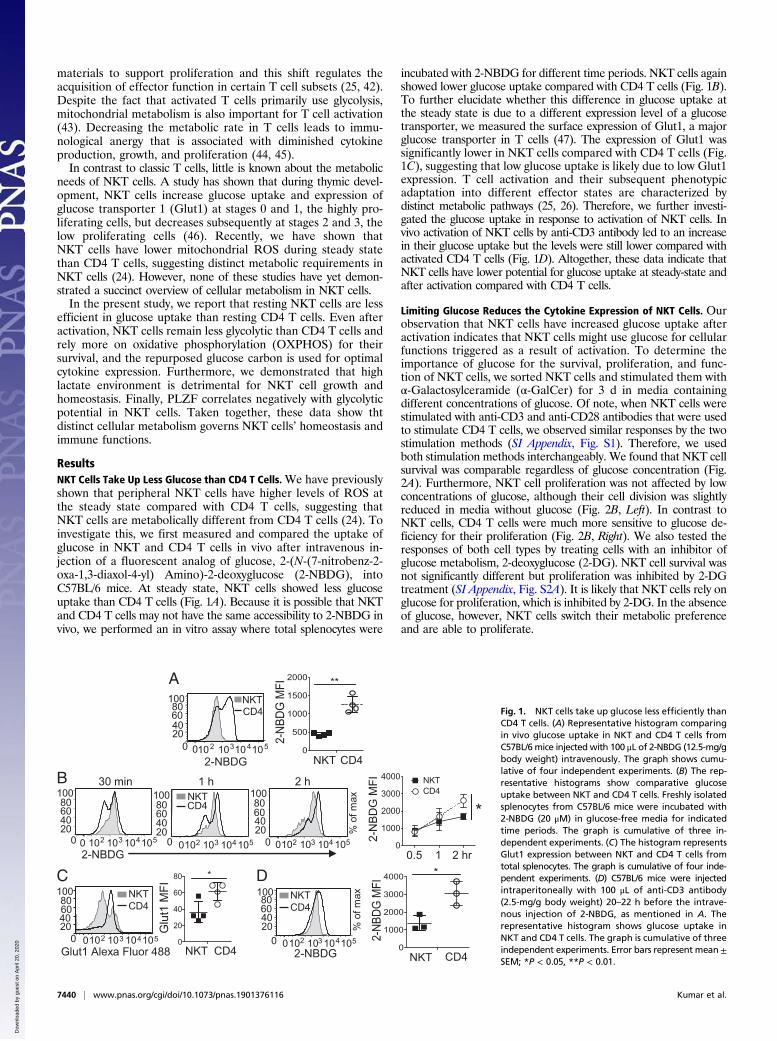
ResultsNKT Cells Take Up Less Glucose than CD4 T Cells.We have previouslyshown that peripheral NKT cells have higher levels of ROS atthe steady state compared with CD4 T cells, suggesting thatNKT cells are metabolically different from CD4 T cells (24). Toinvestigate this, we first measured and compared the uptake ofglucose in NKT and CD4 T cells in vivo after intravenous in-jection of a fluorescent analog of glucose, 2-(N-(7-nitrobenz-2-oxa-1,3-diaxol-4-yl) Amino)-2-deoxyglucose (2-NBDG), intoC57BL/6 mice. At steady state, NKT cells showed less glucoseuptake than CD4 T cells (Fig. 1A). Because it is possible that NKTand CD4 T cells may not have the same accessibility to 2-NBDG invivo, we performed an in vitro assay where total splenocytes were
incubated with 2-NBDG for different time periods. NKT cells againshowed lower glucose uptake compared with CD4 T cells (Fig. 1B).To further elucidate whether this difference in glucose uptake atthe steady state is due to a different expression level of a glucosetransporter, we measured the surface expression of Glut1, a majorglucose transporter in T cells (47). The expression of Glut1 wassignificantly lower in NKT cells compared with CD4 T cells (Fig.1C), suggesting that low glucose uptake is likely due to low Glut1expression. T cell activation and their subsequent phenotypicadaptation into different effector states are characterized bydistinct metabolic pathways (25, 26). Therefore, we further investi-gated the glucose uptake in response to activation of NKT cells. Invivo activation of NKT cells by anti-CD3 antibody led to an increasein their glucose uptake but the levels were still lower compared withactivated CD4 T cells (Fig. 1D). Altogether, these data indicate thatNKT cells have lower potential for glucose uptake at steady-state andafter activation compared with CD4 T cells.
Limiting Glucose Reduces the Cytokine Expression of NKT Cells. Ourobservation that NKT cells have increased glucose uptake afteractivation indicates that NKT cells might use glucose for cellularfunctions triggered as a result of activation. To determine theimportance of glucose for the survival, proliferation, and func-tion of NKT cells, we sorted NKT cells and stimulated them withα-Galactosylceramide (α-GalCer) for 3 d in media containingdifferent concentrations of glucose. Of note, when NKT cells werestimulated with anti-CD3 and anti-CD28 antibodies that were usedto stimulate CD4 T cells, we observed similar responses by the twostimulation methods (SI Appendix, Fig. S1). Therefore, we usedboth stimulation methods interchangeably. We found that NKT cellsurvival was comparable regardless of glucose concentration (Fig.2A). Furthermore, NKT cell proliferation was not affected by lowconcentrations of glucose, although their cell division was slightlyreduced in media without glucose (Fig. 2B, Left). In contrast toNKT cells, CD4 T cells were much more sensitive to glucose de-ficiency for their proliferation (Fig. 2B, Right). We also tested theresponses of both cell types by treating cells with an inhibitor ofglucose metabolism, 2-deoxyglucose (2-DG). NKT cell survival wasnot significantly different but proliferation was inhibited by 2-DGtreatment (SI Appendix, Fig. S2A). It is likely that NKT cells rely onglucose for proliferation, which is inhibited by 2-DG. In the absenceof glucose, however, NKT cells switch their metabolic preferenceand are able to proliferate.
D
0
1000
2000
3000
4000
2-NB
DG M
FI
*
CD4NKT2-NBDG0102 103 1041050
20406080
100 NKTCD4
% o
f max
A
NKT CD40
500
1000
1500
2000
2-NB
DG M
FI
**
2-NBDG0102 1031041050
20406080
100 NKTCD4
B
0.5 1 2 hr0
1000
2000
3000
4000
2-N
BDG
MFI NKT
CD4
*
30 min 1 h
0 102 103 104105020406080
100
0102 103 104 105020406080
100
0102 103 104 105020406080
100
2-NBDG
% o
f maxNKT
2 h
CD4
0
20
40
60
80
Glu
t1 M
FI
*
0102 103 104105020406080
100 NKTCD4
C
Glut1 Alexa Fluor 488 CD4NKT
Fig. 1. NKT cells take up glucose less efficiently thanCD4 T cells. (A) Representative histogram comparingin vivo glucose uptake in NKT and CD4 T cells fromC57BL/6mice injected with 100 μL of 2-NBDG (12.5-mg/gbody weight) intravenously. The graph shows cumu-lative of four independent experiments. (B) The rep-resentative histograms show comparative glucoseuptake between NKT and CD4 T cells. Freshly isolatedsplenocytes from C57BL/6 mice were incubated with2-NBDG (20 μM) in glucose-free media for indicatedtime periods. The graph is cumulative of three in-dependent experiments. (C) The histogram representsGlut1 expression between NKT and CD4 T cells fromtotal splenocytes. The graph is cumulative of four inde-pendent experiments. (D) C57BL/6 mice were injectedintraperitoneally with 100 μL of anti-CD3 antibody(2.5-mg/g body weight) 20–22 h before the intrave-nous injection of 2-NBDG, as mentioned in A. Therepresentative histogram shows glucose uptake inNKT and CD4 T cells. The graph is cumulative of threeindependent experiments. Error bars represent mean±SEM; *P < 0.05, **P < 0.01.
7440 | www.pnas.org/cgi/doi/10.1073/pnas.1901376116 Kumar et al.
These observations prompted us to test if NKT cells use glu-tamine as a source of energy for their survival similar to CD4T cells (48, 49). Sorted NKT cells were stimulated in the pres-ence of either glucose or glutamine alone and compared withmedia containing both. Cell survival and proliferation weredrastically reduced with glutamine deprivation compared withglucose deficiency, suggesting that glutamine is a critical carbonsource for NKT cell survival and proliferation (Fig. 2C and SIAppendix, Fig. S2B). Although our data revealed an essential roleof glutamine for NKT cell proliferation, the present study fo-cuses on glucose metabolism because little is known about howNKT cells utilize glucose.Glycolysis supports cytokine production in CD4 T cells (50).
Therefore, we asked if glucose is necessary for cytokine pro-duction in NKT cells. We found that NKT cells displayed a dose-dependent decrease in IL-4+, IFN-γ+, and IL-17+ NKT cellsunder glucose-limiting conditions (Fig. 2D). To test the responseof NKT cells to glucose deprivation and replenishment, westimulated them without glucose for 3 d and then added glucoseduring the PMA/ionomycin restimulation step. While glucosedepletion for 3 d reduced the frequency of NKT cells expressingIL-4, IFN-γ, and IL-17, replenishment with glucose for 4 h increasedthe levels of all cytokines (SI Appendix, Fig. S2C). Similarly, weinvestigated the role of glucose for the expression of cytokines infreshly isolated NKT cells by stimulating them with PMA/ionomycinfor 4 h in the presence or absence of glucose. In the absence ofglucose, the frequency of IFN-γ+ NKT cells was reduced (SIAppendix, Fig. S2D). In conclusion, glucose is indispensable forcytokine production by NKT cells but is less significant for eithertheir survival or proliferation.
In Vivo Immune Response of NKT Cells to Bacterial Infection Correlateswith Glucose Uptake. NKT cells constitute an important componentof the innate immune response to Listeria monocytogenes infection(51). To understand the functional significance of glucose metab-olism in NKT cells in response to bacterial infection, we infectedC57BL/6 mice with two different doses (105 and 107 CFU permouse) of L. monocytogenes. Two days after infection, we analyzedbacterial loads as well as glucose uptake and IFN-γ expression in
splenic NKT cells. As expected, the mice infected with a higherdose of bacteria showed more bacterial titers in the spleen thanthose infected with the lower dose (Fig. 3A). In response to bac-terial infection, glucose uptake by NKT cells was negatively cor-related with bacterial growth (Fig. 3B). We also observed that thehigher the glucose uptake, the more IFN-γ expressing NKT cells(Fig. 3C, Left). In addition, the amount of IFN-γ per cell, reflectedby mean fluorescence intensity (MFI) values, was higher with in-creased glucose uptake (Fig. 3C, Right). Additionaly, data showedthat increased expression of IFN-γ by NKT cells led to suppressionof bacterial growth (Fig. 3D). Taken together, these observationssuggest that, upon bacterial infection, the cytokine production ofNKT cells is regulated by glucose consistent with the data shown inFig. 2.
Increased Glucose Uptake upon TCR Stimulation in NKT Cells Is Mediatedby mTORC.mTORC regulates various cellular aspects of metabolismand is involved in TCR activation-mediated induction of glucoseuptake and glycolysis (31). Thus, we first assessed if the mTORC1and mTORC2 activities are increased in NKT cells upon activationby measuring the expression of pS6Ser235/236 and pAktSer473, respec-tively. The level of phosphorylation of both molecules increasedprogressively at day 1 and day 3 of stimulation over day 0, dem-onstrating increased mTORC1 and mTORC2 signaling activity inNKT cells upon activation (Fig. 4A). Furthermore, compared withCD4 T cells, NKT cells have a higher mTORC1 expression on day3 of stimulation (SI Appendix, Fig. S3A).Having observed that glucose uptake and mTORC activity are
increased in NKT cells upon stimulation, we investigated if mTORCsignaling regulates glucose uptake in these cells. For this, we treatedNKT cells with rapamycin during stimulation. Rapamycin treatmentdecreased the level of pS6Ser235/236 and pAktSer473, confirmingmTORC1and mTORC2 inhibition, respectively (Fig. 4B, Upper). Datashowed that rapamycin treatment decreased the glucose uptakein NKT cells, which was accompanied by decreased cell size asevidenced by lower FSC in the rapamycin-treated NKT cells thancontrol cells (Fig. 4B, Lower). Therefore, mTORC activity isrequired for optimal glucose uptake and subsequently for propercell growth of NKT cells. One of the main functions of mTORC
10 mM 1 mM 0.1 mM 0 mMGlucose
IFN- PE
0102 103 1041050
102
103
104
105 6.2 27.9
53.412.4
0102 103 1041050
102
103
104105 2.4 0.5
78.418.7
0102 103 104 1050
102
103
104105 2.8 16.5
52.428.2
0102 103 104 1050102
103
104
105 1.1 0.5
66.631.9
0102 103 104 1050
102
103
104
105 1.3 7.8
41.249.0
0102 103 104 1050
102
103
104105 0.4 0.8
45.353.50102 103 104 105
0102
103
104
105 0.6 0.6
41.157.7
0 102 103 1041050102
103
104
105 1.4 5.0
39.354.4
IL-1
7 P
erC
P-C
y5.5
IL-4
PE
-Cy7
0
5
10
15
20
25
%Li
vece
lls
10 1 0.1 0 mM
A
D
B C
Glucose Glucose + + -Glutamine + - +
Fold
cha
nge *200
250
500 102 103 104 105
150100
0
150
250
50
200
100
0 102103 104 1050
NKT CD4
CellTrace Violet
% o
f max
10 mM1 mM0 mM
Fig. 2. Glucose is essential for optimal cytokine ex-pression but not for survival and proliferation ofNKT cells. (A) NKT cells were sorted from spleens ofC57BL/6 mice and stimulated with α-GalCer (100 ng/mL)in the presence of indicated concentrations of glucosein the media. The graph shows the percentage of liveNKT cells on day 3 of stimulation measured by PI ex-clusion (n = 3). (B) NKT and CD4 T cells were sorted,labeled with CellTrace Violet and then stimulated inthe indicated concentrations of glucose-containingmedia. α-GalCer or anti-CD3 with anti-CD28 antibodies(details are described in Materials and Methods) wereused to stimulate NKT or CD4 T cells, respectively. Rep-resentative histograms show cell proliferation measuredafter 3 d of stimulation. (C) Sorted NKT cells werestimulated as in A in the presence of 10 mM glucoseor 2 mM glutamine alone, or with both in the media.The graph shows the fold-change in percent of liveNKT cells after 3 d (n = 3). (D) Representative plotsshow cytokine expression in NKT cells stimulated for3 d in the indicated glucose concentrations and restimu-lated with PMA and ionomycin in the same media con-ditions. Error bars represent mean ± SEM; *P < 0.05.
Kumar et al. PNAS | April 9, 2019 | vol. 116 | no. 15 | 7441
activity is to regulate cell proliferation (45). We also found thatmTORC inhibition affected cell proliferation of NKT cells moreseverely compared with CD4 T cells (Fig. 4C). Moreover, thefrequencies of IL-4+, IFN-γ+, and IL-17+ NKT cells were decreasedwhen mTORC was inhibited (SI Appendix, Fig. S3B), supportingthe earlier studies showing that mTORC activity is important foreffector functions of NKT cells (5). In summary, these datademonstrate that mTORC up-regulates glucose uptake, which inturn controls NKT cell growth upon activation.
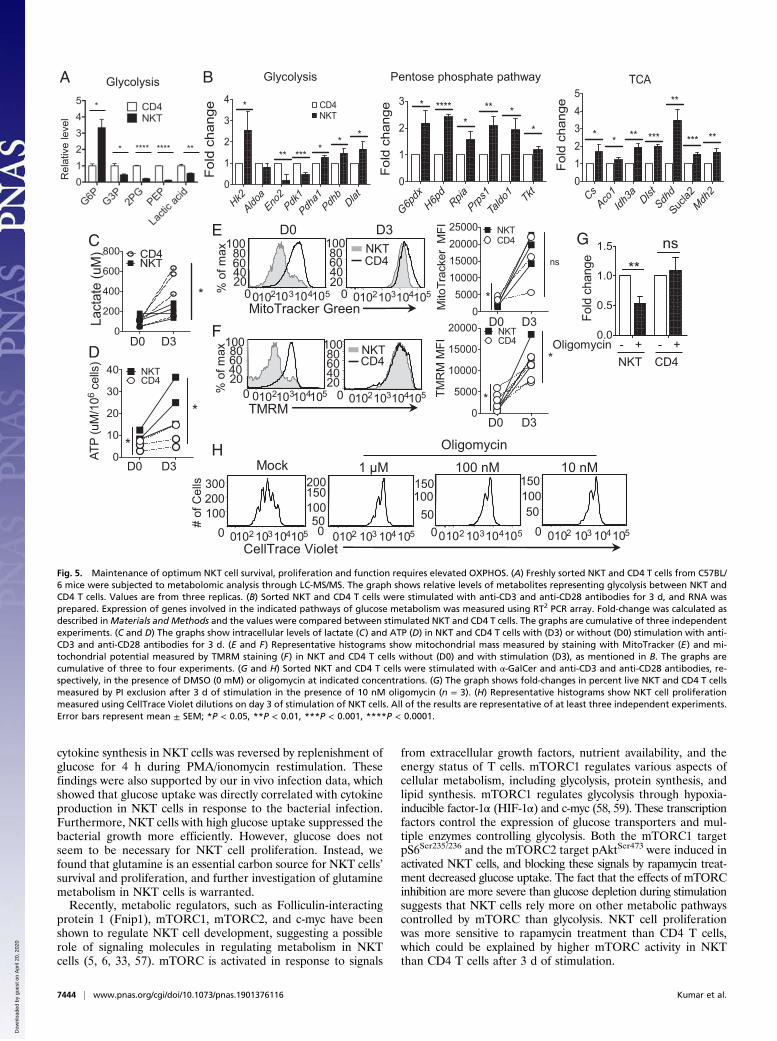
NKT Cells Primarily Use OXPHOS for Their Survival, Proliferation, andSelective Cytokine Production. To gain a better understanding ofmetabolism in NKT cells, we next used liquid chromatography(LC) -coupled tandem mass spectrometry (LC-MS/MS)–basedmetabolomics approaches. We observed a higher level of glucose6-phosphate (G6P) but lower levels of other metabolites fromglycolysis in NKT cells compared with CD4 T cells (Fig. 5A).Levels of metabolites from the TCA cycle were comparable betweenNKT and CD4 T cells (SI Appendix, Fig. S4A). These datasupport the observation that glycolytic activity is lower in NKTthan CD4 T cells. We also compared the expression of genes
encoding key enzymes involved in these metabolic pathwaysbetween NKT and CD4 T cells. The first rate-limiting enzymaticgene of glycolysis, hexokinase 2 (Hk2), was up-regulated in NKTcells compared with CD4 T cells before stimulation supportingthe increase of G6P (SI Appendix, Fig. S4B and Table S1). Expres-sion of downstream enzyme genes was lower in NKT than CD4T cells. Stimulated NKT cells showed a similar pattern by greatlyinducing Hk2 expression but not other genes encoding enzymesleading to the glycolytic pathway (Fig. 5B, Left). In contrast, the genesinvolved in the pentose phosphate pathway (PPP) were up-regulated inNKT cells compared with CD4 T cells after activation (Fig. 5B, Center,and SI Appendix, Table S1). These results suggest that G6P is differ-entially funneled into the PPP in NKT cells relative to CD4 T cells.Pyruvate dehydrogenase kinases (Pdk1 and Pdk2) phosphorylate
and negatively inhibit the activity of the pyruvate dehydrogenase(Pdh) complex, which oxidizes pyruvate and channels it into theTCA cycle. Pdk1 and Pdk2 were down-regulated in NKT cells,whereas Pdh genes (Pdha1 and Pdhb) were highly increased,suggesting that NKT cells oxidize pyruvate in the mitochondriato a greater degree than do CD4 T cells (Fig. 5B, Left, and SIAppendix, Table S1). These observations were further supportedby higher levels of TCA cycle enzymatic gene expression inNKT cells than in CD4 T cells (Fig. 5B, Right, and SI Appendix,Table S1). To further confirm the low glycolytic potential ofNKT cells, we measured the intracellular lactate level in NKTand CD4 T cells with or without activation. We observed similarlevels of intracellular lactate in freshly isolated NKT and CD4T cells (Fig. 5C). After activation, lactate levels were increased inNKT and CD4 T cells, but the levels were lower in NKT cellsthan CD4 T cells (Fig. 5C). Finally, consistent with no knownrole for gluconeogenesis or glycogen metabolism in T cells, genesin these pathways were not altered in NKT cells upon activation(SI Appendix, Table S1). Based on this summation of data, we con-clude that glucose carbon is differentially directed to the PPP and TCAcycle in NKT cells, relative to CD4 T cells (SI Appendix, Fig. S4C).Low intracellular levels of lactate and high expression of TCA
cycle genes led us to hypothesize that NKT cells rely on OXPHOSinstead of glycolysis for their survival and homeostasis. Becausemitochondria are best known for their role as energy powerhouses,we speculated that NKT cells generate high amounts of ATP. In-deed, NKT cells had higher amounts of intracellular ATP comparedwith CD4 T cells both before and after stimulation, suggesting higherOXPHOS in NKT cells (Fig. 5D). Because OXPHOS occurs in themitochondria, we studied the mitochondrial activity in NKT cells.Activated NKT cells showed increased mitochondrial mass andmitochondrial function as measured by MitoTracker and tetrame-thylrhodamine methyl ester perchlorate (TMRM), respectively,relative to CD4 T cells (Fig. 5 E and F).To further investigate the role of mitochondrial OXPHOS in
NKT cell metabolism, we activated NKT cells in the presence orabsence of oligomycin for 3 d. Oligomycin targets ATP synthase,leading to inhibition of electron flow through the electron transportchain and stopping respiration (50). NKT cell survival was de-creased in the presence of oligomycin, indicating that, unlike CD4T cells, they cannot readily switch to generating ATP from glycolysis(Fig. 5G). NKT cell proliferation was also reduced with oligomycintreatment (Fig. 5H). The frequencies of IL-4+ and IL-17+ NKT cellswere also decreased in the presence of oligomycin (SI Appendix, Fig.S4D). Therefore, OXPHOS seems to be critical for NKT cell survivaland proliferation, as well as for optimal cytokine production.
High Lactate Microenvironment Is Detrimental for NKT Cell Homeostasisand Their Effector Function. Because conventional T cells are resistantto high lactate environment-mediated cell apoptosis (52), we asked ifthe less glycolytic NKT cells would be more sensitive to increasedextracellular lactate. To test this, we cultured NKT cells in the presenceof sodium lactate (20 mM and 40 mM) or sodium chloride, and thenmeasured NKT cell survival, proliferation, and cell size. The data
A
105 107106
107
108
109
1010
CFU
/gm
of ti
ssue
CFU injected
0 500 1000 15000
5
10
% IF
N-
+ ce
lls
MFI of 2-NBDG
Cp=0.017r2=0.62
0 500 1000 15000
500
1000
1500
MFI of 2-NBDG
MFI
of I
FN-
+ ce
llsp=0.002r2=0.81
106 107 108 109 10100
5
10
15
% IF
N-
+ ce
lls
CFU/gm of tissue
D
p=0.012r2=0.62
CFU/gm of tissue
106 107 108 109 10100
500
1000
1500
M
FI o
f 2- N
BDG
CFU/gm of tissue
Bp=0.018r2=0.95
106 107 108 109 1010
500
1000
1500
M
FI o
f IFN
-+
cells
Fig. 3. Glucose uptake of NKT cells correlates with their function in re-sponse to bacterial infection. A group of C57BL/6 mice (four to five mice pergroup) were infected with 105 or 107 CFU per mouse LM-Ova intraperito-neally. Two days after infection, spleens were used for bacterial enumera-tion, 2-NBDG uptake, and IFN-γ expression. (A) Bacterial loads in the spleensof mice that were infected with the two different doses of Listeria areshown. (B) Glucose uptake measured by 2-NBDG inversely correlates with thebacterial loads. The 2-NBDG uptake assay was performed using freshly iso-lated splenocytes from infected mice. (C and D) Total splenocytes were in-cubated in the presence of Golgi Plug for 2 h followed by intracellularcytokine staining for IFN-γ expression in NKT cells. The frequency of IFN-γ+
(L) as well as the MFI of IFN-γ+ (Right) NKT cells show a positive and negativecorrelation with glucose uptake (C) and bacterial loads (D), respectively. Twoindependent experiments showed similar results. Spearman correlation wasused for correlation calculation.
7442 | www.pnas.org/cgi/doi/10.1073/pnas.1901376116 Kumar et al.
showed that high lactate exerted a negative effect on survival, pro-liferation, and cell size of NKT cells (Fig. 6 A–C), while high lactateincreased the size of CD4 T cells (Fig. 6C, Right). In addition, highlactate reduced mTORC activity, as evidenced by the reduced level ofpS6Ser235/236 in NKT but not in CD4 T cells (Fig. 6D). High-lactateenvironment also reduced the frequencies of IL-4+ and IL-17+ butnot IFN-γ+ NKT cells, suggesting that cytokine functions of NKTcells are altered in a high-lactate environment (Fig. 6E). Takentogether, the data suggest that a low level of lactate in NKT cells isimportant for their homeostasis and optimal cytokine expression.
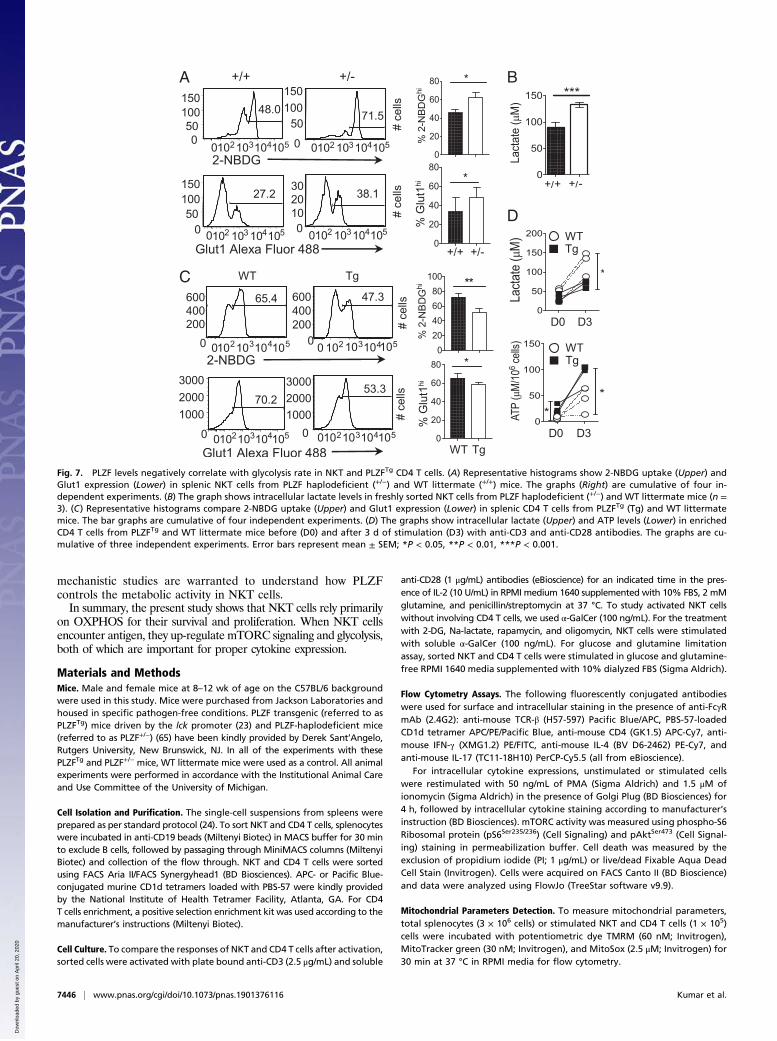
PLZF Correlates with Low Glycolysis in NKT Cells. Previously, we haveshown that PLZF controls the level of ROS in NKT cells (24),indicating that it might play a role in the metabolism of NKTcells. To test this, we used two approaches. First, we examinedNKT cells from PLZF haplodeficient (PLZF+/−) mice. BecausePLZF−/− mice are devoid of NKT cells, these mice are not suitablefor the study (20). We observed that the percentages of 2-NBDGhi
and Glut1-expressing NKT cells were significantly increased inPLZF+/− mice compared with the WT mice (Fig. 7A). In addition,the intracellular lactate levels, mitochondrial ROS, mitochondrialmass, and mitochondrial potential were increased in PLZF+/−
NKT cells compared with WT NKT cells (Fig. 7B and SI Appendix,S5A). Next, we asked if PLZF expression is sufficient to reduceglucose uptake and subsequent processes. CD4 T cells from miceexpressing the PLZF transgene (PLZFTg) showed reduction of boththe frequency of 2-NBDGhi cells and the Glut1-expressing cells(Fig. 7C). Activated PLZFTg and WT CD4 T cells, however, hadsimilar levels of glucose uptake and Glut1 expression (SI Appendix,Fig. S5B). To test if PLZF levels affect glycolysis, we measuredintracellular lactate levels and found significantly lower lactatelevels in PLZFTg than WT CD4 T cells (Fig. 7D, Upper). We alsofound that ATP levels were significantly higher in PLZFTg thanWTCD4 T cells (Fig. 7D, Lower), indicating that CD4 T cells expressingPLZF have increased mitochondrial activity.To further study PLZF-mediated metabolic changes, we used
the Seahorse bioanalyzer to analyze the rate of glycolysis bymeasuring extracellular acidification rate (ECAR). In this ex-periment, we used WT and PLZFTg CD4 T cells because it ischallenging to get a sufficient number of NKT cells for this assay.Moreover, PLZFTg CD4 T cells share similar metabolic char-acteristics to NKT cells (Fig. 7). In line with low intracellularlactate level, ECAR was lower in CD4 T cells from PLZFTg
compared with WT mice (Fig. 8A). Thus, expression of PLZFreduced the rate of glycolysis. Glucose is a major carbon sourcefor the TCA cycle. To test its utilization in a PLZF-dependentmanner, we traced glucose carbon incorporation into TCA cycle
intermediates using nonradioactive carbon-13 isotope labeledglucose ([U-13C]-glucose) and LC/MS-based metabolomics inPLZFTg and WT CD4 T cells for 4 h. PLZFTg CD4 T cells exhibiteda lower abundance of glucose-derived 13C3-phosphoglycerate (2-PG)(m+3) and 13C3-lactate (m+3) (Fig. 8B), further illustrating thatPLZF limits glycolytic flux. Furthermore, we found that PLZFTg
CD4 T cells had a higher abundance of glucose-derived 13C2-citrate(m+2) compared with WT CD4 T cells, indicating a greater di-version of glucose-derived pyruvate into the TCA cycle (Fig. 8B).However, the abundance of glucose-derived 13C2-succinate (m+2)and 13C2-malate (m+2) were similar in WT and PLZFTg CD4T cells (Fig. 8B). These results suggest that, in the PLZFTg CD4T cells, glucose-derived carbon preferentially enters the TCA cycleto make citrate, and that other carbon sources also contribute toTCA cycle anaplerosis. Based on the results in Fig. 2, this is likelyaccounted for by glutamine-derived carbon.
DiscussionThe metabolic demands of naïve T cells are lower because theyrequire energy only for survival, cell migration, and preventingatrophy. This demand increases in activated T cells, which re-quires energy for rapid growth, proliferation, and production ofeffector molecules (53). Thus, it is essential for T cells to switchtheir cellular metabolism to meet the biosynthetic needs of thecells. NKT cells are different from conventional T cells in thatthey are able to rapidly elicit effector functions in response toactivation. As such, understanding the metabolic programmingof NKT cells was the primary goal of this study. Here, we reportthat NKT cells in the resting state use less glucose than conventionalCD4 T cells, suggesting that these cells are metabolically quiescent,like memory T cells (54). Due to the marked disparity in the energyrequirement of resting versus activated T cells, regulation of glucoseuptake is considerably different. In the resting state, glucoseuptake is not regulated through TCR-mediated activation sig-nals. On the other hand, activation of TCR-mediated signalingincreases surface expression of key nutrient receptors and cellularmetabolism (55). The present study showed that activated NKT cellsup-regulate the surface expression of the glucose transporter Glut1and increase their glucose uptake. However, activated NKT cells arestill less efficient than activated CD4 T cells in their glucose uptake.T cells switch metabolism from OXPHOS to glycolysis for
their proliferation and effector functions as soon as they areactivated (56). A previous study indicated that glycolysis affectsthe translation of cytokines at the posttranscriptional level (50).In agreement, our data show that glucose is required for properexpression of cytokines by NKT cells. This observation is furthercorroborated by the fact that the effect of 3 d of starvation on
D0
D1
D3
p-S6 p-Akt
# of
cel
ls
A
C
2 nM
20 nMR
apam
ycin
0102103104105050
100150200 86.2
0 102103 104105020406080
29.5
010 2103104105050
100150
29.6
0102103 1041050500
10001500
93.7
0 1021031041050300600900
1200 71.8
010210 31041050200400600800
100068.7
# of
cel
ls
NKT CD4
CellTrace Violet
0 nM
B
0102103104105020406080
100p-Akt
0102 103104105020406080
100p-S6
% o
f max
FSC
0020406080
100Control
0102103104105020406080
1002-NBDG
% o
f max
102103104105
Rapa
Fig. 4. mTORC regulates glucose uptake in activatedNKT cells. (A) NKT cells were sorted from spleens ofC57BL/6 mice and stimulated with anti-CD3 and anti-CD28 antibodies. Representative histograms fromthree independent experiments show the level ofpS6Ser235/236 and pAktSer473 in NKT cells at day 0 (D0),day 1 (D1), and day 3 (D3) of stimulation. (B) SortedNKT cells were stimulated for 3 d with α-GalCer in thepresence of either DMSO (Control) or rapamycin(20 nM). Representative histograms show the amountsof pS6Ser235/236, pAktSer473, 2-NBDG uptake (20 μM), andFSC of NKT cells on day 3. (C) NKT cells were stimulatedas mentioned in B and CD4 T cells as described inMaterials and Methods in the presence of rapamycin(2 nM and 20 nM) or DMSO for 3 d. Cell proliferationwas measured using CellTrace Violet dilutions. Histo-grams are representative of at least three independentexperiments.
Kumar et al. PNAS | April 9, 2019 | vol. 116 | no. 15 | 7443
cytokine synthesis in NKT cells was reversed by replenishment ofglucose for 4 h during PMA/ionomycin restimulation. Thesefindings were also supported by our in vivo infection data, whichshowed that glucose uptake was directly correlated with cytokineproduction in NKT cells in response to the bacterial infection.Furthermore, NKT cells with high glucose uptake suppressed thebacterial growth more efficiently. However, glucose does notseem to be necessary for NKT cell proliferation. Instead, wefound that glutamine is an essential carbon source for NKT cells’survival and proliferation, and further investigation of glutaminemetabolism in NKT cells is warranted.Recently, metabolic regulators, such as Folliculin-interacting
protein 1 (Fnip1), mTORC1, mTORC2, and c-myc have beenshown to regulate NKT cell development, suggesting a possiblerole of signaling molecules in regulating metabolism in NKTcells (5, 6, 33, 57). mTORC is activated in response to signals
from extracellular growth factors, nutrient availability, and theenergy status of T cells. mTORC1 regulates various aspects ofcellular metabolism, including glycolysis, protein synthesis, andlipid synthesis. mTORC1 regulates glycolysis through hypoxia-inducible factor-1α (HIF-1α) and c-myc (58, 59). These transcriptionfactors control the expression of glucose transporters and mul-tiple enzymes controlling glycolysis. Both the mTORC1 targetpS6Ser235/236 and the mTORC2 target pAktSer473 were induced inactivated NKT cells, and blocking these signals by rapamycin treat-ment decreased glucose uptake. The fact that the effects of mTORCinhibition are more severe than glucose depletion during stimulationsuggests that NKT cells rely more on other metabolic pathwayscontrolled by mTORC than glycolysis. NKT cell proliferationwas more sensitive to rapamycin treatment than CD4 T cells,which could be explained by higher mTORC activity in NKTthan CD4 T cells after 3 d of stimulation.
0102 1031041050100200300
# of
Cel
ls
0102 103 104105050
100150200
0102 103104105050
100150
0102 103 104105050
100150
Mock 1 µM 100 nM 10 nM
Oligomycin
CellTrace Violet
H
D
D0 D30
10
20
30
40
ATP
(uM
/106
cell s
)
*
*
NKTCD4
0102103104105020406080
100
0102103104105020406080
100
% o
f max
MitoTracker Green
D0 D3
CD4NKT
E
D0 D30 30
500010000150002000025000
*
ns
NKTCD4
Mito
Trac
ker
MF I
0102103104105020406080
100
0102103104105020406080
100
% o
f max
TMRM
CD4NKT
F
0 30
5000
10000
15000
20000 NKT
*
*CD4
TMR
MM
FID0 D3
G
- + +-OligomycinNKT CD4
0.0
0.5
1.0
1.5
Fold
chan
ge **
ns
D0 D3
C
0
200
400
600
800 CD4
*
NKT
Lact
ate
(uM
)B
Hk2AldoaEno2Pdk1
Pdha1Pdhb Dl
at0
1
2
3
4
Fold
chan
ge CD4 NKT
*
** *** ** *
Glycolysis
CsAco1Idh3a Dl
stSdhd
Sucla2Mdh2
012345
TCA
Fold
chan
g e
****** * **
**
***
G6pdxH6pdRpiaPrps1
Taldo1 Tk
t0
1
2
3
Fold
chan
ge
* *******
**
Pentose phosphate pathwayA
*
* **** **** **
Rel
ativ
e le
vel
Glycolysis
Fig. 5. Maintenance of optimum NKT cell survival, proliferation and function requires elevated OXPHOS. (A) Freshly sorted NKT and CD4 T cells from C57BL/6 mice were subjected to metabolomic analysis through LC-MS/MS. The graph shows relative levels of metabolites representing glycolysis between NKT andCD4 T cells. Values are from three replicas. (B) Sorted NKT and CD4 T cells were stimulated with anti-CD3 and anti-CD28 antibodies for 3 d, and RNA wasprepared. Expression of genes involved in the indicated pathways of glucose metabolism was measured using RT2 PCR array. Fold-change was calculated asdescribed inMaterials and Methods and the values were compared between stimulated NKT and CD4 T cells. The graphs are cumulative of three independentexperiments. (C and D) The graphs show intracellular levels of lactate (C) and ATP (D) in NKT and CD4 T cells with (D3) or without (D0) stimulation with anti-CD3 and anti-CD28 antibodies for 3 d. (E and F) Representative histograms show mitochondrial mass measured by staining with MitoTracker (E) and mi-tochondrial potential measured by TMRM staining (F) in NKT and CD4 T cells without (D0) and with stimulation (D3), as mentioned in B. The graphs arecumulative of three to four experiments. (G and H) Sorted NKT and CD4 T cells were stimulated with α-GalCer and anti-CD3 and anti-CD28 antibodies, re-spectively, in the presence of DMSO (0 mM) or oligomycin at indicated concentrations. (G) The graph shows fold-changes in percent live NKT and CD4 T cellsmeasured by PI exclusion after 3 d of stimulation in the presence of 10 nM oligomycin (n = 3). (H) Representative histograms show NKT cell proliferationmeasured using CellTrace Violet dilutions on day 3 of stimulation of NKT cells. All of the results are representative of at least three independent experiments.Error bars represent mean ± SEM; *P < 0.05, **P < 0.01, ***P < 0.001, ****P < 0.0001.
7444 | www.pnas.org/cgi/doi/10.1073/pnas.1901376116 Kumar et al.
The results from metabolomic and gene-expression analysesfor glucose metabolism demonstrated differences between NKTand CD4 T cells. NKT cells have lower levels of glycolytic metabolitesin the steady state. Unlike CD4 T cells, activation of NKT cellssubstantially increased the expression of genes encoding enzymesinvolved in the PPP and the TCA cycle. Pdk increases the oxi-dation of pyruvate, the end product of glycolysis into lactate byinhibiting the activity of Pdha, the enzyme responsible for oxi-dizing pyruvate into acetyl-CoA in the mitochondria (60). NKTcells expressed reduced Pdk1 but increased Pdha1 genes, sug-gesting that pyruvate may be primarily converting into acetyl-CoA and then enters the mitochondria rather than convertinginto lactate. This was further corroborated by the finding oflower levels of intracellular lactate in NKT cells than CD4 T cellsupon activation. High levels of lactate in the extracellular environ-ment decreased mTORC signaling activity, which was detrimentalfor NKT cell survival but favorable for CD4 T cells. In addition,NKT cells reduced IL-4 and IL-17 production but not IFN-γ pro-duction, suggesting that IFN-γ expression is more resistant to cellularstress caused by high lactate. In contrast to this, CD4 T cells producemore IL-17 and less IFN-γ in high lactate environment (61).In this study, we observed that the level of PLZF correlates
with the glycolysis rate in NKT cells. PLZF suppresses the ini-tiation of c-myc transcription in non-T cells (62). C-myc controlsnot only key cell cycle regulators, but also is responsible for themetabolic switch from OXPHOS to glycolysis in T cells uponactivation (59). It is possible that the decreased glucose uptakethat we observed in NKT cells is a consequence of low c-mycexpression. PLZF is known to suppress mTORC1 activity by
inducing expression of the mTORC1 inhibitor Redd1 in stemcells (63). In contrast to an earlier study showing that PLZFoverexpression in brown adipose tissue increases mitochondrialrespiration (64), we observed reduced mitochondrial mass andpotential in PLZFTg CD4 T cells. The difference is likely due tothe cell type-specific function of PLZF. Additionally, we pro-vided supporting evidence that glucose is oxidized in the mito-chondria as glucose-derived citrate levels are higher in PLZFTg
than WT CD4 T cells. However, this citrate might be metabo-lizing in the fatty acid synthesis pathway instead of circulating inthe TCA cycle, as revealed by similar levels of abundance of 13
C2-succinate and malate. It should be noted that due to thelimited number of NKT cells, metabolic assays requiring a highnumber of cells were performed with PLZFTg CD4 T cells as amodel to study the role of PLZF. Nevertheless, the data fromPLZF+/− NKT cells align with PLZFTg CD4 T cells, supportingthe idea that PLZF might regulate low glycolysis in NKT cells.To investigate how PLZF regulates these metabolic differences,we reanalyzed the ChIP-sequencing data of NKT and PLZFTg
thymic cells (GSE81772) archived in databases (22). The analysisshowed that PLZF does not seem to bind to genes involved in glucosemetabolism that expressed higher or lower levels in NKT cells thanCD4 T cells before stimulation (SI Appendix, Fig. S6). Therefore, thedata suggest an indirect role of PLZF in glucose metabolism.However, we cannot rule out the possibility that PLZF’s bindingcould be changed in stimulated NKT cells. Unfortunately, thistype of experiment is highly challenging to do with stimulatedNKT cells due to the limited cell number. Therefore, further
D
pS6 PE-Cy70
20406080
100
0 2 10 10 1010 3 4 5 0 102 10 103 4 5020406080
100
10
% o
f max NaCl
Na-lactate
C NKT
% o
f max
FSC
20406080100
0 2 10 10 1010 3 4 50
CD4
20406080
100
0 2 10 10 1010 3 4 50
Na-lactateNaCl
0.0
0.5
1.0
1.5 *
Fold
cha
nge
A
Na-lactate 20mMNa-lactate 40mM
NaCl
0
5
10
15
% IL
-4+ c
ells *
0102 103 1041050
102
103
104
105 7.6 7.2
25.559.7
0102 103 104 1050
102
103
104105 2.0 0.6
34.363.2
IFN- PE
IL-1
7 P
erC
P-C
y5.5
NaCl
0 102 103 104 1050
102
103
104105 0.8 1.5
35.462.4
0 102 103 104 1050
102
103
104105 0.9 0.2
40.458.5
Na-lactate
IL-4
PE
-Cy7
0
1
2
3
% IL
-17+
cells *
83.6
63.5
73.2
NaCl
20 mM
40 mM
Na-
lact
ate
# of
cel
ls
EB
CellTrace Violet
Fig. 6. A high-lactate environment is detrimental for NKT cell homeostasis and effector functions. Sorted NKT and CD4 T cells from of C57BL/6 spleens werestimulated for 3 d, as in Fig. 2, in the presence of NaCl or Na-lactate. (A) The graph shows fold-changes in surviving NKT cells under the indicated conditions atday 3 using PI exclusion assay (n = 3). (B) Representative histograms show proliferation of NaCl and Na-lactate (20 mM and 40 mM) treated NKT cells usingCellTrace Violet dilutions (n = 3). (C and D) Representative histograms comparing the cell size measured using FSC (C) and levels of pS6Ser235/236 (D) in NKT andCD4 T cells treated with NaCl and Na-lactate (40 mM) (n = 3). (E) Representative plots show the cytokine expressions in NKT cells stimulated for 3 d in thepresence of either NaCl or Na-lactate (40 mM) and restimulated with PMA and ionomycin on day 3. Summary graphs on the Right show percentages of IL-4+
and IL-17+ NKT cells. All of the data are representative of at least three independent experiments. Error bars represent mean ± SEM; *P < 0.05.
Kumar et al. PNAS | April 9, 2019 | vol. 116 | no. 15 | 7445
mechanistic studies are warranted to understand how PLZFcontrols the metabolic activity in NKT cells.In summary, the present study shows that NKT cells rely primarily
on OXPHOS for their survival and proliferation. When NKT cellsencounter antigen, they up-regulate mTORC signaling and glycolysis,both of which are important for proper cytokine expression.
Materials and MethodsMice. Male and female mice at 8–12 wk of age on the C57BL/6 backgroundwere used in this study. Mice were purchased from Jackson Laboratories andhoused in specific pathogen-free conditions. PLZF transgenic (referred to asPLZFTg) mice driven by the lck promoter (23) and PLZF-haplodeficient mice(referred to as PLZF+/−) (65) have been kindly provided by Derek Sant’Angelo,Rutgers University, New Brunswick, NJ. In all of the experiments with thesePLZFTg and PLZF+/− mice, WT littermate mice were used as a control. All animalexperiments were performed in accordance with the Institutional Animal Careand Use Committee of the University of Michigan.
Cell Isolation and Purification. The single-cell suspensions from spleens wereprepared as per standard protocol (24). To sort NKT and CD4 T cells, splenocyteswere incubated in anti-CD19 beads (Miltenyi Biotec) in MACS buffer for 30 minto exclude B cells, followed by passaging through MiniMACS columns (MiltenyiBiotec) and collection of the flow through. NKT and CD4 T cells were sortedusing FACS Aria II/FACS Synergyhead1 (BD Biosciences). APC- or Pacific Blue-conjugated murine CD1d tetramers loaded with PBS-57 were kindly providedby the National Institute of Health Tetramer Facility, Atlanta, GA. For CD4T cells enrichment, a positive selection enrichment kit was used according to themanufacturer’s instructions (Miltenyi Biotec).
Cell Culture. To compare the responses of NKT and CD4 T cells after activation,sorted cells were activated with plate bound anti-CD3 (2.5 μg/mL) and soluble
anti-CD28 (1 μg/mL) antibodies (eBioscience) for an indicated time in the pres-ence of IL-2 (10 U/mL) in RPMI medium 1640 supplemented with 10% FBS, 2 mMglutamine, and penicillin/streptomycin at 37 °C. To study activated NKT cellswithout involving CD4 T cells, we used α-GalCer (100 ng/mL). For the treatmentwith 2-DG, Na-lactate, rapamycin, and oligomycin, NKT cells were stimulatedwith soluble α-GalCer (100 ng/mL). For glucose and glutamine limitationassay, sorted NKT and CD4 T cells were stimulated in glucose and glutamine-free RPMI 1640 media supplemented with 10% dialyzed FBS (Sigma Aldrich).
Flow Cytometry Assays. The following fluorescently conjugated antibodieswere used for surface and intracellular staining in the presence of anti-FcγRmAb (2.4G2): anti-mouse TCR-β (H57-597) Pacific Blue/APC, PBS-57-loadedCD1d tetramer APC/PE/Pacific Blue, anti-mouse CD4 (GK1.5) APC-Cy7, anti-mouse IFN-γ (XMG1.2) PE/FITC, anti-mouse IL-4 (BV D6-2462) PE-Cy7, andanti-mouse IL-17 (TC11-18H10) PerCP-Cy5.5 (all from eBioscience).
For intracellular cytokine expressions, unstimulated or stimulated cellswere restimulated with 50 ng/mL of PMA (Sigma Aldrich) and 1.5 μM ofionomycin (Sigma Aldrich) in the presence of Golgi Plug (BD Biosciences) for4 h, followed by intracellular cytokine staining according to manufacturer’sinstruction (BD Biosciences). mTORC activity was measured using phospho-S6Ribosomal protein (pS6Ser235/236) (Cell Signaling) and pAktSer473 (Cell Signal-ing) staining in permeabilization buffer. Cell death was measured by theexclusion of propidium iodide (PI; 1 μg/mL) or live/dead Fixable Aqua DeadCell Stain (Invitrogen). Cells were acquired on FACS Canto II (BD Bioscience)and data were analyzed using FlowJo (TreeStar software v9.9).
Mitochondrial Parameters Detection. To measure mitochondrial parameters,total splenocytes (3 × 10⁶ cells) or stimulated NKT and CD4 T cells (1 × 10⁵)cells were incubated with potentiometric dye TMRM (60 nM; Invitrogen),MitoTracker green (30 nM; Invitrogen), and MitoSox (2.5 μM; Invitrogen) for30 min at 37 °C in RPMI media for flow cytometry.
A
C
D
B
Fig. 7. PLZF levels negatively correlate with glycolysis rate in NKT and PLZFTg CD4 T cells. (A) Representative histograms show 2-NBDG uptake (Upper) andGlut1 expression (Lower) in splenic NKT cells from PLZF haplodeficient (+/−) and WT littermate (+/+) mice. The graphs (Right) are cumulative of four in-dependent experiments. (B) The graph shows intracellular lactate levels in freshly sorted NKT cells from PLZF haplodeficient (+/−) and WT littermate mice (n =3). (C) Representative histograms compare 2-NBDG uptake (Upper) and Glut1 expression (Lower) in splenic CD4 T cells from PLZFTg (Tg) and WT littermatemice. The bar graphs are cumulative of four independent experiments. (D) The graphs show intracellular lactate (Upper) and ATP levels (Lower) in enrichedCD4 T cells from PLZFTg and WT littermate mice before (D0) and after 3 d of stimulation (D3) with anti-CD3 and anti-CD28 antibodies. The graphs are cu-mulative of three independent experiments. Error bars represent mean ± SEM; *P < 0.05, **P < 0.01, ***P < 0.001.
7446 | www.pnas.org/cgi/doi/10.1073/pnas.1901376116 Kumar et al.
Glucose Uptake Assay. For in vitro glucose uptake assay, total splenocytes (3 ×10⁶ cells) were incubated in 2-NBDG (20 μM; Invitrogen) for 1 h or as in-dicated at 37 °C in glucose-free RPMI 1640 media containing 10% dialyzedFBS. For in vivo glucose uptake, mice were injected with 2-NBDG (100 μg permouse) intravenously. After 15 min of 2-NBDG injection, mice were killed,and spleens were removed. Total splenocytes were stained for the surfacemarkers, as mentioned.
Glut1 Expression Detection. To study Glut1 expression, total splenocytes (3 ×10⁶ cells) were stained for surface markers and then fixed in 4% para-formaldehyde. The staining for the expression of Glut1 for flow cytometry wasperformed at room temperature for 30 min in the dark using anti-GlucoseTransporter (Glut1) antibody (EPR3915; Abcam).
ATP and Lactate Assays. ATP levels were measured using CellTiter-Glo Lu-minescent Cell Viability reagent (Promega). For intracellular lactate level,plate-based fluorometric measurement kit (excitation 530–540 nm, emission 585–595 nm) was used according to the manufacturer’s instructions (Cayman Chemicals).
Metabolic Seahorse Assay. CD4 T cells fromWT and PLZFTg mice were enrichedfrom freshly prepared splenocytes and stimulated as indicated. In theXF96 well microplate coated with polylysine, 5 × 10⁵ cells per well wereplated in glucose-free Seahorse media (Sigma Aldrich) and the plate wasbriefly spun to affix the cells to the bottom of the wells. The plate was then
incubated for 30 min in a non-CO2 incubator to equilibrate. ECAR wasmeasured in stimulated CD4 T cells using glucose (10 mM; Sigma Aldrich),oligomycin (2 mM, ATP coupler; Sigma Aldrich), and 2-DG (100 mM; SigmaAldrich) in Seahorse assay medium using Seahorse XFe96 bioanalyzer(Agilent Technologies).
MS Analysis of [U13C6]-Glucose. For heavy isotope flux analysis, 2 × 10⁶
unstimulated and stimulated enriched CD4 T cells from WT and PLZFTg micewere incubated with [U-13C6]-glucose (15 mM; Sigma Aldrich) and glutamine(2 mM) in glucose-free media containing 10% dialyzed serum for 4–5 h at37 °C. Cells were washed with PBS and frozen in liquid nitrogen. Cells werefurther subjected to LC-MS/MS. Mass isotopomer distribution was de-termined using a custom algorithm.
Targeted Metabolites Measurements. Lysate was prepared from sorted NKTand CD4 T cells (5 × 10⁵ cells per replicate) by incubating the cells with 80%methanol and following a series of vigorous mixing steps. Cells were spundown at maximum speed to remove membranous debris, and the lysate wascollected for drying using a SpeedVac. Dried metabolites were collected andanalyzed using Agilent 6470 Triple Quadrupole LC-MS/MS metabolomicswith dynamic multiple reaction monitoring detection method.
Cell Proliferation. Sorted NKT and CD4 T cells were labeled with CellTraceViolet (5 μM; Invitrogen) in 1× PBS containing 0.1% BSA for 30 min at 37 °C.Cells were stimulated as indicated and analyzed by flow cytometry on day3 of stimulation for CTV dilutions.
RT2 Gene PCR Array. Total RNA was isolated from unstimulated and stimu-lated NKT and CD4 T cells using RNeasy Plus mini kit (Qiagen) according to themanufacturer’s instructions. RNA samples were transported to the Universityof Michigan DNA Sequencing Core to perform the Glucose Metabolism PCRArray, and gene array was performed using Mouse Glucose Metabolism RT2
Profiles PCR Array according to the manufacturer’s instructions (Qiagen)using Applied Biosystem’s 7900HT Sequence Detection System. Fold-changeswere calculated from ΔCt values (gene of interest Ct value – an average ofall housekeeping gene Ct values) using the ΔΔCt method. Gene expressionof target genes was normalized to the average of the housekeeping genesβ-actin, β-2 microglobulin, and heat-shock protein 90.
L. monocytogenes Infection. L. monocytogenes expressing Ovalbumin (LM-Ova) strain 10403s (originally obtained from M. L. Gray, Montana StateUniversity, Bozeman, MT) was a kind gift from Mary O’Riordan, University ofMichigan, Ann Arbor, MI. L. monocytogenes was grown in BHI broth mediaand the bacteria were collected in a midlog phase for infection. C57BL/6 mice were injected intraperitoneally with 105 or 107 CFU per mouse of LM-Ova in 200 μL of PBS or PBS alone. On day 2 of infection, bacterial burdenwas enumerated from homogenized spleen using colony forming unit deter-mination by culturing serially diluted samples on LB agar plates. Intracellularcytokine expression and glucose uptake by NKT cells were measured asdescribed above.
Statistical Analysis. All of the graphs were prepared and data analyzed usingPrism software (Prism v7; Graphpad Software). For comparison amongmultiple groups, data were analyzed using one-way ANOVA with the mul-ticomparison post hoc test. For correlation determination, Spearman corre-lation was calculated. For comparison between two groups, unpaired andpaired Student t tests were used. P < 0.05 was considered statisticallysignificant.
ACKNOWLEDGMENTS. We thank Dr. Derek B. Sant’Angelo (Rutgers Univer-sity) for providing PLZFTg and PLZF+/− mice; the laboratory members for theircritical reading of the manuscript and insightful comments; Drs. CharlesBurant and Maureen Kachman, from the Metabolomics Core for carryingout LC-MS/MS analysis and for their critical interpretation of the data andhelpful discussions; Dr. Mary O’Riordan for providing Listeria monocytogenes(10403s LM-Ova); and the National Institutes of Health Tetramer Facility forproviding CD1d-tetramers. This work was supported in part by National Insti-tutes of Health Grant AI121156 (to C.-H.C.). Carbon-tracing experiments weresupported by a pilot and feasibility grant from the Michigan Regional Compre-hensive Metabolomics Resource Core (U24-DK097153).
1. Arase H, Arase N, Nakagawa K, Good RA, Onoé K (1993) NK1.1+ CD4+ CD8- thymocytes
with specific lymphokine secretion. Eur J Immunol 23:307–310.2. Bendelac A, Rivera MN, Park SH, Roark JH (1997) Mouse CD1-specific NK1 T cells:
Development, specificity, and function. Annu Rev Immunol 15:535–562.
3. Zeng Z, et al. (1997) Crystal structure of mouse CD1: An MHC-like fold with a large
hydrophobic binding groove. Science 277:339–345.4. Gapin L, Matsuda JL, Surh CD, Kronenberg M (2001) NKT cells derive from double-
positive thymocytes that are positively selected by CD1d. Nat Immunol 2:971–978.
B Lactate (m+3)
0
1
2
3
4
Abu
ndan
ce(X
105 ) ****
D0 D3
2PG (m+3)
0
1
2
3
4
Abu
ndan
ce(X
105 )
*
D0 D3
Citrate (m+2)
0
1
2
3
Abu
ndan
ce(X
105 ) **
D0 D3
F6P (m+6)
0.0
0.1
0.2
0.3
0.4
Abu
ndan
ce(X
105 )
D0 D3
ns
Succinate (m+2)
0
1
2
3
4
Abun
danc
e(X
103 )
D0 D3
nsMalate (m+2)
0
2
4
6
Abu
ndan
ce(X
105 )
D0 D3
ns
WTTg
0
50
100
150Glycolysis
Glycolytic capacity
Glycolytic reserve
*** ***
ECAR
(mpH
/min
)
0 20 40 600
50
100
150
ECAR
(mpH
/min
)
WTTg
GlucoseOligomycin
2-DG
AWTTg
Fig. 8. PLZF expression correlates with levels of OXPHOS. (A) CD4 T cellsfrom PLZFTg and WT littermate mice were enriched and stimulated as de-scribed in Materials and Methods for 3 d. The representative graph (Left)shows the comparison of ECAR using the Seahorse assay. (Right) Graphshowing basal glycolysis, glycolytic capacity, and glycolytic reserve capacity inPLZFTg and WT CD4 T cells from three independent experiments. (B) WT andPLZFTg CD4 T cells were stimulated for 3 d, washed, and cultured in glucose-free RPMI containing glutamine (2 mM) and [13C6]-glucose (15 mM) for 4 hbefore subjecting to LC-MS analysis. Representative graphs show the abun-dance of 13C6-glucose-derived carbon in glycolysis (F6P, 2PG, and lactate) andTCA cycle (citrate, succinate, and malate) intermediate metabolites fromcells before (D0) and after stimulation for 3 d (D3). Two independent ex-periments showed similar results. Error bars represent mean ± SEM; ns, notsignificant, *P < 0.05, **P < 0.01, ***P < 0.001, ****P < 0.0001.
Kumar et al. PNAS | April 9, 2019 | vol. 116 | no. 15 | 7447
IMMUNOLO
GYAND
INFLAMMATION
Dow
nloa
ded
by g
uest
on
Apr
il 20
, 202
0
5. Zhang L, et al. (2014) Mammalian target of rapamycin complex 1 orchestrates in-variant NKT cell differentiation and effector function. J Immunol 193:1759–1765.
6. Prevot N, et al. (2015) Mammalian target of rapamycin complex 2 regulates invariantNKT cell development and function independent of promyelocytic leukemia zinc-finger. J Immunol 194:223–230.
7. Watarai H, et al. (2012) Development and function of invariant natural killer T cellsproducing T(h)2- and T(h)17-cytokines. PLoS Biol 10:e1001255.
8. Lee YJ, Holzapfel KL, Zhu J, Jameson SC, Hogquist KA (2013) Steady-state productionof IL-4 modulates immunity in mouse strains and is determined by lineage diversity ofiNKT cells. Nat Immunol 14:1146–1154.
9. Buechel HM, Stradner MH, D’Cruz LM (2015) Stages versus subsets: Invariant naturalkiller T cell lineage differentiation. Cytokine 72:204–209.
10. Viale R, Ware R, Maricic I, Chaturvedi V, Kumar V (2012) NKT cell subsets can exertopposing effects in autoimmunity, tumor surveillance and inflammation. CurrImmunol Rev 8:287–296.
11. Illés Z, et al. (2000) Differential expression of NK T cell V alpha 24J alpha Q invariantTCR chain in the lesions of multiple sclerosis and chronic inflammatory demyelinatingpolyneuropathy. J Immunol 164:4375–4381.
12. Beaudoin L, Laloux V, Novak J, Lucas B, Lehuen A (2002) NKT cells inhibit the onset ofdiabetes by impairing the development of pathogenic T cells specific for pancreaticbeta cells. Immunity 17:725–736.
13. Baron JL, et al. (2002) Activation of a nonclassical NKT cell subset in a transgenicmouse model of hepatitis B virus infection. Immunity 16:583–594.
14. Durante-Mangoni E, et al. (2004) Hepatic CD1d expression in hepatitis C virus in-fection and recognition by resident proinflammatory CD1d-reactive T cells. J Immunol173:2159–2166.
15. Crosby CM, Kronenberg M (2016) Invariant natural killer T cells: Front line fighters inthe war against pathogenic microbes. Immunogenetics 68:639–648.
16. Lisbonne M, et al. (2003) Cutting edge: Invariant V alpha 14 NKT cells are required forallergen-induced airway inflammation and hyperreactivity in an experimental asthmamodel. J Immunol 171:1637–1641.
17. Cui J, et al. (1997) Requirement for Valpha14 NKT cells in IL-12-mediated rejection oftumors. Science 278:1623–1626.
18. Dhodapkar MV, et al. (2003) A reversible defect in natural killer T cell functioncharacterizes the progression of premalignant to malignant multiple myeloma. J ExpMed 197:1667–1676.
19. Metelitsa LS, et al. (2004) Natural killer T cells infiltrate neuroblastomas expressingthe chemokine CCL2. J Exp Med 199:1213–1221.
20. Kovalovsky D, et al. (2008) The BTB-zinc finger transcriptional regulator PLZF controlsthe development of invariant natural killer T cell effector functions. Nat Immunol 9:1055–1064.
21. Savage AK, Constantinides MG, Bendelac A (2011) Promyelocytic leukemia zinc fingerturns on the effector T cell program without requirement for agonist TCR signaling.J Immunol 186:5801–5806.
22. Mao AP, et al. (2016) Multiple layers of transcriptional regulation by PLZF in NKT-celldevelopment. Proc Natl Acad Sci USA 113:7602–7607.
23. Kovalovsky D, et al. (2010) PLZF induces the spontaneous acquisition of memory/ef-fector functions in T cells independently of NKT cell-related signals. J Immunol 184:6746–6755.
24. Kim YH, Kumar A, Chang CH, Pyaram K (2017) Reactive oxygen species regulate theinflammatory function of NKT cells through promyelocytic leukemia zinc finger.J Immunol 199:3478–3487.
25. Michalek RD, et al. (2011) Cutting edge: Distinct glycolytic and lipid oxidative meta-bolic programs are essential for effector and regulatory CD4+ T cell subsets.J Immunol 186:3299–3303.
26. Gerriets VA, et al. (2015) Metabolic programming and PDHK1 control CD4+ T cellsubsets and inflammation. J Clin Invest 125:194–207.
27. MacIver NJ, Michalek RD, Rathmell JC (2013) Metabolic regulation of T lymphocytes.Annu Rev Immunol 31:259–283.
28. Pearce EL, Pearce EJ (2013) Metabolic pathways in immune cell activation and qui-escence. Immunity 38:633–643.
29. Pollizzi KN, Powell JD (2014) Integrating canonical and metabolic signalling pro-grammes in the regulation of T cell responses. Nat Rev Immunol 14:435–446.
30. O’Neill LA, Kishton RJ, Rathmell J (2016) A guide to immunometabolism for immu-nologists. Nat Rev Immunol 16:553–565.
31. Laplante M, Sabatini DM (2012) mTOR signaling in growth control and disease. Cell149:274–293.
32. Wei J, Yang K, Chi H (2014) Cutting edge: Discrete functions of mTOR signaling ininvariant NKT cell development and NKT17 fate decision. J Immunol 193:4297–4301.
33. Dose M, et al. (2009) Intrathymic proliferation wave essential for Valpha14+ naturalkiller T cell development depends on c-Myc. Proc Natl Acad Sci USA 106:8641–8646.
34. Mycko MP, et al. (2009) Selective requirement for c-Myc at an early stage of V(alpha)14i NKT cell development. J Immunol 182:4641–4648.
35. Williams JA, et al. (2008) Regulation of thymic NKT cell development by the B7-CD28 costimulatory pathway. J Immunol 181:907–917.
36. Akbari O, et al. (2008) ICOS/ICOSL interaction is required for CD4+ invariant NKT cellfunction and homeostatic survival. J Immunol 180:5448–5456.
38. Kishimoto H, et al. (2007) The Pten/PI3K pathway governs the homeostasis ofValpha14iNKT cells. Blood 109:3316–3324.
39. Pyaram K, Sen JM, Chang CH (2017) Temporal regulation of Wnt/β-catenin signaling isimportant for invariant NKT cell development and terminal maturation.Mol Immunol85:47–56.
40. Vander Heiden MG, Cantley LC, Thompson CB (2009) Understanding the Warburgeffect: The metabolic requirements of cell proliferation. Science 324:1029–1033.
41. Frauwirth KA, et al. (2002) The CD28 signaling pathway regulates glucose metabo-lism. Immunity 16:769–777.
42. Cham CM, Driessens G, O’Keefe JP, Gajewski TF (2008) Glucose deprivation inhibitsmultiple key gene expression events and effector functions in CD8+ T cells. Eur JImmunol 38:2438–2450.
43. Sena LA, et al. (2013) Mitochondria are required for antigen-specific T cell activationthrough reactive oxygen species signaling. Immunity 38:225–236.
44. Powell JD, Lerner CG, Schwartz RH (1999) Inhibition of cell cycle progression by ra-pamycin induces T cell clonal anergy even in the presence of costimulation. J Immunol162:2775–2784.
45. Powell JD, Delgoffe GM (2010) The mammalian target of rapamycin: Linking T celldifferentiation, function, and metabolism. Immunity 33:301–311.
46. Salio M, et al. (2014) Essential role for autophagy during invariant NKT cell devel-opment. Proc Natl Acad Sci USA 111:E5678–E5687.
47. Macintyre AN, et al. (2014) The glucose transporter Glut1 is selectively essential forCD4 T cell activation and effector function. Cell Metab 20:61–72.
48. Carr EL, et al. (2010) Glutamine uptake and metabolism are coordinately regulated byERK/MAPK during T lymphocyte activation. J Immunol 185:1037–1044.
49. Johnson MO, et al. (2018) Distinct regulation of Th17 and Th1 cell differentiation byglutaminase-dependent metabolism. Cell 175:1780–1795.e19.
50. Chang CH, et al. (2013) Posttranscriptional control of T cell effector function byaerobic glycolysis. Cell 153:1239–1251.
51. Ranson T, et al. (2005) Invariant V alpha 14+ NKT cells participate in the early re-sponse to enteric Listeria monocytogenes infection. J Immunol 175:1137–1144.
52. Angelin A, et al. (2017) Foxp3 reprograms T cell metabolism to function in low-glucose, high-lactate environments. Cell Metab 25:1282–1293 e7.
53. Finlay DK (2012) Regulation of glucose metabolism in T cells: New insight into the roleof phosphoinositide 3-kinases. Front Immunol 3:247.
54. Sukumar M, et al. (2013) Inhibiting glycolytic metabolism enhances CD8+ T cellmemory and antitumor function. J Clin Invest 123:4479–4488.
55. Jacobs SR, et al. (2008) Glucose uptake is limiting in T cell activation and requires CD28-mediated Akt-dependent and independent pathways. J Immunol 180:4476–4486.
56. Menk AV, et al. (2018) Early TCR signaling induces rapid aerobic glycolysis enablingdistinct acute T cell effector functions. Cell Rep 22:1509–1521.
57. Park H, Tsang M, Iritani BM, Bevan MJ (2014) Metabolic regulator Fnip1 is crucial foriNKT lymphocyte development. Proc Natl Acad Sci USA 111:7066–7071.
58. Düvel K, et al. (2010) Activation of a metabolic gene regulatory network downstreamof mTOR complex 1. Mol Cell 39:171–183.
59. Wang R, et al. (2011) The transcription factor Myc controls metabolic reprogrammingupon T lymphocyte activation. Immunity 35:871–882.
60. Patel MS, Nemeria NS, Furey W, Jordan F (2014) The pyruvate dehydrogenase com-plexes: Structure-based function and regulation. J Biol Chem 289:16615–16623.
61. Haas R, et al. (2015) Lactate regulates metabolic and pro-inflammatory circuits incontrol of T cell migration and effector functions. PLoS Biol 13:e1002202.
62. McConnell MJ, et al. (2003) Growth suppression by acute promyelocytic leukemia-associated protein PLZF is mediated by repression of c-myc expression. Mol Cell Biol23:9375–9388.
63. Hobbs RM, Seandel M, Falciatori I, Rafii S, Pandolfi PP (2010) Plzf regulates germlineprogenitor self-renewal by opposing mTORC1. Cell 142:468–479.
64. Plaisier CL, et al. (2012) Zbtb16 has a role in brown adipocyte bioenergetics. NutrDiabetes 2:e46.
65. Barna M, Hawe N, Niswander L, Pandolfi PP (2000) Plzf regulates limb and axialskeletal patterning. Nat Genet 25:166–172.
7448 | www.pnas.org/cgi/doi/10.1073/pnas.1901376116 Kumar et al.