Enhanced x-ray resolving power achieved behindthe focal circles of Cauchois spectrometers
John F. Seely,1,* Lawrence T. Hudson,2 Glenn E. Holland,3 and Albert Henins2
1Naval Research Laboratory, Space Science Division, Washington, D.C. 203752National Institute of Standards and Technology, Gaithersburg, Maryland 20899
3SFA Inc., 2200 Defense Highway, Suite 405, Crofton, Maryland 21114
Several transmission-crystal (Laue diffraction) x-rayspectrometers have been developed to record hard x-ray spectra generated by irradiating metal targetswith intense laser pulses. These spectrometers arebased on the Cauchois geometry, which implementsa cylindrically curved crystal and a focal circle withdiameter equal to the radius of curvature of the crys-tal [1,2]. While testing and optimizing the spectro-
meter performance using laboratory Mo and Wsources, it was noticed [3] that the spectral resolvingpower increased when the detector was placed be-yond the conventionally employed focal circle. Thisincreased resolving power, achieved without loss ofsignal, enabled the observation of the Kα1, Kα2,Kβ1, and Kβ2 transitions while using spectrometerswith relatively small dimensions, typically less than0:5m, and with relatively high throughput.
This enhancement follows primarily from the factthat Cauchois-geometry x-ray spectrometers are notfocusing spectrometers for point-like sources, hence,there is no defocusing beyond the conventional focal
circle. In the real world, sources come in all sizes. Thepurpose of this paper is to develop the formalism to op-timize spectrometer designs for maximum resolvingpowergivensourcesizeandotherrelevantparameters.In this paper, measured spectral line widths are ana-lyzed using a geometrical model, and the results arein good agreement with the experimentally measuredline widths. This addresses a vexing challenge—thatof achieving useful resolving power with the smalldiffraction angles that are inherent in hard x-raywavelength-dispersive spectroscopy. Such optimizedtransmission-crystal spectrometers are well suited toperform in the noisy environments of laser-producedplasmas and other types of hot laboratory plasmas.Figure 1 is a schematic of the transmission-crystal
modules utilized in these spectrometers. X rays areincident on the convex side of a cylindrically bentcrystal, are diffracted through a slit, and are re-corded by a planar detector placed on or behind thefocal circle. Metal filters located at the slit provide Kabsorption edges in the continuum spectra for in situcalibration of the x-ray energy scale. A pinhole withseparate filtration is on the center axis of the spectro-meter and produces an image of the source. Therelative positions of the pinhole image and the dis-persed spectral image indicate the instrument point-ing. Massive lead shielding is present on the front ofthe module andat the slit, and there isno line-of-sightpath (except through the pinhole) between the sourceanddetector.Thisgeometry facilitates shieldingof thedetector from the energetic x-ray flux from the source,and in the case of plasmas produced by intense laserirradiation, shielding from energetic protons andelectrons.Three transmission-crystal spectrometers have
been developed and utilized for the study of laser-produced plasmas. The high-energy x-ray spectro-meter (HXS) implemented a cylindrically bent quartz(10-11) crystal covering the 12 to 70keV energy rangewith moderate (E=ΔE ≈ 100) resolving power [4,5].The high-energy electronic x-ray (HENEX) spectro-meter implemented a curved quartz (10-11) crystalcovering the 11 to 40keV range with >300 resolvingpower alongwith four reflection crystals covering low-
er energy ranges [6–8]. The dual crystal spectrometer(DCS) implemented two quartz (10-11) crystals, bentto119and254mmradii of curvature,andcovering the10 to 50keV and the 20 to 120keV energy ranges [9].These instruments were based on spectrometers de-veloped at the National Institute of Standards andTechnology (NIST) for the measurement of the peakkilovoltage of medical x-ray sources [10–12].
The spectra of Fig. 2 illustrate the increase in re-solving power when the detector was placed at in-creasing distances beyond the focal circle of theHXS spectrometer. In this case, the x rays were pro-duced by a Mo microfocus source, and image plateswere placed up to 960mm beyond the focal circle(the spectrum recorded on the focal circle is indicatedby 0mm in Fig. 2). Figure 3 shows the spectral imagerecorded at 960mm behind the focal circle and theresolution of the Kα1, Kα2, Kβ1, and Kβ2 transitions.By comparison, the Kα1 and Kα2 transitions are notresolved in the spectra recorded on or within 20 cm ofthe focal circle as shown in Fig. 2.
2. Small Source
We now develop a model for the spectrometer geome-try shown in Fig. 4 for the case of a point source. Thecylindrically bent crystal has radius of curvature Rand the diffraction planes are assumed to be perpen-dicular to the surface of the crystal. As shown byCauchois [1], focusing of monochromatic x rays froma finite extent along the crystal occurs very nearly onthe circle of diameter R that is tangent to the crystalat p. The distance to a point on the focal circle mea-sured from p is R cos β, where β is the angle from thehorizontal axis of the spectrometer, line ao in Fig. 4,and this is the same parametric equation as for theRowland circle of a concave diffraction grating [13].
We initially consider a point source at a on the spec-trometer axis and at a distanceDs from the crystal.Wealso assume the crystal thickness and diffraction
Fig. 1. Schematic of the transmission-crystal spectrometermodule.
Fig. 2. The Mo spectra recorded by the HXS spectrometer by pla-cing the detector near the focal circle and at distances up to960mm behind the focal circle. The spectrum recorded on the focalcircle is indicated by 0mm.
rocking curve are negligible. The effects of extendedsource size, crystal thickness and rocking curve, andother spectral line broadeningmechanismsare consid-ered in Section 3, so in this case there are no opticaldefocusing effects.In the plane of the spectrometer shown in Fig. 4,
rays from the source with monochromatic energy Eare diffracted at the crystal point c where the Braggequation is satisfied: nhc=E ¼ 2d sin θ where θ is theBragg angle, n is the diffraction order, and d is thecrystal lattice spacing. In all cases considered here,θ ≪ 1 rad, and small angle approximations for sin θ,sin β, and other trigonometric functions and identitiestherefore are used to derive analytical expressions.Thisproducessimple,analyticalequationsthatrevealmore clearly how design parameters impact spectro-meter performance.Let the ray with energy E diffract with angle θ,
cross the spectrometer axis at point s, and intersectthe focal circle at point b. By applying the Law ofSines to the triangles cpb and cpq, we find
cos β sinð2θ − α − βÞ ¼ sinðθ − αÞ ð1Þ
and to lowest order in the angles
β ¼ θ: ð2Þ
Thus, β is independent of the source distance Ds (andindependent of the angle α of the ray from the sourcemeasured with respect to the spectrometer axis).This implies that to lowest order in the angles, allrays with the same energy E intersect at the pointb on the focal circle.
Applying the Law of Sines to the triangles cpb andcpa, we find
Ds sin α ¼ R sinðθ − αÞ ð3Þ
and the angle of the ray from the source, measuredwith respect to the spectrometer axis, is
α ¼ θR=ðRþDsÞ: ð4Þ
In a similar manner, the distances of the crossoverpoint s from the points p and q are found to be
A ¼ RDs=ðRþ 2DsÞ; ð5Þ
B ¼ RðRþDsÞ=ðRþ 2DsÞ; ð6Þ
where Aþ B ¼ R. Since A and B are independent ofthe Bragg angle θ, rays with all energies from a pointsource at a distanceDs from the crystal are diffractedthrough the crossover point s. Thus a slit can beplaced at s, as indicated in Fig. 1, for the purposeof shielding the detector from energetic x rays fromthe source that pass undiffracted through the crystal.Since A and B depend on the source distance Ds, theslit width must be sized to pass rays from a smallsource with variable distance δDs from the crystal.Using Eqs. (2) and (3), it can be shown that the mini-mum slit width is wðRþDsÞ=ðRþ 2DsÞ, where w isthe source extent perpendicular to the axis.
The resolving power is derived from the arc qb onthe focal circle. In the small angle approximation, thedistance along the focal circle (FC) as a function ofenergy, the plate function, is
XFC ¼ βR ¼ θR ¼ nhcR=2dE: ð7Þ
While ideally the detector conforms to the focal circle,our data were acquired with planar detectors tan-gent to the focal circle. The model results of platefunction and resolving power are in good agreementover the range of small diffraction angles (hardx rays) employed here.
Differentiating Eq. (7) with respect to E, the resol-ving power is
E=δE ¼ −nhcR=2dEδX; ð8Þ
where in practice δX is the effective spatial resolu-tion element of the detector (it is shown in the follow-ing sections that other defocusing effects are typically
Fig. 3. The Mo spectrum recorded by the HXS spectrometer withthe detector 960mmbehind the focal circle. TheMoKα1,Kα2,Kβ1,and Kβ2 transitions are well resolved. The grayscale of the imagehas been adjusted to show the x-ray continuum.
Fig. 4. Spectrometer geometry for a point x-ray source.
smaller on the focal circle). Thus, for the case of a de-tector placed on the focal circle, the resolving power isinversely proportional to the detector resolution, isproportional to the focal circle diameter (and crystalbending radius) R, and is independent of the sourcedistance Ds.When a planar detector is placed at a distance D
beyond the focal circle, as illustrated in Fig. 4, thediffracted ray with energy E intersects the detectorat point XD at a distance from the spectrometer axisequal to
where we used Eq. (4). The resolving power is then
E=δE ¼ −ðnhcR=2dEδXÞð1þD=BÞ; ð10Þwhichreduces toEq. (8) onthe focal circle (D ¼ 0).Whilethe spectral line widths increase with detector distanceD from the focal circle, the larger increase in dispersionresults in higher effective resolving power. This is illu-strated with experimental data in Fig. 2 for the case ofMo spectra produced by a microfocus source and re-corded at increasing distances from the focal circle. Asshown in Fig. 3, the resolving power at 960mm beyondthe focal circle is17:5keV=50 eV ¼ 350, while the resol-ving power on the focal circle is 80 (limited primarily bythe 0:14mm resolution of the image plates used in thisexperiment).Equation (6) indicates that B decreases with in-
creasing source distance Ds, and in Eq. (10) this re-sults in increased resolving power. In the limit oflarge distance beyond the focal circle, D ≫ R, the re-solving power is a factor of 2 larger when Ds ≫ R ascompared to Ds ≪ R. Therefore, in contrast to thecase of a detector on the focal circle, Eq. (8), the in-strumental resolving power is enhanced in the caseof a small source both by moving the detector beyondthe focal circle and by increasing the source distance,albeit with a loss of sensitivity and a shift of the in-strumental bandwidth to higher energy.
3. Extended Source
The case of an extended source is shown in Fig. 5.The width of the source perpendicular to the spectro-meter axis is w, and this corresponds to either real orvirtual source points at a and a0 at distances of Dsand Ds
0 from the crystal, respectively. We assumethat w ≪ ðDs;Ds
0Þ so that small angle approxima-tions are valid. Using Eq. (4), it can be shown that
w ¼ tan α0ðDs0−DsÞ ¼ θRðDs
0−DsÞ=ðRþDs
0Þ: ð11ÞAs shown in Fig. 5, two rays from the source points
a and a0 with the same energy E and Bragg angle θ,and having angles with respect to the spectrometeraxis α and α0, pass through point b on the focal circleand diverge to points XD and XD
0 on a detector at dis-
tanceD from the focal circle. The separation betweenXD and XD
0 is
XD0− XD ¼ ð2θ − α0ÞðB0 þDÞ − ð2θ − αÞðBþDÞ
¼ ðα − α0ÞD: ð12Þ
Using Eqs. (4) and (11),
XD0− XD ¼ wD=ðRþDsÞ: ð13Þ
Thus, the broadening resulting from the lateralsource width w is proportional to w and the detectordistanceD beyond the focal circle and decreases withfocal circle radius R and source distance Ds. If thespectral line broadening is dominated by the sourcewidth, which is often the case when the detector isplaced beyond the focal circle, then the source widthw can be inferred from the line width using Eq. (13)and the spectrometer dimensions.
In addition to the broadening that results from thelateral source width w, there is a related geometricalaberration resulting from the cylindrical optical fig-ure of the crystal and from the assumption that thediffraction planes are perpendicular to the surface ofthe crystal and are, therefore, not perpendicular tothe focal circle except at the point p on the horizontalaxis. Hence, the aberration increases with the lengthof the crystal that is used for diffraction, as discussedby Cauchois [1], and is analogous to spherical aber-ration in geometrical optics.
The aberration can be derived by including thenext higher order terms in the small angle approxi-mations. Using Eq. (1) and retaining the terms in thesmall angle expansions up to cubic, and using Eq. (4),we find
β ¼ θ − ðθ2=2Þðθ − αÞ ¼ θ − ðθ3=2ÞDs=ðRþDsÞ; ð14Þwhich replaces Eq. (2). From Eq. (11), a small lateralsource width w is equivalent to a change in thesource distance Ds and, from Eq. (14), this resultsin a small change in the angle β and blurring onthe focal circle. From Eqs. (14) and (11), the extentof the blur on the focal circle is ðθ2=2ÞwR=ðRþDsÞ.
For an extended source of small projected lateralwidth w ≪ ðR;DsÞ, this aberration is typically negli-gible compared to other broadening mechanisms,
Fig. 5. Spectrometer geometry for an extended x-ray source.
such as detector resolution on the focal circle andsource broadening beyond the focal circle. This aber-ration could be eliminated in the same manner asthat for a reflecting crystal of the Johansson type,where the crystal is bent to radius R and the diffrac-tion planes when extended intersect at the point onthe focal circle that is opposite the center of the crys-tal (point q in Figs. 4 and 5) [14]. However, it is dif-ficult to fabricate such a transmission crystal, and fora small source size it is not necessary owing to thenegligible blurring on the focal circle.We now consider additional broadening mechan-
isms that produce small spreads in the Bragg angleθ, namely, the finite thickness of the crystal (δθT), thenatural width of the x-ray transition (δθN), andthe crystal rocking curve width (δθR). From Eq. (9),the blur can be written
δXD ¼ δθRð1þD=BÞ; ð15Þ
where
δθ ¼ ½ðδθTÞ2 þ ðδθNÞ2 þ ðδθRÞ2�1=2: ð16Þ
In writing Eq. (16), we assume that the various con-tributions to the broadening add in quadrature, as isthe case for Gaussian contributions.The contribution resulting from crystal thickness
T is δθT ¼ θT=R, where θ is the Bragg angle givenby sin θ ¼ nhc=2dE. The natural broadening is calcu-lated from the natural width of the transition,δθN ¼ θδEN=E, where δEN is tabulated for the char-acteristic x-ray transitions [15]. If the x-ray source isa hot or dense plasma, such as a laser-produced plas-ma, then additional broadening may result fromDoppler motions and Stark broadening, but theseare usually small in the hard x-ray region.The most difficult broadening to estimate is that
resulting from the rocking curve of a bent crystal,δθR. While the rocking curve of a flat crystal canbe accurately calculated andmeasured, it is more dif-ficult to calculate and measure the rocking curve of abent crystal. The bent crystal rocking curve dependson the exact experimental geometry and can vary sig-nificantly with bending radius, crystal thickness, andthe anisotropy of the elastic tensor of the crystal [16–18]. For the two types of bent crystals used in these ex-periments, quartz (10-11) andGe (220), the integrateddiffraction efficiencies were calculated using the com-puter programXOP [19]. The computational algorithmwas adapted from Takagi and Taupin [20,21].The calculated integrated efficiencies, the efficien-
cies integrated over the rocking curve of the crystals,as functions of energy are presented in Fig. 6(a), andthe ratios of the integrated efficiencies and the Bragganglesarepresented inFig. 6(b). Similar in formto thediffraction angle spreads resulting from the crystalthickness (δθT ¼ θR=T) and the natural width (δθ ¼θδEN=E), the rocking curve contribution is writtenδθR ¼ θF, where F is the ratio of the integrated effi-
ciency divided by the Bragg angle [16] presented inFig. 6(b).
As seen in Fig. 6, the Ge (220) crystal has lowerefficiency than the quartz (10-11) crystals for ener-gies <45keV owing primarily to absorption in theGe crystal. The Ge (220) crystal is more convenientto use at the higher energies owing to the larger dif-fraction angles resulting from smaller 2d lattice spa-cing, 2d ¼ 0:400nm compared to 2d ¼ 0:687nm forthe quartz (10-11) crystals. When the quartz (10-11) crystals are used to record the K spectral linesof the elements heavier than W with energies>70keV, the spectral lines can fall quite close tothe spectrometer axis where radiation scattered bythe slit can cause significant exposure [9].
It is shown in Sections 5–7 that the rocking curvecontribution to the observed spectral line widths issmaller than the contributions of detector resolutionon the focal circle and source size beyond the focalcircle. While the calculations of the integrated dif-fraction efficiencies shown in Fig. 6 have not beenverified by experimental measurements, they are be-lieved to be of sufficient accuracy for the purposes ofthe analysis of the spectral line broadening becausethis contribution is minor comparedtoothersourcesofline broadening. A preliminary experimental compari-son of the relative efficiencies of quartz (10-11) and ger-manium (220) crystals, with the same bending radius(254mm)and illuminatedwith identicalWx-ray sourceconditions, is in qualitative agreement with the calcu-lated efficiencies shown in Fig. 6; the germanium (220)efficiency is significantly smaller than the quartz (10-11) efficiency for energies <80keV and is larger for
Fig. 6. (a) Integrated efficiencies of the bent quartz (10-11) andGe (220) crystals calculated using the XOP computer program inunits of 106 radians and (b) the ratios of the integrated efficienciesand the Bragg angles multiplied by 10−6.
energies>110keV.Finally,wenote that theeffect of theanisotropy of the elastic tensor of the quartz crystal dis-cussedbySumbayevandSmirnov [22] isnot included inthe XOP efficiency calculations.
4. Comparisons with Experimental Spectra
Spectra were recorded using the HXS and DCS spec-trometers described in Section 1. A planar detector, aFuji type SR image plate, was placed on or near thefocal circle and at various distances beyond the focalcircle. After scanning the image plate with 42:3 μmsteps, the positions and widths of the spectral lines,both in units of mm, were accurately measured in thedigital image. The widths of the spectral lines weremeasured by fitting Gaussian profiles to the spectralfeatures, where the measured width is the full-widthat half-maximum (FWHM) of the Gaussian. The en-ergy scale was established using the tabulated ener-gies of the characteristic x-ray transitions and the Kattenuation edges of the filters positioned at thecrossover slit (see Fig. 1). The energies of the Moand W transitions from [23] are listed in Table 1.The spectral line positions, line widths, and resol-
ving power were calculated using the analytical ex-pressions presented in Sections 2 and 3. The spectralline positions were calculated using Eq. (9). The con-tributions to the line widths were calculated as fol-lows: detector effective spatial resolution, Eq. (8);lateral source size w, Eq. (13); optical aberration,Eq. (14); crystal thickness, natural line width, andcrystal rocking curve width, Eqs. (15) and (16).The various contributions to the line width are
added in quadrature, appropriate for Gaussian con-tributions, and the expression for the square of thetotal line width, W, is
The terms in Eq. (17) appear in their order of typicalimportance in these experiments; detector resolutiondominates the line width near the focal circle, source-size broadening is most important far from the focalcircle, crystal thickness and natural broadening con-tribute far from the focal circle, and rocking curvewidth and aberrations are typically negligible. Thecalculated resolving power is equal to the distancefrom the spectrometer axis divided by the line widthXD=W, where XD is from Eq. (9).
5. Molybdenum Spectra
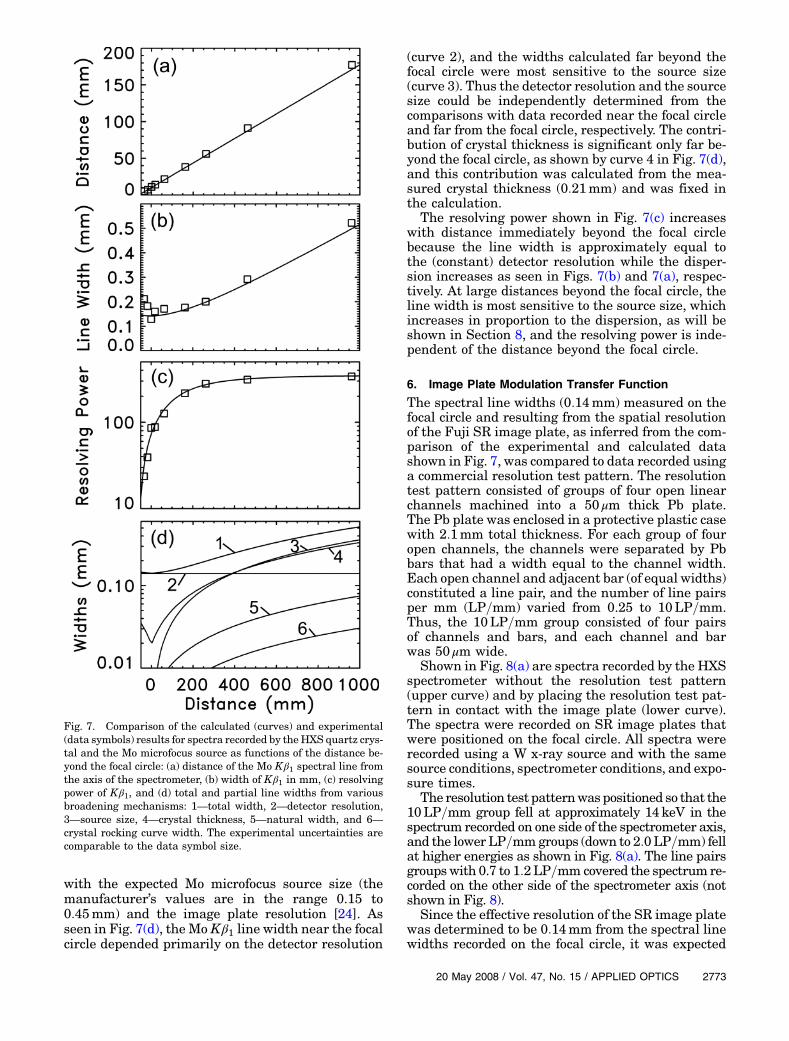
Shown in Fig. 7 are comparisons of the calculations(curves) and experimental measurements (data sym-bols) for the Mo spectra recorded using the HXSquartz (10-11) crystal spectrometer. The uncertain-ties in the measurements are comparable to the datasymbol size and were estimated from the fits of Gaus-sian line profiles to the experimental spectral linesusing the least squares technique. The HXS quartz(10-11) crystal has 2d ¼ 0:687nm lattice spacing, T ¼0:21mmthickness, andwasbent toR ¼ 112mmradiusof curvature. The source-to-crystal distancewas fixed atDs ¼ 500mm, and the image plate was placed on se-quential exposures at distancesDwith respect to the fo-cal circle ranging from −20mm (20mm inside the focalcircle) toþ960mm outside the focal circle. As shown inFig.2, thespectral linewidths increase (whenmeasuredinmm) with distance outside the focal circle, but the ef-fective spectral resolving power increaseswith distancebecause of the more rapid increase in dispersion.
The Mo Kβ1 line was selected for detailed analysisbecause it usually had good exposure levels in thespectra. Where the spectral resolution was insuffi-cient to resolve the Kβ1 and Kβ2 lines, the blendedKβ feature was fit with two overlapping Gaussiansto estimate the line widths. The Mo Kβ1 transitionhas 19:608keV energy and a 0:092 rad Bragg angle,and the small angle approximations are valid.
Shown in Fig. 7, as functions of the detector dis-tance with respect to the focal circle, are the follow-ing: (a) average of the distances from the longitudinalaxis of the spectrometer of the Mo Kβ1 spectral linesin the left and right spectra (see Figs. 1 and 3),(b) width of Kβ1 in mm, (c) instrumental resolvingpower atKβ1, and (d) the contributions to theKβ1 linewidth. The total line width calculated from Eq. (17) islabeled 1 in Fig. 7(d), and the contributions to the linewidth are labeled in the order of appearance inEq. (17): 2 for detector resolution, 3 for source size,4 for crystal thickness, 5 for natural width, and 6for crystal rocking curve. The aberration contributionwasmuchsmaller than the rocking curve contributionand does not appear in Fig. 7(d). Similar data from ex-periments using two other crystals and spectrometergeometries are presented in Figs. 11 and 12. Data arepresented with linear and logarithmic ordinates,whichever enhances the display of the data.
As shown in Fig. 7(a), the distances of the Mo Kβ1spectral lines from the spectrometer axis calculatedusing Eq. (9) are in good agreement with the mea-sured distances, where there are no free parametersin the calculation (all quantities in Eq. (9) are accu-rately known from the spectrometer dimensions andthe experimental setup). In Fig. 7(b), the line widthscalculated using Eq. (17) are compared to the mea-sured line widths where, in this case, there aretwo free parameters in Eq. (17), the source size wand the detector resolution δX . These two quantitieswere varied, and the best fit to the measured linewidths occurred for source size 0:22mm and detectorresolution 0:14mm. These values are in agreement
with the expected Mo microfocus source size (themanufacturer’s values are in the range 0.15 to0:45mm) and the image plate resolution [24]. Asseen in Fig. 7(d), the Mo Kβ1 line width near the focalcircle depended primarily on the detector resolution
(curve 2), and the widths calculated far beyond thefocal circle were most sensitive to the source size(curve 3). Thus the detector resolution and the sourcesize could be independently determined from thecomparisons with data recorded near the focal circleand far from the focal circle, respectively. The contri-bution of crystal thickness is significant only far be-yond the focal circle, as shown by curve 4 in Fig. 7(d),and this contribution was calculated from the mea-sured crystal thickness (0:21mm) and was fixed inthe calculation.
The resolving power shown in Fig. 7(c) increaseswith distance immediately beyond the focal circlebecause the line width is approximately equal tothe (constant) detector resolution while the disper-sion increases as seen in Figs. 7(b) and 7(a), respec-tively. At large distances beyond the focal circle, theline width is most sensitive to the source size, whichincreases in proportion to the dispersion, as will beshown in Section 8, and the resolving power is inde-pendent of the distance beyond the focal circle.
6. Image Plate Modulation Transfer Function
The spectral line widths (0:14mm) measured on thefocal circle and resulting from the spatial resolutionof the Fuji SR image plate, as inferred from the com-parison of the experimental and calculated datashown in Fig. 7, was compared to data recorded usinga commercial resolution test pattern. The resolutiontest pattern consisted of groups of four open linearchannels machined into a 50 μm thick Pb plate.The Pb plate was enclosed in a protective plastic casewith 2:1mm total thickness. For each group of fouropen channels, the channels were separated by Pbbars that had a width equal to the channel width.Each open channel and adjacent bar (of equal widths)constituted a line pair, and the number of line pairsper mm (LP=mm) varied from 0.25 to 10LP=mm.Thus, the 10LP=mm group consisted of four pairsof channels and bars, and each channel and barwas 50 μm wide.
Shown in Fig. 8(a) are spectra recorded by the HXSspectrometer without the resolution test pattern(upper curve) and by placing the resolution test pat-tern in contact with the image plate (lower curve).The spectra were recorded on SR image plates thatwere positioned on the focal circle. All spectra wererecorded using a W x-ray source and with the samesource conditions, spectrometer conditions, and expo-sure times.
The resolution test patternwas positioned so that the10LP=mm group fell at approximately 14keV in thespectrum recorded on one side of the spectrometer axis,and the lower LP=mmgroups (down to 2:0LP=mm) fellat higher energies as shown in Fig. 8(a). The line pairsgroupswith 0.7 to 1:2LP=mm covered the spectrum re-corded on the other side of the spectrometer axis (notshown in Fig. 8).
Since the effective resolution of the SR image platewas determined to be 0:14mm from the spectral linewidths recorded on the focal circle, it was expected
Fig. 7. Comparison of the calculated (curves) and experimental(data symbols) results for spectra recorded by theHXS quartz crys-tal and the Mo microfocus source as functions of the distance be-yond the focal circle: (a) distance of the Mo Kβ1 spectral line fromthe axis of the spectrometer, (b) width of Kβ1 in mm, (c) resolvingpower of Kβ1, and (d) total and partial line widths from variousbroadening mechanisms: 1—total width, 2—detector resolution,3—source size, 4—crystal thickness, 5—natural width, and 6—crystal rocking curve width. The experimental uncertainties arecomparable to the data symbol size.
that the spectrum intensity levels recorded throughthe open channels with widths much greater than0:14mm (much less than 7LP=mm) would be equalto the intensity levels recorded without the resolu-tion test pattern. As seen in Fig. 8(a), the intensitiesrecorded through the open channels of the 2:0LP=mmgroup are significantly lower than the spectrumwith-out the test pattern, and in addition, the inten-sities through the open channels of the 0.7 through1:2LP=mm groups recorded on the other side of thespectrometer axis were also low.The lower than expected intensities recorded
through the open channels with widths much greaterthan 0:14mm resulted from attenuation in the2:1mm thick plastic case. Similarly, the intensitiesrecorded through the Pb bars with widths muchgreater than 0:14mm, compared to the intensity
recorded without the test pattern, increased with en-ergy, and this resulted from the increasing transmit-tance through the 50 μm thick Pb bars with energy.Thus, the intensity levels shown in Fig. 8(a) recordedusing the test pattern must be corrected at all ener-gies by the transmittances through the plastic caseand the Pb bars.
Shown in Fig. 8(b) are the calculated transmittancesof the 2:1mm thick plastic (CH) case and of the 50 μmthickPbbars.The intensities recordedthroughtheopenchannels of the test pattern were divided by the trans-mittanceof theplastic case, and the intensities recordedthrough the Pb bars were divided by the product of theplastic transmittance and the Pb bar transmittance.This corrected spectrum recorded by the test patternwas then divided by the spectrum recorded withoutthe test pattern. The result is the contrast curve shownin Fig. 8(b).
After correcting for the transmittance of the plasticcase, the intensities through the open channels of theline groups with ≤2:0LP=mm, relative to the corre-sponding intensities in the spectrum recorded with-out the test pattern, are essentially 100%. Aftercorrecting for the transmittances of the plastic caseand the Pb bars, the relative intensities through thePb bars of the line groups with ≤2:0LP=mm are ap-proximately 5%, which represents the background le-vel. For >2:0LP=mm, the open channel and Pb barslevels converge with increasing LP=mm values be-cause of the limited spatial resolution of the imageplate, and this represents decreasing contrast withincreasing LP=mm values.
The difference in the contrast levels recordedthrough adjacent open channels and bars with equalwidths is the modulation transfer function (MTF)which is presented in Fig. 9, where each data pointrepresents the MTF of a particular LP=mm group.TheMTF values for the 2.0 through 1:0LP=mmgroupswere derived from the contrast shown in Fig. 8(b). TheMTFisconsistentwiththe0:14mmFWHMvaluedeter-mined from the Gaussian fits to the spectral lines re-corded on the spectrometer focal circle.
7. Tungsten Spectra
Spectra fromaWanode sourcewere recorded onSR im-age plates using aGe (220) crystal with 2d ¼ 0:400nm,0:16mm thickness, andbent to 254mmradius. SpectrawererecordedusingtwonominalWsourcesizes,1:8mmand 3:5mm determined by two focus settings of the Wx-raytube.Thesource-to-crystaldistancewas1200mm,andspectrawere recordedbyplacingan imageplate be-hindthefocalcircleatdistancesof60,480,and1280mm.At the 60mm distance, both the first and second orderlines fell on the image plate, and detailed spectra areshown in Fig. 10 indicating the resolved W Kβ1 andKβ3 lines in the second order spectrum. For the 480and 1280mmdetector distances, the second order lineswere diffracted beyond the ends of the image plate andwere, therefore, not recorded.
Figure 11 shows the comparison of the measured(data symbols) and calculated (curves) results for
Fig. 8. (a) W spectra recorded without (upper curve) and with(lower curve) the resolution test pattern. The line pairs per mm(LP=mm) are indicated, and the W Lγ and W Kα spectral featuresand the Ba K absorption edge are identified. (b) Contrast after cor-recting for the transmittances of the resolution test pattern’s plas-tic case and the Pb bars. The transmittances of the 2:1mm thickplastic (CH) case and the 50 μm Pb bars are also shown.
the W Kβ1 transition with energy of 67:245keV andBragg angle of 0:046 rad. Square and triangular datasymbols indicate the first and second order data, re-spectively. The line widths were calculated by settingthe detector resolution to 0:14mm and the sourcesizes to 1.8 and 3:4mm. Thus, there are no free para-meters in the calculation, and there is good agree-ment between the experimental and calculated data.The resolving power inFig. 11(c) increaseswith dis-
tance immediately beyond the focal circle and ratherquickly decreases because of large source broadeningas indicated by curve 3 in Fig. 11(d). Thus, there is anoptimal distance beyond the focal circle where the re-solvingpower ismaximized, and this optimaldistancedepends primarily on the detector resolution and thesource size. For a given detector resolution and sourcesize, the line widths are the same in the first and sec-ond orders as shown by the curves in Fig. 11(b) calcu-lated usingEq. (13), which is independent of the ordern, and the second order dispersion and resolvingpower are twice the first order values as shown inFigs. 11(a) and 11(c), respectively.Figure 12 is a comparison of the calculated and
measured W Kβ1 results derived from spectra re-corded by a 0:29mm thick quartz (10-11) crystal bentto 254mm radius and positioned 1200mm from theW anode with 1:8mm source size. The W Kβ1 Braggangle is 0:027 rad. In this case, three image plateswere positioned at distances of 140, 700, and1260mm behind the focal circle, and the imageplates were exposed simultaneously. Thus the dis-persed W x-ray intensity propagated through thethree images plates, and portions of the x-ray fluencewere deposited in each image plate and resulted inspectra recorded simultaneously at three distancesbehind the focal circle. The second orderK shell spec-tra were observed at distances of 140 and 700mm,while at 1260mm the second order spectra fell be-
yond the ends of the image plate and were not re-corded. In the calculation of the line widths, thedetector resolution was set to 0:14mmand the sourcesize to 1:8mm. The agreement between the calcu-lated and experimental data is good with the excep-tion that the second order line width measured at140mm is smaller than calculated.
8. Discussion
A geometrical model for the dispersion, spectral linewidths, and resolving power achieved by placing thedetector on or behind the focal circle of a Cauchoisspectrometerwasdeveloped.Using small angle approx-imations, expressions were derived for line broadeningcaused by the effective detector spatial resolution, lat-eral source size, crystal thickness, crystal rocking curve
Fig. 10. Spectra recorded by the Ge crystal and theW source, andby placing the image plate 60mm behind the focal circle, indicat-ing the resolution of the W Kβ1 and Kβ3 lines in the second orderspectrum. The spectrum is relative intensity as derived from a col-umn average in the vertical direction, perpendicular to the disper-sion direction, over a number of rows in the spectral image.
Fig. 9. Themodulation transfer function of the SR image plate de-rived from the spectra recorded using the resolution test pattern.
width, natural line width, and optical aberration. Be-cause of the small Bragg angles considered here(≤92mrad),thesmallangleapproximationsarequiteac-
curate. For example, computer ray tracing indicates theerror in the distance from the crystal to the slit,A givenby Eq. (5), is typically less than 1%.
Fig. 11. Comparison of the calculated (curves) and experimental(data symbols) results for spectra recorded by the Ge crystal andthe W source as functions of the distance beyond the focal circle:(a) distance of the W Kβ1 spectral line from the axis of the spectro-meter, (b)widthofKβ1 inmm,(c) resolvingpowerofKβ1, and(d) totaland partial line widths from various broadening mechanisms: 1—totalwidth,2—detectorresolution,3—source-size,4—crystal thick-ness, 5—natural width, and 6—crystal rocking curve width. Thesquare and triangular data symbols indicate the first and secondorder data, respectively. Additional curve labels are the diffractionorder (n ¼ 1 and n ¼ 2) and the source size (1.8 and 3:4mm).
Fig. 12. Comparisonof thecalculatedandmeasuredWKβ1 resultsderived from spectra recorded by a quartz (10-11) crystal bent to254mm radius as functions of the distance beyond the focal circle.Three image plates were positioned at distances of 140, 700, and1260mmbehind the focal circle, and the image plateswere exposedsimultaneously. (a)Distanceof theWKβ1 spectral line fromtheaxisof the spectrometer, (b) width of Kβ1 in mm, (c) resolving power ofKβ1, and (d) total and partial line widths from various broadeningmechanisms: 1—total width, 2—detector resolution, 3—source-size,4—crystal thickness, and 5—natural width.
The calculations were compared to spectra re-corded using a variety of spectrometer and x-raysource conditions. Excitation spectra were recordedfrom an Mo microfocus source and from a W anodesource with two source sizes. The crystals employedwere quartz (10-11) and Ge (220) with bending radiiof 112 or 254mm, and the source-to-crystal distancewas 500 or 1200mm. The spectra were recorded onFuji SR image plates positioned on or near the focalcircle and at distances up to 1280mm behind the fo-cal circle.By setting the effective detector resolution of the
SR image plate to the value 0:14mm, consistent withthe image plate MTF determined from spectra re-corded on the focal circle using a resolution test pat-tern, it was possible to use the geometrical model toaccurately calculate (with no free parameters) thespectral line broadening and the resolving powerfor detector positions on and beyond the focal circle.The geometrical model enabled the identification ofthe dominant spectral line broadening mechanismsfor a variety of x-ray source and spectrometer experi-mental conditions. In general, when the detector wasplaced on or near the focal circle, the detector resolutiondominated the line widths, and other broadening me-chanismswere smaller because of the focusing propertyof the Cauchois spectrometer. For spectra recorded farbehind the focal circle, source broadening wasmost im-portant evenwhen using a smallMomicrofocus source.Althoughthelinewidthsincreasedwithdistancebehindthe focal circle, themore rapid increase in dispersion re-sulted in increased instrumental resolving power be-hind the focal circle.In the case of the spectra recorded using the Mo
microfocus source, with relatively small source size(inferredtobe0:22mm)andlargeBraggangle,theresol-ving power increases monotonically with distance be-hind the focal circle, as illustrated in Fig. 7(c). In thecase of theWanode source, with relatively large sourcesize (1.8or3:4mm)andsmallBraggangle, theresolvingpowerincreasestoamaximumvalueandthendecreaseswith additional distance behind the focal circle, as illu-strated inFigs. 11(c)and12(c).Thebehaviorof theresol-ving power with distance behind the focal circle can beunderstood from the analytical model, and this modelcanbeusedtooptimize instrumentdesignforhighresol-ving power.For detector distances behind the focal circle where
source broadening dominates over other broadeningmechanisms, the resolving power derived fromEqs. (9) and (13) is
E=δE ¼ ðθR=wDÞð1þD=BÞðRþDsÞ; ð18Þ
and for large distances (D ≫ B) the limiting value is
E=δE ¼ ðθ=wÞðRþ 2DsÞ; ð19Þ
where we used Eq. (6). Equations (18) and (19) repre-sent upper bounds on the resolving power since inpractice other mechanisms can contribute smaller
but significant broadenings that reduce the resolvingpower. However, Eqs. (18) and (19) indicate thetrends in resolving power far beyond the focal circlewhere source broadening is dominant. When θ=w isrelatively large, such as for spectra recorded usingthe Mo microfocus source and the HXS quartz crys-tal, E=δE is large beyond the focal circle, as seen inFig. 7(c). When θ=w is smaller, such as for the spectrarecorded using the W anode source and the quartzand Ge crystal, E=δE is smaller far beyond the focalcircle as seen in Figs. 11(c) and 12(c), although E=δEis twice as large in the second diffraction order com-pared to the first order.
Another insight from Eqs. (18) and (19) is that theresolving power decreases with energy E since θ isproportional to E−1. However, it is still possible to re-solve the Kα and Kβ transitions in the heavier ele-ments such as W, even as the resolving powerdecreases with E, because the energy splittings ofthese transitions increase with atomic number.
By recording spectra on or near the focal circle andat varying distances behind the focal circle, in somecases simultaneously on the same exposure by usingmultiple image plates, it was possible to infer thesource size from the variation in line width as a func-tion of distance behind the focal circle. In the casethat the detector is far beyond the focal circle andsource broadening is dominant, the source size canbe derived directly from Eq. (19). This is a powerfulnew technique for the in situ measurement of thesource size directly from the x-ray spectra and thespectrometer geometry. Knowledge of the source sizeis important for many x-ray applications, such asradiography, where source size affects the spatial re-solution achieved in the radiogram, and for high en-ergy density physics, where small source size istypically necessary for achieving the desired highdensity and temperature levels.
The work at the Naval Research Laboratory wassupported by the Office of Naval Research. Certaincommercial equipment, instruments, or materialsare identified in this paper inorder to specify the experi-mental procedure adequately. Such identification is notintended to imply recommendation or endorsement bythe U.S. government, nor is it intended to imply thatthe materials or equipment identified are necessarilythe best available for the purpose.
References1. Y. Cauchois, “Spectrographie des rayons x par transmission
d’un faisceau non canalise a travers un cristal courbe,” J.de Physique. 3 320 (1932). English translation is availableat http://spectroscopy.nrl.navy.mil/.
2. A. Compton and S. Allison, X-Rays in Theory and Experiments(van Nostrand, 1935), p. 750.
3. L. T. Hudson, A. Henins, J. F. Seely, and G. E. Holland, “Diag-nostic spectrometers for high energy density x-ray sources,” in15th International Conference on Atomic Processes in Plasmas,J. D. Gillaspy, J. J. Curry, and W. Wiese, eds. (American Insti-tute of Physics, 2007, pp. 34–41.
4. L. T.Hudson, A.Henins, R.D.Deslattes, J. F. Seely, G. E.Holland,R. Atkin, L. Martin, D. D. Meyerhofer, and C. Stoeckl, “A
5. J. F. Seely, R. Doron, A. Bar-Shalom, L. T. Hudson, andC. Stoeckl, “Hard x-ray emission from laser-produced plasmasof U and Pb recorded by a transmission crystal spectrometer,”J. Quant. Spectrosc. Radiat. Transfer 81, 421 (2003).
6. J. F. Seely, C. A. Back, C. Constantin, R. W. Lee, H.-K. Chung,L. T. Hudson, C. I. Szabo, A. Henins, G. E. Holland, R. Atkin,and L. Martin, “Krypton K-shell x-ray spectra recorded by theHENEX spectrometer,” J. Quant. Spectrosc. Radiat. Transfer99, 572 (2006).
7. L. T. Hudson, R. Atkin, C. A. Back, A. Henins, G. E. Holland,J. F. Seely, and C. Szabo, “X-ray spectroscopy at next-genera-tion inertial confinement fusion sources: anticipating needsand challenges,” Radiat. Phys. Chem. 75, 1784 (2006).
8. C. I. Szabo, L. T. Hudson, A. Henins, G. E. Holland, R. Atkin,and J. F. Seely, “Mitigation of fluorescence and scattering inreflection convex-crystal x-ray spectrometers,” Radiat. Phys.Chem. 75, 1824 (2006).
9. J. F. Seely, G. Holland, L. Hudson, C. Szabo, A. Henins,H.-S.Park,P.Patel,R.Tommasini,andJ.Laming, “K-shellspec-tra from Ag, Sn, Sm, Ta, and Au generated by intense fetmose-cond laser pulses,” High Energy Density Phys. 3, 263 (2007).
10. R. D. Deslattes, J. C. Levin, M. D. Walker, and A. Henins,“Noninvasive high-voltage measurement in mammographyby crystal diffraction spectroscopy,”Med. Phys. 21, 123 (1994).
11. C. T. Chantler, R. D. Deslattes, A. Henins, and L. T. Hudson,“Flat and curved crystal spectroscopy for mammographicx-ray sources,” Br. J. Radiol. 69, 636 (1996).
12. L. T. Hudson, R. D. Deslattes, A. Henins, C. T. Chantler,E. G. Kessler, and J. E. Schweppe, “A curved crystal spectro-meter for energy calibration and spectral characterization ofmammographic x-ray sources,” Med. Phys. 23, 1659 (1996).
13. J. A. R. Samson, Techniques of Vacuum Ultraviolet Spectro-scopy (Wiley, 1967), p. 8.
14. E. O. Baronova, M. M. Stepanenko, and N. R. Pereira, “Cau-chois-Johansson x-ray spectrograph for 1:5–400keV energyrange,” Rev. Sci. Instrum. 72, 1416 (2001).
15. S. I. Salem and P. L. Lee, “Experimental widths of K and Lx-ray lines,” At. Data Nucl. Data Tables 18, 233 (1976).
16. D. A. Lind, W. J. West, and J. W. M. DuMond, “X-ray and gam-ma-ray reflection properties from 500 x units to nine x units ofunstressed and of bent quartz plates for use in the two-metercurved-crystal focusing gamma-ray spectrometer,” Phys. Rev.77, 475 (1950).
17. P. Suortti, “Focusing monochromators for high energy syn-chrotron radiation,” Rev. Sci. Instrum. 63, 942 (1992).
18. E. Andersson, G. Hölzer, E. Förster, M. Grätz, L. Kiernan,A. Sjögren, and S. Svanberg, “Coronary angiography usinglaser plasma sources: x-ray source efficiency and optimizationof a bent crystal monochromator,” J. Appl. Phys. 90, 3048(2001).
19. M. Sanchez del Rio and R. J. Dejus, “Computer simulation ofbent perfect crystal diffraction profiles,” Proc. SPIE 3151, 312(1997).
20. S. Takagi, “A dynamical theory of diffraction for a distortedcrystal,” J. Phys. Soc. Jpn. 29, 1239 (1969).
21. D. Taupin, “Theorie dynamique de la diffraction des rayons xpar les crustaux deformes,” Bull. Soc. Fr. Mineral. Crystallogr.87, 469 (1964).
22. O. I. Sumbayev and A. I. Smirnov, “4-meter Cauchois spectro-meter for neutron-capture gamma-radiation research,” Nucl.Instrum. Methods 22, 125 (1963).
23. R. D. Deslattes, E. G. Kessler, P. Indelicato, L. de Billy,E. Lindroth, and J. Anton, “X-ray transition energies: new ap-proach to a comprehensive evaluation,” Rev. Mod. Phys. 75,35 (2003).
24. H. H. Li, A. L. Gonzalez, H. Ji, and D. M. Duggan, “Dose re-sponse of BaFBrI:Eu storage phosphor plates exposed tomegavoltage photon beams,” Med. Phys. 34, 103 (2007).