Page 1
1
Enhancement of JMeter
Summer Internship 2013
Submitted in fulfilment of internship project
By
JMeter Team
Under the Guidance of
Prof. D. B. Phatak
Department of Computer Science and Engineering
Indian Institute of Technology, Bombay
Mumbai
Page 2
2
Acknowledgment
We, the summer interns of the team Enhancement of Jmeter, are overwhelmed in all humbleness
and gratefulness to acknowledge our deep gratitude to all those who have helped us put our ideas
to perfection and have assigned tasks, well above the level of simplicity and into something
concrete and unique
We, whole heartedly thank Prof. D.B. Phatak for having faith in us, selecting us to be a part of
his valuable project and for constantly motivating us to do better.
We are very thankful to our project incharge Mr.Nagesh Karmali and our mentors Ms. Silpa T.
and Mr. Sukhdeo Gupta for their valuable suggestions. They were and are always there to show
us the right track when needed help. With help of their brilliant guidance and encouragement, we
all were able to complete our tasks properly and were up to the mark in all the tasks assigned.
During the process, we got a chance to see the stronger side of our technical and non-technical
aspects and also strengthen our concepts. Here by, we gladly consider ourselves to be the most
fortunate batch of interns.
Last but not the least, we whole heartedly thank all our other colleagues working in different
projects under Prof. D.B Phatak for helping us evolve better with their critical advice.
Page 3
3
Team Members
Buddha Sushmitha (KAKINDA INISTITUTE OF ENGINEERING AND
TECHNOLOGY): Worked on Jmeter plugins and Jmeter graphs.
Dhruv Joshi (NIT, Rourkela): Worked on Listeners and Long Polling.
Manisha Choudhury(NIT, Rourkela): Worked on Samplers and auto csv creation.
Naman Choudhary(NIT, Jamshedpur): Worked on Controllers, Preprocessors, Object
Diagrams and Automating TPC-C.
Shekhar Saurav (NIT, Jamshedpur): Worked on Config elements and Dyanmic Bandwidth
Throttling.
Surabhi Mour (NIT, Surat): Worked on Assertions, Post-processors and Automating TPC-C.
Page 4
4
Abstract
JMeter is a desktop application, designed to test and measure the performance and functional
behavior of client/server applications, such as web applications or FTP applications. It is by far,
one of the most widely used open-source, freely distributed testing application that the Net can
offer. It is purely Java-based and is highly extensible through a provided API (Application
Programming Interface). JMeter works by acting as the "client side" of a "client/server"
application. It measures response time and all other server resources such as CPU loads, memory
usage, and resource usage. In this respect, JMeter can be used effectively for functional test
automation. In addition, it has tools that support regression testing of similar types of
applications. Although it was originally designed for testing web applications, it has been
extended to support other test functions. It was first and still is being developed as one of the
Apache Jakarta Projects (http://jakarta.apache.org), as this project offer a diverse set of open-source
Java solutions.
Page 5
5
Contents
1. Introduction 8
1.1 Purpose 9
1.2 Scope 9
1.3 Definitions, Abbreviations 10
1.4 Motivation 11
2. Objective 12
3. Design Considerations 13
3.1 Assumptions and Dependencies 13
3.2 GENERAL CONSTRAINTS 14
3.3 Goals and Guidelines 14
3.4 Technology Used 14
4. Architecture 16
5. Design And Implementation 17
5.1 Class Diagram 17
5.1.1 Assertions 17
5.1.2 Configuration Elements 19
5.1.3 Logic Controllers 21
5.1.4 Post-Propcessors 23
5.1.5 Preprocessors 25
6. Detailed Description 26
6.1 Assertions 26
Page 6
6
6.2 Configuration Element 29
6.3 Logic Controllers 30
6.4 Post-Processors 30
6.5 Pre-Processors 34
6.6 Timers 37
6.7 Visualizers/Listeners 38
6.8 Smaplers 40
6.9 Auto CSV Generation 45
6.10 Filtered Results Listener Plugin 45
6.11 SMTP Defaults 46
6.12 Automating TPC-C tests in JMeter 46
6.13 Bandwidth Throttling 52
6.14 Dynamic Bandwidth Throttling 53
7. Graphical User Interface 54
7.1 Auto CSV Generation 54
7.2 Filtered Results Listener Plugin 55
7.3 SMTP Defaults GUI 57
7.4 GUI for TPC-C Sampler 58
7.5 Bandwidth Throttling GUI 59
7.6 Dynamic Bandwidth Throttling GUI 60
8. Test Plans 61
8.1 Demonstration of Auto CSV Generation config element 61
8.2 Demonstration of SMTP Defaults config element 66
8.3 Demonstration of TPC-C Testing by JMeter 70
8.4 Demonstration of Bandwidth Throttling using JMeter 83
8.5 Demonstration of Dynamic Bandwidth Throttling using JMeter 84
9. Technical Details 94
9.1 Auto CSV Generation 94
9.2 Filtered Results Listener Plugin 94
9.3 SMTP Defaults 95
Page 7
7
9.4 Automating TPC-C Tests in JMeter 95
9.5 Bandwidth Throttling 100
9.6 Dynamic Bandwidth Throttling 101
10. Challenges 102
11. Future Work and Conclusion 102
12. Frequently asked Questions 103
13. References 104
Page 8
8
Chapter 1
Introduction
The Apache JMeter™ desktop application is open source software, a 100% pure Java
application designed to load test functional behavior and measure performance.
Apache JMeter may be used to test performance both on static and dynamic resources (files,
Servlets, Perl scripts, Java Objects, Data Bases and Queries, FTP Servers and more). It can be
used to simulate a heavy load on a server, network or object to test its strength or to analyze
overall performance under different load types. We can use it to make a graphical analysis of
performance or to test our server/script/object behavior under heavy concurrent load.
Apache JMeter features include:
Can load and performance test many different server types:
o Web - HTTP, HTTPS
o SOAP
o Database via JDBC
o LDAP
o JMS
o Mail - SMTP(S), POP3(S) and IMAP(S)
o Native commands or shell scripts
100% Java-based, hence has features that any Java application has:
o Portability: can run on any JVMs
o Concurrency: by many threads and of different functions by separate thread
groups
o Extensible:
– Unlimited testing capabilities—various samplers can be used
– Pluggable timers allow simulation of various types of loads
– API and/or plug-ins allow great extendibility as well as customization
– Built-in functions can be used to provide dynamic input to a test
– Scriptable Samplers
Efficient GUI (Java Swing) design and lightweight component support allows faster execution
and more accurate timings
Page 9
9
Caching of test results and data providing offline analysis/replaying of test results
We have introduced some new features into the existing Jmeter Application to further extend its
functionality.
1.1 Purpose
The present Jmeter application has some features that are missing as compared to other available
load testing tools. The main purpose of this application development is to provide the users of
this tool with other enhanced features. We study the current drawbacks in Jmeter and try to
overcome those drawbacks by providing some efficient solutions in addition to introducing new
features in Jmeter.
The main purpose in making this document is to describe the newly introduced features in
Jmeter. The present Jmeter features and working are also highlighted to better understand this
tool. The working and tests performed with the added new features have been described to make
any further enhancements in future.
1.2 Scope
Current Jmeter application has the robustness of testing various types of servers and also perform
various types of testing, such as Load testing, Regression Testing, Functional Testing, Stress
Testing,etc.
The new features introduced in Jmeter will make the tool efficient for many other types of test
scenerios which can introduce more practicality into the test scripts and user friendliness. We
have introduced preliminary TPC-C benchmarking support in JMeter to extend the scope of
Jmeter from a load testing tool to a preliminary benchmarking tool. A tester can test his server
with Jmeter now in a TPC-C testing like environment with the saved test script and have a good
idea of the performance shown by the server, hence paving the way for further improvements.
Bandwidth throttling has been introduced to simulate a more practical testing scenario. Dynamic
bandwidth throttling is in use in many situations, and environment. In the real world scenario, the
web services are used by a vast variety of users using different categories of network
connections. Some people use extremely high broadband connection while some use low
bandwidth mobile connections to use various web services. Thus a more practical testing has
been made possible.
Page 10
10
A number of elements like Auto csv generation have been enabled for user friendliness in
creating the scripts, whereby the users can now create a csv file for data input in the test plan,
directly taking data from a database instead of manual creation of the file.
Similarly, other small components have been added to Jmeter.
1.3 Definitions, Abbreviations
1. XML : eXtensible Markup Langu
2. JSP : Java Server Pages.
3. J2EE : Java 2 Enterprise Edition.
4. SQL : Structured Query Language.
5. XLS : Excel File.
6. GUI : Graphical User Interface.
7. ID : Identification number
8. HTTP : Hypertext Transfer Protocol.
9. JRE : Java run time environment
10. HTML : Hyper Text Markup Language
11. CSS : Cascading Style Sheet
12. Ajax : Asynchronous JavaScript and XML.
14. FTP : File Transfer Protocol
13. SMTP : Simple Mail Transfer Protocol
14. SUT : System Under Test
15. AUT : Application Under Test.
16. TPC : Transaction Processing Performance Council
Page 11
11
1.4 Motivation
There are a number of reasons that motivated us to enhance Jmeter.
Firstly, Jmeter is an open source tool with zero acquisition cost. We can simply download the
binaries from the URL. (http://jakarta.apache.org/site/downloads/downloads_jmeter.cgi).
JMeter being a highly robust, scalable, and portable application makes it a suitable testing tool
for today's non-proprietary, fast-changing, and market-driven application development process.
Anyone with software testing experience or knowledge at any level will find JMeter easy to learn
and use. One doesn't need programming expertise to realize the potential use of JMeter, but
having it surely helps.
JMeter has abundant resources on the Web and newsgroups that can become a guiding light
towards using JMeter most effectively and enhancing it.
Jmeter is highly scalable. Its modular design allows components to be merged to support large-scale
testing. Testing may also be run by more than one machine.
Jmeter lacks some features as compared to other available commercial testing tools. Hence,
Enhancement of Jmeter would benefit a large class of users of Jmeter who use it for testing
purposes. Also the enhanced features would increase the class of Jmeter users.
Page 12
12
Chapter 2
Objective
Jmeter is an Open Source Performance Measurement tool. The objective is to extend the tool
with benchmark set up for simulating large concurrent users, and to produce performance report.
The project includes extensively studying JMeter and performing various types of testing, thus
discovering limitations. In enhancing Jmeter, we try to overcome these limitations by providing
some rectifying solution to it and introduce new features into Jmeter to extend its present
functionality and scope. We also try to make the interaction between tester and Jmeter
application more user friendly and the generated test scripts to be more closer to a practical
scenario of the emulated environment.
Page 13
13
Chapter 3
Design Considerations
3.1 Assumptions and Dependencies
We have used the following software in the project to develop, modify and test Apache Jmeter:
Apache JMeter 2.9 (Binary and source versions)
• Eclipse-Juno (Version 4.2)
• MySQL Administrator
• PHP MyAdmin
• Mozilla Firefox
• Oracle Weblogic Server 12c
• Mybatis Jpetstore 6.0.1
• Postfix/Dovecot SMTP mail server
• HammerDB
All these software are Open Source software and are freely available.
The Operating System used by us is Ubuntu 12.04, The dependencies for the building and
execution of the source code are as follows
• Apache JMeter 2.9 requires JDK5 or above
• Ant version 1.8 or above is required to build the project from the provided
build.xml file.
Page 14
14
• Before building the project some libraries need to be added and updated using the
command: ant download_jars.
3.2 GENERAL CONSTRAINTS
The Apache JMeter has some General Constraints or limitations, which include the following and
they are necessary for successful processing of the software:
Dynamic changes in the jmeter.properties file is not conceivable as JMeter need to be
restarted for the properties to be applicable.
3.3 Goals and Guidelines
The main goal behind this project is to overcome the limitations of Apache Jmeter by
providing some rectifying solution to them and introduce new features into Jmeter to
extend its present functionality.
To provide a new scope to the present technology.
To present the user/tester with major testing requirements and functionalities in one
place and to improve user experience.
3.4 Technology Used
Java: It is a platform independent and object oriented language. Java is used in a wide
variety of computing platforms from embedded devices and mobile phones on the low
end, to enterprise servers and supercomputers on the high end. Apache Jmeter uses Java
platform for the development process.
o JDBC – Jmeter uses Java Database Connection for interacting with databases at
the backend.
o JMS – Java Message Service is used by Jmeter to exchange messages between
clients
o Java Mail Api – Apache Jmeter uses Java mail api to use mail services through
jmeter.
Page 15
15
o AWT/Swings – Java AWT and Swings has been used in Jmeter to generate the
user interface
o Socket Connection – Jmeter uses socket connection packages to implement
different protocols.
Protocols: Apache Jmeter uses large number of protocols for the virtual users using
different web services.
o HTTP : Hypertext Transfer Protocol (HTTP) is used by the http samplers and
http config element in the test plan.
o HTTPS : Hypertext Transfer Protocol Secure (HTTPS) is used by Jmeter for
secured HTTP requests.
o SMTP : SMTP samplers in Apache Jmeter uses (Simple Mail Transfer Protocol)
SMTP protocols for mail services.
o FTP : FTP (File Transfer Protocol) is used by jmeter for the ftp requests
(samplers and config element)
o TCP : Jmeter uses TCP (Transmission Control Protocol) for TCP Samplers
which used to send tcp packets from client to server.
o LDAP : Jmeter uses to LDAP samplers to send requests to LDAP servers
MySQL: It is the world's most used open source relational database management that
runs as a server providing multi-user access to a number of databases.
Page 16
16
Chapter4
Architecture
At the heart of a load generation tool is the core engine that works at the protocol level to
generate
the traffic/requests which would normally be generated by ―real‖ users driving the user interface
of the application under test.
Here is how the load generation tool fires a set of requests for a single virtual user: It is important
to note that the protocol engine fires requests synchronously
Protocol engine fires Request A to application under test
Protocol engine waits for Response A before it proceeds with execution of Request B
Once Response A is received by the protocol engine, it is stored in memory for analysis
and
processing. This response is discarded from memory only after Request B is sent
Every simulated virtual user has a ―cost‖ associated with it in terms of CPU and Memory
―footprint‖.
Hence the maximum number of virtual user that can be simulated on a given hardware is dictated
by the average memory/CPU footprint for each virtual user. The memory/CPU footprint is in
turn affected by application response and the complexity of the script to be simulated.
Page 17
17
Chapter 5
Design And Implementation
5.1 Class Diagrams
5.1.1 Assertions
Class Diagram for XPath Assertion
Page 18
18
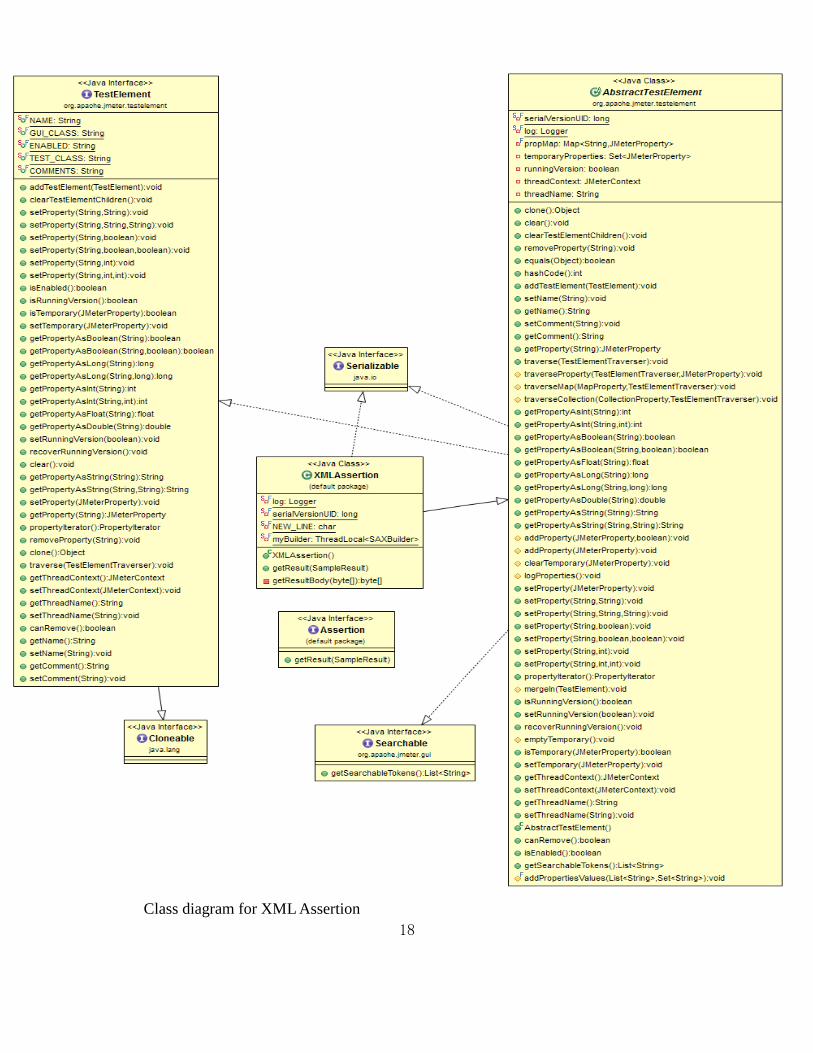
Class diagram for XML Assertion
Page 19
19
5.2 Configuration Elements
Class Diagram for Login Config element
Page 20
20
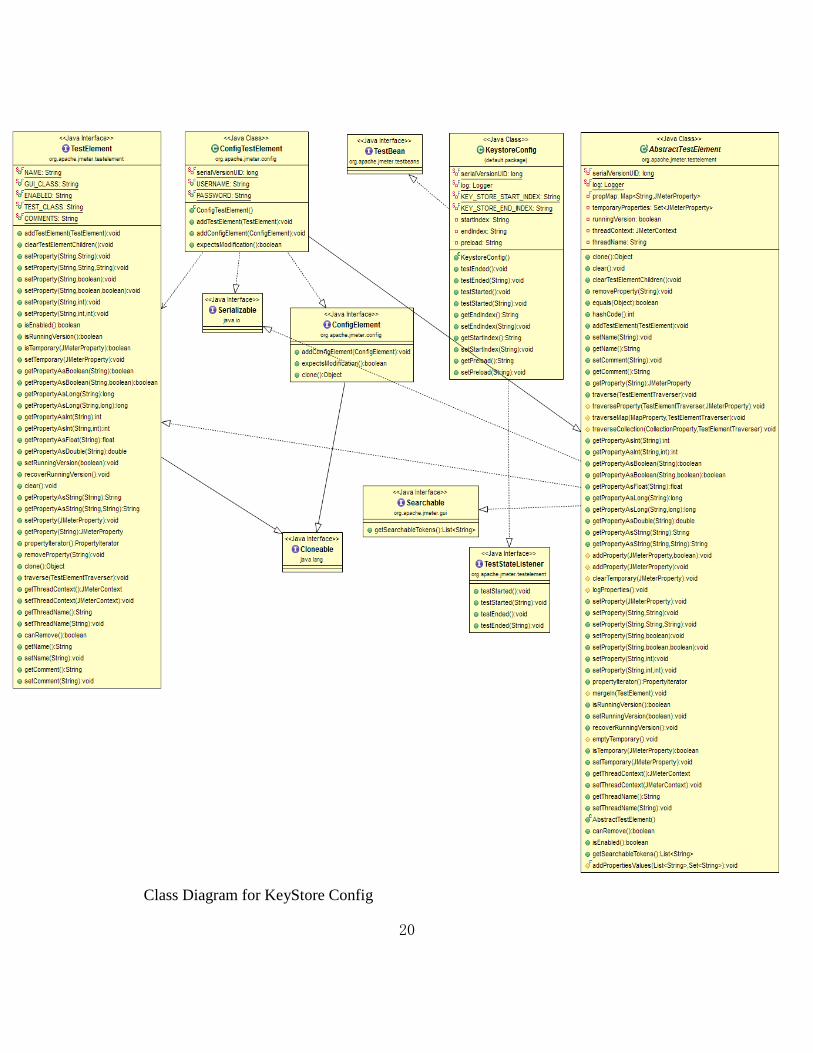
Class Diagram for KeyStore Config
Page 21
21
5.3 Logic Controllers
Class Diagram for Loop Controller
Page 22
22
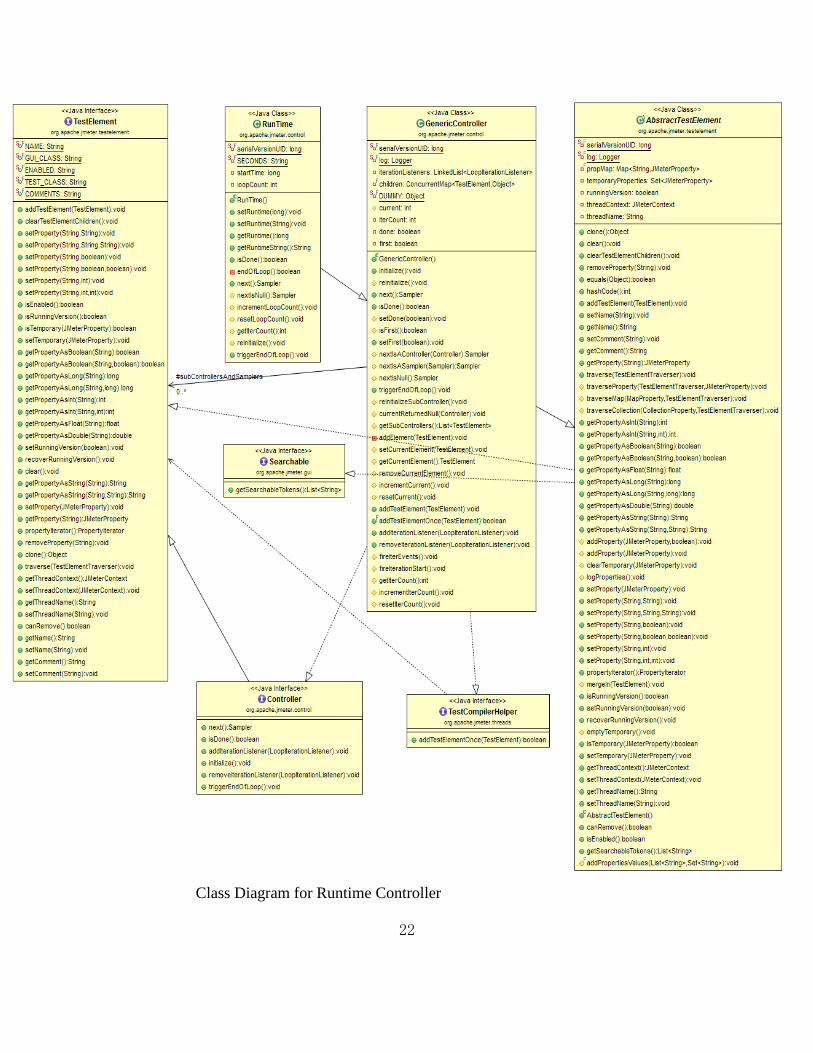
Class Diagram for Runtime Controller
Page 23
23
5.4 Post processors
Class Diagram for XPath Extractor
Page 24
24
Class Diagram for Regex Extractor
Page 25
25
5.5 PreProcessors:
Class Diagram for BSF Preprocessor
Page 26
26
Chapter 6
Detailed Description
Apache JMeter consists of large number of components which are used in a variety of test plans.
These components have been categorised according to their use in the test plans like samplers are
used to define the work to be done by the virtual users and timers are used to set delay in the
execution of the samplers. Similarly there are pre-processors, post-processors, listeners, config
elements, assertions which have several elements under them. These elements are described in
detail in this section. Apart from these the newly added components have also been elaborated in
this section. Their functioning along with suitable examples are placed in the following sections.
6.1 ASSERTIONS
Assertions allow you to include some validation test on the response of your request made using
a Sampler. They are inserted as a child component of a Sampler. Assertions are particularly
necessary in functional testing of your applications, while, in performance testing, you may want
to use assertion to ensure the responses you receive.
With Assertion, you can assert whether the application is returning the expected result or not.
JMeter allows you to specify your assertions using Perl-style regular expressions.
Let's say, you want to ensure that, in an HTTP Request Sampler, the page you request contains
the text 'Login Successful' to indicate successful access to a page. You may use Response
Assertion to specify if the response does contain the text at all. If JMeter cannot find the text,
then it will indicate this as failed request.
Associated with Assertions are Listeners such as "Assertion", "View Result in Table", "View
Result Tree", "Aggregate Report" Listener, and "Summary Report" Listeners, Assertion results.
The variable JMeterThread.last_sample_ok is updated to "true" or "false" after all assertions
for a sampler have been run.
Page 27
27
6.1.1 Response Assertion
The response assertion control panel lets you add pattern strings to be compared against various
fields of the response. The pattern strings are:
Contains, Matches: Perl5-style regular expressions
Equals, Substring: plain text, case-sensitive
You can also choose whether the strings will be expected to match the entire response, or if the
response is only expected to contain the pattern.
6.1.2 Duration Assertion
The Duration Assertion tests that each response was received within a given amount of time. Any
response that takes longer than the given number of milliseconds (specified by the user) is
marked as a failed response.
6.1.3 Size Assertion
The Size Assertion tests that each response contains the right number of bytes in it. You can
specify that the size be equal to, greater than, less than, or not equal to a given number of bytes.
6.1.4 XML Assertion
The XML Assertion tests that the response data consists of a formally correct XML document. It
does not validate the XML based on a DTD or schema or do any further validation.
6.1.5 BeanShell Assertion
The BeanShell Assertion allows the user to perform assertion checking using a BeanShell script.
For full details on using BeanShell, please see the BeanShell website.
6.1.6 MD5Hex Assertion
The MD5Hex Assertion allows the user to check the MD5 hash of the response data.
6.1.7 HTML Assertion
The HTML Assertion allows the user to check the HTML syntax of the response data using
JTidy.
Page 28
28
6.1.8 XPath Assertion
The XPath Assertion tests a document for well formedness, has the option of validating against a
DTD, or putting the document through JTidy and testing for an XPath. If that XPath exists, the
Assertion is true.
6.1.9 XML Schema Assertion
The XML Schema Assertion allows the user to validate a response against an XML Schema.
6.1.10 BSF Assertion
The BSF Assertion allows BSF script code to be used to check the status of the previous sample.
6.1.11 JSR223 Assertion
The JSR223 Assertion allows JSR223 script code to be used to check the status of the previous
sample.
6.1.12 Compare Assertion
The Compare Assertion can be used to compare sample results within its scope. Either the
contents or the elapsed time can be compared, and the contents can be filtered before
comparison. The assertion comparisons can be seen in the Comparison Assertion Visualizer.
6.1.13 SMIME Assertion
The SMIME Assertion can be used to evaluate the sample results from the Mail Reader Sampler.
This assertion verifies if the body of a mime message is signed or not. The signature can also be
verified against a specific signer certificate.
6.2 Configuration Element
Config Elements or Configuration elements are used to set defaults and variables to be used by
the samplers defined under their scope. There are 18 different config elements each for specific
purpose as described below.
Page 29
29
6.2.1 CSV Data Set Config : This config element is used to supply parameter values required
by different type of samplers in their requests. In this config element we supply a CSV file
containing parameter values and we specify the delimiter in the config element to separate the
combined set of values.
6.2.2 FTP request defaults : This config element is used to specify the default values to be
used by FTP samplers in their requests like server name or IP address, port number
method to be used get or post etc.
6.2.3 HTTP Authorization Manager: The authorization manager is used to specify one or
more user logins for the web pages that are restricted using server authentication.
6.2.4 HTTP Cache manager: This config element is used to add cache functionality to the
HTTP request samplers. If the previous sampler that requested some web page was successful
the Last-modified and E-tag parameters from the HTTP headers are saved for the urls. Later on
before requesting a page the cache is first checked if the value is their in the cache or not.
6.2.5 HTTP Cookie Manager: This config element is used to generate or to store cookies
for the users. If the response contains a cookie, that cookie is saved and is used for all future
references. Each thread have their own cookie storage, so we say if a cookie is used to maintain a
session then each thread runs in a separate session.
6.2.6 HTTP request defaults: This config element is used to set default values for the HTTP
samplers to be defined in its scope like server name or IP address or the port number,
parameters, method to be used , proxy configuration if any etc.
6.2.7 HTTP header manager: This config element is used to specify user defined values for
the parameters used in the HTTP headers like User-agents, accept-language etc.
6.2.8 Java Request Defaults: This config element is used to set default values for the java
requests samplers. Here we specify the parameters to be used in the java requests.
6.2.9 JDBC connection configurations: This config element is used to add default values for
the JDBC connection samplers. In this element we can specify jdbc drivers, urls, connection
ports, connection pools, pool variable, pool time out etc.
6.2.10 Keystore configurations: This config element is used specially with https samplers to
establish secure connection that require exchange of encryption algorithms and keys to
be exchanged.
Page 30
30
6.2.11 Login Config element: This config element is used to override the login specs for a
sampler in which scope this element is defined.
6.2.12 LDAP request defaults: This elements lets us set default values for LDAP testing like
server name, port, distinguished name, test configurations etc.
6.2.13 LDAP extended request defaults: This element is used for extended configuration to be
used for LDAP testing search base, filter, scope, size limit, time limit, attributes etc.
6.2.14 TCP sampler config: This config element is used to set default values for TCP samplers
like server name , port number, options like reuse connection close connection etc.
6.2.15 User Defined variables: This element lets us define an initial set of variable. These
variables are processed at the start of the test plan.
6.2.16 Random variable: Random Variable config element is used to generate random numeric
strings and store them in variable for use later. They can be used in any specified format
as needed by the samplers.
6.2.17 Counter: This config element is used to create a counter that can be referenced anywhere
in the thread group. This config element lets the user configure a start, maximum and
increment values.
6.2.18 Simple Config Elements: The Simple Config Element lets us add or overrode arbitrary
values in the samplers. The users can choose a name of the value and value itself as
6.3 Logic Controllers
Logic Controllers determine the order in which Samplers are processed. As in an If controller allows the
execution of the samplers within it only when the condition specified evaluates to true . Similarly the
once only controller allows the execution of the samplers present within it only once per iteration.
6.3.1 Once only controller:
The Once Only Logic Controller tells JMeter to process the controller(s) inside it only once per Thread,
and pass over any requests under it during further iterations through the test plan. For testing that requires
a login, consider placing the login request in this controller since each thread only needs to login once to
establish a session.
Page 31
31
6.3.2 Loop controller:
If we use the loop controller then JMeter will loop through the samplers the number of times
specified in the controller , in addition to the loop value you specified for the Thread Group. For
example, if you add one HTTP Request to a Loop Controller with a loop count of two, and
configure the Thread Group loop count to three, JMeter will send a total of 2 * 3 = 6 HTTP
Requests.
6.3.3 Interleave controller:
JMeter will alternate among each of the other controllers for each loop iteration defined within the
interleave controller.
6.3.4 .Random controller:-
The Random Logic Controller acts similarly to the Interleave Controller, except that instead of going in
order through its sub-controllers and samplers, it picks one at random at each pass.
6.3.5 Random order controller:
The Random Order Controller is much like a Simple Controller in that it will execute each child
element at most once, but the order of execution of the nodes will be random.
6.3.6 Throughput controller:
The Throughput Controller allows the user to control how often it is executed. There are two modes -
percent execution and total executions. Percent executions causes the controller to execute a certain
percentage of the iterations through the test plan. Total executions causes the controller to stop executing
after a certain number of executions have occurred.
6.3.7 IF controller: The If Controller allows the user to control whether the test elements below it (its
children) are run or not depending on the condition being satisfied or not.
6.3.8 While controller:The While Controller runs its children until the condition is "false".
Possible condition values:
blank - exit loop when last sample in loop fails
LAST - exit loop when last sample in loop fails. If the last sample just before the loop failed,
don't enter loop.
Otherwise - exit (or don't enter) the loop when the condition is equal to the string "false"
6.3.9 Module controller:
The Module Controller provides a mechanism for substituting test plan fragments into the current test
plan at run-time. There can be multiple fragments, each with a different series of samplers under them.
The module controller can then be used to easily switch between these multiple test cases simply by
Page 32
32
choosing the appropriate controller in its drop down box. This provides convenience for running many
alternate test plans quickly and easily.
6.3.10 Include controller:
The include controller is designed to use an external jmx file. If the file cannot be found at the location
given by prefix+filename, then the controller attempts to open the fileName relative to the JMX launch
directory.
6.3.11 Transaction controller:
The Transaction Controller generates an additional sample which measures the overall time taken
to perform the nested test elements. This time by default includes all processing within the
controller scope and not just the samples.
6.3.12 Runtime controller:
The Runtime Controller controls how long its children are allowed to run depending on the time
specified by the user in the given field.
6.3.13 Switch controller:
The Switch Controller acts like the Interleave Controller in that it runs one of the subordinate
elements on each iteration, but rather than run them in sequence, the controller runs the
element defined by the switch value.
6.3.14 Foreach controller:
A ForEach controller loops through the values of a set of related variables. When you add
samplers (or controllers) to a ForEach controller, every sample sample (or controller) is
executed one or more times, where during every loop the variable has a new value. The
input should consist of several variables, each extended with an underscore and a number.
Each such variable must have a value. So for example when the input variable has the
name inputVar, the following variables should have been defined:
inputVar_1 = wendy
inputVar_2 = charles
inputVar_3 = peter
inputVar_4 = john
6.3.15 Recording controller:
The Recording Controller is a place holder indicating where the proxy server should
Page 33
33
record samples to. During test run, it has no effect, similar to the Simple Controller. But
during recording using the HTTP Proxy Server , all recorded samples will by default be
saved under the Recording Controller.
6.4 POST-PROCESSORS
Post-processors execute after a request has been made from a Sampler. A good way is
to place them as a child of a Sampler, to ensure that it runs only after a particular
Sampler, not to Sampler afterwards. This element is most often used to process the
response data, for example, to retrieve particular value for later use.
6.4.1 Regular Expression Extractor
Allows the user to extract values from a server response using a Perl-type regular
expression. As a post-processor, this element will execute after each Sample request in
its scope, applying the regular expression, extracting the requested values, generate the
template string, and store the result into the given variable name.
6.4.2 CSS/JQuery Extractor
Allows the user to extract values from a server response using a CSS/JQuery selector
like syntax.
6.4.3 XPath Extractor
This test element allows the user to extract value(s) from structured response - XML or
(X)HTML - using XPath query language.
6.4.4 Result Status Action Handler
This test element allows the user to stop the thread or the whole test if the relevant
sampler failed.
6.4.5 BeanShell PostProcessor
Page 34
34
The BeanShell PreProcessor allows arbitrary code to be applied after taking a sample.
6.4.6 BSF PostProcessor
The BSF PostProcessor allows BSF script code to be applied after taking a sample.
6.4.7 JSR223 PostProcessor
The JSR223 PostProcessor allows JSR223 script code to be applied after taking a
sample.
6.4.8 JDBC PostProcessor
The JDBC PostProcessor enables you to run some SQL statement just after a sample
has run. This can be useful if your JDBC Sample changes some data and you want to
reset state to what it was before the JDBC sample run.
6.5 Pre-processors
Preprocessors are used to modify the Samplers in their scope. There are nine types of
preprocessors defined in JMeter.They are:-
6.5.1 HTML link parser:-
This modifier parses HTML response from the server and extracts links and forms. A
URL test sample that passes through this modifier will be examined to see if it
"matches" any of the links or forms extracted from the immediately previous response.
It would then replace the values in the URL test sample with appropriate values from
the matching link or form. Perl-type regular expressions are used to find matches. Eg-
Can be used in ―spidering‖ through a site.
6.5.2 HTTP URL re-writing modifier:
For web applications that use URL Re-writing to store session ids instead of cookies,
the HTTP url re-writing modifier element can be attached at the ThreadGroup level,
much like the HTTP Cookie Manager . When given the name of the session id
parameter, it finds it on the page and add the argument to every request of that
ThreadGroup.
Page 35
35
6.5.3 HTML parameter mask:
The HTML Parameter Mask is used to generate unique values for HTML arguments.
By specifying the name of the parameter, a value prefix and suffix, and counter
parameters, this modifier will generate values of the form " name=prefixcountersuffix
". Any HTTP Request that it modifies, it will replace any parameter with the same
name or add the appropriate parameter to the requests list of arguments.
6.5.4 User parameters:
Allows the user to specify values for User Variables specific to individual threads. User
Variables can also be specified in the Test Plan but not specific to individual threads.
This panel allows you to specify a series of values for any User Variable. For each
thread, the variable will be assigned one of the values from the series in sequence. If
there are more threads than values, the values get re-used. For example, this can be
used to assign a distinct user id to be used by each thread.
6.5.5 JDBC preprocessor:
JDBC PreProcessor enables you to run some SQL statement just before a sample runs.
This can be useful if your JDBC Sample requires some data to be in DataBase and you
cannot compute this in a setup Thread group.
6.5.6 RegEx user parameters:
Allows to specify dynamic values for HTTP parameters extracted from another HTTP
Request using regular expressions. RegEx User Parameters are specific to individual
threads. This component allows you to specify reference name of a regular expression
that extracts names and values of HTTP request parameters. Regular expression group
numbers must be specified for parameter's name and also for parameter's value.
Replacement will only occur for parameters in the Sampler that uses this RegEx User
Parameters which name matches .
6.5.7 BeanShell preprocessor:
Page 36
36
The BeanShell PreProcessor allows arbitrary code to be applied before taking
a sample.
Before invoking the script, some variables are set up in the BeanShell interpreter:
log - (Logger) - can be used to write to the log file
ctx - ( JMeterContext ) - gives access to the context
vars - ( JMeterVariables ) - gives read/write access to variables: vars.get(key);
vars.put(key,val); vars.putObject("OBJ1",new Object());
props - (JMeterProperties - class java.util.Properties) - e.g.
props.get("START.HMS"); props.put("PROP1","1234");
prev - ( SampleResult ) - gives access to the previous SampleResult (if any)
sampler - (Sampler)- gives access to the current sampler
6.5.8 BSF PreProcessor:
The BSF PreProcessor allows BSF script code to be applied before taking a
sample.
The script (or file) is processed using the BSFEngine.exec() method, which does
not return a value.
The following BSF variables are set up for use by the script:
log - (Logger) - can be used to write to the log file
Label - the String Label
Filename - the script file name (if any)
Parameters - the parameters (as a String)
args[] - the parameters as a String array (split on whitespace)
ctx - ( JMeterContext ) - gives access to the context
vars - ( JMeterVariables ) - gives read/write access to variables: vars.get(key);
vars.put(key,val); vars.putObject("OBJ1",new Object());
vars.getObject("OBJ2");
props - (JMeterProperties - class java.util.Properties) - e.g.
props.get("START.HMS"); props.put("PROP1","1234");
sampler - (Sampler)- gives access to the current sampler
OUT - System.out - e.g. OUT.println("message")
6.5.9 JSR223 Preprocessor:
Page 37
37
The JSR223 PreProcessor allows JSR223 script code to be applied before taking a
sample.
6.6 Timers:
Timers are used to produce a particular amount of delay between the execution of
the different threads. Timers are processed before each sampler in the scope in
which they are found; if there are several timers in the same scope, all the timers
will be processed before each sampler.
6.6.1 Constant timer:
Used to make the threads pause for a constant amount of time between requests.
6.6.2 Gaussian Random timer:-
This timer pauses each thread request for a random amount of time, with most of the
time intervals ocurring near a particular value. The total delay is the sum of the
Gaussian distributed value (with mean 0.0 and standard deviation 1.0) times the
deviation value specified by the user and the offset value.
6.6.3 Uniform random timer:
This timer pauses each thread request for a random amount of time, with each time
interval having the same probability of occurring. The total delay is the sum of the
random value and the offset value.
6.6.4 Constant throughput timer:
This timer introduces variable pauses, calculated to keep the total throughput (in
terms of samples per minute) as close as possible to a given value.
6.6.5 Synchronising timer:
The purpose of the SyncTimer is to block threads until X number of threads have
been blocked, and then they are all released at once. A SyncTimer can thus create
large instant loads at various points of the test plan.
6.6.6 BSF Timer:-
Page 38
38
The BSF Timer can be used to generate a delay using a BSF scripting language.
6.6.7 Poisson Random timer:
This timer pauses each thread request for a random amount of time, with most of the
time intervals ocurring near a particular value. The total delay is the sum of the
Poisson distributed value, and the offset value.
6.7 Visualizers/listeners:
The basic role of listeners is to ‗listen‘ to the test results. Apart from this they also
provide means to view, save, and read saved test results. Listeners are processed at
the end of the scope in which they are found.
6.7.1 Graph Results
The Graph Results listener generates a simple graph that plots all sample times.
Along the bottom of the graph, the current sample (black), the current average of all
samples(blue), the current standard deviation (red), and the current throughput rate
(green) are displayed in milliseconds. The throughput number represents the actual
number of requests/minute the server handled.
6.7.2 Spline visualizer:-
The Spline Visualizer provides a view of all sample times from the start of the test
till the end, regardless of how many samples have been taken. The spline has 10
points, each representing 10% of the samples, and connected using spline logic to
show a single continuous line.
6.7.3 View results tree:-
The View Results Tree shows a tree of all sample responses, allowing you to view
the response for any sample. In addition to showing the response we can see the time
it took to get this response and the response codes.
6.7.4 Aggregate report-
Page 39
39
The aggregate report creates a table row for each differently named request in your
test. For each request, it totals the response information and provides request count,
min, max, average, error rate, approximate throughput (request/second) and
Kilobytes per second throughput. Once the test is done, the throughput is the actual
through for the duration of the entire test.
6.7.5 View results in tree-
This visualizer creates a row for every sample result showing the
status,latency and other details of the sample.
6.7.6 Simple data writer:-
This listener can record results to a file but not to the UI. It is meant to
provide an efficient means of recording data by eliminating GUI overhead. When
running in non-GUI mode, the -l flag can be used to create a data file. The fields to
save are defined by JMeter properties.
6.7.7 Aggregate graph:-
The aggregate graph is similar to the aggregate report. The primary
difference is the aggregate graph provides an easy way to generate bar graphs and
save the graph as a PNG file.
6.7.8 Mailer visualizer:-
The mailer visualizer can be set up to send email if a test run receives too
many failed responses from the server.
6.7.9 Summary report:-
The summary report creates a table row for each differently named request
in your test. This is similar to the Aggregate Report , except that it uses less
memory.
6.7.10 Save responses to a file:-
Page 40
40
For each sample in its scope, it will create a file of the response Data. The
primary use for this is in creating functional tests, but it can also be useful where the
response is too large to be displayed in the View Results Tree Listener.
6.7.11 Generate Summary results:-
Generates a summary of the test run so far to the log file and/or standard
output. Both running and differential totals are shown. Output is generated every n
seconds (default 3 minutes) on the appropriate time boundary, so that multiple test
runs on the same time will be synchronised.
6.7.12 Comparison Assertion Visualiser:-
The Comparison Assertion Visualizer shows the results of any Compare
Assertion elements.
6.8 Samplers
6.8.1 FTP Request
This controller lets you send an FTP "retrieve file" or "upload file" request to an FTP
server. When downloading a file, it can be stored on disk (Local File) or in the
Response Data, or both.
6.8.2 HTTP Request
This sampler lets you send an HTTP/HTTPS request to a web server. It also lets you
control whether or not JMeter parses HTML files for images and other embedded
resources and sends HTTP requests to retrieve them. The following types of embedded
resource are retrieved:
images
applets
stylesheets
external scripts
frames, iframes
background images (body, table, TD, TR)
Page 41
41
background sound
The default parser is htmlparser.
6.8.3 JDBC Request
This sampler lets you send an JDBC Request (an SQL query) to a database. If the
Variable Names list is provided, then for each row returned by a Select statement, the
variables are set up with the value of the corresponding column. The count of rows is
also set up. For example, if the Select statement returns 2 rows of 3 columns, and the
variable list is A,C , then the following variables will be set up:
A_#=2 (number of rows)
A_1=column 1, row 1
A_2=column 1, row 2
C_#=2 (number of rows)
C_1=column 3, row 1
C_2=column 3, row 2
6.8.4 Java Request
This sampler lets you control a java class that implements the
org.apache.jmeter.protocol.java.sampler.JavaSamplerClient interface. By writing your
own implementation of this interface, you can use JMeter to harness multiple threads,
input parameter control, and data collection.
6.8.5 SOAP/XML-RPC Request
This sampler lets you send a SOAP request to a webservice. It can also be used to send
XML-RPC over HTTP. It creates an HTTP POST request, with the specified XML as
the POST content. The primary difference between the soap sampler and webservice
sampler, is the soap sampler uses raw post and does not require conformance to SOAP
1.1
6.8.6 LDAP Request
This Sampler lets you send a different Ldap request(Add, Modify, Delete and Search)
to an LDAP server.
Page 42
42
There are two ways to create test cases for testing an LDAP Server.
Inbuilt Test cases.
User defined Test cases.
6.8.7 Access Log Sampler
AccessLogSampler was designed to read access logs and generate http requests. The
current implementation of AccessLogSampler uses the generator to create a new
HTTPSampler. The servername, port and get images are set by AccessLogSampler.
Next, the parser is called with integer 1, telling it to parse one entry. After that,
HTTPSampler.sample() is called to make the request.
6.8.8 BeanShell Sampler
This sampler allows you to write a sampler using the BeanShell scripting language.
The test element supports the ThreadListener and TestListener interface methods.
These must be defined in the initialisation file.
6.8.9 BSF Sampler
This sampler allows you to write a sampler using a BSF scripting language. By default,
JMeter supports the following languages:
javascript
jexl (JMeter version 2.3.2 and later)
xslt
6.8.10 JSR223 Sampler
The JSR223 Sampler allows JSR223 script code to be used to perform a sample.
JSR223 related elements have a feature that increases highly their performances. To
benefit from this feature:
Use Script files instead of inlining them. This will make JMeter compile them if this
Page 43
43
feature is available on ScriptEngine and cache them.
Or Use Script Text and fill in script cache key property, ensure it is unique accross Test
Plan as JMeter will use it to cache result of compilation.
6.8.11 TCP Sampler
The TCP Sampler opens a TCP/IP connection to the specified server. It then sends the
text, and waits for a response. If "Re-use connection" is selected, connections are
shared between Samplers in the same thread, provided that the exact same host name
string and port are used. Different hosts/port combinations will use different
connections, as will different threads. If both of "Re-use connection" and "Close
connetion" are selected, the socket will be closed after running the sampler. On the next
sampler, another socket will be created.
6.8.12 JUnit Request
The current implementation supports standard Junit convention and extensions. It also
includes extensions like oneTimeSetUp and oneTimeTearDown. The sampler works
like the JavaSampler with some differences.
6.8.13 Mail Reader Sampler
The Mail Reader Sampler can read (and optionally delete) mail messages using
POP3(S) or IMAP(S) protocols. Messages are stored as subsamples of the main
sampler. In versions of JMeter after 2.3.4, multipart message parts are stored as
subsamples of the message.
6.8.14 Test Action
The Test Action sampler is a sampler that is intended for use in a conditional controller.
Rather than generate a sample, the test element eithers pauses or stops the selected
Page 44
44
target. This sampler can also be useful in conjunction with the Transaction Controller,
as it allows pauses to be included without needing to generate a sample. For variable
delays, set the pause time to zero, and add a Timer as a child.
6.8.15 SMTP Sampler
The SMTP Sampler can send mail messages using SMTP/SMTPS protocol. It is
possible to set security propocols for the connection (SSL and TLS), as well as user
authentication. If a security protocol is used a verification on the server certificate will
occur.
Two alternatives to handle this verification are available:
Trust all certificates. This will ignore certificate chain verification
Use a local truststore. With this option the certificate chain will be validated against the
local truststore file.
6.8.16 OS Process Sampler
The OS Process Sampler is a sampler that can be used to execute commands on the
local machine.It should allow execution of any command that can be run from the
command line.
Validation of the return code can be enabled, and the expected return code can be
specified.
6.9 Auto CSV Generation
Page 45
45
For any tester testing with a large number of users; on an application which has a form or
request that takes multiple data entries and the data entries are required to be unique for different
users; it becomes a redundant work to type .csv files with unique data set entries. But,
necessarily, the back end Database of the AUT, which already contains this data for a number of
users, is available with the tester and he would like to use this file instead of creating ―Comma
Separated File‖ for this purpose. The main aim of the ―Auto CSV Generation‖ is to automate the
generation of the .csv file from the mentioned table of the Database, to be used with samplers.
For this purpose, the ―Auto CSV Generation‖ is used as a non test element, before setting
up the actual experiment. The ―Auto CSV Generation‖ is added to the Test Plan of JMeter and
the connection details of the DBMS used with username and password, the Database and the
table for which .csv is to be created, is specified. Then the plan is played, without the actual test
elements.
Thus the table mentioned is saved in form of .csv file, with each row of the table, as a set
of comma separated data. The new .csv file is named as ―databaseName_tableName.csv‖ and can
be found in the ―bin‖ folder of the JMeter.
This .csv file can now be used in the pre-existent config element – ―CSV Data Set
config‖ and the variables of the ―CSV Data Set config‖ can be related to the values of parameter
of the sampler. Now the ―CSV Data Set config‖ is made the child of respective sampler, so that
the sampler can use the data in the .csv file, to send request to respective application, each time
representing a unique user, as the form data will be uniquely taken from .csv file and not
redundant.
6.10 Filtered Results Listener Plugin
The Filtered results Listener plugin works as an add-on to ―View Results in Table‖
Listener in JMeter. The plug-in has a wide spread application in performance testing and load
testing, also in benchmarking any system.
When the user wants to set a filter on any value, he specifies a non-zero integer in the test
box and runs the test, as the tables are populated; only the values greater/less than specified value
will be displayed in the table. The utility of such results is the clarity it provides in performance
testing of system under test. Only those results satisfying the condition selected will be
displayed.
Page 46
46
6.11 SMTP Defaults
Configuration Elements or config elements are important component of the test plans designed in
Apache Jmeter. They are mainly used to specify default values or variables to be used in the test
plan. This helps in preventing the redundant specification of the values to be used by the
samplers in the test plan.
The existing Jmeter have several config element like Http Request Defaults which is used with
http request samplers, Java Request Defaults which is used with Java request samplers, Ldap
Request defaults, TCP Sampler config, JDBC Connection configuration which are all used for
specific purposes. The existing version of Jmeter have a sampler called SMTP Sampler which is
used for testing smtp mail servers. There is large number of fields to be specified within sampler
before the test can be run like Server or IP address of the SMTP server, the port address of the
smtp server, the mail address where the mail is to be sent, mail address of the person sending the
mail, the mail addresses where the copies of the mail is to be sent. In the authorization settings, if
required, the user-name and the password is to be specified. In the message settings the subject
of the mail, headers to be added, message to be sent, any attachment to be sent along with the
mail and other optional parameter which may or may not be selected depending upon the
configuration of the mail server to be tested.
In case if the test plan is having more than one sampler, like four or five or more, these data and
settings have to be specified for all the samplers which is too cumbersome as well as several
entries in the samplers are common which make these entries redundant. In this situation, there is
a need of a SMTP config element where default values can be set which don't have to be
specified in the samplers to be used.
Smtp Defaults Config Element is a configuration element that can be used to set default values
for Smtp samplers.
6.12 Automating TPC-C tests in JMETER
TPC-C is an on-line transaction processing benchmark.
The goal of TPC-C benchmarks is to define a set of functional requirements that can be run on
any transaction processing system, regardless of hardware or operating system.
TPCC carries out OLTP transactions. Online transaction processing, or OLTP, is a class of
information systems that facilitate and manage transaction-oriented applications, typically for
data entry and retrieval transaction processing.
Page 47
47
TPC-C is a standard database benchmark, used to measure database performance. Database
vendors invest big bucks in running this test and showing off which database is faster, and can
scale better.
TPC-C simulates a complete computing environment where a population of users executes
transactions against a database. The benchmark is centered around the principal activities
(transactions) of an order-entry environment. These transactions include entering and delivering
orders, recording payments, checking the status of orders, and monitoring the level of stock at
the warehouses. While the benchmark portrays the activity of a wholesale supplier, TPC-C is not
limited to the activity of any particular business segment, but, rather represents any industry that
must manage, sell, or distribute a product or service.
TPC-C involves a mix of five concurrent transactions of different types and complexity either
executed on-line or queued for deferred execution.
1. New-order: enter a new order from a customer
2. Payment: update customer balance to reflect a payment
3. Delivery: deliver orders (done as a batch transaction)
4. Order-status: retrieve status of customer‘s most recent order
5. Stock-level: monitor warehouse inventory
The benchmark model-
TPC-C simulates an environment in which the operator performs various transactions against a
database .The central elements of the benchmark are the typical transactions of a wholesale
company concerning order entries (order acceptance, delivery, recording payments, checking the
status of orders and monitoring stock levels). The simulated company operates out of a number
of warehouses and their allocated districts.
TPC-C is designed in such a way that the size of the company (i.e. the number of its warehouses)
may vary.
Set parameters on the other hand are the 100,000 items as well as ten sales districts per
warehouse and 3,000 customers per district. Every operator can at any time implement one of
five transactions on the company‘s goods ordering system. Both the transactions and their
Page 48
48
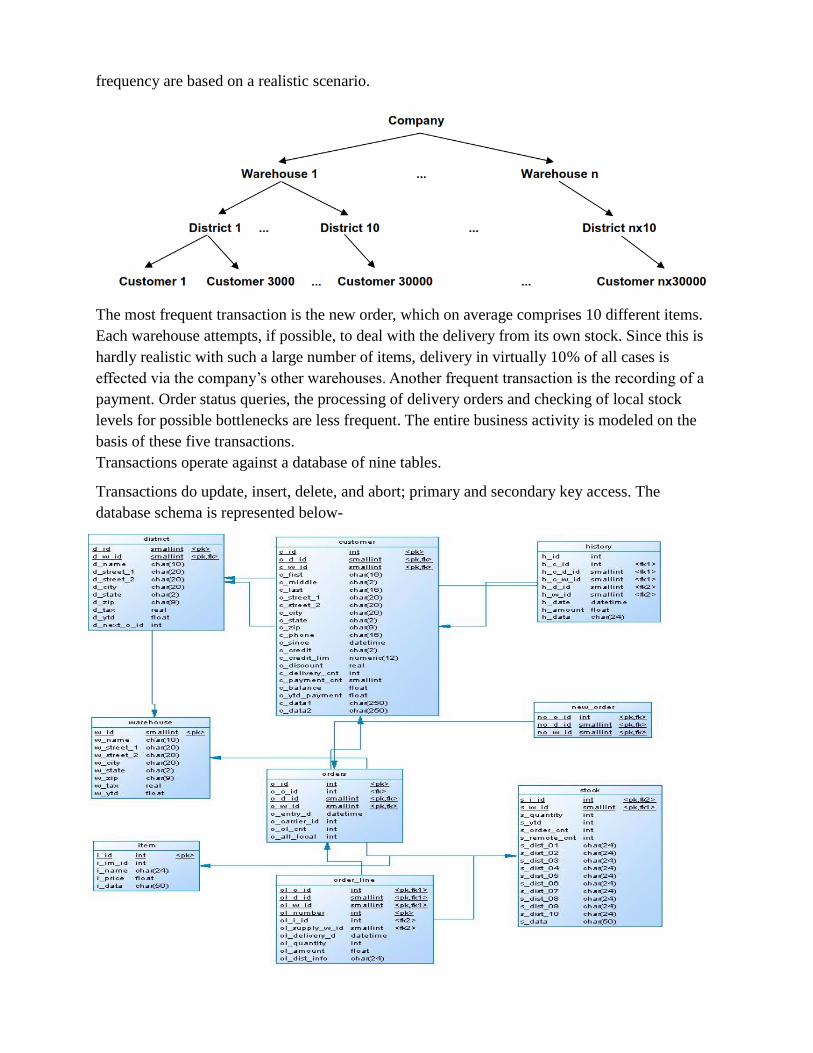
frequency are based on a realistic scenario.
The most frequent transaction is the new order, which on average comprises 10 different items.
Each warehouse attempts, if possible, to deal with the delivery from its own stock. Since this is
hardly realistic with such a large number of items, delivery in virtually 10% of all cases is
effected via the company‘s other warehouses. Another frequent transaction is the recording of a
payment. Order status queries, the processing of delivery orders and checking of local stock
levels for possible bottlenecks are less frequent. The entire business activity is modeled on the
basis of these five transactions.
Transactions operate against a database of nine tables.
Transactions do update, insert, delete, and abort; primary and secondary key access. The
database schema is represented below-
Page 49
49
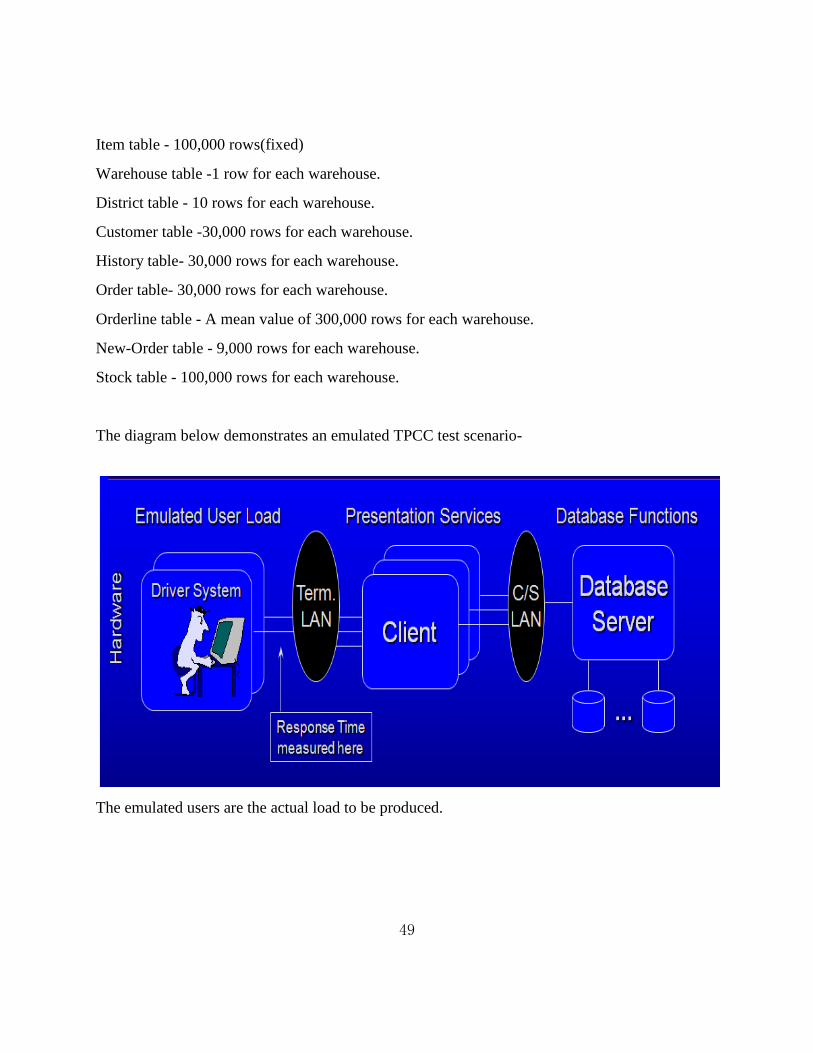
Item table - 100,000 rows(fixed)
Warehouse table -1 row for each warehouse.
District table - 10 rows for each warehouse.
Customer table -30,000 rows for each warehouse.
History table- 30,000 rows for each warehouse.
Order table- 30,000 rows for each warehouse.
Orderline table - A mean value of 300,000 rows for each warehouse.
New-Order table - 9,000 rows for each warehouse.
Stock table - 100,000 rows for each warehouse.
The diagram below demonstrates an emulated TPCC test scenario-
The emulated users are the actual load to be produced.
Page 50
50
The below diagram shows an example TPCC workflow-
Each warehouse has ten terminals and all five transactions are available at each terminal. A
remote terminal emulator (RTE) is used to maintain the required mix of transactions over the
performance measurement period. This mix represents the complete business processing of an
order as it is entered, paid for, checked, and delivered. More specifically, the required mix is
defined to produce an equal number of New-Order and Payment transactions and to produce one
Delivery transaction, one Order-Status transaction, and one Stock-Level transaction for every ten
New-Order transactions.
The calculated metric is tpmC.
The tpmC metric is the number of New-Order transactions executed per minute. Given the
required mix and the wide range of complexity and types among the transactions, this metric
more closely simulates a complete business activity, not just one or two transactions or computer
operations. For this reason, the tpm-C metric is considered to be a measure of business
throughput.
Page 51
51
Response time requirement: 90% of each type of transaction must have a response time less than
5 seconds, except stock-level which is less than 20 seconds. The throughput of TPC-C is a direct
result of the level of activity at the terminals.
Detail on Transactions to be carried out
New Order-
It accepts the warehouse, district and customer data and the item, quantity and supply warehouse
id for up to ten order lines.
The transaction profile requires this to update the stock level for each order line, add a row to
ORDERS and NEW_ORDER and a row to ORDER_LINE for each order line. This also reads
the customer, updates the district and reads the warehouse. This all needs to take place as one
transaction with a high integrity requirement.
The procedure begins by updating the stock levels. This is the part with lowest locality and thus
most likely to cause I/O and least likely to cause lock contention. Most of the transaction's real
time will be spent inside ol_stock. If the order lines are sorted in order of item id, new order
transactions will never deadlock on the stock level part. This will maximize the number of
concurrent new orders on one warehouse.
When the stock level for all order lines has been updated this reads the customer data.
The bottleneck in terms of serialization is the read-update of the district, where the order gets an
O_ID. This must be done as late as possible but has to precede the inserts, since these will use
the O_ID.
Payment-
The payment transaction reads and updates the customer. The customer may either be identified
by its last name or its C_ID. In the case the last name this chooses the middle row of the set of
customers sharing the same last name, ordered by first name.
Delivery-
The delivery transaction reads and deletes a line from NEW_ORDER and updated the
corresponding ORDERS and ORDER_LINE rows. The rules allow committing the transaction
after processing each order. The client calls this procedure ten times with a different district id
parameter once every ten new orders. It is better to have the 1 to 10 loop in the client in order to
keep locks on for the least time possible.
Page 52
52
Order Status-
This transaction picks the last order of a given customer. It uses a select in descending order to
locate it. This is a read only transaction.
Stock level -
This is a complex read-only transaction. This finds all distinct items which have been ordered
within the last n orders from a district having a stock level lower than a given threshold.
Role of JMeter in TPC-C testing.
6.13 Bandwidth Throttling
Bandwidth throttling is the intentional slowing of Internet service. This process is
employed in the communication networks to regulate the network traffic and minimize
bandwidth to control congestion.
Throttling can be used to actively limit a user's upload and download rates on programs such as
video streaming, BitTorrent protocols and other file sharing applications, as well as even out the
usage of the total bandwidth supplied across all users on the network. Bandwidth throttling is
also often used in Internetapplications, in order to spread a load over a wider network to reduce
local network congestion, or over a number of servers to avoid overloading individual ones, and
so reduce their risk of crashing, and gain additional revenue by compelling users on to more
expensive pricing schemes where bandwidth is not throttled.
Utility of bandwidth throttling in Jmeter
Jmeter is a testing tool employed to test web services under various loads, configurations,
situations, and environment. In the real world scenario, the web services are used by a vast
variety of users using different categories of network connections. Some people use extremely
high broadband connection while some use low bandwidth mobile connections to use various
web services. For example, the railway ticket booking website, IRCTC deals with millions and
billions of simultaneous requests at the same time from a vast number of users from all across
India. Similarly major social netwoking websites are used by even greater number of users from
all across the globe. So in there is a need to test these services from users using different
available bandwidth. Such tests can provide the usability, scalability of the servers under
different network connections. Such test can help is the recognizing the scenarios in which the
Page 53
53
service is unusable or to test the minimum requirement to use the service. Such functionality in
Jmeter can increase its usability in testing web services where the tester can specify the available
bandwidth which can less than or equal to the available bandwidth to the system and Jmeter will
use this bandwidth to send or receive requests to/from the servers. Jmeter can measure the
response time, throughput, amount of data exchanged, latency and errors in the transaction using
variable bandwidth as required the scenario described above.
Bandwidth throttling can be used with IP spoofing to create a test plan simulating a real world
scenario where users try to access a web service from various geographical locations having a
varying bandwidth and using different IP addresses which makes the test plan more realistic and
reduces the use of multiple system for testing.
6.14 Dynamic Bandwidth Throttling
Dynamic Bandwidth Throttling deals with the variation of bandwidth at runtime. Through
dynamic bandwidth throttling we would be able to vary bandwidth dynamically based on our
requirements. As described in the previous section of the report that we can specify bandwidth
which jmeter uses to run the samplers in the test plan. The group of samplers under one Http
Request Defaults used the bandwidth once specified. In case of dynamic bandwidth throttling we
want the bandwidth to vary automatically based on the factors like error in the sampler that
completed their task or the aggregate throughput of all the samplers or latency. Dynamic
Bandwidth Throttling can be used to test the performance of the web services under varying
bandwidth. Various types of test plans can be generated to test the performance under varying
load, bandwidth, latency etc.
The Dynamic Bandwidth Throttling component within jmeter is built to vary bandwidth on the
basis of percentage error. Percentage error is defined as the number of samplers that failed to get
response from the server against the total number of samplers in the test plan. Using this value of
percentage error jmeter can vary the available bandwidth to the samplers. This could help in the
scenarios like if a server is under a heavy load and most of the request being sent is being
dropped so the client requesting the server gets request timeout error. So in this situation, when
jmeter detects that the percentage error is going above a threshold value, then it automatically
reduces the available bandwidth, so that the number of request being sent get reduced and hence
the load on the server automatically gets reduced and hence the server gets more time to process
the request thereafter. This method although introduces a slight delay in the response but the
errors in the response are reduced considerably. Dynamic Bandwidth throttling has also the
property of increasing the bandwidth as soon as the server recovers from the errors. Hence as
soon as the percentage errors comes under control, jmeter allocates the full available quota to the
samplers. In this way it tries to minimize the latency introduced due to reduction of bandwidth.
Page 54
54
Chapter 7
Graphical User Interface
7.1 Auto CSV Generation
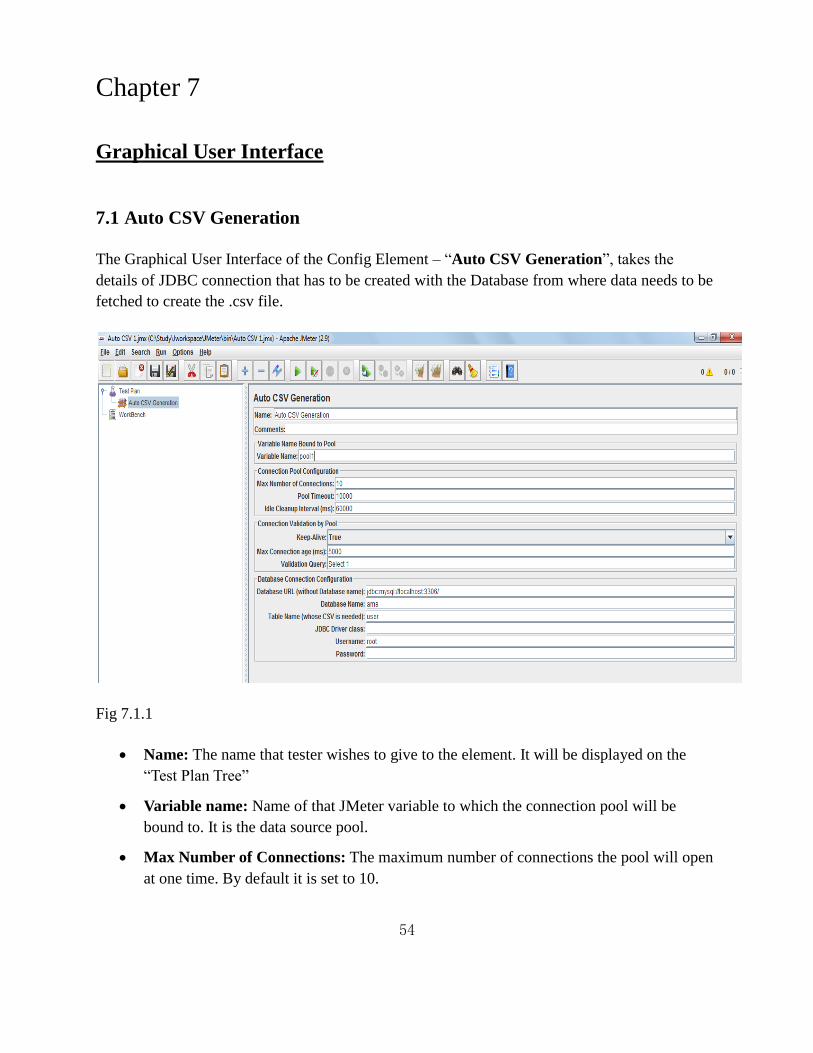
The Graphical User Interface of the Config Element – ―Auto CSV Generation‖, takes the
details of JDBC connection that has to be created with the Database from where data needs to be
fetched to create the .csv file.
Fig 7.1.1
Name: The name that tester wishes to give to the element. It will be displayed on the
―Test Plan Tree‖
Variable name: Name of that JMeter variable to which the connection pool will be
bound to. It is the data source pool.
Max Number of Connections: The maximum number of connections the pool will open
at one time. By default it is set to 10.
Page 55
55
Pool Timeout: After this time period the pool blocks request for connection, until new
connections are available. This is the maximum blocking time, until an exception is
returned. It is in milliseconds. By default it is set to 10000ms (10sec).
Idle Cleanup Interval: The pool removes extra idle connections at regular interval. This
timing for interval is defined here. It is in milliseconds. By default it is set to 60000ms
(60sec).
Keep Alive: Whether the pool should validate connections. If no then the Connection
Age and Validation Query are ignored.
Max Connection Age: It is the maximum number of milliseconds an idle connection is
kept, before discarding. It is in milliseconds. By default it is set to 5000ms
Validation Query: A query used to validate if the connection is still alive. Relevant only
if ―Keep Alive‖ is true.
Database URL: Full URL of the Database, including the JDBC protocol part, but
excluding the database name only. The front slash ―/‖ before the database name should be
present.
Database Name: The name of the database for which the .csv file of one of the table is to
be created.
Table Name: The name of the table of database for which the .csv file will be created.
JDBC Driver class: Full package and class name of the JDBC Driver to be used. It must
be included in the JMeter class path beforehand.
Username: Username to use while connecting to database.
Password: Password to use while connecting to database.
7.2 Filtered Results Listener Plugin
The GUI is quite simple; user can select the appropriate operator, specify the value and run the
test.
Figure 1: Old GUI without filtered results in ―View Results in a Table‖
Figure 2: New GUI with filter ‗Limit‘ in ―View Results in a Table‖
Page 57
57
7.3 SMTP Defaults GUI
The graphical user interface for the SMTP defaults consist fields for the users to provide the
defaults values to be set in the test plan. They are name of the component, comments, server
name or address, port number or address, mail address to.
Fig 7.3.1
Fields in SMTP defaults GUI
1. Name: Name of the config element in the test plan. This name is used to identify the
element in the tree view of the test plan
Comments: This text field is provided to give some related comment or description of the
element used in the test plan. It may describe the use of the element in the test plan.
• Server Settings Panel
• Server: This text field is used specify the IP address or the domain name of the mail
server where all the mails under this config element is to be sent. This value is used
by all the smtp samplers with in this config element in the hierarchy unless a sampler
has specifically specified the value for server.
• Port: This text field is used to specify the port address on which the mails are to be
sent.
Once specified, all the samplers in the test plan will use the same port address unless a sampler
has specifically specified the value for port.
• Mail Settings Panel
• Address To: This text field is used to specify the mail address where all the mails
from the samplers in the test plan hierarchy will be delivered. Once specified, this
value is used by all the samplers in the hierarchy unless a sampler has specifically
Page 58
58
specified the value for address to.
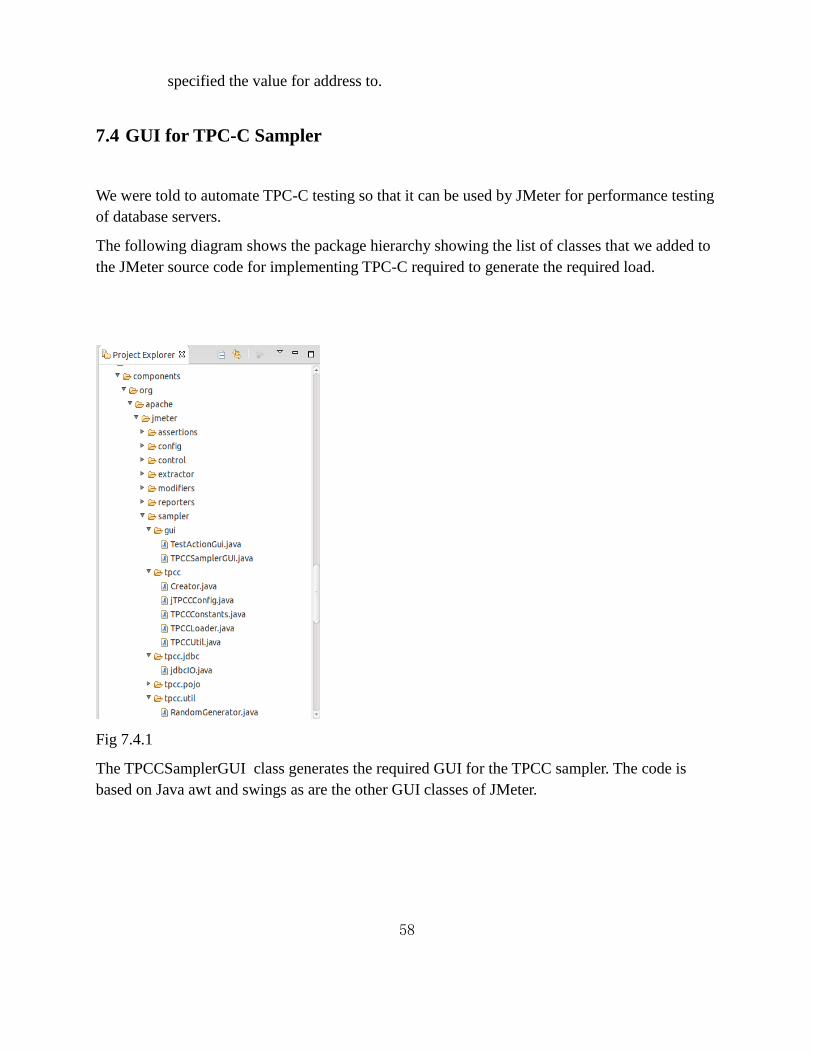
7.4 GUI for TPC-C Sampler
We were told to automate TPC-C testing so that it can be used by JMeter for performance testing
of database servers.
The following diagram shows the package hierarchy showing the list of classes that we added to
the JMeter source code for implementing TPC-C required to generate the required load.
Fig 7.4.1
The TPCCSamplerGUI class generates the required GUI for the TPCC sampler. The code is
based on Java awt and swings as are the other GUI classes of JMeter.
Page 59
59
Fig 7.4.2
The above figure shows the GUI for the sampler being generated. It takes as parameters the host
name , port number, username , password , name of the database to be created and the number of
warehouses to be generated and the total duration of the test.
When the user clicks the ‗‘create database‘‘ button depending on the number of warehouses
generated the 9 tables mentioned in the database schema and the 5 procedures mentioned above
get generated automatically and the tables also get filled with the required amount of data
corresponding to the number of warehouses using random values as specified in the TPC-C
specifications.
Similarly when the user clicks on the ―start test‖ button the procedures which are generated in
the database are called with parameters being random numbers and strings generated by the 15
functions added by us in the Jmeter source code.
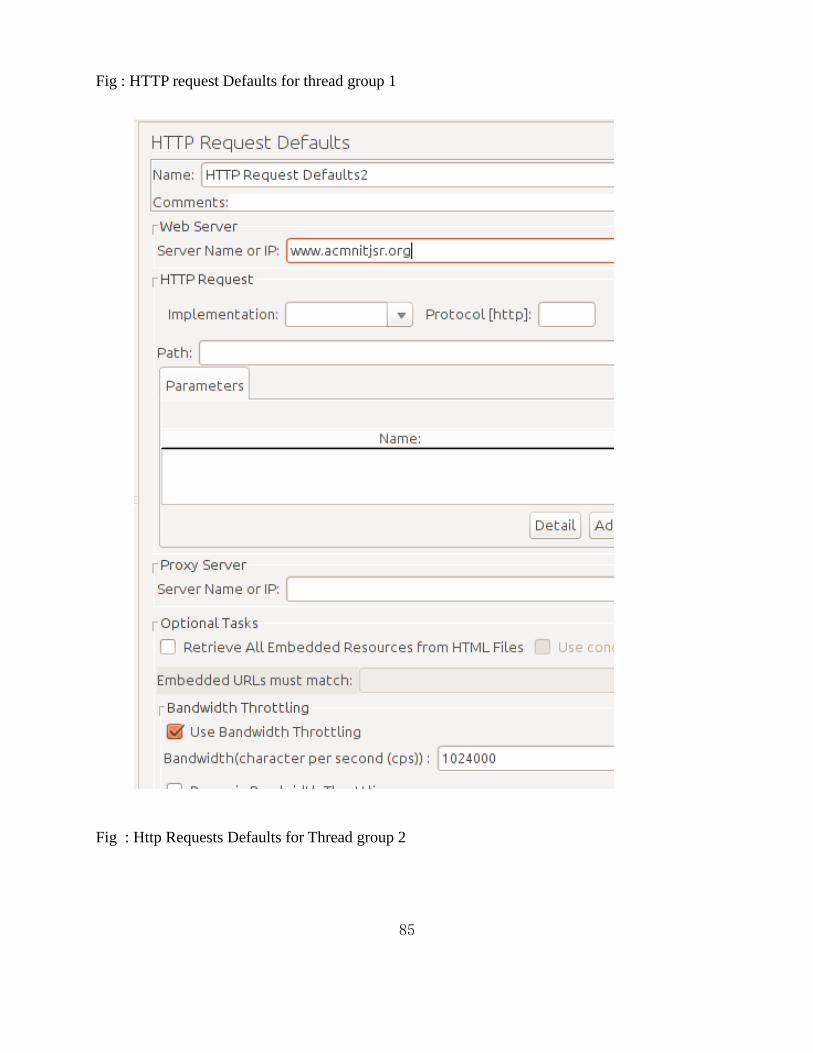
7.5 Bandwidth Throttling GUI
Bandwidth throttling element have been added with in the HTTP Request Defaults 'config
element' of Jmeter. It mainly consists of two components apart from the components which are
already there in the config element. They are 'Use bandwidth Throttling' check box and
Bandwidth (in cps) text box.
Page 60
60
Fig 7.5.1 : Bandwidth Throttling element in Http Requests Defaults
Field elements in the GUI
'Use Bandwidth Throttling' : A check box which enables bandwidth throttling in Jmeter.
When this check box is selected, the text box for the bandwidth is enabled.
Bandwidth (Character per second) : This is a text box enabled only when bandwidth
throttling check box is selected. The value specified in this check box is used by the
Jmeter as the bandwidth available for the System.
7.6 Dynamic Bandwidth Throttling GUI
Dynamic Bandwidth throttling element have been added with in the HTTP Request Defaults
'config element' of Jmeter. It mainly consists of three components apart from the components
which are already there in the config element.
Fig 7.6.1 : Dynamic Bandwidth Throttling GUI
Fields in the Dynamic Bandwidth Throttling GUI component
'Dynamic Bandwidth Throttling' Check Box : This check box is used to set the use of
dynamic bandwidth with Jmeter. Once selected, this enables the use of dyanmic
bandwidth variations. Enabling this component also enable the text fields in the GUI.
'Minimum Applicable Bandwidth' : This sets the minimum level for the bandwidth upto
which the bandwidth can be reduced during runtime. Default value is 0.
Maximum Permissible Error: This text box is used to specify the threshold value which
will be used to vary the bandwidth. If the error crosses this value, then the bandwidth
starts decreasing until the error again gets below this value or reaches the minimum
applicable bandwidth value specified in the previous text field. Default is 100%.
Page 61
61
Chapter 8
8.1 Test 1: Test Plan to demonstrate “Auto CSV Generation” Configuration
Element.
Aim: The aim of running this test is to automatically create the .csv file for the table of database
mentioned, using ―Auto CSV Generation‖ and to use it along with samplers to supply data to
samples under use in test.
Procedure: The main purpose of the ―Auto CSV Generation‖ is to create .csv file and have it in
the ―bin‖ folder of Jmeter to be used by other samplers.
View1: bin before csv file generation
The database name and table name, along with connection details, is mentioned in the interface,
and the new csv file will be named as databaseName_tableName.csv, and can be found in the bin
of Jmeter.
View2: bin after csv file generation
Page 62
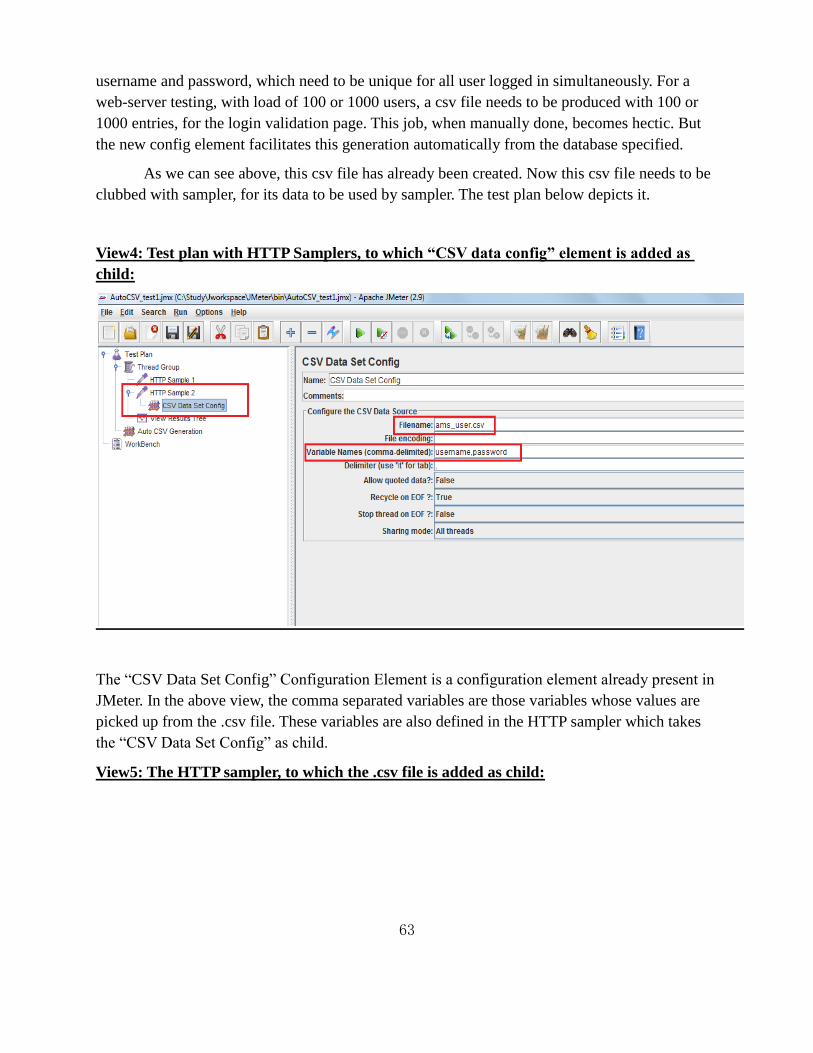
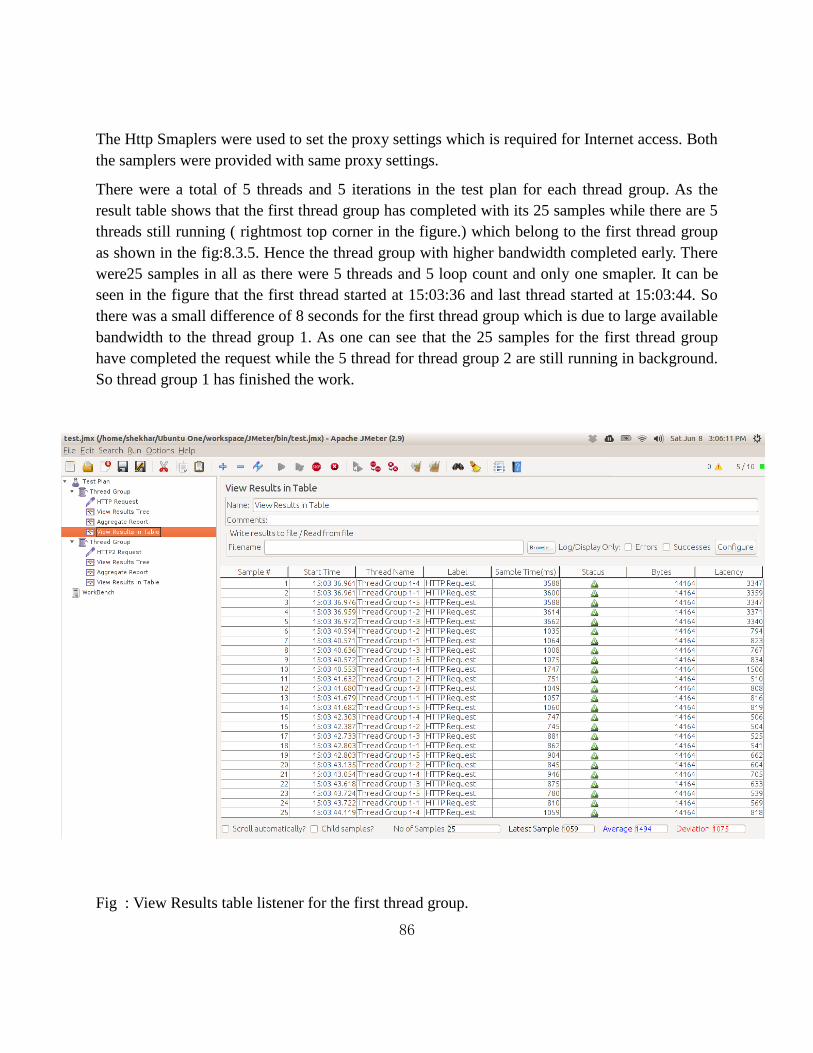
62
The .csv file, created during a Jmeter experiment with Database –ams and Table –user, has the
following content.
View3: The ams_user.csv file in MS Excel
The application under test (AUT) is a simple web-app, for airport management people, the
opening page of which expects user name and password as user (manager) input, checks against
Database already present and then creates session for users. Thus here the parameters passed are
Page 63
63
username and password, which need to be unique for all user logged in simultaneously. For a
web-server testing, with load of 100 or 1000 users, a csv file needs to be produced with 100 or
1000 entries, for the login validation page. This job, when manually done, becomes hectic. But
the new config element facilitates this generation automatically from the database specified.
As we can see above, this csv file has already been created. Now this csv file needs to be
clubbed with sampler, for its data to be used by sampler. The test plan below depicts it.
View4: Test plan with HTTP Samplers, to which “CSV data config” element is added as
child:
The ―CSV Data Set Config‖ Configuration Element is a configuration element already present in
JMeter. In the above view, the comma separated variables are those variables whose values are
picked up from the .csv file. These variables are also defined in the HTTP sampler which takes
the ―CSV Data Set Config‖ as child.
View5: The HTTP sampler, to which the .csv file is added as child:
Page 64
64
Here the parameters of request are set with variables mentioned in the ―CSV Data Set Config‖.
Then the test plan is played. The output of test is observed and it is seen that every request passes
one set of values from .csv file as POST data, when ever that sample is used as user request.
Observation:
View6: Observation 1:
Page 65
65
View7: Observation 2:
Page 66
66
Conclusion:
Different requests take different set of data, successively from .csv file, and if the number of
users is greater than the sets of data in the file, then the set of data are picked from the start of the
file again. Thus the purpose of developing the new Auto CSV generation Config element was
successful.
8.2 Test Plan : Demonstration of the working of “SMTP Defaults” config
Element
Aim: A test plan to demonstrate the working of SMTP defaults in Apache Jmeter.
System requirement: Apache Jmeter 2.9 and Postfix and Dovecot Mail server need to be installed
on the system to be used for testing.
Procedure: The process to create the required test plan is described below
Step 1: A thread group is added to test plan from the Edit menu using Add → Thread group.
Step 2: Number of threads is set to 1 and Loop count is set to 1. See fig. 8.1
Step 3: An 'SMTP defaults' config element is added to thread group using Edit → Add → Config
Element → SMTP Defaults
Step 4: Name of the element is left unchanged. In the server settings panel the server text box is
set to localhost, and port number is set to 25. In the mail settings panel Address is set
'shekhar@localhost' which is an email address configured on localhost mail server.
See fig. 8.2
Step 5: An SMTP sampler is added from Edit → Add → Samplers → SMTP Samplers. 'Address
from' field can be set to any value. Here it is set to '[email protected] '.
The address format should be correct.
Step 6: In the message settings of the sampler. The subject of the message is set to 'Subject of the
mail' and message text field is set to 'message of the mail'.
See fig 8.3
Step 7: Another SMTP Sampler is added to the thread group and in the message setting panel, the
value for subject is set to 'Subject for the mail 2' and message is set to 'message for the
mail 2'. See fig 8.4
Step 8: A 'View Results Tree' listener is added to the thread group from Edit → Add → Listeners
→ View Results tree;
Page 67
67
Fig : Thread group
Fig : SMTP Defaults
Page 68
68
Fig : SMTP Sampler 1
Fig : SMTP Smapler2
Page 69
69
Now the Test Plan is ready to be executed. The test plan was run and the results were recorded
Fig : Request for sampler 1
Fig 8.5 shows the result tree for the first samplers. The request shows the message of the mail
sent and the green icon besides the SMTP sampler shows the successful delivery of the message.
The figure 8.6 shows the mail inbox showing the mail received from the first sampler.
Fig : Mail inbox for sampler 1
For Sampler 2:
Page 70
70
Fig- : Request for sampler 2
Fig 8.6 shows the result tree for the first samplers. The request shows the message of the mail
sent and the green icon besides the SMTP sampler shows the successful delivery of the message.
The figure 8.7 shows the mail inbox showing the mail received from the first sampler.
Fig : Mail Inbox : mail from sampler 2
8.3 Automatic TPC-C testing in JMeter
Initially we tested the database by creating one warehouse. Here are the observations of the
experiment.
As is clearly visible from the images shown below, the required tables and procedures with the
required data get generated in the database. The general measure is that for 1 warehouse about
120MB of data is generated in the user‘s database, which gets multiplied depending on the
number of databases.
Page 71
71
Tables generated in the database for Case 1: 1 warehouse
List of routines generated in the database.
Page 72
72
Similarly we extended the test carrying out an experiment with the creation of 33 warehouses.
The following results were observed:
Tables generated in the database for Case 2: 33 warehouses
As can be seen, all the tables have been created successfully with the expected amount of data.
All the five procedures have also been added to the database.
JMeter being a server load testing tool can be used in carrying out preliminary TPC-C testing.
JMeter can create emulated users as the number of threads in it, send transaction requests to the
server, and get the response.
The procedure of the benchmarking tests includes steps which can as well be automated in
JMeter.
A basic preliminary TPCC test would include-
Page 73
73
1. Take the number of warehouses as input from the tester. The database scales up as a factor of
the number of warehouse.
2. Populate the database depending upon the number of warehouse (each warehouse is
approximately 120 MB of data) and store the procedures of transactions as well in the database.
The procedures would include the following-
New order
Payment
Delivery
Order Status
Stock Level
3. Take the no of virtual users from the tester and create the virtual users. A standard TPC-C test
has 10*(number of warehouse) virtual user. A preliminary test can however have less than this
many number of emulated users.
4. Generate the script to include the function calls to generate parameters to be passed to each
transaction procedure.
5. Generate the test script which would include the procedure calls from the database and
simulate the actual transactions.
6. Include the keying and think time for each transaction and test script should include specified
weights of each transaction.
7. Take the ramp up period from the user and start the test.
8. Calculate the total transactions completed per minute and the total new order transactions
completed per minute (tpmC).
9. Output the tpmC to the tester.
A manual test script created in JMeter for TPC-C testing follows.
In the thread group component, the no of virtual users, the ramp up period can be set up and
scheduling of the test can be done.
Page 74
74
23 samples are taken in the test plan.
Page 75
75
10 New_order samplers.
10 Payment samplers
1 delivery sampler
1 order_status sampler.
1 stock_level sampler.
A Random Order Controller has been included in the test plan. It will execute all the samples
within it in a random order, making sure each sample is executed only once.
In the JDBC Connection Configuration, the connection parameters are given.
The url, username, password and database name is given.
Page 76
76
As a child of each sampler, keying time and think time timers are included.
The Keying time is a constant timer for each transaction. The values are-
New order – 18 sec
Payment – 3 sec
Delivery – 2 sec
Order Status – 2 sec
Stock level – 2 sec
The generation of parameters for calling each procedure also takes some time, so we have
reduced 1 sec from each keying time and fed to the timer.
Page 77
77
The think time has a constant mean value. So, the Guassian Random Timer is used here. We
specify the mean value think time for the transaction as the constant delay offset.
The mean think time for the transactions are-
New order – 12 sec
Payment – 12 sec
Delivery – 10 sec
Order Status – 5 sec
Stock level – 5 sec
Page 78
78
The above is a snapshot of one of the transactions- Payment.
The transaction is called as a callable statement procedure from a jdbc sampler. The procedure
takes 30 parameters. The IN parameters values are calculated from calling functions stored in
JMeter. The functions required to be called have been created and stored in Jmeter functions
directory and as a result are listed in the Function Helper Tool of Jmeter and can be selected from
here also.
Page 79
79
Some functions shown,e.g. _getItemID , _getLastName, _getNURandLNameRun,
_GetWarehouseID, etc. have been added to the list.
Page 80
80
The Jmeter source hierarchy, where the files have been added in the functions directory. A total
of 15 new functions classes have been added here to get the required functionality needed to
create the parameters to call the procedures.
Page 81
81
As can be seen in the request sent, all the functions have been resolved at runtime and the actual
values are being sent.
The response data gives the values of all the OUT and INOUT parameters of the procedures.
Page 82
82
The aggregate report gives the above metrics. The throughput gives the actual benchmark
metrics. The no of new order transactions completed per min is the required value, tpmC.
As we can see all the procedures have a success status.
Page 83
83
This is the Jmeter plugin, Transactions per second. As we can see it gives a nice distribution of
the transactions over time. It can be used to have a better visualization of the transactions taking
place.
8.4 Test Plan : Demonstration of the working of “Bandwidth Throttling” in
jmeter.
Aim : A test plan to demonstrate the working of Bandwidth Throttling in Apache Jmeter.
Procedure : The procedure to create a test plan to describe the working of Bandwidth throttling is
described below
Step 1: Two thread group were added in the test plan. Number of threads in each thread group
were set to 5 with loop counts also as 5.
Step 2: In each thread group a HTTP request default config element were added. In one of the
config element value of bandwidth is set to 1KBps and in the other config element of the
other thread group the value of bandwidth was set to 1MBps and server of both of the
config element was set to www.acmnitjsr.org
Step 4: In each of the thread group an http sampler was added
Page 84
84
Step 3: In each of the thread group two types of visualizers were added, one was View results
tree and aggregate report.
The complete test plan has been shown in the figure given below
Fig: Test Plan hierarchy for Bandwidth Throttling demonstration
Page 85
85
Fig : HTTP request Defaults for thread group 1
Fig : Http Requests Defaults for Thread group 2
Page 86
86
The Http Smaplers were used to set the proxy settings which is required for Internet access. Both
the samplers were provided with same proxy settings.
There were a total of 5 threads and 5 iterations in the test plan for each thread group. As the
result table shows that the first thread group has completed with its 25 samples while there are 5
threads still running ( rightmost top corner in the figure.) which belong to the first thread group
as shown in the fig:8.3.5. Hence the thread group with higher bandwidth completed early. There
were25 samples in all as there were 5 threads and 5 loop count and only one smapler. It can be
seen in the figure that the first thread started at 15:03:36 and last thread started at 15:03:44. So
there was a small difference of 8 seconds for the first thread group which is due to large available
bandwidth to the thread group 1. As one can see that the 25 samples for the first thread group
have completed the request while the 5 thread for thread group 2 are still running in background.
So thread group 1 has finished the work.
Fig : View Results table listener for the first thread group.
Page 87
87
Fig : View Results table listener for the second thread group.
Now all the threads have stopped for the first thread group. In comparing the table results for the
thread group one can easily see the difference in the latency in the response recieved for the two
thread groups although the threads of the two thread groups started at the same time. There is one
more significant difference with in the two results tree. The first thread group ran from 15:03:36
(start time for first thread for first group) to 15:03:44 (start time for last thread for first thread
group) , a total time of 8 seconds where the bandwidth was 1MBps. While the second thread
group ran from 15:03:36 ( start time for first thread for thread group 2) to 15:05:48 (start time for
last thread of second group), a total time of 2 minutes 12 seconds, where the bandwidth is 1Bps.
Clearly there is difference in between the two tread groups as the response with lower bandwidth
takes more time than one with higher bandwidth.
Aggregate report for thread group 1
Page 88
88
Fig : Aggregare report for Thread group1
Aggregate report for thread group 2
Fig : Aggregare report for Thread group1
The aggregate reports for the thread group clearly shows the difference once more. There is large
difference between the average median, throughput for the thread groups. The throughput as
number of requests per second is 3.0/sec for 1st thread group while it is 9.1/min (0.151/sec). Also
throuput in terms of KB/sec is 42.1 for 1st thread group and just 2.1 for the second thread group.
Note : The throughput is for all 25 samples as aggregate.
Hence with in the same instance of jmeter in a single test plan we were able to add two thread
groups that ran at different bandwidths and the results were as expected.
8.5 Test Plan : Demonstration of the working of “Dynamic Bandwidth
Throttling” in jmeter.
Aim : A test plan to demonstrate the working of Dynamic Bandwidth Throttling in Apache
Jmeter.
Procedure : The procedure to create a test plan to describe the working of Dynamic Bandwidth
throttling is described below
Step 1 : A thread group was added to the test plan. The number of threads was set to 1000. Ramp
up period was set to 0 and Loop count was set to 1 as shown in the figure 8.4.1
Step 2: Under the thread group, an http request default was added where the option for dynamic
bandwidth throttling was selected and the value for bandwidth, minimum applicable
bandwidth and maximum permissible error were specified and the values for the test
Page 89
89
plan were 1024000 cps, 1024cps, 7% respectively. The response timeout period was set
to 22seconds As shown in figure 8.4.2
Step 3: Under the thread group of the test plan a complete transaction on the jpetstore web
application was recorded using a proxy server under the workbench option of Jmeter.
This transaction included 11 test pages which added 11 http samplers in the test plan.
Step 4: 3 Types of visualizers were added to verify the results.
Fig : Dynamic Bandwidth Throttling test plan
Fig : Dynamic bandwidth throttling specifications in HTTP Request Defaults
Page 90
90
According to the test plan, Jmeter should normaly use a bandwidth connection of 1MBps as
specified in HTTP Request Default but when the percentage error crosses the threshold value of
7%, the available bandwidth should continue to decrease until either the error percentage comes
under control or the bandwidth gets reduced to the minimum applicable bandwidth as specified
in the test plan. The plan should count an error, if the sampler does not gets a response in
22seconds or does not gets response due to any other reason.
The test plan was created successfully using the steps described above. The test was run and the
results from the samplers were recorded to verify the results. The values specified in the test plan
were chosen so that complete variations in the test plan can shown using this test only.
Aggregate report for the test plan is shown in figure below.
Fig : Aggregate report for dynamic bandwidth throttling
The aggregate report for the specified test plan shows the detailed description of the test with
number of samples per http sampler, average, median, percentage error in the samplers,
throughput and the throughput in KB/sec. As shown in figure 8.4.3 the test starts with all 1000
threads running together. The initial samplers reported 0 percent(approx.) errors, but as the test
plan proceeded further the number of error increased due to increase in load on the server. In this
situation the server is not able to respond to the requests in time alloted and jmeter reports
response timeout error. As the test plan proceeds further first an increase, then decrease and again
Page 91
91
increase in the throughput in KB/sec can seen the figure above. This event corresponds to the
change in the error percentage which is varying on the basis of the changing bandwidth at the
background.
The varying bandwidth is shown in the figure below
Fig : Jmeter log image 1
In the figure 8.4.4 , the log of jmeter has been shown which records the change in percentage
error as well as applicable bandwidth for jmeter. It can be seen from the figure that during the
initial stage of the test the error is below 7%, the specified threshold so jmeter is using the full
available bandwidth which was 1MBps. But as the error crosses the threshold, the bandwidth
Page 92
92
starts decreasing upto the minimum applicable bandwidth ie 1024 Bps and remains constant
from there onwards because the error is still above 7%.
Fig : Jmeter log image 2
The second image of the Jmeter log shows the increasing bandwidth during the test run. In the
figure above it can be seen that when the percentage error goes below the 7% margin the
bandwidth available is full quota is regained. As the figure of percentage error gets to 6.9990 %
the bandwidth is throttled to 1MBps again. This means that once the errors are under control the
full bandwidth is made available to the jmeter samplers.
The third image of the Jmeter log fig 8.4.6 is the continuation of the same log file consisting the
previously run test plan. In this image also the bandwidth is again decreasing with the percentage
error crossing the threshold value. This time also the value of the bandwidth starts degrading
only when the percentage error has crosses 7 % mark and keeps on degrading until it reaches the
minimum applicable bandwidth.
Page 93
93
Fig Jmeter log image 3
Hence using the three figures shown from the jmeter log we get the idea, how the bandwidth is
varying dynamically at the runtime based on the value of percentage error in the samplers.
Page 94
94
Chapter 9
Technical Details
9.1 Auto CSV Generation
FILE PATH DESCRIPTION
DataSourceElement.java JMeter\src\protocol\JDBC\org\apac
he\jmeter\protocol\JDBC\autoCSV
_jdbcConfig
It has the main code – logic
for generating the .csv file
from table, using query. It
also takes care that the .csv is
generated at ―bin‖ folder of
The JMeter file being
presently used.
DataSourceElementBeanI
nfo.java
JMeter\src\protocol\JDBC\org\apac
he\jmeter\protocol\JDBC\autoCSV
_jdbcConfig
It has the code for defining
the GUI of the new Config
Element. It links the user
entered text to main logic of
the Config Element.
DataSourceElementResou
rces.properties
JMeter\src\protocol\JDBC\org\apac
he\jmeter\protocol\JDBC\autoCSV
_jdbcConfig
This properties file holds the
variable names and short
description of all the
elements used in the code
and GUI of ―Äuto CSV
Generation‖.
9.2 Filtered Results Listener Plugin
FILE PATH DESCRIPTION
TableVisualizer.
java
JMeter\src\components\
org\apache\jmeter\visual
izers
This class implements a statistical analyser that
calculates both the average and the standard
deviation of the sampling process. The samples are
displayed in a JTable.
Page 95
95
AbstractVisualiz
er.java
JMeter\src\core\org\apac
he\jmeter\visualizers\gui
This is the base class for JMeter GUI components
which can display test results in some way.
ObjectTableMo
del.java
JMeter\src\jorphan\org\a
pache\jorphan\gui
The ObjectTableModel is a TableModel whose
rows are objects; columns are defined as Functors
on the object.
9.3 SMTP Defaults
FILE Package Description
SmtpConfigG
ui.java
org.apache.jmeter.proto
col.smtp.config.
gui
A java class that generates GUI for 'SMTP Defaults'
config element. A new package config was added
under org.apache.jmeter.protocol.smtp package
and under this a new package gui was created where
this file was placed
SmtpSampler.j
ava
org.apache.jmeter.
protocol.smtp.sampler
Added the smtp config class name in the smtp
sampler so that config element is identified by the
sampler.
Message.prope
rties
Org.apache.jmeter.resou
rces
Added SMTP defaults as title name for the Smtp
config element
9.4 Automating TPC-C tests in JMETER
FILE PATH DESCRIPT
ION
Counter_tpcc.java JMeter\src\functions\org\apache\jmeter\funct
ions
This class
generates
Page 96
96
the fixed
warehouse
number for a
thread.
Counter_tpcc_dist.java JMeter\src\functions\org\apache\jmeter\funct
ions
This class
generates
the district
ID for a
thread.
Getbyname.java JMeter\src\functions\org\apache\jmeter\funct
ions
This class
generates a
flag
indicating
the use of
name in the
query.
getCurrentTimetpcc.java JMeter\src\functions\org\apache\jmeter\funct
ions
Gives the
current
timestamp.
GetCustomerID.java JMeter\src\functions\org\apache\jmeter\funct
ions
Generates a
customer ID
for thread.
GetItemID.java JMeter\src\functions\org\apache\jmeter\funct
ions
Generates
an Item ID
for thread.
GetLastName.java JMeter\src\functions\org\apache\jmeter\funct
ions
Generates a
customer
last name.
GetNonUniformRandomLastName
ForLoad.java
JMeter\src\functions\org\apache\jmeter\funct
ions
Generates a
non uniform
random last
name for
database
loading.
getNonUniformRandomLastNameF
orRun.java
JMeter\src\functions\org\apache\jmeter\funct
ions
Generates a
non uniform
random last
name for run
Page 97
97
time.
GetWarehouseID.java JMeter\src\functions\org\apache\jmeter\funct
ions
Generates a
remote
warehouse
number.
nonUniformRandom.java JMeter\src\functions\org\apache\jmeter\funct
ions
Generates a
non uniform
random
number.
Randomnstr.java JMeter\src\functions\org\apache\jmeter\funct
ions
Generates a
random
string of n
characters.
.
RandomNumbertpcc.java JMeter\src\functions\org\apache\jmeter\funct
ions
Generates a
random
number.
RandomStringtpcc.java JMeter\src\functions\org\apache\jmeter\funct
ions
Generates a
random
string.
TPCCSampler.java JMeter\src\components\org\apache\jmeter\sa
mpler
This class
implements
the TPC-C
sampler
logic and
calls other
related
classes.
TPCCSampleGUI.java JMeter\src\components\org\apache\jmeter\sa
mpler\gui
Contains the
GUI of the
TPC-C
Sampler.
Creator.java JMeter\src\components\org\apache\jmeter\sa
mpler\tpcc
Creates the
TPC-C
database
schema and
procedures.
jTPCCConfig.java JMeter\src\components\org\apache\jmeter\sa
mpler\tpcc
It initializes
all the
Page 98
98
configuratio
n elements
for the
population
of data.
TPCCConstants.java JMeter\src\components\org\apache\jmeter\sa
mpler\tpcc
It defines all
the
constants
used in other
TPC-C
classes.
TPCCLoader.java JMeter\src\components\org\apache\jmeter\sa
mpler\tpcc
It initiates
the actual
population
of database
tables.
TPCCUtil.java JMeter\src\components\org\apache\jmeter\sa
mpler\tpcc
It defines
functions to
be used
during the
population
of fields in
TPC-C
database
tables.
RandomGenerator.java JMeter\src\components\org\apache\jmeter\sa
mpler\tpcc.util
It has
random
generator
class and
functions.
Customer.java JMeter\src\components\org\apache\jmeter\sa
mpler\tpcc.pojo
It contains
the
description
of elements
and return
types of
Customer
table.
District.java JMeter\src\components\org\apache\jmeter\sa It contains
Page 99
99
mpler\tpcc.pojo the
description
of elements
and return
types of
District
table.
History.java JMeter\src\components\org\apache\jmeter\sa
mpler\tpcc.pojo
It contains
the
description
of elements
and return
types of
History
table.
Item.java JMeter\src\components\org\apache\jmeter\sa
mpler\tpcc.pojo
It contains
the
description
of elements
and return
types of
Item table.
NewOrder.java JMeter\src\components\org\apache\jmeter\sa
mpler\tpcc.pojo
It contains
the
description
of elements
and return
types of
NewOrder
table.
Order.java JMeter\src\components\org\apache\jmeter\sa
mpler\tpcc.pojo
It contains
the
description
of elements
and return
types of
Order table.
OrderLine.java JMeter\src\components\org\apache\jmeter\sa
mpler\tpcc.pojo
It contains
the
Page 100
100
description
of elements
and return
types of
OrderLine
table.
Stock.java JMeter\src\components\org\apache\jmeter\sa
mpler\tpcc.pojo
It contains
the
description
of elements
and return
types of
Stock table.
Warehouse.java JMeter\src\components\org\apache\jmeter\sa
mpler\tpcc.pojo
It contains
the
description
of elements
and return
types of
Warehouse
table.
9.5 Bandwidth Throttling
FILE Package Description
HttpDefaultsGui.java org.apache.jmeter.proto
col.http.config.gui
This java consists of the Http config element,
New lines were appended to add bandwidth
throttling gui in it.
HttpSamplerBase.java org.apache.jmeter.proto
col.http.sampler
This is a base class inheriting all the
samplers in jmeter. This java file is used to
set static variables for the samplers
Page 101
101
HTTPAbstractImpl
.java
org.apache.jmeter.proto
col.http.sampler
This is the base class for http sampler.
Functions to get bandwidth value were
added.
HTTPHC4Impl
.java
org.apache.jmeter.proto
col.http.sampler
This class class uses another class to
implement the slow protocol
9.6 Dynamic Bandwidth Throttling
FILE Package Description
HttpDefaultsGui.java org.apache.jmeter.proto
col.http.config.gui
This java consists of the Http config element,
New lines were appended to add bandwidth
throttling gui in it.
HttpSamplerBase.java org.apache.jmeter.proto
col.http.sampler
This is a base class inheriting all the samplers
in jmeter. This java file is used to set static
variables for the samplers
HTTPAbstractImpl
.java
org.apache.jmeter.proto
col.http.sampler
This is the base class for http sampler.
Functions to get bandwidth value were added.
HTTPHC4Impl
.java
org.apache.jmeter.proto
col.http.sampler
This class class uses another class to
implement the slow protocol
Along with the files mentioned in this section, the message.properties in the package
org.apache.jmeter.resources has been referenced and modified in all sections mentioned in this
chapter.
Page 102
102
Challenges
Making Runtime changes in Jmeter
1. Making runtime changes in Jmeter is a very difficult task. The architecture of Jmeter is
not meant to easily support runtime changes. Runtime changes could only be
incorporated in dynamic bandwitdth throttling component added in Jmeter.
Vast architecture of Jmeter
2. Jmeter source code includes above 5770 classes. Going through the object hierarchy of
Jmeter and understanding its working was a very difficult task.
Incorporating new features
3. Any new feature to be included in Jmeter must follow the same modular design as is
already existing in present application and must be in synchronization with them.
Finding loopholes in present Jmeter application
4. Extensive study and testing on the application was done to find out the loopholes
currently present in Jmeter so that we could work on them as a part of Enhancement of
Jmeter.
Future Work and Conclusion
The basic aim of the project was to pave way for a user-friendly and an enhanced Jmeter
application with introduction of some additional features. The task has been successfully
completed by the team and all the above mentioned features and characteristics have been
incorporated in the project. The future work regarding this project can be:
1. Incorporating other Benchmarking support such as TPC-H, TPC-APP etc. into Jmeter.
2. Automation of the test scripts, as in user may not have to create the test script, and Jmeter
can itself do it for the tester by techniques such as web crawling, etc.
3. The instability of Jmeter on large loads could be worked out with some solution.
4. Bringing large download efficiency into Jmeter.
5. Better analysis of the results produced by Jmeter via some complex graphs and better
comparison between different graph results.
Page 103
103
Frequently asked Questions
Q.) What to do in case there is a specific error occurring in Jmeter?
The Jmeter developers group are available in Jmeter forum online to answer to specific queries
of Jmeter users and developers.
Q.) From where should we start reading Jmeter to understand the use and working?
The Jmeter user‘s manual and component reference are a good point to start with. Also, a book
by Emily H. Hallili on understanding and performing tests on JMeter named ―Apache JMeter: A
practical beginner's guide to automated testing and performance measurement for your websites‖
could be a good help.
Q.) How to start developing Jmeter?
Import Jmeter on Eclipse and build with ant. Any changes done for enhancement of Jmeter can
then be visualised in the application on running it, paving way for its development.
Page 104
104
References
1. http://hammerora.sourceforge.net/
2. http://docs.openlinksw.com/virtuoso/tpcc.html
3. http://www.tpc.org/tpcc/
4. http://oltpbenchmark.com
5 http://jmeter.apache.org/
6. "Apache JMeter: A practical beginner's guide to automated testing and
performance measurement for your websites"- Emily H. Hallili
7. www.tpc.org/information/sessions/sigmod/sigmod97.ppt
8. www.tpc.org/tpcc/spec/tpcc_current.pdf
9. http://globalsp.ts.fujitsu.com/dmsp/Publications/public/Benchmark_Overview_TP
C-C.pdf
10. http://gauravmutreja.wordpress.com/2011/10/13/exporting-your-database-to-csv-
file-in-java/
11. http://blackanvil.blogspot.in/2006/06/shootout-load-runner-vs-grinder-vs.html
12. http://jmeter.apache.org/usermanual/component_reference.html#introduction
13. http://www.code.google.com/p/jmeter-plugins/
14. http://shantonusarker.blogspot.in/2013/05/introdution-to-jmeter-google-
plugin.html
15. http://www.methodsandtools.com/tools/jmeterplugins.php/