energies Article Enhancement of Power System Stability Using a Novel Power System Stabilizer with Large Critical Gain Ziquan Liu, Wei Yao * and Jinyu Wen State Key Laboratory of Advanced Electromagnetic Engineering and Technology, School of Electrical and Electronic Engineering, Huazhong University of Science and Technology, Wuhan 430074, China; [email protected] (Z.L.); [email protected] (J.W.) * Correspondence: [email protected]; Tel.: +86-136-5724-7542 Academic Editor: Akhtar Kalam Received: 2 February 2017; Accepted: 23 March 2017; Published: 1 April 2017 Abstract: Power system stabilizers (PSSs) are widely used for suppressing low frequency oscillations in practical power systems. However, according to the requirement of the “guide for setting test of power system stabilizer” of China, PSS gain is limited to no more than 1/3 of its critical gain. As a result, PSSs may not provide enough damping to the inter-area mode oscillations. Through analyzing the Heffron-Phillips (H-P) model of the generator with PSS, it is found that exciter mode will become unstable when PSS exceeds its critical gain. This exciter mode is formed by the natural characteristic of the exciter-PSS loop. To address this problem, a novel PSS with a parallel component added to the conventional PSS is proposed to improve its critical gain. Therefore, large gain can be chosen for the proposed PSS to meet the critical gain requirements of the guide and provide enough damping to the inter-area modes simultaneously. Simulation results on the Ximeng coal power station of China verify the effectiveness of the proposed PSS. Keywords: low frequency oscillation; exciter mode; critical gain; power system stabilizer; excitation system 1. Introduction The interconnection of regional power systems makes the stability of a large-scale power system increasingly important and challenging [1]. Since the power generation sources are usually far away from the load centers in China, huge power need to be delivered from the north or southwest to east China through long transmission lines [2–4]. This situation may increase the risk of low frequency oscillations (LFOs) occurring [5]. Thus, damping of inter-area low-frequency oscillations is one of the main concerns in the operation of such power system [6,7]. PSS is a cost-effective way to suppress LFO [8,9]. To improve the performance and adaptability of PSS, lots of intelligent optimization algorithms, such as genetic algorithm [10], grey wolf optimization [11], adaptive particle swarm optimization [12], culture particle swarm optimization co-evolutionary algorithm [13], have been applied for tuning the parameters of PSSs. However, these methods are based on an accurate model of the power system, which is hard to obtain for a practical power system. Moreover, numerous advanced control techniques, such as robust control [14], linear matrix inequality approach [15,16], synergetic control approach [17,18], are proposed to design PSSs, but the structure and parameter tuning of these controllers are far more complicated than those of the conventional PSS (CPSS) and hence not preferred by the engineers and transmission system operators. Consequently, the CPSSs are widely used in the practical power system and still tuned individually by phase compensate method in China [5,19]. Energies 2017, 10, 449; doi:10.3390/en10040449 www.mdpi.com/journal/energies
Transcript
energies
Article
Enhancement of Power System Stability Using aNovel Power System Stabilizer with LargeCritical Gain
Ziquan Liu, Wei Yao * and Jinyu Wen
State Key Laboratory of Advanced Electromagnetic Engineering and Technology, School of Electrical andElectronic Engineering, Huazhong University of Science and Technology, Wuhan 430074, China;[email protected] (Z.L.); [email protected] (J.W.)* Correspondence: [email protected]; Tel.: +86-136-5724-7542
Academic Editor: Akhtar KalamReceived: 2 February 2017; Accepted: 23 March 2017; Published: 1 April 2017
Abstract: Power system stabilizers (PSSs) are widely used for suppressing low frequency oscillationsin practical power systems. However, according to the requirement of the “guide for setting test ofpower system stabilizer” of China, PSS gain is limited to no more than 1/3 of its critical gain. As aresult, PSSs may not provide enough damping to the inter-area mode oscillations. Through analyzingthe Heffron-Phillips (H-P) model of the generator with PSS, it is found that exciter mode will becomeunstable when PSS exceeds its critical gain. This exciter mode is formed by the natural characteristicof the exciter-PSS loop. To address this problem, a novel PSS with a parallel component added to theconventional PSS is proposed to improve its critical gain. Therefore, large gain can be chosen for theproposed PSS to meet the critical gain requirements of the guide and provide enough damping tothe inter-area modes simultaneously. Simulation results on the Ximeng coal power station of Chinaverify the effectiveness of the proposed PSS.
Keywords: low frequency oscillation; exciter mode; critical gain; power system stabilizer;excitation system
1. Introduction
The interconnection of regional power systems makes the stability of a large-scale power systemincreasingly important and challenging [1]. Since the power generation sources are usually far awayfrom the load centers in China, huge power need to be delivered from the north or southwest to eastChina through long transmission lines [2–4]. This situation may increase the risk of low frequencyoscillations (LFOs) occurring [5]. Thus, damping of inter-area low-frequency oscillations is one of themain concerns in the operation of such power system [6,7].
PSS is a cost-effective way to suppress LFO [8,9]. To improve the performance and adaptabilityof PSS, lots of intelligent optimization algorithms, such as genetic algorithm [10], grey wolfoptimization [11], adaptive particle swarm optimization [12], culture particle swarm optimizationco-evolutionary algorithm [13], have been applied for tuning the parameters of PSSs. However, thesemethods are based on an accurate model of the power system, which is hard to obtain for a practicalpower system. Moreover, numerous advanced control techniques, such as robust control [14], linearmatrix inequality approach [15,16], synergetic control approach [17,18], are proposed to design PSSs,but the structure and parameter tuning of these controllers are far more complicated than those of theconventional PSS (CPSS) and hence not preferred by the engineers and transmission system operators.Consequently, the CPSSs are widely used in the practical power system and still tuned individually byphase compensate method in China [5,19].
However, PSS may have limitations in suppressing LFO under certain circumstances [20,21].Especially in a bulk power transmission system, PSSs may not provide enough damping to inter-areamodes even if they are properly tuned according to the “Guide for setting test of power systemstabilizer” standard of China [19]. To let PSSs provide sufficient damping to the concerned oscillations,larger gain is required for the PSSs.
Unfortunately, further increase of the PSS gain may decrease the damping of other modes andresults in divergent oscillations [22]. Thus, PSS gain has certain limitations in suppressing LFO. Thesetting gain of PSS is recommended to be chosen about 1/3 of its critical gain [23–25]. Therefore, PSSgain is required to be no more than 1/3 of its critical gain in the “Guide for setting test of power systemstabilizer” [19]. That is to say, in a bulk power transmission system, the chosen gain of PSS may not belarge enough to provide sufficient damping to the inter-area modes owing to the upper limitation ofthe critical gain.
To address this problem, mechanism analysis is needed to find out the crucial factors of PSS criticalgain. A new PSS with larger critical gain is also required to provide sufficient damping to the inter-areamodes in such systems. This paper analyzes the above problem and solutions are also provided toenhance the performance of PSS in suppressing inter-area oscillations. The main contributions of thispaper are as follows:
1. Mechanism analysis of the phenomenon that PSS may not provide enough damping to inter-areamodes due to the limitation of its critical gain is carried out. The analysis results reveal that thedamping of exciter mode oscillation limits the critical gain of PSS. The increase of PSS gain maycause unstable exciter mode oscillations because of the natural frequency characteristics of PSSand excitation system.
2. A novel PSS (NPSS) is proposed by adding a parallel component on CPSS. It has better phasecharacteristics in the frequency range of exciter modes so that damping of exciter modes isenhanced. As a result, the critical gain of the NPSS is significantly improved so that NPSS canprovide sufficient damping to inter-area modes by increasing its gain.
3. Validations of the analysis and control are undertaken by small signal analysis and time domainsimulations in the Ximeng bulk power transmission system. Results verify the correctness of theanalysis and the effectiveness of the NPSS control. Thus, the problem is solved satisfactorily.
The rest of the paper is organized as follows. The critical gain problem of PSS is described andanalyzed in Section 2. Section 3 introduces the structure and parameter setting of the proposed PSS.Case studies are undertaken based on the Ximeng coal power station of China in Section 4. Conclusionsare drawn in Section 5.
2. Analysis of the Power System Stabilizer Critical Gain Problem
2.1. Problem Phenomenon
The phenomenon of PSS critical gain problem is described in detail in this subsection. Criticalgain is the largest gain of a controller that can maintain a system stable. PSS exceeding its critical gainwill cause unstable oscillations. In order to ensure enough stability margin for the PSS control, its gainis restricted to under a certain proportion of its critical gain. According to the “Guide for setting test ofpower system stabilizer”, the regulation about putting a PSS into operation is that the PSS gain shouldbe no more than 1/3 of its critical gain.
However, the PSS whose gain is determined according to this regulation may not always provideenough damping to inter-area modes. For example, in the Ximeng coal power station of China, if oneof the two 1000 kV AC transmission lines from Ximeng to Beijing is tripped because of a three phaseshort circuit fault, there will occur an inter-area oscillation in the system. Although all the generatorsare equipped with properly tuned PSSs, power plants in Ximeng will still oscillate against North ChinaPower Grid with a small damping ratio.
Energies 2017, 10, 449 3 of 15
In that case, the larger gain is required for all these PSSs to provide sufficient damping to thisinter-area oscillation. But if the PSS gain is increased to provide more damping, it will certainly exceed1/3 of its critical gain. This situation violates the regulations in the guide and the PSS cannot beput into operation. Moreover, turbine governor system may also bring negative damping torque todecrease the damping of the LFO [26], and make this contradiction more serious.
2.2. Problem Mechanism
In order to solve this problem, PSS is required to have higher critical gain to maintain flexibilityand adaptability in suppressing LFO. Thus, it is important to investigate the mechanism of destabilizingeffect to the system caused by the increase of PSS gain.
In the following analysis, a self-shunt excitation system with CPSS is used because it is commonlyused for a large capacity generator unit. Under such condition, when PSS gain exceeds its critical gain,it will cause an unstable oscillation in the frequency range of 3–8 Hz. By using eigenvalue analysis, thisoscillation mode is related to the state variables of PSS and exciter. Thus, it is called exciter mode. Thatis to say, the increase of PSS gain will cause unstable exciter mode oscillation. Characteristics of theexciter mode can be analyzed by using the Heffron-Phillips (H-P) model of the third-order generatorincluding PSS shown in Figure 1 [8]. The definition of the parameters can be found in [8]. Ge(s) is thetransfer function of the exciter and Gpss(s) is the transfer function of PSS. It can be seen that exciteris in the loop of ∆Me2, thus it is reasonable to study the characteristics of exciter mode on this loop.It is called exciter-PSS loop in the later text. This loop is divided into two parts, part 1 is the transferfunction from −∆Pe to ∆us, and part 2 is the transfer function from ∆Uref to ∆Me2.
Energies 2017, 10, 449 3 of 14
In that case, the larger gain is required for all these PSSs to provide sufficient damping to this
inter-area oscillation. But if the PSS gain is increased to provide more damping, it will certainly
exceed 1/3 of its critical gain. This situation violates the regulations in the guide and the PSS cannot
be put into operation. Moreover, turbine governor system may also bring negative damping torque
to decrease the damping of the LFO [26], and make this contradiction more serious.
2.2. Problem Mechanism
In order to solve this problem, PSS is required to have higher critical gain to maintain
flexibility and adaptability in suppressing LFO. Thus, it is important to investigate the mechanism
of destabilizing effect to the system caused by the increase of PSS gain.
In the following analysis, a self-shunt excitation system with CPSS is used because it is
commonly used for a large capacity generator unit. Under such condition, when PSS gain exceeds its
critical gain, it will cause an unstable oscillation in the frequency range of 3–8 Hz. By using
eigenvalue analysis, this oscillation mode is related to the state variables of PSS and exciter. Thus, it
is called exciter mode. That is to say, the increase of PSS gain will cause unstable exciter mode
oscillation. Characteristics of the exciter mode can be analyzed by using the Heffron-Phillips (H-P)
model of the third-order generator including PSS shown in Figure 1 [8]. The definition of the
parameters can be found in [8]. Ge(s) is the transfer function of the exciter and Gpss(s) is the transfer
function of PSS. It can be seen that exciter is in the loop of ΔMe2, thus it is reasonable to study the
characteristics of exciter mode on this loop. It is called exciter-PSS loop in the later text. This loop is
divided into two parts, part 1 is the transfer function from −ΔPe to Δus, and part 2 is the transfer
function from ΔUref to ΔMe2.
1
sJ
T
0
s
5 4( )
eK K G s
1K
(s)pss
G
6K
3
3 01 ' s
d
K
K T(s)
eG
2K
su
e
P
2eM
1eM
refU 0
Part 1
Part 2 Exciter-PSS
loop
Figure 1. The Heffron-Phillips (H-P) model of the third-order generator including Power system
stabilizer (PSS).
In part 1, transfer function Gp(s) is paralleled with transfer function Gpss(s), where Gp is
represented as:
04
p 5
e
( )( )
KG s K
G s s
(1)
Since the magnitude of Gp(s) is far less than that of Gpss(s) in the frequency range of 3–8 Hz, the
influence of Gp(s) can be neglected. Note that the negative sign of −ΔPe is moved to Δus in Figure 1
in the later analysis, thus the sign of Δus is regarded as negative later.
The phase-frequency characteristic of part 2 is shown in Figure 2a. The PSS mainly compensate
the phase lag of excitation system in the frequency range of 0.2–2.5 Hz. The phase-frequency
characteristic of part 1 is shown in Figure 2b. It can be seen that the phase of part 1 and part 2
decrease monotonically and the sum of their phase lag will cross −180°in the frequency range of 3–8
Hz, as is shown in Figure 2c. The frequency that the phase lag crosses −180° is fc. Taking into
account the negative sign of −ΔPe, an oscillation with the frequency of fc injecting from the position
of Uref will have the same phase when feeds back to signal us after passing part 2 and part 1. If the
magnitude response of the loop reaches 0 dB at fc, it indicates that the feedback signal oscillates the
Figure 1. The Heffron-Phillips (H-P) model of the third-order generator including power systemstabilizer (PSS).
In part 1, transfer function Gp(s) is paralleled with transfer function Gpss(s), where Gp isrepresented as:
Gp(s) =(
K5 +K4
Ge(s)
)ω0
s(1)
Since the magnitude of Gp(s) is far less than that of Gpss(s) in the frequency range of 3–8 Hz, theinfluence of Gp(s) can be neglected. Note that the negative sign of −∆Pe is moved to ∆us in Figure 1 inthe later analysis, thus the sign of ∆us is regarded as negative later.
The phase-frequency characteristic of part 2 is shown in Figure 2a. The PSS mainly compensate thephase lag of excitation system in the frequency range of 0.2–2.5 Hz. The phase-frequency characteristicof part 1 is shown in Figure 2b. It can be seen that the phase of part 1 and part 2 decrease monotonicallyand the sum of their phase lag will cross −180◦ in the frequency range of 3–8 Hz, as is shown inFigure 2c. The frequency that the phase lag crosses −180◦ is f c. Taking into account the negative signof −∆Pe, an oscillation with the frequency of f c injecting from the position of Uref will have the samephase when feeds back to signal us after passing part 2 and part 1. If the magnitude response of the
Energies 2017, 10, 449 4 of 15
loop reaches 0 dB at f c, it indicates that the feedback signal oscillates the same as the input signal.It means an oscillation with the frequency of f c will not decay in the closed loop system. In otherwords, an unstable exciter mode oscillation with the frequency of f c will occur in the system. Thus, theloop will reach its critical gain.
Energies 2017, 10, 449 4 of 14
same as the input signal. It means an oscillation with the frequency of fc will not decay in the closed
loop system. In other words, an unstable exciter mode oscillation with the frequency of fc will occur
in the system. Thus, the loop will reach its critical gain.
0 2 4 6 8 10-180
-135
-90
-45
0
45
-180
-135
-90
-45
0
-90
-45
0
45
90
0 2 4 6 8 10
Frequency(Hz)
Ph
ase
(deg
)
Frequency(Hz) Frequency(Hz)
-225
fc
-2700 2 4 6 8 10
0 2 4 6 8 10-180
-135
-90
-45
0
45
-180
-135
-90
-45
0
-90
-45
0
45
90
0 2 4 6 8 10
Frequency(Hz)
Ph
ase
(deg
)
Frequency(Hz) Frequency(Hz)
-225
fc
-2700 2 4 6 8 10
0 2 4 6 8 10-180
-135
-90
-45
0
45
-180
-135
-90
-45
0
-90
-45
0
45
90
0 2 4 6 8 10
Frequency(Hz)
Ph
ase
(deg
)
Frequency(Hz) Frequency(Hz)
-225
fc
-2700 2 4 6 8 10
(a) (b) (c)
Figure 2. Phase response of the exciter-PSS loop. (a) Phase characteristics from ΔUref to ΔMe2; (b)
phase characteristics from –ΔPe to Δus; and (c) the sum of phase lag of part 1 and part 2.
To sum up, the increase of the PSS gains will increase the damping ratio of LFOs while at the
same time it will decrease the damping ratio of exciter mode. This phenomenon is caused by the
phase-frequency characteristics of the exciter-PSS loop in the frequency range of 3–8 Hz. When PSS
reaches its critical gain, it will form a positive feedback on the exciter-PSS loop. Therefore, an
unstable exciter mode oscillation will occur in the system. In other words, damping of exciter mode
oscillation restricts the critical gain of PSS, which further limits the gain of PSS. Consequently, the
damping provided by PSS to inter-area modes will be insufficient. Therefore, the PSS should have a
higher critical gain to ensure that the PSS can provide enough damping to the inter-area modes.
3. Design of the Novel Power System Stabilizer with High Critical Gain
3.1. Structure of the Novel Power System Stabilizer
According to the theoretical analysis in Section 2, it is known that characteristic of exciter mode
is determined by the frequency characteristics of exciter-PSS loop. This loop is formed by part 1 and
part 2 in Figure 1. To improve the damping of exciter mode oscillation, the phase-frequency
characteristics of the exciter-PSS loop on high frequencies should be improved. Considering output
of part 2 is generator active power, it is hard to put a supplementary control parallel with part 2.
But output of part 1 is that of PSS, it directly goes into excitation system. Thus, it is convenient to
add a supplementary control on part 1. The diagram of the proposed control is shown in Figure 3.
ctrlG s
part
G s2
partG s
1
su
eP
Supplementary control to provide phase lead on 3-8Hz
Figure 3. Diagram of the supplementary control for enhancing damping of exciter mode.
The input of the supplementary control is −ΔPe and its output is Δus. After neglecting
04
5
e ( )
KK
G s s
, part 1 becomes PSS
J
1( )G s
T s, so it is reasonable to add this supplementary control on
the PSS. Therefore, an NPSS by adding a parallel component on the conventional PSS is proposed.
The model of the NPSS is designed as Figure 4 shows.
Figure 2. Phase response of the exciter-PSS loop. (a) Phase characteristics from ∆Uref to ∆Me2; (b) phasecharacteristics from –∆Pe to ∆us; and (c) the sum of phase lag of part 1 and part 2.
To sum up, the increase of the PSS gains will increase the damping ratio of LFOs while at thesame time it will decrease the damping ratio of exciter mode. This phenomenon is caused by thephase-frequency characteristics of the exciter-PSS loop in the frequency range of 3–8 Hz. When PSSreaches its critical gain, it will form a positive feedback on the exciter-PSS loop. Therefore, an unstableexciter mode oscillation will occur in the system. In other words, damping of exciter mode oscillationrestricts the critical gain of PSS, which further limits the gain of PSS. Consequently, the dampingprovided by PSS to inter-area modes will be insufficient. Therefore, the PSS should have a highercritical gain to ensure that the PSS can provide enough damping to the inter-area modes.
3. Design of the Novel Power System Stabilizer with High Critical Gain
3.1. Structure of the Novel Power System Stabilizer
According to the theoretical analysis in Section 2, it is known that characteristic of exciter modeis determined by the frequency characteristics of exciter-PSS loop. This loop is formed by part 1and part 2 in Figure 1. To improve the damping of exciter mode oscillation, the phase-frequencycharacteristics of the exciter-PSS loop on high frequencies should be improved. Considering outputof part 2 is generator active power, it is hard to put a supplementary control parallel with part 2. Butoutput of part 1 is that of PSS, it directly goes into excitation system. Thus, it is convenient to add asupplementary control on part 1. The diagram of the proposed control is shown in Figure 3.
Energies 2017, 10, 449 4 of 14
same as the input signal. It means an oscillation with the frequency of fc will not decay in the closed
loop system. In other words, an unstable exciter mode oscillation with the frequency of fc will occur
in the system. Thus, the loop will reach its critical gain.
0 2 4 6 8 10-180
-135
-90
-45
0
45
-180
-135
-90
-45
0
-90
-45
0
45
90
0 2 4 6 8 10
Frequency(Hz)
Ph
ase
(deg
)
Frequency(Hz) Frequency(Hz)
-225
fc
-2700 2 4 6 8 10
0 2 4 6 8 10-180
-135
-90
-45
0
45
-180
-135
-90
-45
0
-90
-45
0
45
90
0 2 4 6 8 10
Frequency(Hz)
Ph
ase
(deg
)
Frequency(Hz) Frequency(Hz)
-225
fc
-2700 2 4 6 8 10
0 2 4 6 8 10-180
-135
-90
-45
0
45
-180
-135
-90
-45
0
-90
-45
0
45
90
0 2 4 6 8 10
Frequency(Hz)
Ph
ase
(deg
)
Frequency(Hz) Frequency(Hz)
-225
fc
-2700 2 4 6 8 10
(a) (b) (c)
Figure 2. Phase response of the exciter-PSS loop. (a) Phase characteristics from ΔUref to ΔMe2; (b)
phase characteristics from –ΔPe to Δus; and (c) the sum of phase lag of part 1 and part 2.
To sum up, the increase of the PSS gains will increase the damping ratio of LFOs while at the
same time it will decrease the damping ratio of exciter mode. This phenomenon is caused by the
phase-frequency characteristics of the exciter-PSS loop in the frequency range of 3–8 Hz. When PSS
reaches its critical gain, it will form a positive feedback on the exciter-PSS loop. Therefore, an
unstable exciter mode oscillation will occur in the system. In other words, damping of exciter mode
oscillation restricts the critical gain of PSS, which further limits the gain of PSS. Consequently, the
damping provided by PSS to inter-area modes will be insufficient. Therefore, the PSS should have a
higher critical gain to ensure that the PSS can provide enough damping to the inter-area modes.
3. Design of the Novel Power System Stabilizer with High Critical Gain
3.1. Structure of the Novel Power System Stabilizer
According to the theoretical analysis in Section 2, it is known that characteristic of exciter mode
is determined by the frequency characteristics of exciter-PSS loop. This loop is formed by part 1 and
part 2 in Figure 1. To improve the damping of exciter mode oscillation, the phase-frequency
characteristics of the exciter-PSS loop on high frequencies should be improved. Considering output
of part 2 is generator active power, it is hard to put a supplementary control parallel with part 2.
But output of part 1 is that of PSS, it directly goes into excitation system. Thus, it is convenient to
add a supplementary control on part 1. The diagram of the proposed control is shown in Figure 3.
ctrlG s
part
G s2
partG s
1
su
eP
Supplementary control to provide phase lead on 3-8Hz
Figure 3. Diagram of the supplementary control for enhancing damping of exciter mode.
The input of the supplementary control is −ΔPe and its output is Δus. After neglecting
04
5
e ( )
KK
G s s
, part 1 becomes PSS
J
1( )G s
T s, so it is reasonable to add this supplementary control on
the PSS. Therefore, an NPSS by adding a parallel component on the conventional PSS is proposed.
The model of the NPSS is designed as Figure 4 shows.
Figure 3. Diagram of the supplementary control for enhancing damping of exciter mode.
The input of the supplementary control is −∆Pe and its output is ∆us. After neglecting(K5 +
K4Ge(s)
)ω0
s , part 1 becomes 1TJs
GPSS(s), so it is reasonable to add this supplementary control
Energies 2017, 10, 449 5 of 15
on the PSS. Therefore, an NPSS by adding a parallel component on the conventional PSS is proposed.The model of the NPSS is designed as Figure 4 shows.Energies 2017, 10, 449 5 of 14
3
4
1
1 s
T s
T
1
2
1
1 s
T s
T
1 s
W
W
T s
T
pss
Ks
u
(s)ctrl
Ge
Ppss
K
conventional PSS
the parallel componet
Figure 4. Model of the novel power system stabilizer (NPSS).
This parallel component should improve phase lead of PSS in the frequency range of 3–8 Hz
but have little influence on the LFOs. In that case, it is reasonable that this component can be
designed as a high pass filter as shown in Equation (2):
c c
ctrl
c
( )1
K T sG s
T s
(2)
where Kc is the filter gain and Tc is the time constant.
The output of the NPSS is:
W 3 c c1
s PSS PSS e
W 2 4 c
11( )
1 1 1 1
T s T s K T sT su K K P
T s T s T s T s
(3)
It consists of two parts, the former one is W 31
PSS
W 2 4
11
1 1 1
T s T sT sK
T s T s T s
, the latter one is
c c
PSS e
c
( )1
K T sK P
T s
. The former one is the same as the conventional PSS. The latter one is the
supplementary control provided by the parallel component. When the frequency of oscillation is
low, s is small so that magnitude of the latter one is small that it has little influence on us. It
indicates that the former one dominates the NPSS characteristics in the frequency range of LFOs.
When s gets into the frequency range of exciter modes, the magnitude of the latter one increases
significantly so that it can provide phase lead on part 1. In that case the phase characteristics of part
1 are improved so that the damping of exciter mode is enhanced.
3.2. Parameter Determination of the Proposed Novel Power System Stabilizer
The parallel component added to the PSS has brought two new parameters to be set, they are
Tc and Kc. These two parameters can be tuned through Bode analysis. Considering that the
component should have enough effect over 3 Hz and little effect under 2.5 Hz simultaneously, Tc
should be as small as possible. It can be set to 0.01 s by taking practical limit into account.
To tune Kc, its influence on the exciter-PSS loop should be investigated first in a single-machine
infinite-bus system. The sixth-order generator model and its typical parameters are used to
calculate the phase-frequency characteristics of the exciter-PSS loop. The parameters of the
generator are shown in Table A1 in the appendix. The proposed PSS is used and the gain Kpss of the
NPSS is set to be 10. The open-loop Bode diagram of the exciter-PSS loop in 3–30 Hz frequency
range versus the variations of Kc is shown in Figure 5. The improvements of the phase
characteristics can be seen with the increasing of Kc. According to the analysis in Section 2, the
magnitude of the loop at the frequency where the phase of Δus crosses −180° indicates the critical
gain of the system. For example, when Kc = 0.05, the loop magnitude of the frequency where phase
of Δus crosses −180° is −15 dB, means the critical gain Kmax is 56. That is 5.6 times of the current gain.
Figure 4. Model of the novel power system stabilizer (NPSS).
This parallel component should improve phase lead of PSS in the frequency range of 3–8 Hz buthave little influence on the LFOs. In that case, it is reasonable that this component can be designed as ahigh pass filter as shown in Equation (2):
Gctrl(s) =KcTcs
1 + Tcs(2)
where Kc is the filter gain and Tc is the time constant.The output of the NPSS is:
∆us = KPSSTWs
1 + TWs1 + T1s1 + T2s
1 + T3s1 + T4s
∆ω+ KPSSKcTcs
1 + Tcs(−∆Pe) (3)
It consists of two parts, the former one is KPSSTWs
1+TWs1+T1s1+T2s
1+T3s1+T4s ∆ω, the latter one is
KPSSKcTcs1+Tcs (−∆Pe). The former one is the same as the conventional PSS. The latter one is the
supplementary control provided by the parallel component. When the frequency of oscillation is low,s is small so that magnitude of the latter one is small that it has little influence on us. It indicates thatthe former one dominates the NPSS characteristics in the frequency range of LFOs. When s gets intothe frequency range of exciter modes, the magnitude of the latter one increases significantly so that itcan provide phase lead on part 1. In that case the phase characteristics of part 1 are improved so thatthe damping of exciter mode is enhanced.
3.2. Parameter Determination of the Proposed Novel Power System Stabilizer
The parallel component added to the PSS has brought two new parameters to be set, they are Tc
and Kc. These two parameters can be tuned through Bode analysis. Considering that the componentshould have enough effect over 3 Hz and little effect under 2.5 Hz simultaneously, Tc should be assmall as possible. It can be set to 0.01 s by taking practical limit into account.
To tune Kc, its influence on the exciter-PSS loop should be investigated first in a single-machineinfinite-bus system. The sixth-order generator model and its typical parameters are used to calculatethe phase-frequency characteristics of the exciter-PSS loop. The parameters of the generator are shownin Table A1 in the appendix. The proposed PSS is used and the gain Kpss of the NPSS is set to be 10. Theopen-loop Bode diagram of the exciter-PSS loop in 3–30 Hz frequency range versus the variations ofKc is shown in Figure 5. The improvements of the phase characteristics can be seen with the increasingof Kc. According to the analysis in Section 2, the magnitude of the loop at the frequency where thephase of ∆us crosses −180◦ indicates the critical gain of the system. For example, when Kc = 0.05, theloop magnitude of the frequency where phase of ∆us crosses −180◦ is −15 dB, means the critical gainKmax is 56. That is 5.6 times of the current gain.
Energies 2017, 10, 449 6 of 15Energies 2017, 10, 449 6 of 14
3 5 10 15 20 25 30-360
-270
-180
-90
0
Ph
ase
of
us(
deg
)
Frequency(Hz)
-60
-50
-40
-30
-20
-10
0
Ma
gn
itu
de(d
B)
Kc=0
Kc=0.05
Kc=0.2
Kc=0.4Kc=0.3
Kc=0.1
Kc=0
Kc=0.05
Kc=0.1
Kc=0.2
Kc=0.3Kc=0.4
-11.8dB
-15dB
-35dB
-29dB
-25dB
-22.5dB
Figure 5. Bode diagram of exciter-PSS loop under 3–30 Hz with different Kc.
When Kc increases to 0.1, the frequency that phase-frequency characteristic passes through
−180° suddenly changes from 8 Hz to 27 Hz. At the same time, the loop magnitude changes from
−15 dB to −35 dB. It means that the critical gain of this loop changes from 5.6 times to 56 times of the
current gain. That is to say, with the increase of Kc, the frequency that loop phase characteristic
crosses −180° gets higher. The magnitude of the loop at such high frequencies is small. Thus, the
critical gain of the proposed PSS is significantly improved.
From the above analysis, phase characteristics of the exciter-PSS loop ϕ are determined by Kc.
Kc has a minimum value Kcmin that can change the frequency of exciter mode from 8 Hz to 27 Hz.
This Kcmin satisfies the condition that ∂2/∂ω2 > 0, ∂ϕ/∂ω = 0 have one solution ω0, and ϕ(ω0)= −180° in
the frequency range of 3–30 Hz. Therefore, Kcmin can be acquired by solving the former equations.
From Figure 5, it also can be seen that with the increasing of Kc, the phase lead provided to the
system tends to be saturated while the magnitude response of the loop continues to increase. It
indicates that the parallel component will bring unbeneficial effect to the system when the value of
Kc gets too large. Moreover, the value of Kc should be as small as possible to prevent this component
from influencing the phase characteristics in the frequency range of 0.2–2.5 Hz. Besides, Kc should
be larger than Kcmin to some extent to ensure its effectiveness. Taking all above into consideration, Kc
should be chosen as 1.1–1.2Kcmin.
In the above example, it can be calculated that ϕ will be −180° at ω0 = 69.7 rad/s when Kcmin =
0.091. Then Kc can be chosen as Kc = 1.1Kcmin = 0.1. In that case, the exciter mode is changed from the
frequency range of 3–8 Hz to the frequency range that over 25 Hz. Its critical gain is improved from
5.6 times to 56 times of the current gain. That is to say, critical gain of the NPSS is significantly
improved. It makes the chosen gain of NPSS flexible enough to provide sufficient damping and do
not exceed 1/3 of its critical gain simultaneously.
4. Case Studies
4.1. Description of the Study System
To validate the effectiveness of the proposed PSS, the Ximeng coal power station of China
shown in Figure 6 is built in Matlab/Simulink environment. This test system is a practical system
planned to be built in North China, and some of the thermal power plants are already under
Figure 5. Bode diagram of exciter-PSS loop under 3–30 Hz with different Kc.
When Kc increases to 0.1, the frequency that phase-frequency characteristic passes through −180◦
suddenly changes from 8 Hz to 27 Hz. At the same time, the loop magnitude changes from −15 dB to−35 dB. It means that the critical gain of this loop changes from 5.6 times to 56 times of the currentgain. That is to say, with the increase of Kc, the frequency that loop phase characteristic crosses −180◦
gets higher. The magnitude of the loop at such high frequencies is small. Thus, the critical gain of theproposed PSS is significantly improved.
From the above analysis, phase characteristics of the exciter-PSS loop ϕ are determined by Kc. Kc
has a minimum value Kcmin that can change the frequency of exciter mode from 8 Hz to 27 Hz. ThisKcmin satisfies the condition that ∂2/∂ω2 > 0, ∂ϕ/∂ω = 0 have one solutionω0, and ϕ(ω0)= −180◦ inthe frequency range of 3–30 Hz. Therefore, Kcmin can be acquired by solving the former equations.
From Figure 5, it also can be seen that with the increasing of Kc, the phase lead provided tothe system tends to be saturated while the magnitude response of the loop continues to increase.It indicates that the parallel component will bring unbeneficial effect to the system when the value ofKc gets too large. Moreover, the value of Kc should be as small as possible to prevent this componentfrom influencing the phase characteristics in the frequency range of 0.2–2.5 Hz. Besides, Kc should belarger than Kcmin to some extent to ensure its effectiveness. Taking all above into consideration, Kc
should be chosen as 1.1–1.2Kcmin.In the above example, it can be calculated that φ will be −180◦ at ω0 = 69.7 rad/s when
Kcmin = 0.091. Then Kc can be chosen as Kc = 1.1 Kcmin = 0.1. In that case, the exciter mode ischanged from the frequency range of 3–8 Hz to the frequency range that over 25 Hz. Its critical gainis improved from 5.6 times to 56 times of the current gain. That is to say, critical gain of the NPSSis significantly improved. It makes the chosen gain of NPSS flexible enough to provide sufficientdamping and do not exceed 1/3 of its critical gain simultaneously.
Energies 2017, 10, 449 7 of 15
4. Case Studies
4.1. Description of the Study System
To validate the effectiveness of the proposed PSS, the Ximeng coal power station of China shownin Figure 6 is built in Matlab/Simulink environment. This test system is a practical system planned tobe built in North China, and some of the thermal power plants are already under construction. Thissystem includes four power plants named Duolun, Shengli, Chagan, Keshi, respectively. Duolun andChagan power plants have three 600 MW generator sets. Shengli and Keshi power plant have two1000 MW generator sets. Duolun power plant uses two 500 kV transmission lines to deliver power toXimeng substation, and others use one 1000 kV transmission line to deliver power to Ximemg stationeach. Those powers are collected in Ximeng station and delivered through two 1000 kV transmissionlines to Beijing station. Then the power goes to two equivalent systems through Beijing station.The generation capacity of equivalent system 1 and equivalent system 2 are 173 GW and 174 GW,respectively. The base power of the system is 100 MW.
Energies 2017, 10, 449 7 of 14
construction. This system includes four power plants named Duolun, Shengli, Chagan, Keshi,
respectively. Duolun and Chagan power plants have three 600 MW generator sets. Shengli and
Keshi power plant have two 1000 MW generator sets. Duolun power plant uses two 500 kV
transmission lines to deliver power to Ximeng substation, and others use one 1000 kV transmission
line to deliver power to Ximemg station each. Those powers are collected in Ximeng station and
delivered through two 1000 kV transmission lines to Beijing station. Then the power goes to two
equivalent systems through Beijing station. The generation capacity of equivalent system 1 and
equivalent system 2 are 173 GW and 174 GW, respectively. The base power of the system is 100
MW.
Beijing
Duolun 500 kV
1000 kV
Shengli
Chagan
Keshi
Ximeng
1000 kV10km
222km
212km
149km
352km
1000 kV
1000 kV
Equivalent
system 1
173GW
1000 kV160km
Bus2 Bus3
1000 kV
1000 kV
Equivalent
system 2
174GW
G3
G4
G5
G6
G7
G8
G9
G10
G11
G12
G1
G2
Figure 6. Diagram of the Ximeng coal power station of China.
In this study, generators in Duolun, Shengli, Chagan, Keshi are generating the active power of
5 p.u., 10 p.u., 6 p.u., 10 p.u. The total generation of power is 73 p.u. and about 68 p.u. active power
is delivered through the 1000 kV transmission lines between Ximeng and Beijing.
4.2. Stability Characteristics of the System Using Conventional Power System Stabilizers
As planned, self-shunt excitation system with CPSS will be installed in all these generators.
Through the guide, the phase lead of PSS can be calculated, where T1 = T3 = 0.2 s, T2 = T4 = 0.02 s, TW =
10 s. Considering that PSS2A and PSS4B have also been used in practical power system and are
known to have certain advantages towards CPSS [27,28], it is reasonable to firstly compare their
performance with CPSS in this system and study whether they will meet this problem. Thus they
are also tuned for this system. For PSS2A and PSS4B, their structures are shown in Figure A1 and
Figure A2 in the appendix [29]. Their parameters are also displayed in Tables A2 and A3 in the
appendix. For PSS4B, its typical parameters do not provide enough phase lead in high frequency
range of LFOs [30]. Thus, the lead-lag parameters of PSS4B are retuned.
The phase characteristics of the PSSs and the phase lag of excitation system are shown in
Figure 7. It can be seen that the PSSs well compensate the phase lag of the excitation system.
PSS gain is tuned at the 1/3 of its critical gain, that is Kpss = 10 for CPSS, KS1 = 14 for PSS2A, and
KL = 4.28 KI = 17.1 KH = 68.4 for PSS4B. Then small signal stability analysis of the systems is
performed and the results of the inter-area modes are shown in Table 1.
It can be seen that the damping is strong when the system operates with two 1000kV lines.
However, the damping ratio of inter-area mode will decrease to 0.023 with the outage of one
transmission line, lower than 0.05 required by the guide. Therefore, the PSS gain needs to be set
larger to provide enough damping to the system. However, such PSS gain will of course exceed 1/3
of its critical gain and violate the regulations of the guide.
Figure 6. Diagram of the Ximeng coal power station of China.
In this study, generators in Duolun, Shengli, Chagan, Keshi are generating the active power of5 p.u., 10 p.u., 6 p.u., 10 p.u. The total generation of power is 73 p.u. and about 68 p.u. active power isdelivered through the 1000 kV transmission lines between Ximeng and Beijing.
4.2. Stability Characteristics of the System Using Conventional Power System Stabilizers
As planned, self-shunt excitation system with CPSS will be installed in all these generators.Through the guide, the phase lead of PSS can be calculated, where T1 = T3 = 0.2 s, T2 = T4 = 0.02 s,TW = 10 s. Considering that PSS2A and PSS4B have also been used in practical power system andare known to have certain advantages towards CPSS [27,28], it is reasonable to firstly compare theirperformance with CPSS in this system and study whether they will meet this problem. Thus they arealso tuned for this system. For PSS2A and PSS4B, their structures are shown in Figures A1 and A2in the appendix [29]. Their parameters are also displayed in Tables A2 and A3 in the appendix. ForPSS4B, its typical parameters do not provide enough phase lead in high frequency range of LFOs [30].Thus, the lead-lag parameters of PSS4B are retuned.
The phase characteristics of the PSSs and the phase lag of excitation system are shown in Figure 7.It can be seen that the PSSs well compensate the phase lag of the excitation system.
Energies 2017, 10, 449 8 of 15Energies 2017, 10, 449 8 of 14
0 2 4 6 8 100
45
90
135
180
Frequency(Hz)
Ph
ase
(deg
)
Phase lag of 600MW generator in DuolunPhase lag of 1000MW generator in ShengliPhase lead of CPSS & PSS2A
Phase lead of PSS4B
Figure 7. Ideal compensation phases of generator and PSS with certain parameter.
Table 1. Inter-area oscillation mode of the system using CPSSs.
PSS Type Conditions Frequency (Hz) Damping Ratio
CPSS Double lines 0.726 0.121
Single line 0.584 0.023
PSS2A Double lines 0.642 0.122
Single line 0.539 0.032
PSS4B Double lines 0.763 0.097
Single line 0.596 0.041
It can also be concluded that PSS2A and PSS4B cannot meet the damping requirement of the
system either. This is because that their gain is also limited by the damping of exciter mode
oscillation. PSS2A and PSS4B are not designed to enhance the damping of exciter mode oscillations.
In the frequency range of 3–8 Hz, frequency characteristics of PSS2A and PSS4B is similar to CPSS
so that they will also meet this problem.
If the gain of PSS is retuned to ensure that the damping ratio of the inter-area mode is over 0.05,
it has to be set at Kpss = 12. Small signal stability of the system is analyzed and results are shown in
Table 2. Results of the small signal stability analysis at three times this gain are shown in Table 3.
Note that there are several unstable exciter modes in the system. That is to say, the CPSSs cannot
satisfy the damping ratio and critical gain requirement in the guide simultaneously.
Table 2. Inter-area oscillation mode of the system using CPSS at Kpss = 12.
Conditions Frequency (Hz) Damping Ratio
Double lines 0.706 0.156
Single line 0.569 0.053
Table 3. Unstable exciter modes of the system using CPSS at Kpss = 36.
Corresponding State Variables Frequency (Hz) Damping Ratio
Exciter and PSS
7.130 −0.0179
7.090 −0.0331
7.025 −0.0331
7.130 −0.0390
4.3. Stability Characteristics of the System Using NPSS
All the CPSSs are replaced by the NPSSs. Tc is set to be 0.01 s, and Kcmin is calculated to be 0.11.
Thus Kc = 1.1Kcmin = 0.12. Comparisons results of the system small signal stability by using CPSSs
and NPSSs respectively are shown in Table 4.
Figure 7. Ideal compensation phases of generator and PSS with certain parameter.
PSS gain is tuned at the 1/3 of its critical gain, that is Kpss = 10 for CPSS, KS1 = 14 for PSS2A, andKL = 4.28 KI = 17.1 KH = 68.4 for PSS4B. Then small signal stability analysis of the systems is performedand the results of the inter-area modes are shown in Table 1.
Table 1. Inter-area oscillation mode of the system using CPSSs.
PSS Type Conditions Frequency (Hz) Damping Ratio
CPSSDouble lines 0.726 0.121Single line 0.584 0.023
PSS2ADouble lines 0.642 0.122Single line 0.539 0.032
PSS4BDouble lines 0.763 0.097Single line 0.596 0.041
It can be seen that the damping is strong when the system operates with two 1000 kV lines.However, the damping ratio of inter-area mode will decrease to 0.023 with the outage of onetransmission line, lower than 0.05 required by the guide. Therefore, the PSS gain needs to be setlarger to provide enough damping to the system. However, such PSS gain will of course exceed 1/3 ofits critical gain and violate the regulations of the guide.
It can also be concluded that PSS2A and PSS4B cannot meet the damping requirement of thesystem either. This is because that their gain is also limited by the damping of exciter mode oscillation.PSS2A and PSS4B are not designed to enhance the damping of exciter mode oscillations. In thefrequency range of 3–8 Hz, frequency characteristics of PSS2A and PSS4B is similar to CPSS so thatthey will also meet this problem.
If the gain of PSS is retuned to ensure that the damping ratio of the inter-area mode is over 0.05,it has to be set at Kpss = 12. Small signal stability of the system is analyzed and results are shown inTable 2. Results of the small signal stability analysis at three times this gain are shown in Table 3. Notethat there are several unstable exciter modes in the system. That is to say, the CPSSs cannot satisfy thedamping ratio and critical gain requirement in the guide simultaneously.
Table 2. Inter-area oscillation mode of the system using CPSS at Kpss = 12.
Conditions Frequency (Hz) Damping Ratio
Double lines 0.706 0.156Single line 0.569 0.053
Energies 2017, 10, 449 9 of 15
Table 3. Unstable exciter modes of the system using CPSS at Kpss = 36.
Corresponding State Variables Frequency (Hz) Damping Ratio
4.3. Stability Characteristics of the System Using NPSS
All the CPSSs are replaced by the NPSSs. Tc is set to be 0.01 s, and Kcmin is calculated to be 0.11.Thus Kc = 1.1 Kcmin = 0.12. Comparisons results of the system small signal stability by using CPSSsand NPSSs respectively are shown in Table 4.
Table 4. Comparison of dominate oscillation modes of the system using CPSS and NPSS.
PSS Type Kpss Mode Type Frequency (Hz) Damping Ratio
CPSS10
inter-area 0.726 0.121exciter 5.530 0.358
30inter-area 0.545 0.405
exciter 6.930 −0.007
NPSS
10inter-area 0.714 0.093
exciter 16.30 0.771
30inter-area 0.553 0.344
exciter 17.50 0.633
350 exciter 27.30 −0.003
For the CPSS, it reaches its critical gain at Kpss = 30. An unstable exciter mode oscillation of6.93 Hz will occur in the system if Kpss gets over 30. For the NPSS, the critical gain is rather high, andthe system will remain stable until Kpss reaches 350. The frequency of the exciter mode changes from6.93 Hz to 27.3 Hz.
Figure 8 shows the comparison of bode diagram between the system using CPSSs and NPSSs atKpss = 10. Two PSSs have little difference from 0.1 Hz to 2 Hz, it indicates that their performances inthe frequency range of LFO are nearly the same. However, when frequency gets over 4 Hz, phasecharacteristics of the NPSS get higher than the CPSS. The frequency that system phases cross −180◦ ischanged from f 1 to f 2. At the frequency of f 2, the magnitude of the loop is −31 dB. It indicates that thecritical gain is 35 times of Kpss = 10.
Energies 2017, 10, 449 9 of 14
Table 4. Comparison of dominate oscillation modes of the system using CPSS and NPSS.
PSS Type Kpss Mode Type Frequency (Hz) Damping Ratio
CPSS
10 inter-area 0.726 0.121
exciter 5.530 0.358
30 inter-area 0.545 0.405
exciter 6.930 −0.007
NPSS
10 inter-area 0.714 0.093
exciter 16.30 0.771
30 inter-area 0.553 0.344
exciter 17.50 0.633
350 exciter 27.30 −0.003
For the CPSS, it reaches its critical gain at Kpss = 30. An unstable exciter mode oscillation of 6.93
Hz will occur in the system if Kpss gets over 30. For the NPSS, the critical gain is rather high, and the
system will remain stable until Kpss reaches 350. The frequency of the exciter mode changes from
6.93 Hz to 27.3 Hz.
Figure 8 shows the comparison of bode diagram between the system using CPSSs and NPSSs
at Kpss = 10. Two PSSs have little difference from 0.1 Hz to 2 Hz, it indicates that their performances
in the frequency range of LFO are nearly the same. However, when frequency gets over 4 Hz, phase
characteristics of the NPSS get higher than the CPSS. The frequency that system phases cross −180°
is changed from f1 to f2. At the frequency of f2, the magnitude of the loop is −31 dB. It indicates that
the critical gain is 35 times of Kpss =10.
-450
-360
-270
-180
-90
0
90
180
-100
-80
-60
-40
-20
0
20
Frequency(Hz)
Ph
ase
(deg
)M
ag
nit
ud
e(d
B)
10-1
100
101
102
System with NPSS
System with CPSS
9dB31dB
f1 f2
Figure 8. Comparison of bode diagram between the system using CPSS and NPSS at Kpss = 10.
Small signal analysis indicates that the gain of NPSS can be set larger to provide more
damping to the system. To make the damping ratio of the inter-area mode over 0.15 under single
line condition, the gain of NPSS Kpss is set to be 20. Small signal stability of the system is shown in
Table 5, where Kmax is the critical gain.
Table 5. Small signal stability of the system using NPSS at Kpss = 20.
Conditions Frequency (Hz) Damping Ratio Kmax Times to Exceed Kmax
Double lines 0.627 0.223 350 17.5
Single line 0.518 0.151
The damping ratio of the inter-area mode is 0.223 under two transmission lines and 0.151
under single transmission line. The critical gain is 17.5 times higher than 20. That is to say, the NPSS
can satisfy the damping ratio and critical gain requirement in the guide simultaneously.
Figure 8. Comparison of bode diagram between the system using CPSS and NPSS at Kpss = 10.
Energies 2017, 10, 449 10 of 15
Small signal analysis indicates that the gain of NPSS can be set larger to provide more dampingto the system. To make the damping ratio of the inter-area mode over 0.15 under single line condition,the gain of NPSS Kpss is set to be 20. Small signal stability of the system is shown in Table 5, whereKmax is the critical gain.
Table 5. Small signal stability of the system using NPSS at Kpss = 20.
Conditions Frequency (Hz) Damping Ratio Kmax Times to Exceed Kmax
Double lines 0.627 0.223350 17.5Single line 0.518 0.151
The damping ratio of the inter-area mode is 0.223 under two transmission lines and 0.151 undersingle transmission line. The critical gain is 17.5 times higher than 20. That is to say, the NPSS cansatisfy the damping ratio and critical gain requirement in the guide simultaneously.
4.4. Nonlinear Simulation Validation
Time domain simulations are undertaken to validate the former small signal analysis. A threephase short circuit fault occurs on one of the two 1000 kV transmission lines from Ximeng to Beijing att = 0.5s, after 0.1 s the faulty line is tripped from the system. Active power of G3 using CPSS, PSS2Aand PSS4B are shown in Figure 9. An inter-area oscillation with weak damping occurs after the faultwith PSSs operating in the system. Neither of CPSS, PSS2A or PSS4B can mitigate the inter-area modeeffectively under 1/3 of their critical gain. Dynamic response of each power plant and the rest 1000 kVtransmission line between Ximeng and Beijing is shown in Figure 10. It can be seen that active powerof G3, G6, G8 and G11 is coherent in the system dynamic response. It is because the N-1 fault on thetransmission line excites the inter-area oscillation between Ximeng power plant and the equivalentsystem 2. The power of the rest line from Ximeng to Beijing increases from 34 p.u. to 68 p.u. This makesthe load on the rest 1000 kV line extremely heavy so that the damping of the inter-area oscillationbecomes very poor.
Energies 2017, 10, 449 10 of 14
4.4. Nonlinear Simulation Validation
Time domain simulations are undertaken to validate the former small signal analysis. A three
phase short circuit fault occurs on one of the two 1000 kV transmission lines from Ximeng to Beijing
at t = 0.5s, after 0.1 s the faulty line is tripped from the system. Active power of G3 using CPSS,
PSS2A and PSS4B are shown in Figure 9. An inter-area oscillation with weak damping occurs after
the fault with PSSs operating in the system. Neither of CPSS, PSS2A or PSS4B can mitigate the
inter-area mode effectively under 1/3 of their critical gain. Dynamic response of each power plant
and the rest 1000 kV transmission line between Ximeng and Beijing is shown in Figure 10. It can be
seen that active power of G3, G6, G8 and G11 is coherent in the system dynamic response. It is
because the N-1 fault on the transmission line excites the inter-area oscillation between Ximeng
power plant and the equivalent system 2. The power of the rest line from Ximeng to Beijing
increases from 34 p.u. to 68 p.u. This makes the load on the rest 1000kV line extremely heavy so that
the damping of the inter-area oscillation becomes very poor.
0 2 4 6 8 10 12 14 16 18 202
3
4
5
6
7
System with CPSS
System with PSS2ASystem with PSS4B
Time(s)
Act
ive
po
wer
of
G3
(p.u
.)
Figure 9. Active power of G3 during an N-1 fault on one 1000 kV transmission line from Ximieng to
Beijing using CPSS, PSS2A and PSS2B.
G3
G6
G8
G11
0 2 4 6 8 10 12 14 16 18 20
2
4
6
8
10
12
Acti
ve p
ow
er(p
.u.)
Time(s)
20
30
40
50
60
70
80
90
Acti
ve p
ow
er(p
.u.)
0 2 4 6 8 10 12 14 16 18 20
Time(s)
(a) (b)
Figure 10. System response during an N-1 fault on one 1000 kV transmission line from Ximieng to
Beijing using CPSS. (a) Active power of generators in each power plant; and (b) active power of the
rest 1000 kV transmission line between Ximeng and Beijing.
This oscillation lasts more than 20 s. If the PSS gain is increased to Kpss = 12 to provide more
damping to the inter-area mode, the exciter mode will get unstable at 3 times of the current gain
(Kpss = 36), as shown in Figure 11.
While using the NPSS, the PSS gain Kpss is set to be 20, and system response after the N-1 fault
is shown in Figure 12. The inter-area mode attenuates fast and disappears in 10 s. Moreover, the
system is stable at 3 times of the current gain (Kpss = 60), as shown in Figure 11.
Figure 9. Active power of G3 during an N-1 fault on one 1000 kV transmission line from Ximieng toBeijing using CPSS, PSS2A and PSS2B.
This oscillation lasts more than 20 s. If the PSS gain is increased to Kpss = 12 to provide moredamping to the inter-area mode, the exciter mode will get unstable at 3 times of the current gain(Kpss = 36), as shown in Figure 11.
While using the NPSS, the PSS gain Kpss is set to be 20, and system response after the N-1 fault isshown in Figure 12. The inter-area mode attenuates fast and disappears in 10 s. Moreover, the systemis stable at 3 times of the current gain (Kpss = 60), as shown in Figure 11.
In conclusion, the NPSS moves the frequency of exciter mode from 3–8 Hz to over 20 Hz whilehaving the same performance with CPSS under the frequency range of LFOs. Taking the advantage oflow magnitude characteristic of the system on high frequency, the NPSS improves the critical gain
Energies 2017, 10, 449 11 of 15
significantly. Thus, the NPSS can simply and effectively satisfy both the damping ratio and criticalgain requirement of the guide.
Energies 2017, 10, 449 10 of 14
4.4. Nonlinear Simulation Validation
Time domain simulations are undertaken to validate the former small signal analysis. A three
phase short circuit fault occurs on one of the two 1000 kV transmission lines from Ximeng to Beijing
at t = 0.5s, after 0.1 s the faulty line is tripped from the system. Active power of G3 using CPSS,
PSS2A and PSS4B are shown in Figure 9. An inter-area oscillation with weak damping occurs after
the fault with PSSs operating in the system. Neither of CPSS, PSS2A or PSS4B can mitigate the
inter-area mode effectively under 1/3 of their critical gain. Dynamic response of each power plant
and the rest 1000 kV transmission line between Ximeng and Beijing is shown in Figure 10. It can be
seen that active power of G3, G6, G8 and G11 is coherent in the system dynamic response. It is
because the N-1 fault on the transmission line excites the inter-area oscillation between Ximeng
power plant and the equivalent system 2. The power of the rest line from Ximeng to Beijing
increases from 34 p.u. to 68 p.u. This makes the load on the rest 1000kV line extremely heavy so that
the damping of the inter-area oscillation becomes very poor.
0 2 4 6 8 10 12 14 16 18 202
3
4
5
6
7
System with CPSS
System with PSS2ASystem with PSS4B
Time(s)
Act
ive
po
wer
of
G3
(p.u
.)
Figure 9. Active power of G3 during an N-1 fault on one 1000 kV transmission line from Ximieng to
Beijing using CPSS, PSS2A and PSS2B.
G3
G6
G8
G11
0 2 4 6 8 10 12 14 16 18 20
2
4
6
8
10
12
Acti
ve p
ow
er(p
.u.)
Time(s)
20
30
40
50
60
70
80
90
Acti
ve p
ow
er(p
.u.)
0 2 4 6 8 10 12 14 16 18 20
Time(s)
(a) (b)
Figure 10. System response during an N-1 fault on one 1000 kV transmission line from Ximieng to
Beijing using CPSS. (a) Active power of generators in each power plant; and (b) active power of the
rest 1000 kV transmission line between Ximeng and Beijing.
This oscillation lasts more than 20 s. If the PSS gain is increased to Kpss = 12 to provide more
damping to the inter-area mode, the exciter mode will get unstable at 3 times of the current gain
(Kpss = 36), as shown in Figure 11.
While using the NPSS, the PSS gain Kpss is set to be 20, and system response after the N-1 fault
is shown in Figure 12. The inter-area mode attenuates fast and disappears in 10 s. Moreover, the
system is stable at 3 times of the current gain (Kpss = 60), as shown in Figure 11.
Figure 10. System response during an N-1 fault on one 1000 kV transmission line from Ximieng toBeijing using CPSS. (a) Active power of generators in each power plant; and (b) active power of therest 1000 kV transmission line between Ximeng and Beijing.Energies 2017, 10, 449 11 of 14
Time(s)
Vo
lta
ge
of
G3
(p.u
.)
0 2 4 6 8 10 12 14 16 18 20
1.050
1.055
1.060
System with CPSS Kpss=36
System with NPSS Kpss=60
Figure 11. System response to +0.01 p.u. voltage reference step on G3 (both CPSS and NPSS with 3
times of its setting gain).
G3
G6
G8
G11
2
4
6
8
10
12
Acti
ve p
ow
er(p
.u.)
0 2 4 6 8 10 12 14 16 18 20
Time(s)
20
30
40
50
60
70
80
Acti
ve p
ow
er(p
.u.)
0 2 4 6 8 10 12 14 16 18 20
Time(s)
(a) (b)
Figure 12. System response during an N-1 fault on one 1000 kV transmission line from Ximieng to
Beijing using NPSS. (a) Active power of generators in each power plant; and (b) active power of the
rest 1000 kV transmission line between Ximeng and Beijing.
In conclusion, the NPSS moves the frequency of exciter mode from 3–8 Hz to over 20 Hz while
having the same performance with CPSS under the frequency range of LFOs. Taking the advantage
of low magnitude characteristic of the system on high frequency, the NPSS improves the critical
gain significantly. Thus, the NPSS can simply and effectively satisfy both the damping ratio and
critical gain requirement of the guide.
5. Conclusions
This paper investigates a problem that PSSs may not provide enough damping to inter-area
modes due to the limitation of its gain in a bulk power transmission system. In such system, PSS
gain is restricted to a certain level and thus limits the damping it can provide to the inter-area
modes. It is because the increase of PSS gain will make destabilizing effect on the exciter mode
oscillation. Critical gain of PSS is thus limited by the damping of exciter mode oscillation. Bode
analysis through H-P model reveals that the natural phase characteristics of PSS and excitation
system will form a positive feedback in the frequency range of 3–8 Hz. This characteristic is
responsible for the destabilizing effect PSS bring to the exciter mode oscillation.
To solve this problem, a novel PSS is proposed in this paper. Through introducing a parallel
high pass component on a CPSS, the NPSS raises the phase characteristic of exciter-PSS loop in the
frequency range of 3 to 8 Hz and the frequency of exciter mode is changed to over 20 Hz. The
magnitude response of the system is quite low at that frequency. Therefore, the critical gain of PSS
is improved significantly.
Simulation results in the Ximeng power system verify the correctness of the analysis and the
effectiveness of the NPSS. Compared to the CPSS whose critical gain is only three times of Kpss = 10,
the critical gain of the NPSS is 35 times of Kpss = 10. The critical gain is significantly improved by
using the NPSS. Thus, it is more flexible to choose the PSS gain to provide enough damping to the
system. When Kpss = 20 is chosen for the NPSS, the damping ratio of inter-area mode can still be 0.15
after one of the 1000kV transmission lines from Ximeng to Beijing trips owing to an three phase
short circuit fault. The critical gain of NPSS is 17.5 times of Kpss = 20. Thus, the NPSS can satisfy the
Figure 11. System response to +0.01 p.u. voltage reference step on G3 (both CPSS and NPSS with3 times of its setting gain).
Energies 2017, 10, 449 11 of 14
Time(s)
Vo
lta
ge
of
G3
(p.u
.)
0 2 4 6 8 10 12 14 16 18 20
1.050
1.055
1.060
System with CPSS Kpss=36
System with NPSS Kpss=60
Figure 11. System response to +0.01 p.u. voltage reference step on G3 (both CPSS and NPSS with 3
times of its setting gain).
G3
G6
G8
G11
2
4
6
8
10
12
Acti
ve p
ow
er(p
.u.)
0 2 4 6 8 10 12 14 16 18 20
Time(s)
20
30
40
50
60
70
80
Acti
ve p
ow
er(p
.u.)
0 2 4 6 8 10 12 14 16 18 20
Time(s)
(a) (b)
Figure 12. System response during an N-1 fault on one 1000 kV transmission line from Ximieng to
Beijing using NPSS. (a) Active power of generators in each power plant; and (b) active power of the
rest 1000 kV transmission line between Ximeng and Beijing.
In conclusion, the NPSS moves the frequency of exciter mode from 3–8 Hz to over 20 Hz while
having the same performance with CPSS under the frequency range of LFOs. Taking the advantage
of low magnitude characteristic of the system on high frequency, the NPSS improves the critical
gain significantly. Thus, the NPSS can simply and effectively satisfy both the damping ratio and
critical gain requirement of the guide.
5. Conclusions
This paper investigates a problem that PSSs may not provide enough damping to inter-area
modes due to the limitation of its gain in a bulk power transmission system. In such system, PSS
gain is restricted to a certain level and thus limits the damping it can provide to the inter-area
modes. It is because the increase of PSS gain will make destabilizing effect on the exciter mode
oscillation. Critical gain of PSS is thus limited by the damping of exciter mode oscillation. Bode
analysis through H-P model reveals that the natural phase characteristics of PSS and excitation
system will form a positive feedback in the frequency range of 3–8 Hz. This characteristic is
responsible for the destabilizing effect PSS bring to the exciter mode oscillation.
To solve this problem, a novel PSS is proposed in this paper. Through introducing a parallel
high pass component on a CPSS, the NPSS raises the phase characteristic of exciter-PSS loop in the
frequency range of 3 to 8 Hz and the frequency of exciter mode is changed to over 20 Hz. The
magnitude response of the system is quite low at that frequency. Therefore, the critical gain of PSS
is improved significantly.
Simulation results in the Ximeng power system verify the correctness of the analysis and the
effectiveness of the NPSS. Compared to the CPSS whose critical gain is only three times of Kpss = 10,
the critical gain of the NPSS is 35 times of Kpss = 10. The critical gain is significantly improved by
using the NPSS. Thus, it is more flexible to choose the PSS gain to provide enough damping to the
system. When Kpss = 20 is chosen for the NPSS, the damping ratio of inter-area mode can still be 0.15
after one of the 1000kV transmission lines from Ximeng to Beijing trips owing to an three phase
short circuit fault. The critical gain of NPSS is 17.5 times of Kpss = 20. Thus, the NPSS can satisfy the
Figure 12. System response during an N-1 fault on one 1000 kV transmission line from Ximieng toBeijing using NPSS. (a) Active power of generators in each power plant; and (b) active power of therest 1000 kV transmission line between Ximeng and Beijing.
5. Conclusions
This paper investigates a problem that PSSs may not provide enough damping to inter-areamodes due to the limitation of its gain in a bulk power transmission system. In such system, PSS gainis restricted to a certain level and thus limits the damping it can provide to the inter-area modes. It isbecause the increase of PSS gain will make destabilizing effect on the exciter mode oscillation. Criticalgain of PSS is thus limited by the damping of exciter mode oscillation. Bode analysis through H-Pmodel reveals that the natural phase characteristics of PSS and excitation system will form a positivefeedback in the frequency range of 3–8 Hz. This characteristic is responsible for the destabilizing effectPSS bring to the exciter mode oscillation.
Energies 2017, 10, 449 12 of 15
To solve this problem, a novel PSS is proposed in this paper. Through introducing a parallel highpass component on a CPSS, the NPSS raises the phase characteristic of exciter-PSS loop in the frequencyrange of 3 to 8 Hz and the frequency of exciter mode is changed to over 20 Hz. The magnitude responseof the system is quite low at that frequency. Therefore, the critical gain of PSS is improved significantly.
Simulation results in the Ximeng power system verify the correctness of the analysis and theeffectiveness of the NPSS. Compared to the CPSS whose critical gain is only three times of Kpss = 10,the critical gain of the NPSS is 35 times of Kpss = 10. The critical gain is significantly improved by usingthe NPSS. Thus, it is more flexible to choose the PSS gain to provide enough damping to the system.When Kpss = 20 is chosen for the NPSS, the damping ratio of inter-area mode can still be 0.15 after oneof the 1000 kV transmission lines from Ximeng to Beijing trips owing to an three phase short circuitfault. The critical gain of NPSS is 17.5 times of Kpss = 20. Thus, the NPSS can satisfy the critical gainrequirement of the guide. In conclusion, the NPSS can provide enough damping and satisfy the criticalgain requirement in the guide simultaneously.
Acknowledgments: This work was supported by National Natural Science Foundation of China (51577075).
Author Contributions: Ziquan Liu built the dynamic model of the system and performed the analysis andsimulations. This work was carried out under the advisement of and with regular feedback from Wei Yao andJinyu Wen. All authors carried out data analysis, discussed the results and contributed to writing the paper.
Conflicts of Interest: The authors declare no conflict of interest.
Appendix A
In addition to the instructions of the simulation studies, parameters of a typical generator, PSS2Aand PSS4B are given in the following tables. Models of PSS2A and PSS4B are shown in Figures A1and A2.
Table A1. Parameters of a typical generator.
Xd Xq X’d X’q X”d X”q
1.9341 1.9341 0.26 0.42 0.21 0.1985
T’d0 T’q0 T”d0 T”q0 TJ -
9.7 s 1 s 0.07 s 0.13 s 8 s -
Table A2. Parameters of the PSS2A.
TW1 10 s T8 0.6 s KS2 1TW2 10 s T9 0.12 s KS3 1TW3 10 s T1 0.2 s usmax 0.1TW4 10 s T2 0.02 s usmin −0.1T6 0 s T3 0.2 s M 5T7 8 s T4 0.02 s N 1
Table A3. Parameters of the PSS4B.
KL1 KL2 66 TI1 0.173 s TH3 TH9 0.38 sKI1 KI2 66 TI2 0.2075 s TH4 TH10 0.21 s
KH1 KH2 66 TI7 0.2075 s TH5 TH11 0.15 sKL11 KL17 1s TI8 0.2491 s TH6 TH12 0.07 sKI11 KI17 1s TH1 0.01513 s uLmax uLmin ±0.075
KH11 KH17 1s TH2 0.01815 s uImax uImin ±0.15TL1 1.73 s TH7 0.01815 s uHmax uHmin ±0.15TL2 2.075 s TH8 0.02179 s usmax usmin ±0.15TL7 2.075 s TL3 TL9 0.25 s - -TL8 2.491 s TL4 TL10 0.2 s - -
Energies 2017, 10, 449 13 of 15
Energies 2017, 10, 449 12 of 14
critical gain requirement of the guide. In conclusion, the NPSS can provide enough damping and
satisfy the critical gain requirement in the guide simultaneously.
Acknowledgments: This work was supported by National Natural Science Foundation of China (51577075).
Author Contributions: Ziquan Liu built the dynamic model of the system and performed the analysis and
simulations. This work was carried out under the advisement of and with regular feedback from Wei Yao and
Jinyu Wen. All authors carried out data analysis, discussed the results and contributed to writing the paper.
Conflicts of Interest: The authors declare no conflict of interest.
Appendix A
In addition to the instructions of the simulation studies, parameters of a typical generator,
PSS2A and PSS4B are given in the following tables. Models of PSS2A and PSS4B are shown in
Figures A1 and A2.
Table A1. Parameters of a typical generator.
Xd Xq X’d X’q X”d X”q
1.9341 1.9341 0.26 0.42 0.21 0.1985
T’d0 T’q0 T”d0 T”q0 TJ -
9.7 s 1 s 0.07 s 0.13 s 8 s -
Table A2. Parameters of the PSS2A.
TW1 10 s T8 0.6 s KS2 1
TW2 10 s T9 0.12 s KS3 1
TW3 10 s T1 0.2 s usmax 0.1
TW4 10 s T2 0.02 s usmin −0.1
T6 0 s T3 0.2 s M 5
T7 8 s T4 0.02 s N 1
Table A3. Parameters of the PSS4B.
KL1 KL2 66 TI1 0.173 s TH3 TH9 0.38 s
KI1 KI2 66 TI2 0.2075 s TH4 TH10 0.21 s
KH1 KH2 66 TI7 0.2075 s TH5 TH11 0.15 s
KL11 KL17 1s TI8 0.2491 s TH6 TH12 0.07 s
KI11 KI17 1s TH1 0.01513 s uLmax uLmin ±0.075
KH11 KH17 1s TH2 0.01815 s uImax uImin ±0.15
TL1 1.73 s TH7 0.01815 s uHmax uHmin ±0.15
TL2 2.075 s TH8 0.02179 s usmax usmin ±0.15
TL7 2.075 s TL3 TL9 0.25 s - -
TL8 2.491 s TL4 TL10 0.2 s - -
3
4
1
1 s
T s
T
1
2
1
1 s
T s
T
W
W
T s
T
1
11 s
W
W
T s
T
2
21 s T
6
1
1 s
W
W
T s
T
3
31 s
eP
W
W
T s
T
4
41 s
SK
T
2
71 s
N
M
T s
T
8
9
1
1 s
SK
3
su
SK
1
su
max
su
min
Figure A1. Structure of PSS2A. Figure A1. Structure of PSS2A.Energies 2017, 10, 449 13 of 14
L L
L
K T s
T
11 1
21 s
L I
L
L
T s
T
3
4
1
1 s
L
L
T s
T
5
6
1
1 s
LK
1 LK
L L
L
K T s
T
17 7
81 s
L
L
T s
T
9
10
1
1 s
L
L
T s
T
11
12
1
1 s
LK
2
I I
I
K T s
T
11 1
21 s
I
I
T s
T
3
4
1
1 s
I
I
T s
T
5
6
1
1 s
IK
1 IK
I I
I
K T s
T
17 7
81 s
I
I
T s
T
9
10
1
1 s
I
I
T s
T
11
12
1
1 s
IK
2
H H
H
K T s
T
11 1
21 s
H
H
T s
T
3
4
1
1 s
H
H
T s
T
5
6
1
1 s
HK
1
H H
H
K T s
T
17 7
81 s
H
H
T s
T
9
10
1
1 s
H
H
T s
T
11
12
1
1 s
HK
2
H
HK
Lu
max
Lu
min
Iu
max
Iu
min
Hu
max
Hu
min
usmax
usmin
su
s
s
3
4 2 2
1.759e 1
1.2739e 1.7823e s+1
s
s s s
2
3 2
80
82 161 80
L I
H
Figure A2. Structure of PSS4B.
References
1. Shi, X.; Wang, S.; Yao, W.; Waqar, A.; Zuo, W.; Tang, Y. Mechanism analysis and experimental validation
of employing superconducting magnetic energy storage to enhance power system stability. Energies 2015,
8, 656–681.
2. Mao, X.; Zhang, Y.; Guan, L.; Wu, X. Coordinated control of inter-area oscillation in the China Southern
power grid. IEEE Trans. Power Syst. 2006, 21, 845–852.
3. Yu, W.; Xue, Y.; Luo, J.; Ni, M.; Tong, H.; Huang, T. An UHV grid security and stability defense system:
Considering the risk of power system communication. IEEE Trans. Smart Grid. 2016, 7, 491–500.
4. Cai, G.; Yang, D.; Liu, C. Adaptive wide-area damping control scheme for smart grids with consideration
of signal time delay. Energies 2013, 6, 4841–4858.
5. Liu, Q. Power System Stability and Excitation Control; China Electric Power Press: Beijing, China, 2007; pp.
136–144.
6. Yao, W.; Jiang, L.; Wen, J.Y.; Wu, Q.H.; Cheng, S.J. Wide-area damping controller for power system
inter-area oscillations: A networked predictive control approach. IEEE Trans. Control Syst. Technol. 2015,
23, 27–36.
7. Yao, W.; Jiang, L.; Wen, J.Y.; Wu, Q.H.; Cheng, S.J. Wide-area damping controller of FACTS devices for
inter-area oscillations considering communication time delays. IEEE Trans. Power Syst. 2014, 29, 318–329.
8. Rogers, G. Power System Oscillations; Kluwer Academic Publishers: Boston, MA, USA, 2000; p. 171.
9. He, P.; Wen, F.; Ledwich, G.; Xue, Y.; Wang, K. Effects of various power system stabilizers on improving
power system dynamic performance. Int. J. Electr. Power Energy Syst. 2013, 46, 175–183.
10. Hassan, L.H.; Moghavvemi, M.; Almurib, H.A.F.; Muttaqi, K.M. Coordinated design of PSSs and
11. Shakarami, M.R.; Davoudkhani, I.F. Wide-area power system stabilizer design based on grey wolf
optimization algorithm considering the time delay. Electr. Power Syst. Res. 2016, 133, 149–159.
12. Sunkara, S.K.; Narne, R.; Panda, P.C. Coordinated tuning of PSS with TCSC damping controller through
advanced adaptive PSO for a multi-machine power system. In Proceedings of the 2013 International
Conference on Energy Efficient Technologies for Sustainability (ICEETS), Nagercoil, India, 10–12 April
2013; pp. 1097–1102.
Figure A2. Structure of PSS4B.
References
1. Shi, X.; Wang, S.; Yao, W.; Waqar, A.; Zuo, W.; Tang, Y. Mechanism analysis and experimental validation ofemploying superconducting magnetic energy storage to enhance power system stability. Energies 2015, 8,656–681. [CrossRef]
2. Mao, X.; Zhang, Y.; Guan, L.; Wu, X. Coordinated control of inter-area oscillation in the China Southernpower grid. IEEE Trans. Power Syst. 2006, 21, 845–852.
3. Yu, W.; Xue, Y.; Luo, J.; Ni, M.; Tong, H.; Huang, T. An UHV grid security and stability defense system:Considering the risk of power system communication. IEEE Trans. Smart Grid. 2016, 7, 491–500. [CrossRef]
4. Cai, G.; Yang, D.; Liu, C. Adaptive wide-area damping control scheme for smart grids with consideration ofsignal time delay. Energies 2013, 6, 4841–4858. [CrossRef]
5. Liu, Q. Power System Stability and Excitation Control; China Electric Power Press: Beijing, China, 2007;pp. 136–144.
6. Yao, W.; Jiang, L.; Wen, J.Y.; Wu, Q.H.; Cheng, S.J. Wide-area damping controller for power system inter-areaoscillations: A networked predictive control approach. IEEE Trans. Control Syst. Technol. 2015, 23, 27–36.[CrossRef]
7. Yao, W.; Jiang, L.; Wen, J.Y.; Wu, Q.H.; Cheng, S.J. Wide-area damping controller of FACTS devices forinter-area oscillations considering communication time delays. IEEE Trans. Power Syst. 2014, 29, 318–329.[CrossRef]
8. Rogers, G. Power System Oscillations; Kluwer Academic Publishers: Boston, MA, USA, 2000; p. 171.9. He, P.; Wen, F.; Ledwich, G.; Xue, Y.; Wang, K. Effects of various power system stabilizers on improving
power system dynamic performance. Int. J. Electr. Power Energy Syst. 2013, 46, 175–183. [CrossRef]10. Hassan, L.H.; Moghavvemi, M.; Almurib, H.A.F.; Muttaqi, K.M. Coordinated design of PSSs and UPFC-based
stabilizer using genetic algorithm. IEEE Trans. Ind. Appl. 2014, 50, 2957–2966. [CrossRef]11. Shakarami, M.R.; Davoudkhani, I.F. Wide-area power system stabilizer design based on grey wolf
optimization algorithm considering the time delay. Electr. Power Syst. Res. 2016, 133, 149–159. [CrossRef]12. Sunkara, S.K.; Narne, R.; Panda, P.C. Coordinated tuning of PSS with TCSC damping controller through
advanced adaptive PSO for a multi-machine power system. In Proceedings of the 2013 InternationalConference on Energy Efficient Technologies for Sustainability (ICEETS), Nagercoil, India, 10–12 April 2013;pp. 1097–1102.
13. Khodabakhshian, A.; Hemmati, R.; Moazzami, M. Multi-band power system stabilizer design by usingCPCE algorithm for multi-machine power system. Electr. Power Syst. Res. 2013, 101, 36–48. [CrossRef]
14. Soliman, H.M.; Yousef, H.A. Saturated robust power system stabilizers. Int. J. Electr. Power Energy Syst. 2015,73, 608–614. [CrossRef]
15. Soliman, M.; Elshafei, A.L.; Bendary, F.; Mansour, W. Robust decentralized PID-based power system stabilizerdesign using an ILMI approach. Electr. Power Syst. Res. 2010, 81, 1488–1497. [CrossRef]
16. Tang, K.; Venayagamoorthy, G.K. An LMI-SSI model based PSS design approach for a multi-machinepower system. In Proceedings of the Clemson University Power Systems Conference, Clemson, SC, USA,10–13 March 2015; pp. 1–7.
17. Zhao, P.; Yao, W.; Wang, S.R.; Wen, J.Y.; Cheng, S.J. Decentralized nonlinear synergetic power systemstabilizers design for power system stability enhancement. Int. Trans. Electr. Energy Syst. 2014, 24, 1356–1368.[CrossRef]
18. Bouchama, Z.; Harmas, M.N. Optimal robust adaptive fuzzy synergetic power system stabilizer design.Electr. Power Syst. Res. 2012, 83, 170–175. [CrossRef]
19. Guide for Setting Test of Power System Stabilizer; Std DL/T 1231-2013; National Energy Administration ofChina: Beijing, China, 2013.
20. Shahgholian, G.; Faiz, J. Coordinated control of power system stabilizer and FACTS devices for dynamicperformance enhancement—State of art. In Proceedings of the 2016 2nd International Conference onIntelligent Energy and Power Systems (IEPS), Kyiv, Ukraine, 7–11 June 2016; pp. 1–6.
21. Shayeghil, H.; Moradzadeh, M.; Ghasemi, A.; Vandevelde, L. Simultaneous optimal placement andparameter-tuning of SVC, TCSC and PSS using honey-bee mating optimization. In Proceedings of the2013 IEEE PES Asia-Pacific Power and Energy Engineering Conference (APPEEC), Hongkong, China,8–11 December 2013; pp. 1–5.
22. Mobarak, M.; Thorne, D.; Hill, E. Optimization of exciter and stabilizer parameters of a large thermalgenerating station. IEEE Trans. Power Appar. Syst. 1978, PAS-97, 1182–1193. [CrossRef]
23. Larsen, E.V.; Swann, D.A. Applying power system stabilizers part II: Performance objectives and tuningconcepts. IEEE Trans. Power Appar. Syst. 1981, PAS-100, 3025–3033. [CrossRef]
24. Murdoch, A.; Venkataraman, S.; Lawson, R.A.; Pearson, W.R. Integral of accelerating powertype PSS I:Theory, design, and tuning methodology. IEEE Trans. Energy Convers. 1999, 14, 1658–1663. [CrossRef]
25. Chung, C.Y.; Tse, C.T.; Wang, K.W.; Niu, R. PSS design for multi-area system based on combined sensitivityconcept. In Proceedings of the IEEE International Conference on Power System Technology, Perth, Australia,4–7 December 2000; pp. 1197–1202.
26. Gencoglu, C.; Tor, O.B.; Cebeci, E.; Yilmaz, O.; Guven, A.N. Assessment of the effect of hydroelectric powerplants’ governor settings on low frequency inter area oscillations. In Proceedings of the IEEE InternationalConference on Power System Technology, Hangzhou, China, 24–28 October 2010; pp. 1–8.
27. Bollinger, K.E.; Gu, W.; Norum, E. Accelerating power versus electrical power as input signals to powersystem stabilizers. IEEE Trans. Energy Convers. 1991, 6, 610–626. [CrossRef]
28. Kamwa, I.; Grondin, R.; Trudel, G. IEEE PSS2B versus PSS4B: The limits of performance of modern powersystem stabilizers. IEEE Trans. Power Syst. 2005, 20, 903–915. [CrossRef]
29. IEEE Recommended Practice for Excitation System Models for Power System Stability Studies; IEEE Std 421.5-2016;IEEE Power and Energy Society: New York, NY, USA, 2016.
30. Zhao, X.; Xie, H.; Lu, S.; Liu, G.; Wu, T.; Su, W.; Shi, Y.; Yang, B.; Li, W. Parameter setting and on-site test ofpower system stabilizer—PSS4B. Power Syst. Technol. 2016, 40, 508–513.
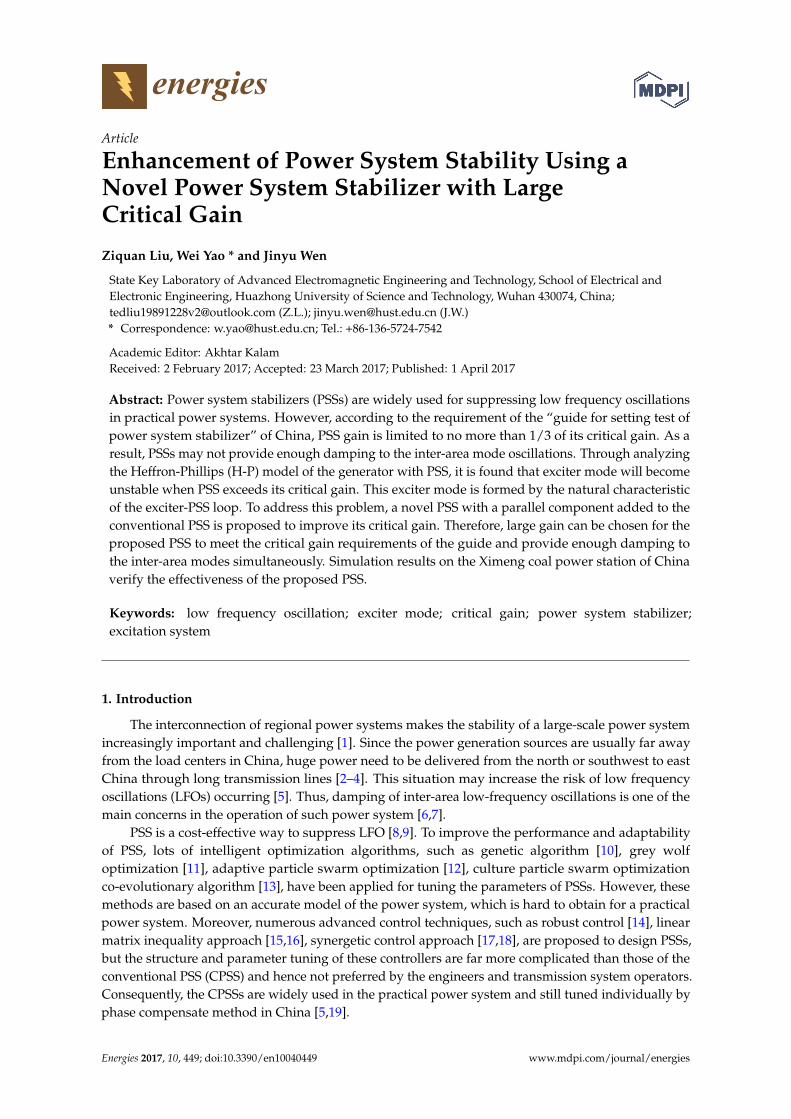
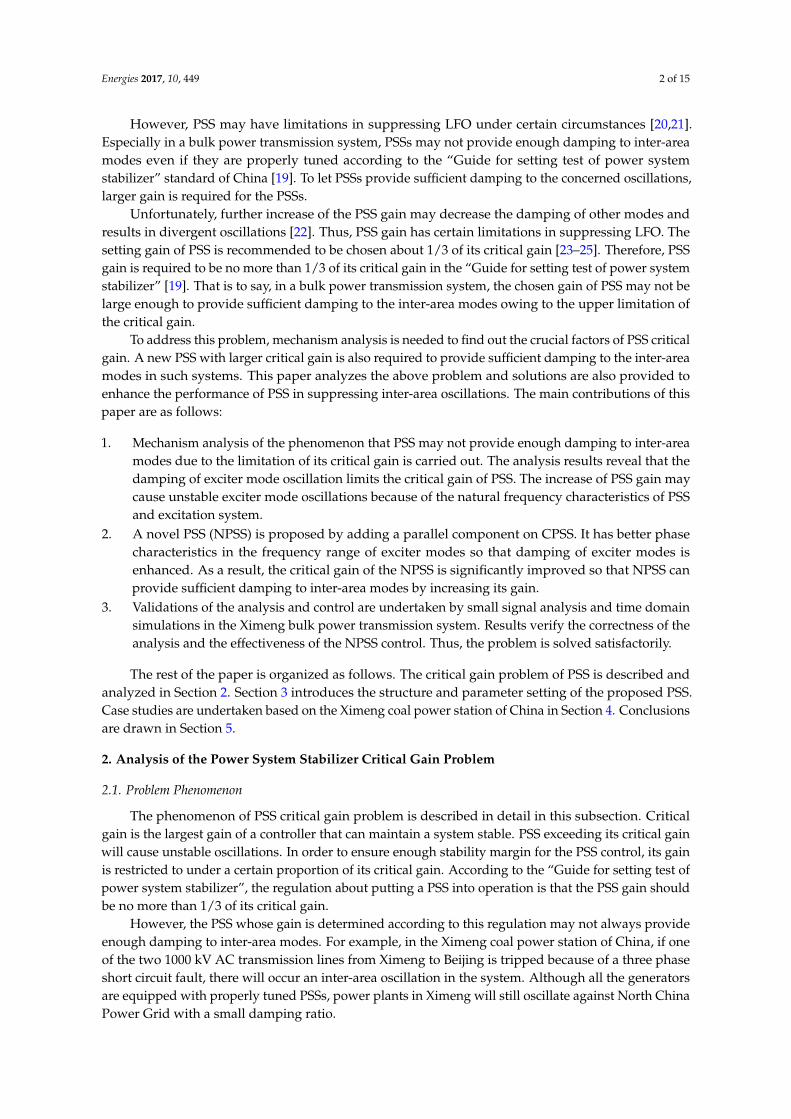
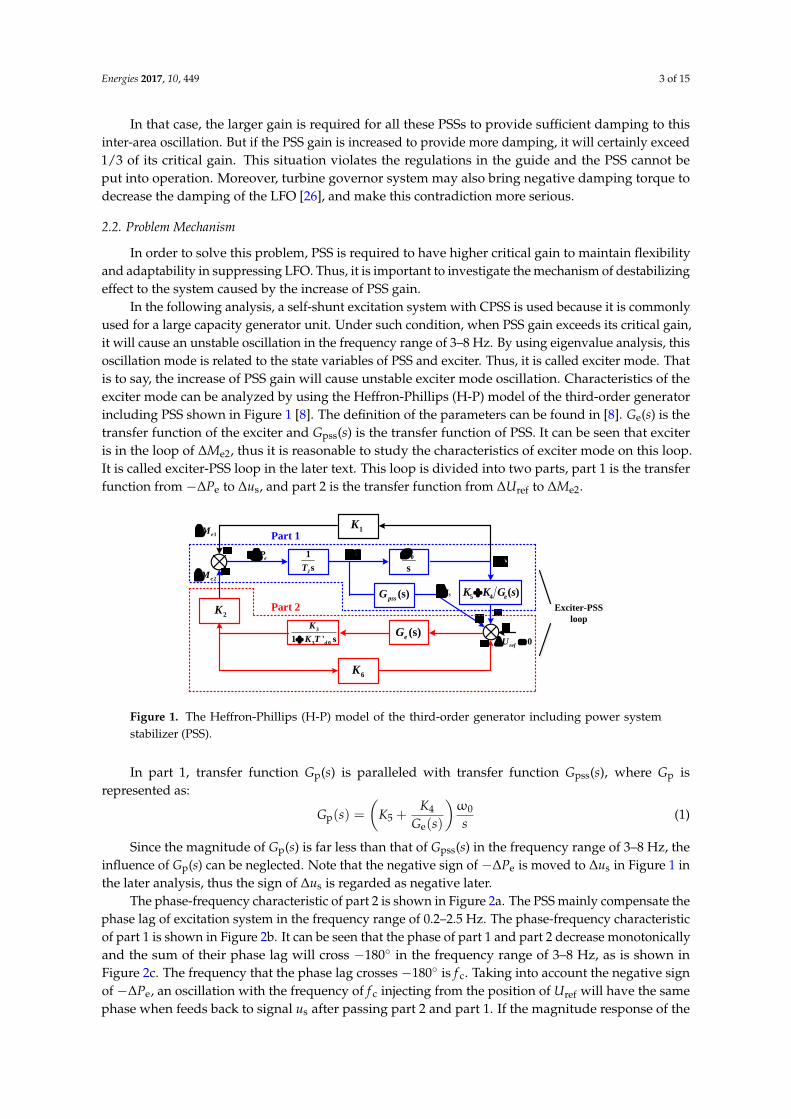
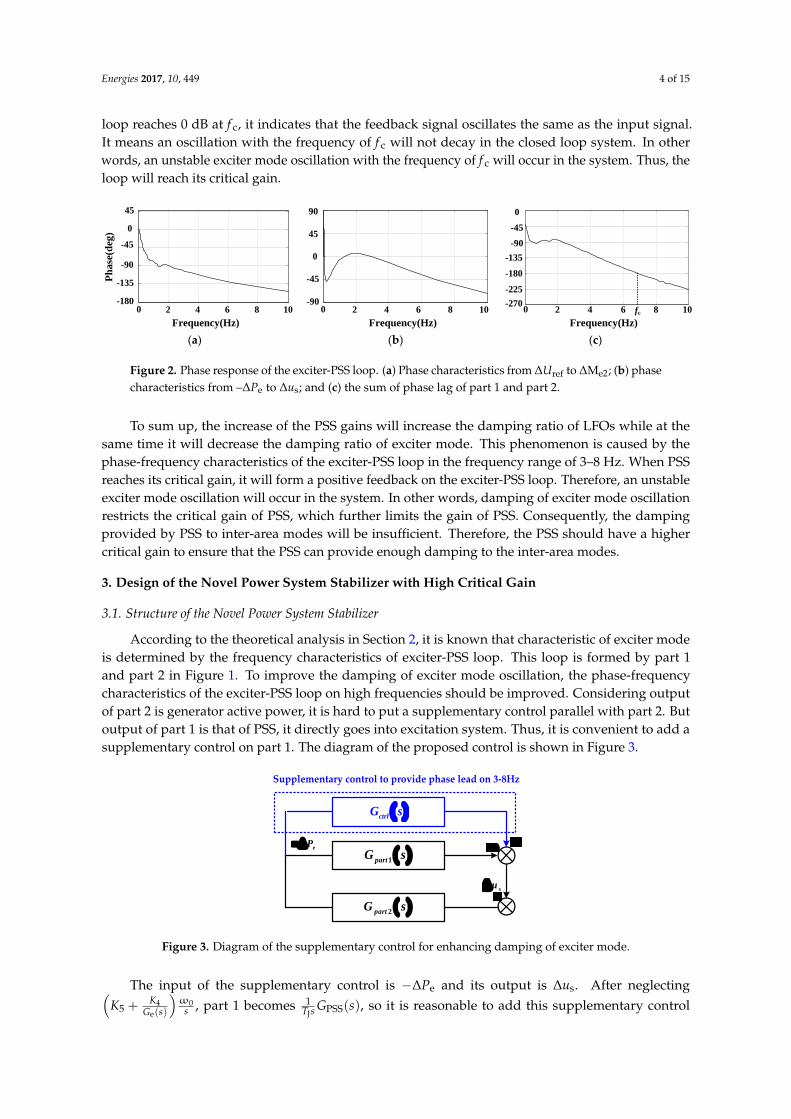
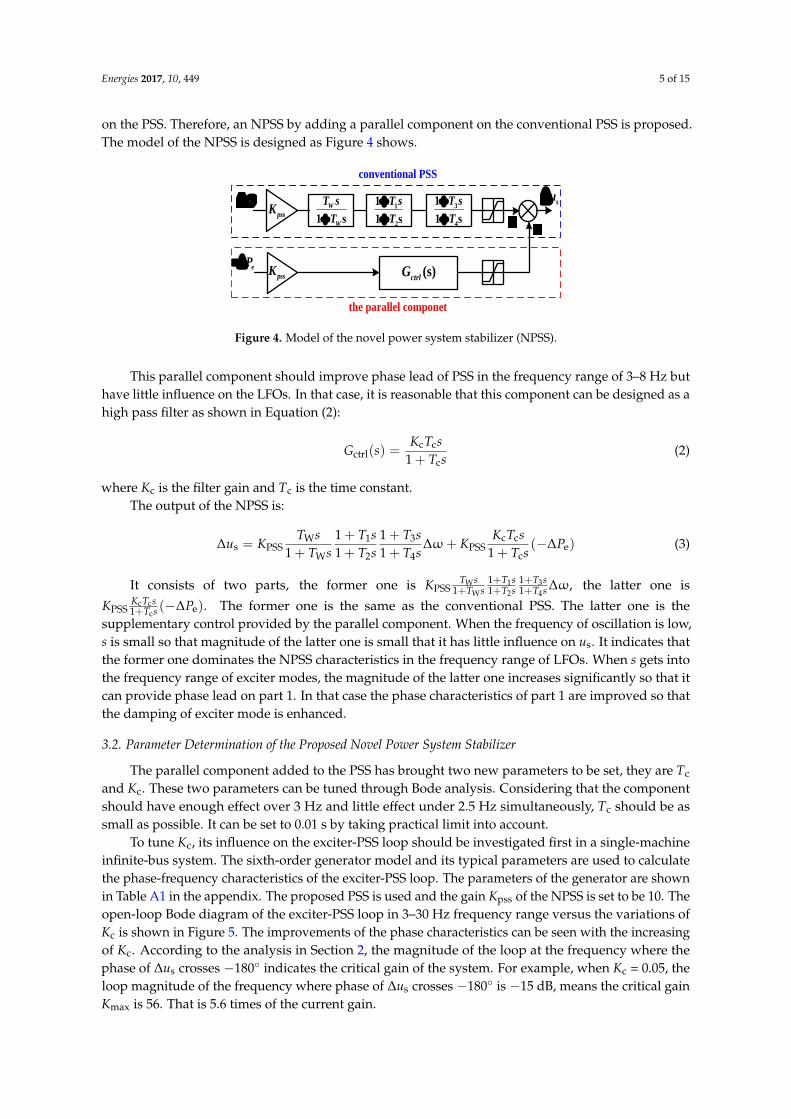
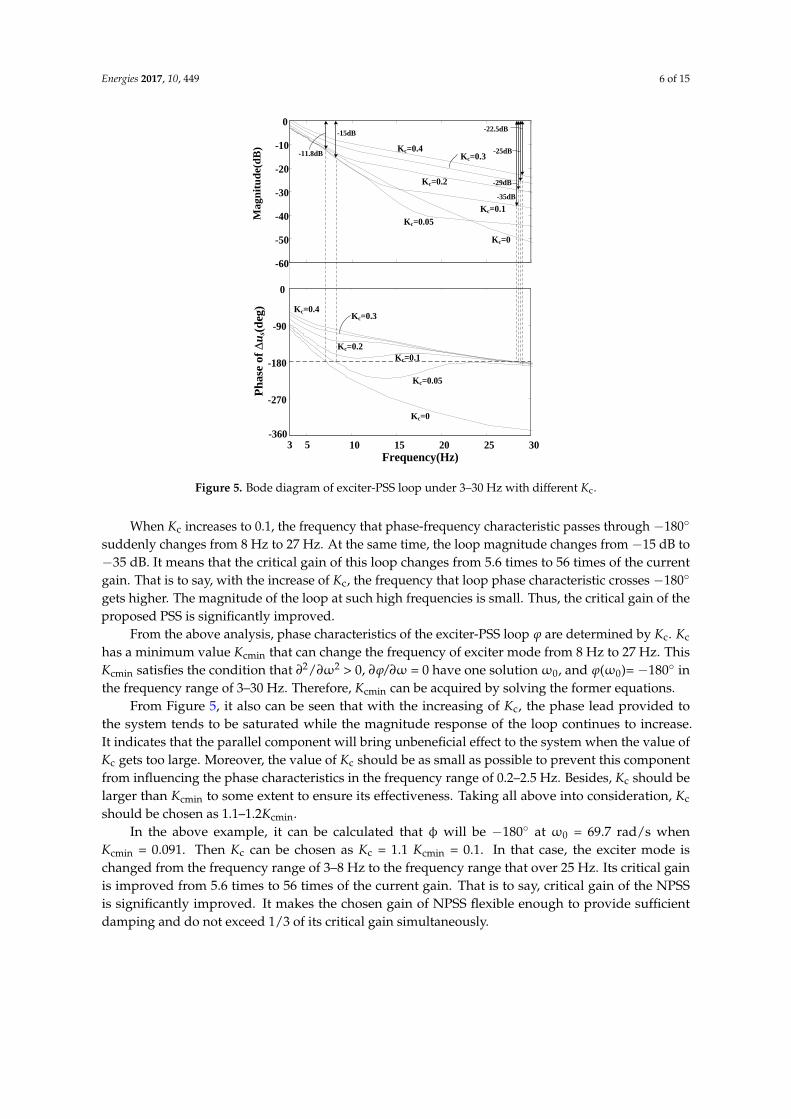
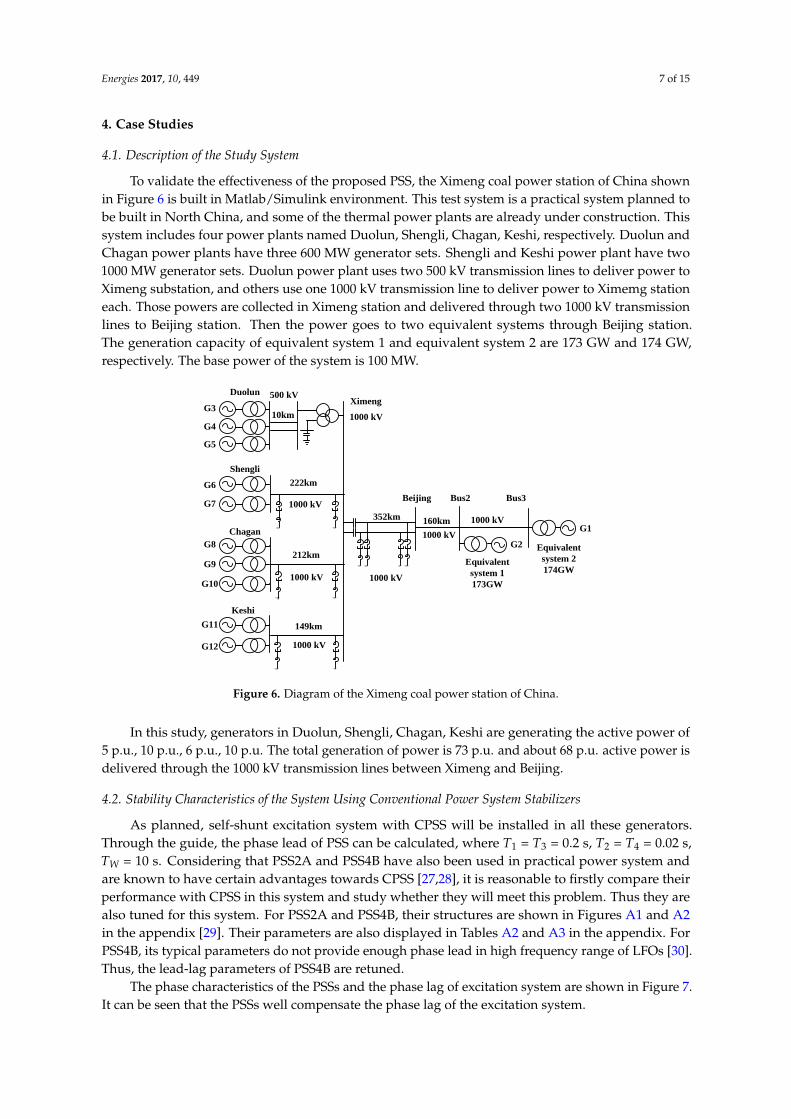
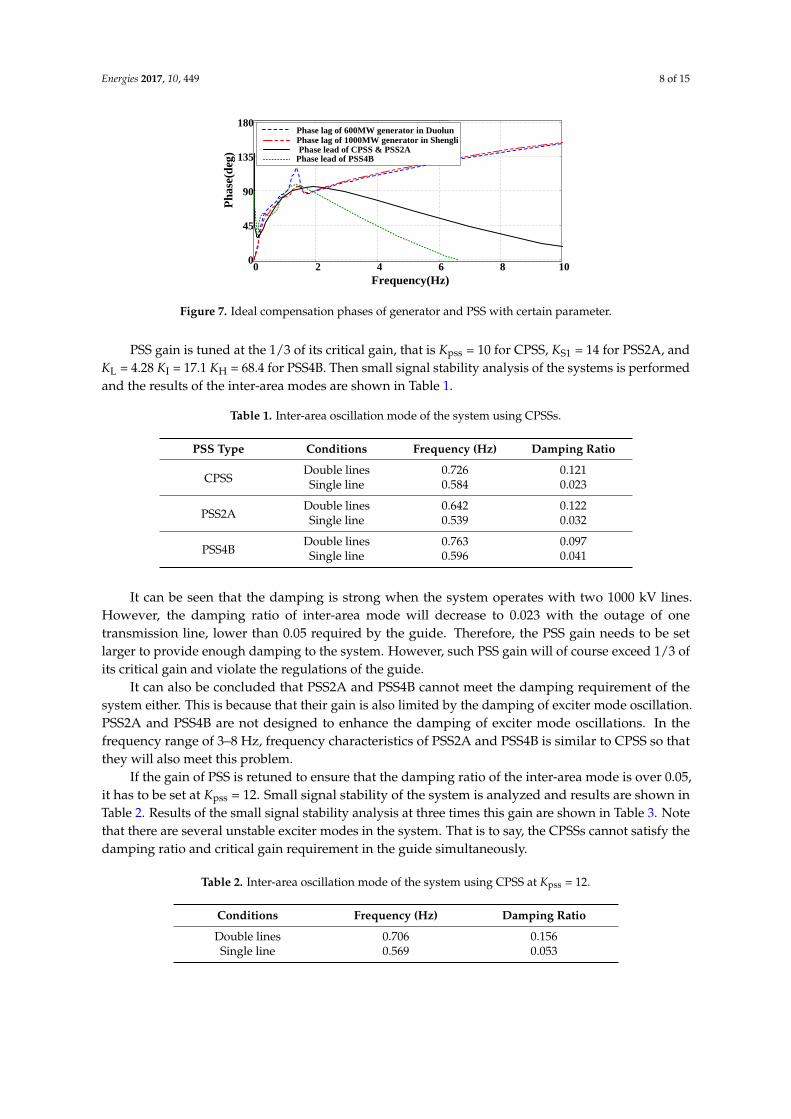
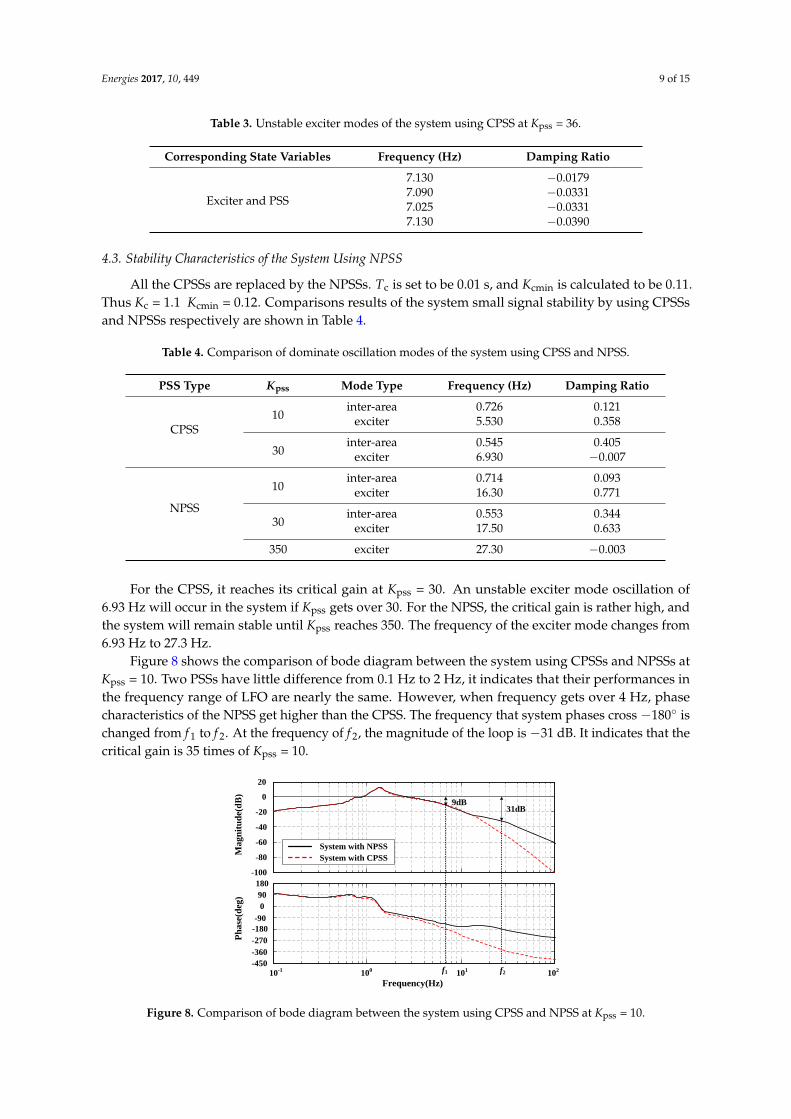
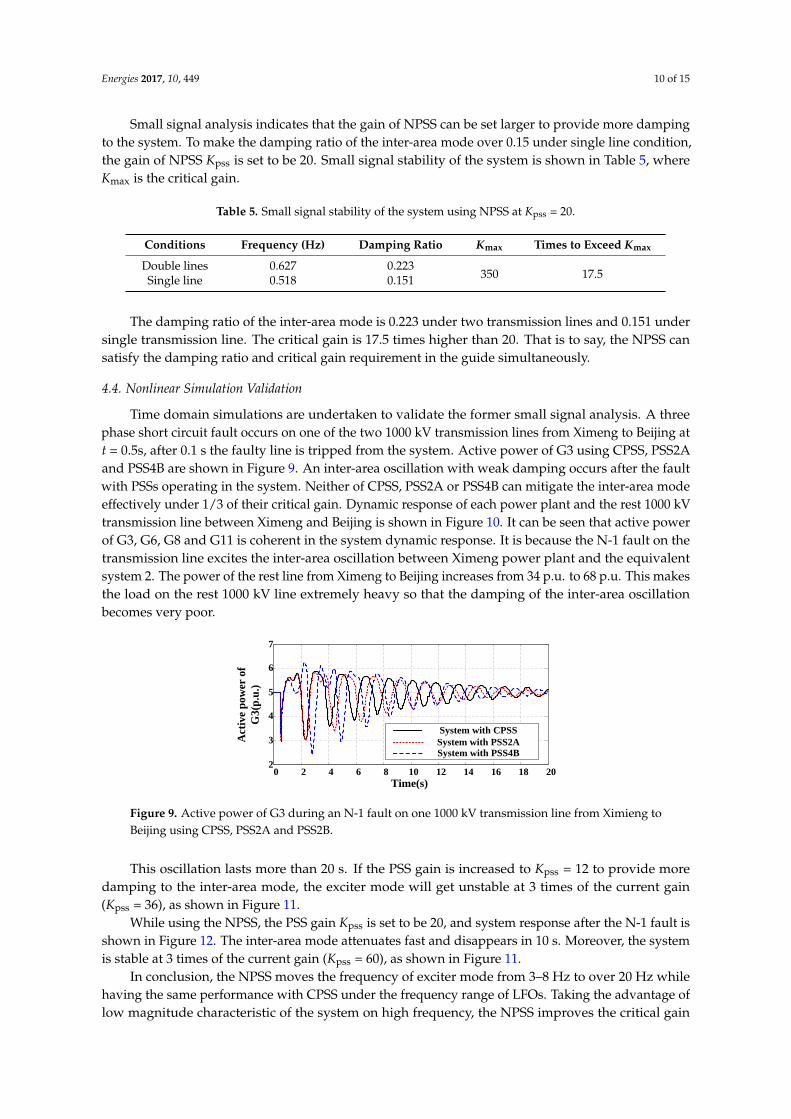
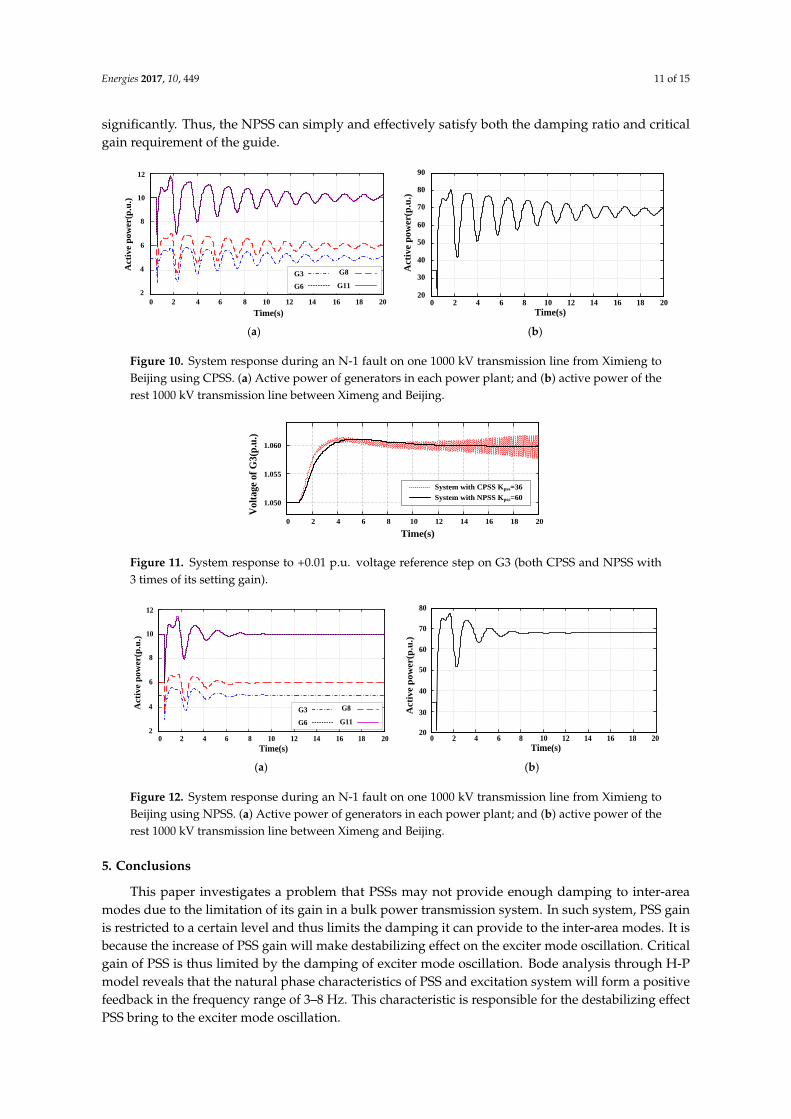
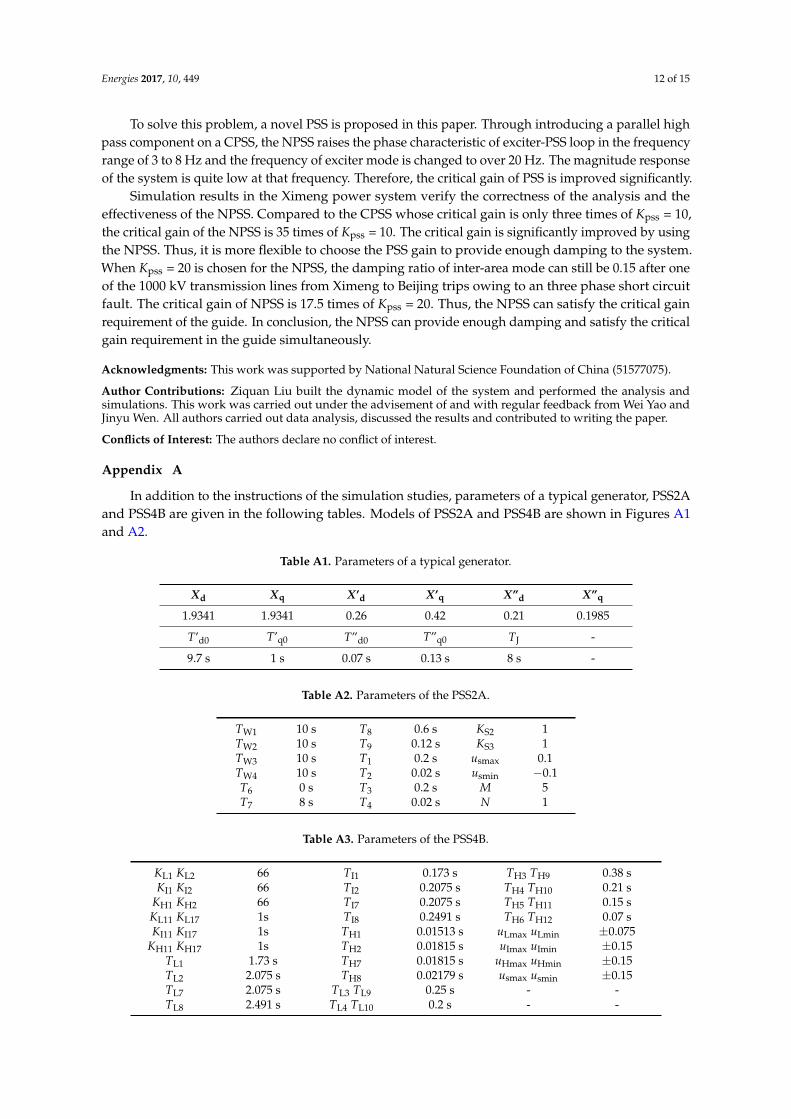
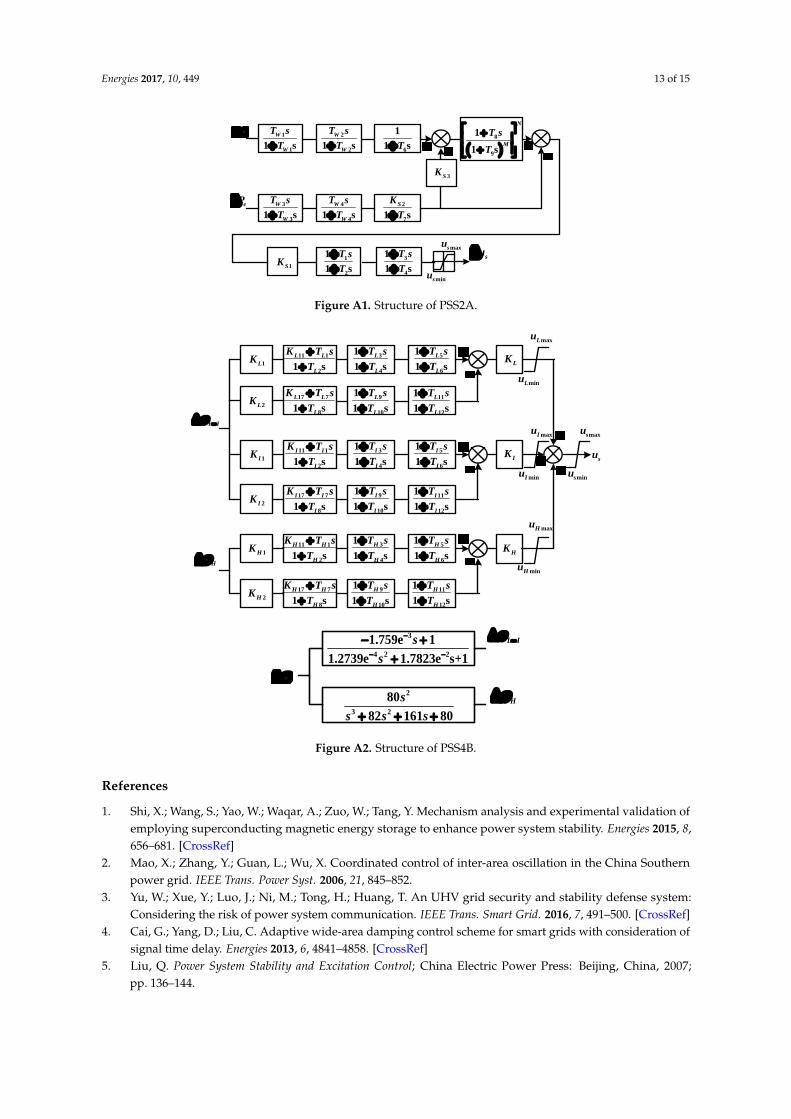
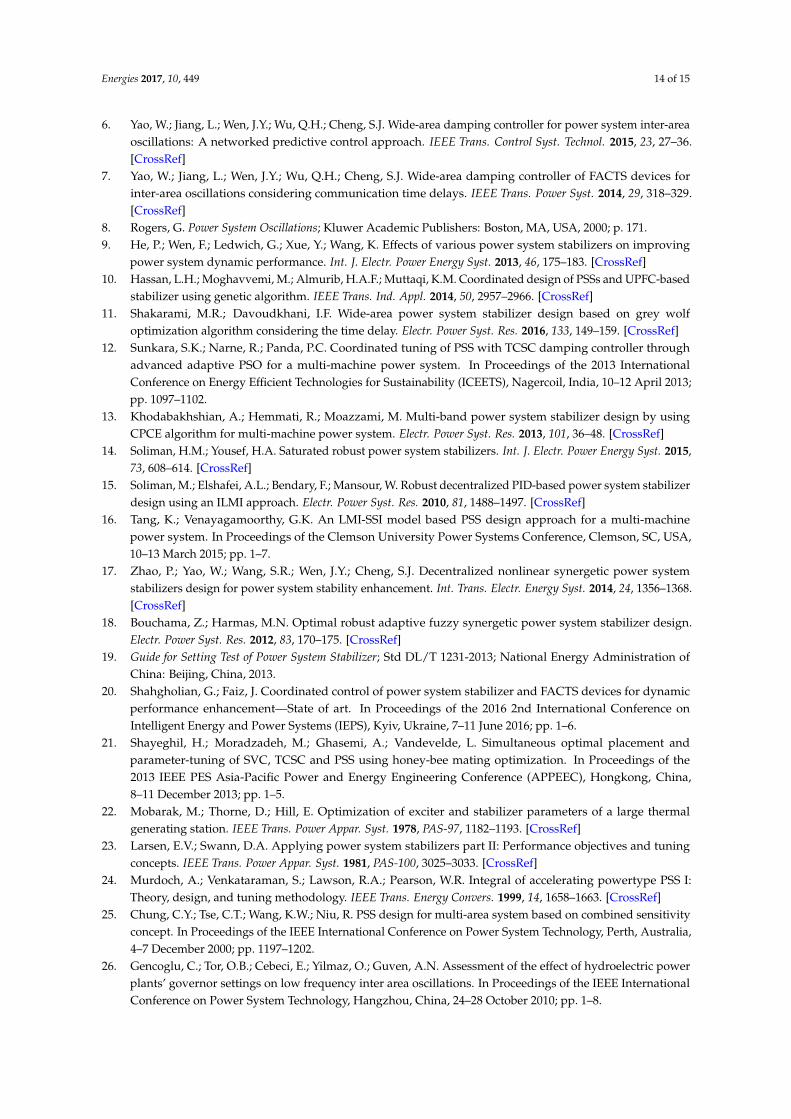


![Voltage Stability Enhancement in Large Power … Stability Enhancement in Large Power System by using STATCOM Punam Domkawale1, V.K. Chandrakar2 1PG student[IPS],Dept.of EE,GHRCE,Nagpur,India](https://static.documents.pub/doc/80x56/5b1e63ad7f8b9a116d8b7e47/voltage-stability-enhancement-in-large-power-stability-enhancement-in-large-power.jpg)


![Stability Enhancement of Multi-Machine Power System … · the PV and wind plants in the power system stability [9]. This motive us to evaluate the proposed control system considering](https://static.documents.pub/doc/80x56/5e7f7cd6da4ce2213a2299da/stability-enhancement-of-multi-machine-power-system-the-pv-and-wind-plants-in-the.jpg)


