Page 1
Enhancement of the cooling performance of microchannel heat sinks
A Thesis
Presented to the
Faculty of the Graduate School
University of Missouri-Columbia
In Partial Fulfillment
of the Requirement for the Degree of
Master of Science
By
Bahram Rajabifar
Dr. Matthew Maschmann, Thesis Supervisor
December 2016
Page 2
The undersigned, appointed by the dean of the Graduate School, have examined the thesis
entitled
“Enhancement of the cooling performance of microchannel heat sinks”
presented by Bahram Rajabifar, a candidate for the degree of Master of Science, and hereby
certify that, in their opinion, it is worthy of acceptance.
Professor Matthew Maschmann
Professor Sanjeev Khanna
Professor Mahmoud Almasri
Page 3
To my dear wife (Nayere),
and
my adorable baby (Ryan)
Page 4
ii
ACKNOWLEDGEMENT
I wish to express my sincere gratitude to Prof. Matthew Maschmann, my academic advisor, and
committee chair, for guiding me into the exciting micro/nanoscience field, for encouraging me to
be creative and think deeper, and advising me to try different ideas. His enthusiasm, efficient
discussions, and trust, convert the research activities for me to an enjoyable journey to the glorious
world of new ideas. I do appreciate that and I know without his priceless support, this study could
not be carried out and completed.
I would also deeply thank Prof. Sanjeev Khanna for his persistent support, trust, and help. I really
appreciate his constructive comments, criticism and the freedom he gave me to explore my ideas.
I also thank the committee member, Prof. Mahmoud Almasri, for his improving comments.
Last but not the least, I wish to thank my dear wife, Nayere, and also my parents, for their continual
support, encouragement and understanding during my study.
Page 5
iii
List of Contents
ACKNOWLEDGEMENT ..................................................................................................................... ii
List of Figures and Tables: ................................................................................................................ v
Nomenclature................................................................................................................................ ix
ABSTRACT...................................................................................................................................... xi
Chapter 1. Introduction .......................................................................................................................1
1. Electronic cooling ....................................................................................................................1
2. Nano-PCMs Suspension ...........................................................................................................4
3. Carbon nanotube growth .........................................................................................................6
Chapter 2. Micro Pin Fin Heat Sinks with Nano-Encapsulated Phase Change Materials ......................... 12
1. Introduction .......................................................................................................................... 12
2. Literature Review: ................................................................................................................. 12
3. Problem Definition and Method of Solution: ........................................................................... 16
4. Grid independency and Validation: ......................................................................................... 21
5. Results and Discussions.......................................................................................................... 23
6. Summary and Conclusion of this Chapter ................................................................................ 33
Chapter 3. Effects of Pin Tip-Clearance on the Performance of an Enhanced Microchannel Heat Sink ... 35
1. Introduction .......................................................................................................................... 35
2. Literature Review .................................................................................................................. 35
3. Mathematical modeling and governing equations ................................................................... 38
4. Slurry thermophysical properties: ........................................................................................... 41
5. Boundary Conditions ............................................................................................................. 44
6. Numerical Solutions, Grid independency, and Code Validation ................................................. 45
7. Results and Discussions.......................................................................................................... 49
7.1. Effect of NEPCM slurry: ................................................................................................ 49
7.2. Effect of Tip clearance.................................................................................................... 56
8. Summary and Conclusion of this Chapter ................................................................................ 59
Chapter 4. Using PCM Slurry and Nanofluid Coolants in a Double Layered Microchannel Heatsink ...... 61
1. Introduction .......................................................................................................................... 61
2. Literature Review .................................................................................................................. 62
3. Problem Definition and Mathematical Modeling ..................................................................... 63
4. Thermophysical properties of NEPCM slurry: ........................................................................... 67
Page 6
iv
5. Thermophysical properties of Nanofluid: ................................................................................ 69
6. Numerical Solutions and Boundary Conditions ........................................................................ 70
7. Grid independency and Code Validation:................................................................................. 72
8. Results and Discussions.......................................................................................................... 74
9. Summary and Conclusion of this Chapter ................................................................................ 83
Chapter 5. Precise three-dimensional machining of vertically aligned carbon nanotube forests ............... 84
1. Introduction .......................................................................................................................... 84
2. Literature Review and Experimental setup .............................................................................. 85
3. Results and Discussion ........................................................................................................... 89
Chapter 6. Contributions and Future Works ........................................................................................ 97
4. Key contributions of this work ................................................................................................ 97
5. Future directions ................................................................................................................... 99
References ..................................................................................................................................... 100
Page 7
v
List of Figures and Tables:
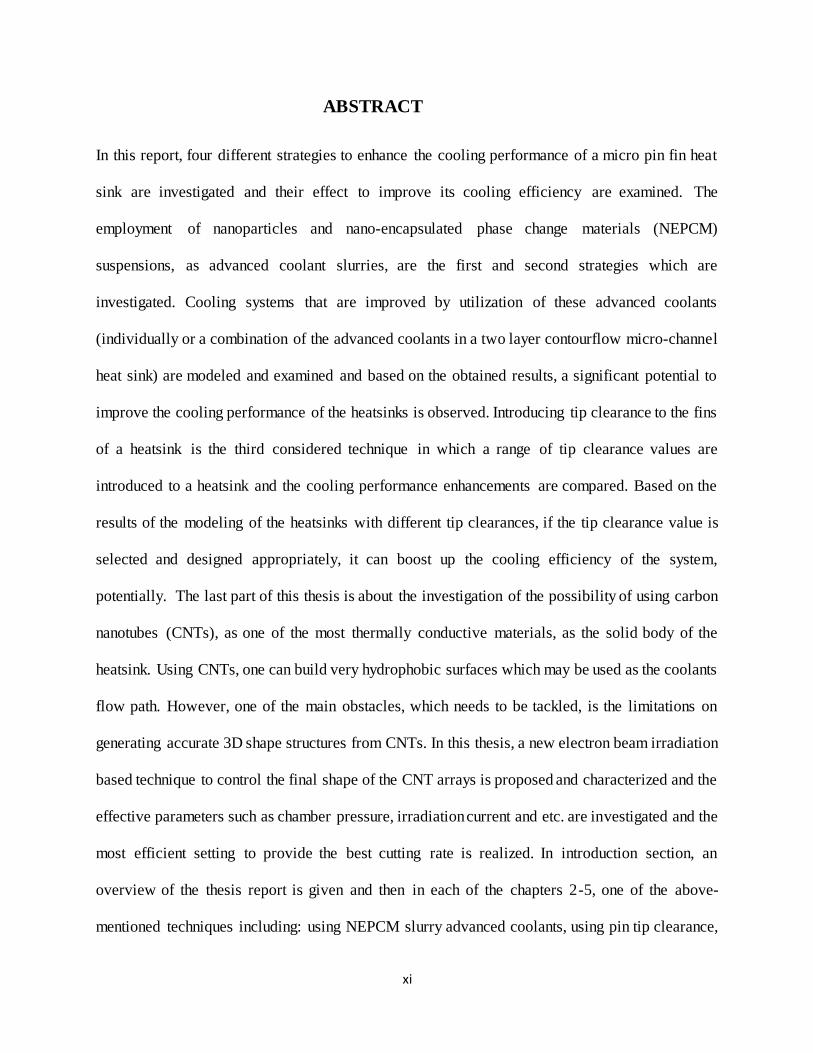
Figure 1. Schematic of a micro pin fin heat sink with nano-encapsulated phase change materials
(NEPCM) particles ...............................................................................................................................2
Figure 2. Scanning electron microscopy image of an advanced pin fin heat sink (scale bar: 500 µm) made
by patterned CNT pillars and thermal CFD modeling of that [1]. ............................................................3
Figure 3. SEM (A) and TEM (B) images of polystyrene encapsulated paraffin nanoparticles [2]. ...............5
Figure 4. CNT forest and graphene research and applications overview [3]. ...........................................7
Figure 5. CNT lattice structures and their orientation on a graphene layer [4]. ........................................8
Figure 6. The most widely accepted growth mechanisms proposed by different research groups .......... 10
Figure 7. SEM image of the patterned CNT pillars. .............................................................................. 11
Figure 8. Schematic of the computational domain .............................................................................. 17
Figure 9. Specific heat of NEPCM as a function of temperature............................................................ 19
Figure 10. Comparison of result using current model, numerical model in [17] and experimental data in
[26].................................................................................................................................................. 22
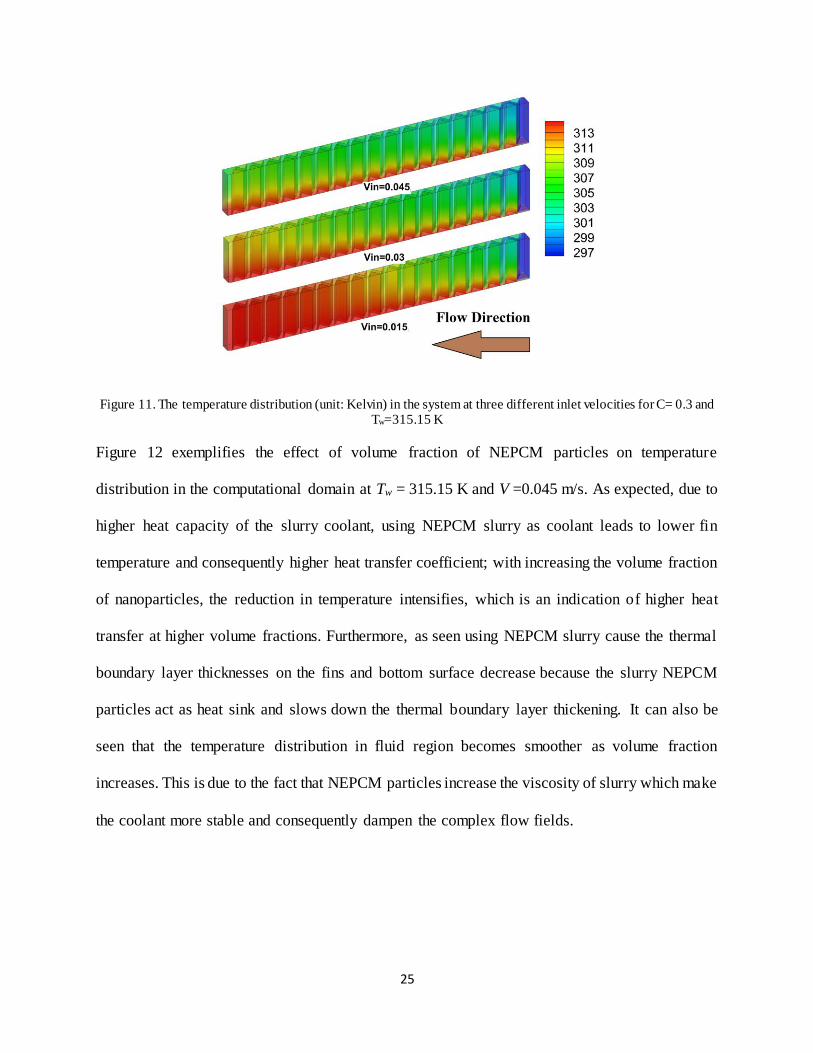
Figure 11. The temperature distribution (unit: Kelvin) in the system at three different inlet velocities for
C= 0.3 and Tw=315.15 K ..................................................................................................................... 25
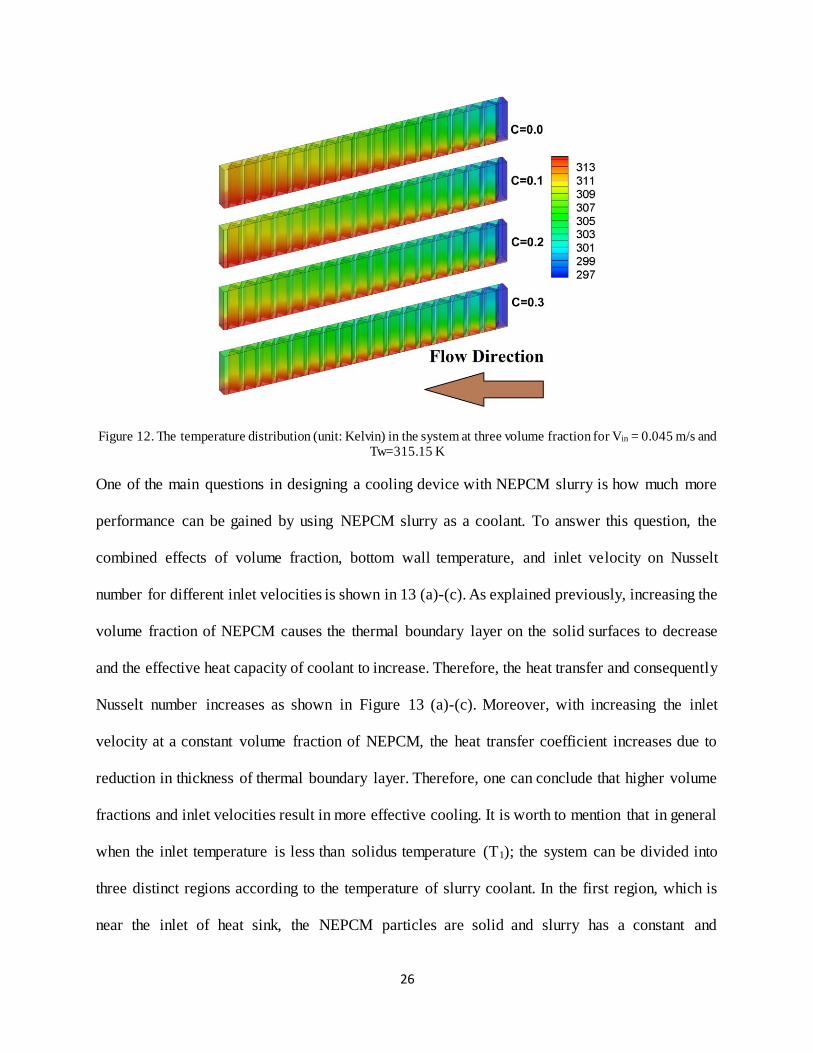
Figure 12. The temperature distribution (unit: Kelvin) in the system at three volume fraction for V in =
0.045 m/s and Tw=315.15 K .............................................................................................................. 26
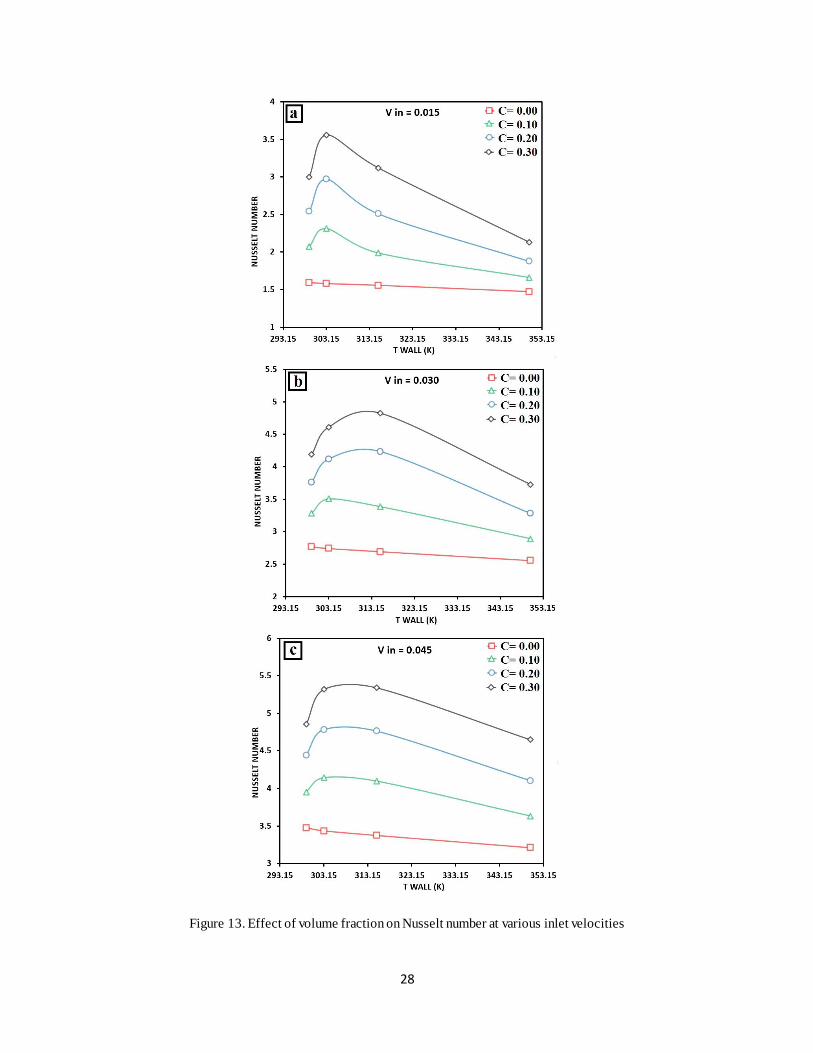
Figure 13. Effect of volume fraction on Nusselt number at various inlet velocities ................................ 28
Figure 14. The distribution of specific heat (unit: J/kg.K) of slurry in the system at constant inlet velocity
of 0.015 m/s and volume fraction of 0.3............................................................................................. 30
Figure 15. The distribution of specific heat (unit: J/kg.K) of slurry in the system at bottom wall
temperature of 315.15 K and volume fraction of 0.3 ........................................................................... 31
Figure 16. Effect of volume fraction on Euler number at various bottom wall temperatures .................. 32
Figure 17. The distribution of viscosity of slurry (unit: kg/m.s) in a plane cutting the fins at the middle of
height computational domain for last seven fins, for a bottom wall temperature of 315.15 K and inlet
velocity of 0.045 m/s at various volume fractions ............................................................................... 33
Figure 18. Schematic of the physical layout of the heatsink (left) and a typical section view from heat
sink area (right). ............................................................................................................................... 38
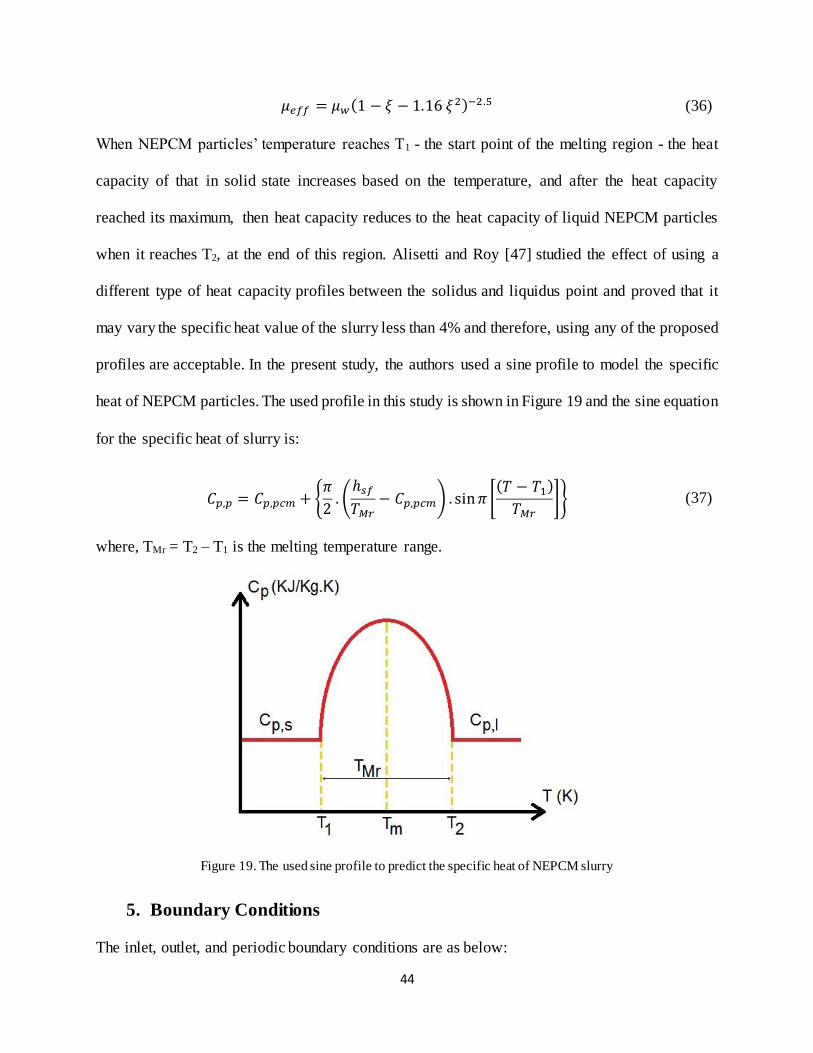
Figure 19. The used sine profile to predict the specific heat of NEPCM slurry ....................................... 44
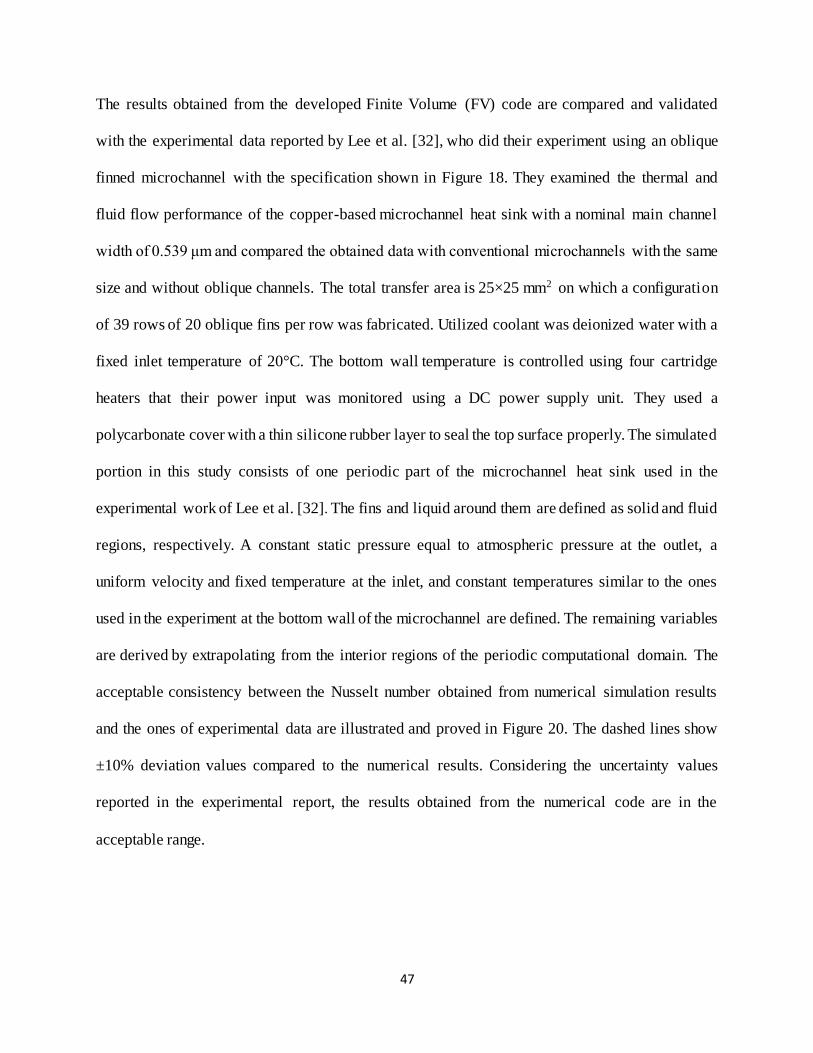
Figure 20. The obtained results from FV code and the ones of experimental test .................................. 48
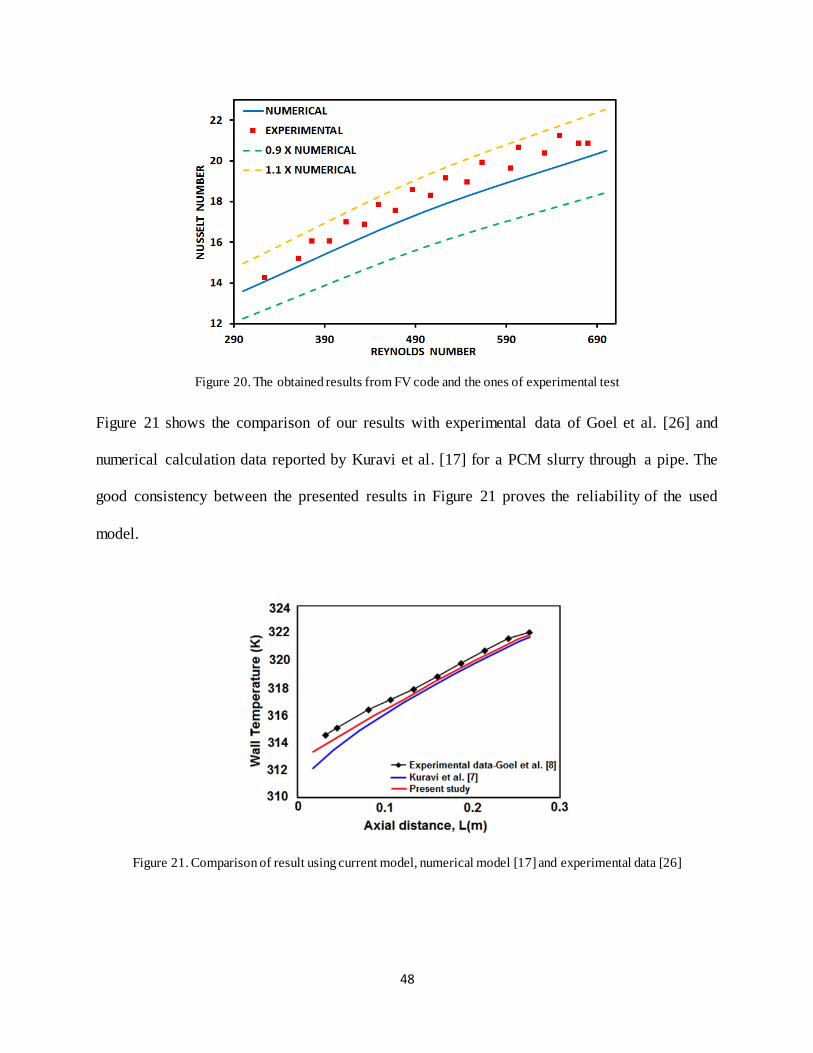
Figure 21. Comparison of result using current model, numerical model [17] and experimental data [26]
........................................................................................................................................................ 48
Figure 22. Nusselt number and bulk temperature variations versus Reynolds Number at different NEPCM
volume fractions and bottom wall temperatures ................................................................................ 50
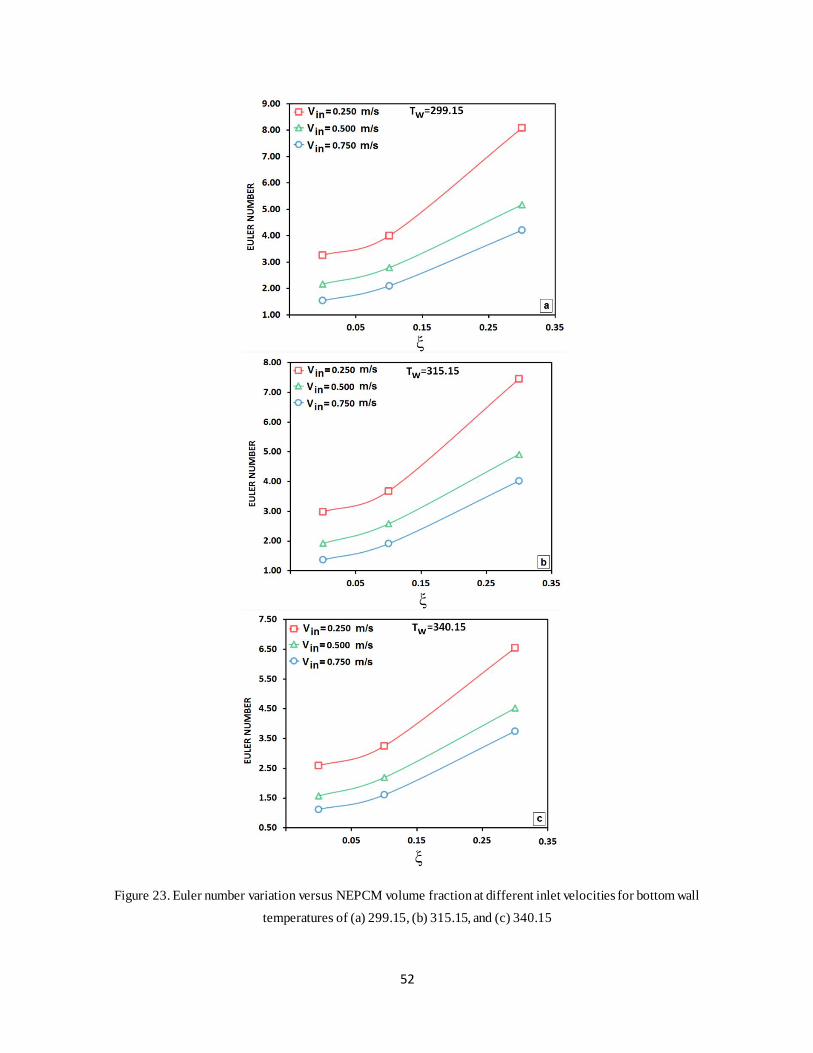
Figure 23. Euler number variation versus NEPCM volume fraction at different inlet velocities for bottom
wall temperatures of (a) 299.15, (b) 315.15, and (c) 340.15................................................................. 52
Figure 24. The contours of (a): Specific heat, (b): Viscosity, (c): Temperature and (d): Velocity at the
surface passing the middle of the computational domain height ......................................................... 54
Figure 25. Variations of Nusselt and Euler numbers versus tip clearance to channel width ratio at
different NEPCM volume fractions. .................................................................................................... 56
Figure 26. Ratios of Nusselt and Euler numbers of the heat sink with tip clearance to the heat sink
without tip clearance: (a) with NEPCM slurry coolant, and (b) pure water coolant ................................ 58
Page 8
vi
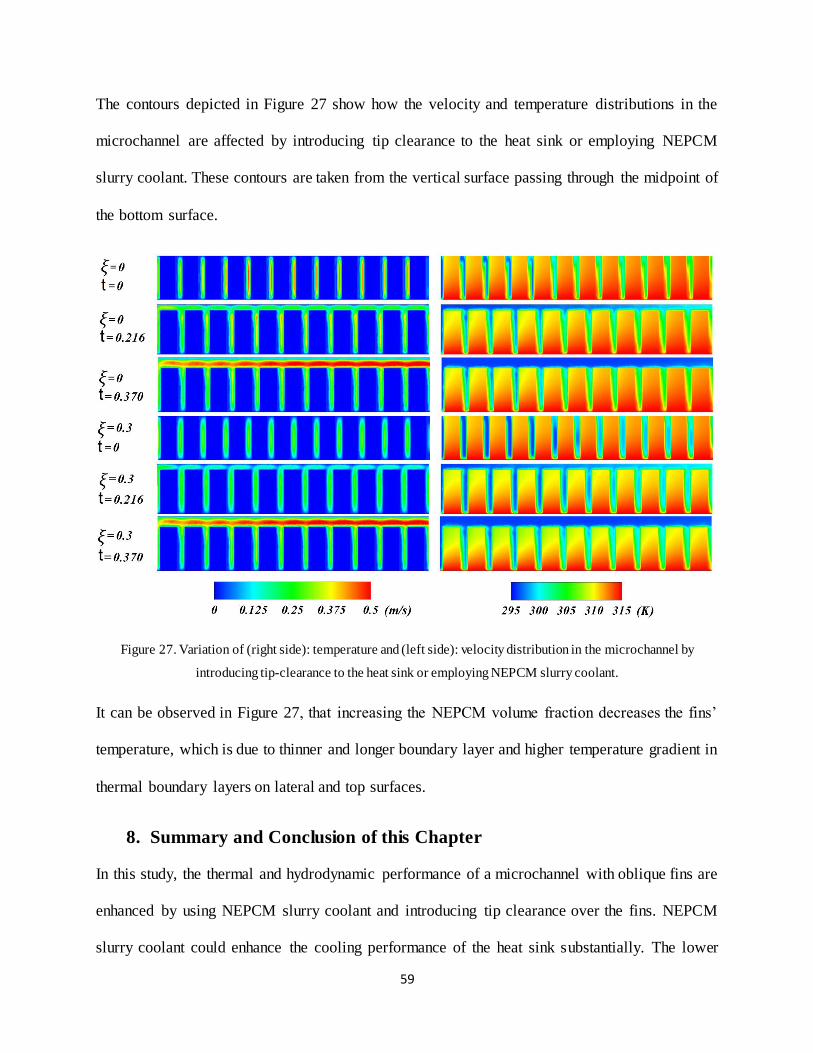
Figure 27. Variation of (right side): temperature and (left side): velocity distribution in the microchannel
by introducing tip-clearance to the heat sink or employing NEPCM slurry coolant. ............................... 59
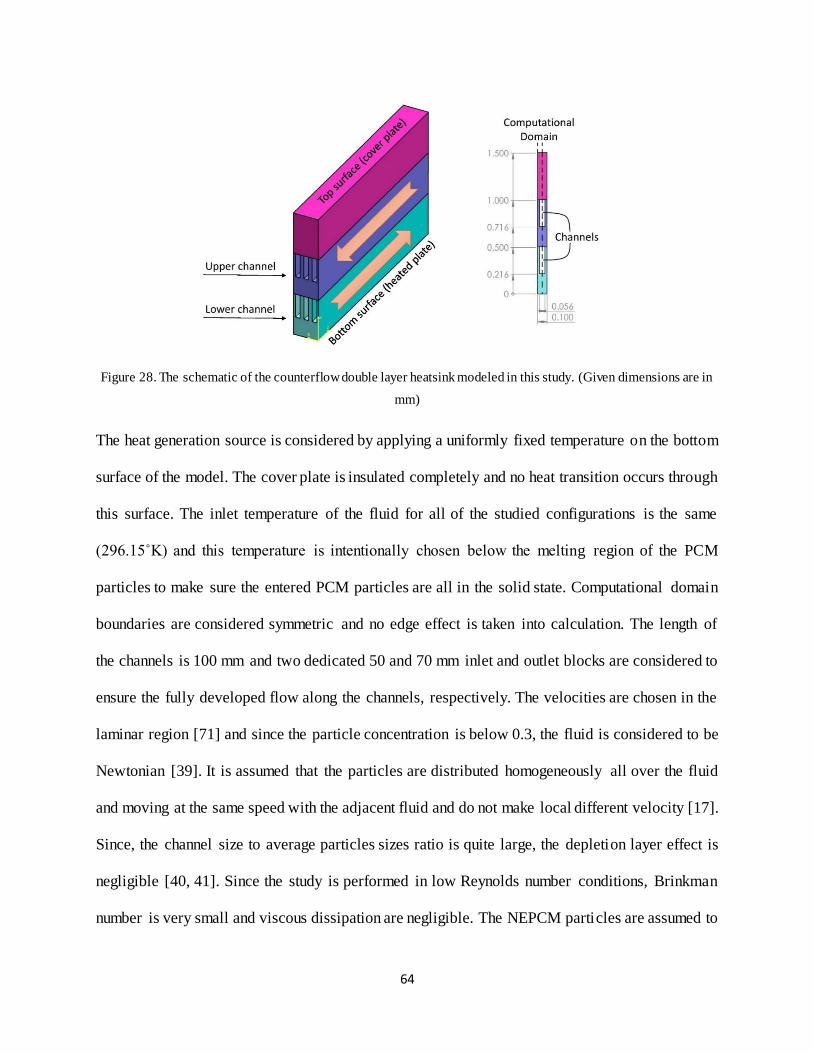
Figure 28. The schematic of the counterflow double layer heatsink modeled in this study. (Given
dimensions are in mm)...................................................................................................................... 64
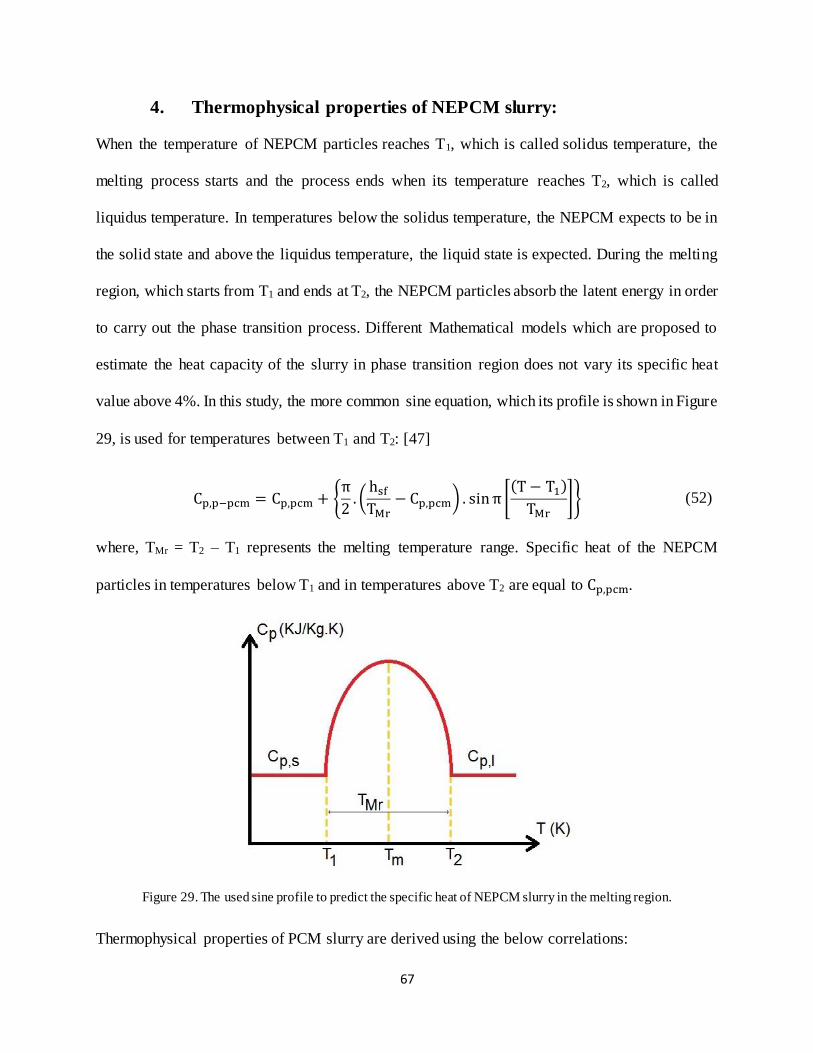
Figure 29. The used sine profile to predict the specific heat of NEPCM slurry in the melting region........ 67
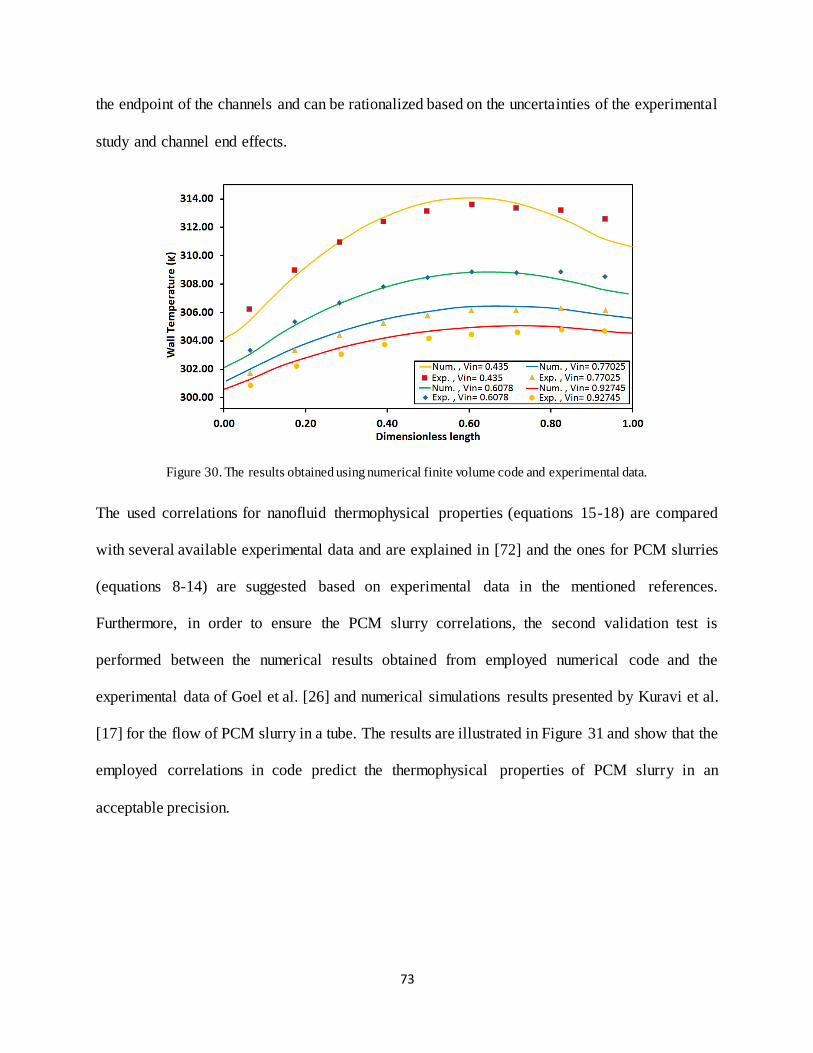
Figure 30. The results obtained using numerical finite volume code and experimental data. ................. 73
Figure 31. Comparison of the results obtained using current code, results reported from the numerical
model [17] and experimental data [26]. ............................................................................................. 74
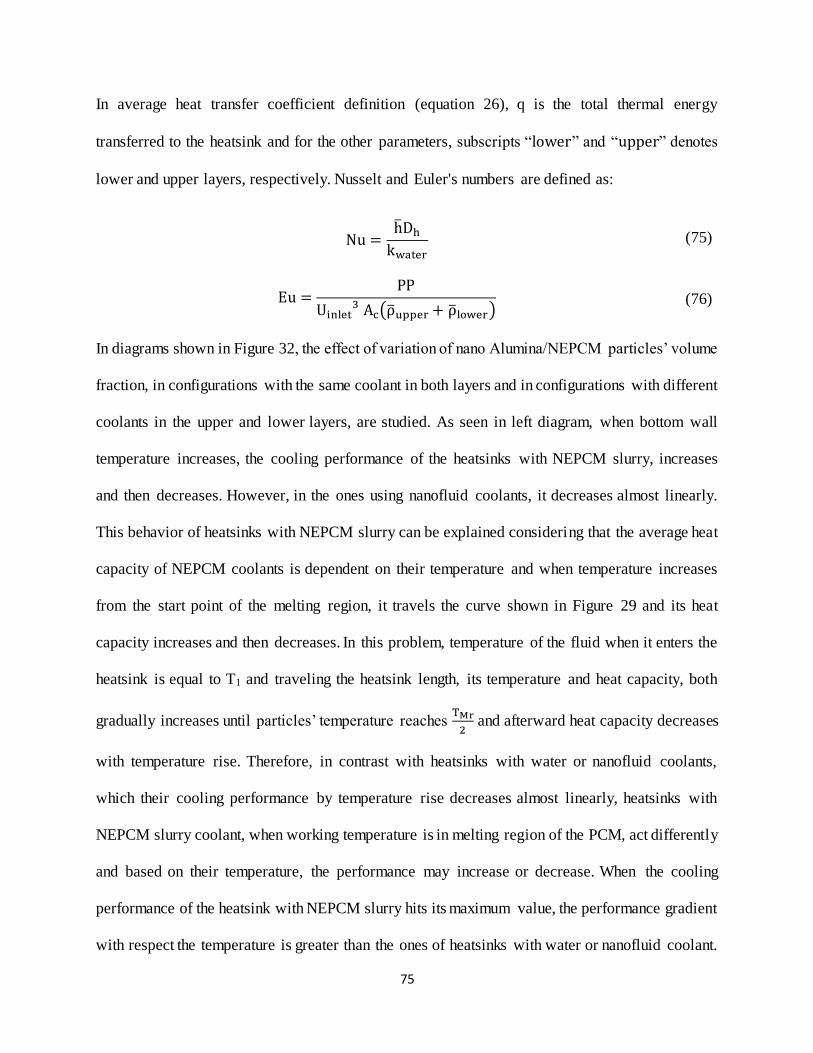
Figure 32. Nusselt number variation vs. wall temperature using different nanoparticle concentration for
the configurations with: Left: same type of coolant for both layers. Right: different type of coolants in
upper/lower layers. (U: upper layer, L: lower layer) ............................................................................ 76
Figure 33. Nusselt number variation vs. wall temperature for two fluid inlet velocity for the
configurations with Left: NEPCM slurry and Right: nanofluid. .............................................................. 77
Figure 34. Euler number variation vs. NEPCM and nano alumina particles’ volume fraction ................... 78
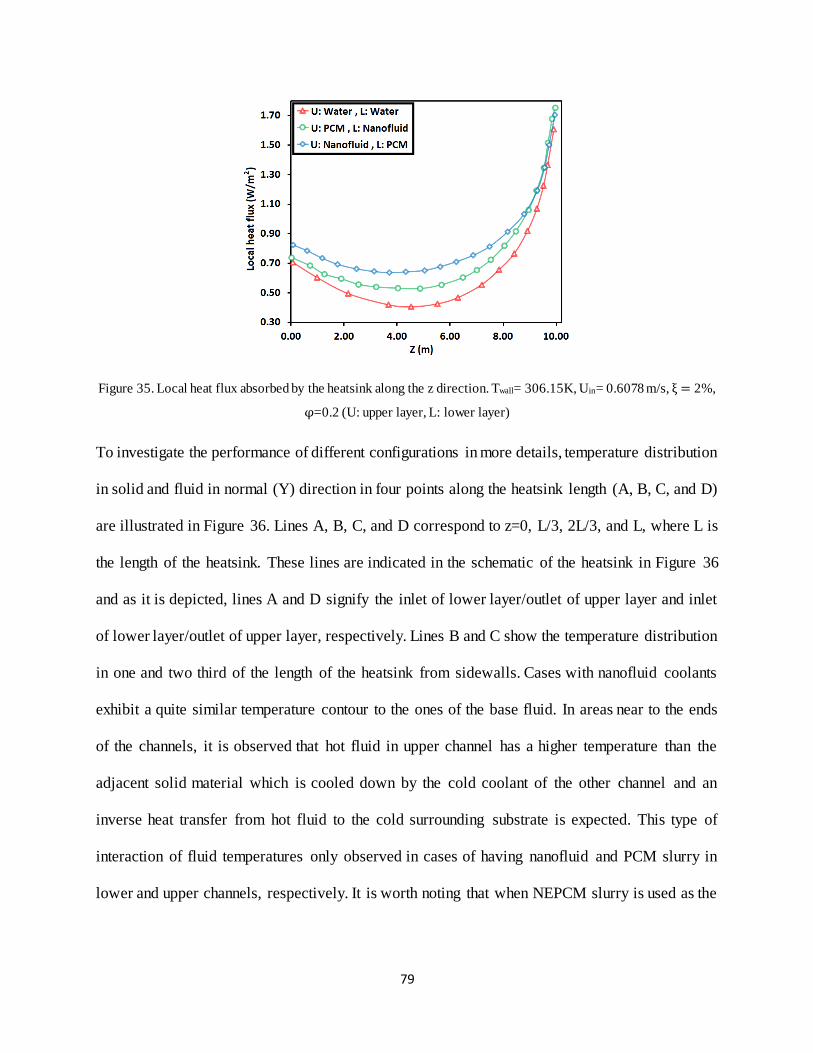
Figure 35. Local heat flux absorbed by the heatsink along the z direction. Twall= 306.15K, Uin= 0.6078 m/s,
ξ = 2%, φ=0.2 (U: upper layer, L: lower layer) .................................................................................... 79
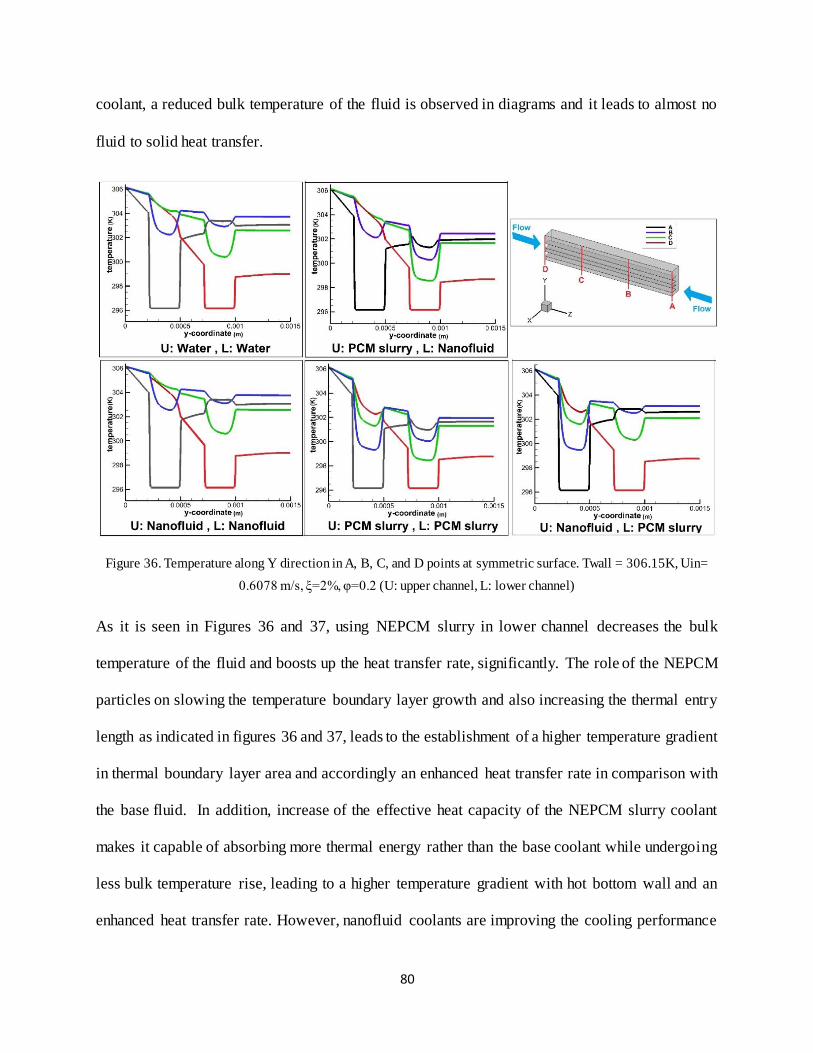
Figure 36. Temperature along Y direction in A, B, C, and D points at symmetric surface. Twall = 306.15K,
Uin= 0.6078 m/s, ξ=2%, φ=0.2 (U: upper channel, L: lower channel) .................................................... 80
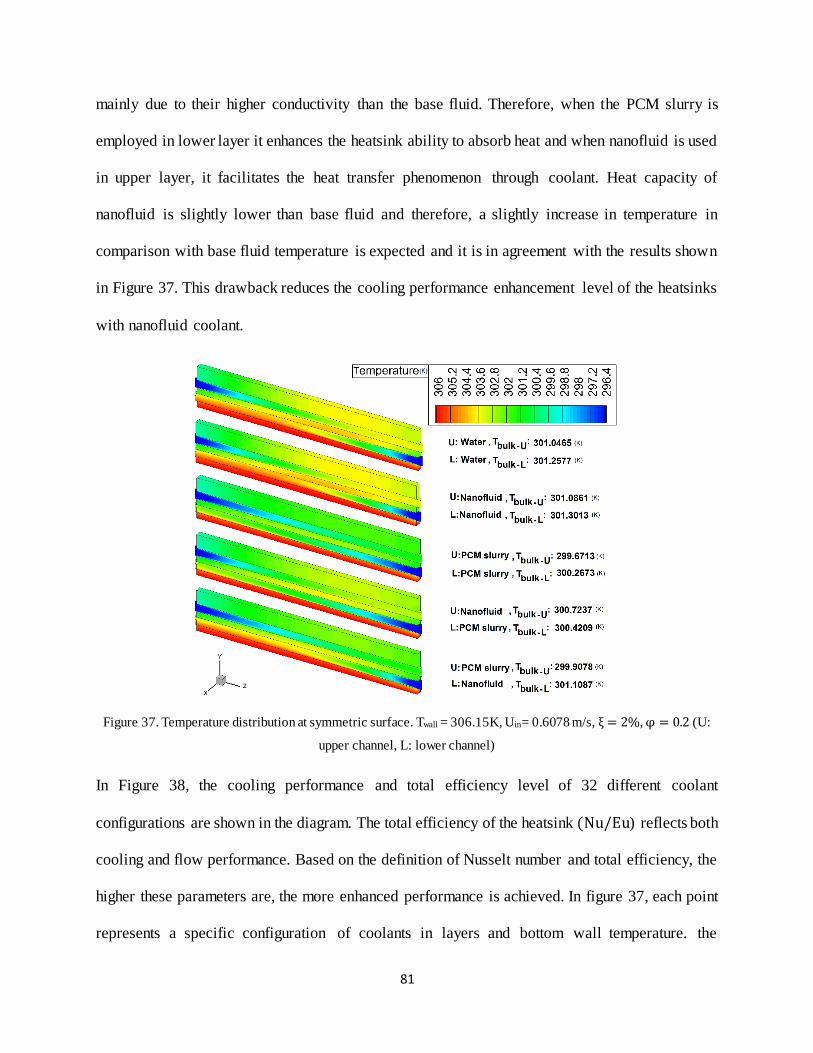
Figure 37. Temperature distribution at symmetric surface. Twal l = 306.15K, Uin= 0.6078 m/s, ξ = 2%, φ =
0.2 (U: upper channel, L: lower channel) ............................................................................................ 81
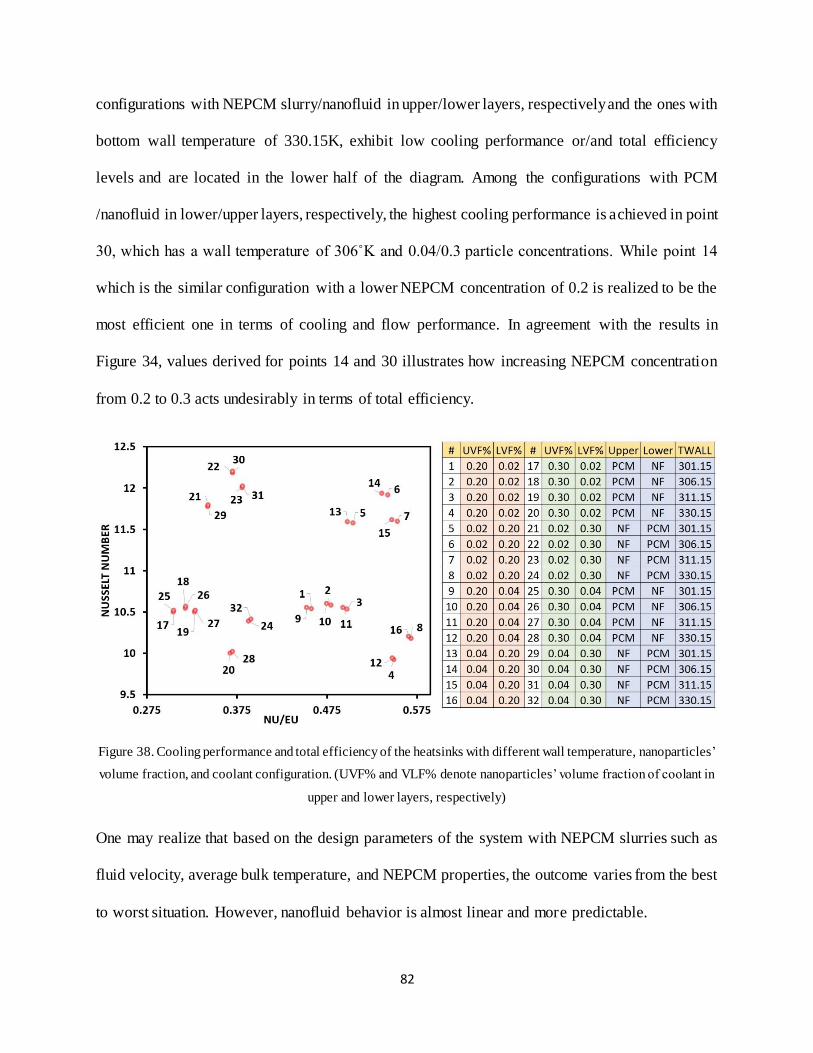
Figure 38. Cooling performance and total efficiency of the heatsinks with different wall temperature,
nanoparticles’ volume fraction, and coolant configuration. (UVF% and VLF% denote nanoparticles’
volume fraction of coolant in upper and lower layers, respectively) ..................................................... 82
Figure 39. Using the proposed machining technique to make cutting on carbon nanotube arrays. ......... 84
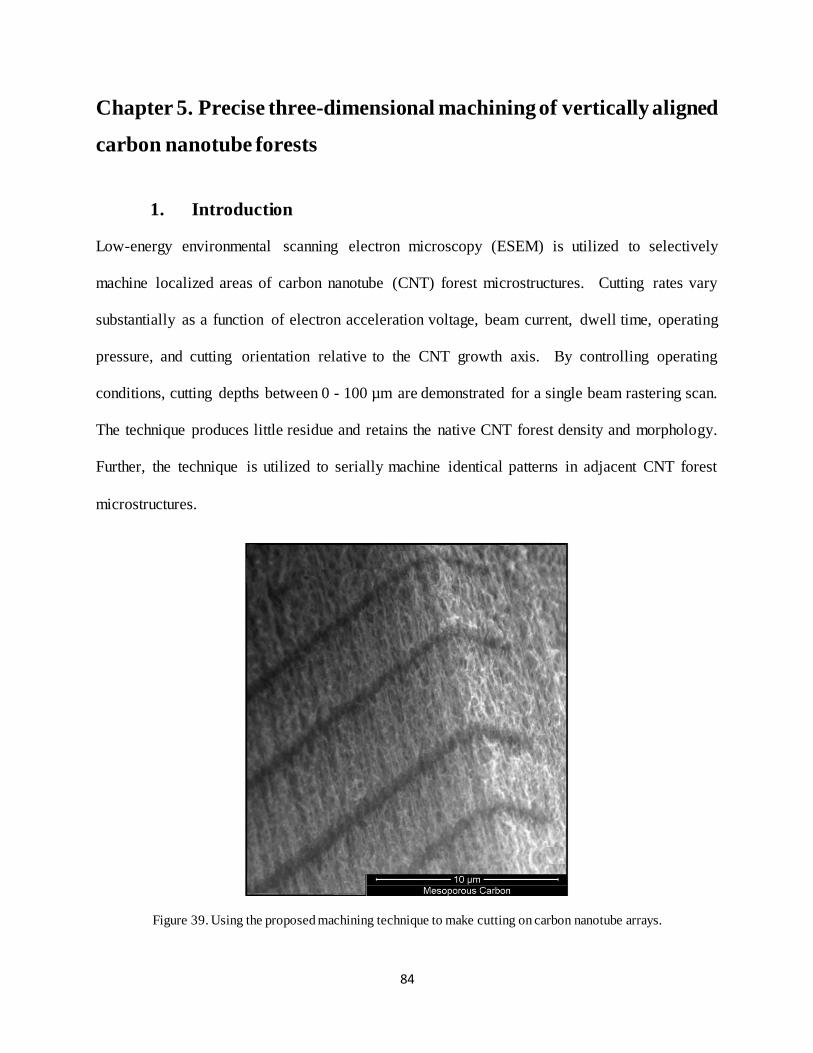
Figure 40. A complete carbon-nanotube-based on-chip cooling solution with very high heat dissipation
capacity [87]..................................................................................................................................... 85
Figure 41. Quanta 600F environmental SEM ....................................................................................... 87
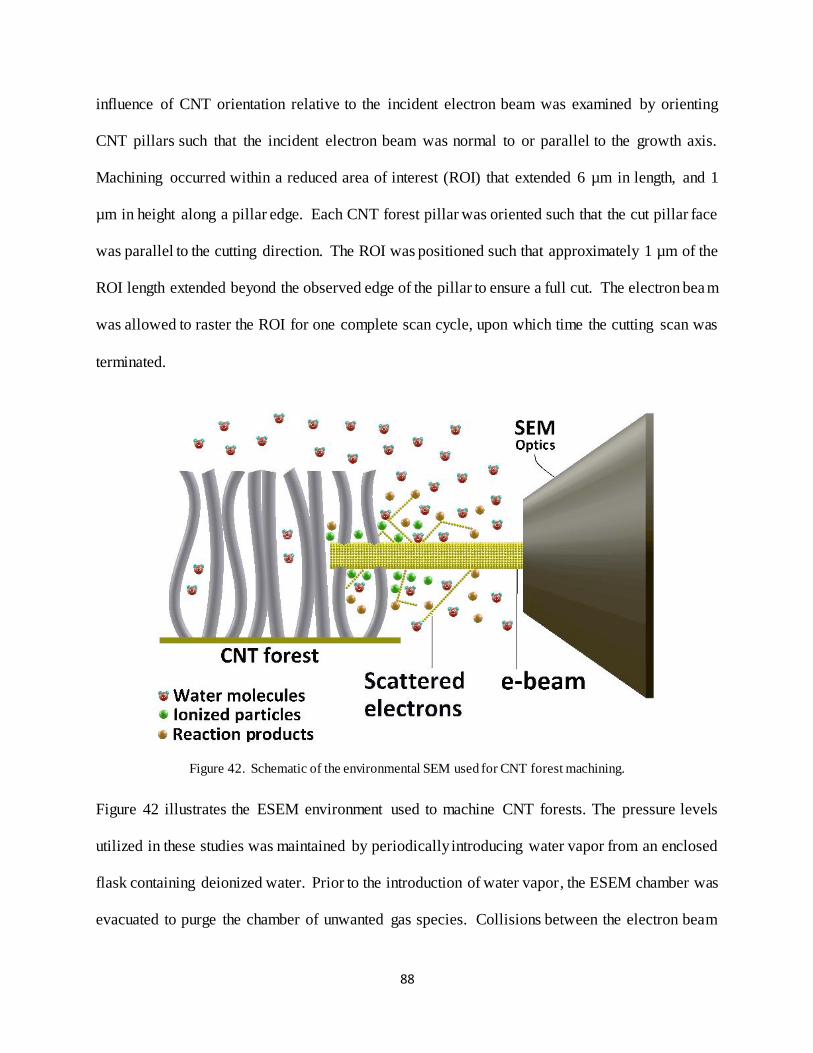
Figure 42. Schematic of the environmental SEM used for CNT forest machining. ................................. 88
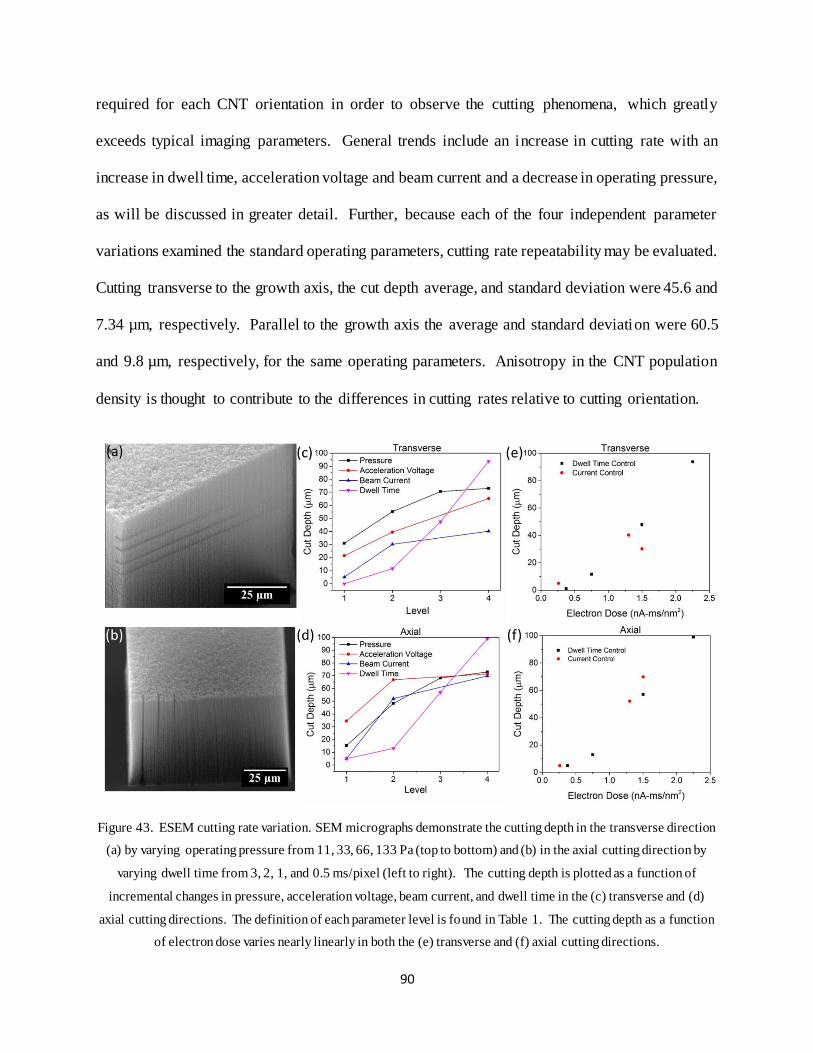
Figure 43. ESEM cutting rate variation. SEM micrographs demonstrate the cutting depth in the
transverse direction (a) by varying operating pressure from 11, 33, 66, 133 Pa (top to bottom) and (b) in
the axial cutting direction by varying dwell time from 3, 2, 1, and 0.5 ms/pixel (left to right). The cutting
depth is plotted as a function of incremental changes in pressure, acceleration voltage, beam current,
and dwell time in the (c) transverse and (d) axial cutting directions. The definition of each parameter
level is found in Table 1. The cutting depth as a function of electron dose varies nearly linearly in both
the (e) transverse and (f) axial cutting directions. ............................................................................... 90
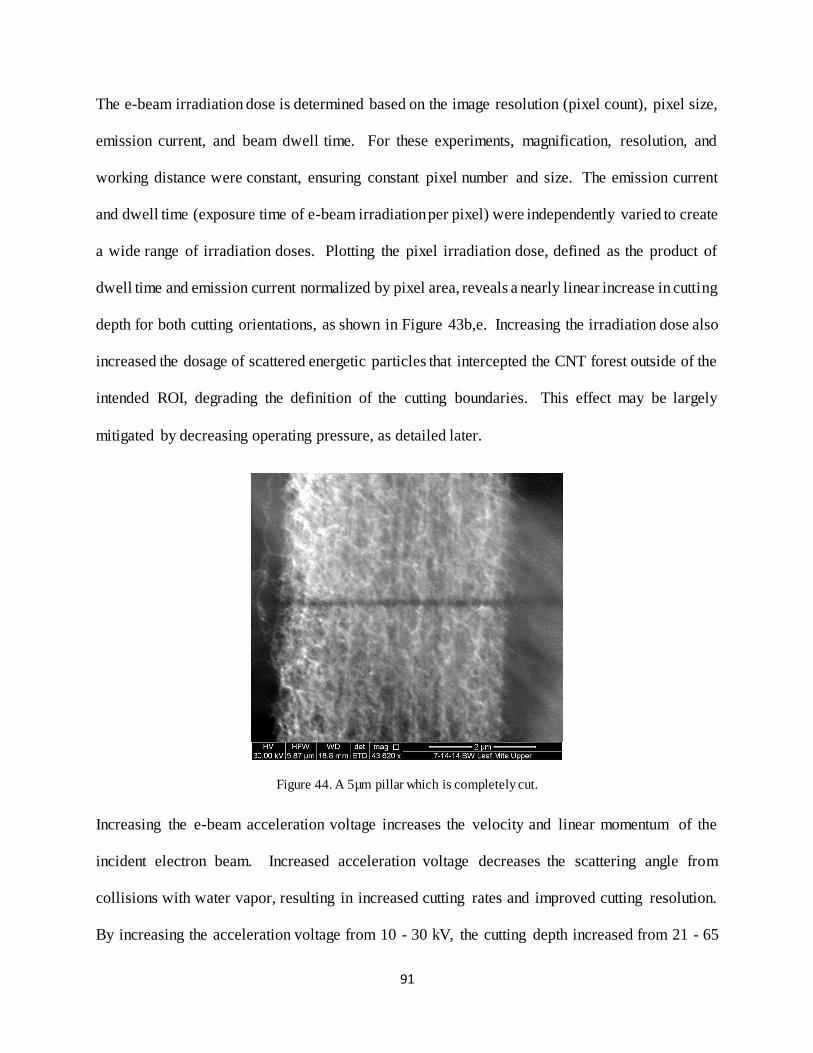
Figure 44. A 5µm pillar which is completely cut. ................................................................................. 91
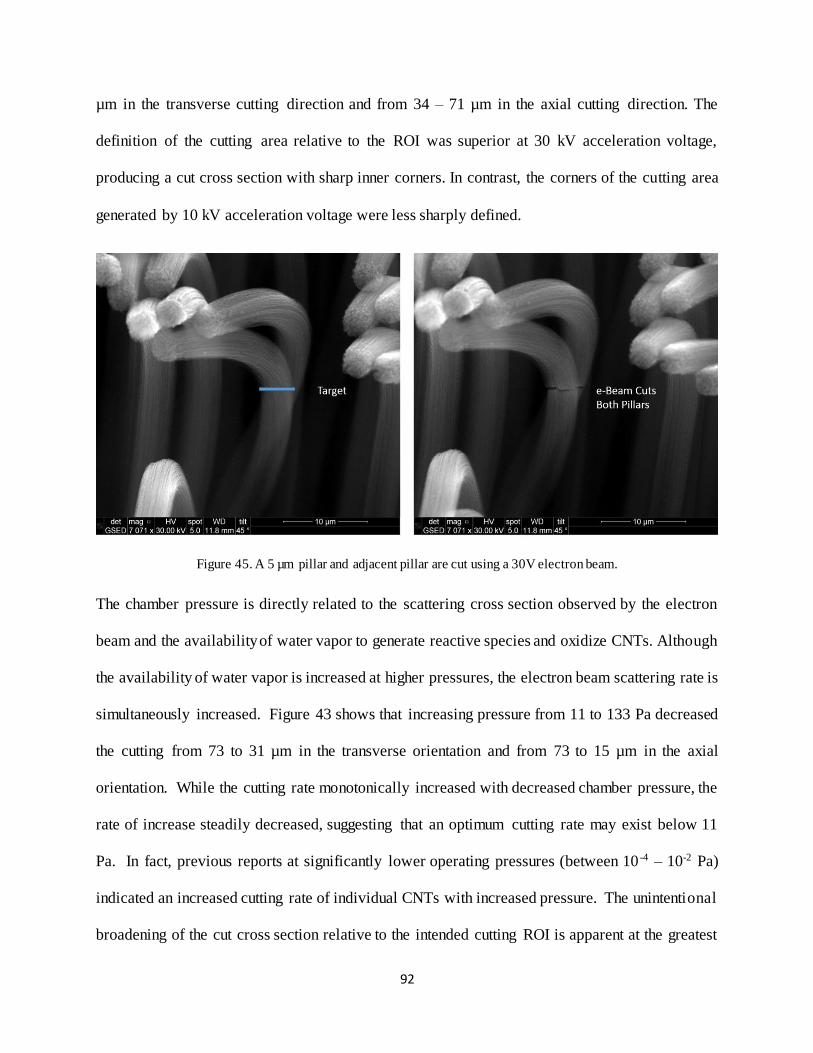
Figure 45. A 5 µm pillar and adjacent pillar are cut using a 30V electron beam. .................................... 92
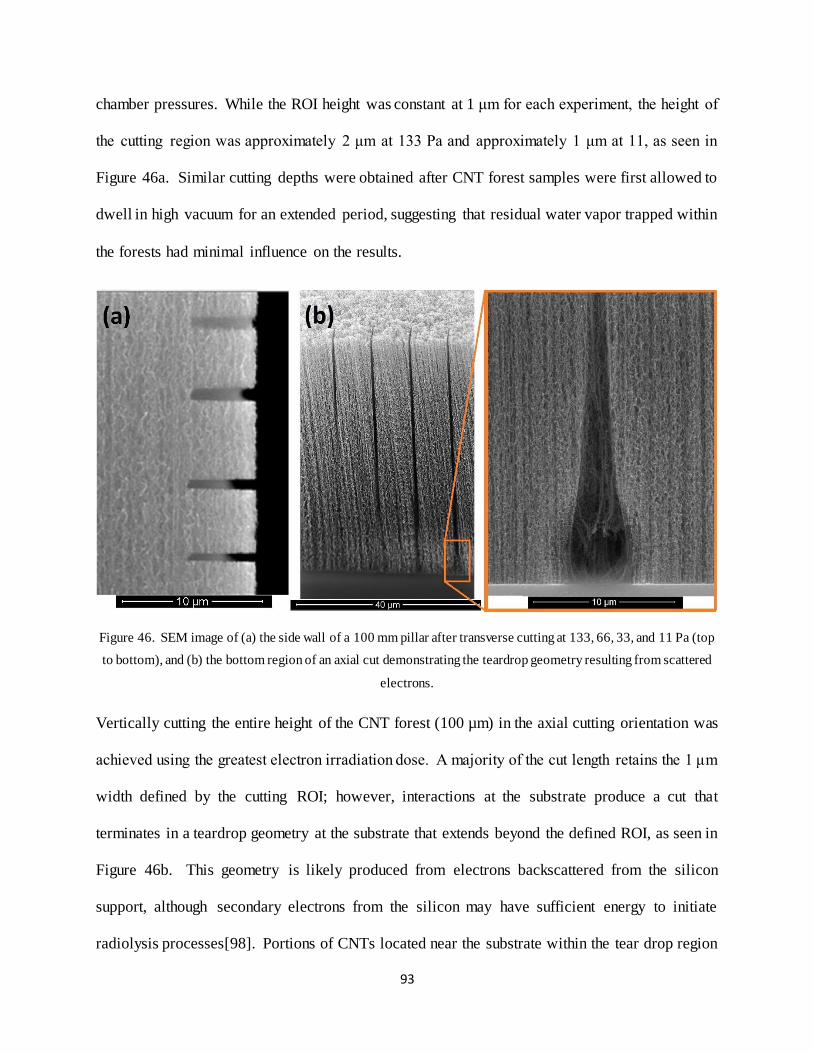
Figure 46. SEM image of (a) the side wall of a 100 mm pillar after transverse cutting at 133, 66, 33, and
11 Pa (top to bottom), and (b) the bottom region of an axial cut demonstrating the teardrop geometry
resulting from scattered electrons. .................................................................................................... 93
Figure 47. The parallel machining of adjacent 30 µm wide CNT pillars at various electron doses. Edge cuts
utilized doses of 1.5, 3, and 6 nA-ms/nm2 (top to bottom). Internal cuts at the centerline of the pillars
utilized doses of 15 and 45 nA-ms/nm2 (top to bottom). ..................................................................... 94
Page 9
vii
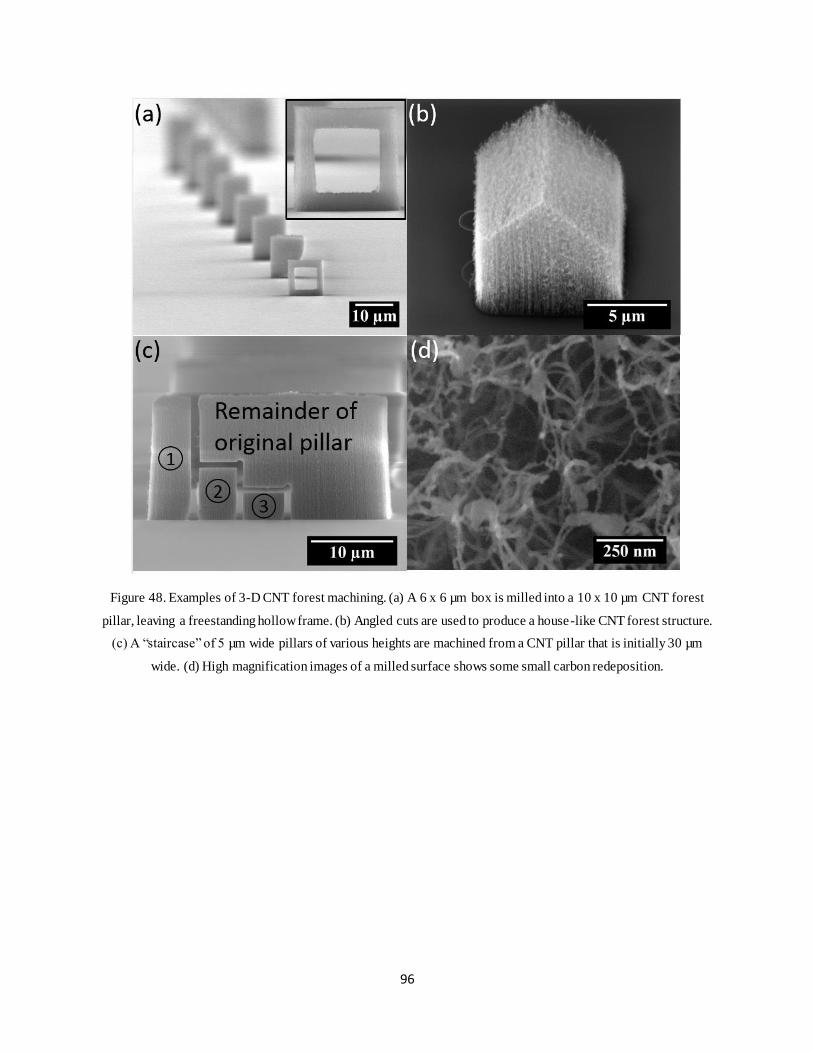
Figure 48. Examples of 3-D CNT forest machining. (a) A 6 x 6 µm box is milled into a 10 x 10 µm CNT
forest pillar, leaving a freestanding hollow frame. (b) Angled cuts are used to produce a house-like CNT
forest structure. (c) A “staircase” of 5 µm wide pillars of various heights are machined from a CNT pillar
that is initially 30 µm wide. (d) High magnification images of a milled surface shows some small carbon
redeposition. .................................................................................................................................... 96
Page 10
viii
Table 1. Thermal properties of common phase change materials and coolants.[2]..................................5
Table 2. Girds independency study .................................................................................................... 21
Table 3. Comparison between experimental and numerical result ....................................................... 23
Table 4. Thermophysical properties of the NEPCM particles [20] ......................................................... 39
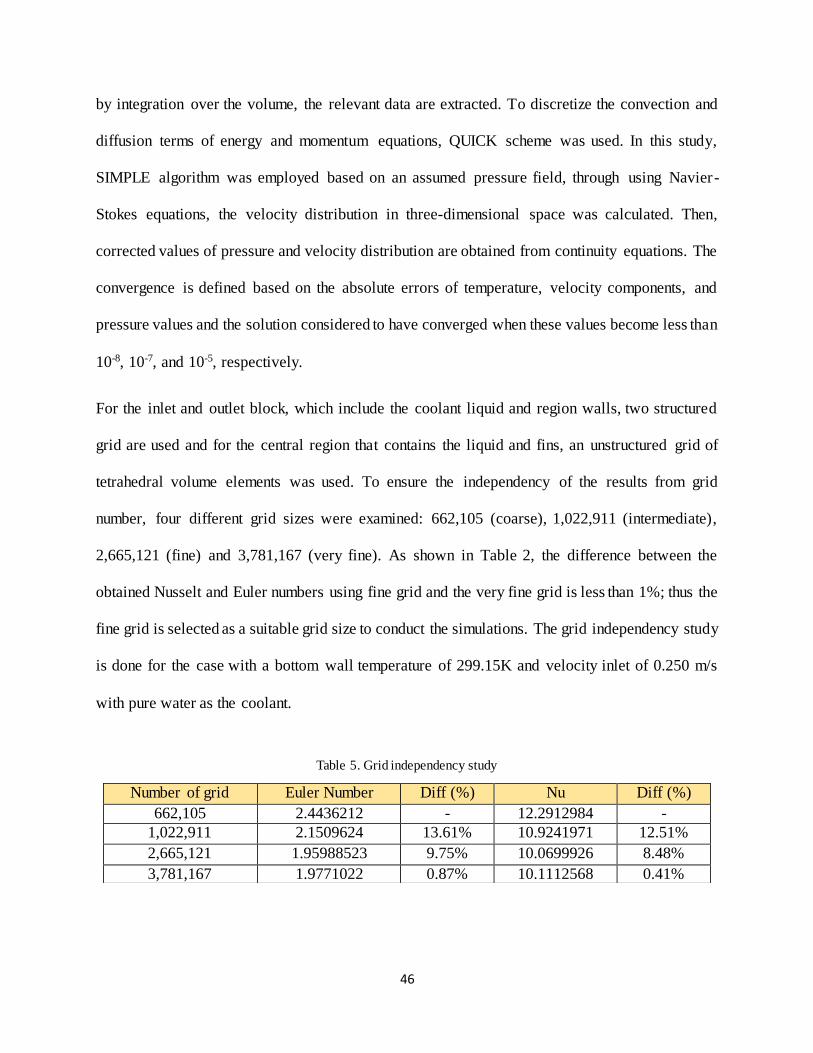
Table 5. Grid independency study ...................................................................................................... 46
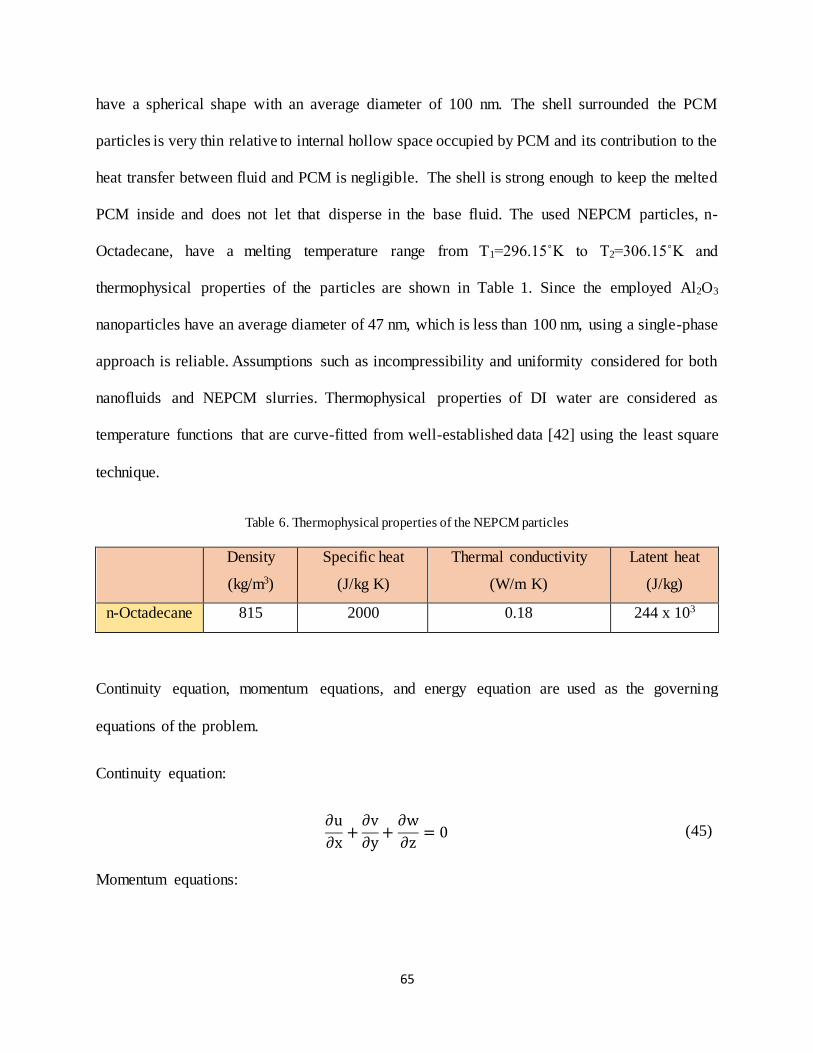
Table 6. Thermophysical properties of the NEPCM particles ................................................................ 65
Table 7. Results of investigation of the solution sensitivity to grid sizes. ............................................... 72
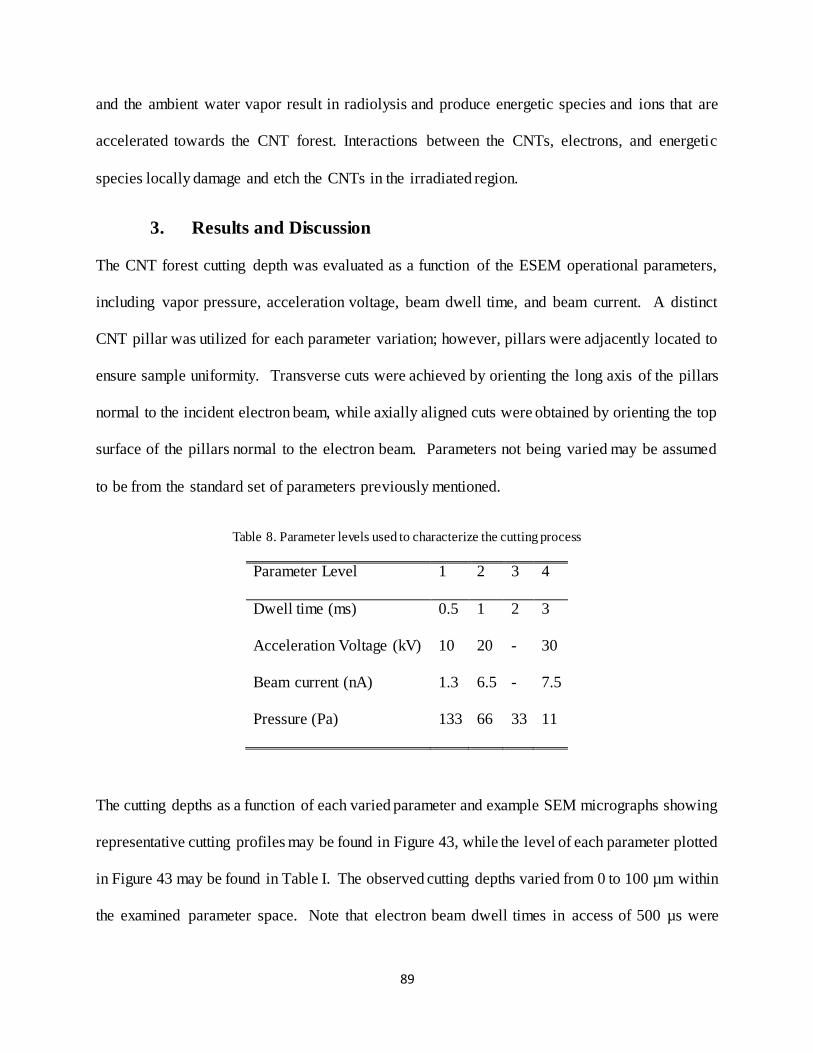
Table 8. Parameter levels used to characterize the cutting process ...................................................... 89
Page 11
ix
Nomenclature
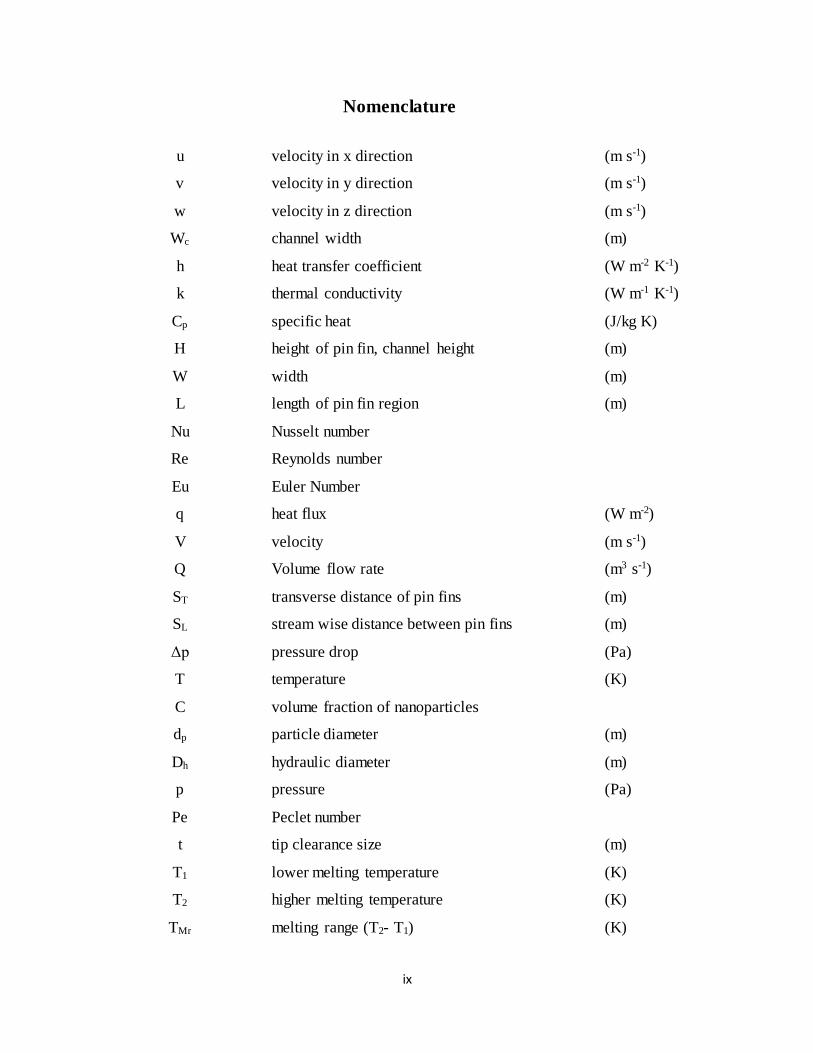
u velocity in x direction (m s-1)
v velocity in y direction (m s-1)
w velocity in z direction (m s-1)
Wc channel width (m)
h heat transfer coefficient (W m-2 K-1)
k thermal conductivity (W m-1 K-1)
Cp specific heat (J/kg K)
H height of pin fin, channel height (m)
W width (m)
L length of pin fin region (m)
Nu Nusselt number
Re Reynolds number
Eu Euler Number
q heat flux (W m-2)
V velocity (m s-1)
Q Volume flow rate (m3 s-1)
ST transverse distance of pin fins (m)
SL stream wise distance between pin fins (m)
Δp pressure drop (Pa)
T temperature (K)
C volume fraction of nanoparticles
dp particle diameter (m)
Dh hydraulic diameter (m)
p pressure (Pa)
Pe Peclet number
t tip clearance size (m)
T1 lower melting temperature (K)
T2 higher melting temperature (K)
TMr melting range (T2- T1) (K)
Page 12
x
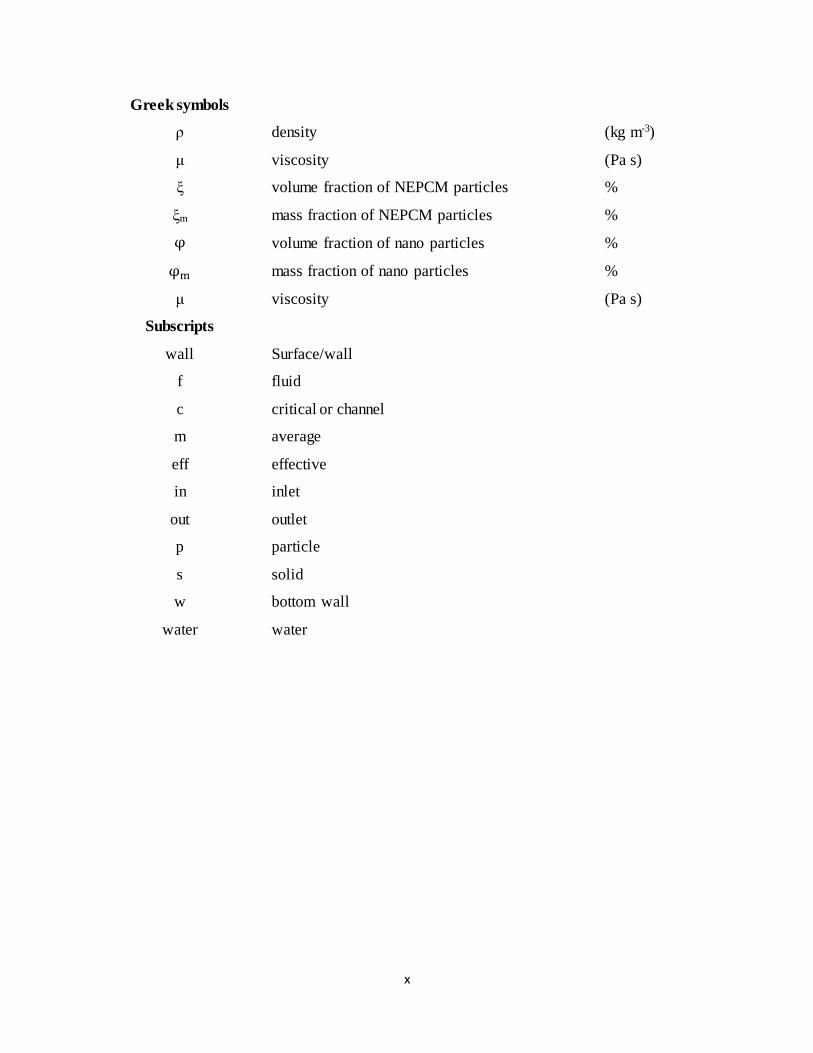
Greek symbols
ρ density (kg m-3)
μ viscosity (Pa s)
ξ volume fraction of NEPCM particles %
ξm mass fraction of NEPCM particles %
φ volume fraction of nano particles %
φm mass fraction of nano particles %
μ viscosity (Pa s)
Subscripts
wall Surface/wall
f fluid
c critical or channel
m average
eff effective
in inlet
out outlet
p particle
s solid
w bottom wall
water water
Page 13
xi
ABSTRACT
In this report, four different strategies to enhance the cooling performance of a micro pin fin heat
sink are investigated and their effect to improve its cooling efficiency are examined. The
employment of nanoparticles and nano-encapsulated phase change materials (NEPCM)
suspensions, as advanced coolant slurries, are the first and second strategies which are
investigated. Cooling systems that are improved by utilization of these advanced coolants
(individually or a combination of the advanced coolants in a two layer contourflow micro-channel
heat sink) are modeled and examined and based on the obtained results, a significant potential to
improve the cooling performance of the heatsinks is observed. Introducing tip clearance to the fins
of a heatsink is the third considered technique in which a range of tip clearance values are
introduced to a heatsink and the cooling performance enhancements are compared. Based on the
results of the modeling of the heatsinks with different tip clearances, if the tip clearance value is
selected and designed appropriately, it can boost up the cooling efficiency of the system,
potentially. The last part of this thesis is about the investigation of the possibility of using carbon
nanotubes (CNTs), as one of the most thermally conductive materials, as the solid body of the
heatsink. Using CNTs, one can build very hydrophobic surfaces which may be used as the coolants
flow path. However, one of the main obstacles, which needs to be tackled, is the limitations on
generating accurate 3D shape structures from CNTs. In this thesis, a new electron beam irradiation
based technique to control the final shape of the CNT arrays is proposed and characterized and the
effective parameters such as chamber pressure, irradiation current and etc. are investigated and the
most efficient setting to provide the best cutting rate is realized. In introduction section, an
overview of the thesis report is given and then in each of the chapters 2-5, one of the above-
mentioned techniques including: using NEPCM slurry advanced coolants, using pin tip clearance,
Page 14
xii
using nanoparticles suspensions, an accurate machining techniques for CNT arrays, are
investigated and presented. The three first chapters are based on the 3D conjugated heat transfer
models of the heat sinks and the last part of the thesis reports the experimental results of the
proposed technique. Results obtained and reported in each of the chapters 2-5 of this thesis are
submitted to accredited journals and until now, one is published and three are still under review.
Page 15
1
Chapter 1. Introduction
1. Electronic cooling
Technological advancements in microprocessors, Batteries, AC/AC, DC/DC, and AC/DC
converters, and many other small scale devices industries have been hindered by the limitations of
current cooling capabilities. These limitations are reflected as an obstacle on the path of
advancements in computational, energy storage, and etc. abilities. Many industries such as electric
vehicles (EV), Hybrid Electric Vehicles (HEV) and Plug-in Hybrid Electric Vehicles (PHEV) are
seeking for new breakthroughs in current small scale cooling methods to help them overcome the
progress barriers to build efficient cooling systems that also meet the size and space confinements .
These systems generally should not need a significant maintenance routines and therefore should
not have a large number of moving parts. Furthermore, the proposed systems should be able to
perform reliably in different environment conditions.
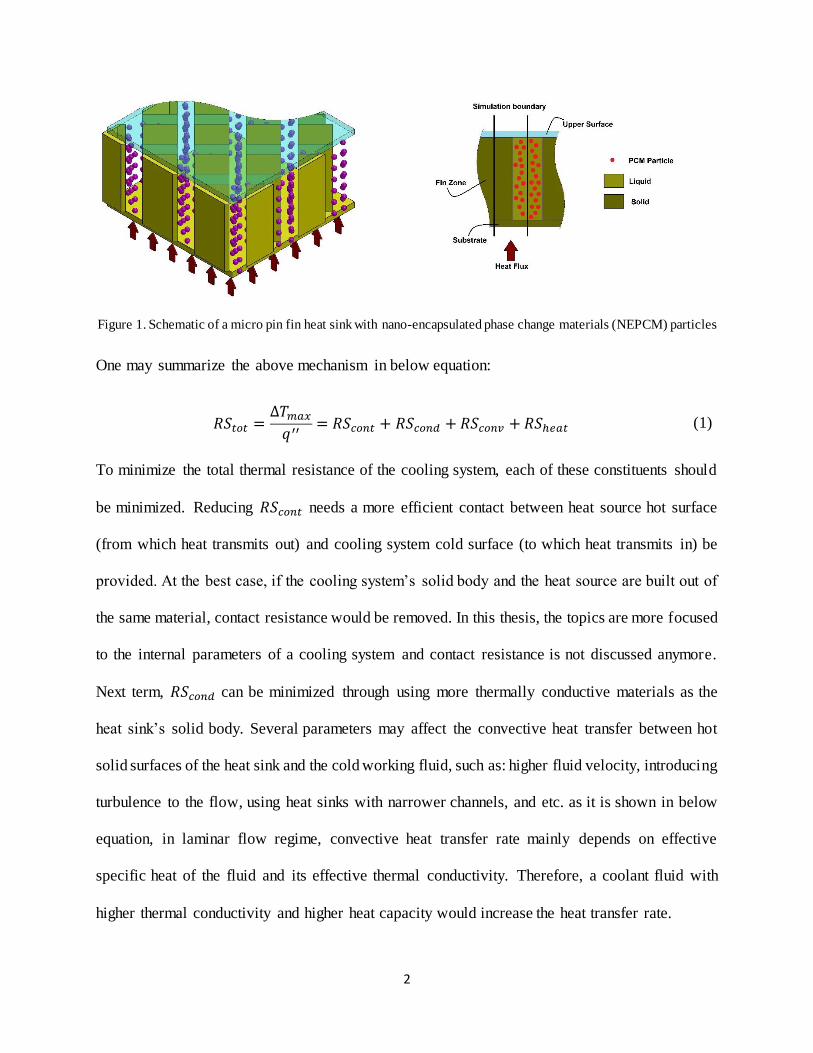
Thermal resistance of a system can be defined based on these four parameters:
1- Thermal resistance of the contact surface between heat source and cooling system
(𝑅𝑆𝑐𝑜𝑛𝑡).
2- Heat conduction rate through the solid part of the cooling system (𝑅𝑆𝑐𝑜𝑛𝑑).
3- Heat convection between solid surfaces and the coolant fluid (𝑅𝑆𝑐𝑜𝑛𝑣 ).
4- Absorbing the transferred heat by the working fluid and increasing its temperature
accordingly (𝑅𝑆ℎ𝑒𝑎𝑡).
Page 16
2
Figure 1. Schematic of a micro pin fin heat sink with nano-encapsulated phase change materials (NEPCM) particles
One may summarize the above mechanism in below equation:
𝑅𝑆𝑡𝑜𝑡 =∆𝑇𝑚𝑎𝑥
𝑞′′ = 𝑅𝑆𝑐𝑜𝑛𝑡 + 𝑅𝑆𝑐𝑜𝑛𝑑 + 𝑅𝑆𝑐𝑜𝑛𝑣 + 𝑅𝑆ℎ𝑒𝑎𝑡 (1)
To minimize the total thermal resistance of the cooling system, each of these constituents should
be minimized. Reducing 𝑅𝑆𝑐𝑜𝑛𝑡 needs a more efficient contact between heat source hot surface
(from which heat transmits out) and cooling system cold surface (to which heat transmits in) be
provided. At the best case, if the cooling system’s solid body and the heat source are built out of
the same material, contact resistance would be removed. In this thesis, the topics are more focused
to the internal parameters of a cooling system and contact resistance is not discussed anymore.
Next term, 𝑅𝑆𝑐𝑜𝑛𝑑 can be minimized through using more thermally conductive materials as the
heat sink’s solid body. Several parameters may affect the convective heat transfer between hot
solid surfaces of the heat sink and the cold working fluid, such as: higher fluid velocity, introducing
turbulence to the flow, using heat sinks with narrower channels, and etc. as it is shown in below
equation, in laminar flow regime, convective heat transfer rate mainly depends on effective
specific heat of the fluid and its effective thermal conductivity. Therefore, a coolant fluid with
higher thermal conductivity and higher heat capacity would increase the heat transfer rate.
Page 17
3
ℎ~𝐶𝑝,𝑒𝑓𝑓1/3
𝑘𝑒𝑓𝑓2/3
(2)
𝑅𝑆ℎ𝑒𝑎𝑡 may be reduced by increasing the mass flow rate of the working fluid or increasing its
specific heat capacity. In this research work, each of the above mentioned terms are tried to be
improved.
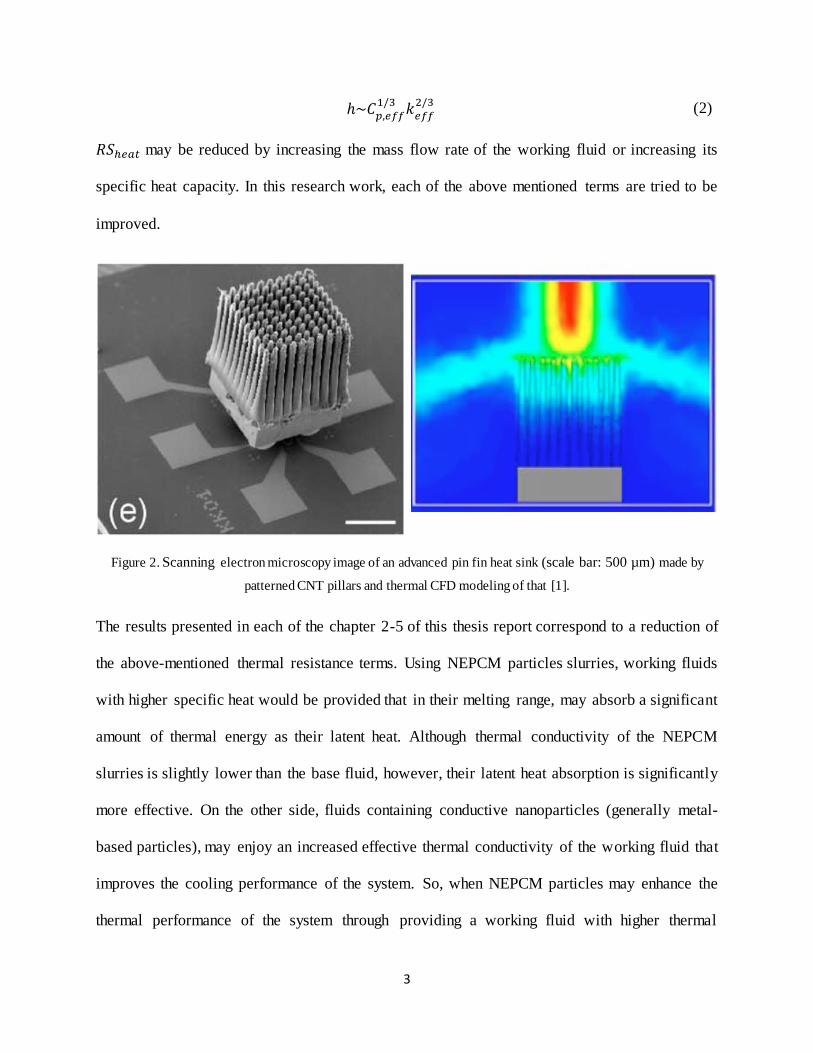
Figure 2. Scanning electron microscopy image of an advanced pin fin heat sink (scale bar: 500 µm) made by
patterned CNT pillars and thermal CFD modeling of that [1].
The results presented in each of the chapter 2-5 of this thesis report correspond to a reduction of
the above-mentioned thermal resistance terms. Using NEPCM particles slurries, working fluids
with higher specific heat would be provided that in their melting range, may absorb a significant
amount of thermal energy as their latent heat. Although thermal conductivity of the NEPCM
slurries is slightly lower than the base fluid, however, their latent heat absorption is significantly
more effective. On the other side, fluids containing conductive nanoparticles (generally metal-
based particles), may enjoy an increased effective thermal conductivity of the working fluid that
improves the cooling performance of the system. So, when NEPCM particles may enhance the
thermal performance of the system through providing a working fluid with higher thermal
Page 18
4
capacity, metal-based nanoparticles may improve the efficiency of the cooling system through
boosting the effective thermal conductivity of the working fluid. It is discussed in details in
chapters 2 and 4. Introducing the pin fin tip clearance to a micro pin fin heat sink, which is
discussed and modeled in chapter 3, may improve the performance of the system through changing
the working fluid’s flow pattern. Introducing tip clearance to a micro pin fin heatsink, not only
increases the total area of the solid surface from which heat transfers to the coolant and therefore
more energy can be transmitted out, but also by changing the 3D flow pattern of the coolant, more
heat transfer rate may be facilitated.
2. Nano-PCMs Suspension
Due to the large heat capacity of phase change materials, which owes to their latent heat
contribution, and based on the explanations given in the last section, it is logically expected that
adding NEPCM particles to the fluids will substantially increase their effective heat capacity.
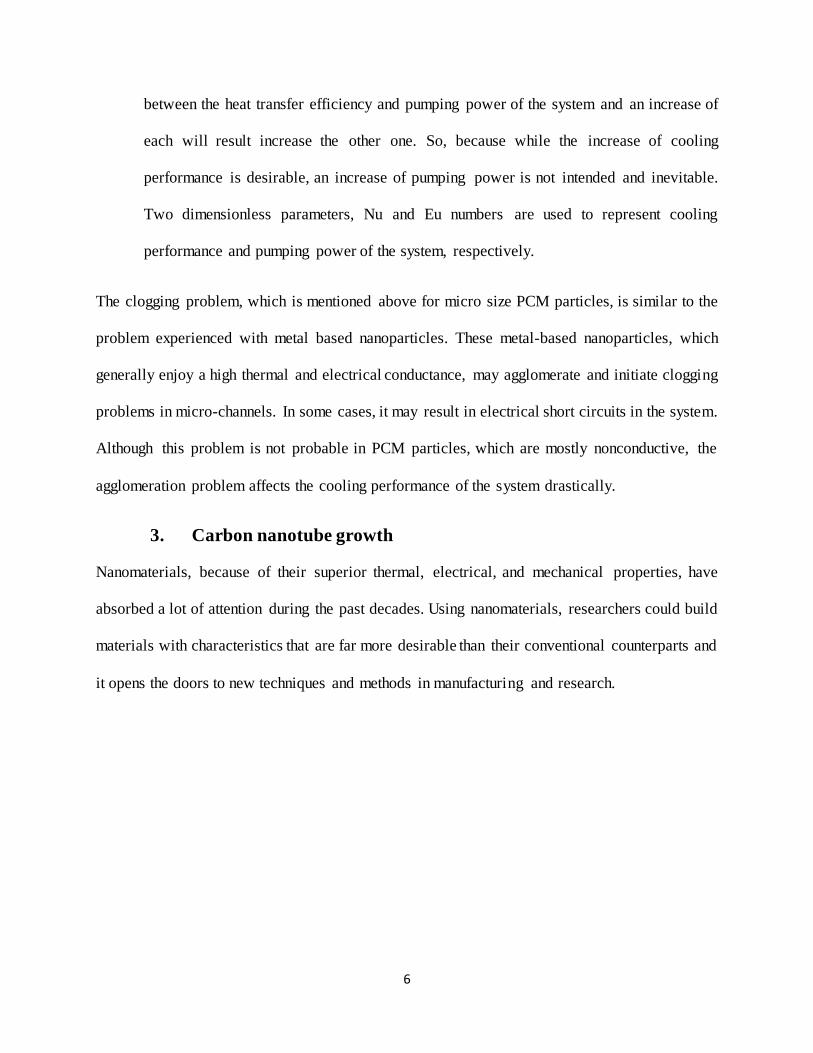
Thermal properties of some of the most popular coolants and PCM particles are listed in Table 1.
However, there are a couple of the drawbacks mentioned in literature which can be associated with
using micro size PCM particles:
1- If the size of the PCM particles and the fluid velocity are not adjusted properly so that the
PCM particles concentration in lower parts of the fluid flowing in channels is higher than
upper parts of that, or in another word, the particles get accumulated in lower parts of the
fluid flowing in channels or even deposit on the bottom surface of channel, they may build
a non-conductive layer which resists against heat transfer. It causes the heat transfer rate to
drop significantly. In addition, the working fluid may not be considered homogenous
anymore. Clogging of channels may happen if agglomeration happens between particles.
Page 19
5
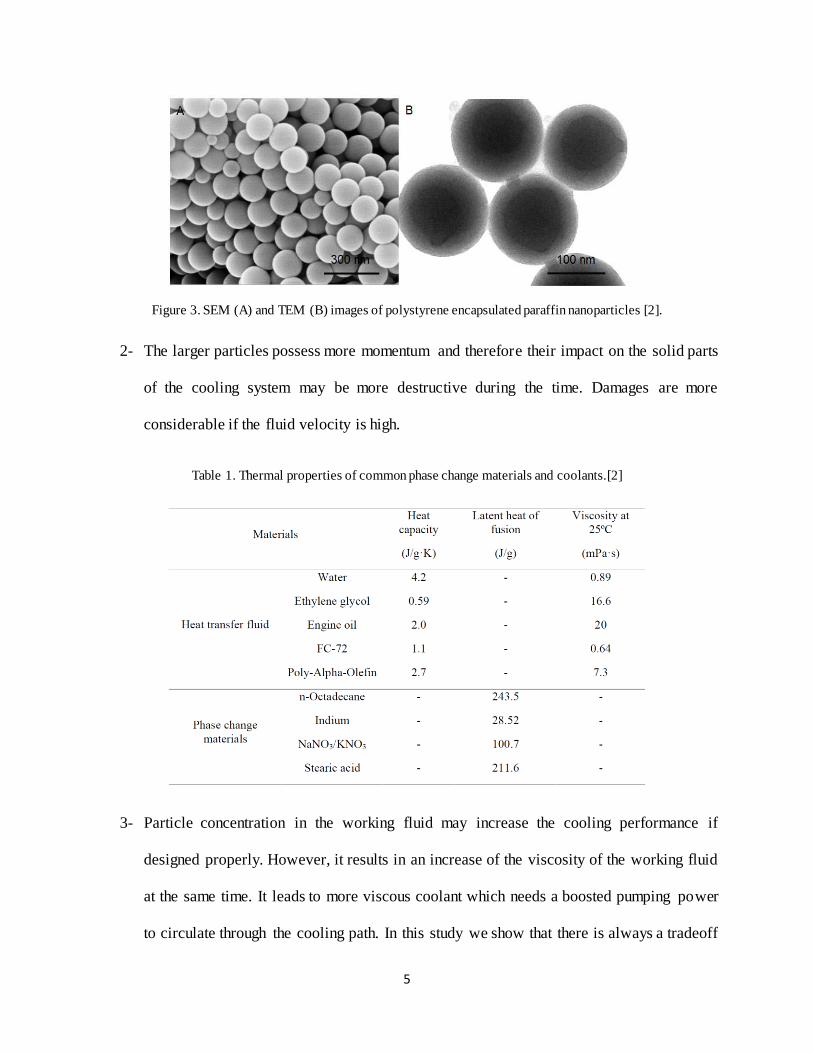
Figure 3. SEM (A) and TEM (B) images of polystyrene encapsulated paraffin nanoparticles [2].
2- The larger particles possess more momentum and therefore their impact on the solid parts
of the cooling system may be more destructive during the time. Damages are more
considerable if the fluid velocity is high.
Table 1. Thermal properties of common phase change materials and coolants.[2]
3- Particle concentration in the working fluid may increase the cooling performance if
designed properly. However, it results in an increase of the viscosity of the working fluid
at the same time. It leads to more viscous coolant which needs a boosted pumping power
to circulate through the cooling path. In this study we show that there is always a tradeoff
Page 20
6
between the heat transfer efficiency and pumping power of the system and an increase of
each will result increase the other one. So, because while the increase of cooling
performance is desirable, an increase of pumping power is not intended and inevitable.
Two dimensionless parameters, Nu and Eu numbers are used to represent cooling
performance and pumping power of the system, respectively.
The clogging problem, which is mentioned above for micro size PCM particles, is similar to the
problem experienced with metal based nanoparticles. These metal-based nanoparticles, which
generally enjoy a high thermal and electrical conductance, may agglomerate and initiate clogging
problems in micro-channels. In some cases, it may result in electrical short circuits in the system.
Although this problem is not probable in PCM particles, which are mostly nonconductive, the
agglomeration problem affects the cooling performance of the system drastically.
3. Carbon nanotube growth
Nanomaterials, because of their superior thermal, electrical, and mechanical properties, have
absorbed a lot of attention during the past decades. Using nanomaterials, researchers could build
materials with characteristics that are far more desirable than their conventional counterparts and
it opens the doors to new techniques and methods in manufacturing and research.
Page 21
7
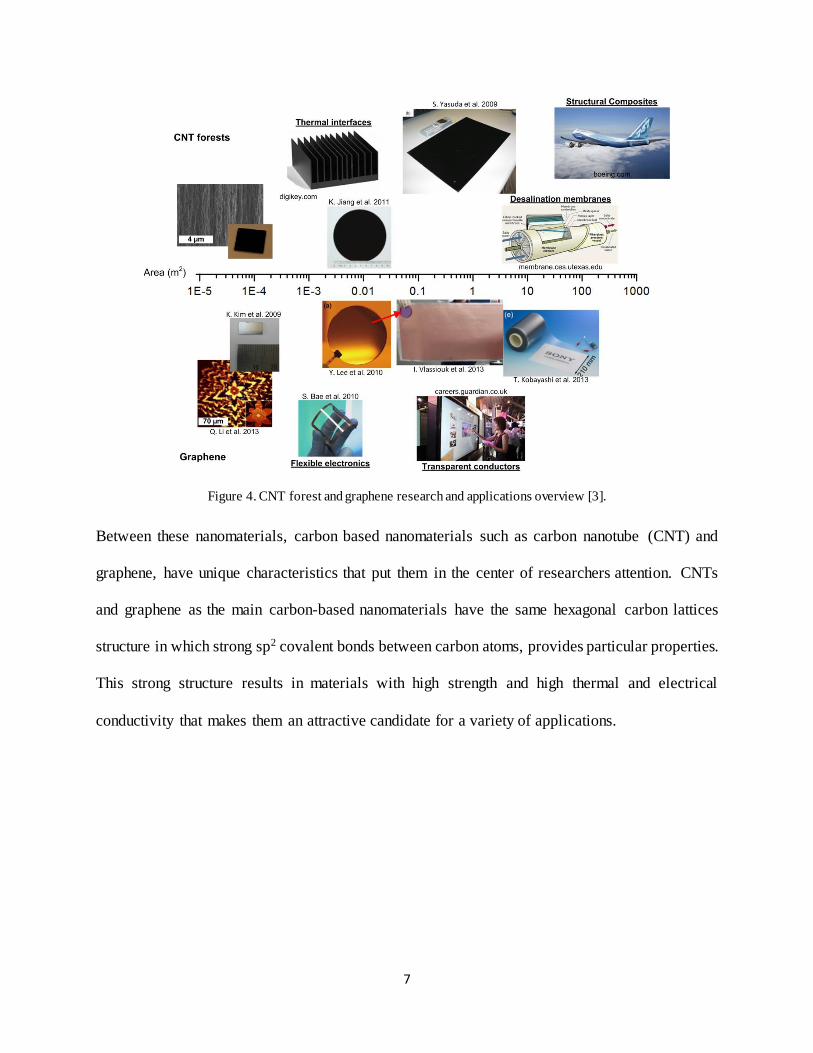
Figure 4. CNT forest and graphene research and applications overview [3].
Between these nanomaterials, carbon based nanomaterials such as carbon nanotube (CNT) and
graphene, have unique characteristics that put them in the center of researchers attention. CNTs
and graphene as the main carbon-based nanomaterials have the same hexagonal carbon lattices
structure in which strong sp2 covalent bonds between carbon atoms, provides particular properties.
This strong structure results in materials with high strength and high thermal and electrical
conductivity that makes them an attractive candidate for a variety of applications.
Page 22
8
Figure 5. CNT lattice structures and their orientation on a graphene layer [4].
As depicted in the picture above, each wall of a single-wall or multi-wall carbon nanotube
(generally referred as SWCNT and MWCNT, respectively) can be thought of a rolled 2D layer of
graphene around a tube. Based on the direction of the axis of the imaginary seamless tube around
which graphene layer is rolled, CNT layers with different properties would result. To define this
direction and also the diameter the nanotube, two chirality parameters, m and n are defined and
expressed as:
𝐶ℎ ≡ 𝑛𝑎1 + 𝑚𝑎2 (3)
These numbers denote the number of unit vectors along two 𝑎1𝑎𝑛𝑑 𝑎2 directions in 2D lattice of
graphene as shown in above picture and may result in three types of CNTs:
1- m = 0 : zigzag nanotubes
2- n = m : Armchair nanotubes.
3- Otherwise : Chiral.
The diameter of the nanotube may also be calculated from the chiral vectors using below
equation:
Page 23
9
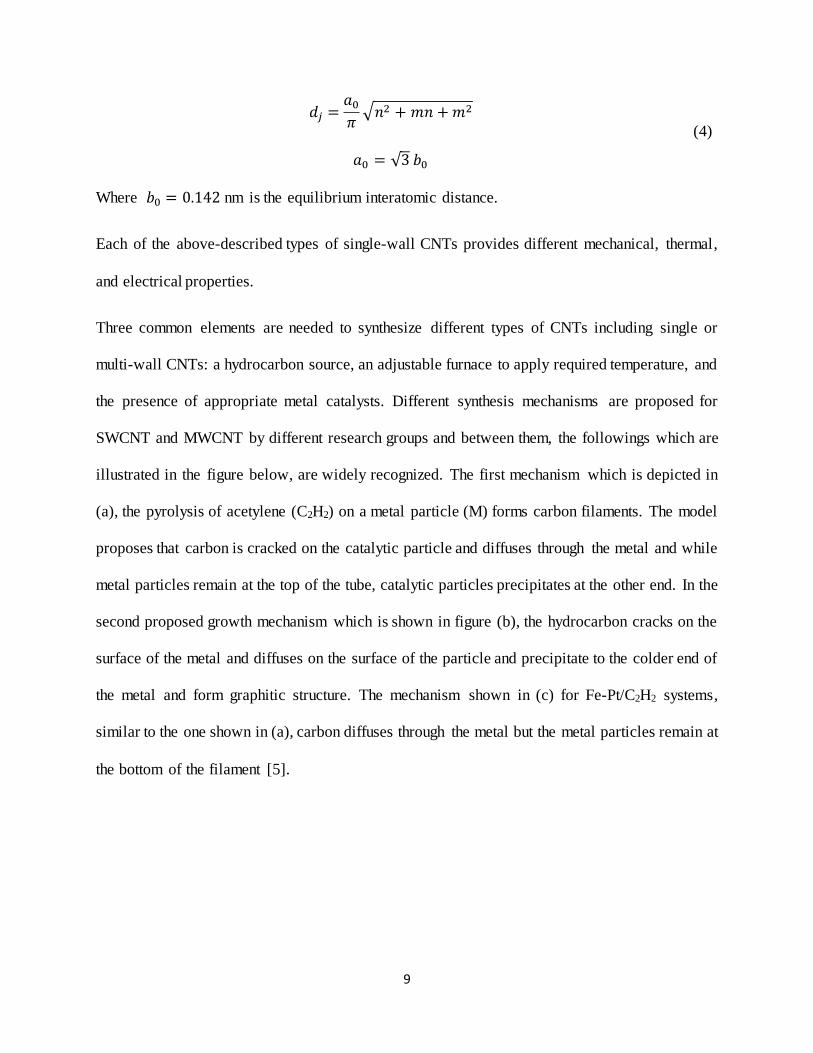
𝑑𝑗 =𝑎0
𝜋√𝑛2 + 𝑚𝑛 + 𝑚2
𝑎0 = √3 𝑏0
(4)
Where 𝑏0 = 0.142 nm is the equilibrium interatomic distance.
Each of the above-described types of single-wall CNTs provides different mechanical, thermal,
and electrical properties.
Three common elements are needed to synthesize different types of CNTs including single or
multi-wall CNTs: a hydrocarbon source, an adjustable furnace to apply required temperature, and
the presence of appropriate metal catalysts. Different synthesis mechanisms are proposed for
SWCNT and MWCNT by different research groups and between them, the followings which are
illustrated in the figure below, are widely recognized. The first mechanism which is depicted in
(a), the pyrolysis of acetylene (C2H2) on a metal particle (M) forms carbon filaments. The model
proposes that carbon is cracked on the catalytic particle and diffuses through the metal and while
metal particles remain at the top of the tube, catalytic particles precipitates at the other end. In the
second proposed growth mechanism which is shown in figure (b), the hydrocarbon cracks on the
surface of the metal and diffuses on the surface of the particle and precipitate to the colder end of
the metal and form graphitic structure. The mechanism shown in (c) for Fe-Pt/C2H2 systems,
similar to the one shown in (a), carbon diffuses through the metal but the metal particles remain at
the bottom of the filament [5].
Page 24
10
Figure 6. The most widely accepted growth mechanisms proposed by different research groups
A couple of methods to grow nanotube are used nowadays for research and commercial
applications including: Arc Discharge, Laser Ablation (LA), Electrolysis, and Chemical Vapor
Deposition (CVD). The carbon nanotube samples that are used in this study are manufactured
using CVD method on a photolithography patterned substrate and are prepared in Dr. A. John
Hart’s lab in MIT. CNT forest pillars of square cross-section with widths of 10, 30, and 100 μm
were synthesized and grown on silicon wafers by thermal chemical vapor deposition (CVD) using
a photolithographically defined supported catalyst film (Fe/Al2O3) using a tube furnace (Thermo
Fisher Mini-Mite, 22 mm inner diameter, 30 cm heated length). A horizontal tube furnace was
Page 25
11
employed to heat the substrate and its temperature gradually ramped up to 775˚C in 10 minutes.
The gas flow rate through the tube furnace was set on 100/400 sccm of H2/He. Then, by introducing
C2H4 to the tube, vertical CNT growth occurred on the spots on which catalysts are deposited.
Figure 7. SEM image of the patterned CNT pillars.
Page 26
12
Chapter 2. Micro Pin Fin Heat Sinks with Nano-Encapsulated Phase
Change Materials
1. Introduction
In this part, a 3D conjugated heat transfer model for Nano-Encapsulated Phase Change Materials
(NEPCMs) cooled Micro Pin Fin Heat Sink (MPFHS) is presented. The governing equations of
flow and heat transfer are solved using a finite volume method based on collocated grid and
validated by comparing results with the available data in the literature. The effect of nanoparticles
volume fraction, inlet velocity, and bottom wall temperature are studied on Nusselt and Euler
numbers as well as temperature contours in the system. The results indicate that considerable heat
transfer enhancement is possible when using NEPCM slurry as a coolant and the degree of
enhancement increases with increasing inlet velocity and volume fraction. However, with
increasing bottom wall temperature, the Nusselt number first increases then decreases. The former
is due to higher heat transfer capability of coolant at temperatures over the melting range of PCM
particles due to partial melting of nanoparticles in this range and latent heat contribution effect into
the heat transfer rate. While the latter phenomena is due to the lower capability of NEPCM
particles and consequently coolant in absorbing heat at temperatures above the temperature
correspond to fully melted NEPCM. It was observed that NEPCM slurry has a drastic effect on
Euler number, and with increasing volume fraction and decreasing inlet velocity the enhancement
in Euler number increases.
2. Literature Review:
With rapid advancement in microfabrication techniques, fabrication of microscale devices for
different applications, including cooling of electronic devices, has been become possible. Due to
Page 27
13
their high surface area per unit volume, compact size, and high heat transfer effectiveness, Micro-
pin-fin heat sinks are an important class of heat transfer devices used in electronic cooling
components. It consists of an array of fins, which extended from a base area and are closely
constrained by the opposing wall and other sides of the channel. For the performance evaluation
of micro-pin-fin heat sinks, it is highly desirable to understand the flow and heat transfer physics
in these devices. In the recent years, several studies have been performed by previous researchers
in order to determine hydrodynamics and thermal characteristics of micro-pin-fin arrays. Go et al.
[6] experimentally investigated the feasibility of heat transfer enhancement using the flow-induced
vibration of a micro-fin array. They showed that vibrating deflection plays a key role in enhancing
the heat transfer rate. Peles et al. [7] analytically and experimentally investigated pressure drop
and heat transfer characteristics of a bank of micro pin fins and discussed the geometrical and
thermo-hydraulic parameters affecting the total thermal resistance. Their results showed that
thermal performance of microscale pin fin heat sinks is very low. Furthermore, they suggested that
to decrease thermal resistance at low and high Reynolds numbers, sparse and dense pin fin
configurations should be used.
Kosar et al. [8] conducted an experimental study to obtain friction factor over intermediate size
pin fin heat sinks. They reported deviations from long tube correlations at low Reynolds numbers
and low fin height-to–diameter ratios. Kosar [9] evaluated the performance of five assorted
MEMS- based pin fin heat sinks with different shapes, spacing and arrangements. It was found
that the effects of arrangement, the shape of pin fins, and spacing on heat transfer and friction
factor were in agreement with the results of existing large-scale reported in the literature. Kosar
and Plese [10] experimentally studied boiling inception, single-phase heat transfer and pressure
drop of R-123 over a bank of micro pin fins at Reynolds numbers from 134 to 314. They found
Page 28
14
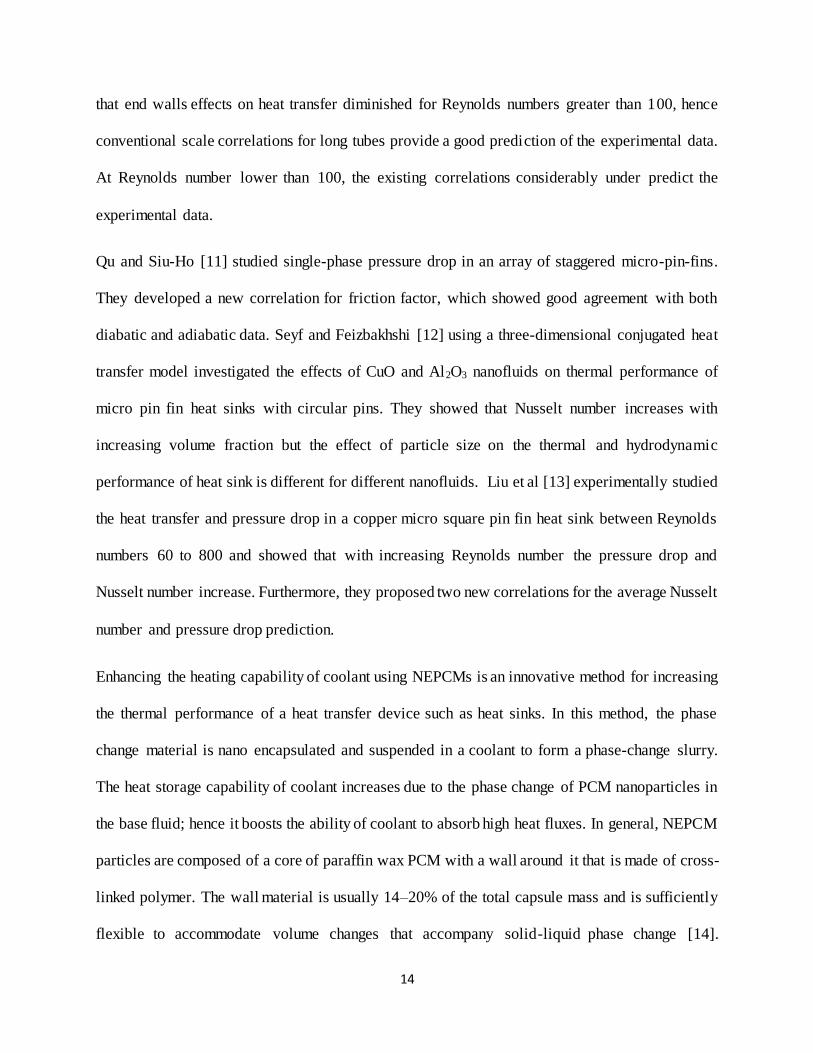
that end walls effects on heat transfer diminished for Reynolds numbers greater than 100, hence
conventional scale correlations for long tubes provide a good prediction of the experimental data.
At Reynolds number lower than 100, the existing correlations considerably under predict the
experimental data.
Qu and Siu-Ho [11] studied single-phase pressure drop in an array of staggered micro-pin-fins.
They developed a new correlation for friction factor, which showed good agreement with both
diabatic and adiabatic data. Seyf and Feizbakhshi [12] using a three-dimensional conjugated heat
transfer model investigated the effects of CuO and Al2O3 nanofluids on thermal performance of
micro pin fin heat sinks with circular pins. They showed that Nusselt number increases with
increasing volume fraction but the effect of particle size on the thermal and hydrodynamic
performance of heat sink is different for different nanofluids. Liu et al [13] experimentally studied
the heat transfer and pressure drop in a copper micro square pin fin heat sink between Reynolds
numbers 60 to 800 and showed that with increasing Reynolds number the pressure drop and
Nusselt number increase. Furthermore, they proposed two new correlations for the average Nusselt
number and pressure drop prediction.
Enhancing the heating capability of coolant using NEPCMs is an innovative method for increasing
the thermal performance of a heat transfer device such as heat sinks. In this method, the phase
change material is nano encapsulated and suspended in a coolant to form a phase-change slurry.
The heat storage capability of coolant increases due to the phase change of PCM nanoparticles in
the base fluid; hence it boosts the ability of coolant to absorb high heat fluxes. In general, NEPCM
particles are composed of a core of paraffin wax PCM with a wall around it that is made of cross-
linked polymer. The wall material is usually 14–20% of the total capsule mass and is sufficiently
flexible to accommodate volume changes that accompany solid-liquid phase change [14].
Page 29
15
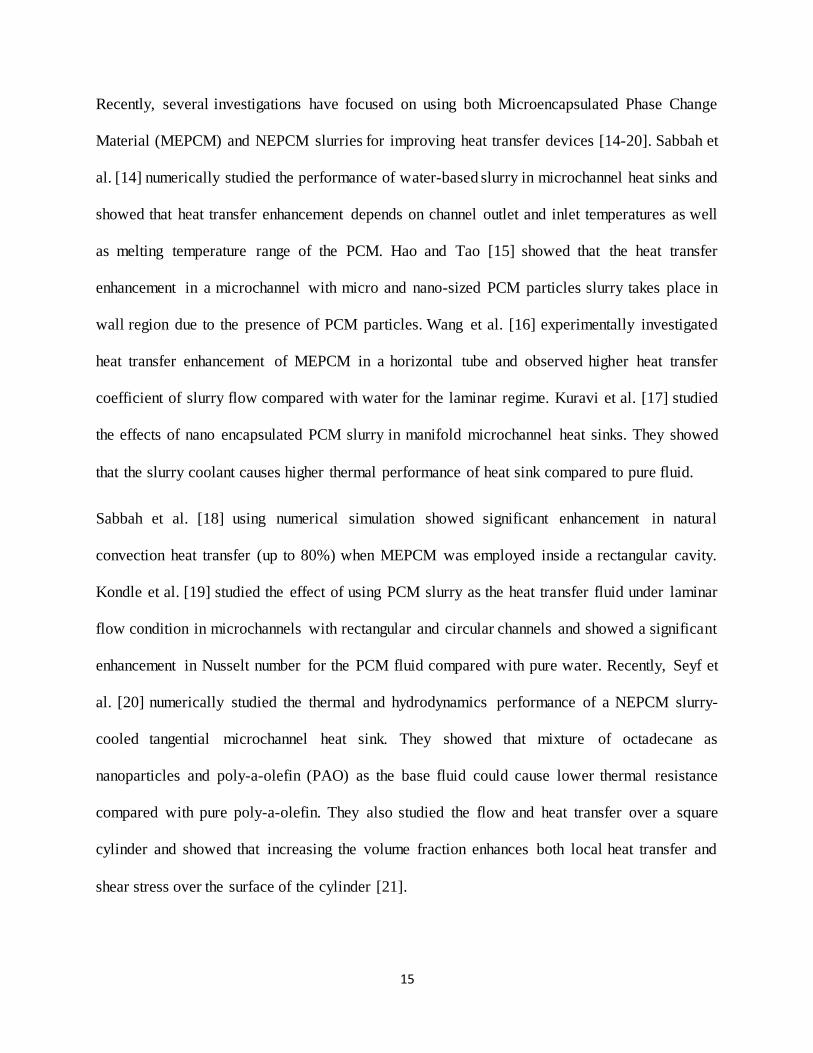
Recently, several investigations have focused on using both Microencapsulated Phase Change
Material (MEPCM) and NEPCM slurries for improving heat transfer devices [14-20]. Sabbah et
al. [14] numerically studied the performance of water-based slurry in microchannel heat sinks and
showed that heat transfer enhancement depends on channel outlet and inlet temperatures as well
as melting temperature range of the PCM. Hao and Tao [15] showed that the heat transfer
enhancement in a microchannel with micro and nano-sized PCM particles slurry takes place in
wall region due to the presence of PCM particles. Wang et al. [16] experimentally investigated
heat transfer enhancement of MEPCM in a horizontal tube and observed higher heat transfer
coefficient of slurry flow compared with water for the laminar regime. Kuravi et al. [17] studied
the effects of nano encapsulated PCM slurry in manifold microchannel heat sinks. They showed
that the slurry coolant causes higher thermal performance of heat sink compared to pure fluid.
Sabbah et al. [18] using numerical simulation showed significant enhancement in natural
convection heat transfer (up to 80%) when MEPCM was employed inside a rectangular cavity.
Kondle et al. [19] studied the effect of using PCM slurry as the heat transfer fluid under laminar
flow condition in microchannels with rectangular and circular channels and showed a significant
enhancement in Nusselt number for the PCM fluid compared with pure water. Recently, Seyf et
al. [20] numerically studied the thermal and hydrodynamics performance of a NEPCM slurry-
cooled tangential microchannel heat sink. They showed that mixture of octadecane as
nanoparticles and poly-a-olefin (PAO) as the base fluid could cause lower thermal resistance
compared with pure poly-a-olefin. They also studied the flow and heat transfer over a square
cylinder and showed that increasing the volume fraction enhances both local heat transfer and
shear stress over the surface of the cylinder [21].
Page 30
16
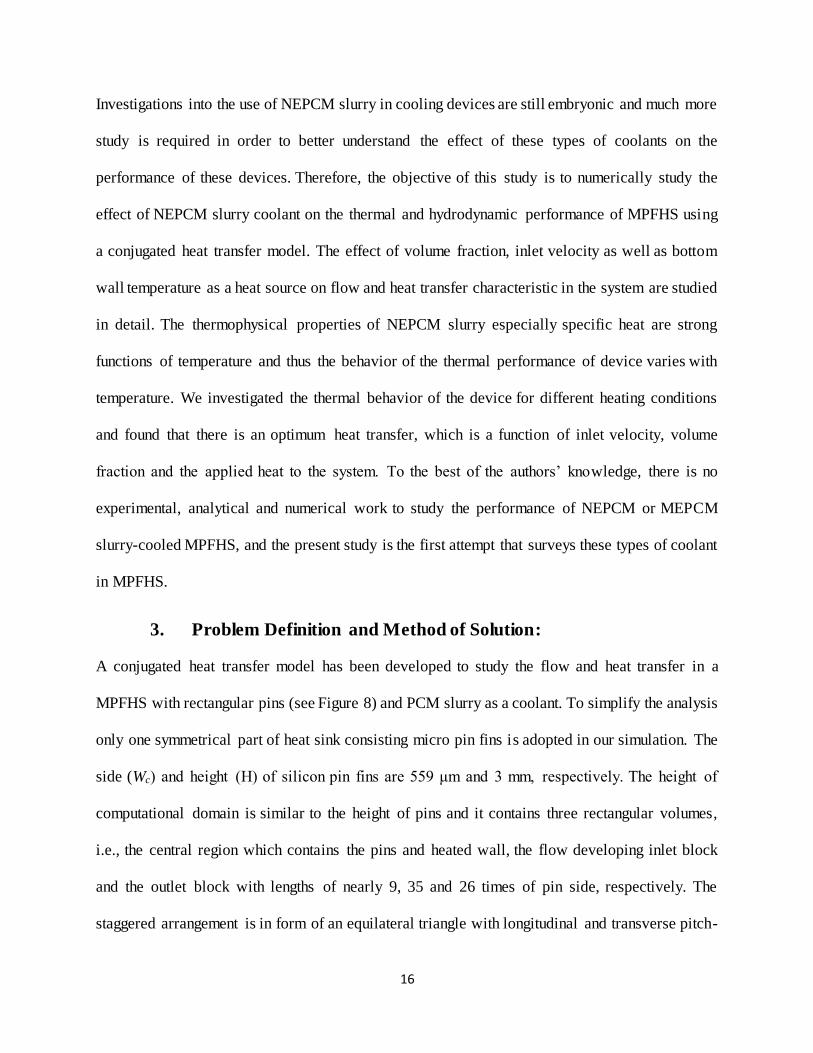
Investigations into the use of NEPCM slurry in cooling devices are still embryonic and much more
study is required in order to better understand the effect of these types of coolants on the
performance of these devices. Therefore, the objective of this study is to numerically study the
effect of NEPCM slurry coolant on the thermal and hydrodynamic performance of MPFHS using
a conjugated heat transfer model. The effect of volume fraction, inlet velocity as well as bottom
wall temperature as a heat source on flow and heat transfer characteristic in the system are studied
in detail. The thermophysical properties of NEPCM slurry especially specific heat are strong
functions of temperature and thus the behavior of the thermal performance of device varies with
temperature. We investigated the thermal behavior of the device for different heating conditions
and found that there is an optimum heat transfer, which is a function of inlet velocity, volume
fraction and the applied heat to the system. To the best of the authors’ knowledge, there is no
experimental, analytical and numerical work to study the performance of NEPCM or MEPCM
slurry-cooled MPFHS, and the present study is the first attempt that surveys these types of coolant
in MPFHS.
3. Problem Definition and Method of Solution:
A conjugated heat transfer model has been developed to study the flow and heat transfer in a
MPFHS with rectangular pins (see Figure 8) and PCM slurry as a coolant. To simplify the analysis
only one symmetrical part of heat sink consisting micro pin fins is adopted in our simulation. The
side (Wc) and height (H) of silicon pin fins are 559 μm and 3 mm, respectively. The height of
computational domain is similar to the height of pins and it contains three rectangular volumes,
i.e., the central region which contains the pins and heated wall, the flow developing inlet block
and the outlet block with lengths of nearly 9, 35 and 26 times of pin side, respectively. The
staggered arrangement is in form of an equilateral triangle with longitudinal and transverse pitch-
Page 31
17
to-side ratios of SL =1.012 and ST =1.012, respectively. The governing equations of conservation
of mass, momentum and energy for an incompressible flow can be written as:
S
zzyyxxz
w
y
v
x
u
(5)
Where, stands for the velocity components and temperature, i.e., wvu ,, and T , S , are
the corresponding source and diffusion terms, respectively [12].
Figure 8. Schematic of the computational domain
A combination of outlet, wall, inlet, and symmetry boundary conditions are applied in the
computational domain. Each of the surfaces is denoted by a number in the schematic shown in
Figure above. Constant temperature boundary condition with different values ranging from
296.15˚K to 350.15˚K is applied on the bottom surface of the central region (surface 6) whereas
the top wall of the domain is insulated (surfaces 5, 9, and 14). At the inlet (surfaces 1), a constant
Page 32
18
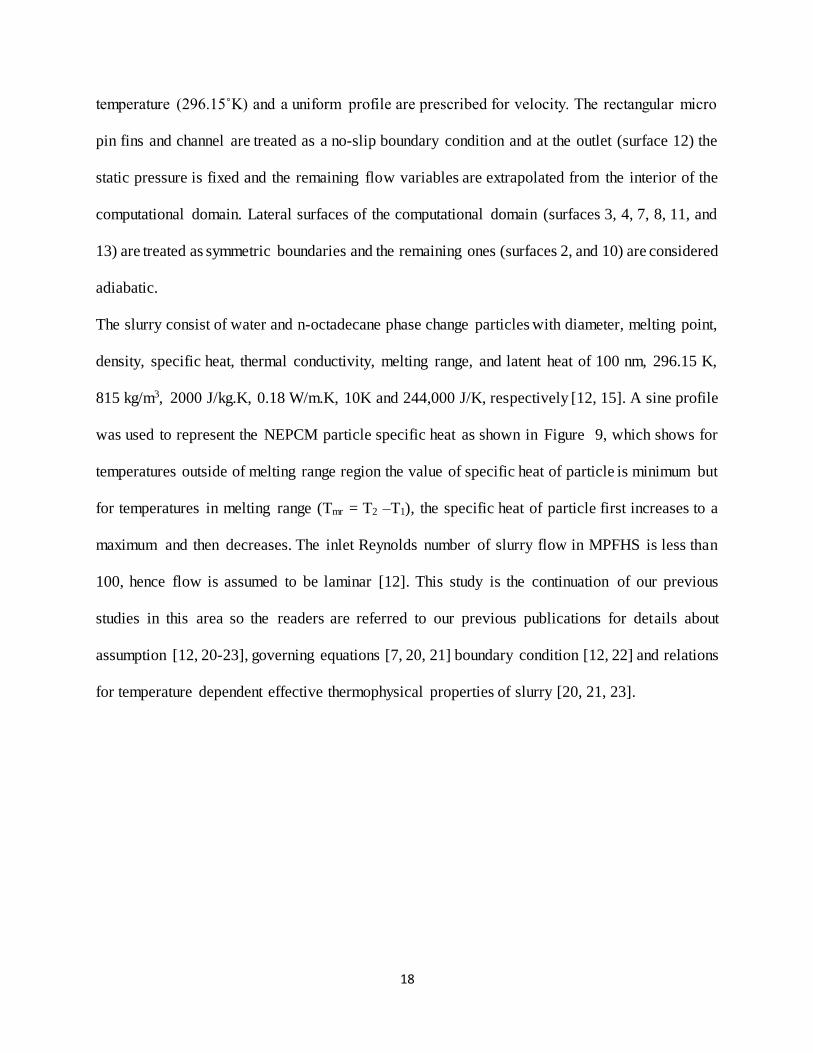
temperature (296.15˚K) and a uniform profile are prescribed for velocity. The rectangular micro
pin fins and channel are treated as a no-slip boundary condition and at the outlet (surface 12) the
static pressure is fixed and the remaining flow variables are extrapolated from the interior of the
computational domain. Lateral surfaces of the computational domain (surfaces 3, 4, 7, 8, 11, and
13) are treated as symmetric boundaries and the remaining ones (surfaces 2, and 10) are considered
adiabatic.
The slurry consist of water and n-octadecane phase change particles with diameter, melting point,
density, specific heat, thermal conductivity, melting range, and latent heat of 100 nm, 296.15 K,
815 kg/m3, 2000 J/kg.K, 0.18 W/m.K, 10K and 244,000 J/K, respectively [12, 15]. A sine profile
was used to represent the NEPCM particle specific heat as shown in Figure 9, which shows for
temperatures outside of melting range region the value of specific heat of particle is minimum but
for temperatures in melting range (Tmr = T2 –T1), the specific heat of particle first increases to a
maximum and then decreases. The inlet Reynolds number of slurry flow in MPFHS is less than
100, hence flow is assumed to be laminar [12]. This study is the continuation of our previous
studies in this area so the readers are referred to our previous publications for details about
assumption [12, 20-23], governing equations [7, 20, 21] boundary condition [12, 22] and relations
for temperature dependent effective thermophysical properties of slurry [20, 21, 23].
Page 33
19
Figure 9. Specific heat of NEPCM as a function of temperature
A validated code [12, 22] based on finite volume method and SIMPLE algorithm [18] has been
employed as the numerical solver. Second order and QUICK schemes [22, 24] were used for
discretization of diffusive and convective terms, respectively. In order to avoid velocity-pressure
decoupling problem, the velocity components in the discretized continuity equation are calculated
using Rhie-Chow [25] interpolation technique. More details about numerical method can be found
in [12, 20-23].
The maximum flow velocity in fin channel can be obtained using:
max
min
fQu
A (6)
Where minA is the minimum transverse flow area of square micro pin fin, which can be calculated
from:
minsin 45
2
co
T
W
A WHS
(7)
The Reynolds number based on the minimum width is given by:
Page 34
20
maxRe
slurry c
c
slurry
u D
(8)
where subscript slurry indicates the effective properties of NEPCM slurry. The minimum
channel width is determined by:
2
sin 45
/ sin 45
co
c o
c
HW
DH W
(9)
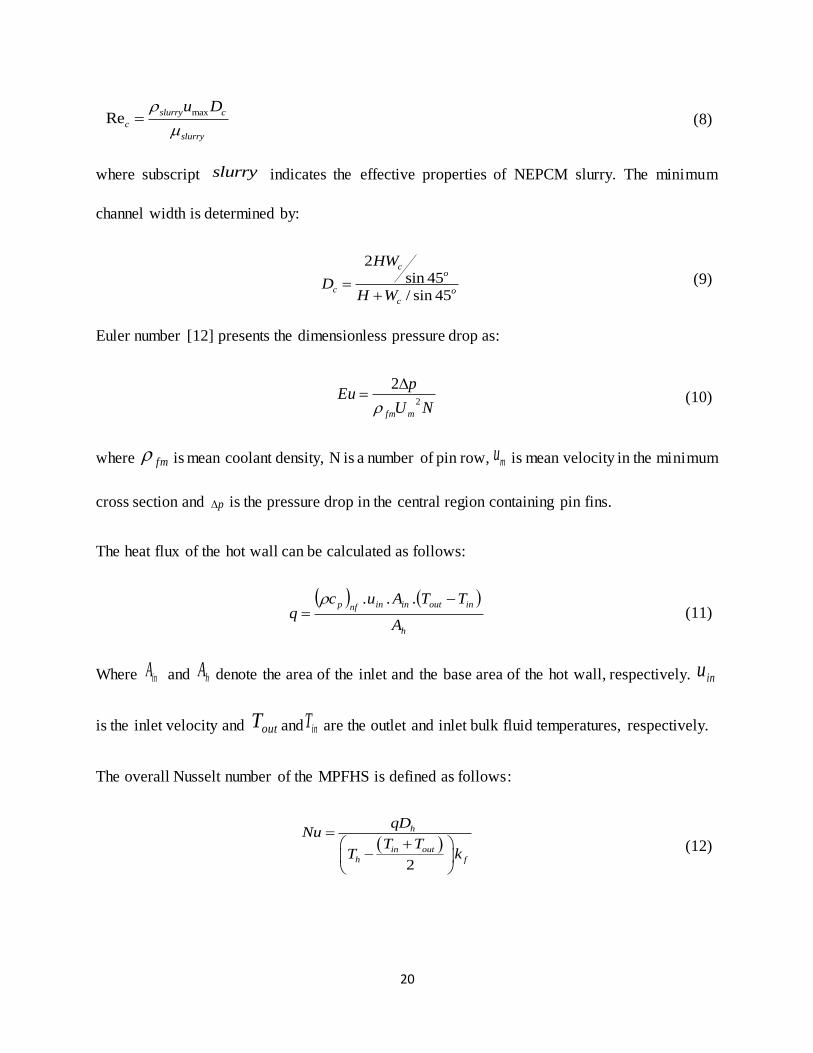
Euler number [12] presents the dimensionless pressure drop as:
NU
pEu
mfm
2
2
(10)
where fm is mean coolant density, N is a number of pin row, mu is mean velocity in the minimum
cross section and p is the pressure drop in the central region containing pin fins.
The heat flux of the hot wall can be calculated as follows:
h
inoutininnfp
A
TTAucq
...
(11)
Where inA and hA denote the area of the inlet and the base area of the hot wall, respectively. inu
is the inlet velocity and outT and inT are the outlet and inlet bulk fluid temperatures, respectively.
The overall Nusselt number of the MPFHS is defined as follows:
2
h
in out
h f
qDNu
T TT k
(12)
Page 35
21
Where hT , fk and hD are the temperature of the bottom wall, fluid thermal conductivity and the
hydraulic diameter of the pin cross-section, respectively.
4. Grid independency and Validation:
An unstructured grid of tetrahedral volume elements was used for the central region that contains
pins, while two structure grids were used for inlet and outlet, and blocks. Four grids with different
size of 836,125 (coarse), 1,298,211 (intermediate), 2,368,659 (fine) and 3,172,277 (very fine) are
used to study the independency of the solution to number of grids. Table 1 presents the values and
percentage difference of Nusselt and Euler numbers for the studied grid sizes for bottom wall
temperature of 299.15 K. As seen the maximum difference between experimental and numerical
Nusselt and Euler numbers are 2.01% and 2.28%, respectively hence in this study, the fine grid is
selected to conduct the simulation.
Table 2. Girds independency study
Twall (K) Number of grid Euler Number diff (%) Nu diff (%)
299.15 836,125 2.118 - 5.072 -
299.15 1,298,211 1.793 15.37% 4.189 17.40%
299.15 2,368,659 1.593 11.14% 3.710 11.42%
299.15 3,172,277 1.561 2.01% 3.626 2.28%
It is worth mentioning that the code used in this study has been validated against several
experimental data [12, 22]. However, we further validate the code and present results by comparing
numerical results with experimental data of Liu et al [13]. The experimental device consists of a
copper micro pin fin heat sink cooled by deionized water with a transfer area of 20 × 20 mm2 and
an array of 625 staggered square pin fins with 3 mm height and 559 × 559 μm2 cross section.
Page 36
22
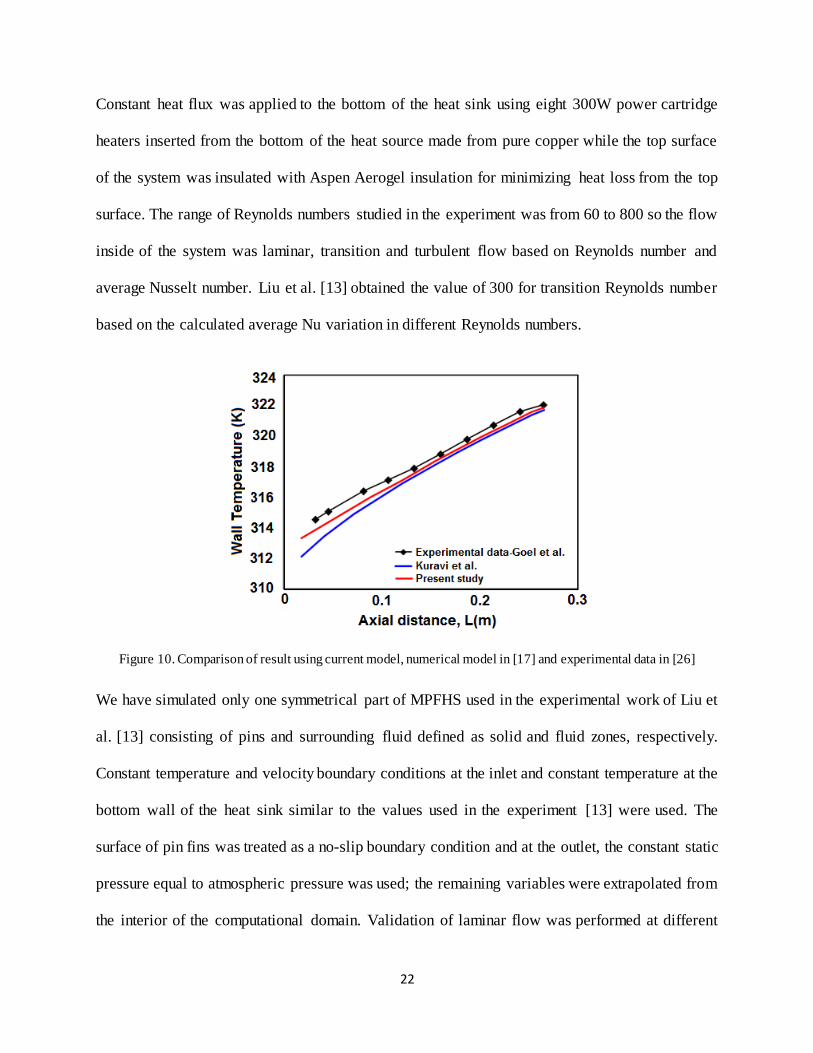
Constant heat flux was applied to the bottom of the heat sink using eight 300W power cartridge
heaters inserted from the bottom of the heat source made from pure copper while the top surface
of the system was insulated with Aspen Aerogel insulation for minimizing heat loss from the top
surface. The range of Reynolds numbers studied in the experiment was from 60 to 800 so the flow
inside of the system was laminar, transition and turbulent flow based on Reynolds number and
average Nusselt number. Liu et al. [13] obtained the value of 300 for transition Reynolds number
based on the calculated average Nu variation in different Reynolds numbers.
Figure 10. Comparison of result using current model, numerical model in [17] and experimental data in [26]
We have simulated only one symmetrical part of MPFHS used in the experimental work of Liu et
al. [13] consisting of pins and surrounding fluid defined as solid and fluid zones, respectively.
Constant temperature and velocity boundary conditions at the inlet and constant temperature at the
bottom wall of the heat sink similar to the values used in the experiment [13] were used. The
surface of pin fins was treated as a no-slip boundary condition and at the outlet, the constant static
pressure equal to atmospheric pressure was used; the remaining variables were extrapolated from
the interior of the computational domain. Validation of laminar flow was performed at different
Page 37
23
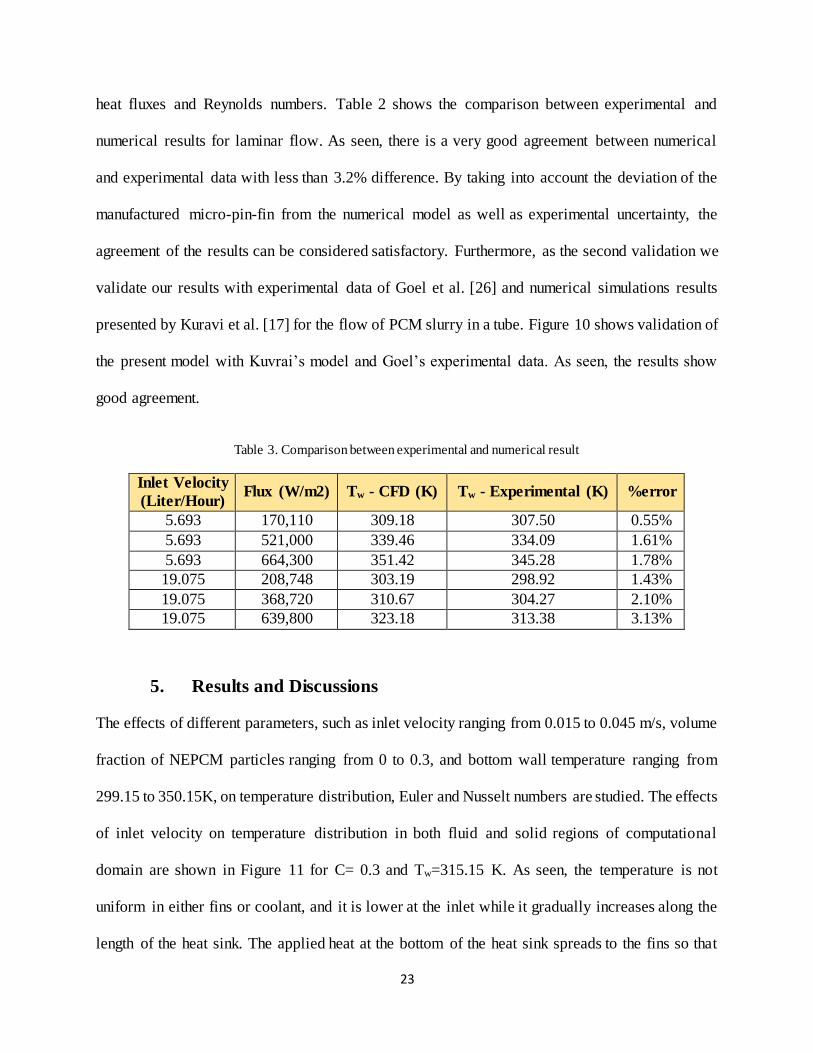
heat fluxes and Reynolds numbers. Table 2 shows the comparison between experimental and
numerical results for laminar flow. As seen, there is a very good agreement between numerical
and experimental data with less than 3.2% difference. By taking into account the deviation of the
manufactured micro-pin-fin from the numerical model as well as experimental uncertainty, the
agreement of the results can be considered satisfactory. Furthermore, as the second validation we
validate our results with experimental data of Goel et al. [26] and numerical simulations results
presented by Kuravi et al. [17] for the flow of PCM slurry in a tube. Figure 10 shows validation of
the present model with Kuvrai’s model and Goel’s experimental data. As seen, the results show
good agreement.
Table 3. Comparison between experimental and numerical result
Inlet Velocity
(Liter/Hour) Flux (W/m2) Tw - CFD (K) Tw - Experimental (K) %error
5.693 170,110 309.18 307.50 0.55%
5.693 521,000 339.46 334.09 1.61%
5.693 664,300 351.42 345.28 1.78%
19.075 208,748 303.19 298.92 1.43%
19.075 368,720 310.67 304.27 2.10%
19.075 639,800 323.18 313.38 3.13%
5. Results and Discussions
The effects of different parameters, such as inlet velocity ranging from 0.015 to 0.045 m/s, volume
fraction of NEPCM particles ranging from 0 to 0.3, and bottom wall temperature ranging from
299.15 to 350.15K, on temperature distribution, Euler and Nusselt numbers are studied. The effects
of inlet velocity on temperature distribution in both fluid and solid regions of computational
domain are shown in Figure 11 for C= 0.3 and Tw=315.15 K. As seen, the temperature is not
uniform in either fins or coolant, and it is lower at the inlet while it gradually increases along the
length of the heat sink. The applied heat at the bottom of the heat sink spreads to the fins so that
Page 38
24
the temperature is high at the bottom of the heat sink but it decreases along the height of micro pin
fins because of the interaction of coolant with pin fins that cools the pin fins. It can be seen that
with increasing inlet velocity the temperatures of coolant and solid region of heat sink decreases
because of lower thermal boundary layer thickness on the fins and bottom surface and
consequently higher heat transfer rates from fins to the coolant. It is worth noting that with
increasing inlet velocity, the average velocity of coolant in the heat sink increases while the heat
transfer between coolant and pin fins increases because of generation of thinner thermal boundary
layers on the solid surfaces. These opposite trends is due to the fact that the convection heat transfer
in the coolant is comprised of two mechanisms, i.e., energy transfer due to the bulk motion of
working fluid and energy transfer due to diffusion in the coolant. With increasing inlet velocity,
the mean coolant velocity in the system increases and forced convection plays a more significant
role in the heat transfer, hence, the coolant transfers more heat without much increase in
temperature. On the other hand at low inlet velocities, the coolant mean velocity is low and the
coolant has more time to absorb and spread heat, hence diffusive heat transfer is the dominant
factor which causes the coolant to achieve a higher bulk temperature. It can be also seen that for
V=0.015 m/s the temperature field in both coolant and fins become fully developed after the
twentieth fin while for other cases the temperature in the system does not reach to fully developed
condition. Similar behaviors have been observed for other bottom wall temperatures and volume
fraction of NEPCM particles.
Page 39
25
Figure 11. The temperature distribution (unit: Kelvin) in the system at three different inlet velocities for C= 0.3 and Tw=315.15 K
Figure 12 exemplifies the effect of volume fraction of NEPCM particles on temperature
distribution in the computational domain at Tw = 315.15 K and V =0.045 m/s. As expected, due to
higher heat capacity of the slurry coolant, using NEPCM slurry as coolant leads to lower fin
temperature and consequently higher heat transfer coefficient; with increasing the volume fraction
of nanoparticles, the reduction in temperature intensifies, which is an indication of higher heat
transfer at higher volume fractions. Furthermore, as seen using NEPCM slurry cause the thermal
boundary layer thicknesses on the fins and bottom surface decrease because the slurry NEPCM
particles act as heat sink and slows down the thermal boundary layer thickening. It can also be
seen that the temperature distribution in fluid region becomes smoother as volume fraction
increases. This is due to the fact that NEPCM particles increase the viscosity of slurry which make
the coolant more stable and consequently dampen the complex flow fields.
Page 40
26
Figure 12. The temperature distribution (unit: Kelvin) in the system at three volume fraction for Vin = 0.045 m/s and Tw=315.15 K
One of the main questions in designing a cooling device with NEPCM slurry is how much more
performance can be gained by using NEPCM slurry as a coolant. To answer this question, the
combined effects of volume fraction, bottom wall temperature, and inlet velocity on Nusselt
number for different inlet velocities is shown in 13 (a)-(c). As explained previously, increasing the
volume fraction of NEPCM causes the thermal boundary layer on the solid surfaces to decrease
and the effective heat capacity of coolant to increase. Therefore, the heat transfer and consequently
Nusselt number increases as shown in Figure 13 (a)-(c). Moreover, with increasing the inlet
velocity at a constant volume fraction of NEPCM, the heat transfer coefficient increases due to
reduction in thickness of thermal boundary layer. Therefore, one can conclude that higher volume
fractions and inlet velocities result in more effective cooling. It is worth to mention that in general
when the inlet temperature is less than solidus temperature (T1); the system can be divided into
three distinct regions according to the temperature of slurry coolant. In the first region, which is
near the inlet of heat sink, the NEPCM particles are solid and slurry has a constant and
Page 41
27
approximately low heat capacity hence the main mechanism for heat transfer is high temperature
difference between wall and coolant not the heat capacity of slurry. In the second region, which is
somewhere in the middle of heat sink, the NEPCM particles melt and coolant has a heat capacity
equal to summation of latent and sensible heat of NEPCM particles so that the main mechanisms
in this region is high effective heat capacity of coolant. Finally, in the third region, which is at the
end heat sink, the temperature of coolant is very high and the PCM is completely molten and heat
capacity of slurry is constant and equal to liquid specific heat of NEPCM slurry so the minimum
heat transfer enhancement occurs in this region. Therefore, the cooling capability of coolant in the
system first increases and then decreases.
Page 42
28
Figure 13. Effect of volume fraction on Nusselt number at various inlet velocities
Page 43
29
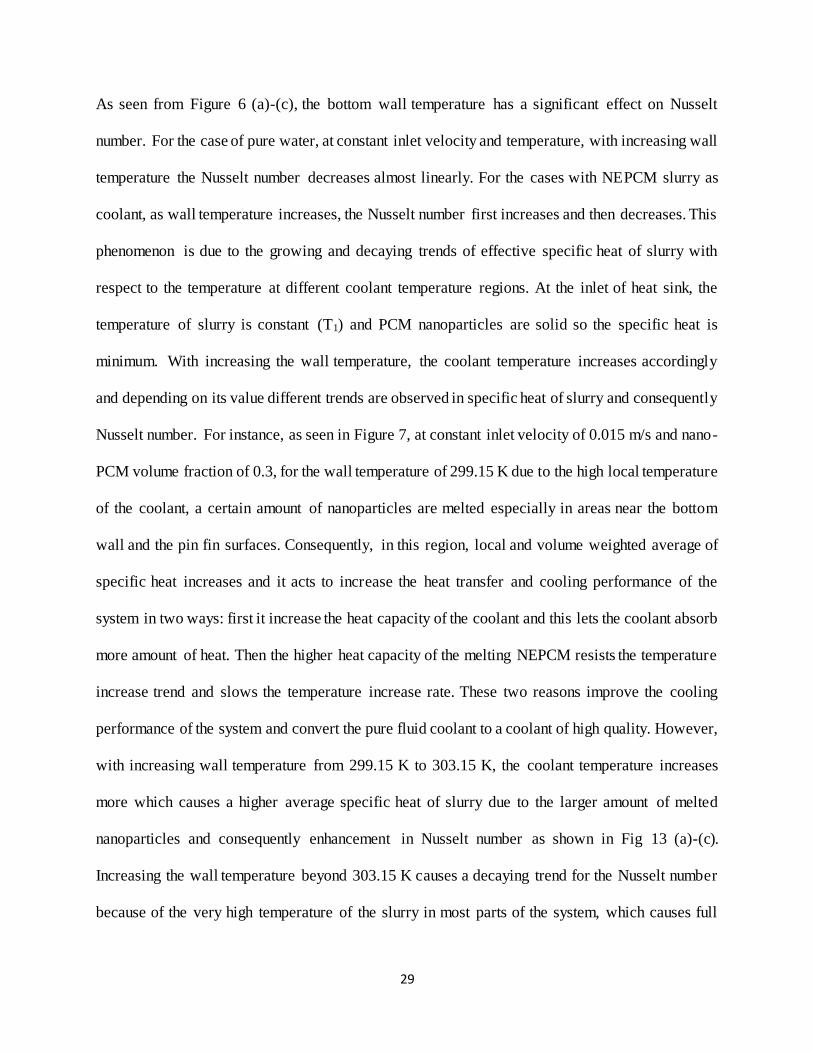
As seen from Figure 6 (a)-(c), the bottom wall temperature has a significant effect on Nusselt
number. For the case of pure water, at constant inlet velocity and temperature, with increasing wall
temperature the Nusselt number decreases almost linearly. For the cases with NEPCM slurry as
coolant, as wall temperature increases, the Nusselt number first increases and then decreases. This
phenomenon is due to the growing and decaying trends of effective specific heat of slurry with
respect to the temperature at different coolant temperature regions. At the inlet of heat sink, the
temperature of slurry is constant (T1) and PCM nanoparticles are solid so the specific heat is
minimum. With increasing the wall temperature, the coolant temperature increases accordingly
and depending on its value different trends are observed in specific heat of slurry and consequently
Nusselt number. For instance, as seen in Figure 7, at constant inlet velocity of 0.015 m/s and nano-
PCM volume fraction of 0.3, for the wall temperature of 299.15 K due to the high local temperature
of the coolant, a certain amount of nanoparticles are melted especially in areas near the bottom
wall and the pin fin surfaces. Consequently, in this region, local and volume weighted average of
specific heat increases and it acts to increase the heat transfer and cooling performance of the
system in two ways: first it increase the heat capacity of the coolant and this lets the coolant absorb
more amount of heat. Then the higher heat capacity of the melting NEPCM resists the temperature
increase trend and slows the temperature increase rate. These two reasons improve the cooling
performance of the system and convert the pure fluid coolant to a coolant of high quality. However,
with increasing wall temperature from 299.15 K to 303.15 K, the coolant temperature increases
more which causes a higher average specific heat of slurry due to the larger amount of melted
nanoparticles and consequently enhancement in Nusselt number as shown in Fig 13 (a)-(c).
Increasing the wall temperature beyond 303.15 K causes a decaying trend for the Nusselt number
because of the very high temperature of the slurry in most parts of the system, which causes full
Page 44
30
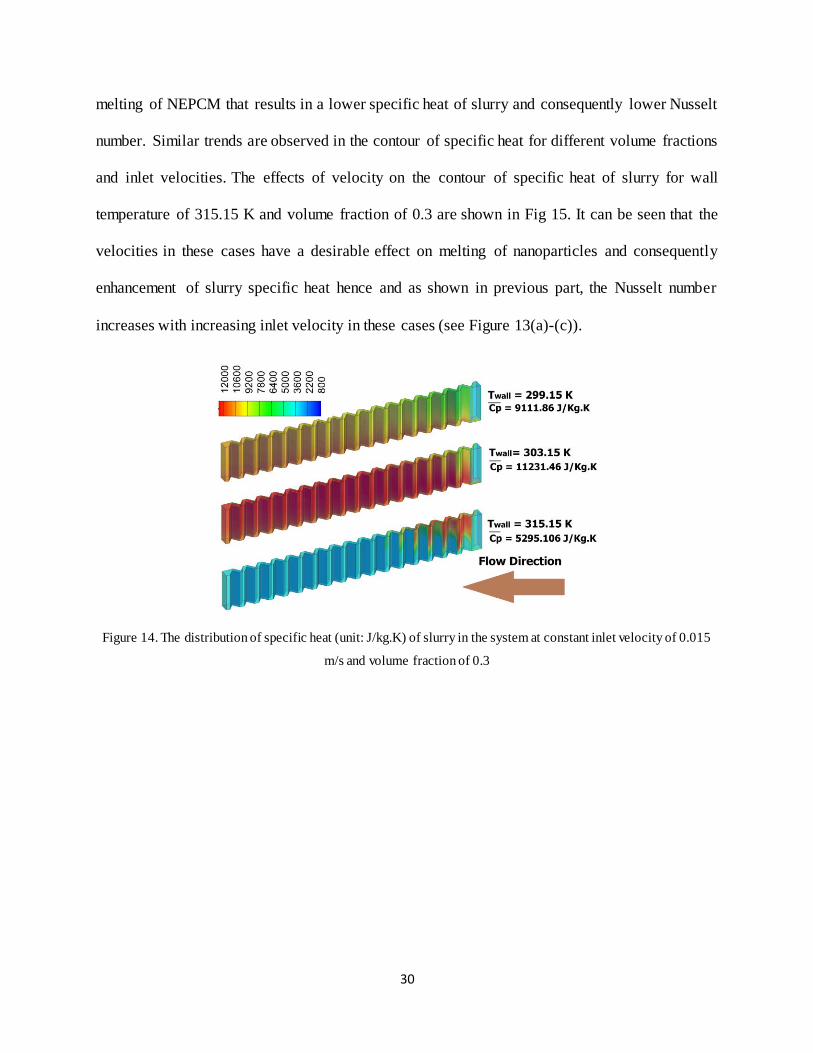
melting of NEPCM that results in a lower specific heat of slurry and consequently lower Nusselt
number. Similar trends are observed in the contour of specific heat for different volume fractions
and inlet velocities. The effects of velocity on the contour of specific heat of slurry for wall
temperature of 315.15 K and volume fraction of 0.3 are shown in Fig 15. It can be seen that the
velocities in these cases have a desirable effect on melting of nanoparticles and consequently
enhancement of slurry specific heat hence and as shown in previous part, the Nusselt number
increases with increasing inlet velocity in these cases (see Figure 13(a)-(c)).
Figure 14. The distribution of specific heat (unit: J/kg.K) of slurry in the system at constant inlet velocity of 0.015
m/s and volume fraction of 0.3
Page 45
31
Figure 15. The distribution of specific heat (unit: J/kg.K) of slurry in the system at bottom wall temperature of
315.15 K and volume fraction of 0.3
Figure 16 illustrates the effects of volume fraction, inlet velocity and bottom wall temperature
variations on Euler number. It can be seen that by decreasing the inlet velocity, the Euler number
increases and the sensitivity of Euler number to volume fraction decreases at higher inlet velocities.
Therefore, the high-pressure drop for the NEPCM slurry coolant at higher inlet velocities should
be given careful consideration in designing heat sinks. Furthermore, with increasing the bottom
wall temperature, the Euler number decreases which is due to absorption of more heat by the
coolant and increasing bulk temperature of coolant and consequently reduction in viscosity of
working fluid which reduce the pressure drop.
Page 46
32
Figure 16. Effect of volume fraction on Euler number at various bottom wall temperatures
Furthermore as seen in Figure 16, with using NEPCM slurry enhances the Euler number and
consequently pressure drop, which is due to higher viscosity of slurry coolant compared to pure
water. As seen, NEPCM slurry coolant is suffering from the increase in Euler number by increasing
the NEPCM volume fraction because of higher viscosity compared with the pure water. It can be
seen in viscosity contours shown in Figure 17 that the higher temperature of the coolant in regions
close to the fin surfaces leads to the lower viscosity of the slurry. The reason behind this
phenomenon is that the molecules in colder segments are enjoying a lower energy level compared
Page 47
33
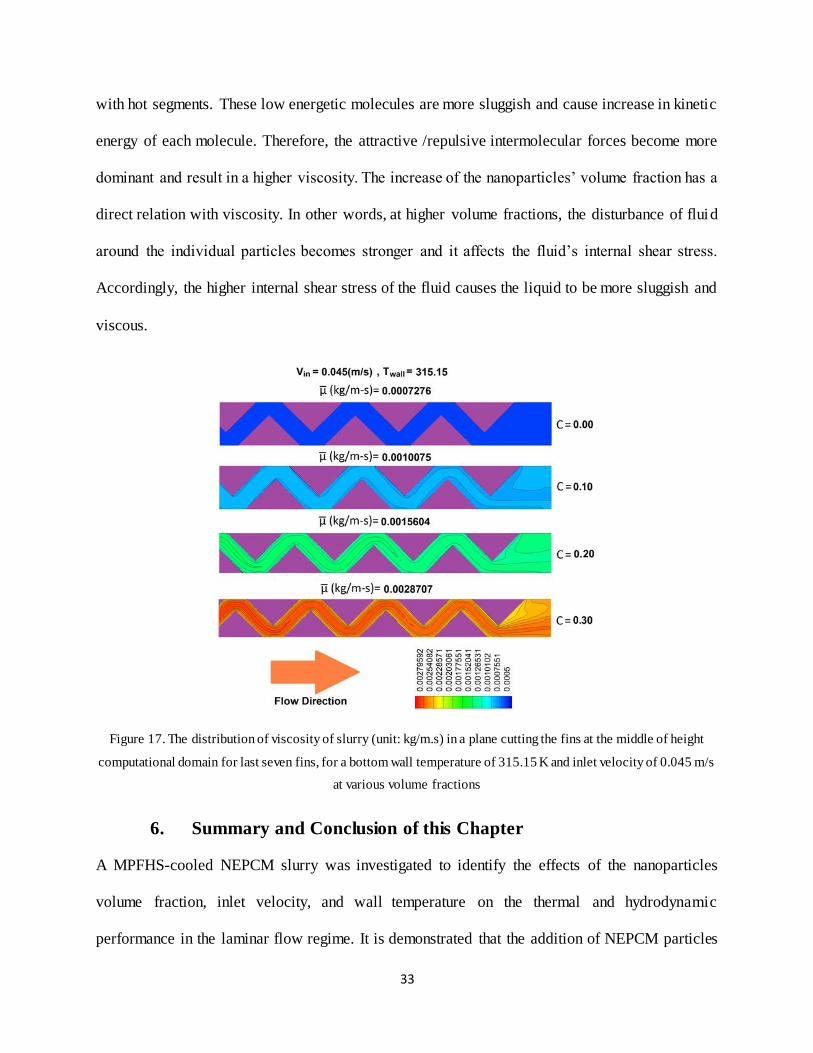
with hot segments. These low energetic molecules are more sluggish and cause increase in kinetic
energy of each molecule. Therefore, the attractive /repulsive intermolecular forces become more
dominant and result in a higher viscosity. The increase of the nanoparticles’ volume fraction has a
direct relation with viscosity. In other words, at higher volume fractions, the disturbance of fluid
around the individual particles becomes stronger and it affects the fluid’s internal shear stress.
Accordingly, the higher internal shear stress of the fluid causes the liquid to be more sluggish and
viscous.
Figure 17. The distribution of viscosity of slurry (unit: kg/m.s) in a plane cutting the fins at the middle of height
computational domain for last seven fins, for a bottom wall temperature of 315.15 K and inlet velocity of 0.045 m/s
at various volume fractions
6. Summary and Conclusion of this Chapter
A MPFHS-cooled NEPCM slurry was investigated to identify the effects of the nanoparticles
volume fraction, inlet velocity, and wall temperature on the thermal and hydrodynamic
performance in the laminar flow regime. It is demonstrated that the addition of NEPCM particles
Page 48
34
to the base fluid can enhance the Nusselt number remarkably but it has a drastic effect on Euler
number; with increasing the volume fraction and decreasing Reynolds number, more increases on
Euler number is observed. The results also show that increasing volume fraction and inlet velocity
causes significant enhancement in Nusselt number but with increasing bottom wall temperature,
the Nusselt number first increases and then decreases. While the desirable 2.27, 1.81, 1.56 times
higher maximum Nusselt numbers may be achieved when NEPCM slurries (C = 0.3) with Vin =
0.015, 0.030, 0.045 (m/s) are employed, respectively, the more than 3 times greater associated
Euler numbers denote the inevitable need for higher pumping power facilities.
Page 49
35
Chapter 3. Effects of Pin Tip-Clearance on the Performance of an
Enhanced Microchannel Heat Sink
1. Introduction
The performance of an enhanced microchannel heat sink with sectional oblique fins and with a
coolant that contains Nano-Encapsulated Phase Change Material (NEPCM) particles is
investigated using a 3D conjugated heat transfer model. Three volume fractions from ξ=0 (pure
water) to 0.3 are studied to investigate the effects of the presence of NEPCM particles. Then the
effects of introducing tip-clearance to the heat sink on thermal and hydrodynamic performance are
examined at low Reynolds numbers (less than 215). Four values of tip-clearance to channel width
ratio (𝑡/𝑊𝑐) are investigated ranging from a no gap (𝑡/𝑊𝑐 = 0) to 𝑡/𝑊𝑐 =0.74. On the bottom
wall of the heat sink a range of uniform and fixed temperatures of 299.15K to 340.15K are applied.
The cooling and hydrodynamic performance of the heat sink is studied using Nusselt and Euler
Numbers, respectively. It was observed that using of NEPCM slurry in contrast with pure water,
enhanced the cooling performance of the heat sink but increased the Euler number. Furthermore,
it was seen that the introduction of tip-clearance to the heat sink, if the clearance ratio is chosen
properly, has the potential to enhance the cooling performance and reducing the Euler number
simultaneously.
2. Literature Review
Necessity to miniaturize the advanced computational instruments to suit the modern needs and the
high heat generation rate of these microprocessors in one side, and the direct relation between the
efficiency of the heat dissipation systems and the computational performance of the processors on
the other side, shows the importance of innovative ideas in design of micro cooling systems. In
Page 50
36
this decade, several researchers have enhanced the heat rejection rate of conventional
microchannel heat sinks and it seems there is an optimum efficiency level for the conventional
microchannels which is numerically and experimentally obtained. Therefore, the heat dissipation
techniques’ ability might have the potential of becoming an obstacle on the path of computational
speed progress. In order to create new opportunities to enhance the cooling ability of the currently
available heat sinks, researchers have investigated the cooling system configuration, working
fluids and other relevant parameters to improve the heat sink cooling performance [27-31]. Wang
and Peles [30] categorized the enhancing techniques into two groups: passive and active. They
experimentally investigated the effect of a combined passive/active heat transfer enhancement
scheme on the thermal performance of a microchannel. Seyf et al. [20] studied the effect of
utilizing NEPCM slurry in a micro tube heat sink and through performing a validated numerical
analysis proved that adding NEPCM particles to the working fluid boosts the Nusselt number of
the system. They compared the total entropy generation rate as a function of Reynolds number for
a set of mass concentration levels of NEPCM particles in PAO coolant. Kuravi et al. [17]
performed a numerical analysis on a microchannel heat sink and achieved an acceptable agreement
between the numerical result and experimental results reported by Goel et al. [26]. The results
presented by Kuravi et al. illustrated that adding NEPCM particles to the slurry enhances the
cooling efficiency.
Sabbah et al. [14] numerically investigated the length of the thermal boundary layer on a surface
when Micro-Encapsulated Phase Change Material (MEPCM) particles are added to the pure
coolant. They suggested that the presence of MEPCM particles in the slurry could increase the
thermal entry length and it consequently boosted the heat dissipation rate. Lee et al. [32] concluded
that by using oblique fins that disrupted the velocity profile development, one could improve the
Page 51
37
heat dissipation rate of a microchannel. They fabricated two microchannels based on the new
design and analyzed the fluid flow. The effects of the oblique channels on boundary layer growth
process and heat transfer behavior of the microchannel were studied and an increase of the Nusselt
number to two times more than the base values was reported. They also investigated the effect of
the oblique channels in more details [33]. Rayes et al. [34] fabricated a microchannel and designed
an appropriate experimental setup so that five different tip clearance configurations could be
tested. Effects of the tip clearance presence on the rejected heat flux and pressure drop along the
channels were examined; they compared them as a function of pumping power. Their research
indicated that the tip clearance distance is a dominant parameter in the heat transfer rate of the
microchannel. Moores et al. [35] studied the effect of tip clearance on the thermal and
hydrodynamic performances of a circular pin fin array. The results showed that the geometric
parameters significantly affected the heat transfer and flow behaviors of the heat sink. They
illustrated that tip clearance may increase or decrease the heat transfer rate at a fixed Reynolds
Number. Min et al. investigated a conventional microchannel heat sink with tip clearance and
reported that the ratio of tip clearance size to channel width (𝑡/𝑊𝑐) is the parameter that should be
considered in design of the heat sinks with tip clearance [36]. They could find an optimum value
of this ratio for their problem definition. The effect of tip clearance was also studied in [37, 38]
and its effect as a function of different parameters such as pumping power, fluid average velocity,
Reynolds number, etc. was investigated.
In this study, the effects of tip clearance size and NEPCM slurry coolant on the performance of an
enhanced microchannel heat sink with oblique channels have been studied. The effect of the
NEPCM slurry on the enhancement of the heat dissipation rate of the heat sink in three different
Page 52
38
bottom wall temperature conditions have been examined and the effect of the presence of tip
clearance on fluid flow and heat transfer rate of the heat sink is reported.
3. Mathematical modeling and governing equations
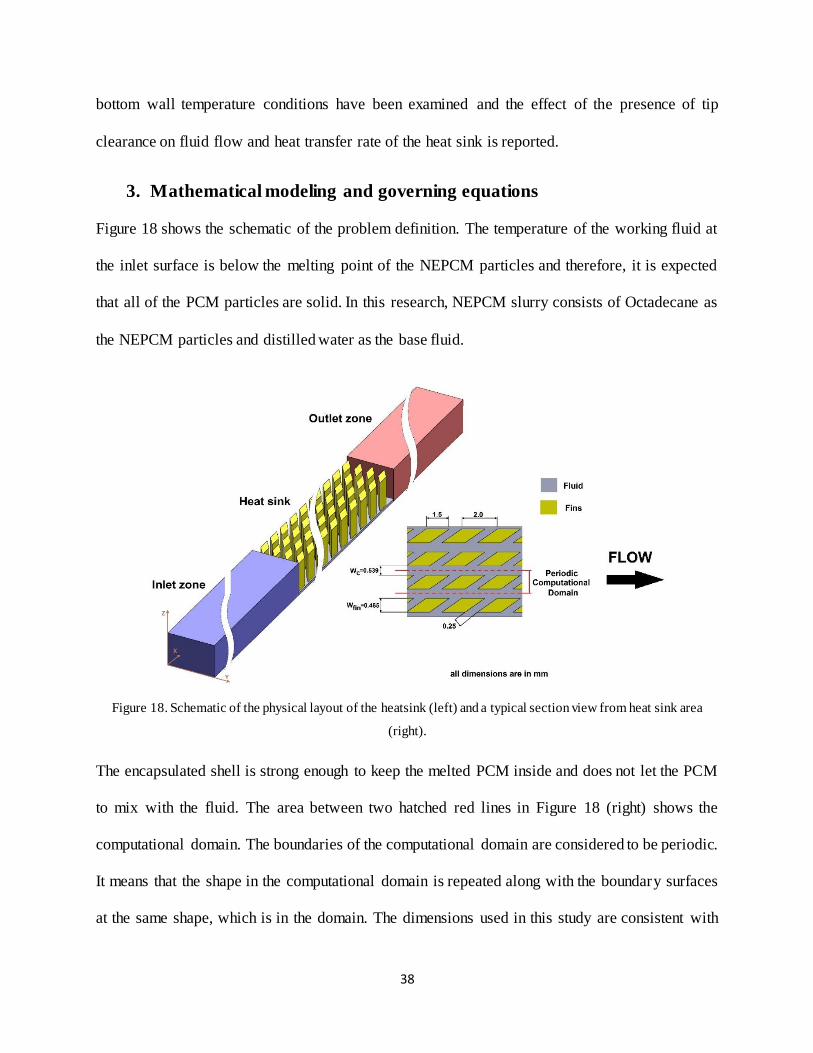
Figure 18 shows the schematic of the problem definition. The temperature of the working fluid at
the inlet surface is below the melting point of the NEPCM particles and therefore, it is expected
that all of the PCM particles are solid. In this research, NEPCM slurry consists of Octadecane as
the NEPCM particles and distilled water as the base fluid.
Figure 18. Schematic of the physical layout of the heatsink (left) and a typical section view from heat sink area
(right).
The encapsulated shell is strong enough to keep the melted PCM inside and does not let the PCM
to mix with the fluid. The area between two hatched red lines in Figure 18 (right) shows the
computational domain. The boundaries of the computational domain are considered to be periodic.
It means that the shape in the computational domain is repeated along with the boundary surfaces
at the same shape, which is in the domain. The dimensions used in this study are consistent with
Page 53
39
the ones used in reference [32]. The periodic computational domain consists of three rectangular
volumes including the central region in which the oblique fins and the heated walls are located,
the inlet block to ensure the entered flow to the central region is developed, and the outlet block.
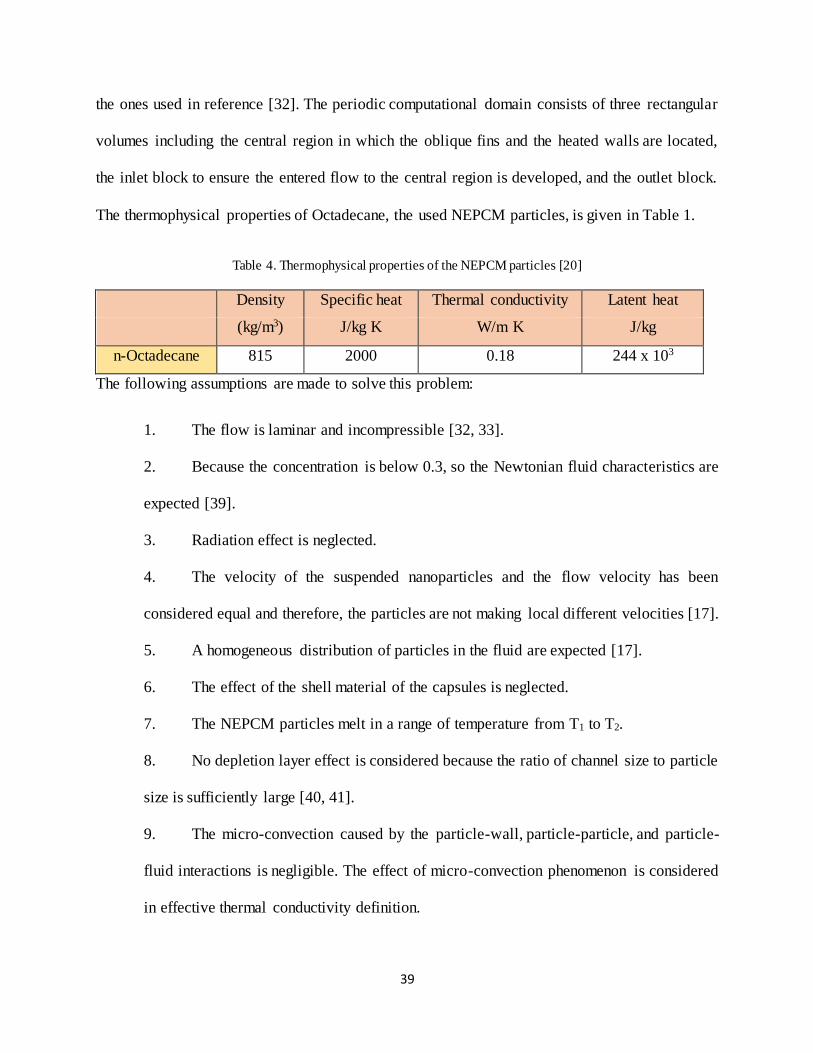
The thermophysical properties of Octadecane, the used NEPCM particles, is given in Table 1.
Table 4. Thermophysical properties of the NEPCM particles [20]
Density Specific heat Thermal conductivity Latent heat
(kg/m3) J/kg K W/m K J/kg
n-Octadecane 815 2000 0.18 244 x 103
The following assumptions are made to solve this problem:
1. The flow is laminar and incompressible [32, 33].
2. Because the concentration is below 0.3, so the Newtonian fluid characteristics are
expected [39].
3. Radiation effect is neglected.
4. The velocity of the suspended nanoparticles and the flow velocity has been
considered equal and therefore, the particles are not making local different velocities [17].
5. A homogeneous distribution of particles in the fluid are expected [17].
6. The effect of the shell material of the capsules is neglected.
7. The NEPCM particles melt in a range of temperature from T1 to T2.
8. No depletion layer effect is considered because the ratio of channel size to particle
size is sufficiently large [40, 41].
9. The micro-convection caused by the particle-wall, particle-particle, and particle-
fluid interactions is negligible. The effect of micro-convection phenomenon is considered
in effective thermal conductivity definition.
Page 54
40
10. Since the modeled Reynolds numbers are low, the Brinkman number that is direct
by proportional to velocity is low and so viscous dissipation is not considered.
The governing equations used to analyze the problem are continuity equation, momentum
equations, and energy equation.
Continuity equation:
𝜕𝑢
𝜕𝑥+
𝜕𝑣
𝜕𝑦+
𝜕𝑤
𝜕𝑧= 0 (13)
Momentum equations:
𝜌𝑒𝑓𝑓 (𝑢𝜕𝑢
𝜕𝑥+ 𝑣
𝜕𝑢
𝜕𝑦+ 𝑤
𝜕𝑢
𝜕𝑧) = −
𝜕𝑝
𝜕𝑥+
𝜕
𝜕𝑥(𝜇𝑒𝑓𝑓
𝜕𝑢
𝜕𝑥) +
𝜕
𝜕𝑦(𝜇𝑒𝑓𝑓
𝜕𝑢
𝜕𝑦) +
𝜕
𝜕𝑧(𝜇𝑒𝑓𝑓
𝜕𝑢
𝜕𝑧) (14)
𝜌𝑒𝑓𝑓 (𝑢𝜕𝑣
𝜕𝑥+ 𝑣
𝜕𝑣
𝜕𝑦+ 𝑤
𝜕𝑣
𝜕𝑧) = −
𝜕𝑝
𝜕𝑦+
𝜕
𝜕𝑥(𝜇𝑒𝑓𝑓
𝜕𝑣
𝜕𝑥) +
𝜕
𝜕𝑦(𝜇𝑒𝑓𝑓
𝜕𝑣
𝜕𝑦) +
𝜕
𝜕𝑧(𝜇𝑒𝑓𝑓
𝜕𝑣
𝜕𝑧) (15)
𝜌𝑒𝑓𝑓 (𝑢𝜕𝑤
𝜕𝑥+ 𝑣
𝜕𝑤
𝜕𝑦+ 𝑤
𝜕𝑤
𝜕𝑧) = −
𝜕𝑝
𝜕𝑧+
𝜕
𝜕𝑥(𝜇𝑒𝑓𝑓
𝜕𝑤
𝜕𝑥) +
𝜕
𝜕𝑦(𝜇𝑒𝑓𝑓
𝜕𝑤
𝜕𝑦) +
𝜕
𝜕𝑧(𝜇𝑒𝑓𝑓
𝜕𝑤
𝜕𝑧) (16)
Energy equation for the liquid region:
𝜌𝑒𝑓𝑓 𝐶𝑝,𝑒𝑓𝑓 (𝑢𝜕𝑇𝑓
𝜕𝑥+ 𝑣
𝜕𝑇𝑓
𝜕𝑦+ 𝑤
𝜕𝑇𝑓
𝜕𝑧)
=𝜕
𝜕𝑥(𝑘𝑒𝑓𝑓
𝜕𝑇𝑓
𝜕𝑥) +
𝜕
𝜕𝑦(𝑘𝑒𝑓𝑓
𝜕𝑇𝑓
𝜕𝑦) +
𝜕
𝜕𝑧(𝑘𝑒𝑓𝑓
𝜕𝑇𝑓
𝜕𝑧) + ∅̇2
(17)
Energy equation for the solid region:
𝜕
𝜕𝑥(𝑘𝑠
𝜕𝑇𝑠
𝜕𝑥) +
𝜕
𝜕𝑦(𝑘𝑠
𝜕𝑇𝑠
𝜕𝑦) +
𝜕
𝜕𝑧(𝑘𝑠
𝜕𝑇𝑠
𝜕𝑧) = 0 (18)
The subscript “eff” denote the effective value of the thermophysical properties. The subscript “s”
in Eq. (6) refers to the solid region. The ∅̇2 term in energy equation is viscous dissipation term and
it represents the viscous energy dissipation rate per unit volume as listed below:
Page 55
41
∅2̇ = ({2 [(𝜇𝑒𝑓𝑓
𝜕𝑢
𝜕𝑥)
2
+ (𝜇𝑒𝑓𝑓
𝜕𝑣
𝜕𝑦)
2
+ (𝜇𝑒𝑓𝑓
𝜕𝑤
𝜕𝑧)
2
] + (𝜇𝑒𝑓𝑓
𝜕𝑢
𝜕𝑦+ 𝜇𝑒𝑓𝑓
𝜕𝑣
𝜕𝑥)
2
+ (𝜇𝑒𝑓𝑓
𝜕𝑣
𝜕𝑧+ 𝜇𝑒𝑓𝑓
𝜕𝑤
𝜕𝑦)
2
+ (𝜇𝑒𝑓𝑓
𝜕𝑤
𝜕𝑥+ 𝜇𝑒𝑓𝑓
𝜕𝑢
𝜕𝑧)
2
})
1/2
(19)
The average heat transfer coefficient is expressed as:
ℎ̅ =𝑞
𝐴𝑡𝑜𝑡∆𝑇𝑙𝑚 (20)
where the log mean temp difference is expressed as:
∆𝑇𝑙𝑚 =𝑇𝑜𝑢𝑡 − 𝑇𝑖𝑛
𝐿𝑛 (𝑇𝑤 − 𝑇𝑖𝑛
𝑇𝑤 − 𝑇𝑜𝑢𝑡) (21)
In average heat transfer coefficient definition, q is the total thermal energy transferred to the
coolant, which is passed through Atot surface area that includes a portion of the bottom surface of
the channel, which is not covered by fins, and the lateral surfaces area of fins.
Reynolds, Nusselt, and Euler numbers are determined from the relations:
𝑅𝑒 =𝜌𝑠 𝑢𝑖𝑛 𝐷ℎ
𝜇𝑠 (22)
𝑁𝑢 =ℎ̅𝐷ℎ
𝐾𝑠 (23)
𝐸𝑢 =2 ∆𝑃
𝜌𝑠 𝑅𝑒2 𝑁 (24)
4. Slurry thermophysical properties:
The thermophysical properties of distilled water as the base fluid are considered as temperature -
dependent, but the properties of NEPCM particles, except heat capacity, are considered to be
Page 56
42
constant. Temperature-dependent equations of distilled water, which are curve-fitted from well-
established data [42] using least square technique, are as follows:
For 278.15𝐾 < 𝑇 < 338𝐾
Density:
𝜌 = −0.002630252 𝑇2 + 1.24115 𝑇 + 861.6624 (25)
Conductivity:
𝑘 = −9.455182 × 10⁻⁶𝑇2 + 0.007289006 𝑇 − 0.7245947 (26)
Heat capacity:
𝐶𝑝 = −8.732238 × 10⁻⁵𝑇3 + 0.09657741𝑇2 − 34.71345 𝑇 + 8255.769 (27)
Viscosity:
𝜇 = 1.548 × 10⁻¹¹ 𝑇4 − 2.186052 × 10⁻⁸𝑇3 + 1.162394 × 10⁻⁵𝑇2
− 0.002763061 𝑇 + 0.2484497
(28)
The thermophysical properties of the slurry are defined as functions of thermophysical properties
of the NEPCM particles and also that of the base fluid.
Density [27]
𝜌𝑒𝑓𝑓 = (1 − 𝜉𝑚)𝜌𝑤𝑎𝑡𝑒𝑟 + 𝜉𝑚𝜌𝑝 (29)
Static thermal conductivity is calculated using Maxwell’s relation [43]:
𝑘𝑏 = 𝑘𝑤𝑎𝑡𝑒𝑟
2 +𝑘𝑝
𝑘𝑤𝑎𝑡𝑒𝑟+ 2𝜉 (
𝑘𝑝
𝑘𝑤𝑎𝑡𝑒𝑟− 1)
2 +𝑘𝑝
𝑘𝑤𝑎𝑡𝑒𝑟− 𝜉 (
𝑘𝑝
𝑘𝑤𝑎𝑡𝑒𝑟− 1)
(30)
Page 57
43
𝑘𝑒𝑓𝑓
𝑘𝑏= 1 + 𝐵 𝜉 𝑃𝑒𝑃
𝑚 (31)
𝐵 = 3, 𝑚 = 1.5, 𝑃𝑒𝑝 < 0.67
𝐵 = 1.8, 𝑚 = 0.18, 0.67 < 𝑃𝑒𝑝 < 250
𝐵 = 3, 𝑚 =1
11, 𝑃𝑒𝑝 > 250
(32)
where subscript w refers to the base fluid, water and p refers to the particles. 𝑃𝑒𝑝 is particle Peclet
number, which is defined as:
𝑃𝑒𝑝 =𝑒 𝑑𝑃
2
𝛼𝑤𝑎𝑡𝑒𝑟 (33)
where 𝛼𝑤𝑎𝑡𝑒𝑟 is thermal diffusivity of water and 𝑑𝑃 is the particles’ average diameter. 𝑒 is the
shear rate which is a function of all of the spatial coordinates and their relevant velocities. The
shear rate magnitude is expressed as [44]:
𝑒 = [1
2∑ ∑ 𝛾𝑖𝑗𝛾𝑗𝑖
𝑗𝑖
]
1/2
(34)
where 𝛾 represents the shear rate. The above correlation for thermal conductivity of NEPCM
slurries shows that the thermal conductivity of the slurry is defined based on two parameters: the
shear rate magnitude and the particle size. Shear rate magnitude can be increased by increasing the
fluid flow velocity or decreasing the conduction dimension. Particle size presents the interaction
between the fluid molecules and particles including drag force, virtual mass, and lift force.
Heat capacity [20]:
𝐶𝑝,𝑒𝑓𝑓 = (1 − 𝜉𝑚)𝐶𝑝,𝑤𝑎𝑡𝑒𝑟 + 𝜉𝑚𝐶𝑝,𝑝 (35)
Viscosity [45, 46]:
Page 58
44
𝜇𝑒𝑓𝑓 = 𝜇𝑤(1 − 𝜉 − 1.16 𝜉2)−2.5 (36)
When NEPCM particles’ temperature reaches T1 - the start point of the melting region - the heat
capacity of that in solid state increases based on the temperature, and after the heat capacity
reached its maximum, then heat capacity reduces to the heat capacity of liquid NEPCM particles
when it reaches T2, at the end of this region. Alisetti and Roy [47] studied the effect of using a
different type of heat capacity profiles between the solidus and liquidus point and proved that it
may vary the specific heat value of the slurry less than 4% and therefore, using any of the proposed
profiles are acceptable. In the present study, the authors used a sine profile to model the specific
heat of NEPCM particles. The used profile in this study is shown in Figure 19 and the sine equation
for the specific heat of slurry is:
𝐶𝑝,𝑝 = 𝐶𝑝,𝑝𝑐𝑚 + {𝜋
2. (
ℎ𝑠𝑓
𝑇𝑀𝑟− 𝐶𝑝,𝑝𝑐𝑚) . sin 𝜋 [
(𝑇 − 𝑇1)
𝑇𝑀𝑟]} (37)
where, TMr = T2 – T1 is the melting temperature range.
Figure 19. The used sine profile to predict the specific heat of NEPCM slurry
5. Boundary Conditions
The inlet, outlet, and periodic boundary conditions are as below:
Page 59
45
Inlet boundary condition:
𝑢 = 𝑈𝑖𝑛 , 𝑣 = 𝑤 = 0 , 𝑇𝑖𝑛 = 296.15 (38)
Outlet boundary condition:
𝜕𝑢
𝜕𝑥=
𝜕𝑣
𝜕𝑥=
𝜕𝑤
𝜕𝑥=
𝜕𝑇𝑓
𝜕𝑥= 0 (39)
Periodic boundary condition:
𝑢, 𝑣, 𝑎𝑛𝑑 𝑤 (𝑎𝑡 𝑦 = 0) = 𝑢, 𝑣, 𝑎𝑛𝑑 𝑤 (𝑎𝑡 𝑦 = 𝑊) (40)
𝜕𝑢
𝜕𝑦(𝑎𝑡 𝑦 = 0) =
𝜕𝑢
𝜕𝑦(𝑎𝑡 𝑦 = 𝑊)
𝜕𝑣
𝜕𝑦(𝑎𝑡 𝑦 = 0) =
𝜕𝑣
𝜕𝑦(𝑎𝑡 𝑦 = 𝑊)
𝜕𝑤
𝜕𝑦(𝑎𝑡 𝑦 = 0) =
𝜕𝑤
𝜕𝑦(𝑎𝑡 𝑦 = 𝑊)
Bottom wall temperature boundary condition:
(41)
𝑇𝑓 = 𝑇𝑠 = 𝑇𝑤𝑎𝑙𝑙 (42)
Walls boundary condition:
Solid-liquid interfaces∶ 𝐾𝑠𝜕𝑇𝑠
𝜕𝑛= 𝐾𝑓
𝜕𝑇𝑓
𝜕𝑛 (43)
Other walls: 𝐾𝑠𝜕𝑇𝑠
𝜕𝑛= 𝐾𝑓
𝜕𝑇𝑓
𝜕𝑛= 0 (44)
6. Numerical Solutions, Grid independency, and Code Validation
The used finite volume code employed for this research was previously validated and used in our
research group and is explained in more detail in peer-reviewed publications referenced at [20]. In
this study, to discretize the three-dimensional governing equations, by utilizing finite volume
method, conservation laws are applied over finite sized control volumes around grid points. Then,
Page 60
46
by integration over the volume, the relevant data are extracted. To discretize the convection and
diffusion terms of energy and momentum equations, QUICK scheme was used. In this study,
SIMPLE algorithm was employed based on an assumed pressure field, through using Navier-
Stokes equations, the velocity distribution in three-dimensional space was calculated. Then,
corrected values of pressure and velocity distribution are obtained from continuity equations. The
convergence is defined based on the absolute errors of temperature, velocity components, and
pressure values and the solution considered to have converged when these values become less than
10-8, 10-7, and 10-5, respectively.
For the inlet and outlet block, which include the coolant liquid and region walls, two structured
grid are used and for the central region that contains the liquid and fins, an unstructured grid of
tetrahedral volume elements was used. To ensure the independency of the results from grid
number, four different grid sizes were examined: 662,105 (coarse), 1,022,911 (intermediate),
2,665,121 (fine) and 3,781,167 (very fine). As shown in Table 2, the difference between the
obtained Nusselt and Euler numbers using fine grid and the very fine grid is less than 1%; thus the
fine grid is selected as a suitable grid size to conduct the simulations. The grid independency study
is done for the case with a bottom wall temperature of 299.15K and velocity inlet of 0.250 m/s
with pure water as the coolant.
Table 5. Grid independency study
Number of grid Euler Number Diff (%) Nu Diff (%)
662,105 2.4436212 - 12.2912984 -
1,022,911 2.1509624 13.61% 10.9241971 12.51%
2,665,121 1.95988523 9.75% 10.0699926 8.48%
3,781,167 1.9771022 0.87% 10.1112568 0.41%
Page 61
47
The results obtained from the developed Finite Volume (FV) code are compared and validated
with the experimental data reported by Lee et al. [32], who did their experiment using an oblique
finned microchannel with the specification shown in Figure 18. They examined the thermal and
fluid flow performance of the copper-based microchannel heat sink with a nominal main channel
width of 0.539 μm and compared the obtained data with conventional microchannels with the same
size and without oblique channels. The total transfer area is 25×25 mm2 on which a configuration
of 39 rows of 20 oblique fins per row was fabricated. Utilized coolant was deionized water with a
fixed inlet temperature of 20°C. The bottom wall temperature is controlled using four cartridge
heaters that their power input was monitored using a DC power supply unit. They used a
polycarbonate cover with a thin silicone rubber layer to seal the top surface properly. The simulated
portion in this study consists of one periodic part of the microchannel heat sink used in the
experimental work of Lee et al. [32]. The fins and liquid around them are defined as solid and fluid
regions, respectively. A constant static pressure equal to atmospheric pressure at the outlet, a
uniform velocity and fixed temperature at the inlet, and constant temperatures similar to the ones
used in the experiment at the bottom wall of the microchannel are defined. The remaining variables
are derived by extrapolating from the interior regions of the periodic computational domain. The
acceptable consistency between the Nusselt number obtained from numerical simulation results
and the ones of experimental data are illustrated and proved in Figure 20. The dashed lines show
±10% deviation values compared to the numerical results. Considering the uncertainty values
reported in the experimental report, the results obtained from the numerical code are in the
acceptable range.
Page 62
48
Figure 20. The obtained results from FV code and the ones of experimental test
Figure 21 shows the comparison of our results with experimental data of Goel et al. [26] and
numerical calculation data reported by Kuravi et al. [17] for a PCM slurry through a pipe. The
good consistency between the presented results in Figure 21 proves the reliability of the used
model.
Figure 21. Comparison of result using current model, numerical model [17] and experimental data [26]
Page 63
49
7. Results and Discussions
7.1. Effect of NEPCM slurry:
We investigated how adding NEPCM particles to the pure water can change the cooling and
hydrodynamics of the water first. Figure 22 shows the variations of Nusselt number and bulk
temperature versus Reynolds number at different bottom wall temperatures and Reynolds number
at different NEPCM volume fractions.
Page 64
50
Figure 22. Nusselt number and bulk temperature variations versus Reynolds Number at different NEPCM volume
fractions and bottom wall temperatures
It can be seen from Figure 22 that when NEPCM particles are added to the base pure water coolant,
the Nusselt number increases but bulk temperature decreases. The reason behind these opposite
Page 65
51
trends is that, when NEPCM particles are added to the working liquid and when temperature of
the particles reaches the liquid temperature, heat capacity of the particles and consequently slurry,
as it is shown in Figure 19, starts increasing. When NEPCM particles are added, two phenomena
occur simultaneously to enhance the heat dissipation rate of the heat sink: (1) increase of heat
capacity of the slurry that makes the coolant capable of absorbing more heat while it undergoes a
lower temperature increase; and (2) since lower bulk-temperature makes a higher temperature
gradient between the bottom hot wall and coolant bulk temperature, it boosts up the heat dissipation
rate of the heat sink. Figure 22 also shows that the NEPCM concentration has a direct relation with
the system Nusselt number. When the velocity of the flow increases, the thickness of the generated
thermal boundary layers decreases and it results in a tendency to increase the heat transfer rate. In
other words, for higher Reynolds numbers because of the thinner boundary layer on the surfaces,
a higher cooling performance of the system is expected. So in terms of cooling performance of the
heat sink, increase in NEPCM particles volume fraction leads to a higher cooling performance and
lower bulk temperature. Regarding average bulk temperature of the coolant, when Reynolds
number or NEPCM particles concentration increases, bulk temperature reduces accordingly.
Page 66
52
Figure 23. Euler number variation versus NEPCM volume fraction at different inlet velocities for bottom wall
temperatures of (a) 299.15, (b) 315.15, and (c) 340.15
Page 67
53
Figure 23 illustrates the variation of the Euler number with the NEPCM particles concentration at
different inlet velocities. As expected, increasing the flow velocity -when the temperature of the
wall is fixed- leads to lower fluid bulk temperature that consequently increases the viscosity of the
slurry. This increase in viscosity yields a higher Euler number. Euler number as the dimensionless
parameter related to the ratio of pressure-drop of the system and squared Reynolds number, as
defined in Eq. (12). Adding NEPCM particles to the base working fluid results in increasing this
ratio because of the higher viscosity of the NEPCM slurries in comparison with the pure water.
When the concentration of NEPCM particles in fluid increases, the fluid becomes more viscous
and this dramatically increases the Euler number. Therefore, it can be realized that when the
volume fraction of NEPCM particles increases, it enhances the cooling performance of the system,
but on the other hand it affects pressure drop and increases the Euler number of the system,
simultaneously.
Page 68
54
Figure 24. The contours of (a): Specific heat, (b): Viscosity, (c): Temperature and (d): Velocity at the surface
passing the middle of the computational domain height
Figure 24 shows the contours of specific heat, viscosity, temperature and velocity at the surface
passing the middle of the computational domain height. Since higher NEPCM volume fraction
causes a higher viscosity as shown in Figure 24(b), a higher pressure-gradient along the channel
is expected. It is depicted in Figs. 24(b) and 24(c) that in regions close to the fin surface higher
temperature results in lower viscosity. The reason is that the hotter molecules are enjoying higher
energy level comparing with cold ones and these high energetic and less sluggish molecules, cause
increase in kinetic energy of each molecule. Therefore, the attractive /repulsive intermolecular
forces become more dominant that lead to a lower viscosity near the pins surfaces. In addition,
Page 69
55
when NEPCM volume fraction increases, stronger disturbance of the flow around the individual
particles results in a higher internal shear stress in comparison with pure liquid. Increasing internal
shear stress cause the fluid to be more viscous and sluggish. Since the NEPCM slurry, exhibits
higher specific heat level between liquidus and solidus temperatures in comparison with the base
fluid, as shown in Figure 24(a), a higher thermal energy is absorbed by them which leads to a
lower temperature rise. Investigating Figure 24(a), one can understand how the temperature rise
of particles affects the specific heat of the slurry. NEPCM slurries are acting more efficiently
compared with pure coolants. First, they have a higher heat capacity level when the temperature
of them is somewhere between T1 and T2. This lets the slurries to absorb more heat with lower
temperature increase. Therefore, the slurries are ready to absorb more heat. Second, the higher heat
capacity of the melting NEPCM resists the temperature increase and slows the temperature
increase rate. This fact slows down the thermal boundary layer growth along the oblique fins
surfaces. Therefore, it exhibits a higher temperature gradient, which boosts up the heat rejection
rate. These two reasons improve the cooling performance of the system and convert the pure fluid
coolant to a coolant of high quality. Observing the results presented in Figure 24 (d) and Figure
24 (c) reveals that the effect of the oblique channels cause the working fluid with a high specific
heat value, flow from a channel to its neighbor channel and meanwhile absorb the heat from the
hot fins. The role of the oblique fins to interrupt hydrodynamic and thermal boundary layers
formation is noteworthy. Velocity and temperature contours show how the higher NEPCM volume
fraction leads to a thinner boundary layer compared to pure liquid and results in a higher heat
dissipation rate. Using NEPCM slurry in a channel with oblique fins that are interrupting the
boundary layer formation results in existence of longer and thinner boundary layers in comparison
Page 70
56
with conventional microchannels with pure coolants; this phenomenon enhances the cooling
performance of the heat sink substantially.
7.2. Effect of Tip clearance
As it was explained before, beside the desirable effect of the presence of NEPCM particles in
coolant on cooling performance of the system, a non-desirable higher pressure-drop is inevitable.
Wang et al. [26] also reported a lower ratio of heat transfer to pumping power with higher Reynolds
number in NEPCM slurries. The reason for this higher pressure drop is mainly the interactions
between NEPCM particles and fluid flow. In this work, the thermal and hydrodynamics effects of
tip clearance introduction over the fins on heat sink behavior under the condition of the fixed flow
velocity (V=0.25 m/s), is investigated. The simulated conditions have a bottom surface
temperature of 315.15K. NEPCM volume fraction is zero (pure water) or 0.3 and the tip clearance
to channel width ratio ranges from 0.108 to 0.370.
Figure 25. Variations of Nusselt and Euler numbers versus tip clearance to channel width ratio at different NEPCM
volume fractions.
As depicted in Figs. 8 and 9, for the heat sink with NEPCM slurry coolant, when tip clearance to
channel width ratio(𝑡/𝑊𝑐)increases, the Nusselt and Euler numbers increase first and then
Page 71
57
decrease after they reach to their maximum values. It can be concluded from the illustrated results
that heat sinks with NEPCM slurry coolant and with (𝑡/𝑊𝑐) ratios of 0.00 to 0.375, have a higher
Nusselt number than the base zero-tip clearance condition. The maximum Nusselt number for heat
sinks with NEPCM slurry coolant is achieved when 𝑡/𝑊𝑐 ratio is about 0.15. On the other hand,
Euler number of the heat sinks with NEPCM slurry coolant and with tip clearance, is above the
base zero tip clearance condition when 𝑡/𝑊𝑐 is between 0.00 to 0.20. Therefore, if we consider
the zero tip clearance heat sink as the base point, when 0.20 < 𝑡/𝑊𝑐 < 0.375, the heat sink with
NEPCM slurry coolant has a higher Nusselt number and lower Euler number in comparison with
the base point. It is worth mentioning that the increase of the Nusselt number by increasing 𝑡/𝑊𝑐
ratio, in the heat sink with NEPCM slurry is stronger compared with heat sink with pure water. In
Figure 9, by defining the two parameters of 𝑁𝑢/𝑁𝑢0 and 𝐸𝑢0 /𝐸𝑢, a comparison between thermal
and hydrodynamic performance of the heat sink with tip clearance is compared to the heat sink
with zero tip clearance. Both of these parameters are desired to be more than 1.00, so it means the
higher Nusselt number and lower Euler number in comparison with the base point. As it was
illustrated in Figure 26, the desired criteria for 𝑡/𝑊𝑐 -where both 𝑁𝑢/𝑁𝑢0 and 𝐸𝑢0 /𝐸𝑢 parameters
value are above 1.00- when using NEPCM slurry coolant is 0.20 < 𝑡/𝑊𝑐 < 0.375 and when using
pure water coolant is 0.16 < 𝑡/𝑊𝑐 < 0.26.
Page 72
58
Figure 26. Ratios of Nusselt and Euler numbers of the heat sink with tip clearance to the heat sink without tip
clearance: (a) with NEPCM slurry coolant, and (b) pure water coolant
The results in this study are in agreement with the results presented by Sparrow et al. [27]. Our
data shows that the suitable size of tip clearance leads to an enhanced cooling performance due to
two reasons: 1- Existence of the gap over the fins increases the total heat transfer area between hot
fins surfaces and the cold coolant. 2- If the tip clearance size, based on the results presented in
Figure 26, is adjusted appropriately, the top surface of the fins rejects more average heat flux in
comparison with lateral surfaces and therefore, a substantially higher total Nusselt number would
be achieved. The higher heat rejection rate from the top surface area of the fins is basically caused
by induced three-dimensional effects via flow structures generated by the bypass flow and vortex
generation at the tips as compared to the reference quasi 1D channel flow without tip clearance.
These three-dimensional effects would be vanished when 𝑡/𝑊𝑐 ratio increases. Readers are
referred to [37] reported by Rozati et al. for further exploration of the effect of the tip clearance
introduction on three dimensional flow generation over the fins. The trend of the results are in
agreement with the results reported by Min et al. [36] for a conventional heat sink.
Page 73
59
The contours depicted in Figure 27 show how the velocity and temperature distributions in the
microchannel are affected by introducing tip clearance to the heat sink or employing NEPCM
slurry coolant. These contours are taken from the vertical surface passing through the midpoint of
the bottom surface.
Figure 27. Variation of (right side): temperature and (left side): velocity distribution in the microchannel by
introducing tip-clearance to the heat sink or employing NEPCM slurry coolant.
It can be observed in Figure 27, that increasing the NEPCM volume fraction decreases the fins’
temperature, which is due to thinner and longer boundary layer and higher temperature gradient in
thermal boundary layers on lateral and top surfaces.
8. Summary and Conclusion of this Chapter
In this study, the thermal and hydrodynamic performance of a microchannel with oblique fins are
enhanced by using NEPCM slurry coolant and introducing tip clearance over the fins. NEPCM
slurry coolant could enhance the cooling performance of the heat sink substantially. The lower
Page 74
60
average bulk temperature and higher average specific heat of the coolant were observed when
NEPCM slurry coolant is used. The disadvantage of utilizing NEPCM slurry as the coolant is
higher Euler number, which needs a higher pumping power. This issue was addressed through
introducing tip clearance to the microchannel. It was shown that, there is a range of 𝑡/𝑊𝑐 ratio in
which the higher Nusselt number with a lower Euler number is expected. This desired range is
0.20 < 𝑡/𝑊𝑐 < 0.375 when the microchannel is working with NEPCM slurry and 0.16 < 𝑡/𝑊𝑐 <
0.26 when pure water employed as the coolant.
Page 75
61
Chapter 4. Using PCM Slurry and Nanofluid Coolants in a Double
Layered Microchannel Heatsink
1. Introduction
Advanced coolants such as nanofluids or PCM slurries are realized and reported as effective
substitutions for conventional coolants in order to enhance the cooling performance of
microchannel heatsinks. However, there are a number of disadvantages associated with using these
advanced coolants that are always considered as their inevitable downsides including the increase
of the needed pumping power of the system for both of the mentioned coolants and decrease of
the fluid average thermal conductivity for PCM slurries. In this study, a 3D conjugated heat
transfer model of a double layer microchannel heatsink (MCHS) to investigate its thermal
performance is presented and the effectiveness of simultaneous employing of both of these types
of advanced coolants in a heatsink is assessed. Finite volume method (FVM) is used to solve the
flow and heat governing equations simultaneously and the obtained results are validated with the
experimental data. The assessed parameters in this study are: coolant type, coolant configurations,
particle concentration, bottom surface temperature, and inlet fluid velocity. In order to investigate
the flow and cooling efficiency of the heatsink, two dimensionless parameters, Nusselt and Euler
numbers, are computed and compared to the considered configurations. The goal is to balance and
optimize the desirable cooling enhancement that is obtained by using advanced coolants and is
represented by associated Nusselt number from one side, and an undesirable increase of the needed
pumping power which is implied by relevant Euler number, from the other side. Results showed
that using the proposed configurations, the cooling performance of the systems are enhanced and
the disadvantages associated with advanced coolant are relieved, substantially.
Page 76
62
2. Literature Review
Microchannel heatsinks (MCHS), which are firstly proposed by Tuckerman and Pease [48],
include in a big category of the cooling enhancers used for microsystems with high heat generation
rates. Common MCHSs include in one layer of separated channels in which cold fluid travels
through and takes away the heat that is generated by the heat source right underneath the MCHS.
The generated heat is continuously transmitted to the cold liquid through the bottom surface of the
heatsink and the surface of the solid ribs. In a fixed applied heat flux condition on the bottom
surface, the temperature rise of the fluid and accordingly bottom surface along the MCHS length
is inevitable and a rising temperature gradient with respect to the channel length would be formed.
In Micro electric devices, this temperature gradient may cause an undesirable thermal tension in
the equipment due to the thermal expansion variation, which in some cases may result in instability
and thermal breakdown of the device [49]. To address this issue, another layer of channels on top
of the first layer, in which the coolant flows in the opposite direction of the first layer (counterflow
MCHSs), was added [50]. Later investigations revealed that counterflow MCHSs provides an
enhanced cooling performance, temperature uniformity, and lower pressure drop rather than the
conventional MCHSs [51-60].
Furthermore, using advanced coolants such as Nanofluids and phase change material (PCM)
slurries may improve the thermophysical properties of the coolants. Nanofluids, which are
produced by dispersions of suspended nano-scale particles in the base fluid [61], based on the
employed nanoparticles can exhibit enhanced thermophysical characteristics rather than the ones
of the base fluid. Since, the metal-based nanoparticles are usually more conductive than
conventional base liquids, nanofluids including these nanoparticles exhibit a higher thermal
conductivity than the base liquids and can be used as an enhancer for heat transfer purposes [62-
Page 77
63
68]. PCM slurries, which are produced by adding micro/nano-encapsulated PCM to the base fluid,
exhibits a higher heat capacity when the particles undergo a phase change transition and are
advantageous if the cooling system parameters are well designed to exploit the particle’s latent
heat properly [14, 17, 19, 26, 69, 70]. The downside of using nanofluids and PCM slurries is the
higher viscosity of them comparing with the base fluid which results in an increase of the needed
pumping power. Therefore, there is always a tradeoff between the flow and cooling performance
of the cooling systems utilizing advanced coolants.
In this study, the cooling and flow performance of a double layered counterflow MCHS with
rectangular cross section channels are numerically investigated. The examined parameters are:
coolant type (DI water, nanofluid, and NEPCM slurry), coolant configurations (employed coolant
in the upper and lower layer), particle concentration (Alumina nanoparticles: 1%, 2%, and 4% and
n-Octadecane NEPCM particles: 0.1, 0.2, and 0.3 in DI water), bottom surface temperature
(301.15, 306.15, 311.15, 330.15˚K), and inlet fluid velocity (0.435, 06078 m/s). Type of the
employed coolant in each layer is chosen independently between seven different coolants
including DI water, nanofluids and PCM slurries with three different particle concentrations, so
that a combination of various possible coolant configurations would be studied. In order to be able
to check the code reliability, the dimensions of the studied microchannel are chosen identical with
the ones used by Wei et al. [71]. Dimensionless Nusselt and Euler Numbers are defined to
determine the most effective configuration(s). Furthermore, the effects of the inlet velocity and
bottom temperature on the system performance are also evaluated.
3. Problem Definition and Mathematical Modeling
The schematic of the problem, the computational domain and the used dimensions for the Double
layered MCHS are shown in Figure 28.
Page 78
64
Figure 28. The schematic of the counterflow double layer heatsink modeled in this study. (Given dimensions are in
mm)
The heat generation source is considered by applying a uniformly fixed temperature on the bottom
surface of the model. The cover plate is insulated completely and no heat transition occurs through
this surface. The inlet temperature of the fluid for all of the studied configurations is the same
(296.15˚K) and this temperature is intentionally chosen below the melting region of the PCM
particles to make sure the entered PCM particles are all in the solid state. Computational domain
boundaries are considered symmetric and no edge effect is taken into calculation. The length of
the channels is 100 mm and two dedicated 50 and 70 mm inlet and outlet blocks are considered to
ensure the fully developed flow along the channels, respectively. The velocities are chosen in the
laminar region [71] and since the particle concentration is below 0.3, the fluid is considered to be
Newtonian [39]. It is assumed that the particles are distributed homogeneously all over the fluid
and moving at the same speed with the adjacent fluid and do not make local different velocity [17].
Since, the channel size to average particles sizes ratio is quite large, the depletion layer effect is
negligible [40, 41]. Since the study is performed in low Reynolds number conditions, Brinkman
number is very small and viscous dissipation are negligible. The NEPCM particles are assumed to
Page 79
65
have a spherical shape with an average diameter of 100 nm. The shell surrounded the PCM
particles is very thin relative to internal hollow space occupied by PCM and its contribution to the
heat transfer between fluid and PCM is negligible. The shell is strong enough to keep the melted
PCM inside and does not let that disperse in the base fluid. The used NEPCM particles, n-
Octadecane, have a melting temperature range from T1=296.15˚K to T2=306.15˚K and
thermophysical properties of the particles are shown in Table 1. Since the employed Al2O3
nanoparticles have an average diameter of 47 nm, which is less than 100 nm, using a single-phase
approach is reliable. Assumptions such as incompressibility and uniformity considered for both
nanofluids and NEPCM slurries. Thermophysical properties of DI water are considered as
temperature functions that are curve-fitted from well-established data [42] using the least square
technique.
Table 6. Thermophysical properties of the NEPCM particles
Density
(kg/m3)
Specific heat
(J/kg K)
Thermal conductivity
(W/m K)
Latent heat
(J/kg)
n-Octadecane 815 2000 0.18 244 x 103
Continuity equation, momentum equations, and energy equation are used as the governing
equations of the problem.
Continuity equation:
∂u
∂x+
∂v
∂y+
∂w
∂z= 0 (45)
Momentum equations:
Page 80
66
ρeff (u∂u
∂x+ v
∂u
∂y+ w
∂u
∂z) = −
∂p
∂x+
∂
∂x(μeff
∂u
∂x) +
∂
∂y(μeff
∂u
∂y) +
∂
∂z(μeff
∂u
∂z) (46)
ρeff (u∂v
∂x+ v
∂v
∂y+ w
∂v
∂z) = −
∂p
∂y+
∂
∂x(μeff
∂v
∂x) +
∂
∂y(μeff
∂v
∂y) +
∂
∂z(μeff
∂v
∂z) (47)
ρeff (u∂w
∂x+ v
∂w
∂y+ w
∂w
∂z) = −
∂p
∂z+
∂
∂x(μeff
∂w
∂x) +
∂
∂y(μeff
∂w
∂y) +
∂
∂z(μeff
∂w
∂z) (48)
Energy equation for the liquid region:
ρeffCp,eff (u∂Tf
∂x+ v
∂Tf
∂y+ w
∂Tf
∂z) =
∂
∂x(keff
∂Tf
∂x) +
∂
∂y(keff
∂Tf
∂y) +
∂
∂z(keff
∂Tf
∂z) + φ̇2 (49)
Energy equation for the solid region:
∂
∂x(ks
∂Ts
∂x) +
∂
∂y(ks
∂Ts
∂y) +
∂
∂z(ks
∂Ts
∂z) = 0 (50)
where, u, v, and w are x, y, and z components of fluid velocity, respectively. The subscripts ”eff”
and “s” denote the effective thermophysical properties and the ones of solid region, respectively.
Effective thermophysical properties of each of the coolants are defined using the single phase
correlations. φ̇2 term in energy equation is called viscous dissipation and represents the viscous
energy dissipation rate per unit volume and is equal to:
φ̇ = ({2 [(μeff
∂u
∂x)
2
+ (μeff
∂v
∂y)
2
+ (μeff
∂w
∂z)
2
] + (μeff
∂u
∂y+ μeff
∂v
∂x)
2
+ (μeff
∂v
∂z+ μeff
∂w
∂y)
2
+ (μeff
∂w
∂x+ μeff
∂u
∂z)
2
})
1/2
(51)
Thermophysical properties of the nanofluid and PCM slurries are defined based on the ones of the
base fluid (DI water) and the ones of nano-encapsulated n-Octadecane PCM or nano Alumina
particles. The properties of the DI water and heat capacity of the PCM particles are defined as
temperature-dependent functions.
Page 81
67
4. Thermophysical properties of NEPCM slurry:
When the temperature of NEPCM particles reaches T1, which is called solidus temperature, the
melting process starts and the process ends when its temperature reaches T2, which is called
liquidus temperature. In temperatures below the solidus temperature, the NEPCM expects to be in
the solid state and above the liquidus temperature, the liquid state is expected. During the melting
region, which starts from T1 and ends at T2, the NEPCM particles absorb the latent energy in order
to carry out the phase transition process. Different Mathematical models which are proposed to
estimate the heat capacity of the slurry in phase transition region does not vary its specific heat
value above 4%. In this study, the more common sine equation, which its profile is shown in Figure
29, is used for temperatures between T1 and T2: [47]
Cp,p−pcm = Cp,pcm + {π
2. (
hsf
TMr− Cp,pcm) . sin π [
(T − T1)
TMr]} (52)
where, TMr = T2 – T1 represents the melting temperature range. Specific heat of the NEPCM
particles in temperatures below T1 and in temperatures above T2 are equal to Cp,pcm.
Figure 29. The used sine profile to predict the specific heat of NEPCM slurry in the melting region.
Thermophysical properties of PCM slurry are derived using the below correlations:
Page 82
68
Heat capacity [69]:
Cp,eff−pcm = (1 − ξm)Cp,water + ξmCp,p (53)
Viscosity [45, 46] :
μeff−pcm = μwater(1 − ξ − 1.16 ξ2)−2.5 (54)
Density [27]:
ρeff−pcm = (1 − ξm)ρwater + ξmρp (55)
Maxwell’s relation is used to derive static thermal conductivity of the PCM slurry [43] :
kb = kwater
2 +kp
kwater+ 2ξ (
kp
kwater− 1)
2 +kp
kwater− ξ (
kp
kwater− 1)
(56)
keff−pcm = kb(1 + B ξ PePm)
B = 3, m = 1.5, Pep < 0.67
B = 1.8, m = 0.18, 0.67 < Pep < 250
B = 3, m =1
11, Pep > 250
(57)
where Pep, particle Peclet number, is defined as:
Pep =e dP
2
αwater (58)
where “dP” is the average diameter of the PCM particles and “e”, shear rate, depends on all of the
spatial coordinates and their velocities and is expressed as [44]:
e = [1
2∑ ∑ γijγji
ji
]
1/2
(59)
Page 83
69
where, γ is the shear rate. More explanation about the utilized equations is given in the given
references.
5. Thermophysical properties of Nanofluid:
Khanafer and Vafai [72], based on the experimental data reported by various researchers, proposed
reliable and precise empirical correlations to model different thermophysical properties of
nanofluids. The correlations used in this study come in below rows:
Heat capacity:
Cp,eff−nano =1
ρeff−nano((1 − φ)ρwaterCp,water + φ ρpCp,p) (60)
Viscosity:
μeff−nano = −0.4491 +28.837
T+ 0.574 φ − 0.1634 φ2 + 23.053
φ2
T2 + 0.0132 φ3
− 2354.735 φ
T3 + 23.498 φ2
dp2 − 3.0185
φ3
dp2
1% ≤ φ ≤ 9% , 20 ≤ T ≤ 70, 13nm ≤ dp ≤ 131nm
(61)
Density:
ρeff−nano = (1 − φ)ρwater + φρp (62)
Thermal conductivity:
keff−nano = kwater (0.9843 + 0.398 φp0.7383 (
1
dp)
0.2246
(μeff−nano
μwater)
0.0235
− 3.9517φ
T+ 34.034
φ2
T3 + 32.509 φ
T2)
0 ≤ φ ≤ 10% , 20℃ ≤ T ≤ 70℃, 11nm ≤ dp ≤ 150nm
(63)
Page 84
70
6. Numerical Solutions and Boundary Conditions
Developing a finite volume code, mass, momentum and energy conservation equations are
discretized and applied all over the finite sized control volumes around grids points [73]. To
discretize convective and diffusive terms of governing equations, QUICK and second order
centered schemes are employed [24]. Then, through integrating the governing equations over each
finite size control-volume and implementing the multidimensional linear reconstruction
approximation approach, the discretized equations are derived [74]. A point implicit linear
equation solver (Gauss-Seidel) and an Algebraic MultiGrid (AMG) method are used to solve
dependent variables in each cell and in order to avoid velocity-pressure decoupling problems, The
SIMPLE algorithm was employed [73]. Structured grids are utilized for upper and lower
inlet/outlet blocks including the liquid and region walls, and unstructured grids of tetrahedral
volume elements are used for the central region containing liquid and channel walls. In areas close
to the channel walls where the liquid-solid interface occurs and conjugate boundary condition is
defined, and similarly, in exit and entrance regions where flow developing occurs, grid sizes are
refined suitably in order to resolve the flow and temperature equations more accurately. To decide
if the convergence is obtained, the residuals of each component of the velocity vector, temperature,
and pressure are defined to be equal or less than 10-7, 10-11, and 10-5, respectively. The residuals
of each component of velocity vector, temperature, and pressure are derived using below
equations:
∑ ∑ ∑|V(i, j, k) − V0(i, j, k)| ≤ 10−7
Nz
k=0
Ny
j=0
Nx
i=0
(64)
Page 85
71
∑ ∑ ∑|T(i, j, k) − T0(i, j, k)| ≤ 10−11
Nz
k=0
Ny
j=0
Nx
i=0
∑ ∑ ∑|P(i, j, k) − P0(i, j, k)| ≤ 10−5
Nz
k=0
Ny
j=0
Nx
i=0
where Nx, Ny, and Nz are the number of the grids generated in x, y, and z directions, respectively.
The residuals of the parameters such as velocity, temperature, and pressure are derived by
subtracting the obtained grid values from the ones obtained in the previous iteration.
List of boundary conditions, which are used for the problem are as below:
Inlet boundary condition:
wupper = Uin , wlower = −Uin , u = v = 0 , Tin = 296.15 (65)
Outlet boundary condition:
∂u
∂z=
∂v
∂z=
∂w
∂z=
∂Tf
∂z= 0 (66)
Symmetry boundary condition - channel:
u =∂v
∂z=
∂w
∂z= 0 ,
∂Tf
∂x= 0 (at x = 0) (67)
Symmetry boundary condition - Solid:
u = v = w = 0 , ∂Ts
∂x= 0 (at x = 0) (68)
Bottom wall temperature boundary condition:
Tf = Ts = Twall (69)
Walls boundary condition:
Page 86
72
Solid-liquid interfaces∶ Ks∂Ts
∂n= Kf
∂Tf
∂n (70)
Other walls: Ks∂Ts
∂n= Kf
∂Tf
∂n= 0 (71)
7. Grid independency and Code Validation:
To ensure the independency of the obtained code results and the grid numbers, through generating
four hexagonal grids with total sizes of 634,128 (coarse), 982,326 (medium), 1,636,695 (fine), and
2,102,586 (very fine), grid sensitivity of the problem was examined. Based on the results shown
in Table 2, the solution became independent from the grid number in “fine” grid size and the
maximum deviation of the Nusselt and Euler numbers among “fine” and “very fine” doesn’t
exceed 1%. Therefore, according to aforementioned parameters for the grid independency test, the
“fine” grid number, which is associated with 1,636,695 cells, is judged to be appropriate and
increasing grid numbers beyond that does not improve the results’ accuracy considerably.
Table 7. Results of investigation of the solution sensitivity to grid sizes.
To ensure the code accuracy and solution reliability, the obtained results are compared with
experimental data [71]. Figure 30 illustrates an excellent agreement between the experimental and
numerical data for the wall temperature distribution along the flow direction when uniform heating
of 70 W/cm2 is applied to the bottom surface of the heatsink and proves the code results’ validity
and reliability for this problem. The maximum deviation (below 1%) occurs in the areas close to
Nusselt Number Euler Number
Coarse Medium Fine Very fine Coarse Medium Fine Very fine
DI water 7.11232 8.01941 8.42301 8.50016 21.23265 23.21236 24.18226 24.26325
- 11.31% 4.79% 0.91% - 8.53% 4.01% 0.33%
PCM slurry 8.51265 9.55326 10.12808 10.22803 29.53264 33.33105 34.80701 34.95023
- 10.89% 5.68% 0.98% - 11.40% 4.24% 0.41%
Nanofluid 7.16123 8.12456 8.51694 8.53331 34.12156 37.53684 39.72105 39.91256
- 11.86% 4.61% 0.19% - 9.10% 5.50% 0.48%
Page 87
73
the endpoint of the channels and can be rationalized based on the uncertainties of the experimental
study and channel end effects.
Figure 30. The results obtained using numerical finite volume code and experimental data.
The used correlations for nanofluid thermophysical properties (equations 15-18) are compared
with several available experimental data and are explained in [72] and the ones for PCM slurries
(equations 8-14) are suggested based on experimental data in the mentioned references.
Furthermore, in order to ensure the PCM slurry correlations, the second validation test is
performed between the numerical results obtained from employed numerical code and the
experimental data of Goel et al. [26] and numerical simulations results presented by Kuravi et al.
[17] for the flow of PCM slurry in a tube. The results are illustrated in Figure 31 and show that the
employed correlations in code predict the thermophysical properties of PCM slurry in an
acceptable precision.
Page 88
74
Figure 31. Comparison of the results obtained using current code, results reported from the numerical model [17]
and experimental data [26].
8. Results and Discussions
The parameters studied in this study include the coolant type and configuration (DI water,
nanofluid, or PCM slurry), concentration of the nanoparticle (NEPCM or nano Alumina), inlet
velocity, and bottom wall temperature. Two dimensionless parameters, Nusselt number, and Euler
number was defined to evaluate thermal and flow performance of the system, respectively. The
ratio of Nusselt number to Euler number is considered as the system efficiency. To define the
dimensionless parameters, average heat transfer coefficient, pumping power, and hydraulic
diameter are defined as below:
h̅ =q
Abottom (Twall − (Tbulk−upper + Tbulk−lower
2 ))
(72)
PP = Uinlet Ac (∆Pupper + ∆Plower) (73)
Dh =2 W H
W + H (74)
Page 89
75
In average heat transfer coefficient definition (equation 26), q is the total thermal energy
transferred to the heatsink and for the other parameters, subscripts “lower” and “upper” denotes
lower and upper layers, respectively. Nusselt and Euler's numbers are defined as:
Nu =h̅Dh
kwater (75)
Eu =PP
Uinlet3 Ac(ρ̅upper + ρ̅lower)
(76)
In diagrams shown in Figure 32, the effect of variation of nano Alumina/NEPCM particles’ volume
fraction, in configurations with the same coolant in both layers and in configurations with different
coolants in the upper and lower layers, are studied. As seen in left diagram, when bottom wall
temperature increases, the cooling performance of the heatsinks with NEPCM slurry, increases
and then decreases. However, in the ones using nanofluid coolants, it decreases almost linearly.
This behavior of heatsinks with NEPCM slurry can be explained considering that the average heat
capacity of NEPCM coolants is dependent on their temperature and when temperature increases
from the start point of the melting region, it travels the curve shown in Figure 29 and its heat
capacity increases and then decreases. In this problem, temperature of the fluid when it enters the
heatsink is equal to T1 and traveling the heatsink length, its temperature and heat capacity, both
gradually increases until particles’ temperature reaches TMr
2 and afterward heat capacity decreases
with temperature rise. Therefore, in contrast with heatsinks with water or nanofluid coolants,
which their cooling performance by temperature rise decreases almost linearly, heatsinks with
NEPCM slurry coolant, when working temperature is in melting region of the PCM, act differently
and based on their temperature, the performance may increase or decrease. When the cooling
performance of the heatsink with NEPCM slurry hits its maximum value, the performance gradient
with respect the temperature is greater than the ones of heatsinks with water or nanofluid coolant.
Page 90
76
The highest improved cooling performance of heatsink is obtained when NEPCM slurry and
nanofluid coolants are used in lower and upper layers, respectively.
Figure 32. Nusselt number variation vs. wall temperature using different nanoparticle concentration for the
configurations with: Left: same type of coolant for both layers. Right: different type of coolants in upper/lower
layers. (U: upper layer, L: lower layer)
In diagrams shown in Figure 33, the effect of fluid inlet-velocity variation on the cooling
performance of the heatsink, in configurations with the same coolant in both layers, are studied. It
is illustrated that the cooling performance of the heatsink enhances with the coolant velocity
increase, substantially.
Page 91
77
Figure 33. Nusselt number variation vs. wall temperature for two fluid inlet velocity for the configurations with Left:
NEPCM slurry and Right: nanofluid.
In contrast with the Nusselt number that greater numbers of it are more desirable in terms of the
cooling performance of the system, smaller Euler numbers represent more improved flow
performance of the heatsink. Figure 34 illustrates the effect of the particles’ volume fractions of
the coolant on associated Euler number to the system. It shows that Euler number gradient with
respect to NEPCM volume concentration is significantly greater than the one with respect to
nanofluid volume fraction. Therefore, although in terms of cooling performance, NEPCM slurry
exhibits a better performance in comparison with nanofluid coolant, in terms of flow performance,
increasing NEPCM concentration causes worse effect than increasing nanofluid’s particle volume
fraction. In the other word, NEPCM slurry is more desirable than nanofluid in cooling performance
point of view; however, nanofluid is preferred in terms of flow performance. Therefore, to obtain
the optimized total efficiency of the heatsink, a combination of these two types of coolants may
provide the best result.
Page 92
78
Figure 34. Euler number variation vs. NEPCM and nano alumina particles’ volume fraction
Local heat flux absorbed through bottom surface of the heatsink in three coolant configurations
are compared with each other in Figure 35. It shows that when PCM slurry/nanofluid are used in
lower/upper layers, respectively, the absorbed heat flux is the greatest. In addition, in terms of
local heat flux uniformity, when water is used as the coolant in both layers, the variance of the
local heat flux with respect to the average heat flux is more than the ones with a combination of
nanofluid and NEPCM slurry coolants. The lowest variance is achieved when PCM
slurry/nanofluid are used in lower/upper layers, respectively.
Page 93
79
Figure 35. Local heat flux absorbed by the heatsink along the z direction. Twall= 306.15K, Uin= 0.6078 m/s, ξ = 2%,
φ=0.2 (U: upper layer, L: lower layer)
To investigate the performance of different configurations in more details, temperature distribution
in solid and fluid in normal (Y) direction in four points along the heatsink length (A, B, C, and D)
are illustrated in Figure 36. Lines A, B, C, and D correspond to z=0, L/3, 2L/3, and L, where L is
the length of the heatsink. These lines are indicated in the schematic of the heatsink in Figure 36
and as it is depicted, lines A and D signify the inlet of lower layer/outlet of upper layer and inlet
of lower layer/outlet of upper layer, respectively. Lines B and C show the temperature distribution
in one and two third of the length of the heatsink from sidewalls. Cases with nanofluid coolants
exhibit a quite similar temperature contour to the ones of the base fluid. In areas near to the ends
of the channels, it is observed that hot fluid in upper channel has a higher temperature than the
adjacent solid material which is cooled down by the cold coolant of the other channel and an
inverse heat transfer from hot fluid to the cold surrounding substrate is expected. This type of
interaction of fluid temperatures only observed in cases of having nanofluid and PCM slurry in
lower and upper channels, respectively. It is worth noting that when NEPCM slurry is used as the
Page 94
80
coolant, a reduced bulk temperature of the fluid is observed in diagrams and it leads to almost no
fluid to solid heat transfer.
Figure 36. Temperature along Y direction in A, B, C, and D points at symmetric surface. Twall = 306.15K, Uin=
0.6078 m/s, ξ=2%, φ=0.2 (U: upper channel, L: lower channel)
As it is seen in Figures 36 and 37, using NEPCM slurry in lower channel decreases the bulk
temperature of the fluid and boosts up the heat transfer rate, significantly. The role of the NEPCM
particles on slowing the temperature boundary layer growth and also increasing the thermal entry
length as indicated in figures 36 and 37, leads to the establishment of a higher temperature gradient
in thermal boundary layer area and accordingly an enhanced heat transfer rate in comparison with
the base fluid. In addition, increase of the effective heat capacity of the NEPCM slurry coolant
makes it capable of absorbing more thermal energy rather than the base coolant while undergoing
less bulk temperature rise, leading to a higher temperature gradient with hot bottom wall and an
enhanced heat transfer rate. However, nanofluid coolants are improving the cooling performance
Page 95
81
mainly due to their higher conductivity than the base fluid. Therefore, when the PCM slurry is
employed in lower layer it enhances the heatsink ability to absorb heat and when nanofluid is used
in upper layer, it facilitates the heat transfer phenomenon through coolant. Heat capacity of
nanofluid is slightly lower than base fluid and therefore, a slightly increase in temperature in
comparison with base fluid temperature is expected and it is in agreement with the results shown
in Figure 37. This drawback reduces the cooling performance enhancement level of the heatsinks
with nanofluid coolant.
Figure 37. Temperature distribution at symmetric surface. Twall = 306.15K, Uin= 0.6078 m/s, ξ = 2%, φ = 0.2 (U:
upper channel, L: lower channel)
In Figure 38, the cooling performance and total efficiency level of 32 different coolant
configurations are shown in the diagram. The total efficiency of the heatsink (Nu/Eu) reflects both
cooling and flow performance. Based on the definition of Nusselt number and total efficiency, the
higher these parameters are, the more enhanced performance is achieved. In figure 37, each point
represents a specific configuration of coolants in layers and bottom wall temperature. the
Page 96
82
configurations with NEPCM slurry/nanofluid in upper/lower layers, respectively and the ones with
bottom wall temperature of 330.15K, exhibit low cooling performance or/and total efficiency
levels and are located in the lower half of the diagram. Among the configurations with PCM
/nanofluid in lower/upper layers, respectively, the highest cooling performance is achieved in point
30, which has a wall temperature of 306˚K and 0.04/0.3 particle concentrations. While point 14
which is the similar configuration with a lower NEPCM concentration of 0.2 is realized to be the
most efficient one in terms of cooling and flow performance. In agreement with the results in
Figure 34, values derived for points 14 and 30 illustrates how increasing NEPCM concentration
from 0.2 to 0.3 acts undesirably in terms of total efficiency.
Figure 38. Cooling performance and total efficiency of the heatsinks with different wall temperature, nanoparticles’
volume fraction, and coolant configuration. (UVF% and VLF% denote nanoparticles’ volume fraction of coolant in
upper and lower layers, respectively)
One may realize that based on the design parameters of the system with NEPCM slurries such as
fluid velocity, average bulk temperature, and NEPCM properties, the outcome varies from the best
to worst situation. However, nanofluid behavior is almost linear and more predictable.
Page 97
83
9. Summary and Conclusion of this Chapter
NEPCM slurries may boost up the cooling performance of the system by slowing the thermal
boundary layer development while nanofluids improve it through enhancing the average thermal
conductivity of the coolant. Unfortunately, both of these types of coolants increase the needed
pumping power of the system because of their higher viscosity and PCM slurries exhibit a lower
average thermal conductivity rather than the base fluid. Results showed that simultaneous
employing of both of these types of advanced coolants in a heatsink, the cooling performance of
the system is enhanced and the disadvantages associated with these advanced coolant are relieved,
substantially. The desirable cooling enhancement that is obtained by using advanced coolants and
is represented by associated Nusselt number and an undesirable increase of the needed pumping
power which is implied by relevant Euler number are balanced and optimum configuration is
realized. Based on the obtained results, bottom wall temperature of 306.15˚K leads to the highest
percentage of the PCM particles in the slurry that are in their melting range and their latent heat
absorptions would be effectively contributed in the cooling process. The optimum flow and
cooling performance may be achieved in a configuration with nanofluid/NEPCM slurry coolants
with 0.04/0.2 volumetric concentrations in upper/lower layers, respectively. The cooling
performance of the system can be enhanced by increasing the NEPCM concentration to 0.3 but
that would decrease the total efficiency of the system, substantially.
Page 98
84
Chapter 5. Precise three-dimensional machining of vertically aligned
carbon nanotube forests
1. Introduction
Low-energy environmental scanning electron microscopy (ESEM) is utilized to selectively
machine localized areas of carbon nanotube (CNT) forest microstructures. Cutting rates vary
substantially as a function of electron acceleration voltage, beam current, dwell time, operating
pressure, and cutting orientation relative to the CNT growth axis. By controlling operating
conditions, cutting depths between 0 - 100 µm are demonstrated for a single beam rastering scan.
The technique produces little residue and retains the native CNT forest density and morphology.
Further, the technique is utilized to serially machine identical patterns in adjacent CNT forest
microstructures.
Figure 39. Using the proposed machining technique to make cutting on carbon nanotube arrays.
Page 99
85
2. Literature Review and Experimental setup
Carbon nanotube (CNT) forests are vertically aligned CNT populations that offer unique
mechanical, electrical, and material properties that may be integrated into structural [75],
electrical[76-78], and thermal management devices[79, 80], sensors[81-83], and a wide range of
other applications[84]. The ability to pattern and manipulate CNT forests is expected to extend
and accentuate their application space. While the cross section of vertically oriented CNT forest
microstructures may be defined using photolithographic catalyst patterning, fabrication of
complex three-dimensional CNT forest microstructures remains a challenge. Capillary forces have
been utilized to shape and densify diverse CNT forest microstructures[85]; however, the final
structure is often not of uniform cross section, and the initial low-density morphology of the initial
forest is lost. Curved and structurally graded CNT forest microstructures have also been produced
by engineering regional mismatches in population growth rate during forest growth[86]. These
techniques manipulate the orientation of CNT forest microstructures, but they are bound by the
initial cross-section of patterned catalyst and are not amenable to arbitrary pattern definition in
three dimensions.
Figure 40. A complete carbon-nanotube-based on-chip cooling solution with very high heat dissipation capacity
[87].
Page 100
86
Additional geometric abstraction may be realized using a selective-area removal approach. Top-
down laser machining may be used to pattern CNT forests [88, 89], but pattern definition is
degraded from a Gaussian beam intensity profile, and significant carbon redeposition on the forest
is often observed. Limitations on beam diameter and beam placement hinder the resolution and
feature accuracy, particularly if 3-D patterning is desired on patterned microstructures. Focused
ion beam cutting of CNT forests offers high spatial precision [90], but suffers from carbon and
gallium redeposition that significantly alters the morphology of the surrounding forest.
Transmission electron microscopy (TEM) has been utilized to locally cut individual CNTs or small
CNT bundles in high vacuum [91-93]. In these experiments, electron energies exceeded that of
the knock-on threshold of 86.4 keV[93] required to remove a carbon atom from the CNT lattice,
and the time required to cut through a single CNT was on the order of minutes. In the presence of
gaseous oxidizing agents such as oxygen[94, 95] or water vapor[96], electron beams with energies
as low as 1 keV may be used to locally cut a CNT[94, 96] or graphene[95] layers using SEM.
Localized cutting at low energy is a product of CNT damage produced by e-beam and ion
bombardment and subsequent CNT oxidation. Again, reported CNT cutting rates were on the
order of minutes using SEM when operating at pressures between 10-4 – 10-2 Pa of water vapor[96]
and 10-2 Pa of oxygen[94]. By utilizing water vapor at pressures between 11 and 133 Pa, typical
of ESEM, we demonstrate the selective-area machining of CNT forests at a rate that is orders of
magnitude greater than previous reports while retaining nanoscale dimensional control and with
minimal carbon redeposition.
Page 101
87
Figure 41. Quanta 600F environmental SEM
CNT forest pillars of square cross-section were synthesized to a height of approximately 100 μm
using thermal CVD and lithographically defined catalyst film (Fe/Al2O3) on a silicon support.
Synthesis conditions may be found elsewhere[97]. The MWNTs exhibited a nominal inner and
outer diameter of the CNTs 7 and 10 nm, respectively and an average mass density of 22 μg/mm3.
A FEI Quanta 600 FEG ESEM operating in environmental mode was employed to irradiate CNT
forest samples. An investigation of ESEM operational parameters was examined relative to the
CNT forest cutting rate. All experiments were performed at a magnification of 40,000x, a
resolution of 2048 x 1768, a working distance of 8 mm, and an aperture of 1 mm. Varied
parameters include operating pressures of 11, 33, 66, 133 Pa, acceleration voltages of 5, 10, 20, 30
kV, electron beam dwell times of 0.5, 1, 2, 3 ms / pixel, and beam currents of 1.25, 6.45, and 7.5
nA. The standard set of operating conditions about which the parameters were varied includes a
pressure of 66 Pa, an acceleration voltage of 20 kV, a dwell time of 2 ms / pixel, and a beam current
of 7.5 nA. These standard conditions may be assumed unless otherwise stated. Further, the
Page 102
88
influence of CNT orientation relative to the incident electron beam was examined by orienting
CNT pillars such that the incident electron beam was normal to or parallel to the growth axis.
Machining occurred within a reduced area of interest (ROI) that extended 6 µm in length, and 1
µm in height along a pillar edge. Each CNT forest pillar was oriented such that the cut pillar face
was parallel to the cutting direction. The ROI was positioned such that approximately 1 µm of the
ROI length extended beyond the observed edge of the pillar to ensure a full cut. The electron bea m
was allowed to raster the ROI for one complete scan cycle, upon which time the cutting scan was
terminated.
Figure 42. Schematic of the environmental SEM used for CNT forest machining.
Figure 42 illustrates the ESEM environment used to machine CNT forests. The pressure levels
utilized in these studies was maintained by periodically introducing water vapor from an enclosed
flask containing deionized water. Prior to the introduction of water vapor, the ESEM chamber was
evacuated to purge the chamber of unwanted gas species. Collisions between the electron beam
Page 103
89
and the ambient water vapor result in radiolysis and produce energetic species and ions that are
accelerated towards the CNT forest. Interactions between the CNTs, electrons, and energetic
species locally damage and etch the CNTs in the irradiated region.
3. Results and Discussion
The CNT forest cutting depth was evaluated as a function of the ESEM operational parameters,
including vapor pressure, acceleration voltage, beam dwell time, and beam current. A distinct
CNT pillar was utilized for each parameter variation; however, pillars were adjacently located to
ensure sample uniformity. Transverse cuts were achieved by orienting the long axis of the pillars
normal to the incident electron beam, while axially aligned cuts were obtained by orienting the top
surface of the pillars normal to the electron beam. Parameters not being varied may be assumed
to be from the standard set of parameters previously mentioned.
Table 8. Parameter levels used to characterize the cutting process
Parameter Level 1 2 3 4
Dwell time (ms) 0.5 1 2 3
Acceleration Voltage (kV) 10 20 - 30
Beam current (nA) 1.3 6.5 - 7.5
Pressure (Pa) 133 66 33 11
The cutting depths as a function of each varied parameter and example SEM micrographs showing
representative cutting profiles may be found in Figure 43, while the level of each parameter plotted
in Figure 43 may be found in Table I. The observed cutting depths varied from 0 to 100 µm within
the examined parameter space. Note that electron beam dwell times in access of 500 µs were
Page 104
90
required for each CNT orientation in order to observe the cutting phenomena, which greatly
exceeds typical imaging parameters. General trends include an increase in cutting rate with an
increase in dwell time, acceleration voltage and beam current and a decrease in operating pressure,
as will be discussed in greater detail. Further, because each of the four independent parameter
variations examined the standard operating parameters, cutting rate repeatability may be evaluated.
Cutting transverse to the growth axis, the cut depth average, and standard deviation were 45.6 and
7.34 µm, respectively. Parallel to the growth axis the average and standard deviation were 60.5
and 9.8 µm, respectively, for the same operating parameters. Anisotropy in the CNT population
density is thought to contribute to the differences in cutting rates relative to cutting orientation.
Figure 43. ESEM cutting rate variation. SEM micrographs demonstrate the cutting depth in the transverse direction
(a) by varying operating pressure from 11, 33, 66, 133 Pa (top to bottom) and (b) in the axial cutting direction by
varying dwell time from 3, 2, 1, and 0.5 ms/pixel (left to right). The cutting depth is plotted as a function of
incremental changes in pressure, acceleration voltage, beam current, and dwell time in the (c) transverse and (d)
axial cutting directions. The definition of each parameter level is found in Table 1. The cutting depth as a function
of electron dose varies nearly linearly in both the (e) transverse and (f) axial cutting directions.
Page 105
91
The e-beam irradiation dose is determined based on the image resolution (pixel count), pixel size,
emission current, and beam dwell time. For these experiments, magnification, resolution, and
working distance were constant, ensuring constant pixel number and size. The emission current
and dwell time (exposure time of e-beam irradiation per pixel) were independently varied to create
a wide range of irradiation doses. Plotting the pixel irradiation dose, defined as the product of
dwell time and emission current normalized by pixel area, reveals a nearly linear increase in cutting
depth for both cutting orientations, as shown in Figure 43b,e. Increasing the irradiation dose also
increased the dosage of scattered energetic particles that intercepted the CNT forest outside of the
intended ROI, degrading the definition of the cutting boundaries. This effect may be largely
mitigated by decreasing operating pressure, as detailed later.
Figure 44. A 5µm pillar which is completely cut.
Increasing the e-beam acceleration voltage increases the velocity and linear momentum of the
incident electron beam. Increased acceleration voltage decreases the scattering angle from
collisions with water vapor, resulting in increased cutting rates and improved cutting resolution.
By increasing the acceleration voltage from 10 - 30 kV, the cutting depth increased from 21 - 65
Page 106
92
µm in the transverse cutting direction and from 34 – 71 µm in the axial cutting direction. The
definition of the cutting area relative to the ROI was superior at 30 kV acceleration voltage,
producing a cut cross section with sharp inner corners. In contrast, the corners of the cutting area
generated by 10 kV acceleration voltage were less sharply defined.
Figure 45. A 5 µm pillar and adjacent pillar are cut using a 30V electron beam.
The chamber pressure is directly related to the scattering cross section observed by the electron
beam and the availability of water vapor to generate reactive species and oxidize CNTs. Although
the availability of water vapor is increased at higher pressures, the electron beam scattering rate is
simultaneously increased. Figure 43 shows that increasing pressure from 11 to 133 Pa decreased
the cutting from 73 to 31 µm in the transverse orientation and from 73 to 15 µm in the axial
orientation. While the cutting rate monotonically increased with decreased chamber pressure, the
rate of increase steadily decreased, suggesting that an optimum cutting rate may exist below 11
Pa. In fact, previous reports at significantly lower operating pressures (between 10 -4 – 10-2 Pa)
indicated an increased cutting rate of individual CNTs with increased pressure. The unintentional
broadening of the cut cross section relative to the intended cutting ROI is apparent at the greatest
Page 107
93
chamber pressures. While the ROI height was constant at 1 μm for each experiment, the height of
the cutting region was approximately 2 μm at 133 Pa and approximately 1 μm at 11, as seen in
Figure 46a. Similar cutting depths were obtained after CNT forest samples were first allowed to
dwell in high vacuum for an extended period, suggesting that residual water vapor trapped within
the forests had minimal influence on the results.
Figure 46. SEM image of (a) the side wall of a 100 mm pillar after transverse cutting at 133, 66, 33, and 11 Pa (top
to bottom), and (b) the bottom region of an axial cut demonstrating the teardrop geometry resulting from scattered
electrons.
Vertically cutting the entire height of the CNT forest (100 µm) in the axial cutting orientation was
achieved using the greatest electron irradiation dose. A majority of the cut length retains the 1 μm
width defined by the cutting ROI; however, interactions at the substrate produce a cut that
terminates in a teardrop geometry at the substrate that extends beyond the defined ROI, as seen in
Figure 46b. This geometry is likely produced from electrons backscattered from the silicon
support, although secondary electrons from the silicon may have sufficient energy to initiate
radiolysis processes[98]. Portions of CNTs located near the substrate within the tear drop region
Page 108
94
appear to be removed from the bottom up, suggesting that energetic species originated from the
substrate rather than from the top CNT forest surface. Substrate interactions such as this may be
utilized to amplify the cutting rate near a rigid substrate, though fine control over cutting resolution
may be limited.
Figure 47. The parallel machining of adjacent 30 µm wide CNT pillars at various electron doses. Edge cuts utilized
doses of 1.5, 3, and 6 nA-ms/nm2 (top to bottom). Internal cuts at the centerline of the pillars utilized doses of 15
and 45 nA-ms/nm2 (top to bottom).
The relatively rapid cutting rate afforded from ESEM machining enables the serial machining of
multiple adjacent CNT columns, as observed in Figure 47a. Adjacent 30 µm wide pillars were
machined at 11 Pa along their edges and through their center line of using e-beam doses between
1.5 - 6 nA-ms/nm2. Internal and edge cuts at the smallest dose of 1.5 nA-ms/nm2 were confined
to the first pillar. Increasing the e-beam dose to 3 nA-ms/nm2 produced a pattern that completely
penetrated the first column. The edge pattern was transferred to the second column, though it did
not fully penetrate through the second column. The internal square pattern, however, cut
Page 109
95
completely through the front two columns and cut the surface of a third pillar, as seen by the dashed
line in Figure 47. A third edge cut at 6 nA-ms/nm2 completely cut through the first and second
pillar, with negligible cutting on the third pillar. The greater cutting depth of the internal pattern
may suggest spatial CNT density variations or that gas-phase electron scattering is reduced within
the internal CNT forest relative to the edges which are fully exposed to the vapor ambient. The
cut CNT forest surfaces produced by ESEM machining appear to largely retain the morphology of
the original CNT forest. High magnification imaging shows minimal carbon redeposition
concentrated at the cut surface (see Figure 47b). The ability to selectively and cleanly machine
single or multiple CNT forest microstructures with fine-scale features enables a new
nanomanufacturing capability for production of increasingly complex 3-D microstructures.
Page 110
96
Figure 48. Examples of 3-D CNT forest machining. (a) A 6 x 6 µm box is milled into a 10 x 10 µm CNT forest
pillar, leaving a freestanding hollow frame. (b) Angled cuts are used to produce a house-like CNT forest structure.
(c) A “staircase” of 5 µm wide pillars of various heights are machined from a CNT pillar that is initially 30 µm
wide. (d) High magnification images of a milled surface shows some small carbon redeposition.
Page 111
97
Chapter 6. Contributions and Future Works
4. Key contributions of this work
In chapter 2 of this thesis, the effects of nanoparticles volume fraction, inlet velocity, and wall
temperature on the thermal and hydrodynamic performance in the laminar flow regime is
investigated. It is demonstrated that the addition of NEPCM particles to the base fluid can enhance
the Nusselt number remarkably but it has a drastic effect on Euler number. The results also show
that increasing volume fraction and inlet velocity causes significant enhancement in Nusselt
number but with increasing bottom wall temperature, the Nusselt number first increases and then
decreases. In the defined special problem, while the desirable 2.27, 1.81, 1.56 times higher
maximum Nusselt numbers may be achieved when NEPCM slurries (C = 0.3) with Vin = 0.015,
0.030, 0.045 (m/s) are employed, respectively, the more than 3 times greater associated Euler
numbers denote the inevitable need for higher pumping power facilities.
In chapter 3, the higher Euler number as the main disadvantage of utilizing NEPCM slurry as the
coolant was addressed through introducing tip clearance to the microchannel. It was shown that,
there is a range of t/Wc ratio in which the higher Nusselt number with a lower Euler number is
expected. This desired range in the defined micro channel heat sink problem is 0.20< t/Wc <0.375
when the microchannel is working with NEPCM slurry and 0.16< t/Wc <0.26 when pure water
employed as the coolant.
In chapter 4, modeling a two layer counterflow heat sink, both nanomaterials suspensions and
NEPCM slurry coolant are employed simultaneously. NEPCM slurries may boost up the cooling
performance of the system by slowing the thermal boundary layer development while nanofluids
improve it through enhancing the average thermal conductivity of the coolant. Results showed that
simultaneous employing of both of these types of advanced coolants in a heatsink, the cooling
Page 112
98
performance of the system is enhanced and the disadvantages associated with these advanced
coolant are relieved, substantially. Based on the obtained results, in the defined problem, bottom
wall temperature of 306.15˚K leads to the highest percentage of the PCM particles in the slurry
that are in their melting range and their latent heat absorptions would be effectively contributed in
the cooling process.
In chapter 5, low-energy environmental scanning electron microscopy (ESEM) is utilized to
selectively machine localized areas of carbon nanotube (CNT) forest microstructures. Cutting
rates vary substantially as a function of electron acceleration voltage, beam current, dwell time,
operating pressure, and cutting orientation relative to the CNT growth axis. By controlling
operating conditions, cutting depths between 0 - 100 µm are demonstrated for a single beam
rastering scan. The technique produces little residue and retains the native CNT forest density and
morphology. Further, the technique is utilized to serially machine identical patterns in adjacent
CNT forest microstructures.
Page 113
99
5. Future directions
Conducting experimental test to examine the actual improvement which can be achieved
through employing NEPCM slurries can be a next step. The results that would be obtained
from the experimental tests would show what other parameters can be added to the
simulation to enhance the model’s accuracy.
Two-phase flow modeling of the NEPCM slurry and considering the physical and thermal
properties of the NEPCM particles and working fluid separately, would enhance the
physical insight to the problem, substantially.
Experimental tests and numerical modeling of the suspensions containing a mixture of
metal-based nanoparticles and NEPCM particles would be a great step. The disadvantage
of NEPCM slurries which is lower effective conductivity may be compensated by adding
conductive metal-based nanoparticles. The physical model, governing equations and
relevant correlations of the resultant suspension is not reported yet. Agglomeration
problem and the clogging issue need to be investigated as well.
Using the presented technique in chapter 5 to make precise machining of carbon nanotube
arrays may have a variety of potential applications. Using this technique in order to have more
insight into the relevant mechanical or thermal phenomena, may result in significant findings.
Page 114
100
References
1. Kordas, K., et al., Chip cooling with integrated carbon nanotube microfin architectures.
Applied Physics Letters, 2007. 90(12): p. 123105.
2. Hong, Y., Encapsulated Nanostructured Phase Change Materials for Thermal
Management. 2011, University of Central Florida Orlando, Florida.
3. Polsen, E.S., Robust synthesis and continuous manufacturing of carbon nanotube forests
and graphene films. 2013, University of Michigan.
4. Balasubramanian, K. and M. Burghard, Chemically functionalized carbon nanotubes.
Small, 2005. 1(2): p. 180-192.
5. Hahm, M.G., Controlled synthesis of vertically aligned carbon nanotubes and fabrication
of their diverse composites structures. Mechanical Engineering Dissertations, 2010.
6. Go, J.S., et al., Heat transfer enhancement using flow-induced vibration of a microfin
array. Sensors and Actuators A: Physical, 2001. 90(3): p. 232-239.
7. Peles, Y., et al., Forced convective heat transfer across a pin fin micro heat sink.
International Journal of Heat and Mass Transfer, 2005. 48(17): p. 3615-3627.
8. Koşar, A., C. Mishra, and Y. Peles, Laminar flow across a bank of low aspect ratio micro
pin fins. Journal of Fluids Engineering, 2005. 127(3): p. 419-430.
9. Kosar, A., Heat and Fluid Flow in MEMS-Based Pin Fin Heat Sinks. 2006, New York:
Rensselaer Polytechnic Institute.
10. Koşar, A. and Y. Peles, Convective flow of refrigerant (R-123) across a bank of micro pin
fins. International Journal of Heat and Mass Transfer, 2006. 49(17): p. 3142-3155.
11. Qu, W. and A. Siu-Ho, Liquid Single-Phase Flow in an Array of Micro-Pin-Fins—Part II:
Pressure Drop Characteristics. Journal of heat transfer, 2008. 130(12): p. 124501.
12. Seyf, H.R. and M. Feizbakhshi, Computational analysis of nanofluid effects on convective
heat transfer enhancement of micro-pin-fin heat sinks. International Journal of Thermal
Sciences, 2012. 58: p. 168-179.
13. Liu, M., et al., Experimental study on liquid flow and heat transfer in micro square pin fin
heat sink. International Journal of Heat and Mass Transfer, 2011. 54(25): p. 5602-5611.
14. Sabbah, R., J. Seyed-Yagoobi, and S. Al-Hallaj, Heat Transfer Characteristics of Liquid
Flow With Micro-Encapsulated Phase Change Material: Numerical Study. Journal of Heat
Transfer, 2011. 133(12): p. 121702-121702.
15. Hao, Y.-L. and Y. Tao, A numerical model for phase-change suspension flow in
microchannels. Numerical Heat Transfer, Part A: Applications, 2004. 46(1): p. 55-77.
16. Wang, X., et al., Heat transfer of microencapsulated PCM slurry flow in a circular tube.
AIChE journal, 2008. 54(4): p. 1110-1120.
17. Kuravi, S., et al., Numerical Investigation of Flow and Heat Transfer Performance of
Nano-Encapsulated Phase Change Material Slurry in Microchannels. Journal of Heat
Transfer, 2009. 131(6): p. 062901-062901.
18. Sabbah, R., J. Seyed-Yagoobi, and S. Al-Hallaj, Natural convection with micro-
encapsulated phase change material. Journal of Heat Transfer, 2012. 134(8): p. 082503.
19. Kondle, S., J.L. Alvarado, and C. Marsh, Laminar Flow Forced Convection Heat Transfer
Behavior of a Phase Change Material Fluid in Microchannels. Journal of Heat Transfer,
2013. 135(5): p. 052801-052801.
Page 115
101
20. Seyf, H.R., et al., Three dimensional numerical study of heat-transfer enhancement by
nano-encapsulated phase change material slurry in microtube heat sinks with tangential
impingement. International Journal of Heat and Mass Transfer, 2013. 56(1): p. 561-573.
21. Seyf, H.R., et al., Flow and Heat Transfer of Nanoencapsulated Phase Change Material
Slurry Past a Unconfined Square Cylinder. Journal of Heat Transfer, 2014. 136(5): p.
051902.
22. Seyf, H.R. and M. Layeghi, Numerical analysis of convective heat transfer from an elliptic
pin fin heat sink with and without metal foam insert. Journal of Heat Transfer, 2010. 132(7):
p. 071401.
23. Lu, H., et al., Heat Transfer Enhancement of Backward-Facing Step Flow by Using Nano-
Encapsulated Phase Change Material Slurry. Numerical Heat Transfer, Part A:
Applications, 2014. 67(4): p. 381-400.
24. Leonard, B.P., Order of accuracy of QUICK and related convection-diffusion schemes.
Applied Mathematical Modelling, 1995. 19(11): p. 640-653.
25. Rhie, C. and W. Chow, Numerical study of the turbulent flow past an airfoil with trailing
edge separation. AIAA journal, 1983. 21(11): p. 1525-1532.
26. Goel, M., S.K. Roy, and S. Sengupta, Laminar forced convection heat transfer in
microcapsulated phase change material suspensions. International Journal of Heat and
Mass Transfer, 1994. 37(4): p. 593-604.
27. Steinke, M.E. and S.G. Kandlikar. Single-phase liquid heat transfer in plain and enhanced
microchannels. in ASME 4th International Conference on Nanochannels, Microchannels,
and Minichannels. 2006. American Society of Mechanical Engineers.
28. Tullius, J., T. Tullius, and Y. Bayazitoglu, Optimization of short micro pin fins in
minichannels. International Journal of Heat and Mass Transfer, 2012. 55(15): p. 3921-
3932.
29. Koşar, A. and Y. Peles, Thermal-hydraulic performance of MEMS-based pin fin heat sink.
Journal of Heat Transfer, 2006. 128(2): p. 121-131.
30. Wang, Y. and Y. Peles, An Experimental Study of Passive and Active Heat Transfer
Enhancement in Microchannels. Journal of Heat Transfer, 2014. 136(3): p. 031901.
31. Wang, Y., et al., Convective heat transfer and mixing enhancement in a microchannel with
a pillar. International Journal of Heat and Mass Transfer, 2013. 62: p. 553-561.
32. Lee, Y., P. Lee, and S. Chou, Enhanced thermal transport in microchannel using oblique
fins. Journal of Heat Transfer, 2012. 134(10): p. 101901.
33. Lee, Y., P. Lee, and S. Chou, Numerical study of fluid flow and heat transfer in the
enhanced microchannel with oblique fins. Journal of Heat Transfer, 2013. 135(4): p.
041901.
34. Reyes, M., et al., Experimental study of heat transfer and pressure drop in micro-channel
based heat sinks with tip clearance. Applied Thermal Engineering, 2011. 31(5): p. 887-
893.
35. Moores, K.A. and Y.K. Joshi, Effect of tip clearance on the thermal and hydrodynamic
performance of a shrouded pin fin array. Journal of heat transfer, 2003. 125(6): p. 999-
1006.
36. Min, J.Y., S.P. Jang, and S.J. Kim, Effect of tip clearance on the cooling performance of a
microchannel heat sink. International Journal of Heat and Mass Transfer, 2004. 47(5): p.
1099-1103.
Page 116
102
37. Rozati, A., D.K. Tafti, and N.E. Blackwell, Effect of pin tip clearance on flow and heat
transfer at low Reynolds numbers. Journal of Heat Transfer, 2008. 130(7): p. 071704.
38. Liu, Z., N. Guan, and C. Zhang, Influence of tip clearance on heat transfer efficiency in
micro-cylinders-group heat sink. Experimental Thermal and Fluid Science, 2013. 46: p.
64-73.
39. Zhang, Y. and A. Faghri, Analysis of forced convection heat transfer in microencapsulated
phase change material suspensions. Journal of Thermophysics and Heat Transfer, 1995.
9(4): p. 727-732.
40. Karnis, A., H.L. Goldsmith, and S.G. Mason, The kinetics of flowing dispersions: I.
Concentrated suspensions of rigid particles. Journal of Colloid and Interface Science,
1966. 22(6): p. 531-553.
41. Watkins, R.W., C.R. Robertson, and A. Acrivos, Entrance region heat transfer in flowing
suspensions. International Journal of Heat and Mass Transfer, 1976. 19(6): p. 693-695.
42. Incropera, F.P., Principles of heat and mass transfer. 2013, Hoboken, NJ: John Wiley.
43. Zhang, Y., X. Hu, and X. Wang, Theoretical analysis of convective heat transfer
enhancement of microencapsulated phase change material slurries. Heat and Mass
Transfer, 2003. 40(1-2): p. 59-66.
44. Schlichting, H., K. Gersten, and K. Gersten, Boundary-layer theory. 2000: Springer.
45. Vand, V., Viscosity of Solutions and Suspensions. I. Theory. The Journal of Physical and
Colloid Chemistry, 1948. 52(2): p. 277-299.
46. Vand, V., Theory of viscosity of concentrated suspensions. Nature, 1945. 155: p. 364-365.
47. Alisetti, E.L. and S.K. Roy, Forced Convection Heat Transfer to Phase Change Material
Slurries in Circular Ducts. Journal of Thermophysics and Heat Transfer, 2000. 14(1): p.
115-118.
48. Tuckerman, D.B. and R.F.W. Pease, High-performance heat sinking for VLSI. Electron
Device Letters, IEEE, 1981. 2(5): p. 126-129.
49. Lin, L., et al., Optimization of geometry and flow rate distribution for double-layer
microchannel heat sink. International Journal of Thermal Sciences, 2014. 78(0): p. 158-
168.
50. Vafai, K. and L. Zhu, Analysis of two-layered micro-channel heat sink concept in
electronic cooling. International Journal of Heat and Mass Transfer, 1999. 42(12): p. 2287-
2297.
51. Beh, S.L., et al., Fast transient solution of a two‐layered counter‐flow microchannel heat sink. International Journal of Numerical Methods for Heat & Fluid Flow, 2009. 19(5): p.
595-616.
52. Levac, M.L.J., H.M. Soliman, and S.J. Ormiston, Three-dimensional analysis of fluid flow
and heat transfer in single- and two-layered micro-channel heat sinks. Heat and Mass
Transfer, 2011. 47(11): p. 1375-1383.
53. Hung, T.-C. and W.-M. Yan, Enhancement of thermal performance in double-layered
microchannel heat sink with nanofluids. International Journal of Heat and Mass Transfer,
2012. 55(11–12): p. 3225-3238.
54. Sharma, D., et al., Numerical Study on the Performance of Double Layer Microchannel
with Liquid Gallium and Water. Advances in Mechanical Engineering, 2013. 2013: p. 15.
55. SHARMA, D., P.P. SINGH, and H. GARG, Numerical Analysis of Trapezoidal Shape
Double Layer Microchannel Heat Sink. analysis, 2013. 15(76): p. 78.8.
Page 117
103
56. Xie, G., et al., Numerical Predictions of the Flow and Thermal Performance of Water-
Cooled Single-Layer and Double-Layer Wavy Microchannel Heat Sinks. Numerical Heat
Transfer, Part A: Applications, 2012. 63(3): p. 201-225.
57. Xie, G., et al., Computational Study and Optimization of Laminar Heat Transfer and
Pressure Loss of Double-Layer Microchannels for Chip Liquid Cooling. Journal of
Thermal Science and Engineering Applications, 2013. 5(1): p. 011004-011004.
58. Hung, T.-C., et al., Optimal design of geometric parameters of double-layered
microchannel heat sinks. International Journal of Heat and Mass Transfer, 2012. 55(11–
12): p. 3262-3272.
59. Xie, G., et al., Comparative Study of the Flow and Thermal Performance of Liquid-Cooling
Parallel-Flow and Counter-Flow Double-Layer Wavy Microchannel Heat Sinks.
Numerical Heat Transfer, Part A: Applications, 2013. 64(1): p. 30-55.
60. Xie, G., et al., Comparative Study of Thermal Performance of Longitudinal and
Transversal-Wavy Microchannel Heat Sinks for Electronic Cooling. Journal of Electronic
Packaging, 2013. 135(2): p. 021008-021008.
61. Choi, S.U.S. and J.A. Eastman, Enhancing thermal conductivity of fluids with
nanoparticles. 1995. Medium: ED; Size: 8 p.
62. Lee, S. and S.U.S. Choi, Application of metallic nanoparticle suspensions in advanced
cooling systems. 1996. Medium: ED; Size: 9 p.
63. Chein, R. and G. Huang, Analysis of microchannel heat sink performance using nanofluids.
Applied Thermal Engineering, 2005. 25(17–18): p. 3104-3114.
64. Koo, J. and C. Kleinstreuer, Laminar nanofluid flow in microheat-sinks. International
Journal of Heat and Mass Transfer, 2005. 48(13): p. 2652-2661.
65. Jang, S.P. and S.U.S. Choi, Cooling performance of a microchannel heat sink with
nanofluids. Applied Thermal Engineering, 2006. 26(17–18): p. 2457-2463.
66. Chein, R. and J. Chuang, Experimental microchannel heat sink performance studies using
nanofluids. International Journal of Thermal Sciences, 2007. 46(1): p. 57-66.
67. Tsai, T.-H. and R. Chein, Performance analysis of nanofluid-cooled microchannel heat
sinks. International Journal of Heat and Fluid Flow, 2007. 28(5): p. 1013-1026.
68. Li, J. and C. Kleinstreuer, Thermal performance of nanofluid flow in microchannels.
International Journal of Heat and Fluid Flow, 2008. 29(4): p. 1221-1232.
69. Seyf, H.R., et al., Three dimensional numerical study of heat-transfer enhancement by
nano-encapsulated phase change material slurry in microtube heat sinks with tangential
impingement. International Journal of Heat and Mass Transfer, 2013. 56(1–2): p. 561-573.
70. Dammel, F. and P. Stephan, Heat transfer to suspensions of microencapsulated phase
change material flowing through minichannels. Journal of Heat Transfer, 2012. 134(2): p.
020907.
71. Wei, X., Y. Joshi, and M.K. Patterson, Experimental and Numerical Study of a Stacked
Microchannel Heat Sink for Liquid Cooling of Microelectronic Devices. Journal of Heat
Transfer, 2007. 129(10): p. 1432-1444.
72. Khanafer, K. and K. Vafai, A critical synthesis of thermophysical characteristics of
nanofluids. International Journal of Heat and Mass Transfer, 2011. 54(19–20): p. 4410-
4428.
73. Van Doormaal, J.P. and G.D. Raithby, ENHANCEMENTS OF THE SIMPLE METHOD
FOR PREDICTING INCOMPRESSIBLE FLUID FLOWS. Numerical Heat Transfer, 1984.
7(2): p. 147-163.
Page 118
104
74. Timothy, B. and J. Dennis, The design and application of upwind schemes on unstructured
meshes, in 27th Aerospace Sciences Meeting. 1989, American Institute of Aeronautics and
Astronautics.
75. Hutchison, D.N., et al., Carbon Nanotubes as a Framework for High-Aspect-Ratio MEMS
Fabrication. Microelectromechanical Systems, Journal of, 2010. 19(1): p. 75-82.
76. Toth, G., et al., Carbon-Nanotube-Based Electrical Brush Contacts. Advanced Materials,
2009. 21(20): p. 2054-2058.
77. Park, M., et al., Effects of a carbon nanotube layer on electrical contact resistance between
copper substrates. Nanotechnology, 2006. 17(9): p. 2294-303.
78. Li, J., et al., Bottom-up approach for carbon nanotube interconnects. Applied Physics
Letters, 2003. 82(15): p. 2491-2493.
79. Cola, B., X. Xu, and T. Fisher, Increased real contact in thermal interfaces: A carbon
nanotube/foil material. Applied Physics Letters, 2007. 90(9): p. 093513.
80. Xu, J. and T.S. Fisher, Enhancement of thermal interface materials with carbon nanotube
arrays. International Journal of Heat and Mass Transfer, 2006. 49(9-10): p. 1658-1666.
81. Munge, B.S., et al., Electrochemical immunosensors for interleukin-6. Comparison of
carbon nanotube forest and gold nanoparticle platforms. Electrochemistry
Communications, 2009. 11(5): p. 1009-1012.
82. Maschmann, M.R., et al., Bioinspired Carbon Nanotube Fuzzy Fiber Hair Sensor for Air-
Flow Detection. Advanced Materials, 2014. 26(20): p. 3230-3234.
83. Yamada, T., et al., A stretchable carbon nanotube strain sensor for human-motion
detection. Nat Nano, 2011. 6(5): p. 296-301.
84. De Volder, M.F.L., et al., Carbon Nanotubes: Present and Future Commercial
Applications. Science, 2013. 339(6119): p. 535-539.
85. De Volder, M., et al., Diverse 3D Microarchitectures Made by Capillary Forming of
Carbon Nanotubes. Advanced Materials, 2010. 22(39): p. 4384-4389.
86. De Volder, M., et al., Strain-engineered manufacturing of freeform carbon nanotube
microstructures. Nat Commun, 2014. 5.
87. Fu, Y., et al., A complete carbon-nanotube-based on-chip cooling solution with very high
heat dissipation capacity. Nanotechnology, 2012. 23(4): p. 045304.
88. Hung, W.H., et al., Rapid prototyping of three-dimensional microstructures from
multiwalled carbon nanotubes. Applied Physics Letters, 2007. 91(9): p. -.
89. Emplit, A., et al., Multifunctional Material Structures Based on Laser-Etched Carbon
Nanotube Arrays. Micromachines, 2014. 5(3): p. 756-765.
90. Sears, K., et al., Focused ion beam milling of carbon nanotube yarns to study the
relationship between structure and strength. Carbon, 2010. 48(15): p. 4450-4456.
91. Krasheninnikov, A.V., et al., Stability of carbon nanotubes under electron irradiation:
Role of tube diameter and chirality. Physical Review B, 2005. 72(12): p. 125428.
92. Banhart, F., J. Li, and M. Terrones, Cutting Single-Walled Carbon Nanotubes with an
Electron Beam: Evidence for Atom Migration Inside Nanotubes. Small, 2005. 1(10): p.
953-956.
93. Smith, B.W. and D.E. Luzzi, Electron irradiation effects in single wall carbon nanotubes.
Journal of Applied Physics, 2001. 90(7): p. 3509-3515.
94. Liu, P., F. Arai, and T. Fukuda, Cutting of carbon nanotubes assisted with oxygen gas
inside a scanning electron microscope. Applied Physics Letters, 2006. 89(11): p. -.
Page 119
105
95. Thiele, C., et al., Electron-beam-induced direct etching of graphene. Carbon, 2013. 64(0):
p. 84-91.
96. Yuzvinsky, T.D., et al., Precision cutting of nanotubes with a low-energy electron beam.
Applied Physics Letters, 2005. 86(5): p. 053109.
97. Maschmann, M.R., et al., Continuum analysis of carbon nanotube array buckling enabled
by anisotropic elastic measurements and modeling. Carbon, 2014. 66(0): p. 377-386.
98. Zhou, W., et al., Fundamentals of Scanning Electron Microscopy (SEM), in Scanning
Microscopy for Nanotechnology, W. Zhou and Z. Wang, Editors. 2007, Springer New
York. p. 1-40.