Enhancing crustal reflection data through curvelet denoising
Vishal Kumar a,1, Jounada Oueity b,⁎, Ron M. Clowes b,2, Felix Herrmann b,3
a CGGVeritas, 9 Serangoon North Avenue 5, Singapore 554531, Singaporeb Department of Earth & Ocean Sciences, University of British Columbia, 6339 Stores Road, Vancouver, BC V6T 1Z4, Canada
Suppression of incoherent noise, which is present in the seismic signal and may often lead to ambiguousinterpretation, is a key step in processing associatedwith crustal reflection data. In this paper,wemake use of theparsimonious representation of seismic data in the curvelet domain to perform the noise attenuation whilepreserving the coherent energy and its amplitude information. Curvelets are a recently developedmathematicaltransform that has as one of its properties minimal overlap between seismic signal and noise in the transformdomain, thereby facilitating signal-noise separation. The problem is cast as an inverse problemand the results areobtained by updating the solution at each iteration. We demonstrate the effectiveness of this procedure atremoving noise on both synthetic shot gathers and a synthetic stacked seismic section. We then apply curveletdenoising to deep crustal seismic reflection data where the signal-to-noise ratio is low. The reflection data wererecorded along Lithoprobe's SNORCLE Line 1 across Paleoproterozoic-Archean domains in Canada's NorthwestTerritories. After initial processing, we apply the iterative curvelet denoising to both pre-stack shot gathers andpost-stack data. Ground roll, random noise andmuch of the anomalous vertical energy is removed from the pre-stack shot gathers, to the extent that crustal reflections, including those from the Moho, are clearly seen onindividual gathers. Denoised stacked data show a series of dipping reflections in the lower crust that extend intothe Moho. The Moho itself is relatively flat and characterized by a sharp, narrow band of reflections. Comparingthe results for the stacked data with those from F-X deconvolution, curvelet denoising outperforms the latter byattenuating incoherent noise with minimal harm to the signal. Because curvelet denoising retains amplitudeinformation, it provides opportunities for further studies of seismic sections through attribute analyses. Curveletdenoising provides an important new tool in the processing toolbox for crustal seismic reflection data.
In near-vertical incidence (NVI) seismic reflection data, recordedwavefronts (i.e., reflections) arise from the interaction of the incidentwavefield with inhomogeneities in the Earth's subsurface. Thesewavefronts can become contaminated with various types of noise dueto acquisition and processing problems (Olhovich, 1964). The noisesources can be separated into two categories. The first category of noiseis associated with the experiment itself. Such noise comprises anyunexpected perturbation of the recording environment during dataacquisition. A geophonemaymalfunction or the recording systemsmayhave glitches creating erratic noise in the seismic record. Wind motionor cable vibrations can generate random noise. Outside factors, such asthe activities of mammals and/or drilling rigs for marine acquisition,might also contaminate seismic records. Such noise sources can create
coherent energy in the data that may be misinterpreted as true signal.The second category of seismic noise derives from modeling orprocessing uncertainties (Tarantola, 1987). Such uncertainties occurwhen the physical description and parameterization of the earth isincomplete, as it inevitablymust be. This incomplete description resultsfrom the inherent complexity of wavefield propagation in thesubsurface, leading to various noisy components in the data. Noise inseismic data corrupts the quality of the signal; this can lead to poorinterpretation ormisinterpretation. Thus, separation of signal and noiseforms an important part of seismic data processing, particularly forcrustal data where the signal-to-noise ratio is low.
Because noise attenuation is a major step in seismic processing,manymethods have been developed to suppress this incoherent signalcomponent (e.g., Jones and Levy, 1987; Donoho, 1995; Ulrych et al.,1999; Fomel, 2002; Zhang and Ulrych, 2003). Within the seismicexploration industry, predictive deconvolution is one of the mostcommon techniques to attenuate noise. This adaptive method is alsoknown as F-X (frequency-space) deconvolution or F-X prediction(Abma and Claerbout, 1995). The prediction filter works in awindowedsense, predicting one dip at a time and tends to attenuate all othersecondary dips in that window. Another method for incoherent noisesuppression is localized slant stack (McMechan, 1983; Milkereit, 1987).
107V. Kumar et al. / Tectonophysics 508 (2011) 106–116
The localized slant stackmethod (also knownas linear radon transform)is based on assumptions of linear events in a localized window. Thewindowsize isfixedandall linear events in thewindowcanbemodeled.However, the method fails to model curved and complicated events inthewindow. Thus F-X prediction and slant stackmethods are not suitedfor curved events and for events with conflicting dips such as those thatoccur at caustics and pinch-outs.
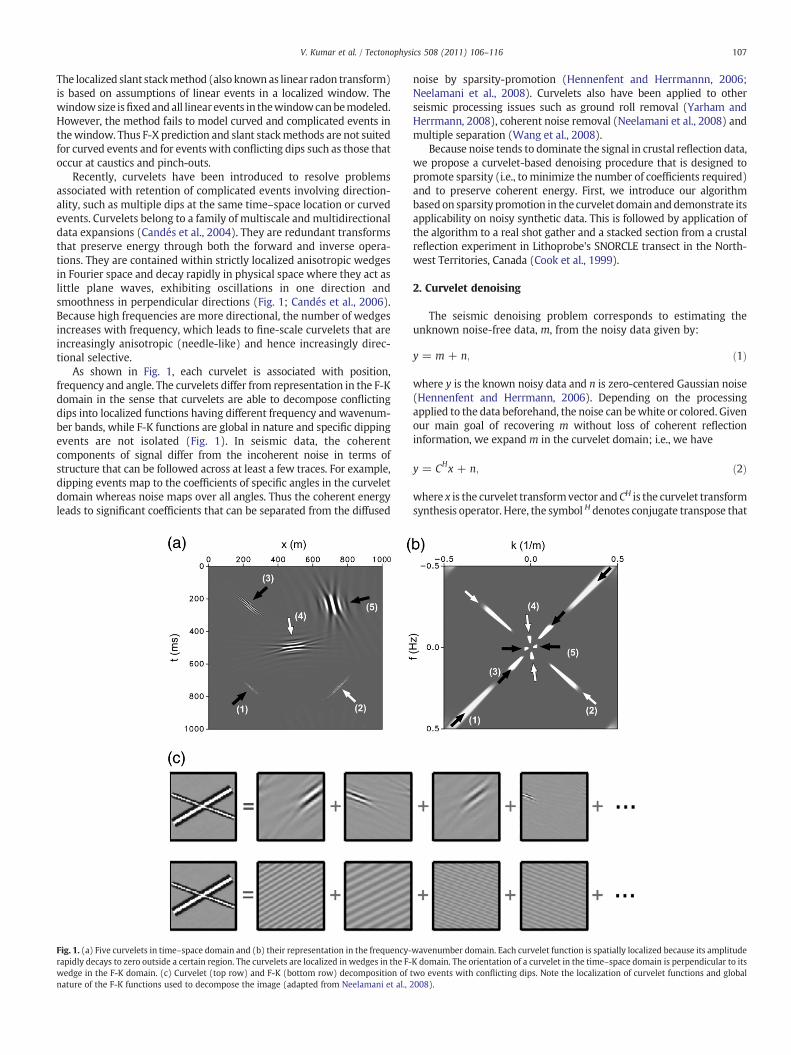
Recently, curvelets have been introduced to resolve problemsassociated with retention of complicated events involving direction-ality, such as multiple dips at the same time–space location or curvedevents. Curvelets belong to a family of multiscale and multidirectionaldata expansions (Candés et al., 2004). They are redundant transformsthat preserve energy through both the forward and inverse opera-tions. They are contained within strictly localized anisotropic wedgesin Fourier space and decay rapidly in physical space where they act aslittle plane waves, exhibiting oscillations in one direction andsmoothness in perpendicular directions (Fig. 1; Candés et al., 2006).Because high frequencies are more directional, the number of wedgesincreases with frequency, which leads to fine-scale curvelets that areincreasingly anisotropic (needle-like) and hence increasingly direc-tional selective.
As shown in Fig. 1, each curvelet is associated with position,frequency and angle. The curvelets differ from representation in the F-Kdomain in the sense that curvelets are able to decompose conflictingdips into localized functions having different frequency and wavenum-ber bands, while F-K functions are global in nature and specific dippingevents are not isolated (Fig. 1). In seismic data, the coherentcomponents of signal differ from the incoherent noise in terms ofstructure that can be followed across at least a few traces. For example,dipping events map to the coefficients of specific angles in the curveletdomain whereas noise maps over all angles. Thus the coherent energyleads to significant coefficients that can be separated from the diffused
Fig. 1. (a) Five curvelets in time–space domain and (b) their representation in the frequency-rapidly decays to zero outside a certain region. The curvelets are localized in wedges in the F-wedge in the F-K domain. (c) Curvelet (top row) and F-K (bottom row) decomposition ofnature of the F-K functions used to decompose the image (adapted from Neelamani et al., 2
noise by sparsity-promotion (Hennenfent and Herrmannn, 2006;Neelamani et al., 2008). Curvelets also have been applied to otherseismic processing issues such as ground roll removal (Yarham andHerrmann, 2008), coherent noise removal (Neelamani et al., 2008) andmultiple separation (Wang et al., 2008).
Because noise tends to dominate the signal in crustal reflection data,we propose a curvelet-based denoising procedure that is designed topromote sparsity (i.e., to minimize the number of coefficients required)and to preserve coherent energy. First, we introduce our algorithmbasedon sparsity promotion in the curvelet domain anddemonstrate itsapplicability on noisy synthetic data. This is followed by application ofthe algorithm to a real shot gather and a stacked section from a crustalreflection experiment in Lithoprobe's SNORCLE transect in the North-west Territories, Canada (Cook et al., 1999).
2. Curvelet denoising
The seismic denoising problem corresponds to estimating theunknown noise-free data, m, from the noisy data given by:
y = m + n; ð1Þ
where y is the known noisy data and n is zero-centered Gaussian noise(Hennenfent and Herrmann, 2006). Depending on the processingapplied to the data beforehand, the noise can bewhite or colored. Givenour main goal of recovering m without loss of coherent reflectioninformation, we expand m in the curvelet domain; i.e., we have
y = CHx + n; ð2Þ
where x is the curvelet transformvector and CH is the curvelet transformsynthesis operator. Here, the symbol H denotes conjugate transpose that
wavenumber domain. Each curvelet function is spatially localized because its amplitudeK domain. The orientation of a curvelet in the time–space domain is perpendicular to itstwo events with conflicting dips. Note the localization of curvelet functions and global008).
108 V. Kumar et al. / Tectonophysics 508 (2011) 106–116
is equivalent to the inverse for this choice of curvelet transform. Theforward and inverse curvelet transform operators are taken fromCurvelab codes available on www.curvelet.org. First, we detect thecurvelet coefficients whose absolute values exceed a threshold levelselected such that the residue, i.e., the difference between the noisy dataand the estimate for m, contains as much noise as possible withouttouching the coherent reflection energy. Because the curvelet transformis redundant, the use of a threshold level does not lead to a sparsecurvelet vector. Therefore, we include a second iterative stage duringwhich additional noise is removed while preserving the reflectionamplitudes. Notice that this procedure differs from most commondenoising approaches that only apply one of these two stages. However,our requirement of not removing coherent energy calls for thiscombined approach.
After detecting the set of curvelet coefficients that survive thethreshold, we solve the following constrained optimization problem:
x̃ = argx min ‖x‖1 subject to ‖y−Ax‖2≤ε; ð3Þ
where x̃ represents the estimated curvelet transform coefficientvector, and ε is proportional to the noise level (Elad et al., 2005).During the solution of this optimization problem, we restrictourselves to the detected curvelet coefficients by restricting thecurvelet synthesis matrix, i.e., A=CHR=Cr
H, which corresponds tocompounding the inverse curvelet transform CH with a diagonalmatrix R that has ones at the entries of the detected coefficients andzeros otherwise. The noise level is also set in accordance with thenoise estimate from the detection stage; i.e., ε=||y−Cr
HCry||2.Empirically, we obtained the best results, i.e., results that look best
in the so-called ‘eye-ball norm’, by choosing the curvelet transform tohave 5 scales, 16 angles at the second coarsest level and 64 angles atthe finest (fifth) scale. Fig. 2 shows the F-K tiling for our choice ofcurvelet transform. In essence, the curvelet transform entails a tilingof the frequency plane into multiple-angle and dyadic multiscalewedges (e.g., Fig. 2).
Following the procedure summarized above, the estimate for thedenoised data,m̃ = CH
r x̃, is found amongst the detected coefficients byminimizing the l1 norm. Following the seminal work by Figueiredoand Nowak (2003), Daubechies et al. (2004) and Elad et al. (2005), wesolve the constrained optimization problem (cf. Eq. 3) by a series of
Fig. 2. Discrete curvelet partitioning of the 2-D Fourier plane into second dyadiccoronae (boxes) and sub-partitioning of the coronae into angular wedges (radiatinglines). The tiling corresponds to 5 scales, 16 angles at the second coarsest level and 64angles at the finest (fifth) scale. The angles double every other scale. Numbers in theupper left indicate that if the length of an angular wedge segment is proportional to 2j,where j is an integer, then the end wedge dimension is proportional to 2j/2. (Adaptedfrom Hennenfent and Herrmannn, 2006).
unconstrained optimization problems for decreasing regularizationparameters λ:
x̃ = argx min12‖y−Ax‖
2
2 + λ‖x‖1: ð4Þ
The parameter λ determines the trade-off between data consis-tency and the sparsity in the curvelet domain. During the coolingprocedure that involves solution of Eq. (4), the trade-off parameter λis lowered gradually. This allows more curvelet coefficients to enterinto the solution until λ is sufficiently small such that the stoppingcriterion ||y−Ax||2≤ε is met. Each Kth subproblem is solved by Literations of soft thresholding (Figueiredo and Nowak, 2003;Daubechies et al., 2004) that involves the following updates for x:
x←Sλkx + AH y−Axð Þ
� �ð5Þ
where Sλk(x)=sgn(x) · max(0, |x|− |λk|), is the elementwise soft
thresholding operator (Donoho, 1995). The descent update, x←(x+AH(y−Ax)), minimizes the quadratic part of Eq. 4 while the softthresholding promotes sparsity. We solve a series of problems (Eq. 4)starting with high values of λ (λ1 is set slightly below the largestcurvelet coefficient, i.e., λ1b ||A
Hy||∞) and decreasing the value of λuntil ||y−Ax||2≤ε. Fig. 3 summarizes the algorithm. In contrast to F-Xdeconvolution and the localized slant stack method, the algorithmdoes not work within the context of a sliding window that has a fixedwidth in the x-direction. Rather, the entire data are treated as a singleimage and decomposed into localized functions of different frequen-cies, angles and positions. All these curvelet functions have a weightassociated with them tomodel the desired coherent data. The weightsare estimated by the algorithm.
3. Application to synthetic data
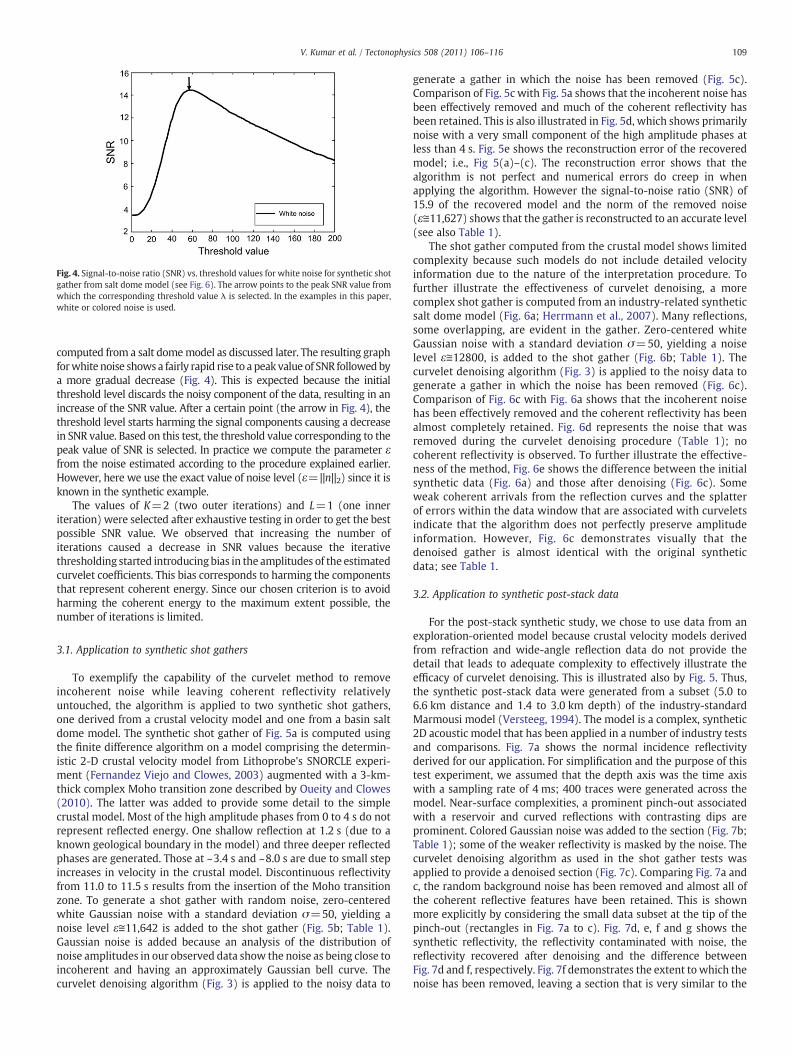
Prior to the application of the curvelet denoising algorithm tosynthetic data, the set of decreasing trade-off parameters (λ1,λ2,…,λk );L, the number of inner iterations; and K, the number of outer iterations,must be selected. To choose the best threshold level for the restriction inthe curvelet domain (Cr), a test in which a graph of signal-to-noise ratio(SNR) versus threshold level is plotted (Fig. 4). The SNR is calculatedfrom the following formula
SNR = 20* log10‖m‖2
‖m− m̃‖; ð6Þ
wherem is the truemodel (noise free data) and m̃ is the estimatedmodel(denoised data). The test was conducted on a synthetic shot gather
Fig. 3. The cooling method with iterative thresholding to solve equation (3). L is thenumber of inner iterations, K is the number of outer iterations, k is the counter for theouter iterations, and λk are the series of trade-off parameters with λ1 being the largest;other symbols are as explained in the text. Note that this is a two-stage iterativeprocedure (adapted from Herrmann and Hennenfent, 2008).
Fig. 4. Signal-to-noise ratio (SNR) vs. threshold values for white noise for synthetic shotgather from salt dome model (see Fig. 6). The arrow points to the peak SNR value fromwhich the corresponding threshold value λ is selected. In the examples in this paper,white or colored noise is used.
109V. Kumar et al. / Tectonophysics 508 (2011) 106–116
computed from a salt domemodel as discussed later. The resulting graphforwhite noise showsa fairly rapid rise to a peak value of SNR followedbya more gradual decrease (Fig. 4). This is expected because the initialthreshold level discards the noisy component of the data, resulting in anincrease of the SNR value. After a certain point (the arrow in Fig. 4), thethreshold level starts harming the signal components causing a decreasein SNR value. Based on this test, the threshold value corresponding to thepeak value of SNR is selected. In practice we compute the parameter εfrom the noise estimated according to the procedure explained earlier.However, here we use the exact value of noise level (ε=||n||2) since it isknown in the synthetic example.
The values of K=2 (two outer iterations) and L=1 (one inneriteration) were selected after exhaustive testing in order to get the bestpossible SNR value. We observed that increasing the number ofiterations caused a decrease in SNR values because the iterativethresholding started introducingbias in the amplitudes of the estimatedcurvelet coefficients. This bias corresponds to harming the componentsthat represent coherent energy. Since our chosen criterion is to avoidharming the coherent energy to the maximum extent possible, thenumber of iterations is limited.
3.1. Application to synthetic shot gathers
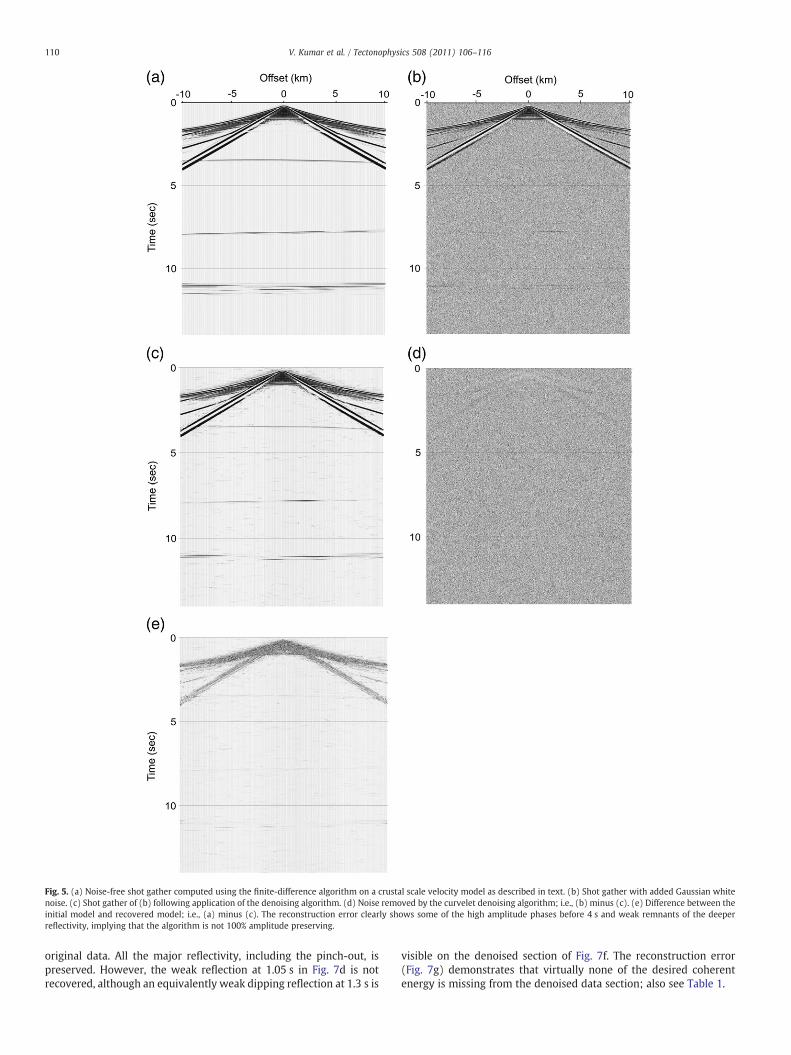
To exemplify the capability of the curvelet method to removeincoherent noise while leaving coherent reflectivity relativelyuntouched, the algorithm is applied to two synthetic shot gathers,one derived from a crustal velocity model and one from a basin saltdome model. The synthetic shot gather of Fig. 5a is computed usingthe finite difference algorithm on a model comprising the determin-istic 2-D crustal velocity model from Lithoprobe's SNORCLE experi-ment (Fernandez Viejo and Clowes, 2003) augmented with a 3-km-thick complex Moho transition zone described by Oueity and Clowes(2010). The latter was added to provide some detail to the simplecrustal model. Most of the high amplitude phases from 0 to 4 s do notrepresent reflected energy. One shallow reflection at 1.2 s (due to aknown geological boundary in the model) and three deeper reflectedphases are generated. Those at ~3.4 s and ~8.0 s are due to small stepincreases in velocity in the crustal model. Discontinuous reflectivityfrom 11.0 to 11.5 s results from the insertion of the Moho transitionzone. To generate a shot gather with random noise, zero-centeredwhite Gaussian noise with a standard deviation σ=50, yielding anoise level ε≅11,642 is added to the shot gather (Fig. 5b; Table 1).Gaussian noise is added because an analysis of the distribution ofnoise amplitudes in our observed data show the noise as being close toincoherent and having an approximately Gaussian bell curve. Thecurvelet denoising algorithm (Fig. 3) is applied to the noisy data to
generate a gather in which the noise has been removed (Fig. 5c).Comparison of Fig. 5c with Fig. 5a shows that the incoherent noise hasbeen effectively removed and much of the coherent reflectivity hasbeen retained. This is also illustrated in Fig. 5d, which shows primarilynoise with a very small component of the high amplitude phases atless than 4 s. Fig. 5e shows the reconstruction error of the recoveredmodel; i.e., Fig 5(a)–(c). The reconstruction error shows that thealgorithm is not perfect and numerical errors do creep in whenapplying the algorithm. However the signal-to-noise ratio (SNR) of15.9 of the recovered model and the norm of the removed noise(ε≅11,627) shows that the gather is reconstructed to an accurate level(see also Table 1).
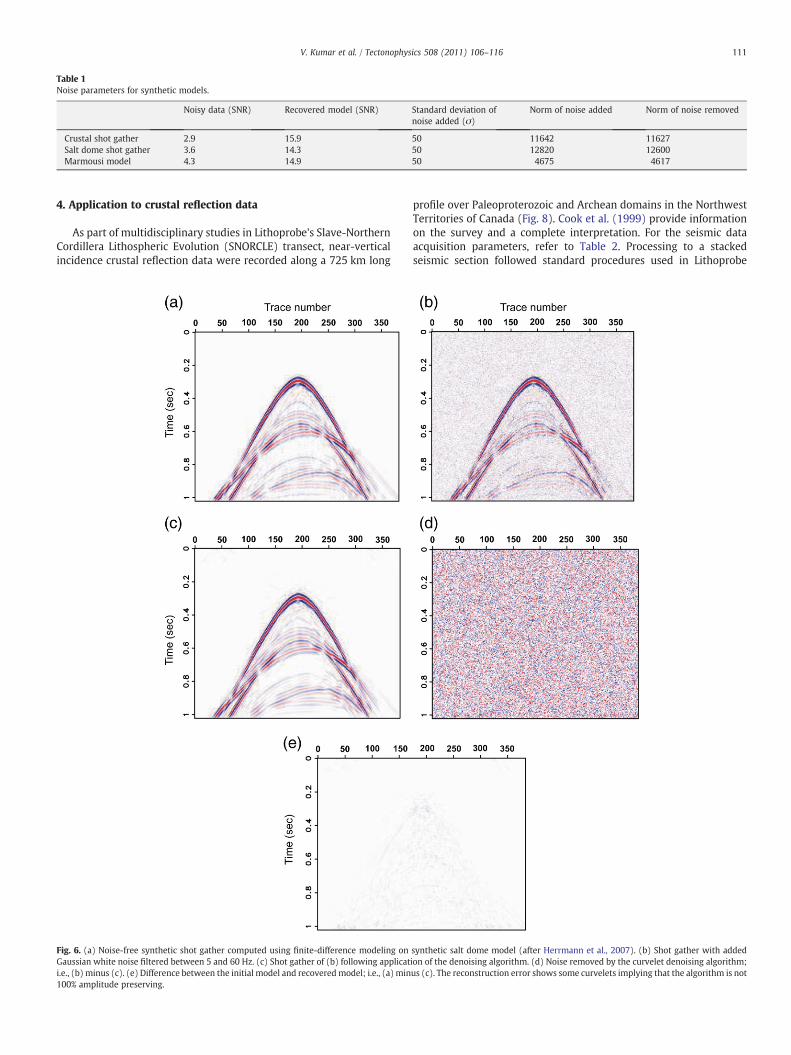
The shot gather computed from the crustal model shows limitedcomplexity because such models do not include detailed velocityinformation due to the nature of the interpretation procedure. Tofurther illustrate the effectiveness of curvelet denoising, a morecomplex shot gather is computed from an industry-related syntheticsalt dome model (Fig. 6a; Herrmann et al., 2007). Many reflections,some overlapping, are evident in the gather. Zero-centered whiteGaussian noise with a standard deviation σ=50, yielding a noiselevel ε≅12800, is added to the shot gather (Fig. 6b; Table 1). Thecurvelet denoising algorithm (Fig. 3) is applied to the noisy data togenerate a gather in which the noise has been removed (Fig. 6c).Comparison of Fig. 6c with Fig. 6a shows that the incoherent noisehas been effectively removed and the coherent reflectivity has beenalmost completely retained. Fig. 6d represents the noise that wasremoved during the curvelet denoising procedure (Table 1); nocoherent reflectivity is observed. To further illustrate the effective-ness of the method, Fig. 6e shows the difference between the initialsynthetic data (Fig. 6a) and those after denoising (Fig. 6c). Someweak coherent arrivals from the reflection curves and the splatterof errors within the data window that are associated with curveletsindicate that the algorithm does not perfectly preserve amplitudeinformation. However, Fig. 6c demonstrates visually that thedenoised gather is almost identical with the original syntheticdata; see Table 1.
3.2. Application to synthetic post-stack data
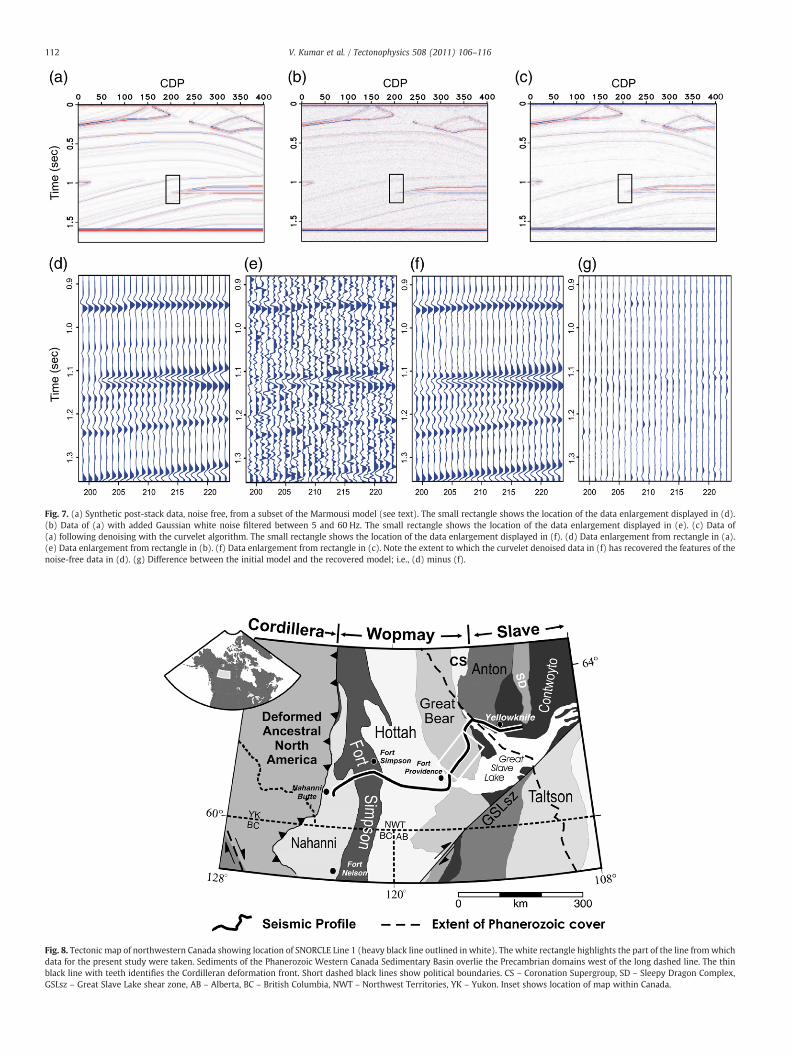
For the post-stack synthetic study, we chose to use data from anexploration-oriented model because crustal velocity models derivedfrom refraction and wide-angle reflection data do not provide thedetail that leads to adequate complexity to effectively illustrate theefficacy of curvelet denoising. This is illustrated also by Fig. 5. Thus,the synthetic post-stack data were generated from a subset (5.0 to6.6 km distance and 1.4 to 3.0 km depth) of the industry-standardMarmousi model (Versteeg, 1994). The model is a complex, synthetic2D acoustic model that has been applied in a number of industry testsand comparisons. Fig. 7a shows the normal incidence reflectivityderived for our application. For simplification and the purpose of thistest experiment, we assumed that the depth axis was the time axiswith a sampling rate of 4 ms; 400 traces were generated across themodel. Near-surface complexities, a prominent pinch-out associatedwith a reservoir and curved reflections with contrasting dips areprominent. Colored Gaussian noise was added to the section (Fig. 7b;Table 1); some of the weaker reflectivity is masked by the noise. Thecurvelet denoising algorithm as used in the shot gather tests wasapplied to provide a denoised section (Fig. 7c). Comparing Fig. 7a andc, the random background noise has been removed and almost all ofthe coherent reflective features have been retained. This is shownmore explicitly by considering the small data subset at the tip of thepinch-out (rectangles in Fig. 7a to c). Fig. 7d, e, f and g shows thesynthetic reflectivity, the reflectivity contaminated with noise, thereflectivity recovered after denoising and the difference betweenFig. 7d and f, respectively. Fig. 7f demonstrates the extent to which thenoise has been removed, leaving a section that is very similar to the
Fig. 5. (a) Noise-free shot gather computed using the finite-difference algorithm on a crustal scale velocity model as described in text. (b) Shot gather with added Gaussian whitenoise. (c) Shot gather of (b) following application of the denoising algorithm. (d) Noise removed by the curvelet denoising algorithm; i.e., (b) minus (c). (e) Difference between theinitial model and recovered model; i.e., (a) minus (c). The reconstruction error clearly shows some of the high amplitude phases before 4 s and weak remnants of the deeperreflectivity, implying that the algorithm is not 100% amplitude preserving.
110 V. Kumar et al. / Tectonophysics 508 (2011) 106–116
original data. All the major reflectivity, including the pinch-out, ispreserved. However, the weak reflection at 1.05 s in Fig. 7d is notrecovered, although an equivalently weak dipping reflection at 1.3 s is
visible on the denoised section of Fig. 7f. The reconstruction error(Fig. 7g) demonstrates that virtually none of the desired coherentenergy is missing from the denoised data section; also see Table 1.
111V. Kumar et al. / Tectonophysics 508 (2011) 106–116
4. Application to crustal reflection data
As part of multidisciplinary studies in Lithoprobe's Slave-NorthernCordillera Lithospheric Evolution (SNORCLE) transect, near-verticalincidence crustal reflection data were recorded along a 725 km long
Fig. 6. (a) Noise-free synthetic shot gather computed using finite-difference modeling onGaussian white noise filtered between 5 and 60 Hz. (c) Shot gather of (b) following applicati.e., (b) minus (c). (e) Difference between the initial model and recovered model; i.e., (a) min100% amplitude preserving.
profile over Paleoproterozoic and Archean domains in the NorthwestTerritories of Canada (Fig. 8). Cook et al. (1999) provide informationon the survey and a complete interpretation. For the seismic dataacquisition parameters, refer to Table 2. Processing to a stackedseismic section followed standard procedures used in Lithoprobe
synthetic salt dome model (after Herrmann et al., 2007). (b) Shot gather with addedion of the denoising algorithm. (d) Noise removed by the curvelet denoising algorithm;us (c). The reconstruction error shows some curvelets implying that the algorithm is not
Fig. 7. (a) Synthetic post-stack data, noise free, from a subset of the Marmousi model (see text). The small rectangle shows the location of the data enlargement displayed in (d).(b) Data of (a) with added Gaussian white noise filtered between 5 and 60 Hz. The small rectangle shows the location of the data enlargement displayed in (e). (c) Data of(a) following denoising with the curvelet algorithm. The small rectangle shows the location of the data enlargement displayed in (f). (d) Data enlargement from rectangle in (a).(e) Data enlargement from rectangle in (b). (f) Data enlargement from rectangle in (c). Note the extent to which the curvelet denoised data in (f) has recovered the features of thenoise-free data in (d). (g) Difference between the initial model and the recovered model; i.e., (d) minus (f).
Fig. 8. Tectonic map of northwestern Canada showing location of SNORCLE Line 1 (heavy black line outlined in white). The white rectangle highlights the part of the line fromwhichdata for the present study were taken. Sediments of the Phanerozoic Western Canada Sedimentary Basin overlie the Precambrian domains west of the long dashed line. The thinblack line with teeth identifies the Cordilleran deformation front. Short dashed black lines show political boundaries. CS – Coronation Supergroup, SD – Sleepy Dragon Complex,GSLsz – Great Slave Lake shear zone, AB – Alberta, BC – British Columbia, NWT – Northwest Territories, YK – Yukon. Inset shows location of map within Canada.
112 V. Kumar et al. / Tectonophysics 508 (2011) 106–116
Number of vibrators 4 or 5Sweep frequencies 10–80 HzSample rate 4 msSweep length 20 sRecord length 32 s (uncorrelated)Number of channels/record 404Receiver spacing 60 mVibrator point spacing 90 mGeophone frequency 10 HzNominal fold 134
Table 3Curvelet parameters.
Parameter Value
Number of scales 5Number of angles at 2nd coarsest scale 16Number of angles at 5th coarsest scale 64
113V. Kumar et al. / Tectonophysics 508 (2011) 106–116
studies (Cook et al., 1999). For the present example, data from a 60 kmsegment of the profile over the Paleoproterozoic domains were used(Fig. 8).
For the application of curvelet denoising to real data, the samenumber of scales and angles that were used for the synthetic data wereretained (Fig. 2; Table 3). Choosing the value of the noise level, ε, is achallenge for real data. In this study, the noise removed for a series ofthreshold values and associated noise levels was observed. From theseexperiments, the result that caused reasonable noise attenuation, andfor which the difference between the observed and denoised dataappeared as incoherent randomnoise,was selected; this is knownas the
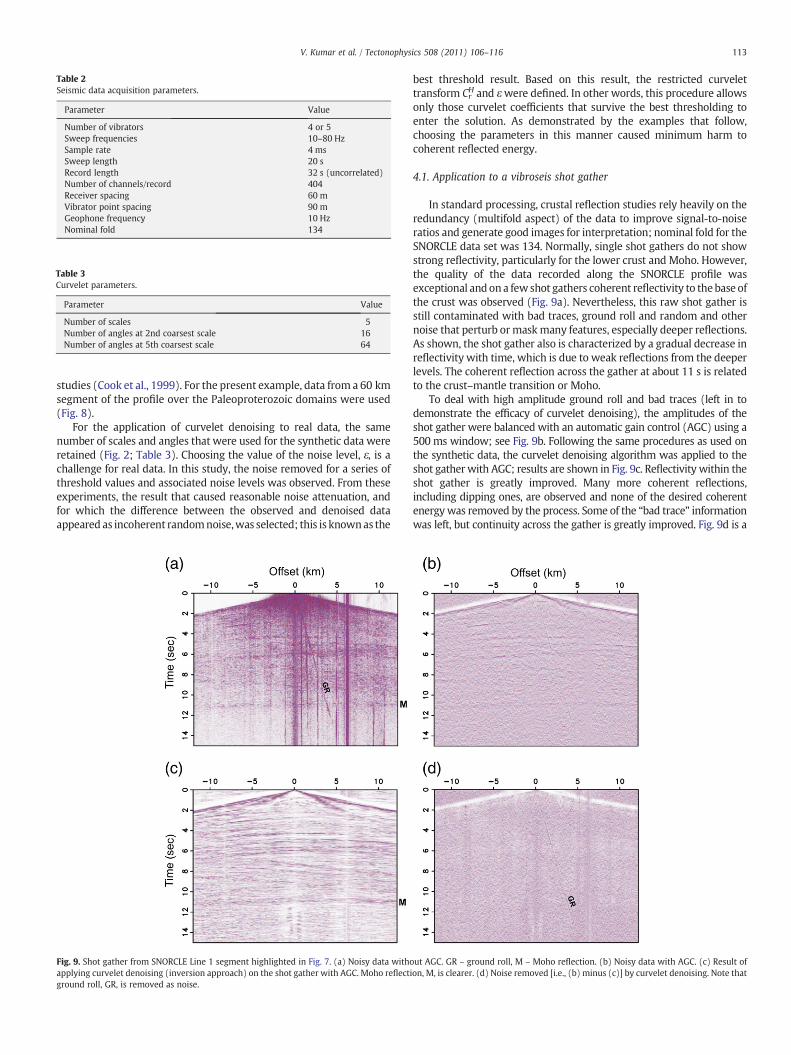
Fig. 9. Shot gather from SNORCLE Line 1 segment highlighted in Fig. 7. (a) Noisy data withoapplying curvelet denoising (inversion approach) on the shot gather with AGC. Moho reflectground roll, GR, is removed as noise.
best threshold result. Based on this result, the restricted curvelettransform Cr
H and εwere defined. In other words, this procedure allowsonly those curvelet coefficients that survive the best thresholding toenter the solution. As demonstrated by the examples that follow,choosing the parameters in this manner caused minimum harm tocoherent reflected energy.
4.1. Application to a vibroseis shot gather
In standard processing, crustal reflection studies rely heavily on theredundancy (multifold aspect) of the data to improve signal-to-noiseratios and generate good images for interpretation; nominal fold for theSNORCLE data set was 134. Normally, single shot gathers do not showstrong reflectivity, particularly for the lower crust and Moho. However,the quality of the data recorded along the SNORCLE profile wasexceptional andon a fewshot gathers coherent reflectivity to the base ofthe crust was observed (Fig. 9a). Nevertheless, this raw shot gather isstill contaminated with bad traces, ground roll and random and othernoise that perturb ormaskmany features, especially deeper reflections.As shown, the shot gather also is characterized by a gradual decrease inreflectivity with time, which is due to weak reflections from the deeperlevels. The coherent reflection across the gather at about 11 s is relatedto the crust–mantle transition or Moho.
To deal with high amplitude ground roll and bad traces (left in todemonstrate the efficacy of curvelet denoising), the amplitudes of theshot gather were balanced with an automatic gain control (AGC) using a500 ms window; see Fig. 9b. Following the same procedures as used onthe synthetic data, the curvelet denoising algorithm was applied to theshot gather with AGC; results are shown in Fig. 9c. Reflectivity within theshot gather is greatly improved. Many more coherent reflections,including dipping ones, are observed and none of the desired coherentenergywas removed by the process. Some of the “bad trace” informationwas left, but continuity across the gather is greatly improved. Fig. 9d is a
ut AGC. GR – ground roll, M – Moho reflection. (b) Noisy data with AGC. (c) Result ofion, M, is clearer. (d) Noise removed [i.e., (b) minus (c)] by curvelet denoising. Note that
114 V. Kumar et al. / Tectonophysics 508 (2011) 106–116
plot of the noise removed by curvelet denoising. Note that not only therandom noise but also the ground roll of Fig. 9a and much of the vertical“bad trace” energy have been removed.
4.2. Application to a stacked seismic section
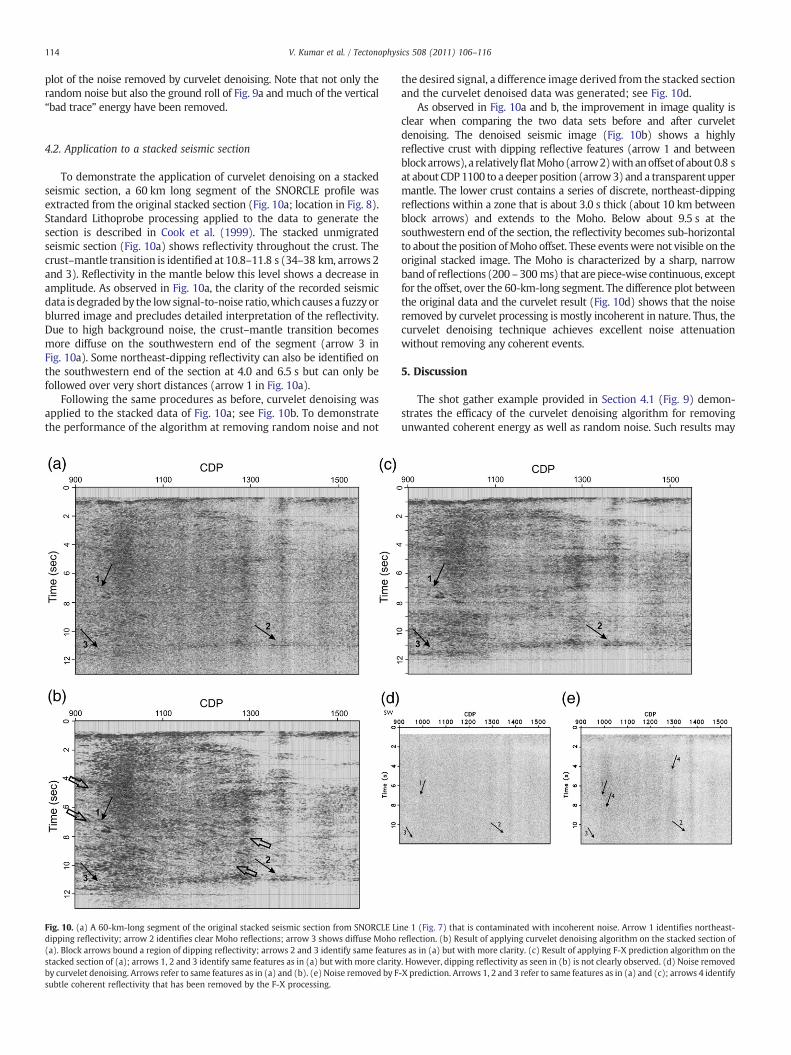
To demonstrate the application of curvelet denoising on a stackedseismic section, a 60 km long segment of the SNORCLE profile wasextracted from the original stacked section (Fig. 10a; location in Fig. 8).Standard Lithoprobe processing applied to the data to generate thesection is described in Cook et al. (1999). The stacked unmigratedseismic section (Fig. 10a) shows reflectivity throughout the crust. Thecrust–mantle transition is identified at 10.8–11.8 s (34–38 km, arrows 2and 3). Reflectivity in the mantle below this level shows a decrease inamplitude. As observed in Fig. 10a, the clarity of the recorded seismicdata is degradedby the lowsignal-to-noise ratio,whichcauses a fuzzy orblurred image and precludes detailed interpretation of the reflectivity.Due to high background noise, the crust–mantle transition becomesmore diffuse on the southwestern end of the segment (arrow 3 inFig. 10a). Some northeast-dipping reflectivity can also be identified onthe southwestern end of the section at 4.0 and 6.5 s but can only befollowed over very short distances (arrow 1 in Fig. 10a).
Following the same procedures as before, curvelet denoising wasapplied to the stacked data of Fig. 10a; see Fig. 10b. To demonstratethe performance of the algorithm at removing random noise and not
Fig. 10. (a) A 60-km-long segment of the original stacked seismic section from SNORCLE Lidipping reflectivity; arrow 2 identifies clear Moho reflections; arrow 3 shows diffuse Moho(a). Block arrows bound a region of dipping reflectivity; arrows 2 and 3 identify same featurstacked section of (a); arrows 1, 2 and 3 identify same features as in (a) but with more clarityby curvelet denoising. Arrows refer to same features as in (a) and (b). (e) Noise removed by Fsubtle coherent reflectivity that has been removed by the F-X processing.
the desired signal, a difference image derived from the stacked sectionand the curvelet denoised data was generated; see Fig. 10d.
As observed in Fig. 10a and b, the improvement in image quality isclear when comparing the two data sets before and after curveletdenoising. The denoised seismic image (Fig. 10b) shows a highlyreflective crust with dipping reflective features (arrow 1 and betweenblockarrows), a relativelyflatMoho(arrow2)withanoffset of about0.8 sat about CDP1100 to a deeper position (arrow3) and a transparent uppermantle. The lower crust contains a series of discrete, northeast-dippingreflections within a zone that is about 3.0 s thick (about 10 km betweenblock arrows) and extends to the Moho. Below about 9.5 s at thesouthwestern end of the section, the reflectivity becomes sub-horizontalto about the position ofMoho offset. These events were not visible on theoriginal stacked image. The Moho is characterized by a sharp, narrowband of reflections (200 – 300 ms) that are piece-wise continuous, exceptfor the offset, over the 60-km-long segment. The difference plot betweenthe original data and the curvelet result (Fig. 10d) shows that the noiseremoved by curvelet processing is mostly incoherent in nature. Thus, thecurvelet denoising technique achieves excellent noise attenuationwithout removing any coherent events.
5. Discussion
The shot gather example provided in Section 4.1 (Fig. 9) demon-strates the efficacy of the curvelet denoising algorithm for removingunwanted coherent energy as well as random noise. Such results may
ne 1 (Fig. 7) that is contaminated with incoherent noise. Arrow 1 identifies northeast-reflection. (b) Result of applying curvelet denoising algorithm on the stacked section ofes as in (a) but with more clarity. (c) Result of applying F-X prediction algorithm on the. However, dipping reflectivity as seen in (b) is not clearly observed. (d) Noise removed-X prediction. Arrows 1, 2 and 3 refer to same features as in (a) and (c); arrows 4 identify
115V. Kumar et al. / Tectonophysics 508 (2011) 106–116
enhance the ability of crustal seismologists to examine reflectivity onindividual shot gathers, for example theMohoarrivals, insteadof just onstacked data, which is the current procedure. To this end, curveletdenoising has been applied tomany shot gathers from SNORCLE Line 1,these being used in a quantitative study of Moho reflectivity to furtherunderstand the characteristics of the crust–mantle transition (OueityandClowes, 2010). The studyhas demonstrated thenatureof lateral andvertical heterogeneities within the crust–mantle transition and enabledinferences about the tectonic processes involved in development of theMoho.
Application of curvelet denoising to the 60-km segment of SNORCLEstacked, unmigrated data (Fig. 10a) generated a significantly improvedimage (Fig. 10b) thatwouldbebetter for interpretation than the former. Arevised, and improved, interpretation of Line 1would require applicationof the denoising procedure to the entire 725-km-long seismic line, anundertaking that is beyond the scope of this contribution.
As noted in the Introduction, predictive deconvolution is acommon technique to attenuate noise. To generate an image forcomparison with the curvelet denoised image (Fig. 10b), an F-Xprediction algorithm was applied to the stacked data. The F-Xpredicted image (Fig. 10c) shows most of the features observed onthe curvelet denoised image, but the northeast-dipping reflectivityand that from theMoho transition are not as clearly expressed.Withinthe prominent Moho reflectivity, individual and coherent reflectivityacross tens of traces, but discontinuous across the section, aredelineated better on the denoised section of Fig. 10b compared tothose on the F-X section of Fig. 10c. In addition, the noise removed byF-X prediction (Fig. 10e) contains some coherent energy (arrows 4).Therefore, we claim that results from curvelet processing are in manyaspects superior to those from F-X prediction.
Currently, interpretation of seismic sections (stacked, or stacked andmigrated) in crustal reflection studiesmakeuse of coherency filtering toprovide an improved image for interpretation and display in publica-tions (Kong et al., 1985;Milkereit and Spencer, 1989). Itwas used on theSNORCLE Line1 section so that thegeometrical aspects of the reflectivitywere well displayed (Cook et al., 1999). The denoised section of Fig. 10bdoes not quite show the clarity of reflections observed on the equivalentcoherency-filtered section (Fig. 2 in Cook et al., 1999), although all themajor aspects of the reflectivity can be seen. However, the curvelet-denoised section preserves the amplitude information of the originaldata section, whereas all amplitude information is lost throughcoherency filtering. Thus, curvelet denoising would be particularlyuseful for enhancingdatawhere further analyses that involve amplitudeinformation are intended. Such analyses might include instantaneousamplitude, trace envelope amplitude, instantaneous frequency, etc.(e.g., Robertson and Nogami, 1984; Robertson and Fisher, 1988; Barnes,1996). Since the amplitude information on reflection seismic sectionsarenot usuallyutilized inanyquantitative sense, theability todosowithcurvelet-denoised data opens up new opportunities for studying andinterpreting crustal reflectivity.
6. Conclusions
By exploiting the ability of curvelets to detect wavefront-likefeatures and sparsely represent seismic data, a denoising procedurethat is a clear improvement over results from existing methods such asadaptive F-X predictive-error filtering has been developed. The lattermethods often dim reflection amplitudes and are subject to leavingincoherent noise present. The two-stage procedure applied in curveletdenoising largely eliminates these shortcomings by first detecting a setof curvelet coefficients that are mostly noise-free and contain all thereflection information. During the second iterative stage, asmuch of theremaining noise as possible is removed while preserving the ampli-tudes. Application of curvelet denoising to synthetic shot gathers and astacked section exemplify the efficacy of themethod. The technique alsowas applied to observed shot gathers and a stacked seismic section from
a Lithoprobe survey in northwestern Canada. Clear coherent reflectivityto the base of the crust on the shot gather and dipping reflection eventsand reflections from theMoho that are muchmore clearly expressed inthepost-stack exampledemonstrate that themethodalsoworkswell onreal data.
Curvelet denoising expands the toolbox available for seismic dataprocessing. Although the algorithmwas developed for 2D data, it couldbe extended, using3Dcurvelets, to enhance thequality of 3Ddatasets sothat structure in three dimensions can be better exploited. This wouldrequire further developments. Another approach for further develop-ment would consider choosing a restriction operator that suppressescertain dipping events within the input data. This could lead to asophisticated dip filtering algorithm using the curvelet transform.
Acknowledgments
The authors thank two anonymous journal reviewers whoseconstructive comments contributed to significant improvements in themanuscript. This study was financially supported by the Natural Sciencesand Engineering Research Council (NSERC) of Canada Discovery Grants261641-2006 (FH) and 7707-2009 (RC) and DNOISE CRD Grant 334810-05 (FH). It was carried out as part of a project with support securedthrough the Industry Technology Facilitator (ITF), from the followingorganizations: BG Group, BP, Chevron, ExxonMobil and Shell.
References
Abma, R., Claerbout, J., 1995. Lateral prediction for noise attenuation by T-X and F-Xtechniques. Geophysics 60, 1887–1896.
Barnes, A.E., 1996. Theory of 2-D complex seismic trace analysis. Geophysics 61,264–272.
Candés, E., Demanet, L., Donoho, D., Ying, L., 2004. New tight frames of curvelets andoptimal representations of objects with C2 singularities. Communications on Pureand Applied Mathematics 57, 219–266.
Candés, E., Demanet, L., Donoho, D., Ying, L., 2006. Fast discrete curvelet transforms.Multiscale Modeling and Simulation 5, 861–899.
Cook, F.A., van der Velden, A.J., Hall, K.W., Roberts, B.J., 1999. Frozen subduction inCanada's Northwest Territories: lithoprobe deep lithospheric reflection profiling ofthe western Canadian Shield. Tectonics 18, 1–24.
Daubechies, I., Defrise, M., De Mol, C., 2004. An iterative thresholding algorithm forlinear inverse problems with a sparsity constraint. Communications on Pure andApplied Mathematics 5711, 1413–1457.
Donoho, D., 1995. De-noising by soft thresholding. IEEE Transactions on InformationTheory 41, 613–627.
Elad, M., Starck, J.L., Querre, P., Donoho, D.L., 2005. Simultaneous cartoon and textureimage inpainting using morphological component analysis (MCA). Applied andComputational Harmonic Analysis 19 (3), 340–358.
Fernandez Viejo, G., Clowes, R.M., 2003. Lithospheric structure beneath the ArchaeanSlave Province and Proterozoic Wopmay orogen, northwestern Canada, from aLithoprobe refraction/wide-angle reflection survey. Geophysical Journal Interna-tional 153, 1–19.
Figueiredo, M., Nowak, R., 2003. An EM algorithm for wavelet-based image restoration.IEEE Transactions on Image Processing 12, 906–916.
Fomel, S., 2002. Applications of plane-wave destructionfilters. Geophysics 67, 1946–1960.Hennenfent, G., Herrmann, F.J., 2006. Seismic denoising with nonuniformly sampled
curvelets. Computing in Science and Engineering 8 (3), 16–25.Herrmann, F.J., Hennenfent, G., 2008. Non-parametric seismic data recovery with
with directional curvelet frames. Geophysical Journal International 170, 781–799.Jones, I.F., Levy, S., 1987. Signal-to-noise enhancement in multichannel seismic data via
the Karhunen-Lo´eve Transform. Geophysical Prospecting 35 (1), 12–32.Kong, S.M., Phinney, R.A., Roy-Chowdhury, K., 1985. A nonlinear signal detector for
enhancement of noisy seismic record sections. Geophysics 50, 539–550.McMechan, G.A., 1983. P-X imaging by localized slant stacks of T-X data. Geophysical
Journal of the Royal Astronomical Society 72, 213–221.Milkereit, B., 1987. Migration of noisy crustal seismic data. Journal of Geophysical
Research 92, 7916–7930.Milkereit, B., Spencer, C., 1989. Noise suppression and coherency enhancement of
seismic data. In: Agterberg, F.P., Bonham-Carter, G.F. (Eds.), Statistical Applicationin the Earth Sciences. Geological Survey of Canada, pp. 243–248.
Neelamani, R., Baumstein, A.I., Gillard, D.G., Hadidi, M.T., Soroka, W.L., 2008. Coherentand random noise attenuation using the curvelet transform. The Leading Edge 27,240–248.
Olhovich, V.A., 1964. The causes of noise in seismic reflection and refraction work.Geophysics 29, 1015–1030.
116 V. Kumar et al. / Tectonophysics 508 (2011) 106–116
Oueity, J., Clowes, R.M., 2010. The nature of the Moho transition in NW Canada fromcombined near-vertical and wide-angle seismic reflection studies. Lithosphere 2,377–396.
Robertson, J.D., Fisher, D.A., 1988. Complex seismic trace attributes. The Leading Edge 7,22–26.
Tarantola, A., 1987. Inverse Problem Theory. Elsevier, N.Y.Ulrych, T.J., Sacchi, M.D., Graul, J.M., 1999. Signal and noise separation, art and science.
Geophysics 64, 1648–1656.
Versteeg, R., 1994. The Marmousi experience: velocity model determination on asynthetic data set. The Leading Edge 13, 927–936.
Wang, D., Saab, R., Yilmaz, O., Herrmann, F.J., 2008. Bayesian wavefield separation bytransform-domain sparsity promotion. Geophysics 73, 33–38. doi:10.1190/1.2952571.
Yarham, C., Herrmann, F.J., 2008. Bayesian ground-roll separation by curvelet-domainsparsity promotion. SEG Technical Program Expanded Abstracts 27, 3662–3666.