research for a fairer world Enhancing Domestic Resource Mobilization for Effective Development: The Role of Donors by Aniket Bhushan and Yiagadeesen Samy This paper is part of a multi-year research project by The North-South Institute, Ottawa, Canada. The project was made possible through the generous financial support of the African Development Bank (AfDB), the Canadian International Development Agency (CIDA), Canada’s International Development Research Centre (IDRC), and UKaid from the Department for International Development (DFID). Summer 2010
Transcript
research for a fairer world
Enhancing Domestic Resource Mobilization for Effective Development: The Role of Donorsby Aniket Bhushan and Yiagadeesen Samy
This paper is part of a multi-year research project by The North-South Institute, Ottawa, Canada. The project was made possible through the generous financial support of the African Development Bank (AfDB), the Canadian International Development Agency (CIDA), Canada’s International Development Research Centre (IDRC), and UKaid from the Department for International Development (DFID).
Summer 2010
Acknowledgements
We thank Roy Culpeper and Joe Ingram for helpful comments on an earlier draft of the paper;
and Teralynn Ludwick for her research assistance. A preliminary draft of this paper was
presented at a workshop on “Enhancing Domestic Resource Mobilization in Sub-Saharan
Africa” (Wilton Park, April 27–30, 2010). The current version has benefited from the comments
of workshop participants, whom we also thank. The responsibility for errors and opinions is ours.
Executive Summary
This paper complements five country studies — Burundi, Cameroon, Ethiopia, Tanzania, and
Uganda — on domestic resource mobilization (DRM) in sub-Saharan Africa and is part of the
output of a research project on DRM led by The North-South Institute, in partnership with the
African Development Bank, the African Economic Research Consortium, the Canadian
International Development Agency, the International Development Research Centre, and the
United Kingdom’s Department for International Development. Taxation is a key element of
public-sector DRM, and there are growing concerns that reliance on external resources (e.g., aid
and resource rents) confounds efforts to mobilize more resources domestically, creates perverse
incentives, and reduces the likelihood of the emergence of a fiscal contract between the state and
citizens. However, DRM also includes savings mobilization and intermediation.
In this paper, we outline the key debates on aid and its relation to DRM: aid, taxation, and
governance; tax effort and tax capacity; aid, savings, and investment; and aid volatility and
absorptive capacity. We discuss DRM in sub-Saharan Africa and identify some key challenges
faced by African governments. Our empirical analysis shows that aid has had no significant
impact on taxation and that the latter is mostly determined by the structure of economies.
In the final section, we suggest ways donors can support DRM in sub-Saharan Africa: by
building tax capacity and supporting domestic policy communities working on taxation; by
helping countries diversify their revenue mix and focus on untapped areas (such as property
taxes and better harnessing the revenue potential of natural resource sectors); and through
measures aimed at building the information infrastructure necessary to enhance private-sector
resource mobilization.
Introduction
In developing regions, especially sub-Saharan Africa, domestic resource mobilization (DRM)
has a significant international dimension. In many cases, resources lost to capital flight and
transfer pricing exceed aid flows; remittances are becoming increasingly important; revenues
from trade taxes are in decline; and aid accounts for a large (in many cases growing) share of the
government budget. The dramatic reversal of trade and financial flows during the global
economic crisis has heightened the need to think about more stable and sustainable modes of
development finance.
DRM has been a relatively neglected factor in strategy development, especially in sub-Saharan
Africa (Culpeper and Bhushan 2008, 2009, 2010). However, in recent years it has received
increasing attention in the development discourse beginning with the Monterrey Consensus on
Financing for Development in 2002. More recently, the donor community has begun to
acknowledge the importance of DRM, as evidenced by support for initiatives such as the African
Tax Administration Forum (ATAF). Enhancing DRM is limited by challenges on both the fiscal
side — broadening tax bases and ensuring that tax systems are simple, fair, and efficient and that
governments are accountable to taxpayers — and on the financial sector side — enhancing
mobilization of savings, increasing penetration of banking and financial services to all sections,
and ensuring that savings are channeled into productive investment.
Why enhance DRM now? What is different this time?
Notwithstanding recent interest in DRM as evident in support for ATAF (November, 2009) and
in the recent European Commission communication on Tax and Development (April, 2010),
regional and multilateral institutions such as the World Bank, IMF (through Regional Technical
Assistance Centers) and African Development Bank have been working on supporting tax
capacity, deepening and developing the financial sector in sub-Saharan Africa for decades. So a
legitimate question is why now? What is different in the case for enhancing DRM? There are at
least three good reasons:
Aid fatigue and the financial crisis: most donor countries fail to live up to the long-standing
commitment to deliver 0.7% of GNI as aid even in good times. More recently donors have fallen
far short of the Gleneagles (2005) commitments to raise the volume of aid and double aid to
Africa by 2010. Beyond the numbers there is also a sense that donor views on the purpose of aid
are constantly shifting and there is increasing skepticism about the utility of aid given over
decades and development results achieved. Moreover, the global economic crisis has brought aid
budgets in many countries under pressure. In tough times aid is unfortunately an easy line item
for cuts. We know from past crises in donor countries that aid budgets decline, bottoming out
over several years, and may not return to pre-crisis levels at all (Dang et al. 2009; Roodman,
2008). This makes enhancing alternative sources, including but not limited to domestic
resources, a matter of urgency.
Learning from success: for many developing countries the experience of East Asian economies,
and more recently China and India has been seminal. In each case these countries followed a
growth path which in addition to integration into the global economy was underpinned by very
high levels of DRM (domestic savings and investment). Indeed, as the Commission on Growth
and Development (2008) which examined the experience of 13 high-growth economies since
1950 concludes, “there is no case of a high investment path not backed up by high domestic
savings.” Furthermore as the report notes, in principle countries could rely on foreign capital to
finance investment, but capital inflows over the past several decades have a mixed record.
Foreign savings are an imperfect substitute for domestic saving, including public saving, to
finance the investment a booming economy requires.
Domestic resources are a necessary complement: it is now widely accepted that external
resource alone will not be enough to meet financing needs associated not merely to meet the
Millennium Development Goals (MDG) but also to sustain developmental performance beyond
2015. Aid in most countries simply will not be sufficient. Moreover aid-financed projects give
rise to additional spending needs which are expected to be covered by domestic resources. Thus,
even in the context of increasing aid levels enhancing DRM is crucial.
The aim of the paper is, first, to outline the key debates on aid and how it relates to DRM and,
second, to analyze the relation between aid and taxation in developing countries. In particular,
we explore whether being recipients of aid affects the ability of countries to enhance tax
mobilization. Ultimately, our objective is to examine what role donors can and should play in
enhancing DRM in developing regions and to what extent this role could contribute to eventual
“aid exit” or at least reduced dependence on aid. We conclude with a series of policy
recommendations drawn from the country studies, a literature review, our empirical analysis, and
discussions at an international conference on DRM (NSI 2010).
Relation between Aid and DRM
In the literature on aid and DRM, relatively greater attention has been paid to the interaction
between aid and public-sector resource mobilization (tax and non-tax revenue) than the relation
between aid and savings, investment, and growth. With reference to East Asia, Di John (2008)
makes the case that taxation should be viewed within a wider DRM perspective. The mainstream
literature assumes that state legitimacy is enhanced when there is consensus around taxation.
However, growth and the creation of conditions that contribute to employment creation are also
important sources of state legitimacy. The state’s capacity to mobilize resources beyond taxes is
an important feature of developmental success stories. This is clear from East Asia’s experience,
where although tax-to-GDP ratios are similar to those of other developing regions, there are
major differences in saving and investment rates, achieved largely through restrictions on credit,
mandatory pension contributions, encouragement of postal savings, and a close nexus between
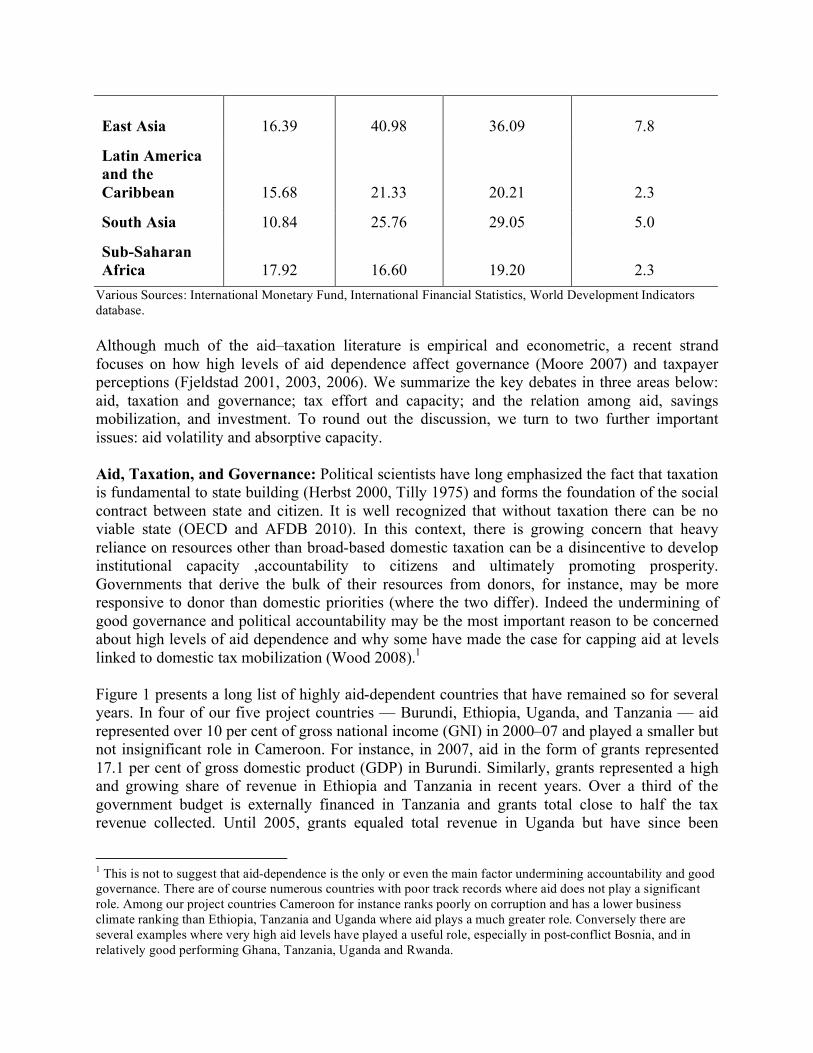
investment and export promotion (Table 1). Thus it is important to look at the aid–taxation
relationship, in the wider DRM context of savings and investment rates.
Table 1. DRM in Developing Regions
Tax/GDP
(2000–07
average)
Savings/GDP
(2000–08
average)
Investment/GDP
(2000–08
average)
GDP per capita
growth, annual %
(2000–08 average)
East Asia 16.39 40.98 36.09 7.8
Latin America
and the
Caribbean 15.68 21.33 20.21 2.3
South Asia 10.84 25.76 29.05 5.0
Sub-Saharan
Africa 17.92 16.60 19.20 2.3
Various Sources: International Monetary Fund, International Financial Statistics, World Development Indicators
database.
Although much of the aid–taxation literature is empirical and econometric, a recent strand
focuses on how high levels of aid dependence affect governance (Moore 2007) and taxpayer
perceptions (Fjeldstad 2001, 2003, 2006). We summarize the key debates in three areas below:
aid, taxation and governance; tax effort and capacity; and the relation among aid, savings
mobilization, and investment. To round out the discussion, we turn to two further important
issues: aid volatility and absorptive capacity.
Aid, Taxation, and Governance: Political scientists have long emphasized the fact that taxation
is fundamental to state building (Herbst 2000, Tilly 1975) and forms the foundation of the social
contract between state and citizen. It is well recognized that without taxation there can be no
viable state (OECD and AFDB 2010). In this context, there is growing concern that heavy
reliance on resources other than broad-based domestic taxation can be a disincentive to develop
institutional capacity ,accountability to citizens and ultimately promoting prosperity.
Governments that derive the bulk of their resources from donors, for instance, may be more
responsive to donor than domestic priorities (where the two differ). Indeed the undermining of
good governance and political accountability may be the most important reason to be concerned
about high levels of aid dependence and why some have made the case for capping aid at levels
linked to domestic tax mobilization (Wood 2008).1
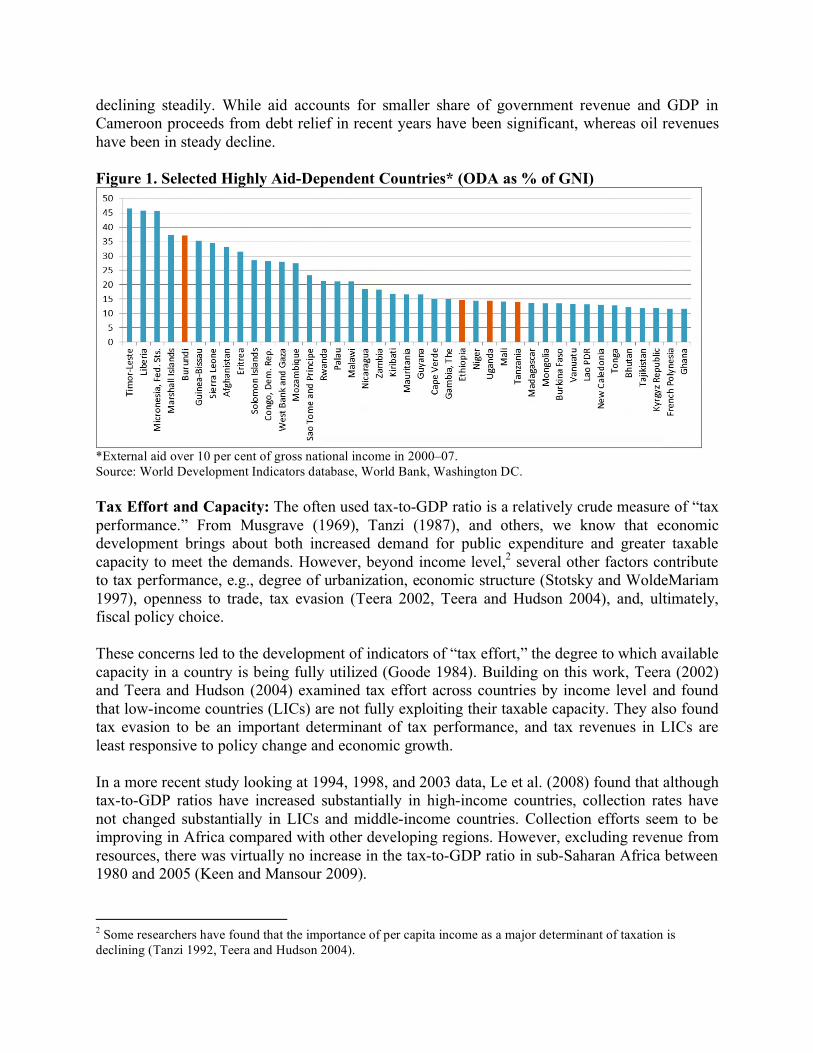
Figure 1 presents a long list of highly aid-dependent countries that have remained so for several
years. In four of our five project countries — Burundi, Ethiopia, Uganda, and Tanzania — aid
represented over 10 per cent of gross national income (GNI) in 2000–07 and played a smaller but
not insignificant role in Cameroon. For instance, in 2007, aid in the form of grants represented
17.1 per cent of gross domestic product (GDP) in Burundi. Similarly, grants represented a high
and growing share of revenue in Ethiopia and Tanzania in recent years. Over a third of the
government budget is externally financed in Tanzania and grants total close to half the tax
revenue collected. Until 2005, grants equaled total revenue in Uganda but have since been
1 This is not to suggest that aid-dependence is the only or even the main factor undermining accountability and good
governance. There are of course numerous countries with poor track records where aid does not play a significant
role. Among our project countries Cameroon for instance ranks poorly on corruption and has a lower business
climate ranking than Ethiopia, Tanzania and Uganda where aid plays a much greater role. Conversely there are
several examples where very high aid levels have played a useful role, especially in post-conflict Bosnia, and in
relatively good performing Ghana, Tanzania, Uganda and Rwanda.
declining steadily. While aid accounts for smaller share of government revenue and GDP in
Cameroon proceeds from debt relief in recent years have been significant, whereas oil revenues
have been in steady decline.
Figure 1. Selected Highly Aid-Dependent Countries* (ODA as % of GNI)
*External aid over 10 per cent of gross national income in 2000–07.
Source: World Development Indicators database, World Bank, Washington DC.
Tax Effort and Capacity: The often used tax-to-GDP ratio is a relatively crude measure of “tax
performance.” From Musgrave (1969), Tanzi (1987), and others, we know that economic
development brings about both increased demand for public expenditure and greater taxable
capacity to meet the demands. However, beyond income level,2 several other factors contribute
to tax performance, e.g., degree of urbanization, economic structure (Stotsky and WoldeMariam
1997), openness to trade, tax evasion (Teera 2002, Teera and Hudson 2004), and, ultimately,
fiscal policy choice.
These concerns led to the development of indicators of “tax effort,” the degree to which available
capacity in a country is being fully utilized (Goode 1984). Building on this work, Teera (2002)
and Teera and Hudson (2004) examined tax effort across countries by income level and found
that low-income countries (LICs) are not fully exploiting their taxable capacity. They also found
tax evasion to be an important determinant of tax performance, and tax revenues in LICs are
least responsive to policy change and economic growth.
In a more recent study looking at 1994, 1998, and 2003 data, Le et al. (2008) found that although
tax-to-GDP ratios have increased substantially in high-income countries, collection rates have
not changed substantially in LICs and middle-income countries. Collection efforts seem to be
improving in Africa compared with other developing regions. However, excluding revenue from
resources, there was virtually no increase in the tax-to-GDP ratio in sub-Saharan Africa between
1980 and 2005 (Keen and Mansour 2009).
2 Some researchers have found that the importance of per capita income as a major determinant of taxation is
declining (Tanzi 1992, Teera and Hudson 2004).
Among our case study countries, during 1975–98, Burundi and Cameroon made a “high tax
effort,” whereas Uganda’s tax effort was low (Teera and Hudson 2004). According to Le et al
(2008), while Cameroon falls into the “low effort–low collection” quadrant, Ethiopia and
Uganda are in the “high effort–low collection” quadrant. Typically, low effort–low collection
countries have overly complex tax structures, riddled with ad-hoc incentives, numerous
loopholes, evasion, and perceptions of unfairness and corruption. In the small group of countries
in the high effort–low collection quadrant (primarily LICs), high effort is achieved by enforcing
easy–to-collect taxes or imposing high taxes on the formal sector or both (Uganda is a case
in point).
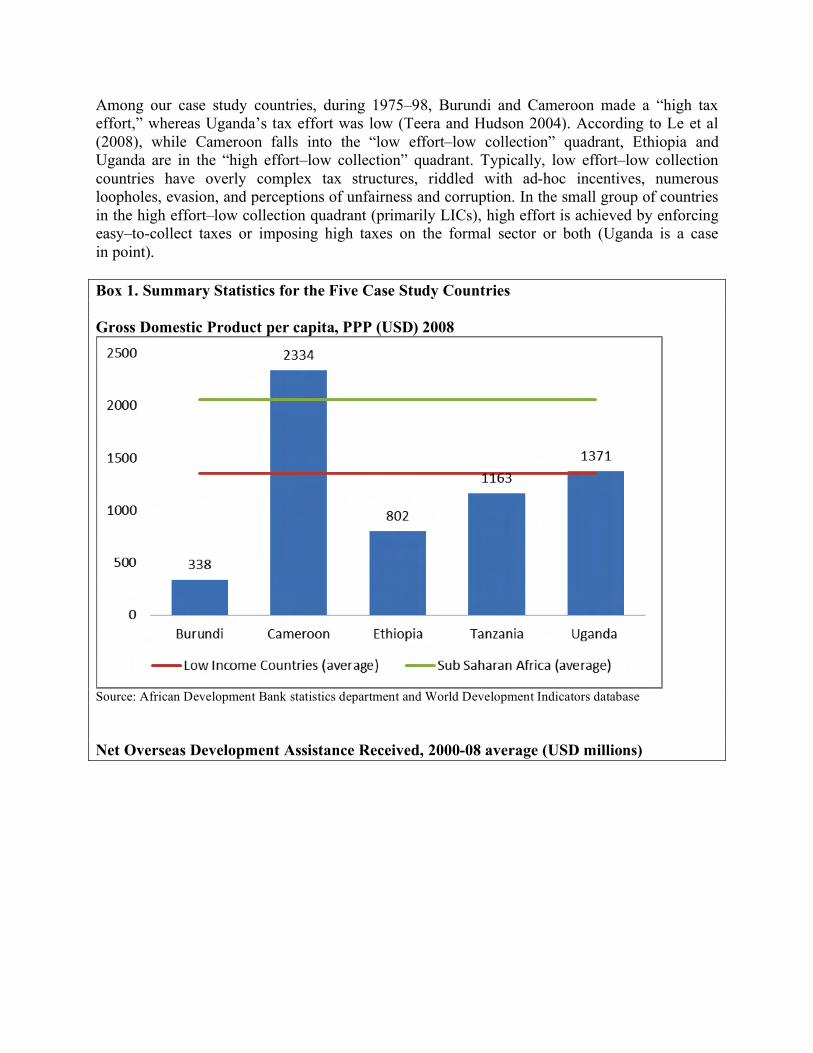
Box 1. Summary Statistics for the Five Case Study Countries
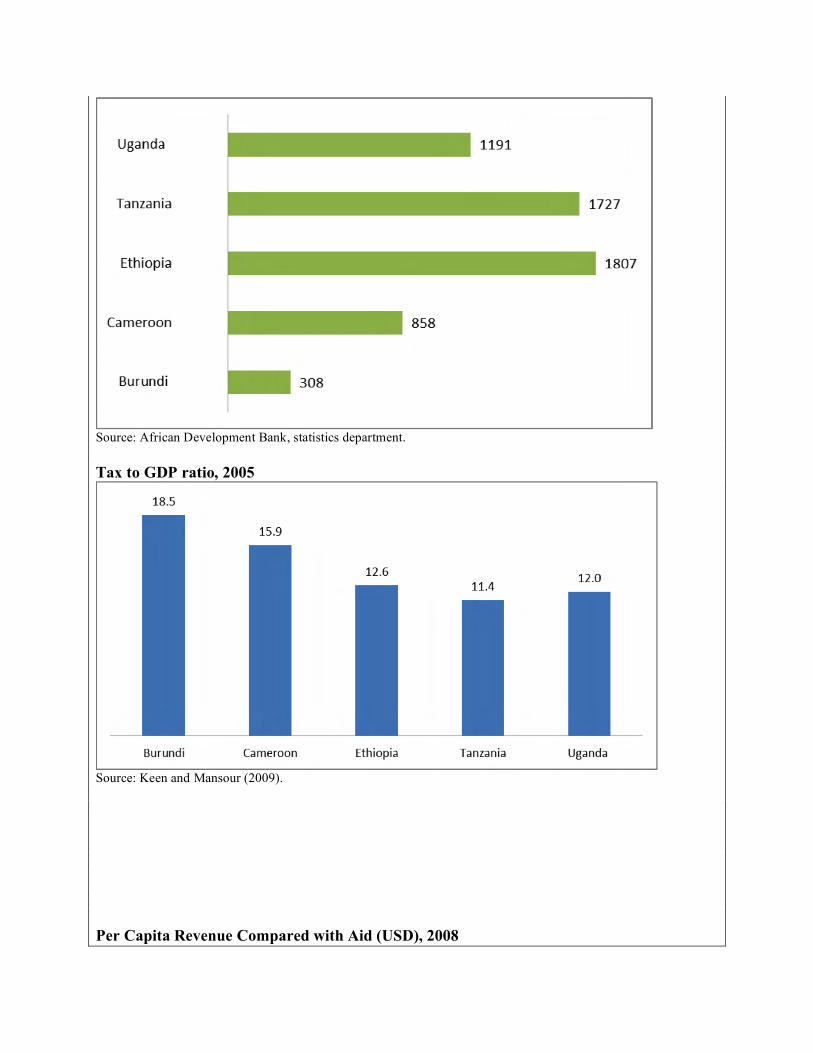
Gross Domestic Product per capita, PPP (USD) 2008
Source: African Development Bank statistics department and World Development Indicators database
Net Overseas Development Assistance Received, 2000-08 average (USD millions)
Source: African Development Bank, statistics department.
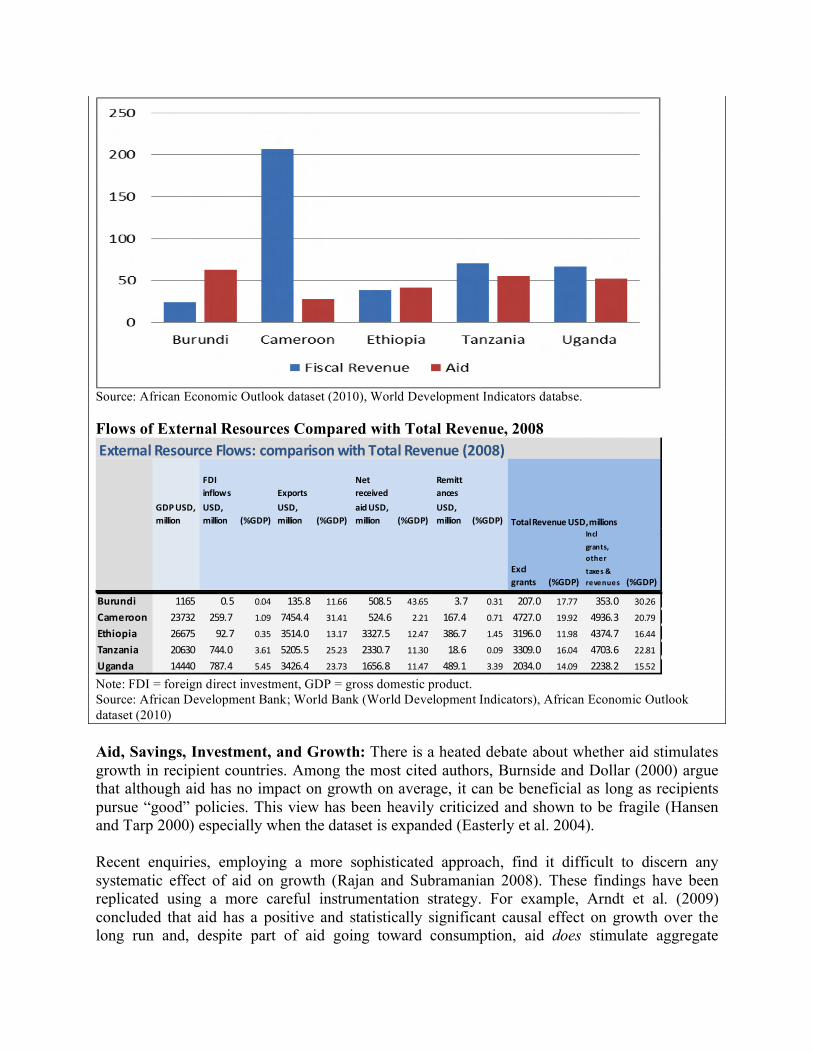
Tax to GDP ratio, 2005
Source: Keen and Mansour (2009).
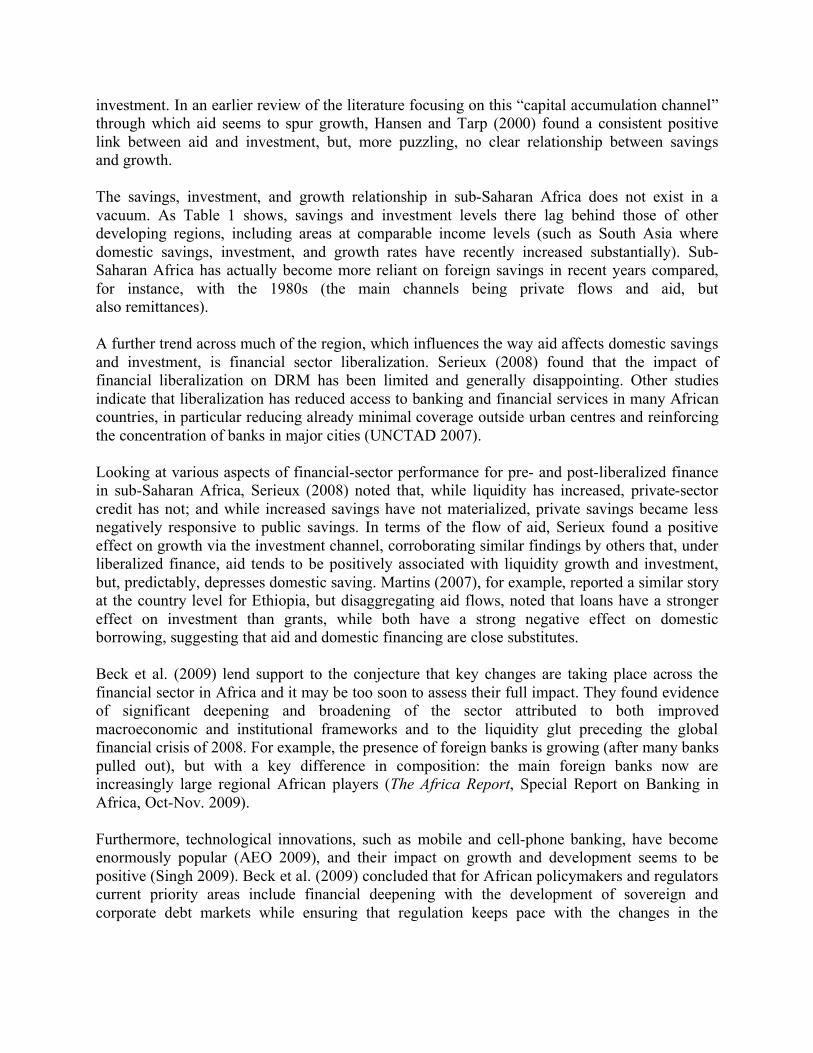
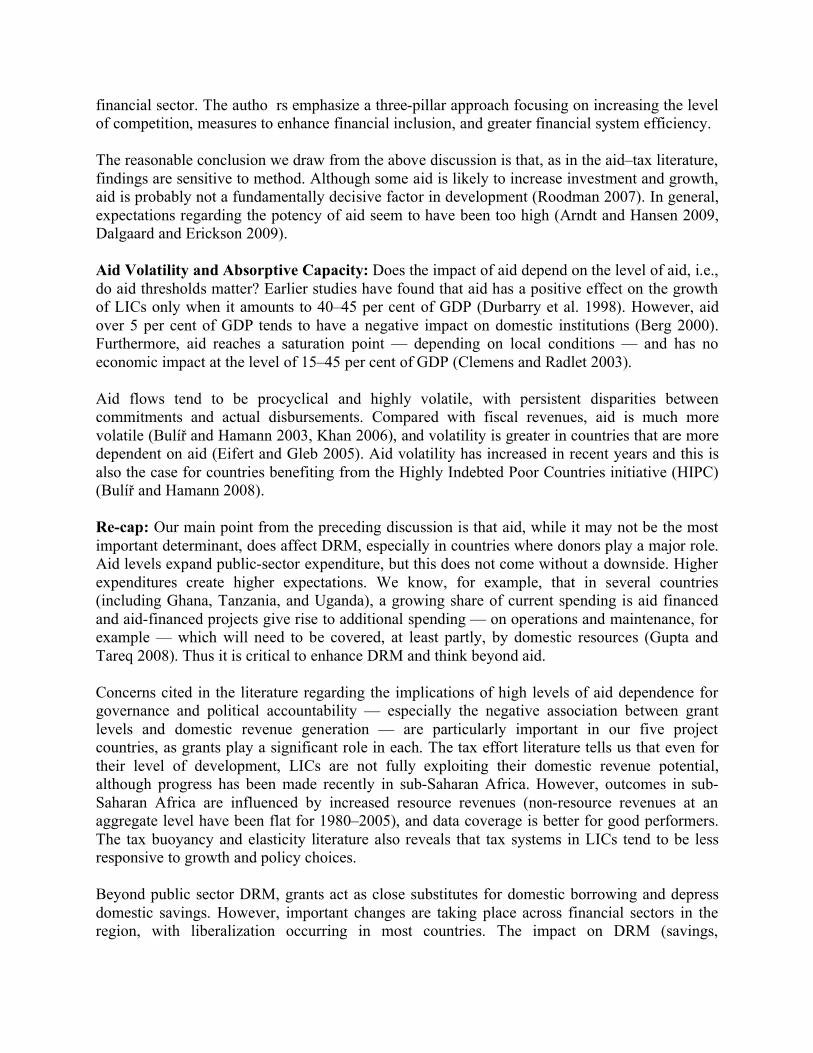
Per Capita Revenue Compared with Aid (USD), 2008
Source: African Economic Outlook dataset (2010), World Development Indicators databse.
Flows of External Resources Compared with Total Revenue, 2008
Note: FDI = foreign direct investment, GDP = gross domestic product.
Source: African Development Bank; World Bank (World Development Indicators), African Economic Outlook
dataset (2010)
Aid, Savings, Investment, and Growth: There is a heated debate about whether aid stimulates
growth in recipient countries. Among the most cited authors, Burnside and Dollar (2000) argue
that although aid has no impact on growth on average, it can be beneficial as long as recipients
pursue “good” policies. This view has been heavily criticized and shown to be fragile (Hansen
and Tarp 2000) especially when the dataset is expanded (Easterly et al. 2004).
Recent enquiries, employing a more sophisticated approach, find it difficult to discern any
systematic effect of aid on growth (Rajan and Subramanian 2008). These findings have been
replicated using a more careful instrumentation strategy. For example, Arndt et al. (2009)
concluded that aid has a positive and statistically significant causal effect on growth over the
long run and, despite part of aid going toward consumption, aid does stimulate aggregate
investment. In an earlier review of the literature focusing on this “capital accumulation channel”
through which aid seems to spur growth, Hansen and Tarp (2000) found a consistent positive
link between aid and investment, but, more puzzling, no clear relationship between savings
and growth.
The savings, investment, and growth relationship in sub-Saharan Africa does not exist in a
vacuum. As Table 1 shows, savings and investment levels there lag behind those of other
developing regions, including areas at comparable income levels (such as South Asia where
domestic savings, investment, and growth rates have recently increased substantially). Sub-
Saharan Africa has actually become more reliant on foreign savings in recent years compared,
for instance, with the 1980s (the main channels being private flows and aid, but
also remittances).
A further trend across much of the region, which influences the way aid affects domestic savings
and investment, is financial sector liberalization. Serieux (2008) found that the impact of
financial liberalization on DRM has been limited and generally disappointing. Other studies
indicate that liberalization has reduced access to banking and financial services in many African
countries, in particular reducing already minimal coverage outside urban centres and reinforcing
the concentration of banks in major cities (UNCTAD 2007).
Looking at various aspects of financial-sector performance for pre- and post-liberalized finance
in sub-Saharan Africa, Serieux (2008) noted that, while liquidity has increased, private-sector
credit has not; and while increased savings have not materialized, private savings became less
negatively responsive to public savings. In terms of the flow of aid, Serieux found a positive
effect on growth via the investment channel, corroborating similar findings by others that, under
liberalized finance, aid tends to be positively associated with liquidity growth and investment,
but, predictably, depresses domestic saving. Martins (2007), for example, reported a similar story
at the country level for Ethiopia, but disaggregating aid flows, noted that loans have a stronger
effect on investment than grants, while both have a strong negative effect on domestic
borrowing, suggesting that aid and domestic financing are close substitutes.
Beck et al. (2009) lend support to the conjecture that key changes are taking place across the
financial sector in Africa and it may be too soon to assess their full impact. They found evidence
of significant deepening and broadening of the sector attributed to both improved
macroeconomic and institutional frameworks and to the liquidity glut preceding the global
financial crisis of 2008. For example, the presence of foreign banks is growing (after many banks
pulled out), but with a key difference in composition: the main foreign banks now are
increasingly large regional African players (The Africa Report, Special Report on Banking in
Africa, Oct-Nov. 2009).
Furthermore, technological innovations, such as mobile and cell-phone banking, have become
enormously popular (AEO 2009), and their impact on growth and development seems to be
positive (Singh 2009). Beck et al. (2009) concluded that for African policymakers and regulators
current priority areas include financial deepening with the development of sovereign and
corporate debt markets while ensuring that regulation keeps pace with the changes in the
financial sector. The autho rs emphasize a three-pillar approach focusing on increasing the level
of competition, measures to enhance financial inclusion, and greater financial system efficiency.
The reasonable conclusion we draw from the above discussion is that, as in the aid–tax literature,
findings are sensitive to method. Although some aid is likely to increase investment and growth,
aid is probably not a fundamentally decisive factor in development (Roodman 2007). In general,
expectations regarding the potency of aid seem to have been too high (Arndt and Hansen 2009,
Dalgaard and Erickson 2009).
Aid Volatility and Absorptive Capacity: Does the impact of aid depend on the level of aid, i.e.,
do aid thresholds matter? Earlier studies have found that aid has a positive effect on the growth
of LICs only when it amounts to 40–45 per cent of GDP (Durbarry et al. 1998). However, aid
over 5 per cent of GDP tends to have a negative impact on domestic institutions (Berg 2000).
Furthermore, aid reaches a saturation point — depending on local conditions — and has no
economic impact at the level of 15–45 per cent of GDP (Clemens and Radlet 2003).
Aid flows tend to be procyclical and highly volatile, with persistent disparities between
commitments and actual disbursements. Compared with fiscal revenues, aid is much more
volatile (Bulí and Hamann 2003, Khan 2006), and volatility is greater in countries that are more
dependent on aid (Eifert and Gleb 2005). Aid volatility has increased in recent years and this is
also the case for countries benefiting from the Highly Indebted Poor Countries initiative (HIPC)
(Bulí and Hamann 2008).
Re-cap: Our main point from the preceding discussion is that aid, while it may not be the most
important determinant, does affect DRM, especially in countries where donors play a major role.
Aid levels expand public-sector expenditure, but this does not come without a downside. Higher
expenditures create higher expectations. We know, for example, that in several countries
(including Ghana, Tanzania, and Uganda), a growing share of current spending is aid financed
and aid-financed projects give rise to additional spending — on operations and maintenance, for
example — which will need to be covered, at least partly, by domestic resources (Gupta and
Tareq 2008). Thus it is critical to enhance DRM and think beyond aid.
Concerns cited in the literature regarding the implications of high levels of aid dependence for
governance and political accountability — especially the negative association between grant
levels and domestic revenue generation — are particularly important in our five project
countries, as grants play a significant role in each. The tax effort literature tells us that even for
their level of development, LICs are not fully exploiting their domestic revenue potential,
although progress has been made recently in sub-Saharan Africa. However, outcomes in sub-
Saharan Africa are influenced by increased resource revenues (non-resource revenues at an
aggregate level have been flat for 1980–2005), and data coverage is better for good performers.
The tax buoyancy and elasticity literature also reveals that tax systems in LICs tend to be less
responsive to growth and policy choices.
Beyond public sector DRM, grants act as close substitutes for domestic borrowing and depress
domestic savings. However, important changes are taking place across financial sectors in the
region, with liberalization occurring in most countries. The impact on DRM (savings,
investment, productivity increase at an aggregate level) is ambiguous. At least two relatively new
developments are worth emphasizing: the increasing presence of large African multinational
banks and the rapid adoption of mobile technologies with implications for regulation and
development of payment systems.
Global Perspective on DRM in sub-Saharan Africa
Several weaknesses have been noted above with respect to foreign aid as a long-term source of
development financing. However, aid is not the only point of interest for donors in a wider DRM
agenda. Loss of trade tax revenue (the most important source of taxation in LICs and lower-
middle-income countries [LMICs]) with declining tariff rates and liberalization, the proliferation
of exemptions and investments incentives, and capital flight and transfer pricing by multinational
corporations are other key issues, which we discuss next.
Trade Liberalization and Reductions in Trade Tax Revenue: Trade taxes form the bulk of
taxes collected in LICs, because they are the easiest to collect. About a third of non-resource tax
revenue in sub-Saharan Africa comes from trade taxes; however, this figure is in decline — from
over 6 per cent of regional GDP in the early 1980s to 4 per cent by the early 2000s. This is in
keeping with the global trend toward tariff reduction and integration, but presents a major fiscal
challenge for non-resource-rich sub-Saharan Africa in particular (Keen and Mansour 2009). In
that region, the average tariff rate has declined from over 20 per cent in the 1980s to 13 per cent
by 2005. LICs face the biggest challenge of replacing lost trade revenues (on average 30 cents on
every dollar) (Baunsgaard and Keen 2005).
Recent trends are somewhat more encouraging. Although loss of trade revenue has been
significant in middle- and upper-middle-income sub-Saharan Africa, both groups have managed
to increase overall tax-to-GDP ratio, relying mainly on indirect taxes or resource revenue. For
low-income sub-Saharan Africa, although nine countries gained trade tax revenue (comparing
the 1980s with 2003–05), 20 countries saw declines. However, even the LICs that lost trade tax
revenue managed to increase their overall tax-to-GDP ratio. Revenue recovery, it seems, has
been stronger in sub-Saharan Africa than other regions (Keen and Mansour 2009). However
much of this recovery is likely to have come from expansion of consumption taxes and the
introduction of value-added taxes particularly in non-resource-rich countries. Since these taxes
have impacts across the income spectrum (the poor are taxed indirectly even if they are not
counted as part of the tax base), social and vertical equity implications in the absence of remedial
measures such as transfer payments and refunds can be problematic.
Trade tax revenues are in clear decline among our project countries, although to varying degrees:
as a percentage of total tax revenue, they declined from 33.8 per cent to around 20 per cent in
Ethiopia; from 18.5 to 6.9 per cent in Tanzania; from 41.2 to 13.3 per cent in Cameroon; from
42.6 to 24.1 per cent in Burundi; and from 45.9 to 8.8 per cent in Uganda (all 1980 versus 2005
values, based on Keen and Mansour 2009). These trends can be expected to continue as countries
reduce tariffs as part of regional agreements (Burundi, Tanzania, and Uganda in the East African
Community, Cameroon in the Communauté economique et monetaire de l’Afrique centrale) and
enter bilateral agreements (for Cameroon the European Union–Economic Partnership Agreement
is projected to reduce tariff revenue by 70 per cent).
Proliferation of Exemptions: In a wide-ranging survey of taxation challenges facing developing
countries, Bird (2008) made a convincing argument for minimizing exemptions or completely
eliminating them. Exemptions contract the revenue base, complicate tax systems, and open the
door to political capture (the party or group in power could use discretionary exemptions to
retain power or undermine businesses linked to the opposition). More important, exemptions
have a ratcheting effect; once in place they are hard to remove. To date, there is no convincing
evidence that such incentives are a driver of investment decisions, but there is evidence to the
contrary (McKinsey & Company 2003, Dharmapala and Hines 2006). Other factors, such as
infrastructure, quality and cost of labour, and good governance, tend to be more important
drivers of investment decisions; yet, the number of countries in sub-Saharan Africa offering
exemptions of some type (especially in the form of “free zones,” reduced corporate tax rates, tax
holidays, and investment codes) has risen substantially (from 1980 to 2005). The net gains are
not at all clear (Gupta and Tareq 2008).
Tax exemptions are a major issue in the resource sector due to the long-term and capital-
intensive nature of outlays. In a number of resource-rich sub-Saharan Africa countries, such as
Democratic Republic of Congo, the resource sector is less taxed than non-resource industries. In
Mozambique, investment in the aluminum sector by Mozal was encouraged by placing the
project in a free zone, reducing the multinational’s corporate tax rate to only 1 per cent (Di John
2008). The lost revenue is estimated to be nearly equal to the entire fiscal take for Mozambique
in 2005. Other resource exporters, such as Zambia, have been more successful at getting
multinationals to renegotiate revenue-sharing agreements when global commodity prices were in
ascent before the recent crisis. Investment in the sector and demand for Africa’s natural
resources by emerging economies like China and India represents an opportunity for rethinking
resource-sector strategies.
Among our project countries, revenue losses due to exemptions in Cameroon were estimated at
1–6 per cent of GDP (1993–2000); customs exemptions in Ethiopia were 3.7–4.5 per cent of
GDP (2005–07); in Uganda less than 5 per cent of value-added tax was found to be actually
collected; in Tanzania exemptions represented 5 per cent of GDP or about a third of total tax
revenue (2006–07); and in Burundi exemptions totaled nearly 55 per cent of revenue (2005).
There are a number of examples of countries that have recently been successful in scaling back
exemptions (e.g., Egypt, China, Mauritius, and the Slovak Republic). In each case, this was
achieved via a combination of reducing top marginal rates and rationalizing and simplifying the
system (Keen and Mansour 2009). Sub-Saharan Africa countries need to re-examine exemptions
with a view to keeping them simple, keeping records, and evaluating results. Too often
exemptions are viewed as costless because the costs are not evaluated (Bird 2008). Ultimately,
investors — both domestic and foreign — are more interested in a tax system that is easy to
comply with, fair, and predictable so that they can plan decisions around it.
A less-investigated issue relates to exemptions on donor-funded goods and services imported as
part of a mission. Donors rarely pay taxes on imported cars and other goods or contribute to local
taxes; yet, in some cases, donor presence creates sub-economies that represent a significant
sphere of commercial activity (Boyce and O’Donnell 2007). This confers preferential treatment,
exacerbates a “culture of exemptions,” and creates opportunities for corruption. Waiving such
exemptions and complying voluntarily with local tax regulations could send an important signal
to domestic elites and tax authorities.
Transfer Pricing and Illicit Capital Flight: Africa’s cumulated stock of capital flight for 1970–
2004 has been estimated at USD 607 billion, representing almost three times the continent’s
external debt. The extent of the problem varies from country to country (UNCTAD 2009;
Ndikumana and Boyce 2008). Employing a different method, Kar and Cartwright-Smith (2010)
arrive at a figure of USD 854 billion (1970–2008). Illicit capital flight can be reasonably
estimated to be twice the level of aid flows. It is hard to see how effective investment in
productive capacity can take place as long as such vast amounts are being squandered by the
region’s elites.
In the aftermath of the recent financial crisis, the G20 has adopted financial secrecy surrounding
tax havens and non-cooperative jurisdictions. This is an area where the interests of advanced
countries and LICs are the same: identify and isolate illicit resources, punish offenders, create
strong disincentives for tax havens, and repatriate resources. This has once again brought into
focus the importance of North–South tax cooperation, an issue long enshrined in the Monterrey
Consensus, but one on which progress remains to be made.
Naming and shaming tax havens, as was done in the recent Organisation for Economic Co-
operation and Development (OECD) report requested by the G20, and tax information exchange
agreements are, at best, starting points. Although the exact amounts may be debated, it is clear
that developing countries lose a large and growing amount of financial resources (multiples of
aid flows) to capital flight. Given that many havens are in other developing countries, addressing
the problem requires a multipronged and global effort, including support for development of
surveillance, investigative capacity, and tax capacity in general in developing regions. The
potential payoff for sub-Saharan Africa could be substantial.
Does Aid Affect the Ability of Countries to Tax?
What does the literature tell us about the impact of aid on taxation? Review of a broad sample of
the aid–taxation literature revealed that most of the empirical literature emphasizes a negative
link between aid and taxation in developing countries, i.e., high levels of aid have a negative
impact on revenue mobilization. However, these findings are sensitive to methodological
specifications and significant gaps in the data (especially tax data).
Several studies document a statistically significant negative relationship between aid (usually
measured as a percentage of GDP, GNI, or government expenditure) and taxation measured as
the tax-to-GDP ratio (Bräutigam and Knack 2004, Remmer 2004, Moss et al. 2006, Moore
2007). More troubling is the finding that high levels of aid erode governance, measured variously
as changes in indicators of democracy (Djankov et al. 2005), country risk (Bräutigam 2000), and
more recently “efficiency of resource mobilization,” a measure of the “quality of tax systems” in
the World Bank’s country policy institutional assessment (Knack 2008). Reminiscent of the
micro–macro paradox in the aid–growth literature (Arndt et al. 2009), studies at the country level
find a positive relationship between aid and revenue mobilization in some countries — Indonesia
(Pack and Pack 1990), Ghana (Osei et al. 2003), Uganda (Fagernäs and Roberts 2004a), and
Malawi (Fagernäs and Schurich 2004) — and a negative relationship in others — Pakistan
(Franco-Rodriguez et al. 1998), Zambia (Fagernäs and Roberts 2004b), and Côte d’Ivoire
(McGillivray and Outtara 2003).
Efforts have been made to account for donor proclivities, e.g., to direct aid to countries showing
signs of improving governance (Bräutigam and Knack 2004), worsening institutional quality
(Bräutigam 2000), and less-corrupt regimes (Alesina and Weder 2002). Yet, the negative
relationship persists. Understandably then, some studies compare aid with oil and other so-called
“resource curses.” It is interesting to note that aid is found to have a greater negative effect on
governance indicators (Djankov et al. 2005) and quality of tax systems (Knack 2008) than
resource curses.
A further issue, beyond aid levels is whether the type of aid — grants or loans — has any impact
on revenue mobilization in recipient countries. While focusing on the impact of corruption on tax
revenue generation, Ghura (1998) also found that grants tend to have a negative effect on the tax-
to-GDP ratio. In a much cited paper, Gupta et al. (2003) found that net aid has a negative impact
on government revenue and that the relationship is primarily driven by the negative impact of
grants. The relationship is more pronounced in countries with high levels of corruption; grants
seem to substitute for domestic revenue effort, unlike loans presumably because the latter must
be serviced.
This finding is important for a number of highly aid-dependent countries, including at least four
of our five project countries where, as we have seen, grants play a significant role in financing
public expenditure. However, it is not uncontested. Gambaro et al. (2007) found a positive
relationship between aid and tax revenue (using a different data-enlarging sample size) driven by
the role of grants, but only for a shorter and more recent period (1990–2002). The authors
attribute this to new trends in donor–recipient practices including the recent emphasis on
institution building.
On the expenditure side, Moss et al. (2006) cited a number of studies that show a statistically
significant relationship between aid levels and government expenditure. Although it is not
surprising that aid increases government spending, Remmer (2004) found that it may also
decrease domestic revenue generation. Remmer suggested that aid-funded expansion is not
primarily channeled to investment (capital formation) but rather toward consumption, which in
turn may undermine revenue effort and increase dependence. There is some evidence at the
country level that aid may be encouraging fiscal indiscipline, with higher aid levels associated
with increased disparity between projected and actual expenditure (Moss et al. 2006).
Expectation of access to aid seems to erode the discipline of hard budget caps applicable when
countries rely primarily on domestic revenue sources.
What can we take away from this discussion? The most reasonable conclusion is that there is
significant ambiguity in the aid–taxation literature, and conclusions about whether aid has
enhanced or hampered domestic tax mobilization are sensitive to choice of method, sample size,
and data limitations. As we shall see below, our findings are in line with some of the older
literature, showing that the structure of the economy and openness to international trade are
better predictors of taxation than aid. We do not find a statistically significant relationship
between aid and taxation. This is in line with recent evidence such as Di John (2008) and
OECD (2010).
Examining scatterplots of aid as a percentage of GNI versus taxation as a percentage of GDP for
LICs and LMICs by decade (1970s, 1980s, 1990s, and 2000–07), we find that this relationship
changed from being positive to almost flat from the 1970s to the 1990s, and became negative in
recent years. However, we do not know whether these relationships are significant and whether
they have changed within and across regions over time. Note, that if we consider a longer time
period (1972–2008) in the case of sub-Saharan Africa, we obtain a clearer negative relationship
between aid and taxes (Fig. 2). In the case of the full sample of countries (not shown here), the
relationship is virtually flat.
Figure 2. Aid vs. Taxes in sub-Saharan Africa, 1972–2008
The real question is whether these relationships persist when one controls for other determinants
of taxation. A country’s ability to tax is largely based on its level of development and the
structure of its economy. Consequently, in our baseline estimates, we consider GDP per capita,
the contribution of agriculture to GDP, and the degree to which a country is open to trade. In
particular, we expect that countries with higher levels of per capita income are able to draw more
revenue from taxes (as potential taxable income is larger and tax collection systems are more
developed and efficient). Similarly, more open economies can derive higher revenue from taxes
(as goods that cross the border are easier to tax and trade takes place through formal markets).
On the other hand, countries that are heavily dependent on agriculture can be expected to have
lower tax shares as, first, agricultural trade, especially when it is at the subsistence level, takes
place in the informal sector and, second, agriculture is harder to tax than a well-organized
industrial sector.
To examine the robustness of our results, we add additional factors to the baseline specification.
In particular, we consider the rate of inflation, the size of the external debt, and a variable
measuring political regime type. Because high inflation rates are expected to reduce the real
value of taxes collected, one expects to find a negative relationship between these two variables.
In the case of external debt, the ability of countries to borrow and accumulate debt may mean
that they do not have to rely on taxes, especially when political cycles are short. However,
governments may also resort to higher taxes to finance increasing debt burdens. Finally, regime
type is important and one would expect democracies to tax more in exchange for core “public”
goods and accountability. The type of political regime is likely to act as proxy for the
institutional characteristics of countries.3 Except for the latter, which was obtained from the
Polity IV dataset and aid data from the OECD Development Assistance Committee, all other
variables were obtained from the World Development Indicators of the World Bank.
3 Our choice of additional elements is driven not only by theory but for practical reasons having to do with data
availability.
The model that we test takes the following form:
ititit
ititittiit
democracydebtlation
tradeeagriculturaidtax
+++
++++++=
61514
1312110
)ln()ln(inf
)ln()ln()ln(
where i refers to countries, t refers to time and it is the normal disturbance term. All variables
are averaged over four-year periods to smooth year-to-year fluctuations in the data, which is a
standard practice in aid-effectiveness studies. Furthermore, we lagged all independent variables
by one period to reduce the likelihood of endogeneity. In other words, the averages for the
dependent variable are for 1973–76, 1977–80, 1981–84, 1985–88, 1989–92, 1993–96, 1997–
2000, 2001–04, and 2005–08. The corresponding averages for the independent variables are for
1972–75, 1976–79, 1980–83, 1984–87, 1988–91, 1992–95, 1996–99, 2000–03, and 2004–07.
Various options are available to estimate such a model. A naïve approach would be to apply
ordinary least squares, that is, estimate a model with a single constant for all countries, which
assumes that there are no differences between the various cross-sectional units (i.e., an
assumption of strong homogeneity across countries). Other options include estimating the model
with fixed or random effects. Under fixed effects, the constant is treated as country-specific by
including a dummy variable for each country; under random effects, the constant for each
country is treated as a random parameter. As we have an unbalanced panel with limited
observations for some cross-sectional units, one would expect the random effects model to be
more appropriate.4 However, the Hausman test favours the fixed effects model in most cases.
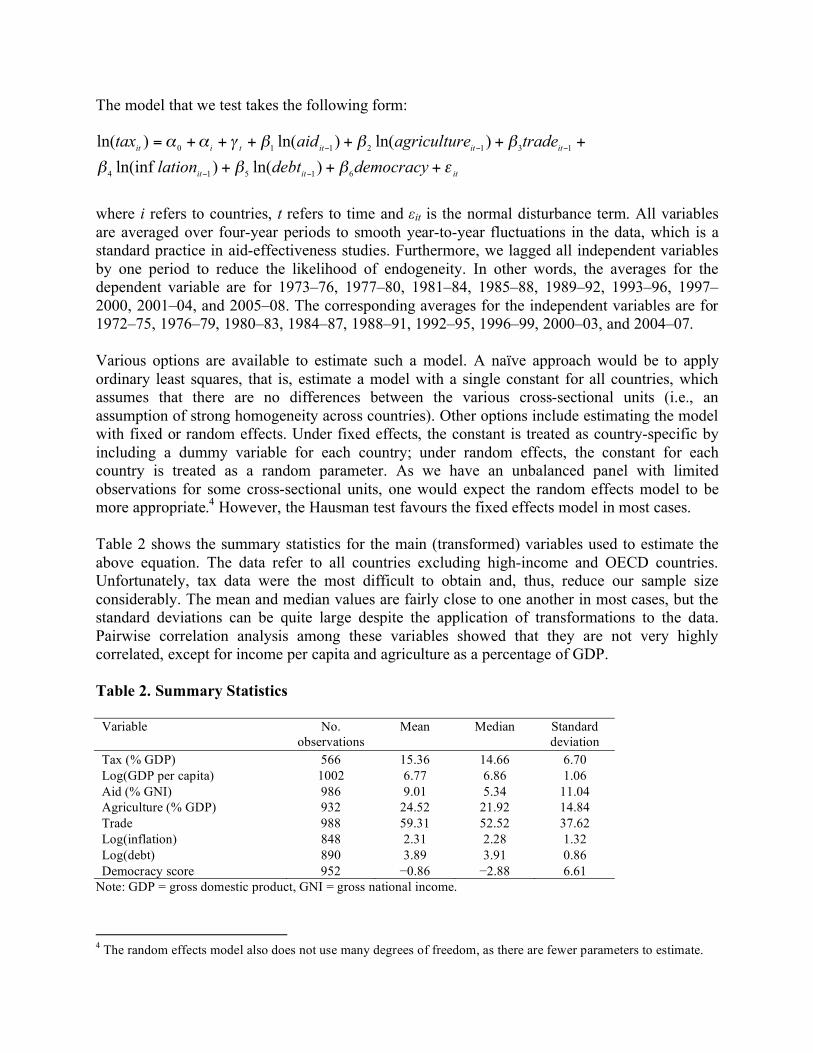
Table 2 shows the summary statistics for the main (transformed) variables used to estimate the
above equation. The data refer to all countries excluding high-income and OECD countries.
Unfortunately, tax data were the most difficult to obtain and, thus, reduce our sample size
considerably. The mean and median values are fairly close to one another in most cases, but the
standard deviations can be quite large despite the application of transformations to the data.
Pairwise correlation analysis among these variables showed that they are not very highly
correlated, except for income per capita and agriculture as a percentage of GDP.
Table 2. Summary Statistics
Variable No.
observations
Mean Median Standard
deviation
Tax (% GDP) 566 15.36 14.66 6.70
Log(GDP per capita) 1002 6.77 6.86 1.06
Aid (% GNI) 986 9.01 5.34 11.04
Agriculture (% GDP) 932 24.52 21.92 14.84
Trade 988 59.31 52.52 37.62
Log(inflation) 848 2.31 2.28 1.32
Log(debt) 890 3.89 3.91 0.86
Democracy score 952 0.86 2.88 6.61
Note: GDP = gross domestic product, GNI = gross national income.
4 The random effects model also does not use many degrees of freedom, as there are fewer parameters to estimate.
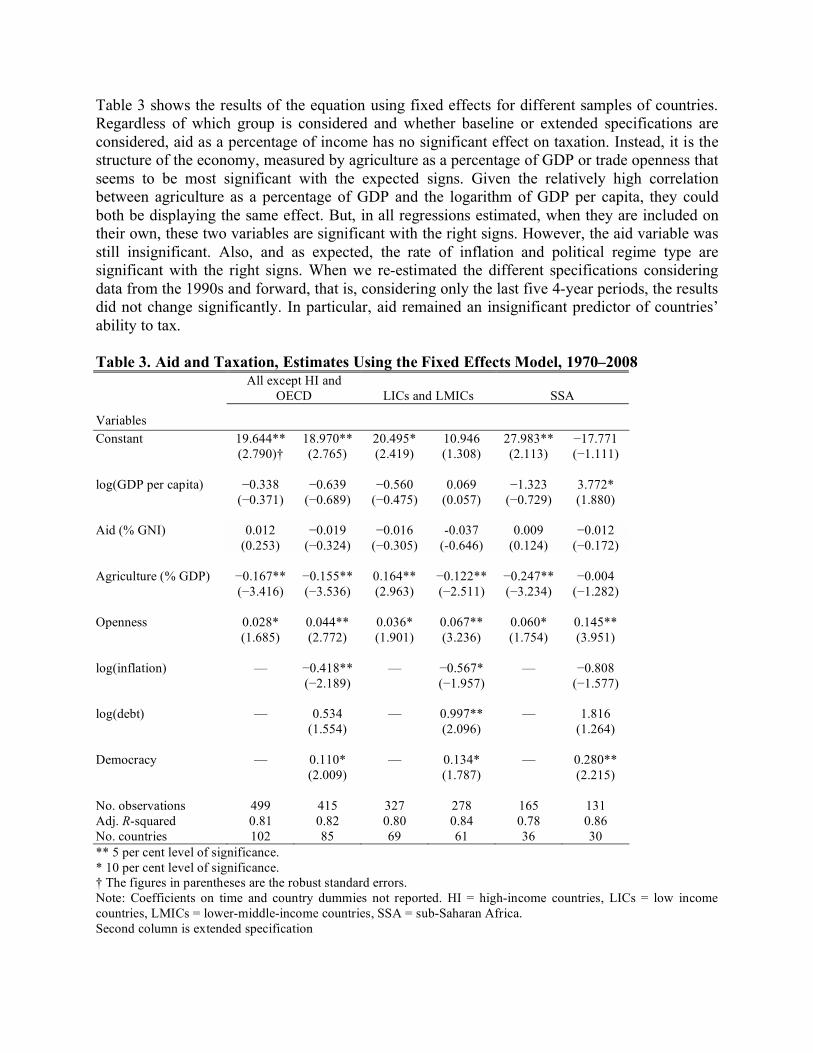
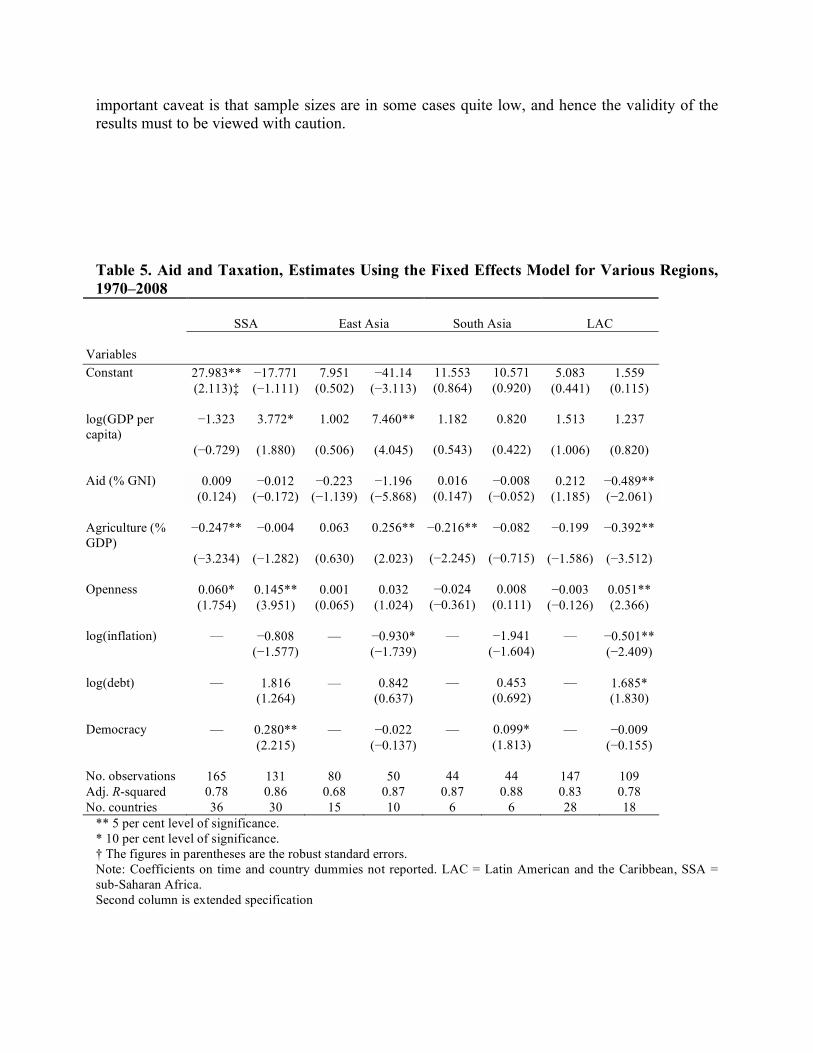
Table 3 shows the results of the equation using fixed effects for different samples of countries.
Regardless of which group is considered and whether baseline or extended specifications are
considered, aid as a percentage of income has no significant effect on taxation. Instead, it is the
structure of the economy, measured by agriculture as a percentage of GDP or trade openness that
seems to be most significant with the expected signs. Given the relatively high correlation
between agriculture as a percentage of GDP and the logarithm of GDP per capita, they could
both be displaying the same effect. But, in all regressions estimated, when they are included on
their own, these two variables are significant with the right signs. However, the aid variable was
still insignificant. Also, and as expected, the rate of inflation and political regime type are
significant with the right signs. When we re-estimated the different specifications considering
data from the 1990s and forward, that is, considering only the last five 4-year periods, the results
did not change significantly. In particular, aid remained an insignificant predictor of countries’
ability to tax.
Table 3. Aid and Taxation, Estimates Using the Fixed Effects Model, 1970–2008 All except HI and
† The figures in parentheses are the robust standard errors.
Note: Coefficients on time and country dummies not reported. LAC = Latin American and the Caribbean, SSA =
sub-Saharan Africa.
Second column is extended specification
Overall, therefore, we do not find a lot of evidence that aid has undermined the ability of
countries to raise revenue through taxation. This result holds when one considers sub-samples
based on income levels, regional groupings, and aid thresholds. What seems to matter most is the
overall structure of the economy, rather than the amount of aid a country receives. Although this
is unsurprising in itself, it is noteworthy that even in regions that have received large amounts of
aid over long periods, such as sub-Saharan Africa, aid does not seem to have a profound effect
on taxation.
More important, we also found no evidence that aid (at the aggregate level) has helped countries
become more self-reliant through for instance increased domestic revenue mobilization. Perhaps
this should be expected as aid is given for many reasons that have nothing to do with improving
the capacity of countries to mobilize resources domestically. Based on our findings, we can
argue that aid could be better targeted to increase DRM. We know from the data that there are
several countries whose dependency on aid has decreased over time, e.g., Algeria, Botswana,
Bangladesh, India, Kenya, Mauritius, South Korea, Thailand, and Tunisia. Among them are
some that have also seen their taxation capacity grow over time. An interesting area for future
research is how and why some countries have made this transition and others have not. This
would help frame expectations regarding “aid exit” in reality (see Box 2 below).
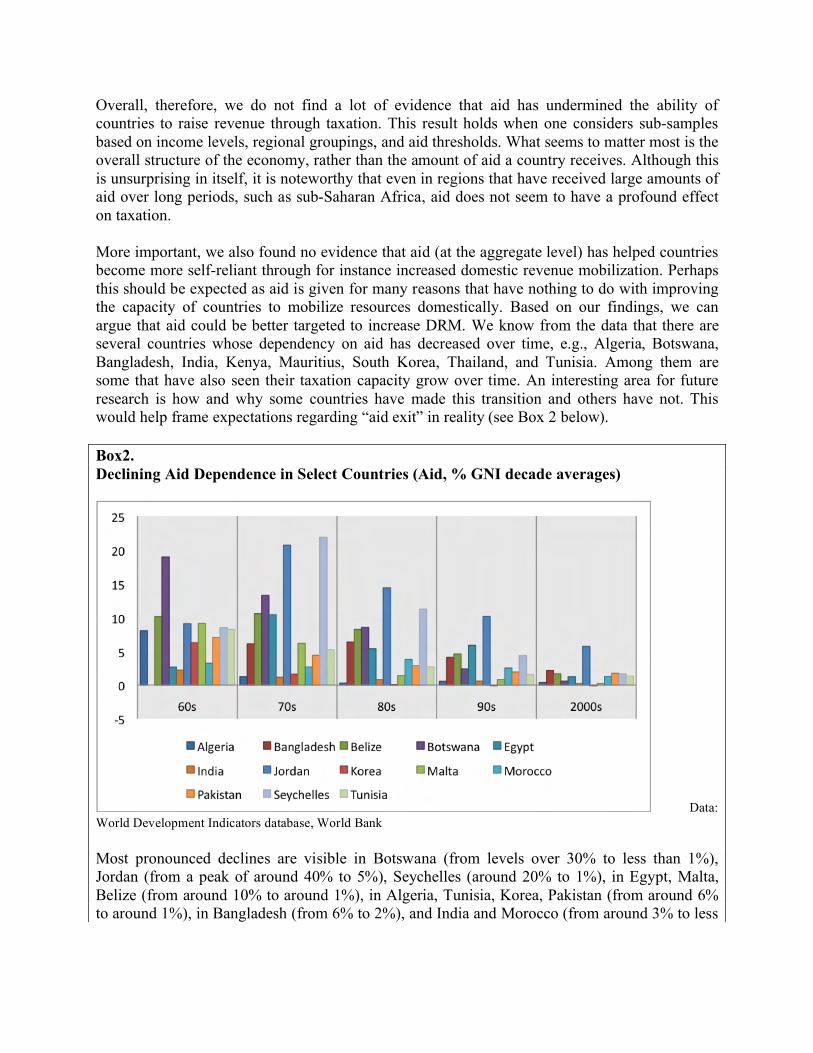
Box2.
Declining Aid Dependence in Select Countries (Aid, % GNI decade averages)
Data:
World Development Indicators database, World Bank
Most pronounced declines are visible in Botswana (from levels over 30% to less than 1%),
Jordan (from a peak of around 40% to 5%), Seychelles (around 20% to 1%), in Egypt, Malta,
Belize (from around 10% to around 1%), in Algeria, Tunisia, Korea, Pakistan (from around 6%
to around 1%), in Bangladesh (from 6% to 2%), and India and Morocco (from around 3% to less
than 1%). More recently the ratio in Kenya (not above) declined from around 15% in the mid-
1990s to 4% as donors withdrew from the country.
Clearly the relatively short list above, from a much larger list of countries that are highly aid
dependant and have remained so for many decades, should inject a healthy dose of realism
regarding expectations of ‘aid-exit’. Even countries that have exited from high reliance on aid
have done so over vast time periods (decades). Relatively well-managed natural resources
receipts explains a no. of those listed above (e.g. Botswana, Algeria, Tunisia), while others
received very high levels of aid at points in their history arguably for strategic reasons beyond
development (e.g. Egypt, Jordan, we could add Israel which received aid around 9% of GNI in
the 70s and 80s, as well as Pakistan).
We are still left with an albeit smaller list however that is harder to explain and where declining
importance of aid has more to do with wider improvement in overall economic performance.
This includes Korea, India, Taiwan (not above), Thailand (not above) and to some extent
Bangladesh.
Interestingly, when we analyzed the ‘aid-taxation’ relationship using a select sample of 12
countries that saw dramatic declines in aid dependence; we found a strong and statistically
significant positive relationship between aid and taxation. However, here too the inverse
relationship with agriculture and positive relationship with trade was more important.
Notwithstanding these, we can say, in countries that witnessed dramatic declines in aid
dependence aid was consistent with tax mobilization. This however remains a tentative finding.
It is biased by a very selective sample. More work is needed to explain why some countries make
the transition from aid dependence to exit, and the precise role DRM (taxation, but also gross
savings and investment) plays in this process.
Conclusion and Policy Recommendations
The findings from our case studies on DRM in Burundi, Cameroon, Ethiopia, Tanzania, and
Uganda, together with our empirical analysis of the relationship between aid and taxation point
to a number of policy recommendations regarding the delivery of aid and coherence across trade,
investment, and aid policies. By definition, much of the challenge of enhancing the role of
domestic resources rests with national policymakers, the domestic private sector, and citizens
more broadly. However, external resources, such as aid, foreign direct investment, remittances,
and export earnings, play an important role in each of our case study countries and, given the
very low levels of domestic fiscal resources, aid in particular can be expected to play an
important role in these countries for the foreseeable future (see Box 1). Thus expectations
regarding aid exit must be reasonable. In this concluding section, we focus on how donors can
further support DRM in sub-Saharan Africa.
Much effort has already gone into enhancing the capacity of sub-Saharan Africa tax authorities
and administrations in specific cases, yet there is room to do more. Given the challenges that
countries in the region face in collecting taxes and mobilizing resources domestically, there is
need for better cooperation across jurisdictions and efforts to repatriate capital that leaves them.
Donors can help by supporting strategies aimed at expanding and diversifying domestic revenue
bases, for example by helping countries exploit the revenue potential of new taxes and better
harnessing that of the natural resource sectors. Building infrastructure in the financial sector —
credit reference bureaus, registries — and supporting the development of local capital markets
are further avenues that remain underexplored and could have significant payoff.
Greater Coherence and Coordination of Efforts: First and foremost, donors must see their
role as more than simply channeling aid. Donors and aid priorities are part of a wider set of
issues that affect the relation between the international community and sub-Saharan Africa
countries. Before “doing good,” donors would do well to ensure that they are doing no harm.
This means more coherence across trade, investment, and development cooperation objectives
and policies. An obvious starting point is a more rational approach to trade liberalization and
tariff reduction in sub-Saharan Africa countries that rely heavily on trade taxes. In many cases,
expectations regarding LICs’ ability to replace revenues lost through tariff reduction have been
too optimistic. Therefore, donors could start by ensuring that their trade and investment policies
create a climate in which DRM can be enhanced.
Clearly, there is scope for a more coherent and better coordinated approach to taxation and
development across the international community. A recent mapping exercise by the International
Tax Compact found multiple donor agencies working on tax-related issues at the same time in
the same countries, while other countries were not supported at all (ITC 2010). Although there
was intensive donor engagement in some countries, such as Tanzania, 17 out of 53 African
countries were not receiving long-lasting tax-related assistance. Donor engagement was weaker
in Africa (the continent with lowest tax-to-GDP levels) than in Asia, and Central and South
America. The survey noted that better division of labour across donor agencies could encourage
in-depth engagement and extend coverage to regions not well covered at the moment.
Exemptions on Donor-Funded Goods and Services: An area where donors could lead by
example is tax exemptions on aid-funded goods and services, which are significant in many sub-
Saharan Africa countries. Donors rarely pay taxes on imported cars, other goods, and rental
properties or contribute to local taxes. Yet, in some cases, donor presence creates sub-economies
that represent a large sphere of commercial activity. This results in preferential treatment,
exacerbates a culture of exemptions, and creates opportunities for corruption. Waiving such
exemptions and complying voluntarily with local tax regulations could send an important signal
to domestic elites and tax authorities.
International Tax Cooperation and Development: The international tax cooperation agenda is
intimately linked to development. This is an area where Africa’s interests align with those of the
wider international community. More exchange of tax information and more cooperation
agreements could be a starting point for strengthening tax capacity (surveillance, administration,
and policymaking) in sub-Saharan Africa. Increasing transparency and deepening the quality of
information exchange across tax jurisdictions are priorities, especially in light of the global
financial crisis.
Africa’s huge losses to capital flight far predate the crisis. The Global Financial Integrity report
estimated illicit capital flight from Africa from 1970 to 2008 at a staggering USD 854 billion,
over twice the amount of overseas development assistance during the same period. This makes
the poorest region of the world a net creditor to the rest of the world. Reversing even a small
percentage of this perverse flow could have a substantial impact on DRM in the region.
Coalescing interests around international tax cooperation and development is an obvious starting
point, and the European Commission’s recent communication on tax and development is a
welcome political step in this direction (EC 2010).
International initiatives, information-sharing platforms, non-governmental and civil society
organizations, and research institutes are already playing a key role in the fight against tax
evasion and avoidance. Good examples of such efforts include the Extractive Industries
Transparency Initiative, Tax Justice Network, International Tax Dialogue, and International Tax
Compact. Donors, as well as domestic policy communities in Africa, can make greater use of
these initiatives in support of DRM and greater transparency and accountability to citizens more
generally.
A good example of alignment of donor and sub-Saharan Africa priorities on taxation is the
recently established African Tax Administration Forum. Launched in November 2009, this
forum brings together 25 African revenue authorities with a shared conviction that “efficient and
effective tax administration is key to building capable states” (ATAF 2009). The forum will
provide peer support for increasing the capacity and integrity of African revenue authorities, as
well as a platform for more coherent donor engagement.
Multifaceted Support for Tax Administration and Policy: The potential payoff from
supporting DRM in Africa is high. It is estimated that aid aimed at stimulating public resource
mobilization can have up to a 10-fold effect on DRM in African countries. Yet, technical
cooperation in “public-sector financial management” in sub-Saharan Africa accounts for only
about 2 per cent of total technical cooperation (AEO 2010). Clearly there is much room for
improvement. (For a brief summary of donor engagement in tax-related capacity building and
other technical assistance across our five project countries see Appendix 1.)
Potential returns to investment in building tax capacity (hardware, but, more important,
organizational support, skills training, and legal support to make tax codes more user-friendly)
are large. Two specific areas donors could make a useful contribution are providing independent
monitoring of the implementation of reforms policymakers have committed to undertaking, and
building surveillance and investigative capacity to step up anti-corruption efforts. Such support
needs to be multifaceted. What we describe so far are supply-side measures but enhancing the
demand-side is equally important. For instance, donors could help enhance the capacity of
domestic policy communities that are working on taxation. This would make technical
cooperation more demand driven and, thus, more in line with country priorities. Taxpayer
education is vital in creating informed bargaining and negotiation around tax issues and central
to democratic governance. Ultimately, such multipronged capacity building would enable sub-
Saharan Africa countries to forge a meaningful social contract with taxpayers. The goal of such
efforts must be to create a virtuous link between enhanced mobilization and more accountable
expenditure. One way to do this is to reduce ‘fiscal distance’, such that revenues mobilized are
spent directly on the people or communities they are mobilized from (see the example of
property taxation below). Forging such a virtuous link also entails recognizing that in many cases
people see the tax authorities as illegitimate and there are major power imbalances between for
instance authority wielded by tax assessors and citizen’s awareness of their rights as taxpayers.
Bridging these imbalances requires viewing tax reform in a broader perspective including the
interplay between tax authorities and other institutions such as the auditor general and judiciary.
These bodies can ensure there is adequate access to information about revenue collection and
mechanisms to redress grievances.
At the country level, there have been successes in terms of donor engagement on taxation in
sub-Saharan Africa that lend credence to renewing donor support for broad-based tax capacity
building; the United Kingdom’s efforts in Rwanda and German work in Ghana are good
examples. In each case, a high degree of local ownership was an important factor in
ensuring success.
Broadening the Revenue Base: Most sub-Saharan African countries rely on a narrow base of
taxes. In some cases (such as resource-rich countries), a handful of taxes dominate the fiscal mix.
Enhancing DRM in most countries implies looking for new types of taxes and diversifying the
revenue base. However systematic application of and revenue generation from new taxes is
predicated on the existence of basic taxpayer infrastructure. Donors can play a valuable role
in this regard.
Property taxes are a good example. Currently, property taxes represent the greatest potential
source of revenue in several sub-Saharan Africa countries, and there is heated debate regarding
the need for greater fiscal decentralization. Although decentralization, no doubt, has merit, one
of the common findings across countries is the lack of capacity and lack of resources at the sub-
regional and municipal levels. To exploit the potential of property taxes, concerted efforts aimed
at building land registries and carrying out local censuses are prerequisites. Donors could
sponsor such efforts as part of their support for DRM.
Building Information Infrastructure in Financial Markets: Similarly, on the private
mobilization side, donors could play a major role in building financial-sector infrastructure. A
case in point is credit reference bureaus. At less than 7% of adults covered by either public or
private credit reference bureaus sub-Saharan Africa lags other regions (East Asia 22%; Latin
America 43%; OECD 68%) by some distance. Lack of reliable credit information is one of the
primary reasons cited by most banks (public, private, and foreign) in sub-Saharan Africa for their
inability to extend credit to individuals, entrepreneurs, and small and micro enterprises. Building
credit bureaus and creating creditor databases is partly an infrastructure issue and one that
requires up-front investment — in information technology, management, and training as well as
financial literacy. Donors could help initiate, or at least underwrite, the outlays required to get
the process going. Lack of economies of scale is a key reason for slow progress in this area. A
regional ‘hub-and-spoke’ approach, which has proven successful in Central America, could be
one way of getting around this problem in sub-Saharan Africa (Mylenko 2007). As is the
experience in other regions this would also require government leadership in getting banks to
cooperate by sharing credit information across the system.
Land and property registration, as described above, is also a prerequisite for the development of
a coherent house financing system and mortgage markets. As in developed and emerging
economies, housing finance is a key component of deep and long-term credit market. Therefore,
investing in infrastructure linked to land and property registration could have a dual payoff if, in
the long run, it is able to stimulate the development of homegrown mortgage markets. Deep and
long-term-oriented domestic capital markets are ultimately crucial to self-sustained DRM.
In a similar vein, donors could assist in appropriate design and development of pension systems
and, where appropriate, pension reform. It is widely believed across the region that pension
systems are a major untapped source of long-term financing due to numerous investment
restrictions and, in some cases, outdated regulations. However, as this has proved a controversial
area in other regions (like Latin America) donors must work very closely with local stakeholders.
Better Harnessing and Management of Resource-related Revenues: Several sub-Saharan
Africa countries are now benefiting significantly from resource rents, and new players, such as
Ghana and Uganda, are soon expected to join the ranks of resource-rich economies.
Transparency in the resources sector has, thus, never been more important, especially with
increasing competition for Africa’s resources from rapidly emerging economies, such as China
and India.
Donors can play a constructive role in helping sub-Saharan Africa countries better harness and
manage their resource revenue potential. First, they could pressure their own mining companies
to make fair deals with sub-Saharan Africa counterparts, including appropriate provisions for
reviewing royalty- and revenue-sharing mechanisms if commodity prices move suddenly (either
up or down). Many sub-Saharan Africa countries have been repeatedly short-changed and have
lost out on revenue benefits from commodity price upswings, thanks in part to dated and
inflexible contracts.
Second, donor countries can require their mining companies to report revenues on a detailed,
country-by-country basis. This would increase transparency and be consistent with international
tax cooperation and information exchange efforts. That said, transparency in this arena needs to
go well beyond sharing profit and revenue information. Natural resource extraction has a huge
social, environmental, and human impact. Given the asymmetries between large mining
companies whose balance sheets are often larger than the GDP of the African countries they
operate in, as well as the asymmetries between governments and local populations directly
affected by mining, it is incumbent on donors to take strong steps to support sub-Saharan Africa
civil society, academic, and other policy communities working on resource-related issues.
Donors could also build geological capacity, which is often lacking in sub-Saharan African
resource ministries and, thus, the reason resource potential is not appropriately harnessed
(Di John 2008).
Finally, donors could assist sub-Saharan Africa countries in the development of appropriate
financial structures, such as stabilization funds, to facilitate a more development friendly and
equitable outcome for Africa’s vast resource wealth.
Tapping the Informal Economy: The presence of large and growing informal and semi-formal
sectors in most sub-Saharan Africa countries is a serious challenge to DRM. Over the years, a
diverse array of strategies, such as presumptive and turnover taxation, has attempted to tap the
informal sector. Despite a range of experiences, the general consensus is that cost outlays are not
worth the benefits, either in terms of revenues mobilized or tax-base information gained. Here,
donors could join with sub-Saharan Africa governments, civil society, and other stakeholders to
address the difficulties arising from the predominance of the informal and semi-formal sectors in
most countries.
Instead of viewing the vast majority of productive economic activity that takes place informally
as a problem, one could see the informal sectors as the most dynamic parts of the economy. A
new approach could be to target the sector, not with the aim of increasing revenue mobilization,
but to learn more about informal economy dynamics and, in the long run, facilitate a transition to
the formal economy. A good place to start would be a basic form of small business and micro-
enterprise registration. Here again, donors could play a vital role in underwriting setup costs and
supporting necessary infrastructure.
One of the basic hurdles countries face is the lack of necessary information on small businesses
and the entrepreneurial dynamic. Building capacity to collect, analyze, and disseminate such
information is a key component of DRM. Extending credit and drawing revenue are only
possible once this basic informational architecture is in place and, thus, it requires the collective
efforts of donors, African governments, and local stakeholders.
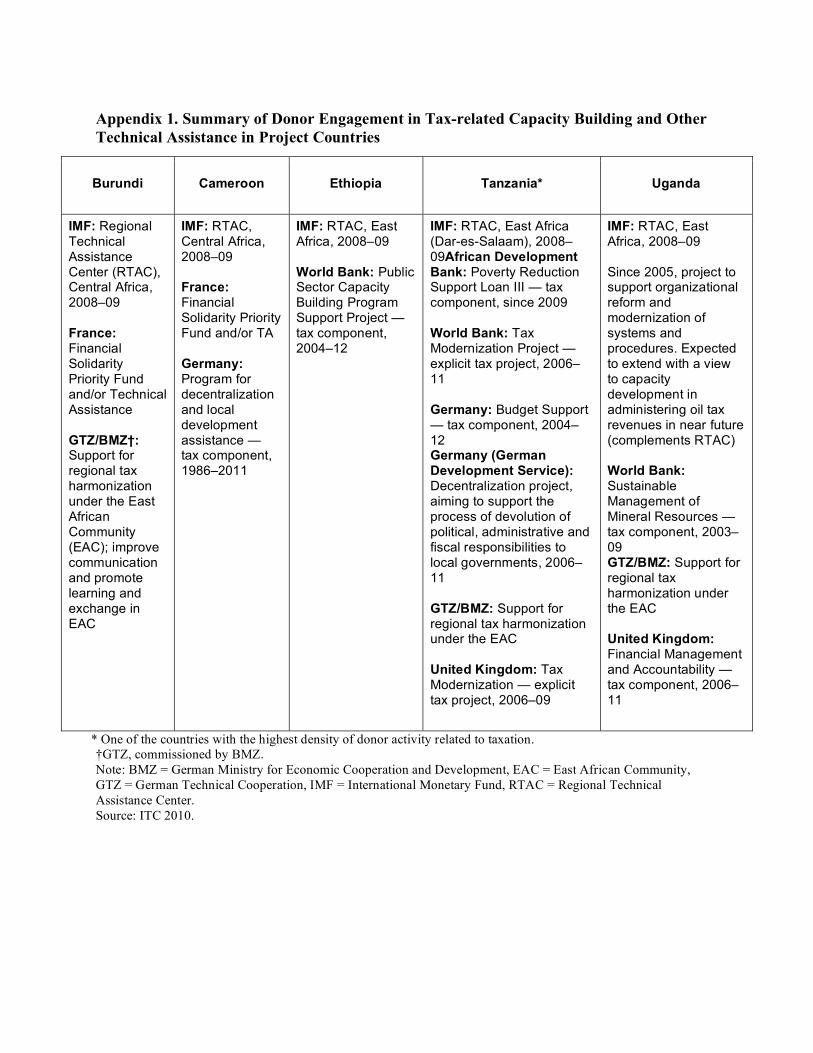
Appendix 1. Summary of Donor Engagement in Tax-related Capacity Building and Other
Technical Assistance in Project Countries
* One of the countries with the highest density of donor activity related to taxation.
†GTZ, commissioned by BMZ.
Note: BMZ = German Ministry for Economic Cooperation and Development, EAC = East African Community,
GTZ = German Technical Cooperation, IMF = International Monetary Fund, RTAC = Regional Technical
Assistance Center.
Source: ITC 2010.
Burundi
Cameroon
Ethiopia
Tanzania*
Uganda
IMF: Regional Technical Assistance Center (RTAC), Central Africa, 2008–09 France: Financial Solidarity Priority Fund and/or Technical Assistance GTZ/BMZ†: Support for regional tax harmonization under the East African Community (EAC); improve communication and promote learning and exchange in EAC
IMF: RTAC, Central Africa, 2008–09 France: Financial Solidarity Priority Fund and/or TA Germany: Program for decentralization and local development assistance — tax component, 1986–2011
IMF: RTAC, East Africa, 2008–09 World Bank: Public Sector Capacity Building Program Support Project — tax component, 2004–12
IMF: RTAC, East Africa (Dar-es-Salaam), 2008–09African Development Bank: Poverty Reduction Support Loan III — tax component, since 2009 World Bank: Tax Modernization Project — explicit tax project, 2006–11 Germany: Budget Support — tax component, 2004–12 Germany (German Development Service): Decentralization project, aiming to support the process of devolution of political, administrative and fiscal responsibilities to local governments, 2006–11 GTZ/BMZ: Support for regional tax harmonization under the EAC United Kingdom: Tax Modernization — explicit tax project, 2006–09
IMF: RTAC, East Africa, 2008–09 Since 2005, project to support organizational reform and modernization of systems and procedures. Expected to extend with a view to capacity development in administering oil tax revenues in near future (complements RTAC) World Bank: Sustainable Management of Mineral Resources — tax component, 2003–09 GTZ/BMZ: Support for regional tax harmonization under the EAC United Kingdom: Financial Management and Accountability — tax component, 2006–11
References
AEO (African Economic Outlook). Innovation in information and communications technologies. AEO; 2009.
______. Public resource mobilization and aid in Africa. AEO; 2010.
Aitingi-Ego, Michael. Budget support, aid dependency, and Dutch disease: the case of Uganda. In Koeberle, Stefan,
Zoran Stavreski, and Jan Walliser (editors). Budget support as more effective aid? recent experiences and emerging
lessons. Washington, DC: World Bank; 2006.
Alesina, Alberto, and Beatrice Weder. Do corrupt governments receive less foreign aid? American Economic
Review 2002, 92(4).
Arndt, Channing, Sam Jones, and Finn Tarp. Aid and growth: have we come full circle? Tokyo: United Nations