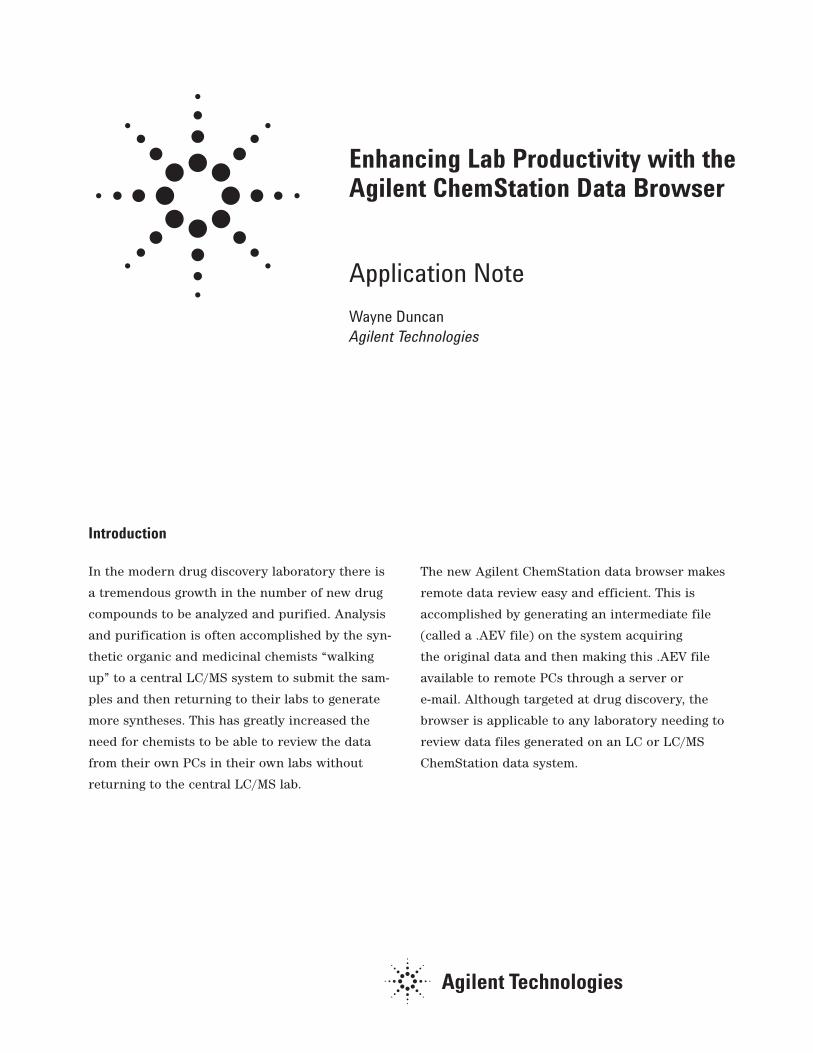
Introduction In the modern drug discovery laboratory there is a tremendous growth in the number of new drug compounds to be analyzed and purified. Analysis and purification is often accomplished by the syn- thetic organic and medicinal chemists “walking up” to a central LC/MS system to submit the sam- ples and then returning to their labs to generate more syntheses. This has greatly increased the need for chemists to be able to review the data from their own PCs in their own labs without returning to the central LC/MS lab. Enhancing Lab Productivity with the Agilent ChemStation Data Browser Application Note Wayne Duncan Agilent Technologies The new Agilent ChemStation data browser makes remote data review easy and efficient. This is accomplished by generating an intermediate file (called a .AEV file) on the system acquiring the original data and then making this .AEV file available to remote PCs through a server or e-mail. Although targeted at drug discovery, the browser is applicable to any laboratory needing to review data files generated on an LC or LC/MS ChemStation data system.
Transcript
Introduction
In the modern drug discovery laboratory there is
a tremendous growth in the number of new drug
compounds to be analyzed and purified. Analysis
and purification is often accomplished by the syn-
thetic organic and medicinal chemists “walking
up” to a central LC/MS system to submit the sam-
ples and then returning to their labs to generate
more syntheses. This has greatly increased the
need for chemists to be able to review the data
from their own PCs in their own labs without
returning to the central LC/MS lab.
Enhancing Lab Productivity with theAgilent ChemStation Data Browser
Application Note
Wayne DuncanAgilent Technologies
The new Agilent ChemStation data browser makes
remote data review easy and efficient. This is
accomplished by generating an intermediate file
(called a .AEV file) on the system acquiring
the original data and then making this .AEV file
available to remote PCs through a server or
e-mail. Although targeted at drug discovery, the
browser is applicable to any laboratory needing to
review data files generated on an LC or LC/MS
ChemStation data system.
2
Enhancing Lab Productivity with the Agilent ChemStation Data Browser
Agilent Technologies
Primary Functionality of the Data Browser
The main use of the browser in the drug discoverylaboratory is to answer the following question asquickly as possible for a large number of samples:
Did I make the expected compound and, if so, atapproximately what purity level?
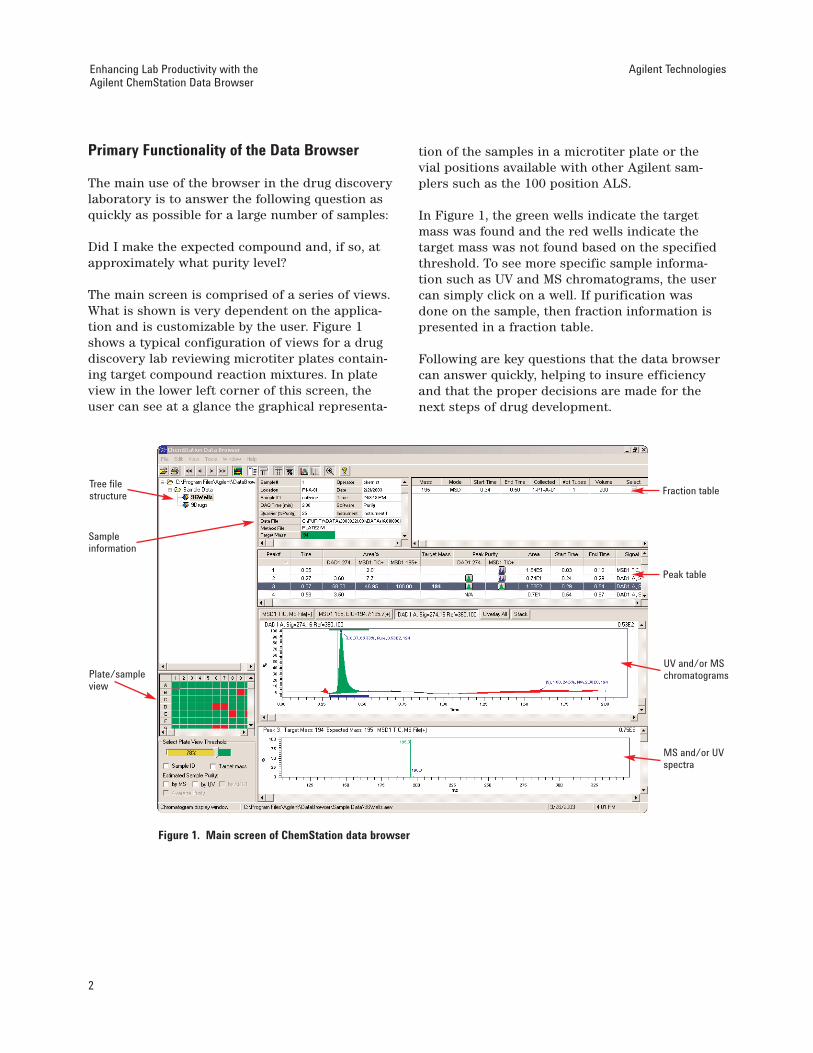
The main screen is comprised of a series of views.What is shown is very dependent on the applica-tion and is customizable by the user. Figure 1shows a typical configuration of views for a drugdiscovery lab reviewing microtiter plates contain-ing target compound reaction mixtures. In plateview in the lower left corner of this screen, theuser can see at a glance the graphical representa-
Figure 1. Main screen of ChemStation data browser
tion of the samples in a microtiter plate or thevial positions available with other Agilent sam-plers such as the 100 position ALS.
In Figure 1, the green wells indicate the targetmass was found and the red wells indicate thetarget mass was not found based on the specifiedthreshold. To see more specific sample informa-tion such as UV and MS chromatograms, the usercan simply click on a well. If purification wasdone on the sample, then fraction information ispresented in a fraction table.
Following are key questions that the data browsercan answer quickly, helping to insure efficiencyand that the proper decisions are made for thenext steps of drug development.
Peak table
UV and/or MSchromatograms
MS and/or UVspectra
Tree filestructure
Plate/sampleview
Sampleinformation
Fraction table
3
Using the ExpandedEnhancing Lab Productivity with the Agilent ChemStation Data Browser
Agilent Technologies
Is This Peak Pure Or Are There Co-ElutingCompounds?
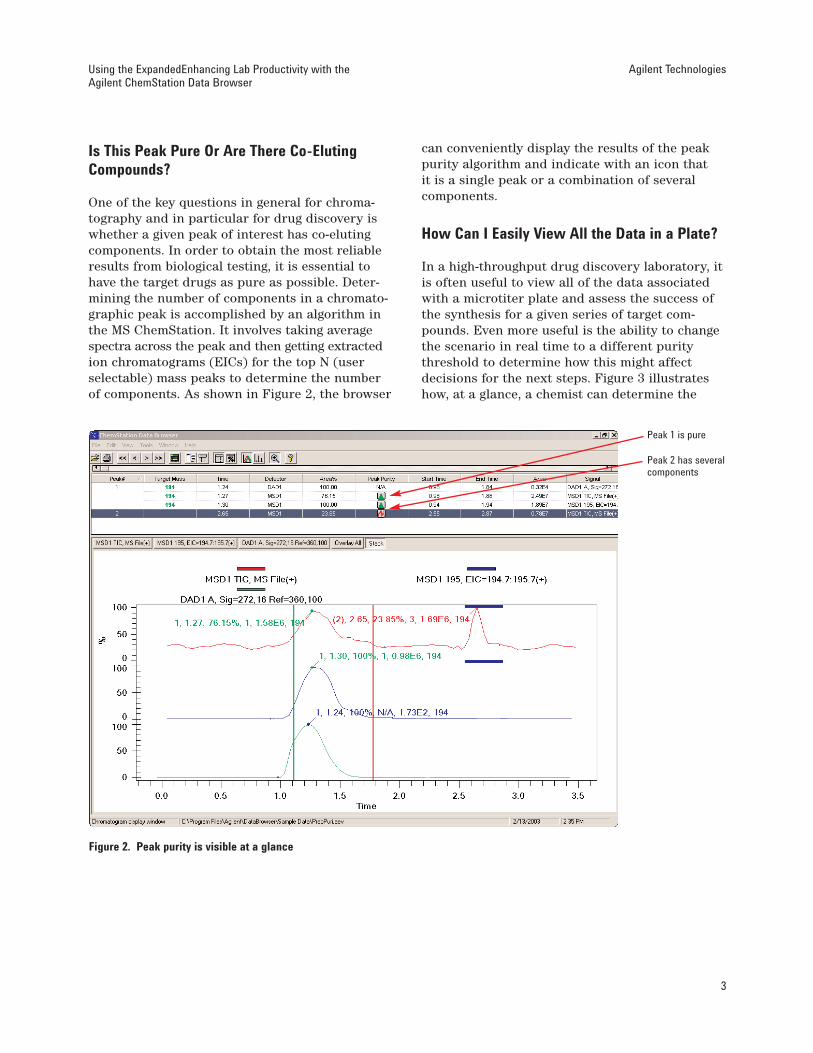
One of the key questions in general for chroma-tography and in particular for drug discovery iswhether a given peak of interest has co-elutingcomponents. In order to obtain the most reliableresults from biological testing, it is essential tohave the target drugs as pure as possible. Deter-mining the number of components in a chromato-graphic peak is accomplished by an algorithm inthe MS ChemStation. It involves taking averagespectra across the peak and then getting extractedion chromatograms (EICs) for the top N (userselectable) mass peaks to determine the numberof components. As shown in Figure 2, the browser
Figure 2. Peak purity is visible at a glance
Peak 1 is pure
Peak 2 has several components
can conveniently display the results of the peakpurity algorithm and indicate with an icon that it is a single peak or a combination of severalcomponents.
How Can I Easily View All the Data in a Plate?
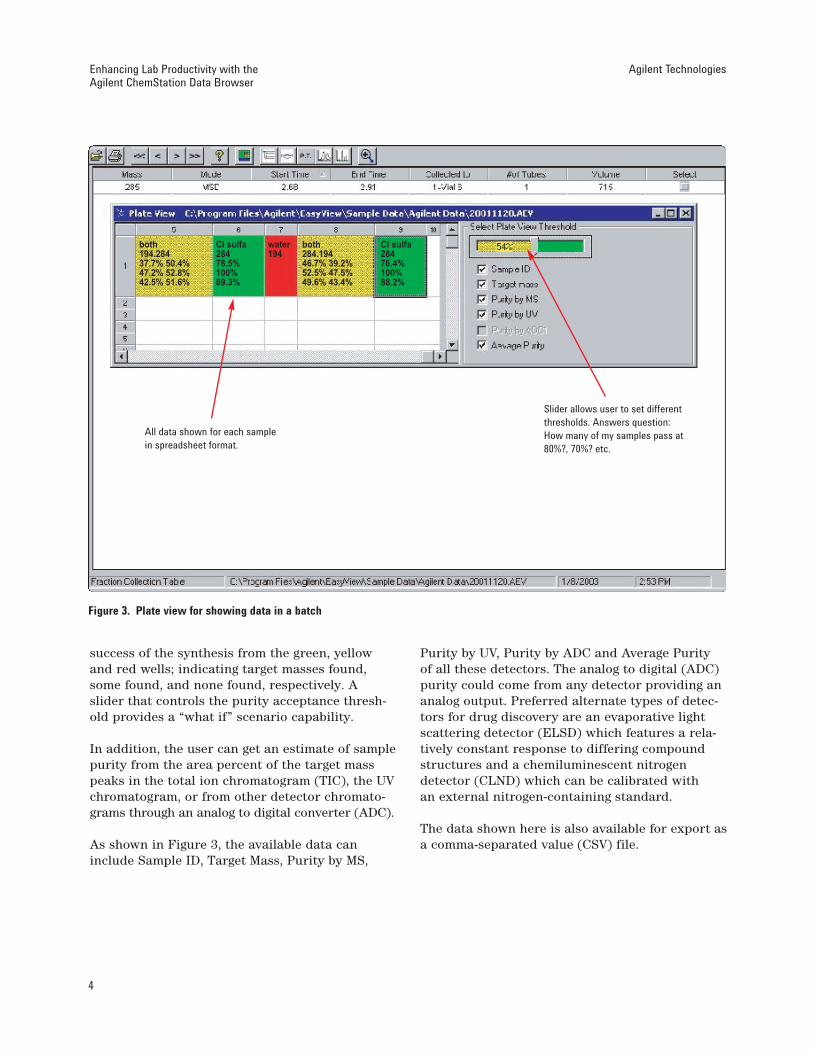
In a high-throughput drug discovery laboratory, itis often useful to view all of the data associatedwith a microtiter plate and assess the success ofthe synthesis for a given series of target com-pounds. Even more useful is the ability to changethe scenario in real time to a different puritythreshold to determine how this might affectdecisions for the next steps. Figure 3 illustrateshow, at a glance, a chemist can determine the
4
Enhancing Lab Productivity with the Agilent ChemStation Data Browser
Agilent Technologies
both194.28437.7% 50.4%47.2% 52.8%42.5% 51.6%
both284.19446.7% 39.2%52.5% 47.5%49.6% 43.4%
Cl sulfa28478.5%100%89.3%
Cl sulfa28476.4%100%88.2%
water194
Figure 3. Plate view for showing data in a batch
All data shown for each samplein spreadsheet format.
Slider allows user to set differentthresholds. Answers question:How many of my samples pass at80%?, 70%? etc.
success of the synthesis from the green, yellowand red wells; indicating target masses found,some found, and none found, respectively. A slider that controls the purity acceptance thresh-old provides a “what if” scenario capability.
In addition, the user can get an estimate of samplepurity from the area percent of the target masspeaks in the total ion chromatogram (TIC), the UVchromatogram, or from other detector chromato-grams through an analog to digital converter (ADC).
As shown in Figure 3, the available data caninclude Sample ID, Target Mass, Purity by MS,
Purity by UV, Purity by ADC and Average Purity of all these detectors. The analog to digital (ADC)purity could come from any detector providing ananalog output. Preferred alternate types of detec-tors for drug discovery are an evaporative lightscattering detector (ELSD) which features a rela-tively constant response to differing compoundstructures and a chemiluminescent nitrogendetector (CLND) which can be calibrated with an external nitrogen-containing standard.
The data shown here is also available for export asa comma-separated value (CSV) file.
5
Using the ExpandedEnhancing Lab Productivity with the Agilent ChemStation Data Browser
Agilent Technologies
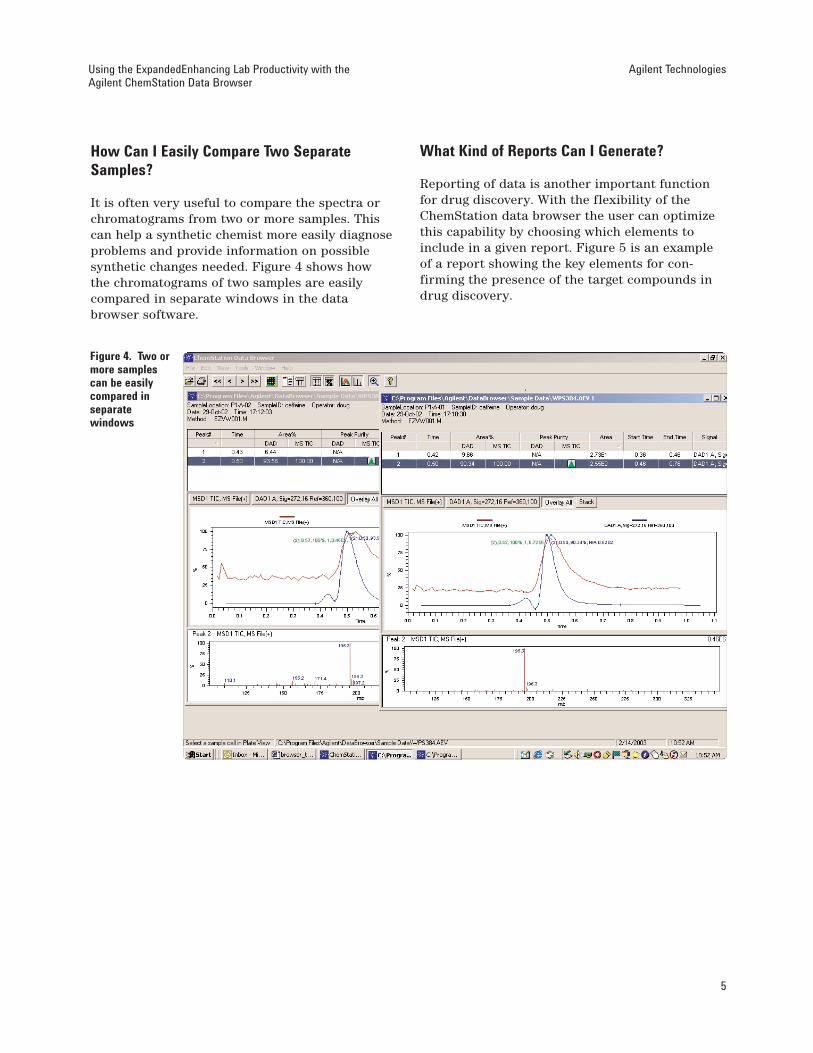
How Can I Easily Compare Two Separate Samples?
It is often very useful to compare the spectra orchromatograms from two or more samples. Thiscan help a synthetic chemist more easily diagnoseproblems and provide information on possiblesynthetic changes needed. Figure 4 shows how the chromatograms of two samples are easilycompared in separate windows in the databrowser software.
Figure 4. Two ormore samplescan be easilycompared inseparatewindows
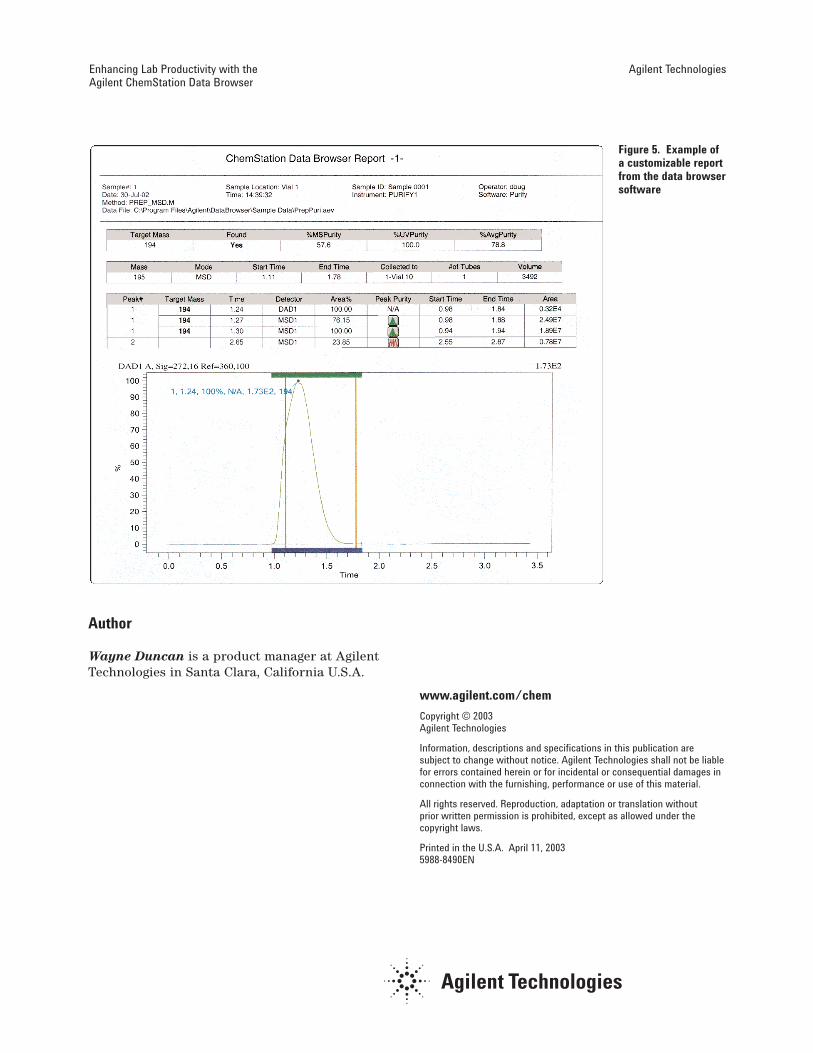
What Kind of Reports Can I Generate?
Reporting of data is another important functionfor drug discovery. With the flexibility of theChemStation data browser the user can optimizethis capability by choosing which elements toinclude in a given report. Figure 5 is an exampleof a report showing the key elements for con-firming the presence of the target compounds indrug discovery.
Author
Wayne Duncan is a product manager at AgilentTechnologies in Santa Clara, California U.S.A.
Information, descriptions and specifications in this publication aresubject to change without notice. Agilent Technologies shall not be liablefor errors contained herein or for incidental or consequential damages inconnection with the furnishing, performance or use of this material.
All rights reserved. Reproduction, adaptation or translation without prior written permission is prohibited, except as allowed under thecopyright laws.
Printed in the U.S.A. April 11, 20035988-8490EN
Enhancing Lab Productivity with the Agilent ChemStation Data Browser
Agilent Technologies
Figure 5. Example ofa customizable reportfrom the data browsersoftware