1 Enhancing Musical Experience for the Hearing-impaired using Visual and Haptic Displays Suranga Chandima Nanayakkara National University of Singapore Lonce Wyse National University of Singapore S. H. Ong National University of Singapore Elizabeth A. Taylor National University of Singapore RUNNING HEAD: ENHANCING MUSICAL EXPERIENCE FOR THE DEAF Corresponding Author’s Contact Information: [email protected]Brief Authors’ Biographies: Suranga Chandima Nanayakkara is interested in developing multisensory, tangible, intelligent interfaces that would enable people to interact with the environment seamlessly; during the time of writing this paper, he was a Research Scholar at National University of Singapore (NUS), and then a Postdoctoral Associate at the Fluid Interfaces Group, MIT Media Lab, now he is an Assistant Professor at the Singapore University of Technology and Design. Lonce Wyse is an interdisciplinary media researcher specializing in sound and music; he is an Associate Professor in the Communications and New Media Programme at NUS, and Director of the Arts and Creativity Laboratory in the Interactive and Digital Media Institute. S H Ong’s research interest encompasses signal and image processing; he is an Associate Professor in the Department of Electrical and Computer Engineering and the Division of Bioengineering, NUS. Elizabeth Taylor’s multi-disciplinary research experience includes biomedical science, bioacoustics and sensory perception in underwater and terrestrial environments; she heads the Marine Mammal Research Laboratory at the Tropical Marine Science Institute, NUS.
Transcript
1
Enhancing Musical Experience for the Hearing-impaired using
Visual and Haptic Displays
Suranga Chandima Nanayakkara
National University of Singapore
Lonce Wyse
National University of Singapore
S. H. Ong
National University of Singapore
Elizabeth A. Taylor
National University of Singapore
RUNNING HEAD: ENHANCING MUSICAL EXPERIENCE FOR THE DEAF
Suranga Chandima Nanayakkara is interested in developing multisensory, tangible, intelligent interfaces that would enable people to interact with the environment seamlessly; during the time of writing this paper, he was a Research Scholar at National University of Singapore (NUS), and then a Postdoctoral Associate at the Fluid Interfaces Group, MIT Media Lab, now he is an Assistant Professor at the Singapore University of Technology and Design. Lonce Wyse is an interdisciplinary media researcher specializing in sound and music; he is an Associate Professor in the Communications and New Media Programme at NUS, and Director of the Arts and Creativity Laboratory in the Interactive and Digital Media Institute. S H Ong’s research interest encompasses signal and image processing; he is an Associate Professor in the Department of Electrical and Computer Engineering and the Division of Bioengineering, NUS. Elizabeth Taylor’s multi-disciplinary research experience includes biomedical science, bioacoustics and sensory perception in underwater and terrestrial environments; she heads the Marine Mammal Research Laboratory at the Tropical Marine Science Institute, NUS.
2
ABSTRACT
This paper addresses the broad question of understanding whether and how a combination of tactile and visual information could be used to enhance the experience of music by the hearing-impaired. Initially, a background survey was conducted with hearing-impaired people to find out the techniques they used to ‘listen’ to music and how their listening experience might be enhanced. Information obtained from this survey and feedback received from two profoundly deaf musicians were used to guide the initial concept of exploring haptic and visual channels to augment a musical experience.
The proposed solution consisted of a vibrating ‘Haptic Chair’ and a computer display of informative visual effects. The Haptic Chair provided sensory input of vibrations via touch by amplifying vibrations produced by music. The visual display transcoded sequences of information about a piece of music into various visual sequences in real-time. These visual sequences initially consisted of abstract animations corresponding to specific features of music such as beat, note onset, tonal context and so forth. In addition, since most people with impaired hearing place emphasis on lip-‐reading and body gestures to help understand speech and other social interactions, their experiences were explored when they were exposed to human gestures corresponding to musical input.
Rigorous user studies with hearing-impaired participants suggested that musical representation for the hearing-impaired should focus on staying as close to the original as possible, and is best accompanied by conveying the physics of the representation via an alternate channel of perception. All the hearing-impaired users preferred either the Haptic Chair alone or the Haptic Chair accompanied by a visual display. These results were further strengthened by the fact that user satisfaction was maintained even after continuous use of the system over a period of three weeks. One of the comments received from a profoundly deaf user when the Haptic Chair was no longer available (“I am going to be deaf again”), poignantly expressed the level of impact it had made.
The system described in this paper has the potential to be a valuable aid in speech therapy and a user study is being carried out to explore the effectiveness of the Haptic Chair for this purpose. It is also expected that the concepts presented in this paper would be useful in converting other types of environmental sounds into a visual display and/or a tactile input device that might, for example, enable a deaf person to hear a doorbell ring, footsteps approaching from behind, a person calling them, or to make understanding conversations or watching television less stressful. Moreover, the prototype system could be used as an aid in learning to play a musical instrument or to sing in tune.
This research work has shown considerable potential in using existing technology to significantly change the way the deaf community experiences music. We believe the findings presented here will add to the knowledge base of researchers in the field of Human Computer Interaction (HCI) interested in developing systems for the hearing-impaired.
3
CONTENTS
1. INTRODUCTION 2. BACKGROUND 2.1 Cross-modal Interactions 2.2 Haptic Feedback through Skin 2.3 Bone Conduction of Sound 2.4 Visualising Music 2.5 Feeling the Vibrations 3. FINDINGS FROM A SURVEY OF THE HEARING-IMPAIRED 4. SYSTEM DESCRIPTION 4.1 The ‘Haptic Chair’ 4.2 Visual Display 4.3 User Evaluation 5. REFINEMENTS TO THE SYSTEM 5.1 Visual Display 5.2 The ‘Haptic Chair’ 5.3 User Evaluation of the Revised System 6. DISCUSSION 7. CONCLUSION AND FUTURE DIRECTIONS 7.1 Summary of Results 7.2 Future Work
4
1. INTRODUCTION Music is the time-based art of sound. Listeners bring a host of cultural and personal
experience to bear when listening to a piece of music. Statistical regularities among a set of twelve tones are the fundamental blocks on which the structural regularities in western tonal music are based. A chord is defined as the simultaneous playing of three tones, while a subset of seven tones and chords generated from them defines a key (Tillmann et al., 2006). Conventions of melodic patterns, chord sequences and key changes are exploited to create an intellectual and emotional response that we call the musical experience. A question central to this research is whether or not the musical experience can be conveyed by sensory channels other than reception of sound via the external ear canal.
It is not just musical ‘information’ that we want to convey, but the musical ‘experience’. For example, non-musically trained listeners (those who can hear) can experience music as part of everyday life. They can tap their foot or otherwise move rhythmically in response to a musical stimulus, and quickly articulate whether the piece of music is in a familiar style, and whether it is a style they like. If they are familiar with the music, they might be able to identify the composer and/or performers. Such listeners can often recognise at least some of the instruments they hear being played. They can immediately assess stylistic and emotional aspects of the music, including whether it is loud or not, complicated, sad, fast, soothing, or generates a feeling of anxiety. They can also make complex socio-cultural judgments, such as identifying a friend who would like a particular piece of music or a social occasion for which it would be appropriate; and, importantly, they can share a musical experience.
However, if the listeners are hearing-impaired1, all of the above will be consistently more difficult and sometimes impossible. Partial or profound lack of hearing makes alternative ways humans use to sense sound in the environment much more important for the deaf than for hearing people (Glennie, 2009). Sound transmitted through the air and through other physical media such as floors, walls, chairs and machines act on the entire human body, not just the ears, and play an important role in the perception of music and environmental events for almost all people, but in particular for the deaf. Music being a multi-sensory experience should not prevent the hearing-impaired from enjoying it. Relatively little research has been directly addressed on how to optimise the musical experience for a deaf person. This paper describes the design and evaluation of a system developed for conceptualising approaches that move us towards understanding how best to provide musical sensory enhancement for the deaf.
Some work has been done to provide the deaf with greater awareness of environmental sounds (Ho-Ching, Mankoff, & Landay, 2003; Matthews, Fong, & Mankoff, 2005). However, very little guidance is available to address the challenges encountered at the early stage of designing a system for the deaf to facilitate a deeper experience of music. In order to keep the focus on the musical experience for the deaf and minimise potential bias from
1 The terms ‘hearing-impaired’, ‘hard of hearing’ and ‘deaf’ are used interchangeably in this paper. These loosely defined terms are used to refer to a person whose primary mode of accessing sounds is not through the ‘conventional’ hearing route, an air-filled external ear canal. The hearing loss is typically measured by an audiometer which measures the loss in decibels (dB) at different frequencies when listening to sound through external ear canals. Depending on the degree of the hearing loss, hearing-impaired people are typically classified as: mildly deaf, moderately deaf, severely deaf and profoundly deaf. However, in this paper, we considered two broad categories:
• Profoundly deaf (hearing loss of 95 dB or more) • Partially deaf (hearing loss ranging from 25 to 95 dB) More information about deafness can be found in the Royal National Institute for Deaf People (RNID)
assumptions about musical experiences of hearing people, it was imperative to involve hearing-impaired people in the design loop from the beginning. Therefore, as a starting point a survey was conducted to gather information from the deaf about how and how much they engage in music related activities and their suggestions about how to approach enriching their musical experience. Based on the results of this survey, we implemented a prototype system which has two components: a ‘Haptic2 Chair’ that vibrates in a systematic manner driven by music; and a computer display that generates different visual effects based on musical features. Once the initial prototype had been developed, possible improvements were explored through continuous feedback from hearing-impaired users.
Because people naturally sense musically derived vibrations throughout the body when experiencing music, any additional ‘information’ delivered through this channel might actually disrupt the musical experience, and this confounding effect is potentially more significant for the deaf. There is so much we still do not know about the brain and its ability to integrate different natural stimuli to replace missing information (Meredith, 2002)—for example, using naturally occurring tactile stimuli to replace missing auditory stimuli for those who are profoundly deaf. Since we know that the human central nervous system (CNS) is particularly plastic in its intake of various sensory inputs and their interpretation, and the production of different physiological (motor, sensory or other) or behavioural output, it is important to support this ability to create new sensory experiences for people with specific sensory impairments. The human CNS is still largely a ‘black box’ in data processing terms and it would be unforgivable to assume we can create a computerised system to replace its many and various abilities. Therefore, it was decided not to alter the natural vibrations caused by musical sounds, but to design a prototype Haptic Chair to deliver the natural vibrations produced by music tactilely via different parts of the chair. Preliminary findings suggested that the ‘Haptic Chair’ was capable of providing not only haptic sensory input but also bone conduction of sound.
This work will contribute to the field of HCI and significantly to the hearing-impaired community. The results and conclusions drawn from extensive surveys and user studies performed on the system throughout its development provide significant understanding of the perceptual, cognitive, and behavioural capabilities and user interactivity of the hearing-impaired, and add to the knowledge base on which HCI researchers can develop more sophisticated systems for the hearing-impaired. Apart from the scientific contributions, we believe this research might potentially bridge the gap between the hearing and hearing-impaired communities, something very evident from the enthusiastic feedback and observations received from the deaf participants.
The rest of the paper is organised as follows: Section 2 contains a critical assessment of related work and discusses its relationship to our research. This is followed by the summary of a survey conducted with the deaf to make important design decisions at an appropriately early stage of the project. Section 4 describes the details of the initial design and evaluation of our system consisting of a visual display and a Haptic Chair, which was aimed at providing an enhanced musical experience for the hearing-impaired. Section 5 presents improvements to the initial system, and explores different methods of presenting visual cues. A detailed discussion of the findings and experimental methodology is given in Section 6. Finally, we conclude the paper by summarising the findings and outlining future directions.
2 Strictly speaking, the term ‘haptic’ refers to skin and muscle receptor feedback while feedback only from skin receptors is referred by the term ‘tactile’. However, in this paper both terms refer to the sense of touch.
6
2. BACKGROUND
2.1. Cross-modal Interactions Integration of visual and auditory information It is widely accepted that our brain combines information from all available senses to form
a coherent perception of the environment. Visual and auditory sensory information are most often used by humans to sense their environment over greater ranges than smell, taste or touch, and, in most people, hearing is primarily processed in the temporal lobe while the occipital lobe is responsible for the sense of vision. However, in some circumstances visual input can be used to stimulate the part of the brain that processes auditory input and vice versa; and this phenomenon can also occur with other types of sensory input.
Integration of audio and visual information is very common; for example, while watching movies or attending concerts; in fact, the majority of people combine audio and visual information while having face-to-face conversations. In addition, a number of phenomena such as the ventriloquism effect (Howard, 1966), ‘McGurk effect’ (McGurk & MacDonald, 1976) and synesthesia (Cytowic, 1989) demonstrate how auditory and visual information can mutually reinforce or modify sensory perception. Taylor, Moss, Stamatakis, and Tyler (2006) suggested that the human peripheral cortex helps to bind the major aspects of audio-‐visual features to provide meaningful multi-modal representations. It can thus be established that even though humans receive sensations via distinct sensory pathways, the information is not always perceived independently, but often put together before being finally processed. It is particularly important for the purpose of this research to note that audio-visual integration influences many structural aspects of music experience. For example, the perceived duration of a note is affected by the length of the gesture used to create the note when the audience can see the performer while listening (Schutz & Lipscomb, 2007). Integration of audio and visual information serves to extend the sense of phrasing and to help anticipate changes in emotional content (Vines, Krumhansl, Wanderley, & Levitin, 2006). Furthermore, Thompson, Russo, and Quinto (2008) have shown that facial expressions of a singer can significantly influence the judgement of emotions in music. Referring to the above with regard to people with hearing impairment, exploiting the visual mode might be one of the ways to compensate for the lack of auditory information. This was explored and several methods have been discussed and evaluated to represent music in visual form in order to offer the hearing-impaired community an enhanced mode of enjoying music.
Integration of touch and sound Shibata (2001) found that some deaf people process vibrations sensed via touch in the part
of the brain used by most people for hearing. According to Kayser et al. (2005), tactile sensation stimulates portions of the auditory cortex in addition to the somatosensory cortex. These findings provide one possible explanation for how deaf musicians can sense music, and how deaf people can enjoy concerts and other musical events. In addition, they suggest that a mechanism to physically ‘feel’ music might provide an experience to a hearing-impaired person that is qualitatively similar to that experience by a hearing person. However, this concept has not been fully utilised to optimise the musical experience of a deaf person. Reed (1996) demonstrated that with sufficient training, blind and deaf practitioners of the ‘Tadoma method’ are able to use tactile sensations to support speech and language processing. In the Tadoma method, the hand of the deaf-blind individual is placed over the face and neck of the person who is speaking such that the thumb rests lightly on the lips and the fingers fan out over the cheek and neck. From this position, the deaf-blind user can primarily obtain information about speech from vibrations from both the neck and jaw, the
7
movement of the lips and jaw, and less importantly from the airflow characteristics produced during speech. This series of studies by Reed illustrates that naturally occurring tactile sensations produced by sound can provide acoustic information to the hearing-impaired. Russ Palmer, a hearing and visually-impaired person, has worked on a new approach in understanding how people with sensory impairments perceive and interpret music. He called this idea ‘Feeling the music philosophy’—a description for being able to ‘visualise’ and ‘interpret’ music by people with sensory impairments, to feel music through vibrations instead of listening to music using the ears (Palmer, 1997). He describes how people might feel music through vibrations:
“... it is true to assume that all people with a sensory impairment, without the use of hearing aids, can feel sound vibrations and ‘tones’ through their bodies. This means that the physiological, neurological functions in the body become activated in a stronger sense, compared to those people who have no hearing impairment i.e. a switching of senses. I know that when I switch off my hearing aids there appears to be a “switching over” of senses through to my ‘tactile’ sense.”
Furthermore, Palmer developed a theory in which he claimed that the vibrations produced by low-pitched (low frequency) tones can be felt by body sensors in the feet, legs and hips; middle tones can be felt in the stomach, chest and arms; and high-pitched tones can be felt in the fingers, head and hair. This theory is consistent with the findings of the review on the tactile modality, carried out by the Army Research Laboratory, USA (Myles & Binseel, 2007).
2.2. Haptic Feedback through Skin Physiological and anatomical research has identified four types of neuro-sensory fibres in
non-hairy (glabrous) skin that are involved in tactile sensation: (1) the Pacinian corpuscle (PC) with rapidly adapting type I fibers; (2) the Meissner corpuscle (MEI) with rapidly adapting type II fibers; (3) the Merkel disk (MRK) with slow adapting type I fibers; and (4) the Ruffini cylinder (RU) with slowly adapting type II fibers (Weisenberger, 1996). Thorough reviews of functionality of haptic perception (Lederman & Klatzky, 2009) and fundamental aspects of tactile psychophysics (Burton & Sinclair, 1996) are available; and often quoted studies of the human tactile system reported frequency sensitivity up to approximately 1000 Hz (Sherrick, 1953; Verillo, 1962, 1992). According to Verillo (1992), the absolute threshold as a function of frequency showed and U-shaped curve with a minimum at 250 Hz. The hairy skin yielded the same U-shape compared to glabrous skin; however, sensitivity of the hairy skin was 20 dB below the glabrous skin (Verillo, 1962, 1992). Therefore, most tactile display research aimed to encode the information into a frequency range below 1000 Hz.
However, Lamoré (1984) has measured vibrotactile thresholds up to 2000 Hz for glabrous and non-glabrous skin with hearing and hearing-impaired subjects. It is possible that responses to more complex and dynamic signals, characteristic of natural environmental stimuli, are not predictable from responses to sine tones alone. In the auditory system, for example, Evans (1968) found that 20% of cortical neurons in unanesthetized cats respond only to complex signals such as clicks and noise bursts. Whitfield and Evans (1965) found cortical neurons they called ‘frequency sweep detectors’ for their preferential responses to frequency changes in particular directions. The visual system is also well known to contain many types of complex ‘feature detector’ neurons (e.g. Hubel and Wiesel, 1968). Complex signals are qualitatively more than the sum of their parts. For example, harmonic components with properly constructed amplitude and phase relationships can create signals with instantaneous pressure variations (approaching square waves) with steeper slopes than those
8
in any of the constituent sine wave components alone, and these fast pressure variations could conceivably play a role in signal detection.
The mechanism of providing a tactile sensation through the Haptic Chair is quite similar to the common technique used by deaf people, called ‘speaker listening’. In speaker listening, deaf people place their hands or foot directly on audio speakers to feel vibrations produced by audio output. However, the Haptic Chair provides a tactile stimulation to various parts of the body simultaneously in contrast to ‘speaker listening’ where only one part of the body is stimulated at any particular instant and not necessarily within an optimal frequency range. This is important since feeling sound vibrations through different parts of the body plays an important role in perceiving music (Glennie, 2009; palmer 1994). The Haptic Chair therefore appears to provide much more than simple speaker listening. The teachers at the deaf school where most of the user studies were conducted said that, as is typical of deaf listeners, some of the deaf participants place their hands on the normal audio speakers available at the school’s main auditorium while listening to music. Nevertheless, from the observations made throughout this research work, it appeared that even those who had already experienced speaker listening preferred to experience music while sitting on the Haptic Chair.
2.4 Bone Conduction of Sound Bone conduction of sound is generally understood to mean the process of transmitting
sound energy through vibrations of the skull or neighbouring parts of the body (Henry & Letowski, 2007). For a hearing person, bone conduction is a secondary auditory pathway supplementing conduction of sound via the external ear canal. In normal situations (when there is no direct stimulation of the skull), its contribution to the sense of hearing is relatively small. This is due to the impedance mismatch between propagation of sound waves from the air via the interface between the skin, underlying fat and ‘wet’ bones of the skull and other complex anatomical structures. However, bone conduction technology has been widely used in a variety of commercial products, including development of hearing aids and devices for listening to music.
Deatherage, Jeffress and Blodgett (1954) demonstrated that humans could perceive ultrasonic frequencies by bone conduction. In fact, this ultrasonic hearing pathway has shown to be as high as 100 kHz (Lenhardt, Skellett, Wang, & Clarke, 1991). Dobie, Wiederhold and Lenhardt (1992) have suggested that the bone conduction process is able to demodulate the ultrasonic signal to the perception of a frequency that is within the audible range which represents the fluctuations of the carrier signal. Moreover, bone conduction of ultrasound has been shown to be able to help users with sensorineural and conductive hearing loss (Abramovich, 1978; Hosoi, Imaizumi, Sakaguchi, Tonoike, & Murata, 1998; Imaizumi et al., 2001; Lenhardt et al, 1991). Imaizumi et al. (2001) found that bone-conducted ultrasound can activate the auditory cortex of profoundly deaf subjects. Lenhardt et al. (1991) have suggested that when speech signals are used to modulate the amplitude of an ultrasonic carrier wave, the result is a clear perception of the speech stimuli and not a sense of high-frequency vibration. It is possible that in addition to tactile sensory input, the Haptic Chair might be providing an additional avenue for enhanced sensory input through bone conduction of sound.
2.5 Visualising Music A large number of parameters can be extracted from a music data stream and these can
each be mapped to several visual properties. The number of all possible mappings is too large to be explored fruitfully without some guiding principles. By analysing mappings reported in the literature and considering the results of studies of human audiovisual perception, several avenues open for exploration. If nothing else, we need to convey the beat and underlying
9
percussive elements. However, the musical ‘key’ and key changes are also of great importance since they are normally part of the structural foundation of musical works, and they evoke emotional empathy (Hevner, 1935). For example, major keys are associated with happy and uplifting emotions, whereas minor keys are typically associated with sad emotions (Hevner, 1935). Jones and Nevile (2005) suggest that mapping single musical voices in a composition to single graphical elements would result in a visual experience with a musical meaning. Marks (1974) conducted a study in which subjects were asked to match pure tones with increasing pitch to brightness of grey surfaces. He found that most people would match increasing pitch with increasing brightness, while some would match increasing loudness with increasing brightness. The use of the colour is tricky since there are different cross-cultural interpretations (Melara, 1989). However, Kawanobe, Kameda, and Miyahara (2003) have proposed a mapping table between music and colour combinations, where they also showed there is a strong similarity between musical effect and colour effect. These trends can be used as a rational basis for finding a ‘good’ map between musical features and visual features, which can convey a musical experience more fully. Since the system was designed for the deaf, their feedback was collected regularly and initial mappings were modified based on the feedback.
Among the earliest researchers to use a computer based approach to visualise music was Mitroo, Herman, and Badler (1979), who input musical attributes such as pitch, notes, chords, velocity, loudness to create colour compositions and moving objects. In the early 20th century, Oskar Fischinger, an animator, created exquisite ‘visual music’ using geometric patterns and shapes choreographed tightly to classical music and jazz. A more recent example is Norman McLaren, a Canadian animator and film director who created ‘animated sound’ by hand-drawn interpretations of music for film (Jones & Nevile, 2005). Evans (2005) gives an excellent analysis of visual music. Since then, music visualisation schemes have proliferated to include commercial products like WinAmp™ and iTunes™, as well as visualisations to help train singers. Smith and Williams (1997) have developed a music visualisation which maps music data to 3D space. Each note is represented as a sphere where the relative size of the sphere corresponds to the loudness, colour corresponds to the timbre of the tone and relative vertical location of the sphere corresponds to the pitch of the tone. Individual instruments are mapped to particular values along the horizontal axis. Although this music display is totally generated by the music, Smith’s aim was to present an alternative method for visualising music instead of conventional music notation. However, this simple approach of visualising music is easy to interpret and thus might be helpful for someone with less musical competency. Furthermore, there have been attempts to extract meaningful musical features from live performances and map them to the behaviour of an animated human character in such a way that the musician’s performance elicits a response from the virtual character (Taylor, Boulanger, & Torres, 2005; Taylor, Torres, & Boulanger, 2005). DiPaola and Arya (2006) have developed a music-driven emotionally expressive face animation system, called ‘MusicFace’, to extract the affective data from a piece of music to control facial expressions. Although the analysis attempted to extract affective features, it was not their intention to elicit emotional responses in the viewers.
The effect of aforementioned music visualisations on the hearing-impaired has not been scientifically investigated and no prior specific application for this purpose is known to the authors. However, there have been attempts to build displays capable of providing information to the hearing-impaired about sounds in their environment. For example, Matthews et al. (2005) have proposed a small desktop screen display with icons and spectrographs that can keep a deaf person informed about sounds in their vicinity. Similar work has been done by Ho-Ching et al. (2003) where two prototypes were implemented to provide awareness of environmental sounds to deaf people. They found that deaf people
10
prefer to have displays that are easy to interpret and ‘glance-able’. As functional requirements, hearing-impaired users wanted to be able to identify sounds as they occurred, view a history of the displayed sounds, customize the information that is shown and determine the accuracy of displayed information. Matthews et al. (2005) have reported that, during an interview, one participant expressed her interest in music: “she loved watching live musicians and feeling the vibrations through the floor or speakers”.
2.6 Feeling the Vibrations As mentioned in the previous sections, feeling sound vibrations through different parts of
the body plays an important role in perceiving music, particularly for the deaf. Based on this concept, Palmer (1994) has developed a portable music floor, which he called ‘Tac-Tile Sounds System’ (TTSS). However, we have not been able to find a report of any formal objective evaluation of the TTSS. Recently, Kerwin (2005) has developed a touch pad that enables deaf people to feel music through vibrations sensed by the fingertips. Kerwin claimed that when music is played each of the five finger pads on a pad designed for one hand vibrates in a different manner that enables the user to feel the difference between notes, rhythms and instrument combinations. As in the previous case (TTSS), not many technical or user test details about this device are available.
An audio-tactile device that represents audio information as tactile stimuli called EmotiChair’ has been developed (Karam, Russo, & Fels, 2009; Karam, Nespoli, Russo, & Fels, 2009; Karam, Russo, Branje, Price, & Fels, 2008). The EmotiChair uses a simplified ‘Model of Human Cochlea’ (MHC) to separate audio signals into discrete vibro-tactile output channels that are presented along the back of a user’s body. Gunther, Davenport, and O'Modhrain (2002) introduced the concept of ‘tactile composition’ based on a similar system comprised of thirteen transducers worn against the body with the aim of creating music specifically for tactile display. Some of the goals of this research and the goals of EmotiChair are similar, but with different approaches. The ‘Multisensory Sound Lab’ (MSL) developed by Oval Window Audio is a special environment consisting of vibrating floors generated by mechanical vibrations and colourful visual displays generated by spectrum analysers intending to educate or enhance the sound experience for the hearing-impaired. The MSL environment uses a transformation of sound to generate vibrations (low frequency sounds as slow vibrations and high frequency sounds as faster vibrations) and the visual display effects basically represent the different waveforms of the audio signal, which is very different from our approach.
There are commercial products advertised to enhance the listening experience by providing tactile information for explosions, gun shots, and other high noise events, for example, the ‘Tactile Effects System’ by Crowson Technology. Currently, the closest commercially available comparisons to the proposed Haptic Chair include the ‘Vibrating Bodily Sensation Device’ from Kunyoong IBC Co., the ‘X-chair’ by Ogawa World Berhad, the MSL from Oval Window Audio, Soundbeam® products (soundchair, soundbed, sound box and minibox) by Soundbeam Project and Snoezelen® vibromusic products from FlagHouse, Inc. The Vibrating Bodily Sensation Device is a vibro-tactile device which is advertised as a mobile device that can be placed on existing chairs to enhance the listening experience of the hearing-impaired. The X-chair has been designed for long-hour indulgence while listening to music, playing games or watching movies. Both these commercial products only stimulate one part of the body (the lower lumbar region of the body which tends to be more sensitive to lower frequencies than some other anatomical regions). However, as discussed earlier, studies have shown that different locations of the body have different sensitivities to vibrations (Palmer, 1997). In our system, positioning of the vibrating speakers was determined based on the reports in scientific literature and feedback from several
11
hearing-impaired participants. These user feedbacks were obtained from a preliminary user study that investigated which part of the body felt and perceived the vibrations most informatively. Our pilot study showed that the fingertips, palms of the hand, lower/middle back (especially along the spinal cord), upper chest, and the feet were especially sensitive to vibrations.
Discussion on the state of the art given in this section reveals that a variety of methods have been suggested to compensate for hearing disabilities in music appreciation. However, little has been done to assess their applicability to the hearing-impaired community. We addressed this gap by proposing a user-centred approach, primarily by employing an extensive series of user studies, to explore how best we could enhance the musical experience of a deaf person.
3. FINDINGS FROM A SURVEY OF THE HEARING-IMPAIRED The literature review revealed that little guidance is available to address the challenges
encountered at the early stages of designing a system for the deaf to facilitate a better experience of music. Therefore, it was important to study what hearing-impaired people might find most useful in helping them enjoy music. Thus, we conducted a survey with deaf people from multi-ethnic backgrounds. Forty-one people (19 partially deaf and 22 profoundly deaf participants; 36 aged 15–30 years and five aged 31–45 years) with various degrees of hearing impairment took part in this survey. We have discussed the findings in our previous publication (Nanayakkara, Taylor, Wyse, & Ong, 2009). In summary, the following were the main findings of the background survey:
• Partially deaf subjects were more involved in musical activities than the profoundly deaf and most of them listen to music with a strong beat. This might seem obvious but needed to be formally tested.
• Regardless of the level of deafness, the participants expressed the desire to enjoy music.
• Currently, sign language and subtitle displays are the most commonly used methods by hearing-impaired people to understand music. One reason for this could be the fact that these are two of the most easily available options.
• Apart from sign language and subtitle displays, most of the participants thought devices that provide haptic feedback and visual displays would be helpful. One of the significant observations for the purpose of this study was that most people (94%) who have used a graphical display or haptic input found these assistive devices contribute significantly to their musical enjoyment.
• Seventy four percent of the hearing-impaired subjects said that they expect a system that provides a visual and haptic feedback would provide them a more satisfying musical experience.
These findings formed the basis for conceptualising approaches that move us towards understanding how best to provide musical sensory enhancement for the deaf.
4. SYSTEM DESCRIPTION Based on an initial concept guided by the information obtained from the background
survey conducted with a cohort of hearing-impaired young adult students, we developed a system to enrich the experience of music for the deaf by enhancing sensory input through channels other than in-air audio reception via the external ear canal. The proposed system consisted of an informative visual display and a ‘Haptic Chair’.
12
4.1 The Haptic Chair The literature review, background survey results and informal interviews with deaf
musicians suggested that if vibrations caused by sound could be amplified and sensed through the body as they are in natural environmental conditions, this might increase the experience and enjoyment of music over either a mute visual presentation or by simply increasing the volume of sound. This led to the development of a device to achieve the above aim, which we called the ‘Haptic Chair’. The Haptic Chair provides sensory input of vibrations via the sense of touch and possibly also through bone conduction of sound. Since hearing-impaired people are used to sensing vibrations from their fingertips to the soles of their feet, it was important to provide a vibrotactile feedback to the entire body. In addition, O'Modhrain (2003) has suggested that a haptic feedback provided through a computer controlled actuator embedded in a sofa would ‘create a greater sense of immersion’. A chair was a simpler, multi-purpose structure to test this concept of ‘whole body stimulation’. Initial informal tests suggested that our prototype enabled the listener to be comfortably seated while being enveloped in an enriched sensation created by sound received via strategically placed speakers that created a ‘rounded’ sense of sound-induced vibrations.
Structure of the chair The concept of the Haptic Chair is to amplify vibrations produced by musical sounds,
delivering them to different parts of the body without adding additional artificial sound-processing effects into this communication channel; although the latter approach might be used in future if it is shown to produce better results. But the most basic approach needed to be formally tested before making major changes to the acoustic signal. The first version of the chair used contact speakers (SolidDrive™ SD1 and Nimzy™ Vibro Max) to generate vibrotactile feedback. These speakers are designed to make most surfaces they are attached to vibrate and produce sound. The quality and frequency response of the sound these contact speakers produce is similar to that of conventional diaphragm speakers. This is important since many partially deaf people can hear some sounds via in-air conduction through the ‘conventional’ hearing route - an air-filled external ear canal, and vibrational input is supplementary.
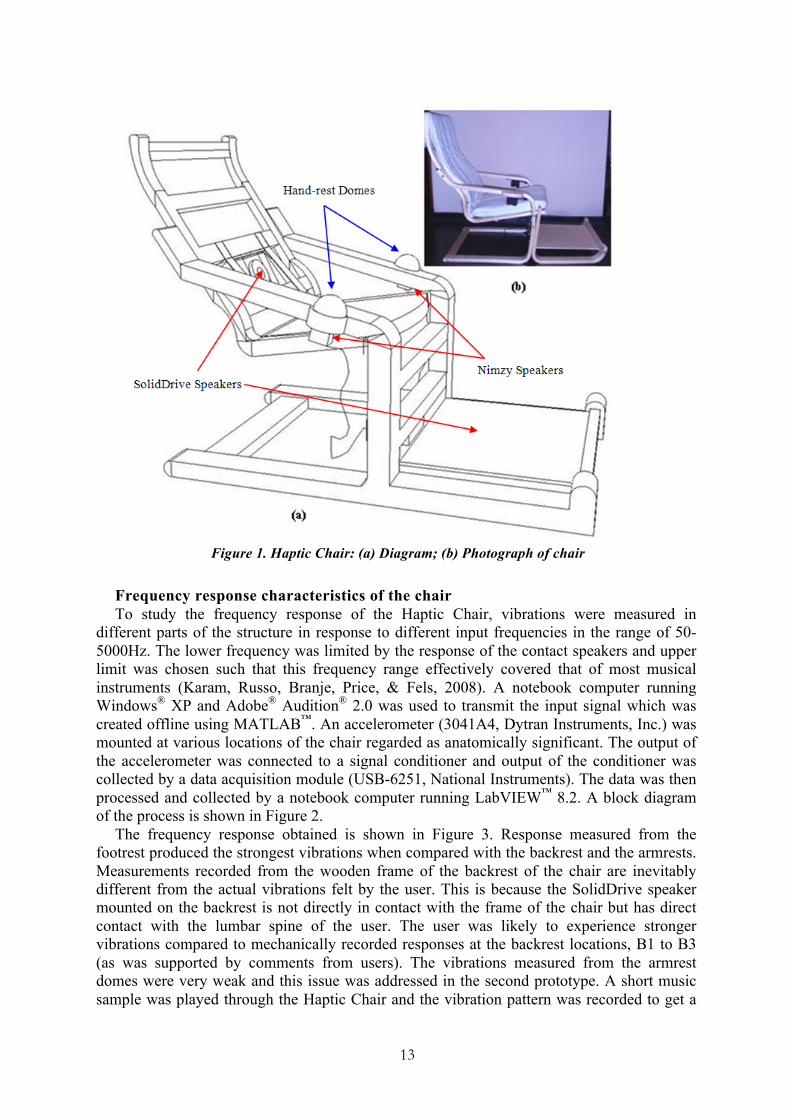
After exploring many different materials including various solid woods, laminated woods, glass, metal, plastic, and high-density gels, and configurations for the chair frame, a densely laminated wooden chair that is widely available at relatively low cost (‘Poäng’ made by IKEA®) was chosen. The frame was made of layer-glued bent beech wood that provided flexibility, and solid beech cross-struts that provided rigidity. The chair was able to vibrate relatively freely and could also be rocked by the subjects (if they wanted to do so). A contact speaker was mounted under each arm-rest, one under a similar rigid, laminated wooden foot-rest (also ‘Poäng’ by IKEA) that was securely fixed to the main chair, and one on the back-rest at the level of the lumbar spine (Figure 1).
Initially, a thin but rigid plastic dome was mounted over each hand-rest to amplify vibrations produced by high frequency sounds for optimal detection by the hands and fingers. The domes also provided an ergonomic hand rest that brought fingertips, hand bones and wrist bones in contact with the vibrating structures of the main body of the chair. The arm rests also served to conduct sound vibrations to the core of the body. The sound signal was presented in conventional stereo output to the right and left arm rests. A textured cotton cushion with a thin foam filling supplied with the IKEA ‘Poäng’ chair was used to increase physical comfort but not significantly interfere with haptic perception of the music. It might have reduced bone conduction of sound particularly to the skull but since this was not the specific focus of the present study, the cushion was used because it increased the overall comfort of the user which would be important for extended use of the chair.
13
Figure 1. Haptic Chair: (a) Diagram; (b) Photograph of chair
Frequency response characteristics of the chair To study the frequency response of the Haptic Chair, vibrations were measured in
different parts of the structure in response to different input frequencies in the range of 50-5000Hz. The lower frequency was limited by the response of the contact speakers and upper limit was chosen such that this frequency range effectively covered that of most musical instruments (Karam, Russo, Branje, Price, & Fels, 2008). A notebook computer running Windows® XP and Adobe® Audition® 2.0 was used to transmit the input signal which was created offline using MATLAB™. An accelerometer (3041A4, Dytran Instruments, Inc.) was mounted at various locations of the chair regarded as anatomically significant. The output of the accelerometer was connected to a signal conditioner and output of the conditioner was collected by a data acquisition module (USB-6251, National Instruments). The data was then processed and collected by a notebook computer running LabVIEW™ 8.2. A block diagram of the process is shown in Figure 2.
The frequency response obtained is shown in Figure 3. Response measured from the footrest produced the strongest vibrations when compared with the backrest and the armrests. Measurements recorded from the wooden frame of the backrest of the chair are inevitably different from the actual vibrations felt by the user. This is because the SolidDrive speaker mounted on the backrest is not directly in contact with the frame of the chair but has direct contact with the lumbar spine of the user. The user was likely to experience stronger vibrations compared to mechanically recorded responses at the backrest locations, B1 to B3 (as was supported by comments from users). The vibrations measured from the armrest domes were very weak and this issue was addressed in the second prototype. A short music sample was played through the Haptic Chair and the vibration pattern was recorded to get a
14
qualitative observation When the recorded vibration pattern was played back as an audio stream, the resulting sound had the same quality as the original signal but amplitude was dependent on the location from which the vibrations were recorded. This observation supported the idea that the vibrations produced by the chair do not have any significant distortions.
Figure 2. Block diagram of the equipment used in the data acquisition process
Figure 3. Power spectrum of vibrations measured at various positions on the chair: F2–foot rest; B1 to B3–back rest; R2, R3–arm rest; ARD–plastic dome (Power of the input is taken as the
reference; i.e. 0 dB)
Notebook Computer running Adobe® Audition® 2.0
Audio Signal
Vibrations
Haptic Chair
Accelerometer Dytran USA (3041A4)
Signal Conditioner ICP (480E09)
Notebook Computer
running LabVIEW™
Data Acquisition Unit
NI (USB-‐6251)
Power Spectrum Magnitude
(dB)
Frequency (Hz)
15
4.2 Visual Display Development of the platform Extracting notes and instrument information from a live audio stream is an extremely
difficult problem (Scheirer, 2000) and is not the main objective of this research. Thus, we used MIDI data, a communications protocol representing musical information similar to that contained in a musical score, as the main source of information instead of a live audio stream. Using MIDI makes determining note onsets, pitch, duration, loudness and instrument identification straightforward. However, just as with musical scores, key changes are not explicit or trivially extractable from a MIDI note stream because, a) musical key is only implicit in a stream of notes, and b) MIDI note numbers do not carry quite the same amount of key information as note names. Therefore, a method developed by Chew (2001) based on a mathematical model for tonality called the ‘Spiral Array Model’ was used to accomplish this task.
The spiral array model is a three-dimensional model that represents pitches in 3D space, i.e., each pitch has three coordinates. Any pitch-based object that can be described by a collection of pitches, such as intervals, chords, and keys, can be represented in the same three-dimensional space for ease of comparison. Central to the spiral array is the idea of the Centre of Effect (CE), which is the representation of pitch-based objects as the weighted sum of their lower-level components. For key analysis using the spiral array, one needs to map any numeric representation of pitch to its letter name. For example, MIDI note number 60 could be spelled as ‘C’, ‘B#’ or ‘Dbb’ depending on the key context. The pitch spelling algorithm, described in (Chew & Chen, 2003, 2005), is applied to assign letter names to the pitches so that they can be mapped to their corresponding representations in the spiral array for key finding. The pitch-spelling algorithm uses the current CE as a proxy for the key context, and assigns pitch names through a nearest-neighbour search for the closest pitch-class representation. To initialise the process, all pitches in the first time window are spelt closest to the pitch class ‘D’ in the spiral array, then the coordinates of the CE of these pitches are calculated as a weighted sum of pitch coordinates, and they are re-spelt using this CE (Chew, 2001). The evolving CE is calculated using CE( ) .CE( ) (1 ).CE( 1)t t tα α= + − − where t is the time-stamp and used as a proxy for the key context. The value of α can be adjusted to emphasise local or global key context, where higher value results in more local CE and lower value results in more global CE.
System architecture The music visualisation scheme consists of three main components: Processing layer,
XML Socket, and Flash® AS3.0 application (Figure 4). The processing layer takes in a MIDI data stream and extracts note onset, pitch, loudness, musical instrument and key changes. This processing layer is implemented using the Max/MSP™, a musical signal and event processing, and programming environment. The Max ‘midi-in’ object was used to capture raw MIDI data coming from a MIDI keyboard and the ‘seq’ object was used to deal with standard single track MIDI files. Note and velocity of note onset was read directly from MIDI using the midiparse object. Percussive and non-percussive sounds were separated by considering the MIDI channel number. The extracted musical information was passed to a Flash CS3 programme via a Max flashserver external object (Matthes, 2002). The basic functionality of the flashserver is to establish a connection between Flash CS3 and Max/MSP. The TCP/IP socket connection that is created enables exchange of data between both programs in either direction, thereby enabling two-way Max-controlled animations in Flash CS3. With this architecture, each musical feature extracted by Max/MSP can be programmatically associated with a corresponding visual effect in Flash.
16
Figure 4. System architecture of the proposed music visualiser A fundamental display decision was the window of time to be visualised. We identified
two distinct types of visualisation: a ‘piano roll’ and a ‘movie roll’ type (See Figure 5). The ‘piano roll’ presentation refers to a display that scrolls from left to right, in which events corresponding to a given time window are displayed in a single column, and past events and future events are displayed on the left side and right side of the current time, respectively. In contrast, in a ‘movie roll’-type presentation, the entire display is used to show instantaneous events allowing more freedom of expression. The visual effect for a particular audio feature is visible on screen for as long as that audio feature is audible, and fades away into the screen as the audio feature fades. When listening, people tend to hear instantaneous events: future events are not known (although they might be anticipated), and past events are not heard (although they might be remembered). Thus, a ‘movie roll’-type visual presentation is more directly analogous to the audio musical listening process than the ‘piano roll’ depiction.
Figure 5: Examples of piano roll and movie roll presentations. Music-to-visual mapping The main challenge in building this music-driven display was to choose a suitable way of
mapping musical features to visual effects. We discuss a few possible audiovisual mappings
Processing layer Read and process MIDI data stream
XML Socket Establish a connection to Flash™ Action Script 3.0 application
Flash™ AS3.0 application Generate visual effects based on received
information
17
and how they were used in the initial design. Two deaf musicians (a pianist and a percussionist) were consulted to obtain more insight into the requirements of hearing-impaired people. Based on their feedback, the system was modified. First version of the visual display had visual effects corresponding to note onset, note duration, pitch of a note, loudness, instrument type, and key changes. Each note produced by a non-percussive instrument was mapped to a graphical sphere-like object to emphasise the note onset, and based on the number of instruments being played, the screen was divided into columns, and objects corresponding to one instrument appeared in one column. As suggested by Jones and Nevile (Jones & Nevile, 2005), high notes were mapped to small shapes and low notes were mapped to large shapes. In addition, the pitch of the object determined the vertical location– the higher the pitch, the higher it appeared on screen. The amplitude of a particular note was mapped to the brightness of the corresponding visual object according to findings by Marks (1974). Timbre is too complex to be represented by a small number of changing values and there have been many approaches to characterise musical timbre (Donnadieu, McAdams, & Winsberg, 1994). However, the two deaf musicians who worked with us suggested using different colours to represent different instruments. Each instrument being played at a given time was mapped to a unique colour. Based on these factors, the visual display produced graphics corresponding to the music data fed into it. Figure 6 shows a screen capture of the visual display but obviously cannot convey the effect of a visual display corresponding to a piece of music: this must be left to the imagination of the reader.
Figure 6. Screen capture of the visual display with real-time abstract animations corresponding to music. The blobs/bursts appear at note onsets and colour, size and brightness changes according to the instrument type, pitch and loudness respectively; the visual effect for a given note fades away as
the audible sound of that note fades away.
4.3 User Evaluation Measuring musical experience The concept of a ‘musical experience’ is often used in various forms in everyday life to
describe how people psychologically experience and respond to music. However there is no widely accepted definition that adequately captures this complex concept. In a personal email to a co-author of this work, Professor Daniel Levitin (2007) provided a simpler definition for musical experience:
“The aesthetic and emotional appreciation of variations in pitch and rhythm over time, which typically cause a desire to synchronise one’s body movements to the underlying (rhythmic) pulse”
18
Even this simplified definition (which only refers to synchronising body movements to the rhythm) does not lend itself to quantifying the musical experience. However, the aim of the present research project is to provide a more satisfying musical experience to a hearing-impaired person. Qualities of musical engagement have been systematically studied using self reporting methods and interviews (DeNora, 2000; Gabrielsson & Lindstrom, 2000). These investigations have contributed to our understanding of how people make meaning from their interactions with music in social contexts. Sloboda, O’Neill, and Ivaldi (2001) have studied musical engagement in everyday life using conventional ‘flow’ methodology. Thus, we proposed to evaluate musical engagement based on Csikszentmihalyi’s ‘theory of flow’ (Csikszentmihalyi, 1975). The timelessness, effortlessness and lack of self-consciousness one experiences are what Csikszentmihalyi would describe as being ‘in flow’. He describes ‘flow’ as a state in which people are so involved in an activity that nothing else matters: the experience itself is so enjoyable that people will do it even at a high cost, for the sheer ‘joy’ of doing it. Flow has been described as having nine main components (Csikszentmihalyi, 1990; Sheridan & Byrne, 2002):
• No worry of failure—a feeling of being ‘in control’ • Clear goals—a feeling of certainty about what one is going to do • Immediate feedback—feedback confirming a feeling that everything is going
according to plan • Complete involvement—a feeling of being entirely focused • Balance of challenge and skill—a feeling of balance between the demands of the
situation and personal skills • No self-consciousness—not having to watch ourselves as if a third party while
concurrently performing the activity • Unaware of time—thoroughly focused on present and not noticing time passing • Merger of action and awareness—a feeling of automaticity about one’s actions • Autotelic experience—a feeling of doing something for its own sake
Although ‘flow theory’ has been widely used to analyse interactive experiences such as theatrical plays, sports or gaming, among the passive activities that can result in flow, is relaxing while listening to music (Lowis, 2002). This explains the link between enjoying a musical performance and optimal experience—when someone is really enjoying a musical performance, he or she is said to be in ‘flow state’. It has also been suggested that the flow model could be used as a reflective tool for monitoring, regulating and assessing the learning of music (Byrne, MacDonald, & Carlton, 2003; Sheridan & Byrne, 2002). However, not all of the nine dimensions of flow described by Csikszentmihalyi are applicable for a passive activity like listening to music. For example, when listening to music, there is no immediate feedback confirming that everything is proceeding according to plan.
Researchers have applied various methods to assess flow. Csikszentmihalyi (1990) used a method called ‘Experience Sample Method’ (ESM) which requires participants to answer a short questionnaire when they receive a random signal from an electronic beeper. Bakker (2005) suggested that a simple questionnaire may offer a reasonable alternative. Jackson and Marsh (1996) have developed and validated a questionnaire to measure the flow—a questionnaire with 36 items which they called the ‘Flow State Scale’ (FSS). FSS evaluates the nine dimensions of flow described by Csikszentmihalyi (1990). In our work, we used FSS based approach to develop most of the questionnaires. The original FSS instrument was modified considering only the questions applicable to a scenario of listening to music. The modified FSS consisted of six statements derived from the original FSS statements corresponding to complete involvement; merger of action and awareness; autotelic experience; unaware of time; balance of challenge and skill; and no self-consciousness. The
19
participants were asked to rate each statement on a five-point scale, ranging from 1 (strongly disagree) to 5 (strongly agree).
In addition to quantitative measurements, we used ‘observable indicators of the flow’ (Custodero, 1999, 2005) to obtain a qualitative measurement. Custodero (1999) originally used this method to analyze video data of young children participating in early childhood music activities. According to Custodero (2005), the following observations indicate that a person might be experiencing a flow state:
• Focused and immersed in the musical activity • Desire to repeat the task • Visible enjoyment once the activity has finished • Expresses feelings of high competency
In contrast, following behaviours indicates that a person is not in flow: • Frustration • Anxiety • Off task behaviour
Quantitative evaluation using ‘FSS score’ and qualitative observation using ‘observable indicators of the flow’ were used to cross-validate the data and thus provided a reliable method to assess whether a person is having an enjoyable experience. Nevertheless, the fact remains that a musical experience is much more than the measures of enjoyment, and complete characterisation of musical experience is still an open question.
The formal user study A user evaluation study was carried out with hearing-impaired people to examine the
effectiveness of the proposed system. The objective of the study was to find the answers to the following questions.
• Does the visual display enhance their experience? • Does the Haptic Chair enhance their experience? • Does a combined output (visual display together with the Haptic Chair) enhance their
experience? • What is the optimal configuration?—visual display alone, the Haptic Chair alone, or a
combination of a visual display and Haptic Chair. The studies were conducted in accordance with the ethical research guidelines provided by
the Internal Review Board (IRB) of the National University of Singapore and with IRB approval.
Participants, apparatus and procedure Forty-three hearing-impaired participants (28 partially deaf and 15 profoundly deaf
participants) took part in the study. Most of the participants had previous experience with music using speaker-listening techniques (keeping a hand on a normal diaphragm speaker). Their ages ranged from 12 to 20 years with a median age of 16 years. All participants had normal vision. The participants in this study were not from the same group of subjects who took part in the background survey and informal design interviews and therefore provided us with a fresh perspective. An expert sign language interpreter facilitated communication with the participants.
The study was carried out in a quiet room resembling a calm ‘home’ environment. A notebook computer with a 17-inch LCD display was used to present the visual effects. We did not include the size of the display as a variable in this study, and chose the commonly available 17-inch monitor that was both easily portable and widely available in homes and workplaces. During the various study blocks, participants were asked to sit on the Haptic Chair with their feet flat on the footrest and arms on the armrests, and/or to watch the visual
20
effects while listening to the music, or simply listen to the music. The subjects did not report any discomfort during or following this procedure. The visual display was placed at a constant horizontal distance (approximately 150 cm) and constant elevation (approximately 80 cm) from the floor. Participants switched off their hearing aids during the study.
Table 1. Conditions tested with a piece of music in the formal user study
Trial Visual Display Haptic Chair Task
A OFF OFF Follow the music
B ON OFF Follow the music while paying attention to the visual display
C OFF ON Follow the music while paying attention to the vibrations provided via the Haptic Chair
D ON ON Follow the music while paying attention to the visual display and vibrations provided via the Haptic Chair
The experiment was a within-subject 4×3 factorial design. The two independent variables were: Music sample (classical, rock, or beat only); and Test condition (neither visual display nor Haptic Chair; visual display only; Haptic Chair only; and visual display and Haptic Chair). The test samples of music were chosen based on the background survey results. MIDI renditions of Mozart’s Symphony No. 41, ‘It’s my life’ (a song by Bon Jovi), and a hip-hop beat pattern were used as classical, rock, and beat only examples, respectively. The duration of each of the three musical test pieces was approximately one minute.
For each musical test piece, there were four trial blocks as shown in Table 1. In all four blocks, in addition to the ‘Haptic Chair’ the music was played through a normal diaphragm speaker system (Creative™ 5.1 Sound Blast System). Before starting the trial blocks, each participant was told that the purpose of the experiment was to study the effect of the Haptic Chair and the visual display. In addition, they were given the opportunity to become comfortable with the Haptic Chair and the display. Also, the sound levels of the speakers were calibrated to each participant’s comfort level. Once the subject was ready, sets of stimuli were presented in random order. After each block, participants were asked to rate their experience by answering a modified FSS questionnaire. Upon completion of the four trials for a given piece of music, participants were asked to rank these four configurations (A, B, C and D as shown in Table 1) according to their preference. This procedure was repeated for the three different music samples. Each participant took approximately 45 minutes to complete the experiment. It took eight days to collect responses from 43 participants.
Results Overall results: The FSS score was calculated as a weighted average of the ratings given
for each question, and ranged from 0 to 1 where a FSS score of 1 corresponded to an optimal experience. The mean FSS score was plotted across all experimental conditions. From the results shown in Figure 7, it appeared that the Haptic Chair had a dominant effect on the FSS score. Also, as might be expected, the FSS score was minimal for the control situation in which both the visual display and Haptic Chair were turned off. A two-way repeated measures ANOVA analysis showed no main effect for music genres ( (2,504) 2.85, 0.16)F p= = . Also, there was no interaction between music genres and the four conditions ( (6,504) 1.11, 0.35)F p= = . However, there was a main effect for the four conditions ( (3,504) 589.18, 0.000001)F p= = . This suggested that the situation (whether the subjects were watching the Visual Display, sitting on the Haptic Chair, etc.) did have a significant effect on the FSS score.
21
321
1.0
0.8
0.6
0.4
0.2
0.0
Figure 7. Overall FSS score for 3 music samples under all experimental conditions with error bars showing 95% confident interval. ( A–music alone; B–music & visual display; C–music &
Haptic Chair; D–music, visual display & Haptic Chair.) Level of deafness vs. Experience: A two-way repeated measures ANOVA analysis was
carried out to study whether the level of deafness (partially deaf or profoundly deaf) has a significant effect on the FSS score (Figure 8). Analysis showed no main effect for level of deafness ( (1,508) 0.33, 0.56)F p= = and no interaction between the level of deafness and the four conditions ( (3,508) 1.38, 0.25)F p= = .
DCBA
1.0
0.8
0.6
0.4
0.2
0.0
Figure 8. Mean FSS score of partially deaf and profoundly deaf subjects for four different conditions with error bars showing 95% confident interval. (A–music alone, B–music & visual
Comparison of the four conditions: Since there was no significant effect for music genres and level of deafness, the mean FSS score was compared across the four different experimental combinations: music only; music and visual display; music and Haptic Chair; music, visual display and Haptic Chair using Tukey’s Honestly Significant Difference (HSD) test. We found that, mean FSS score of music with visuals (Trial B) was significantly higher
€
(p < 0.01) than music alone (Trial A); mean FSS score of music with Haptic Chair (Trial C) was significantly higher
€
(p < 0.01) than music alone (Trial A); mean FSS score of music, visuals and Haptic Chair together (Trial D) was significantly higher
€
(p < 0.01) than music alone (Trial A); and mean FSS scores of music, visuals and Haptic Chair together (Trial D) and music with Haptic Chair (Trial C) were significantly higher
€
(p < 0.01) than music and visuals (Trial B).
When the participants were asked to rank the most preferred configuration, 54% chose music together with the Haptic Chair. Forty six percent ranked music together with visuals and Haptic Chair as their first choice. None of the participants preferred other possible options (music alone, or music with a visual display). The low FSS scores for the ‘music alone’ and ‘music with visuals’ options can be explained by some of the comments received from the participants. One said:
“I can’t hear with the visuals alone, but when I get the vibrations (from the Haptic Chair), there is a meaning to the visuals.”
A profoundly deaf concert pianist said that he could detect almost all the important musical features via the Haptic Chair but wanted to feel musical pitch more precisely. When he was given an explanation of the options and the need for familiarisation with the system for such a high level input of information, he said he learned continuously throughout his initial test of the system and would continue to participate in refining the concept. Although the system appears to produce almost instant benefit, the importance of learning to use it should not be neglected—particularly for musicians.
The overall results of the user evaluation studies significantly supported the hypothesis that a combination of haptic and visual input would enhance the musical experience of the hearing-impaired. However, it was also observed that positive results were largely due to the influence from the Haptic Chair. The strategy of using abstract animations driven by music did not make as much impact as expected. Therefore, alternative means of using the visual channel were explored. In addition, further user studies were conducted to verify the strong positive feedback received for the Haptic Chair.
5. REFINEMENTS TO THE SYSTEM
5.1 Visual Display One of the significant observations made during the user study described in the previous
section was that the impact of the abstract visual patterns was low compared to the unanimous approval of the Haptic Chair. Therefore, several attempts were made to improve the visual display. One obvious extension was to incorporate 3D effects. Apart from that, a completely new approach was taken in which human gestures synchronised with music were used to convey a better musical experience.
3D abstract patterns It can be argued that a 3D visual display might provide an additional degree of freedom
compared to a 2D display. This additional dimension of 3D implementation allowed us to represent the time in a more intuitive manner. For example, as audible sound faded away, the corresponding sound also faded away into the screen. This was clearly visible in 3D version
23
compared to 2D version. Another particular improvement made using 3D capabilities was making the particles corresponding to non-‐percussive instruments to appear in the centre of the screen with an initial velocity towards the user then to accelerate away from the user (into the screen). As a result, it appeared to the user that the particle first came closer for a short instant, and then receded. This movement provided a looming effect as described by Seifritz et al. (2002). The colouring and presentation of particles were kept consistent with that of the 2D implementation described in the previous section. As for the percussive instrument based particles, the positions were still kept at the bottom of the screen in the 3D view. However, the behaviour was changed so that when such a particle appeared on screen, it made a rapid upward movement before disappearing. This upward movement simulates a pulsating effect corresponding to the beat of the music. Two deaf musicians worked with us reported that they usually feel the sounds of percussive instruments through their legs as if the sound came up from the ground. The Flint Particle Library (version 2.0) was used to implement 3D effects into the visual display.
Music visualisation with human gestures It has often been noted that hearing-‐impaired people employ lip-‐reading as part of the
effort to understand what is being said to them and hearing people sometimes resort to this when in a very noisy environment. One possible explanation derives from the hypothesis of ‘motor theory of speech perception’ which suggests that people in a challenging hearing environment perceive speech by identifying vocal gestures rather more than identifying sound patterns (Liberman & Whalen, 2000). This effect could be even more significant for people with hearing difficulties. McGurk and MacDonald (1976) found that seeing lip-movements corresponding to ‘ga’ resulted in the audible sound ‘ba’ being perceived as ‘da’ which suggested that watching human lip-movements might substantially influence the auditory perception. Moreover, Davidson (1993), Boone and Cunningham (2001) have shown that body movements contain important information about the accompanying music. This could be one of the possible explanations of why many people tend to enjoy live performances of music, even though a quiet room at home seems to be a more intimate and pristine listening environment. Combining these factors, the effects and experiences of hearing-impaired people were investigated when they were exposed to a simple series of ‘ba-ba’ lip-movements corresponding to the beat of the music.
Lip/Face animation We conducted a preliminary user study with hearing-impaired participants and found that
showing a facial movement pronouncing the syllable ‘ba’ synchronised with the beat of a song might be helpful to follow the music. This was assumed to be particularly true for songs with a strong beat. The closing and opening of lips while making a ‘ba’ movement, was something deaf people were likely to understand easily as verified by the preliminary user study. As a result, the visual display was replaced with a video recording of a young woman making lip movements corresponding with the audible sound ‘ba-ba’, even though this meant omitting a substantial amount of work done on realistic human motion synthesis (Xia & Wang, 2009).
An undergraduate student volunteered to make the facial/lip movements in synchrony with the music. Apart from making the lip movements, she was given specific instructions to make other facial changes to complement the lip movement. As the lips come together, the eyelids close a bit and the eyebrows lower. Also, her head tilted slightly to the front as it would when a person listening to music is beginning to move with the rhythm of the music. As soon as the lips are released to move apart, the eyes open more, eyebrows move upwards and the head gives a slight jerk backwards, keeping the lip movement in synchrony with the rest of the face. In addition, she was instructed not to ‘dance’ with the music since that would introduce
24
additional variables. Figure 9 shows some screen shots of a video recording where the human character makes lip and facial movements corresponding to the music being played.
Figure 9. Screen captures of a young woman making lip and facial movements
Conductor’s expressive gestures During our preliminary study, we found that the facial/lip movement strategy is most
suitable for music with a strong beat. However, a different approach was required to express the richness of a classical music piece. During a typical orchestral performance, an experienced conductor tends to transmit his or her musical intentions with highly expressive visual information through gestures often involving the whole body. Rudolf (1995) reported that a conductor’s left arm indicates features such as dynamics or playing style while the right arm indicates the beat (the latter being a presumably stronger intention in the majority of conductors since they are likely to be predominantly right handed: although, this might be of sufficient interest to merit a separate study). Therefore, to convey a better listening experience while listening to classical music, it was decided to show the conductor’s expressive gestures on a visual display while subjects sat on the Haptic Chair.
Figure 10. Screen captures of an orchestra conductor making expressive gestures
25
Wöllner and Auhagen (2008) have shown that watching the conductor from positions occupied by woodwind players and first violinists in many orchestral situations is perceptually more informative compared to the cello/double bass position. Therefore, a video camera was positioned next to the woodwind players, from which the conductor’s expressive gestures were recorded. These observations were made while a music director of the conservatory orchestra at the Yong Siew Toh Conservatory of Music was conducting Mendelssohn’s Symphony No. 4. Figure 10 shows some screen shots taken from a video recording. The proposed approach of showing lip/facial movements or an orchestra conductor’s expressive gestures synchronised to music were compared with the previously found best case (showing abstract animations synchronised with the music). The results are summarised in the Section 5.3.
5.2 The Haptic Chair As mentioned in the Section 4, the original version of the Haptic Chair received very
positive feedback from all of the hearing impaired users. Therefore, major modifications were not introduced. However, it was observed that the strength of the vibrations felt through hand-rest domes were considerably weaker compared to those at other locations of the chair (especially the back-rest and foot-rest). It might be possible that the strong vibrations from the back-rest and foot-rest of the chair override the vibrations felt at the hand-rest domes.
Figure 11. Photographs showing the modifications to the chair: (a) original version; (b) schematic drawing of the chair (F2–foot rest; B1 to B4–back rest; R2, R3–arm rest; ARD–plastic dome); (c) new location of the Nimzy speakers; (d) plastic dome was replaced by Xa-10 flat panel speakers
from TDK Therefore, the rigid plastic domes mounted on the hand-rests were replaced by a set of flat panel speakers (NXT™ Flat Panels Xa-10 from TDK) to improve the vibrations felt by the fingertips, a particularly important channel for sensing higher frequencies due to the concentration of Pacinian corpuscles in the glabrous skin of the hands (Burton, & Sinclair, 1996). These comfortably textured flat panel speakers were also a lower cost alternative to
26
produce stronger vibrations at the hand-rest compared to vibrations produced by the plastic dome structures originally positioned on the hand-rests overlying the Nimzy contact speakers. With this modification, the Nimzy contact speakers were moved backwards on the arm-rests towards the position where the elbow and long bones of the forearm contacted the wooden structure of the Haptic Chair. This enhanced the vibrations felt via wooden arm-rest. These modifications are shown in Figure 11.
The frequency response of the modified chair at position ‘ARD’ (position on the hand-rest as shown in Figure 11(b)) was compared with that of the previous prototype. The flat panel speakers operate similar to conventional diaphragm audio speakers, they do not directly vibrate the structure they are in contact with and hence do not introduce significant additional vibration to the chair structure. From Figure 12 it can be seen that the ‘new ARD’ has a stronger and flatter power spectrum magnitude than the former ‘ARD’. Thus, the introduction of the flat panel speakers provided better haptic input to the fingertips.
Figure 12. Comparison of the sound frequency response at the ‘ARD’ position of initial and revised
prototype
5.3 User Evaluation of the Revised System Three different user studies were carried out to evaluate the revised version of the visual
display and the Haptic Chair. The following sections include a summary of the experimental procedures, results and discussion. The studies were conducted in accordance with the ethical research guidelines provided by the IRB of NUS and with IRB approval.
Comparison of the proposed music visualisation strategies The objective of this study was to compare the performance of the two new visualisation
strategies proposed in this section. We hypothesized that showing human gestures directly corresponding to music might provide a more satisfying musical experience than watching previously developed abstract animations. In addition, we hypothesized that watching abstract visual effects in 2D space and 3D space might be different since 3D space offered an additional dimension to represent time. To test our hypotheses, we compared the effect of watching 2D abstract animations, 3D abstract animations and human gestures while listening to music sitting on the Haptic Chair.
Participants, apparatus and procedure Thirty-six subjects (21 partially deaf and 15 profoundly deaf, aged 12 to 20 years with a
median age of 15) took part in the study. All had normal vision. All the participants had taken
Power Spectrum Magnitude
(dB)
Sound Frequency (Hz)
27
part in our previous experiments. However, they were not exposed to the gestural conditions and music stimuli used in this experiment. An expert sign language interpreter’s service was used to communicate with the participants.
The study was carried out in a quiet room resembling a home environment. As in previous studies, a notebook computer with a 17-inch LCD display was used to present the visual effects and was placed at a constant horizontal distance (approximately 170 cm) from subjects and a constant elevation (approximately 80 cm) from the floor. During the various study blocks, participants were asked to sit on the Haptic Chair (keeping their feet flat on the foot rest, arms on the armrests and finger tips on the flat panel speakers), and to watch the visual effects while listening to the music. Participants were asked to switch off their hearing aids during the study.
Table 2. Three different trials for a piece of music used to compare different music visualisation
strategies Trial Visual Display Haptic Chair Remark A 2D ON Best known condition (Discussed in section 4) B 3D ON Implementation of the visual effects
C Human gestures ON ‘ba-‐ba’ lip/facial movement for the rock song; Orchestral conductor’s expressive gestures for the classical piece
The experiment was a within-subject 3×2 factorial design. The two independent variables
were: musical genres (classical and rock) and type of visuals (2D abstract patterns; 3D abstract patterns; and human gestures synchronised with the music). MIDI renditions of Mendelssohn’s Symphony No. 4 and ‘It’s my life’ (by Bon Jovi) were used as classical and rock examples, respectively. The duration of each of the two musical test pieces was approximately one minute. For each musical test piece, there were three blocks of trials as shown in Table 2. In all three blocks, in addition to the visual effects, music was played through the Haptic Chair. Before starting the blocks, the participants were given the opportunity to become comfortable with the Haptic Chair and the display. The sound levels of the speakers were calibrated to the participant’s comfort level. Once each participant was ready, stimuli were presented in a random order. The FSS instrument described in previous section was used to measure the experience of the participants. This procedure was repeated for the two different musical pieces. Each participant took approximately 25 minutes to complete the experiment. The experiment took seven days to collect responses from 36 participants.
Results Figure 13 shows the mean FSS score across for each experimental condition. From the
figure, it appears that watching human gestures with music has a dominant effect on the FSS score. A 2-way repeated measures ANOVA analysis showed no main effect for music genres ( (1,210) 0.51, 0.48)F p= = . However, there was a significant main effect for visual type ( (2,210) 90.29, 0.000001)F p= = . There was no interaction between music genres and three visualisation strategies ( (2,210) 0.19, 0.83)F p= = . Tukey’s HSD test was used to compare the average mean FSS score across the three different experimental combinations. Listening to music while watching synchronised human gestures (Trial C) was found to be significantly higher than the other two methods
€
(p < 0.01) .
28
ClassicalRock
1.0
0.8
0.6
0.4
0.2
0.0
Figure 13. Overall FSS score for all experimental conditions with error bars showing 95%
Synchronised gestures vs. asynchronised gestures One possibility for preferring watching human gestures rather than abstract patterns could
be the presence of a real human character. However we hypothesized that the tight synchronisation between music and gestures was an important factor in providing a satisfying musical experience. To test for this, a comparison of three different scenarios—human gestures synchronised with music, human gestures asynchronised with music and music without any visuals—was carried out. Asynchronised gestures and synchronized gestures contained the same gesturing patterns; the only difference in asynchronised gestures was that gesturing patterns and music had no correspondence.
Participants, apparatus and procedure Twelve participants (seven partially deaf and five profoundly deaf students) took part in
this study. All of them had taken part in the previous study but had not been exposed to the combination of gestural conditions and music stimuli used in this experiment. As previously, an expert sign language interpreter’s service was available to communicate with the participants. Same set up—a 17-inch LCD display placed at a constant horizontal distance (approximately 170 cm) and a constant elevation (approximately 80 cm) from the floor in a quiet room resembling a home environment—was used to present the visual effects.
Table 3. Three different trials for a piece of music were conducted to compare the effectiveness of
synchronised and asynchronised human gestures Trial Visual Display Haptic Chair Remark
A No visuals ON Control case
B Music with synchronised human gestures ON Gestures correspond to the music being
played
C Music with asynchronised human gestures ON Gestures do not correspond to the music
being played The experiment was a within-subject 3×2 factorial design. The two independent variables
were: musical genres (classical and rock); type of visuals (no visuals; music with
Mean FSS score
Music Sample
29
synchronised human gestures; and music with asynchronised human gestures). Same music samples used in the previous experiment (Mendelssohn’s Symphony No. 4 and ‘It’s my life’ by Bon Jovi) were used. For each musical test piece, the participants were shown three sets of stimuli—music alone, music with synchronised gestures, and music with asynchronised gestures in a random order. In all conditions, participants received feedback through the Haptic Chair as well. After presentation of each stimulus, participant’s experience was measured using the FSS instrument. This procedure was repeated for the two different musical pieces. Each participant took approximately 25 minutes to complete the experiment. Data was collected from the 12 participants over a period of three days.
Results
ClassicalRock
1.0
0.8
0.6
0.4
0.2
0.0
Figure 14. Overall FSS score for all experimental conditions with error bars showing the 95% confidence interval ( Trial A–no visuals, Trial B–music with synchronised gestures, Trial
C–music with asynchronised gestures)
Figure 14 shows the overall results across all experimental conditions. Music with synchronised gestures had the maximum score, music alone was the second best and music with asynchronised gestures had the lowest FSS score. A 2-way repeated measures ANOVA analysis showed no main effect for music genres ( (1,66) 0.53, 0.81)F p= = . However, there was a significant main effect for visual type ( (2,66) 118.19, 0.000001)F p= = . There was no interaction between music genres and three visualisation strategies ( (2,66) 0.303, 0.74)F p= = . Tukey’s HSD test revealed that mean FSS score of music with synchronised gestures (Trial B) was significantly higher
€
(p < 0.01) than music alone (Trial A); mean FSS score of music with synchronised gestures (Trial B) was significantly higher
€
(p < 0.01) than music with asynchronised gestures (Trial C); and mean FSS score of music alone (Trial A) was significantly higher
€
(p < 0.01) than music with asynchronised gestures (Trial C).
Music Sample
Mean FSS Score
30
Continuous monitoring of response to Haptic Chair Although the feedback about the Haptic Chair was uniformly positive, it was possible that
what we were measuring was in part due to novelty rather than anything specific about listening to music haptically. Therefore, we further investigated the validity of the 100% positive feedback received for the initial prototype of the Haptic Chair. If the unusually high positive feedback was not due to initial excitement of a novel technology, then the user response should continue to be positive after using the Haptic Chair for a longer period of time. To study this effect, the user satisfaction of the Haptic Chair was monitored over a period of three weeks.
The ISO 9241-11 defines satisfaction as ‘freedom from discomfort and positive attitudes to the use of the product’ (ISO 9241-11. Ergonomic requirements for office work with visual display terminals (VDTs)–Part 11: Guidance on usability, 1998). Satisfaction can be specified and measured by subjective ratings on scales such as ‘discomfort experienced’, ‘liking for the product’ and many other aspects of evaluating user satisfaction (Bevan, 1995; Chin, Diehl, & Norman, 1988; Lewis, 1995; Lund, 2001). In this work, satisfaction was measured using a questionnaire derived from the ‘Usefulness, Satisfaction, and Ease of use’ (USE) questionnaire (Lund, 2001). The modified USE questionnaire consisted of five statements indicating preference to the music piece; usefulness of the chair; level of comfort feeling vibration; ease of sitting on the chair for an extended period; and overall experience. Participants were asked to rate a statement (of modified USE) on a five-point scale, ranging from 1 (strongly disagree) to 5 (strongly agree). Overall satisfaction was calculated as a weighted average of the ratings given for the questions, and ranged from 0 to 1 where a score of 1 corresponded to an optimal satisfaction.
Participants and procedure Six participants (three partially deaf, three profoundly deaf) took part in this study. They
were randomly chosen from the 36 participants who took part in the initial study described in section 5.3. Each participant was given ten minutes to listen to music of their choice while sitting on the Haptic Chair. They were allowed to choose songs from a large collection of MP3 songs the included British rock songs, Sri Lankan Sinhalese songs and Indian Hindi songs. This procedure was repeated each day over a period of 22 days. On each day, after the sessions, participants were asked to comment on their experience. On days 1, 8, 15 and 22 (Monday of each week over four weeks), after ten minutes of informal listening, each of the participants were given the chance to listen to two test music samples—Mendelssohn’s Symphony No. 4 and ‘It’s my life’ by Bon Jovi (the same samples used in the previous experiment). After listening to two test music samples, they were asked to answer a simple questionnaire. User satisfaction was calculated from the responses.
Results Figure 15 shows the overall satisfaction of the users measured on days 1, 8, 15 and 22. All
six participants were very satisfied with the experience of Haptic Chair throughout the experiment. In fact, after two weeks of continuous use, all of them requested to increase the time (ten minutes) they were provided within a study session. Therefore, the duration for each participant was increased and each participant was offered the opportunity to ‘listen’ to music for 15 minutes per day during the last week of the study. One-way ANOVA analysis confirmed that there was no significant difference in the observed level of satisfaction ( (3,44) 0.64, 0.59)F p= = . This suggests that a participant’s satisfaction with the Haptic Chair remained unchanged even after using it for ten minutes every day for a period of more than three weeks. The initial response was very positive and there was little room for improvement.
31
Figure 15. Mean ‘USE’ score of satisfaction monitored from six participants over a period of three weeks. (Bars at each data point show the 95% confidence intervals)
6. Discussion The analysis of results in Section 4 showed that the Haptic Chair has the potential to
significantly enhance the musical experience for people with hearing impairments. In this study we limited the test stimuli to three samples each lasting one-minute from three different music genres. This followed from the decision to limit the total time spent by each participant to 45 minutes since a longer time might have reduced the concentration and interest of the participants. Within 45 minutes we could only test three music samples (of duration one minute) because each sample was played four times under four different conditions. The subjects also had to answer several questions after each trial. Based on previous experience, we believe listening to the music for one minute would be adequate for our hearing-impaired participants to answer the questionnaire. Our observations during the formal study were similar to the ‘observable indicators of flow experience’ reported by Custodero (2005) which suggests that a duration of one minute was long enough for the subjects to have had an enjoyable experience. For example, one very excited participant said that it was an amazing experience unlike anything she had experienced before. She reported that now she feels like there is no difference between herself and a hearing person. She preferred the combination of the Haptic Chair and visual display, but added that, if she could see the lyrics (karaoke-style) and if she had the opportunity to change the properties of the visual display (colour, objects, how they move, etc.), it would make the system even more effective. Moreover, we had an informal session with our participants during which they were allowed to use the chair for a longer period (more than ten minutes). The observed reactions were similar to those during the formal study in which subjects listened to music samples of one-minute duration. These observations collectively support the reliability of the results based on samples of one minute.
In general, 3D visuals have the potential to increase the richness of mappings as well as the aesthetics of the display compared with a 2D design. However, the overall responses obtained from the deaf users of both 2D and 3D abstract patterns were not significantly different from each other. Many participants reported that they could ‘hear’ better when watching human gestures while listening to music and seated in the Haptic Chair. Referring to face/lip movements and conductor’s gestures, some participants said these (gestures) “are more musical”. Only one participant commented that the conductor’s gestures were “difficult to understand”. Perhaps this was because the conductor’s gestures were particularly subtle.
Mean satisfaction score based on ‘USE’
scale
1 8 15 22 Total days of experiencing the Haptic Chair
32
Many participants said, “the visuals are wrong” when they listened to music with asynchronised gestures. Only one participant could not tell the difference between synchronised and asynchronised gestures for the rock song (the 'ba-ba’ lip movements). She could still differentiate between synchronised and asynchronised gestures for the classical music (the orchestral conductor’s gestures). All the participants preferred to watch human body movements synchronised with music. When asked for the reason for this, some of the participants said they could ‘hear’ better; however, they were unable to clarify this further. The reason for the combination of human gestures synchronised with music being preferred by the participants over abstract patterns could have been due to the presence of a human character. However, when the music and gestures were asynchronised, almost all the participants observed the fact and expressed their dislike for it. This suggests that there is little to be gained by showing human gestures with music unless the gesturing patterns and music are tightly synchronised. From the statistical analysis, comments received from the participants and their observed level of excitement, it appeared that the use of human gestures might be a promising way of enhancing musical experience through visuals. Brain imaging techniques might provide a fuller explanation for the preference to watch human gestures, but this approach was not within the scope of this research project.
The participants’ reactions to the Haptic Chair were continuously monitored as a way of controlling for a possible novelty effect in our previous data. However, the level of enthusiasm was maintained throughout the extended experiment. Many of the participants told us that they could identify the rhythm of a song/piece of music and could ‘hear’ the song/piece of music much better than when using standard hearing aids. A few participants who were born with profound deafness said that this was the first time they actually ‘heard’ a song and they were extremely happy about it. They expressed a wish to buy a similar Haptic Chair and connect it to the radio and television at home. Although it is difficult to know exactly what the subjects were experiencing, the majority (more than 80%) of the profoundly deaf participants appeared to be ‘hearing’ something when they were seated in the chair. There were occasions when some participants were unhappy when they were told that his/her session was over. After two weeks, the six participants were told that they did not have to come every day to take part in the experiment if they were not willing to do so. However, all the participants reported that they looked forward to the listening session. In fact, all participants wanted to listen to music using the Haptic Chair for a longer duration. None seemed to get bored with the Haptic Chair. Some of the important comments received were:
“I am really happy.”
“This is very good.” “I feel like taking this home.”
“Can I sit for 5 more minutes?” “10 minutes is not enough.”
“I couldn’t hear the lyrics.” “So much better than listening to radio at home.”
During this experiment, while one of the participants (a profoundly deaf student) was listening to music, a recording of speech was played through the Haptic Chair and he was asked whether he could hear the ‘music’. He reported that it was not music! Since all the participants were making frequent positive comments and not criticising the Haptic Chair; they were specifically asked to make negative comments. However, none of the participants made any negative comments other than reporting that they could not hear the lyrics if a song was played. Overall it appeared that everyone who used the Haptic Chair enjoyed the
33
experience very much. This positive response was not due to the fact that it was a completely new experience for them. If it was due to initial excitement, the response was likely to decrease as they used the Haptic Chair for more than three weeks. However, the response at the end of the last day was as good as or even better than the response on the first day. On the last day of the experiment, when the participants were told that the experiment was over, one of them said, “I am going be deaf again”, believing that she would not get another chance to experience the Haptic Chair.
The authors did not want to make any assumptions about the benefits or otherwise of manipulating the frequency content of the haptic output to the user. Therefore the Haptic Chair described in this paper deliberately avoided pre-processing the music and delivered the entire audio stream to the separate vibration systems targeting the feet, back, arms and hands. In fact, as mentioned in the introduction, any additional or modified information delivered through the haptic sense might actually disrupt the musical experience, and this confounding effect is potentially more significant for the deaf. This is because deaf people have extensive experience in sensing vibrations that occur naturally in an acoustic environment via whole body input. Most of the existing devices mentioned in the background section pre-process the audio signal taking the frequency range of tactile sensation into account before producing a tacile output. We conducted a preliminary study to observe the response to frequency scaled music (all the frequencies were scaled down by a factor of five) played through the Haptic Chair. Although this kind of frequency scaling effectively generates lower frequency vibrations which might be more easily felt than higher frequency vibrations, pitch variations in the music were diminished and the richness of musical content was lower in the frequency scaled version. This might have been one reason why our subjects disliked frequency-scaled audio during the preliminary study. This reduction in audio quality was easily detected by hearing people; however, it was important to note that even the hearing-impaired could still feel this effect. In addition to our strategic motivation of not manipulating the signal naturally available for tactile music perception, we believe that the role played by higher frequencies in tactile perception is still an open question as the frequency response curves reported in the literature have only been measured with sine tones (Verillo, 1991). It is possible that the role of higher frequencies in more realistic audio signals, for instance in creating sharp transients, could still be important. Another exciting possibility is that, in addition to tactile sensory input, bone conduction might be providing an additional route for enhanced sensory input. Bone conduction of sound is likely to be very significant for people with certain hearing impairments and a far greater range of frequencies is transmitted via bone conduction of sound compared with purely tactile stimulation (Lenhardt et al., 1991).
Feedback received from the two deaf musicians was valuable although they typically perform for hearing audiences and therefore might not have had any special insight into deaf audiences with either limited or no musical training. However, one of the musicians also teaches deaf children and therefore offered a more balanced opinion. Various categories of deaf listeners might need to be addressed differently using the kinds of assistive technologies we are exploring. Musical backgrounds and tastes differ for the deaf as widely as for hearing people. The deaf community can be categorised based on their music competency and involvement—deaf people who have a music background and are able to enjoy music; deaf people who have no music knowledge, but appreciate music; deaf people who do not have any music background or experience, but want to know more about music; and deaf people who have no musical background at all and are not able to appreciate music and/or are not interested in music as it is normally presented/sensed. This research was not focused on any specific category in terms of different skill levels or musical tastes. Nevertheless, the deaf musicians who participated in this series of studies provided valuable insight at the early stage of the system design. Also the feedback received from the participants at the sequential
34
user evaluation stages regarding their specific needs provided additional insight to a better understanding of the target audience. The findings of this series of research studies might have been confounded by cultural differences between the Sri Lankan population who took part in several of the user studies and other cultural groups, or between different age groups but we believe the beneficial effect can be generalised since a reasonably large sample of ethnic backgrounds were sampled and even hearing people reported their approval of the enhanced effect of listening to music of their choice (or during other activities such as computer games in which sound plays an important part) while seated in the Haptic Chair.
7. CONCLUSION AND FUTURE DIRECTIONS
7.1 Summary of Results This paper presented the systematic development of a prototype system to enhance the
musical experience of the hearing-impaired using human-centred design techniques. The findings from the initial survey summarised in Section 3 guided the decision to use a combination of visual and tactile information to help convey a musical experience.
As described in the second part of the system description, novel system architecture was developed to produce real-time abstract visual effects corresponding to the music being played. This architecture allows the rapid prototyping of real-time music visualisations and was used as the keystone to develop music-to-visual abstract animations. For the tactile input, a system based on a wooden chair that amplifies audio vibrations of music was developed. The main concept behind the development of the Haptic Chair was to enhance the natural vibrations produced by music. The first working prototype consisted of two main components—an informative visual display and a Haptic Chair.
This initial system was evaluated by a formal user study with 43 deaf participants from the Dr. Reijntjes School for the Deaf, Sri Lanka. This study suggested that the Haptic Chair was capable of substantially enhancing the musical experience of deaf people, both children and adults. The Haptic Chair received 100% positive feedback but many participants reported that the display of abstract animation alone was not very effective. However, they reported that visual effects conveyed additional musical meaning when presented together with the Haptic Chair. Some of the deaf participants were able to sing with the music while sitting on the Haptic Chair and watching karaoke-style lyrics.
In the revised prototype, the effect of showing human gestures corresponding to music was compared with the abstract animations we developed based on fairly well accepted principles. From the results of the user studies, it was found that human gestures synchronised with music are capable of providing a better sense of the music compared with our abstract animations, and many participants reported that gestures were “more musical”. It was found that this preference to watch gestures was not due merely to the visual presence of a human character. When the human gestures and music were not synchronised, many hearing-impaired participants said that the “gestures don’t make sense”. It can be concluded that showing human gestures synchronised with music might be an effective way of conveying a musical experience using visual displays.
Strong positive feedback received for the Haptic Chair during the first round of user studies called for further investigation. It was possible that this positive response could have been due to the initial excitement of using a new technology. A group of deaf participants used the Haptic Chair every day over a period of three weeks and none became bored with the chair. In fact, they kept asking for longer durations to ‘listen’ to music. Their level of satisfaction was sustained during this extended period. These results showed that the Haptic Chair truly provided useful feedback to hearing-impaired users.
35
The study showed that the hearing-impaired users preferred to feel the vibrations generated by the music without any alterations to the audio stream. This suggests that musical representation for the hearing-impaired should focus on staying as close to the original as possible, and is best accomplished by conveying the physics of the representation via an alternate channel of perception. The system proposed in this paper has several ways of conveying music to the hearing-impaired—through feeling sound-induced vibrations via touch, via bone conduction of sound and watching human gestures synchronised with music. These different modalities individually or in combination provided a very satisfactory experience to almost all the hearing-impaired people who used the system.
7.2 Future Work During the first formal user study, one of the sign language interpreters (a qualified speech
therapist) wanted to use the Haptic Chair when training deaf people to speak. When she conducted her speech therapy programme with and without the Haptic Chair, she expressed confidence that the Haptic Chair would be a valuable aid in this kind of learning. The Haptic Chair was modified so that the user was able to hear/feel the vibrations produced by the voice of the speech therapist and their own voice. With this modification, the Haptic Chair is currently being tested to explore its effectiveness for speech therapy. The speech therapist is currently conducting her regular speech therapy program with three groups of students under three different conditions: (1) haptic chair with no sound/vibration output; (2) haptic chair with complete sound/vibration output; (3) regular speech therapy program without the Haptic Chair. The preliminary improvements displayed by the deaf users indicate the possibility of significantly improving their competence in pronouncing words through use of the Haptic Chair during speech therapy sessions.
One of the limitations of experiencing music through the Haptic Chair was the fact that hearing-impaired people could not clearly hear the lyrics of a song. One possible solution for this is to use Amplitude Modulated (AM) ultrasound. Staab et al. (1998) found that when speech signals are used to modulate the amplitude of an ultrasonic carrier signal, the result was clear perception of the speech stimuli and not a sense of high-frequency vibration. It is possible to use this technology to modulate a music signal using an ultrasonic carrier signal that might result in clear perception of lyrics in a song or a piece of music. This concept is currently being developed by our research team and preliminary tests have shown that hearing is possible via ultrasonic bone conduction. One profoundly deaf participant was able to differentiate AM music and speech. He preferred the sensation when music was presented through AM ultrasound over speech presented through AM ultrasound. Since he was profoundly deaf from birth, he could not explain what he heard but simply reported that he preferred the sensation obtained from the sample of music delivered through AM ultrasound. These observations open up an entirely new field to explore.
The work by Karem et al. (2009) suggests that emotional responses are stronger when different parts of the musical signal (separated by frequency regions or by instrumental part) are delivered through different vibration elements to different locations on a user’s back. One explanation for the improved enjoyment is that there might be masking of some portions of the audio signal that is eliminated by the spatial separation of musical or frequency components. Another explanation relates to the difference between the nature of the signals typically processed by the skin and the ear. Multiple sound sources excite overlapping regions of the cochlea, and the auditory cortex has evolved to perform source segregation under such conditions, whereas multiple sources of tactile stimuli sensed through touch are typically represented by distinct spatial separation. One possible future study would be to determine whether multiple sources could be detected when delivered through a single
36
channel of vibrotactile stimulation. If not, spatially segregating the sources might significantly enhance the musical information available.
The methodology outlined in this paper might also enhance the enjoyment of music for hearing people and those with narrow sound frequency band ‘drop-outs’. The latter is a relatively common form of hearing loss that is often not severe enough to classify the person as deaf but might interfere with their enjoyment of music or conversation, and is more common in older people or those who have been exposed to loud noise. The Haptic Chair has the potential to bridge these gaps to support music or other types of acoustic enjoyment for this community. This research project opens multiple new avenues of related work. We hope that our work might be a ‘prelude’ to many more musical and other enjoyable sounds for the deaf community to experience!
37
NOTES
Background: This article is based on the Ph.D. dissertation of the first author
Acknowledgments: The authors gratefully acknowledge the support of Dr. Reijntjes School for the Deaf, Sri Lanka. In addition, we would like to thank the reviewers for valuable suggestions for improvements to the paper. Finally, we are grateful for all the help provided by our colleagues at various stages of this project.
Authors’ Present Addresses. Suranga Chandima Nanayakkara, Singapore University of Technology and Design, 20 Dover Drive, Singapore, 138682. E-mail: [email protected]. Lonce Wyse, Communications And New Media Programme, Faculty of Arts and Social Sciences, National University of Singapore, Block AS3 #04-09, 3 Arts Link, Singapore 117570. E-mail: [email protected]. S H Ong, Department of Electrical and Computer Engineering, National University of Singapore, 4 Engineering Drive 3, Singapore 117583. E-mail: [email protected]. Elizabeth Taylor, Marine Mammal Research Laboratory, Tropical Marine Science Institute, National University of Singapore, 18 Kent Ridge Road, Singapore 119227. E-mail: [email protected].
HCI Editorial Record. (Supplied by Editor)
REFERENCES Abramovich, S. J. (1978). Auditory perception of ultrasound in patients with sensorineural
and conductive hearing loss. The Journal of Laryngology & Otology 92, 861-867.
Bakker, A. B. (2005). Flow among music teachers and their students: The crossover of peak experiences. Journal of Vocational Behavior 66(1), 26-44.
Bevan, N. (1995). Measuring usability as quality of use. Journal of Software Quality, 4(2), 115-130.
Boone, R. T., & Cunningham, J. G. (2001). Children’s expression of emotional meaning in music through expressive body movement. Journal of Nonverbal Behavior, 25(1), 21-41.
Burton, H., & Sinclair, R. (1996). The Psychophysics of Tactile Perception and Its Peripheral Physiological Basis. In L. Kruger (Ed.), Pain and Touch (pp. 25-103). San Diego: Academic Press.
Byrne, C., MacDonald, R., & Carlton, L. (2003). Assessing creativity in musical compositions: flow as an assessment tool. British Journal of Music Education, 20 (3), 277-290.
Chew, E. (2001, August 1-4 ). Modeling Tonality: Applications to Music Cognition. Paper presented at the 23rd Annual Meeting of the Cognitive Science Society, Edinburgh, Scotland, UK.
Chew, E., & Chen, Y. C. (2003). Mapping MIDI to the spiral array: disambiguating pitch spellings. Paper presented at the 8th INFORMS Computing Society Conference (ICS ’03), Chandler, Ariz, USA
Chew, E., & Chen, Y. C. (2005). Real-time pitch spelling using the spiral array. Computer Music Journal, 29(2), 61-76.
38
Chin, J. P., Diehl, V. A., & Norman, K. L. (1988, 15-19 May). Development of an instrument measuring user satisfaction of the human-computer interface. Paper presented at the ACM Conference on Human factors in computing systems (CHI'88), Washington, D.C., United States.
Csikszentmihalyi, M. (1975). Beyond Boredom and Anxiety. San Francisco, CA, USA: Jossey-bass.
Csikszentmihalyi, M. (1990). Flow: The psychology of optimal experience. New York: HarperCollins.
Custodero, L. A. (1999). Construction of musical understandings: The cognition-flow interface. Bulletin for the Council of Research in Music Education, 142, 79-80.
Custodero, L. A. (2005). Observable indicators of flow experience: a developmental perspective on musical engagement in young children from infancy to school age. Music Education Research, 7(2), 185-209.
Cytowic, R. E. (1989). Synaesthesia: a Union of the Senses. New York: Springer-Verlag.
Davidson, J. (1993). Visual perception of performance manner in the movements of solo musicians. Psychology of Music, 21(2), 103-113.
Deatherage, B., Jeffress, L., & Blodgett, H. (1954). A Note on the Audibility of Intense Ultrasonic Sound. Journal of the Acoustical Society of America 26(4), 582.
DeNora, T. (2000). Music in everyday life. Cambridge: Cambridge University Press.
DiPaola, S., & Arya, A. (2006). Emotional remapping of music to facial animation. Paper presented at the Proceedings of the 2006 ACM SIGGRAPH symposium on Video games.
Dobie, R., Wiederhold, M., & Lenhardt, M. (1992). Ultrasonic Hearing. Science, 255(5051), 1584-1585.
Donnadieu, S., S. McAdams, & Winsberg., S. (1994). Context Effects in 'Timbre Space. Paper presented at the Proceedings of the 3rd International Conference on Music Perception and Cognition.
Evans, B. (2005). Foundations of a Visual Music. Computer Music Journal, 29(4), 11–24.
Evans, E. F. (1968). Corical representation. In A.V.S. de Reuck and J. Knight (Ed.), Hearing Mechanisms in Vertebrates. Churchill, London.
Gabrielsson, A., & Lindstrom, S. (2000). Strong experiences of and with music. In D. Greer (Ed.), Musicology and sister disciplines; past, present, future (pp. 100-108). Oxford: Oxford University Press.
Glennie, D. E. Hearing Essay. Retrieved Jul. 8, 2009, from http://www.evelyn.co.uk/live/ hearing_essay.htm.
Gunther, E., Davenport, G., & O'Modhrain, S. (2002). Cutaneous grooves: Composing for the sense of touch. Paper presented at the Conference on New interfaces for musical expression (NIME'02).
Henry, P., & Letowski, T. R. (2007). Bone conduction: Anatomy, Physiology, and Communication. MD USA: Army Research Laboratory Aberdeen Proving Ground.
Hevner, K. (1935). The affective character of the major and minor mode in music. American Journal of Psychology, 47(1), 103-118.
39
Ho-Ching, F. W., Mankoff, J., & Landay, J. A. (2003). Can you see what I hear? The design and evaluation of a peripheral sound display for the deaf. Paper presented at the ACM Conference on Human factors in computing systems (CHI’03).
Hosoi, H., Imaizumi, S., Sakaguchi, T., Tonoike, M., & Murata, K. (1998). Activation of the auditory cortex by ultrasound. Lancet, 351(9101), 496-497.
Howard, I. P. (1966). Human Spatial Orientation. London, England: Wiley.
Hubel, D. H., & Wiesel, T. N. (1968). Receptive fields and functional architecture of monkey striate cortex. Journal of Physiology, 195, 215-243.
Imaizumi, S., Hosoi, H., Sakaguchi, T., Watanabe, Y., Sadato, N., Nakamura, S., et al. (2001). Ultrasound activates the auditory cortex of profoundly deaf subjects. Neuroreport, 12(3), 583-586.
ISO 9241-11. Ergonomic requirements for office work with visual display terminals (VDTs)–Part 11: Guidance on usability. (1998).). Switzerland: International Organization for Standardization (ISO).
Jackson, S. A., & Marsh, H. W. (1996). Development and validation of a scale to measure optimal experience: The Flow State scale. Journal of Sport and Exercise Psychology, 18 (1), 17-35.
Jones, R., & Nevile, B. (2005 ). Creating Visual Music in Jitter: Approaches and Techniques. Computer Music Journal, 29(4), 55-70.
Karam, M., Russo, F.A., & Fels, D.I. (2009). Designing the Model Human Cochlea: An Ambient Crossmodal Audio-Tactile Display. IEEE Transactions on Haptics. 2(3). 160-169
Karam, M., Nespoli, G., Russo, F., & Fels, D. I. (2009). Modelling perceptual elements of music in a vibrotactile display for deaf users: A field study. Paper presented at the 2nd International Conferences on Advances in Computer-Human Interactions.
Karam, M., Russo, F. A., Branje, C., Price, E., & Fels, D. (2008). Towards a model human cochlea. Paper presented at the Graphics Interface.
Kawanobe, M., Kameda, M., & Miyahara, M. (2003). Corresponding affect between music and color. Paper presented at the IEEE International Conference on Systems, Man and Cybernetics.
Kayser, C., Petkov, C. I., Augath, M., & Nikos K. Logothetis. (2005). Integration of Touch and Sound in Auditory Cortex. Neuron 48(2), 373-384.
Kerwin, S. (2005, Oct. 22, 2005). Can you feel it? speaker allows deaf musicians to feel music. Retrieved Jul. 8, 2009, from http://www.brunel.ac.uk/news/pressoffice/ pressreleases/2005/cdata/october/vibrato
Lamoré, P. J. (1984). Vibrotactile threshold for hairy skin and its transformation into equivalent bone-conduction loss for the mastoid. Audiology, 23 (6), 537-551.
Lederman, S. J. & Klatzky, R. L. (2009). Haptic perception: a tutorial. Attention Perception and Psychophysics, 71(7), 1439-1459.
Lenhardt, M., Skellett, R., Wang, P., & Clarke, A. (1991). Human ultrasonic speech perception. Science, 253(5015), 82-85.
40
Levitin, D. (2007 ). Re: Music Through vision and Haptics, Personal E-mail.
Lewis, J. R. (1995). IBM computer usability satisfaction questionnaires: psychometric evaluation and instructions for use. International journal of Human-Computer Interaction, 7(1), 57-78.
Liberman, A., & Whalen, D. (2000). On the relation of speech to language. Trends in Cognitive Sciences, 4(5), 187-196.
Lowis, M. J. (2002). Music as a Trigger for Peak Experiences Among a College Staff Population. Creativity Research Journal, 14(3), 351-359.
Lund, A. M. (2001). Measuring Usability with the USE Questionnaire (Vol. 8). STC Usability SIG Newsletter.
Marks, L. E. (1974). On associations of light and sound: the mediation of brightness, pitch, and loudness. American Journal of Psychology, 87(1-2), 173-188.
Matthes, O. (2002). Flashserver external for Max/MSP. 1.1. Retrieved Jul. 8, 2009, from http://www.nullmedium.de/dev/flashserver
Matthews, T., Fong, J., & Mankoff, J. (2005). Visualizing non-speech sounds for the deaf. Paper presented at the 7th international ACM SIGACCESS conference on Computers and accessibility, Baltimore, MD, USA.
McGurk, H., & MacDonald, J. (1976). Hearing lips and seeing voices. Nature, 264(5588), 746-748.
McLeod, P., & Wyvill, G. (2003). Visualization of musical pitch. Paper presented at the Proceedings of the Computer Graphics International IEEE.
Melara, R. D. (1989). Dimensional interaction between color and pitch. Journal of Experimental Psychology: Human Perception and Performance, 15(1), 69-79.
Meredith, M. A. (2002). On the neuronal basis for multisensory convergence: a brief overview. Cognitive Brain Research, 14(1), 31-40.
Mitroo, J. B., Herman, N., & Badler, N. I. (1979). Movies from music: Visualizing musical compositions. SIGGRAPH Comput. Graph, 13(2), 218-225.
Myles, K., & Binseel, M. S. (2007). The Tactile Modality: A Review of Tactile Sensitivity and Human Tactile Interfaces. MD USA.
Nanayakkara, S. C., Taylor, E., Wyse, L., & Ong, S. H. (2009). An enhanced musical experience for the deaf: design and evaluation of a music display and a haptic chair. In Proceedings of the 27th international Conference on Human Factors in Computing Systems (Boston, MA, USA, April 04 - 09, 2009). CHI '09. ACM, New York, NY, 337-346.
O'Modhrain, S., & Oakley, I. (2003). Touch TV: Adding Feeling to Broadcast Media. In proceedings of the European Conference on Interactive Television: from Viewers to Actors, 41-47.
Palmer, R. (1994). Tac-tile sounds system (TTSS). Retrieved Jul. 8, 2009, from http://www.kolumbus.fi/riitta.lahtinen/tactile.html.
Palmer, R. (1997). Feeling Music, Based on the paper presented at the 3rd Nordic Conference of music therapy, Finland.
41
Reed, C. M. (1996). The implication of the Tadoma Method of speechreading for spoken language processing. Paper presented at the 4th International Conference on Spoken Language, Philadelphia, PA, USA.
Rudolf, M. (1995). The grammar of conducting: A comprehensive guide to baton technique and interpretation (3 ed.). New York: Schirmer Books.
Scheirer, E. (2000). Music listening systems. Massachusetts Institute of Technology.
Schutz, M., & Lipscomb, S. (2007). Hearing gestures, seeing music: Vision influences perceived tone duration. Perception, 36(6), 888-897.
Seifritz, E. Neuhoff, J. G., Bilecen, D., Scheffler, D., Mustovic, H., Schächinger,H., Elefante, R., & Di Salle, F. (2002) Neural processing of auditory 'looming' in the human brain. Current Biology, 12, 2147-2151
Sheridan, M., & Byrne, C. (2002). Ebb and flow of assessment in music. British Journal of Music Education, 19(2), 135-143.
Sherrick, C. E. (1953). Variables affecting sensitivity of the human skin to mechanical vibration. Journal of Experimental Psychology, 45, 273-282.
Shibata, D. (2001). Brains of Deaf People "Hear" Music (Vol. 16): International Arts-Medicine Association Newsletter.
Sloboda, J. A., O’Neill, S. A., & Ivaldi, A. (2001). Functions of music in everyday life: an exploratory study using the Experience Sampling Method. Musicae Scientiae, 5(1), 9-29.
Smith, S., & Williams, G. (1997). A visuaization of music. Paper presented at the 8th conference on Visualization '97, Phoenix, Arizona, United States.
Staab, W., Polashek, T., Nunley, J., Green, R., Brisken, A., Dojan, R., et al. (1998). Audible Ultrasound for Profound Losses. The Hearing Review, 36, 28-32.
Taylor, K. I., Moss, H. E., Stamatakis, E. A., & Tyler, L. K. (2006). Binding crossmodal object features in perirhinal cortex. National Academy of Sciences, 103(21), 8239-8244.
Taylor, R., Boulanger, P., & Torres, D. (2005). Visualizing emotion in musical performance using a virtual character. Paper presented at the 5th International Symposium on Smart Graphics, Munich, Germany.
Taylor, R., Torres, D., & Boulanger, P. (2005). Using music to interact with a virtual character. Paper presented at the International Conference on New Interfaces for Musical Expression (NIME'05), Vancouver, Canada.
Thompson, W. F., Russo, F. A., & Quinto, L. (2008). Audio-visual integration of emotional cues in song. Cognition and Emotion, 22(8), 1457-1470.
Tillmann, B., Koelsch, S., Escoffier, N., Bigand, E., Lalitte, P., Friederici, A., et al. (2006). Cognitive priming in sung and instrumental music: Activation of inferior frontal cortex. NeuroImage, 31(4), 1771-1782.
Verillo, R. T. (1962). Investigation of some parameters of the cutaneous threshold for vibration. Journal of the Acoustical Society of America, 34, 1768-1773.
Verillo, R. T. (1992). Vibration sensing in humans. Music Perception, 9(3), 281-302.
Vines, B. W., Krumhansl, C. L., Wanderley, M. M., & Levitin, D. J. (2006). Cross modal interactions in the perception of musical performance. Cognition, 101(1), 80-113.
42
Weisenberger, J. M. (1996). Touch and proprioception. In J. E. Birren (Ed.), Encylopedia of. Gerontology (Vol. 2, pp. 591-603). San Diego: Academic Press.
Whitfield, I. C., & Evans, E. F. (1965). Responses of auditory cortical neurones to stimuli of changing frequency. Journal Sound and Vibration. 21, 431-448.
Wöllner, C., & Auhagen, W. (2008). Perceiving conductors’ expressive gestures from different visual perspectives. An exploratory continuous response study. Music Perception, 26(2), 143-157.
Xia, S. H., & Wang, Z. Q. (2009). Recent advances on virtual human synthesis. Science in China Series F: Information Sciences, 52(5), 741-757.