Enhancing Road Maintenance in the OIC Member States COMCEC COORDINATION OFFICE March 2016 Standing Committee for Economic and Commercial Cooperation of the Organization of Islamic Cooperation (COMCEC)
Transcript
Enhancing Road Maintenance in the OIC Member States
COMCEC COORDINATION OFFICE March 2016
Standing Committee for Economic and Commercial Cooperation of the Organization of Islamic Cooperation (COMCEC)
Enhancing Road Maintenance in the OIC Member States
COMCEC COORDINATION OFFICE March 2016
Standing Committee for Economic and Commercial Cooperation of the Organization of Islamic Cooperation (COMCEC)
This report has been commissioned by the COMCEC Coordination Office to International Road Federation (IRF). Views and opinions expressed in the report are solely those of the author(s) and do not represent the official views of the COMCEC Coordination Office or the Member States of the Organization of Islamic Cooperation. Excerpts from the report can be made as long as references are provided. All intellectual and industrial property rights for the report belong to the COMCEC Coordination Office. This report is for individual use and it shall not be used for commercial purposes. Except for purposes of individual use, this report shall not be reproduced in any form or by any means, electronic or mechanical, including printing, photocopying, CD recording, or by any physical or electronic reproduction system, or translated and provided to the access of any subscriber through electronic means for commercial purposes without the permission of the COMCEC Coordination Office.
For further information please contact: COMCEC Coordination Office Necatibey Caddesi No: 110/A 06100 Yücetepe Ankara/TURKEY Phone: 90 312 294 57 10 Fax: 90 312 294 57 77 Web: www.comcec.org
2. A FRAMEWORK FOR ROAD MAINTENANCE ....................................................................................................... 9
2.1. What is Maintenance? ...................................................................................................................................................... 9
2.2. Framework for Road Maintenance ......................................................................................................................... 10
3. THE IMPORTANCE OF ROAD MAINTENANCE AND THE BEST PRACTICES ............................................ 13
3.1. The Reasons for the “Maintenance Gap” .............................................................................................................. 13
3.2. Roads as an Economic Motor .................................................................................................................................... 14
3.3. The Case for Road Maintenance ............................................................................................................................... 16
3.3.1. Reduction in the value of road assets ......................................................................................................... 17
3.3.2. Higher vehicle operating and transport costs ......................................................................................... 18
3.4. Examples of Management of Road Sector – International Case Studies ................................................ 20
3.4.1. South Africa ............................................................................................................................................................ 20
3.4.2. New Zealand ........................................................................................................................................................... 26
4. ROAD MAINTENANCE IN OIC MEMBER STATES ............................................................................................. 34
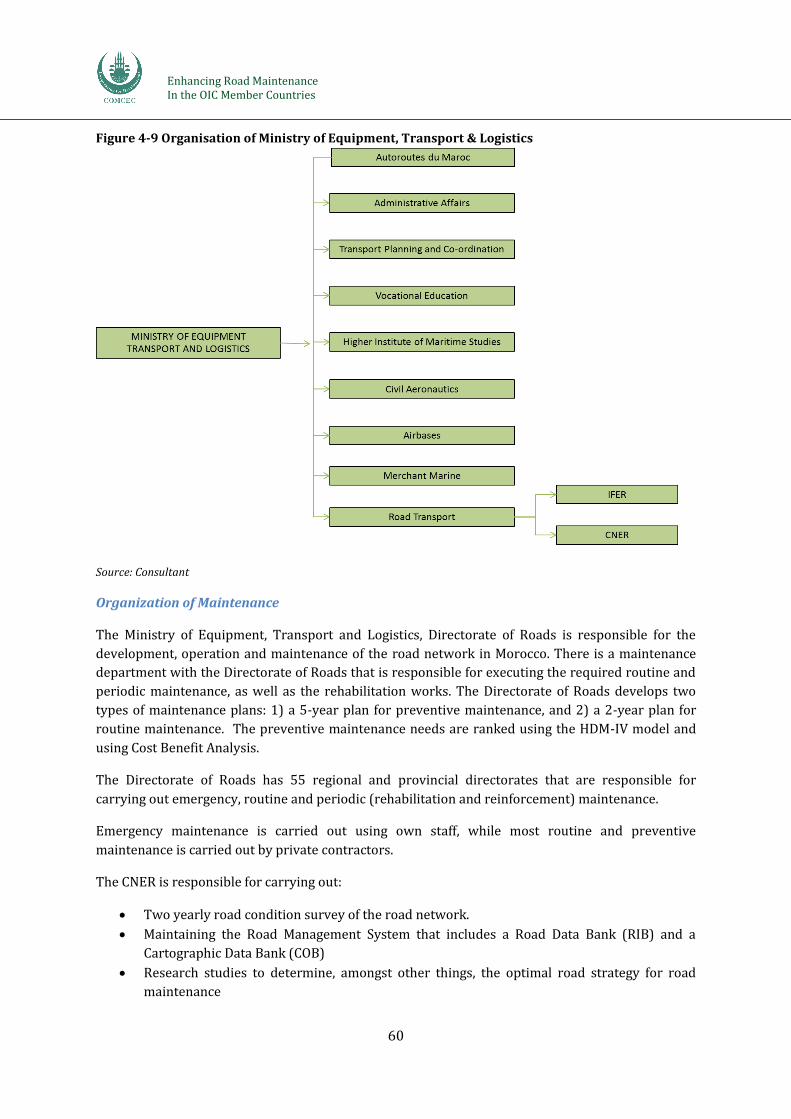
4.1. Overview of Road Maintenance ............................................................................................................................... 51
4.1.1. Organization of Road Maintenance .............................................................................................................. 52
4.1.3. Other Issues ........................................................................................................................................................... 57
4.2. Case Studies....................................................................................................................................................................... 58
4.2.1. Case Study – Morocco ........................................................................................................................................ 58
4.2.2. Case Study – Turkey ........................................................................................................................................... 65
4.2.3. Case Study – Senegal .......................................................................................................................................... 70
5. CONCLUSIONS AND RECOMMENDATIONS ........................................................................................................ 75
LIST OF REFERENCES ..................................................................................................................................................... 86
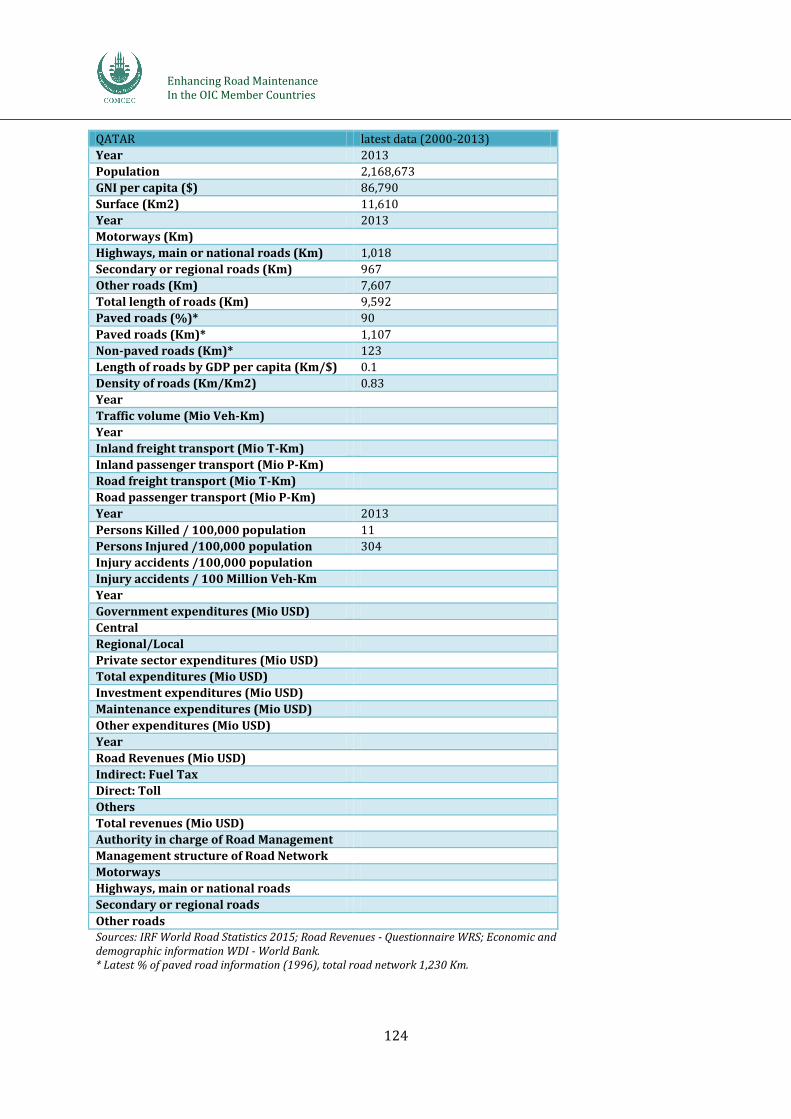
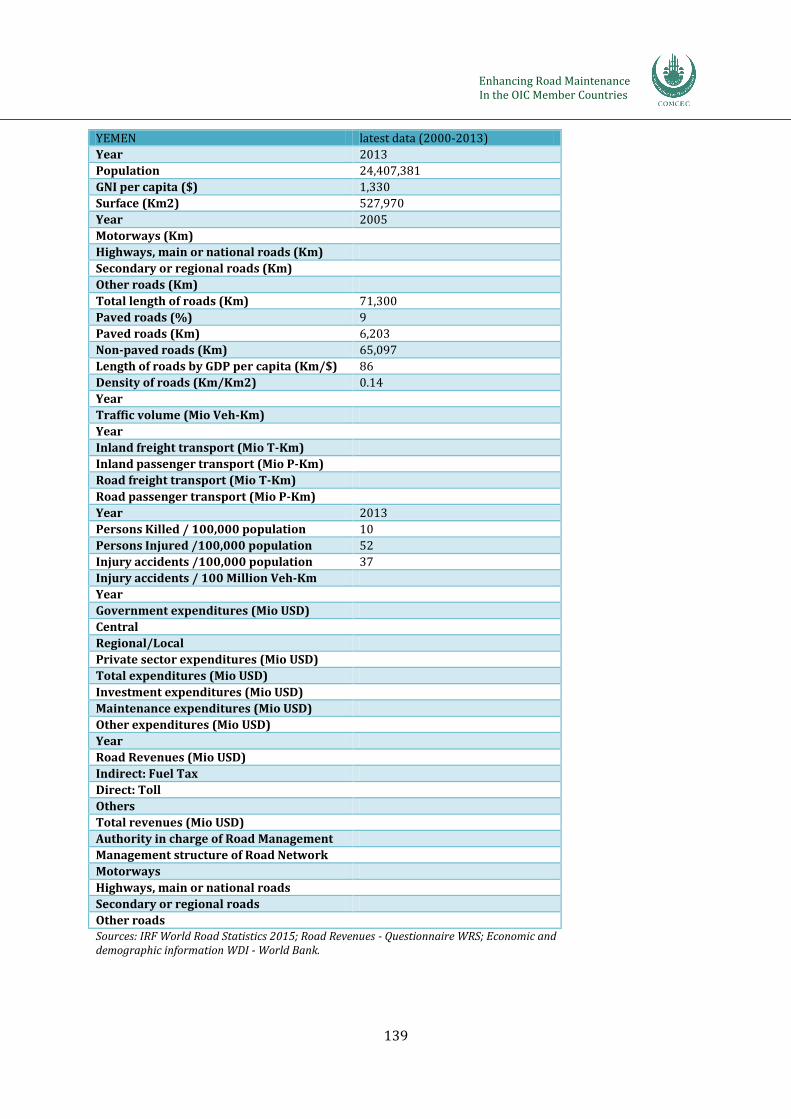
APPENDIX: Statistical Overview of Individual Countries ................................................................................ 89
ii
List of Tables
Table 3-1 Effect of Road Roughness on Vehicle Operating Costs (Index of VOC: Good=100, at IRI=2.3) ..... 18
Table 3-2 Roads Managed by SANRAL ....................................................................................................................................... 22
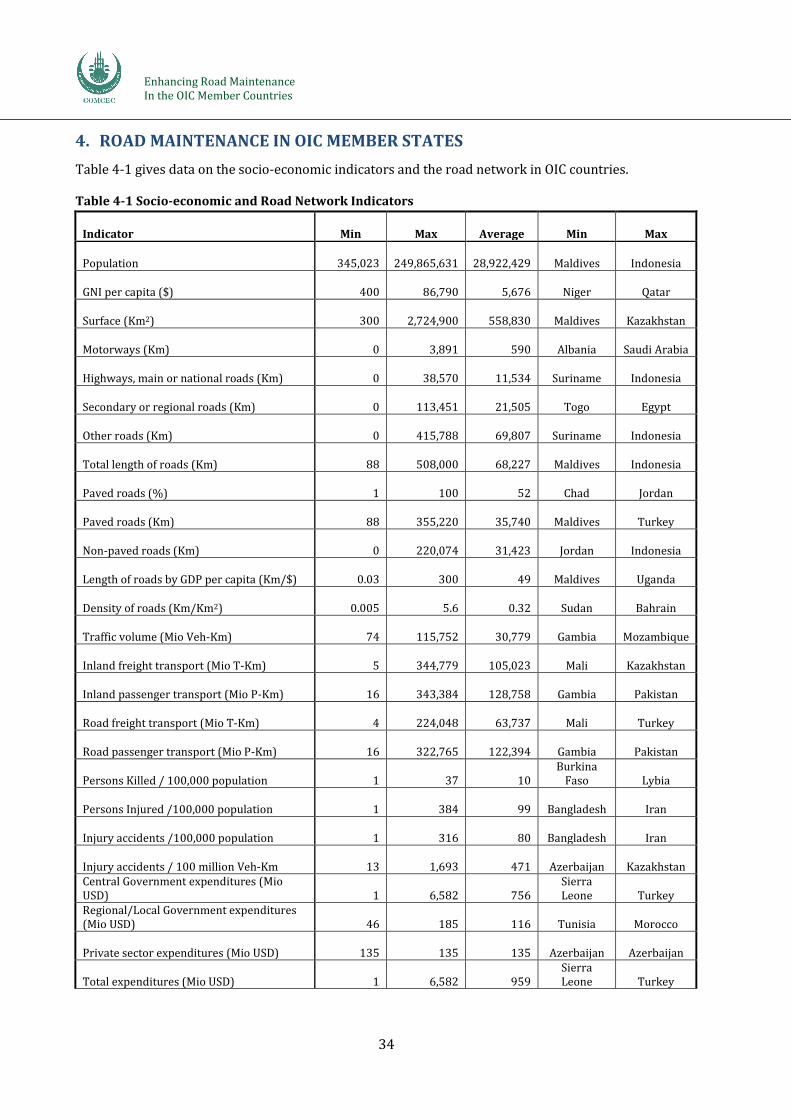
Table 4-1 Socio-economic and Road Network Indicators .................................................................................................. 34
Table 4-2 Percentage of Road Categories in OIC Countries, USA and the EU ............................................................ 37
Table 4-3 Expenditures on Main Road Networks in Sub-Saharan African OIC Countries ................................... 51
Table 4-4 OIC Countries with Road Funds ................................................................................................................................ 53
Table 4-5 Socio-economic Indicators for Morocco................................................................................................................ 59
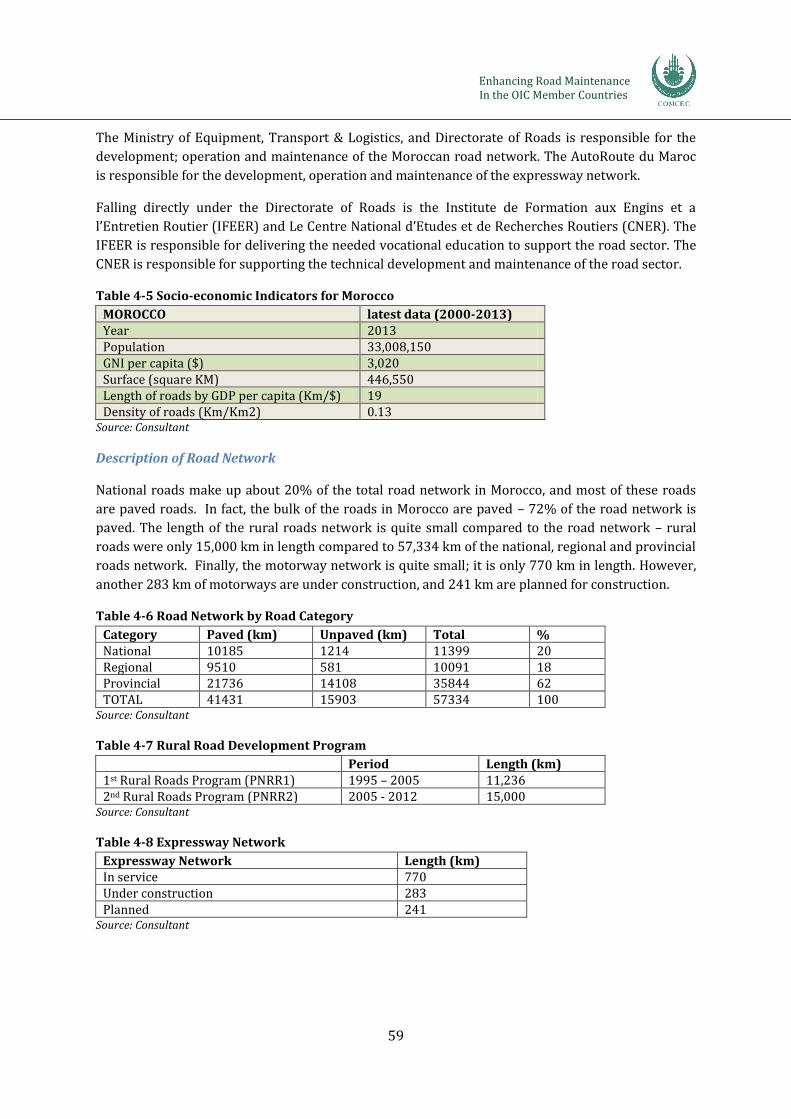
Table 4-6 Road Network by Road Category ............................................................................................................................. 59
Table 4-7 Rural Road Development Program ......................................................................................................................... 59
Table 4-9 Funding by Source for Road Projects ..................................................................................................................... 61
Table 4-10 Socio Economic Indicators for Turkey ................................................................................................................ 65
Table 4-11 Length of Road Network by Road Type .............................................................................................................. 65
Table 4-12 Composition of the Classified Network (CN) in Senegal ............................................................................. 71
Table 4-13 Evolution of the TRU collection in Senegal (2009-2015) ........................................................................... 73
Table 4-14 Sources of road financing and needs for road maintenance in Senegal (2009-2015) ................... 74
iii
List of Figures
Figure ES1 Generic Asset Management System ......................................................................................................................... 2
Figure 2-1 The Management Cycle ............................................................................................................................................... 11
Figure 3-1 Forecasted quality of non-toll roads in South Africa ..................................................................................... 21
Figure 3-2 Organisational Structure of SANRAL .................................................................................................................... 22
Figure 3-3 Planning Responsibilities Within SANRAL......................................................................................................... 23
Figure 3-4 Performance Management System of SANRAL ................................................................................................ 24
Figure 3-5 Asset Management System at SANRAL ................................................................................................................ 24
Figure 3-6 Organisational Structure of New Zealand Transport Agency .................................................................... 28
Figure 3-7 Integrated Planning Strategy Used by NZTA ..................................................................................................... 30
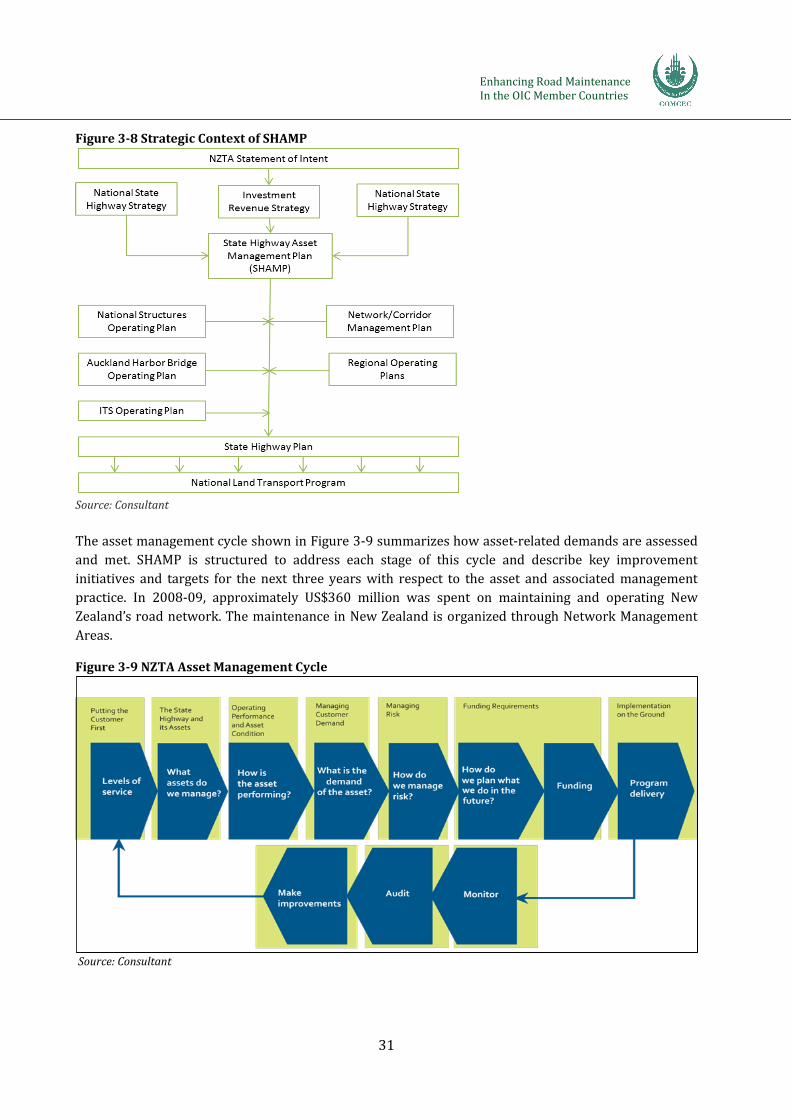
Figure 3-8 Strategic Context of SHAMP ...................................................................................................................................... 31
Figure 4-11 Condition of the Road Network ............................................................................................................................ 63
Figure 4-12 Growth of State Highways and Provincial and Other Roads in Turkey (1967 – 2015) ............... 65
Figure 4-13 Organogram of Turkish General Directorate of Highways ....................................................................... 67
Figure 4-15 Initial and Year End Budgets for Turkish GDH (1980 - 2014) ................................................................ 69
i
List of Abbreviations
AGEROUTE Agency of Works and Management of Roads
AICD Africa Infrastructure Country Diagnostic
AMS Asset Management System
CFR La Caisse Pour Le Financement Routier (of Morrocco)
CN Classified Network (in Senegal)
CNER Le Centre National d’Etudes et de Recherches Routiers (in Morocco)
COB Cartographic Data Bank of Morocco
COMCEC Standing Committee for Economic and Commercial Cooperation of the Organization of the Islamic Cooperation
DOT Department of Transport
EIB European Investment Bank
FCFA Currency of Communauté Financière Africaine (Senegalese currency)
FERA Fund for Autonomous Road Maintenance (in Senegal)
FHWA Federal Highway Works Administration (of the United States)
FSR Fonds Speciale Routiere (of Morocco)
GDH General Directorate of Highways (of Turkey)
HDM – IV Highway Development and Management Model – Version 4
IFEER Institute de Formation aux Engins et a l’Entretien Routier (in Morocco)
IRI International Roughness Index
JICA Japan International Cooperation Agency
MILT Ministère des Infrastructures, des Transports terrestres et du Désenclavement (of Senegal)
Mio Veh-Km Million Vehicle Kilometers
NCN Non Classified Network (in Senegal)
NLTP National Land Transport Plan (of New Zealand)
NZTA New Zealand Transport Agency
OIC Organisation for Islamic Cooperation
PERA Annual Road Maintenance Program (of Senegal)
PPP Public Private Partnership
PTIP Public Transport Investment Program (of Senegal)
PWD Public Works Department
RIB Road Data Bank of Morocco
RONET Road Network Evaluation Tools (suite of tools developed by the World Bank)
SANRAL South African National Roads Agency Limited
SHAMP State Highway Asset Management Plan
TRU Tax on Road Use (in Senegal)
VCI Visual Condition Index (of roads)
VOC Vehicle Operating Costs
WRS IRF - World Road Statistics
Enhancing Road Maintenance
In the OIC Member Countries
1
EXECUTIVE SUMMARY
This study commissioned by the Standing Committee for Economic and Commercial Cooperation of the
Organization of the Islamic Cooperation (COMCEC) to study road maintenance practices in OIC Member
States.
Importance of maintenance and the maintenance gap
Maintenance is important because poorly maintained roads lead to:
Destruction of the value of road assets and its corresponding impact on government accounts and higher costs for road rehabilitation in the future
Higher vehicle operating costs, fuel costs, and reduced road safety
Reduced access resulting in poorer healthcare and fewer employment and educational opportunities
Unfortunately, however, the required maintenance works are not always carried out in a timely manner
because of:
Mismanagement of the road infrastructure, such as overloading of vehicles beyond legal limits,
An inability to allocate required resources required,
Underfunding of road assets and lack of will to keep them properly maintained because
o Maintenance can be postponed as a lack of maintenance does not result in immediate asset failure
o There is preference for building new roads, bridges etc., and
o There is a shortage of expertise, institutions, and measures to keep the road assets in good condition.
Study objective and approach
The overall objective of this study is to provide an overview of road maintenance practices in the OIC
Member States, the challenges they face, and recommendations for addressing these challenges.
To meet this objective, this study:
Conducted an extensive literature review of maintenance practices in OIC Member States,
Conducted an electronic survey of the road maintenance practices in the OIC Member States,
Carried out three case studies covering Morocco, Turkey, and Senegal,
Developed a framework that can be used for identifying and evaluating policy actions and investment priorities,
Identified the challenges in improving maintenance of road networks, and
Provided recommendations for meeting the challenges that have been identified.
Enhancing Road Maintenance In the OIC Member Countries
2
Definition of maintenance use in this study
The maintenance activities that are the primary focus of this study are:
Routine maintenance – includes local repair of roadway and pavement; grading of unpaved surfaces
and shoulders, maintenance of drainage ditches, side slopes, verges, traffic control devices, and
furniture, roadside cleaning, dust and vegetation control, snow or sand removal, and maintaining rest
areas and safety related installations.
Resurfacing – involves re-graveling an unpaved road or resurfacing a paved road with an asphalt
overlay to preserve the structural integrity and ride quality of the road.
A framework for maintenance
Most authorities responsible for the maintenance of road networks use an Asset Management System
(AMS). An AMS covers the processes, tools, data, and policies necessary to effectively manage assets. An
AMS includes the following components1:
Goals and policies of the administration, Data, Resources and budget details, Performance models for alternative strategies and programme development, Project selection criteria, Implementation programme, and A monitoring and feedback loop.
Figure ES1 – Generic Asset Management System
Source: Consultant
1 Organisation for Economic Cooperation and Development (2001) Asset Management for the Roads Sector, Paris
Enhancing Road Maintenance
In the OIC Member Countries
3
Lessons from international best practice
Experiences from across the world suggest that for required maintenance activities to be carried out properly and in a timely manner the following are important:
Thorough planning and programming of maintenance works based on priorities,
Availability of timely, accurate, and relevant data to support setting of priorities,
An independent, secure, and stable source of funding for carrying out preventive maintenance,
Having an appropriate institutional structure in place for managing and operating the road network. In particular, a separation of the financing of maintenance from the procurement and execution of works,
Monitoring the results of maintenance works on road network performance,
Linking the performance of the organisation responsible for management and operation of the road network to the performance of the maintenance works,
Having the appropriate human resources in place not just to oversee the engineering and technical aspects of maintenance works, but also to undertake the planning and programming of these works, collecting and analysing data, and project and financial management expertise for managing maintenance contracts.
Observations on the road sector and maintenance in OIC Member States
The road sector in most OIC countries is over-developed in terms of length relative to the size of
the population and GDP.
The share of motorways, highways, national and main roads in the total road network is
disproportionately large in the OIC Member States.
There is an acute lack of reliable and consistent data when it comes to expenditures in the road
sector. It is rather surprising to note that this data is not readily available.
For the limited number of countries for which data is available, there is a capital investment bias
with the bulk of expenditures being rehabilitation and capital expenditures.
Not surprisingly given the above, the road network in most OIC countries is not in a very good
condition.
The institutional development of the road maintenance sector in OIC Member States is lagging
behind international best practices in terms of establishing road funds and road agencies. Thus,
for example, a majority of OIC Member States still do not have an operational road fund.
Unfortunately, even when the road fund exists, its performance can be improved. The situation
with regards to road agencies is not significantly better.
Many OIC Member States still carry out routine and preventive maintenance using force account
methods, resulting in the well-known inefficiencies and delays in execution of the works.
The governance, transparency of operation, and public accountability of the road maintenance
organisations is in need of improvement so that these organisations can make decisions about
road maintenance based on the needs and requirements rather than any other considerations.
There is an issue with regards to the human resource side of government organisations involved
in road maintenance; there is a shortage of qualified staff and it is becoming increasingly
difficult for these organisations to attract the needed talent.
The capabilities of the construction sector in many OIC Member States need to be upgraded and
expanded so that they can undertake, for example, performance based maintenance contracts.
Enhancing Road Maintenance In the OIC Member Countries
4
The level of the fuel levy and road user charges is set at very low levels and need upward
revision.
The maintenance needs of, in particular the rural road networks, need to be given more
attention during the planning a budgeting process than what they currently receive.
Recommendations and the way forward
Use of performance indicators for decision-making - Performance indicators should be defined and
used in a consistent manner over time for making decisions about needs and requirements, investments,
maintenance prioritization, or anything else.
Data collection – At a minimum there must be an asset register, a periodic survey to collect information
on the condition of its assets, and collect data on traffic volumes and vehicle mix on the road network.
Financial Management Systems – A financial management system should be required to maintain the
accounts of the organisation, and more importantly for producing reports linking the use of financial
resources to the performance of the road assets and various activities.
Road Information System and Asset Management System – An integrated asset management system
containing all relevant data on the assets (location and other attributes, and condition and quality)
should be used and should be linked to the financial management system so as to permit an analysis of
the efficiency and effectiveness of various activities.
Project Management System – A project management system that is capable of managing and
monitoring projects is essential to the efficient performance of a highway agency. This project
management system needs to be able to monitor progress on projects on a daily basis, manage project
risks, and resource use on the project.
Risk Management Framework – Organisations need to develop a risk framework that incorporates the
risks associated with these phenomenon and their potential consequences and incorporate these into
their planning and budgeting.
In addition to the above recommendations, the progressively more challenging recommendations
should be adopted by the organisations (depending on their level of maturity) responsible for
maintenance in phases:
Phase 1 – Preparing the organisation for monitoring performance
This phase is intended to prepare an organisation for performance based management of road
networks. Thus, this phase is intended to:
Identify the shortcoming and needs with respect to the systems and procedures noted above
Collect needed information
Make changes to the institutional setting, including the legal and regulatory frameworks
Make necessary internal reforms in the organisation
In terms of the institutional setting, the following is required:
Enhancing Road Maintenance
In the OIC Member Countries
5
An autonomously functioning organisation that is authorised to take all decisions that it needs to take to ensure a well-functioning road network. In other words the organisation must be independent of political and other interference.
A clear and comprehensive mandate for the organisation that is responsible for managing and operating the road network. This mandate needs to extend beyond, for example, just the construction and maintenance of highways. It needs to included, for example, the authority for enforcing weight limits on the roads, for raising finances to finance various activities, etc.
The various functions of the organisation such as tolling, maintenance, planning, programming and budgeting should be separated as much as possible. For example, procurement, execution, and financing should not be in the hands of the same agency.
The funding of the organisation should be explicitly linked to targets specified in something like a Service Level Agreement (SLA) that elaborates what the organisation is expected to do with the resources allocated to it.
In terms of the internal reforms at the organization the following is needed:
Establishing guidelines for identifying and assessing maintenance needs and prioritising them in such a way that the activities to meet the identified needs are clearly linked to the performance goals and targets of the organisation.
Internal separation of functions in such a way that the monitoring is separate from the actual activities themselves. Regular internal audits of performance should also be undertaken.
Phase 2 – Monitoring and improving performance
In this phase, there are three priorities, namely ensuring:
Human resources issues
Involvement of stakeholders and road users, and
Financial security for the organisation
In terms of the HR issues, the following need to be addressed:
The availability of properly qualified staff is becoming increasingly important at organisations responsible for managing and operating road networks.
Attracting and retaining this talent requires that organisations pay attention to the criteria used for employing staff, particularly for non-engineering staff, and the salary structure for these positions (many of these people are eminently employable in the private sector).
There are two aspects to the stakeholder involvement:
Steps for improving the capabilities of the road sector, and a programme for engaging the road sector contractors are an important part of improving the overall performance of the sector.
Involving the road users in the performance and functioning of the organisation. This involvement is an important way to build support for the organisation and help it in its interactions with the government in getting needed resources.
Finally, it is essential that the level of available resources is adequate, and the annual variation in
available resources is not so large so as to make planning difficult. To do this three things are proposed:
Enhancing Road Maintenance In the OIC Member Countries
6
Ring-fenced or earmarked budgets to guarantee revenue streams commensurate with the ambitions, objectives, and targets for the road sector. And establishment of an independent for taking decisions for procurement and execution of these works.
Adequate funding. The level of funding should be linked to the targets that have been set for the road network in terms of performance.
Including a valuation of the value of all road assets in the books of the organisation.
Phase 3 – Measuring performance based on outputs
The fundamental difference in this phase from the earlier phases is that now the emphasis is on realising
the performance objectives in terms of the end-result, the outputs. In this phase, the focus should be on,
for example, the cumulative delays resulting from maintenance works on the road network. This focus
makes it important to no longer just do the maintenance, but do it in ways that minimise the
interruptions and disturbances resulting from the maintenance works.
In this most mature phase, the entire organisation measures and monitors its performance at every
stage of decision making, and in every decision that it takes.
Enhancing Road Maintenance
In the OIC Member Countries
7
1. INTRODUCTION
Roads are an important public asset; improving the road network can bring about immediate and large
benefits by providing better access to hospitals, schools, and markets; improved comfort, speed, and
safety; and lower vehicle operating costs. However, sustaining these benefits over time requires
maintaining the road network in a timely and proper manner. Without periodic maintenance roads can
quickly deteriorate; inhibiting the realisation of the long-term development impacts of building roads.
Delayed maintenance, and the resulting poor state of repair, makes roads more difficult to use. This
results in increased vehicle operating costs (such as, for example, more frequent repairs, and more fuel
use) and reluctance by transport operators to use the roads. This in turn reduces the benefits of
providing more access to jobs, hospitals, schools, etc., and an overall loss of economic and social
development opportunities.
Properly maintaining a road network requires regular and appropriate maintenance works. Delaying
such maintenance erodes the value of this important public asset and results in unnecessarily large costs
at some later time. If maintenance is not carried out in a timely manner, entire road sections may fail
completely, requiring full reconstruction at a much higher cost than the cost of preventive maintenance.
A 1999 Michigan Department of Transportation (DOT) study provided, for the first time, hard evidence
that preventive maintenance is a wise investment. According to the study, the DOT's preventive
maintenance strategy is more than six times as cost-effective as rehabilitation and reconstruction
projects. The Michigan DOT adopted its preventive maintenance strategy in 1992 to keep its 15,420 km
(9,580 mi) of highways in the best shape possible despite a decline in funding. Since then, preventive
maintenance treatments have been applied to about 4,260 km (2,650 mi) of asphalt and portland
cement concrete pavements, at a cost of $80 million. According to the Michigan DOT, if the DOT had not
implemented its preventive maintenance strategy, the DOT would have to spend $700 million today on
rehabilitation and reconstruction projects to bring pavements up to their current condition - that's more
than eight times the money that was spent on preventive maintenance treatments.
The South African National Road Agency Ltd. (SANRAL) estimates that repair costs are six times
maintenance costs after three years of delayed maintenance, and 18 times the maintenance costs after
five years. To avoid such escalating costs, SANRAL first “allocate[s] its available funding resources to
ideal maintenance actions (e.g., reseals and overlays), and thereafter to more extensive maintenance
actions (e.g., rehabilitation), and finally to new construction” (SANRAL 2004).
Deferred maintenance refers to the dollar amount of maintenance and rehabilitation work that should
have been completed to maintain the pavements in acceptable condition but had to be deferred due to
reduced maintenance funding or policy changes for the preventative maintenance and/or pavement
rehabilitation programs. Pavements that remain untreated can deteriorate at a faster rate. The cost of
repairs increases disproportionately as the condition of the pavement decreases over its life. According
to the Federal Highway Administration (FHWA), deferring pavement preventive maintenance or
rehabilitation can lead to a substantial increase in required repair costs (FHWA 2005).
Although maintenance engineers have been making the case for preventive maintenance for years, their
message often goes unheeded. While some part of the overall road budget has to be spent on
construction, some part has to be spent on maintaining the existing road network. But because new road
construction is often financed by donor countries that provide “cheap money”, many countries favour
Enhancing Road Maintenance In the OIC Member Countries
8
new road construction, rehabilitation, or reconstruction of roads over maintenance which has to be
financed by own resources. This, together with the perception that delaying maintenance activities does
not result in immediate asset failure, has resulted in a large backlog of roads needing maintenance.
The Organisation of Islamic Cooperation (OIC) includes countries that follow very different maintenance
protocols and regimes and hence there is a wide range of variation in the state of repair of the road
networks in the countries of the OIC. Thus, the OIC would like to assess the road maintenance strategies
of three selected OIC Member States to support the development of a framework for identifying and
evaluating policy actions and investment priorities.
Thus, the overall objective of the work being proposed here is to provide an overview of road
maintenance practices in the OIC Member States, the challenges they face, and recommendations for
addressing these challenges.
To meet this objective this study:
Conducted an extensive literature review of the maintenance practices in place for maintaining
road networks in the OIC Member States,
Conducted an electronic survey of the road maintenance practices in the OIC Member States,
Assessed the road maintenance strategies of three OIC Member States,
Developed a framework that can be used for identifying and evaluating policy actions and
investment priorities,
Identified the challenges in improving maintenance of road networks, and
Provided recommendations for meeting the challenges that have been identified.
The results of the above work are provided in this report in the following four chapters:
A Framework for Road Maintenance
The Importance of the Road Maintenance and Best Practices
Road Maintenance in the OIC Member States
Conclusions and Recommendations
Chapter 2 outlines a framework for road maintenance, a framework that includes institutional, financial,
and technical elements. Chapter 3 makes the case for road maintenance, why it is important to
undertake timely and regular road maintenance, and provides best practices from around the world.
Chapter 4 does three things: 1) Presents an overview of the road networks in each of the OIC Member
States, 2) Outlines the issues related to road maintenance in the Member States, and 3) Presents the case
studies for Morocco, Turkey and Senegal. Chapter 5 presents our conclusions and recommendations for
the OIC Member States for improving the state of road maintenance.
Enhancing Road Maintenance
In the OIC Member Countries
9
2. A FRAMEWORK FOR ROAD MAINTENANCE
This chapter briefly defines road maintenance and what it involves, review the problems and issues
associated with road maintenance, and outline the framework for maintenance that was used in
developing the email survey and the case studies.
2.1. What is Maintenance?
Maintenance is a series of activities designed to keep a road network serviceable by reducing the
deterioration of pavements. There are different kinds of maintenance:
Routine maintenance
Resurfacing
Rehabilitation
Reconstruction
Restoration
Betterment
New road construction
Routine maintenance – includes local repair of roadway and pavement; grading of unpaved surfaces
and shoulders, maintenance of drainage ditches, side slopes, verges, traffic control devices, and
furniture, roadside cleaning, dust and vegetation control, snow or sand removal, and maintaining rest
areas and safety related installations.
Resurfacing – involves re-graveling an unpaved road or resurfacing a paved road with an asphalt
overlay to preserve the structural integrity and ride quality of the road. Resurfacing is also sometimes
referred to a periodic maintenance.
Rehabilitation – involves selectively repairing, strengthening and shape correction of the pavement or
roadway (including minor drainage improvements) to restore a road’s structural strength and ride
quality.
Reconstruction – involves renewal of the road structure using existing earthworks and road
alignments.
Restoration – major rehabilitation and reconstruction works considered together.
Betterment – are improvements related to the width, alignment, curvature, or gradient of the road to
improve traffic safety, speeds, and capacity. These are usually not considered to be part of maintenance.
New construction – is the construction of a paved or gravel road on a new alignment, providing
additional lane capacity, or constructing additional carriageways, frontage roads, grade separated
intersections, or multi-lane divided highways. This is not considered to be part of maintenance activities.
Road networks are complex; spread over large geographic areas, and the pavement conditions are
determined by traffic volumes and mix, climatic and environmental conditions. Given this complexity, it
Enhancing Road Maintenance In the OIC Member Countries
10
is difficult to make long-term predictions about the future condition of road networks. However,
maintenance is essentially a management problem that involves:2
Delivering a defined quality of service
Resources of people, materials and equipment
Activities and procedures
Location on the road network
Timing of intervention
Constrained budgets
2.2. Framework for Road Maintenance
Road maintenance is an integral part of road management. Thus, the starting point for elaborating the
road maintenance framework is the framework for road management. Robinson (2008) defines four
categories of functions for an organization responsible for managing a road network, namely:
1. Strategic planning
2. Programming
3. Preparation
4. Operations management
Strategic planning – involves analysing the road network and preparing a long-term strategic plan that
includes future needs in terms of, for example, maintenance needs, the resource requirements for
different future budgetary and economic scenarios.
Programming – involves developing a multi-year program of work and associated expenditures. This
work program identifies future maintenance needs of the road network, and prioritises these needs
based on costs and benefits and available budgets.
Preparation – involves developing the details for implementing the multi-year program of work –
detailed designs and cost estimates are prepared.
Operations management – covers the management of daily on-going works activities of the
organisation on a daily or weekly basis. This includes, for example, the scheduling of work, monitoring
of the work, and evaluation of completed works.
For each of these four categories of management functions a common system of decision-making can be
used, namely:
Defining the objectives,
Assessing needs and requirements,
Determining the various options for meeting the needs and requirements and realising the
defined objectives,
Choosing what to do from the available options,
Implementing the chosen options, and
2 Robinson, R., (2008) Restructuring Road Institutions, Finance and Management, Volume 1: Concepts and Principles, 207-208, University of Birmingham
Enhancing Road Maintenance
In the OIC Member Countries
11
Monitoring the implementation of the options and the progress towards the objectives.
Figure 2-1 – The Management Cycle
Source: Consultant
The above four categories of management functions, and the management cycle for each of these are
referred to as Asset Management. This asset management framework serves as the basis for the work
described in this report.
2.3. Asset Management
Most authorities responsible for the maintenance of road networks in developed economies use, what is
commonly referred to as, an Asset Management System (AMS). An AMS covers the processes, tools, data,
and policies necessary to effectively manage assets. An AMS includes the following components3:
Goals and policies of the administration,
Data,
Resources and budget details,
Performance models for alternative strategies and programme development,
Project selection criteria,
Implementation programme, and
A monitoring and feedback loop.
Each of these components, while common to all asset management systems, can be customized to match
the needs of any given road administration. While an AMS is usually flexible enough to accommodate
changes in goals, priorities and assets of any given authority, its establishment and operation must
follow a systematic procedure that includes the development, or using existing, performance models,
incorporating generally accepted economic and business practices. Thus, the use of an AMS requires
adequately trained users with the necessary skills and competences in order to effectively be able to use
the system.
3 Organisation for Economic Cooperation and Development (2001) Asset Management for the Roads Sector, Paris
Enhancing Road Maintenance In the OIC Member Countries
12
Source: FHWA (2007) Asset Management Overview, US Department of Transportation.
Figure 2-2 – Generic Asset Management System
Source: Consultant
It is clear that most low and middle income countries do not have such comprehensive asset
management systems in place to support the planning and budgeting of maintenance of road networks.
This framework is used, however, as a structuring device to assess the state of road maintenance in the
OIC Member States.
Core Principles of Asset Management
Policy Driven – Resources are allocated for undertaking different activities
based on well -defined policy objectives
Performance Based – All policy objectives are translated into indicators to
measure system performance and used for operational and strategic
management
Analysis of Options and Trade-offs - The allocation of resources to different
types of projects (maintenance versus rehabilitation) is based on evaluating
how different budget allocations perform with regards to reaching the policy
objectives
Decisions Based on Information – The costs and benefits of the different
options is based on current, complete, and accurate data
Enhancing Road Maintenance
In the OIC Member Countries
13
3. THE IMPORTANCE OF ROAD MAINTENANCE AND THE BEST PRACTICES
This chapter describes the reasons for the maintenance gap, makes the case for road maintenance by
highlighting the economic importance of roads, and provides evidence for why spending on
maintenance makes good economic sense, especially in view of the impacts of poorly maintained road
networks on economic and social development, and provides examples of best practices from across the
world.
3.1. The Reasons for the “Maintenance Gap”
Given the straightforward economic case for undertaking preventive maintenance, and the importance
of doing so, it is worth recounting the reasons for why preventive maintenance is not undertaken as
widely and regularly as one would expect it to happen.
There are essentially three factors that have can be held responsible for the poor maintenance of road
networks, namely:
1. The structure and nature of organisations responsible for road maintenance
2. Lack of pressure for better roads
3. Inadequate and unreliable funding
In the past decades the focus has been on expanding road networks rather than on maintenance. The
fact that larger road networks would, in the future, require funds for their maintenance was, till recently,
largely ignored; the question of whether the resources need for maintaining these road networks were
available or not was deferred to be answered at some future point in time. One of the reasons for why
the question about the future availability of resources for maintain the roads that were being built was
that the funds for road construction come from capital budgets, whereas the funds for maintenance
come from operational budgets. The construction of new roads is also, at least in low and middle income
countries, often financed via loans provided by multi-lateral development banks. Experience suggests
that, for various reasons, it is easier to get approval from government, for projects requiring capital
investments, than it is to get funds approved for recurring expenditures – the kinds of expenditures
associated with maintenance of road networks. Thus, while the resources for building new roads are
approved, the resources required for maintaining these roads are not. For the roads financed by loans,
the provisions for financing the maintenance of these new roads were inadequately considered in the
conditions for these loans, and even the weak contractual conditions are all too often poorly enforced.
One consequence of the expansion of the road networks that was not taken into account was whether
the recurrent operational budgets available to agencies were large enough to support the regular
preventive maintenance. As a result, the budgets that are available are often far too small to be able to
support proper maintenance of the road networks and there is a significant “maintenance gap.”
What has exacerbated the “maintenance gap” is that funding available for maintenance of agencies
responsible for maintenance was limited, and there was no funding source dedicated to financing
maintenance activities. Also, not unimportant in this context, is that the agencies responsible for
maintenance were/are largely unaccountable for the problems caused by the lack of maintenance. This
lack of accountability is compounded by a lack of proper understanding about what is needed to carry
out long-term preventive maintenance. It was not, and still is not properly understood, that undertaking
cost-effective maintenance requires a significant amount of planning, administrative and managerial
Enhancing Road Maintenance In the OIC Member Countries
14
capacity in addition to the technical capacity. In many parts of the world, maintenance is still not
considered to be a recurrent, preventive activity; it is still seen as something that is done to remedy the
situation once a road has significantly deteriorated.
The issue of the lack of capacity was made even more severe by the decentralization of responsibilities
from central to local bodies, without a corresponding transfer of financial resources. At the local levels,
the technical, managerial and administrative capacity is simply lacking.
The organisations responsible for road maintenance do not bear the costs of poor maintenance; these
costs are borne by road users. Neither do these organisations have any market forces nor do they have
any competitive pressures that would make them improve the condition of the road network. Finally,
these organisations have little, if any, direct interaction with the road users and hence are further
insulated from any public pressures to improve road maintenance. Thus, without any public pressure to
improve the condition of the road network, there is little political or administrative urgency attached to
improving maintenance.
3.2. Roads as an Economic Motor
To assess the contribution of road investments to economic growth, several studies specify some sort of
an aggregate production function that includes transportation infrastructure as explanatory variables.
Most of these studies found that transportation infrastructure had a positive effect in terms of economic
growth (Antle, 1983; Ratner, 1983; Binswanger et al., 1987; Aschauer, 1989; Binswanger, Khandker, and
Rosenzweig, 1989; Baffes and Shah 1993; and Easterly and Rebelo, 1993).4
However, these studies do not account for reverse causality and this can lead to overestimating the
positive effects of infrastructure on economic growth, and these studies fail to control for the quality of
the road infrastructure which can lead to biases in the estimates of infrastructure’s contribution to
growth. Fernald (1999), however, using data from 29 U.S. manufacturing industries, from 1953 to 1989,
examined the question of whether investments in road infrastructure lead to economic growth, or
whether economic growth leads to larger investments in road infrastructure.5 His findings also suggest
that investment in road infrastructure does contribute to economic growth. Fernald’s study does,
however, suggest that the marginal returns to investments in roads may not be as high as commonly
thought, primarily because road construction offers a one-off increase in productivity rather continuous
improvement.
Studies by Fan et al. (1999, 2000, 2002, and 2004) in rural India, China, and Thailand also estimate the
effect of infrastructure investments on economic growth and poverty.6 Using sophisticated techniques
4 Antle, J. M., (1983) Infrastructure and aggregate agricultural productivity: International evidence. Economic Development and Cultural Change 31 (April), 609 – 619; Baffes, J., and Shah, A., (1993) Productivity of public spending, sectoral allocation choices and economic growth. Paper presented at the 1993 Annual Meeting of American Economic Association, Anaheim, California; Binswanger, H., Khandekar, S., and Rosenzweig, M., (1989) How infrastructure and financial institutions affect agricultural output and investment in India. World Bank Working Paper Series 163. Washington D.C., USA; Easterly, W., and Rebelo, S., (1993) Fiscal policy and economic growth: An empirical investigation. Journal of Monetary Economics 32 (3) 417-458; Ratner, J. B., (1983) Government capital and the production function for US private output. Economic Letters 13: 213 – 217 5 Fernald, J. G., (1999) Roads to prosperity? Assessing the link between public capital and productivity. The American Economic Review 89 (3) 619 - 638 6 Fan, S., and P. G. Pardey. (1997). Research, productivity, and output growth in Chinese agriculture. Journal of Development Economics 53: 115–137; Fan, S., and N. Rao. (2002). Public investment and poverty reduction: A synthesis of issues, methods and major findings. Mimeo. Washington, D.C.: International Food Policy Research Institute; Fan, S., P.
Enhancing Road Maintenance
In the OIC Member Countries
15
these studies simultaneously controlled for investments in infrastructure factor and product markets.
These studies consistently found that investments in roads made significant contributions to economic
growth and reducing poverty - in rural India, public investment in rural roads was found to have had the
largest positive impact on agricultural productivity growth, while in China and Thailand, road
investments were found to have contributed significantly to growth in non-farm and total economic
growth as well as to agricultural growth.
Differences in the level of accessibility can also lead to differing levels of economic performance and
income levels between regions within a country. Lagging regions are often characterized by having poor
infrastructure and this isolates local populations from educational, social, and economic opportunities
and contributes to the rise of poverty in the region. Deichmann et al. (2000), Nagaraj, Varoudakis, and
Veganzones (2000), and Stephan (2000) investigated the determinants of regional economic disparities
and found that investments in road infrastructure contribute to raising incomes and labour
productivity.7
In addition to affecting regional economic performance, road infrastructure also has implications for the
volume of trade. Limao and Venables (1999) showed that infrastructure is a significant determinant of
transportation costs, and that in landlocked regions transport costs can increase by 50 percents.8 They
concluded that most of Africa’s poor trade performance is the result of weak infrastructure.
The accessibility of a region can also influence the food prices in the region. Minten and Kyle (1999)
analysed the causes of food price variation and concluded that there is significant variation in food
prices across regions and products, transportation costs explain most of the this variation, and road
quality is an important factor in transportation costs: transportation costs were on average two times
greater on dirt roads than on paved roads.9
Hazell, and S. Thorat. (1999). Government spending, agricultural growth and poverty: An analysis of interlinkages in rural India. IFPRI Research Report No. 110. Washington, D.C.: International Food Policy Research Institute; ———. (2000). Government spending, agricultural growth, and poverty in rural India. American Journal of Agricultural Economics 82 (4): 1038–1051; Fan, S., L. Zhang, X. Zhang, and X. Ma. (2001a). Regional priorities of public investment in rural China: A country-level analysis. Report prepared for the project Priorities of Public Investments in Chinese Agriculture. Washington, D.C.: International Food Policy Research Institute; Fan, S., C. Fang, and X. Zhang. (2001b). How agricultural research affects urban poverty in developing countries: The case of China. EPTD Discussion Paper 80. Washington, D.C.: International Food Policy Research Institute; Fan, S., L. Zhang, and X. Zhang. (2002). Growth, inequality, and poverty in rural China: The role of public investments. IFPRI Research Report No. 125. Washington, D.C.: International Food Policy Research Institute; Fan, S., S. Jitsuchon, and N. Methakunnavut. (2004). The importance of public investment for reducing rural poverty in middle-income countries: The case of Thailand. DSGD Discussion Paper No. 7. Washington, D.C.: International Food Policy Research Institute. 7 Deichmann, U., Fay, M., & Lall, S. V., (2000) Economic structure, productivity, and infrastructure quality in Southern Mexico. Policy Research Working Paper Series 2900. Washington D.C., World Bank; Nagaraj, R. A., Varoudakis, A., & Veganzones, M. A., (2000) Long-run growth trends and convergence across Indian states, Journal of International Development 12: 45 – 70; Stephan, A., (2000) Regional infrastructure policy and its impact on productivity: A comparison of Germany and Fracne, Konjuknturpolitik 46 (940) 327 – 356. 8 Limao, N., & Venables, A. J., (1999). Infrastructure, geographical disadvantage and transport costs. Policy Research Working Paper Series 2257. Washington, D.C.: World Bank. 9 Minten, B., & Kyle, S., (1999). The effects of distance and road quality on food collection, marketing margins, and traders’ wages: Evidence from former Zaire. Journal of Development Economics 60: 467–495.
Enhancing Road Maintenance In the OIC Member Countries
16
Road Maintenance: Why and Who Benefits?
The purpose of maintenance is to ensure that the road remains serviceable
during its lifetime. Maintenance is important because it:
Prolongs the life of a road by countering the effects of deterioration and
thus preserves the value of the previous investments and the road asset.
Reduces Vehicle Operating Costs (VOC) by providing a smooth running
surface.
Preserves the benefits provided by the original roads by providing
reliable access and travel times for people to access healthcare,
employment and educational opportunities.
Governments should be interested in preserving the value of their road assets.
However, in practice, the responsible agencies have little incentive to undertake
preventive maintenance activities.
The people living and businesses operating in areas served by the roads and the
vehicle owners and operators are the primary beneficiaries of good roads and
improved access.
3.3. The Case for Road Maintenance
Source: Consultant
The World Bank (1988) produced a seminal report investigating the causes and remedies for
deterioration of road networks.10 One of the first sentences in this report states “The failure to maintain
roads is tantamount to an act of disinvestment, for it implies the sacrifice of past investment in roads.”
This report further goes on to say that in 20 years’ time, an estimated $45 billion worth of road
infrastructure was lost owing to poor maintenance in the 85 countries that were included in the study.
According to the World Bank, this loss could have been averted by spending $12 billion on carrying out
preventive maintenance.
Poor maintenance practices impose the following costs on national economies:
1. Destruction of the value of road assets and its corresponding impact on government accounts and higher costs for road rehabilitation in the future
3. Reduced access resulting in poorer healthcare and fewer employment and educational opportunities
10 World Bank (1988) Road Deterioration in Developing Countries: Causes and Remedies, A World Bank Policy Study
Enhancing Road Maintenance
In the OIC Member Countries
17
Impact of Delaying Road Maintenance on Africa’s Road Network
Paradoxically, low income countries spend 50% more per kilometer [on
road maintenance] overall than do middle-income countries, while
countries with established road agencies and fuel levies seem to spend
somewhat less than those without. The explanation is a pronounced
capital bias in road spending, with investment accounting for two thirds
of total spending in the [resource rich and] low-income countries,
particularly those without adequate institutional mechanisms for
funding road maintenance. Middle income countries and those with high
fuel levies tend to spend more on maintenance without incurring higher
road expenditure overall. This finding clearly shows that timely
attention to maintenance reduces the expenditure needed to
sustain the road system in the long term.
3.3.1. Reduction in the value of road assets
Roads are one of the largest, most important, and valuable assets managed by governments. To give an
example, the value of the road network managed by the Japan Highway Public Corporation were roughly
equal in value to the assets of General Motors (before its current problems).11 The highway network of a
small country like New Zealand is valued at roughly €15 billion making it the largest publicly owned
asset in the country.12 The future value of this road network (assuming no new construction) depends
on the quality and timeliness of road maintenance. Without proper and timely road maintenance, the
value of road assets can decline sharply, in turn reducing greatly the significant positive benefits that
accrue from well-maintained road networks.
Source: Foster and Briceno-Garmendia (2011)
The implications of the lack of maintenance are severe. In the Philippines, it is estimated that the annual
reduction in the value of road assets is twice the amount that would be required to undertake
preventive maintenance of these road assets.13
In Asia, for many countries, roads represent the single largest asset owned by governments. Rural roads,
or unpaved roads, are a large part of this public road network. For the 15 countries in the Asian region,
asset value of rural roads alone represents almost 27% of the GNP of these countries.14 In these same
countries, there is also a huge maintenance gap, the expenditures on maintaining the rural roads
network relative to the requirement are very small (typically well below 50%). This means that the
value of the rural roads network is decreasing over time and the replacement costs are increasing.
The annual maintenance costs represent a small proportion of the cost of new construction and
rehabilitation costs; 2-3% for a paved road, and 5-6% for an unpaved rural road. It is unfortunate that
despite the rather clear cut case for investing in preventive maintenance, the amounts spent on
11 Heggie, I. & Vickers, P. (1998) Commercial Management and Financing of Roads, World Bank Technical Paper, Washington DC, USA. New Zealand Transport Agency (2012) State Highway Asset Management Plan 2012-2015, NZTA, New Zealand. 12 New Zealand Transport Agency (2012) State Highway Asset Management Plan 2012-2015, NZTA, New Zealand. 13 Donnges, C., Edmonds, G., & Johannessen, B., (2007) Rural Roads Maintenance: Sustaining the Benefits of Maintaining Access, Bankgkok, Thailand, International Labour Organisation. 14 Ibid.
Enhancing Road Maintenance In the OIC Member Countries
18
maintenance activities remains low in most middle and low income countries.15 While unpaved roads
deteriorate more or less uniformly over their design life, it is well known that the deterioration in the
condition of paved roads does not follow a linear trajectory over time.16 Newly paved roads slowly
deteriorate, depending on the volume and mix of traffic, the climate and weather conditions, over the
first half to –two-thirds of their life. After this, without adequate maintenance, the pavements
deteriorate much more rapidly and eventually break apart completely.
Postponing road maintenance results in high direct and indirect costs. If road defects are repaired
promptly, the cost is usually modest. If defects are neglected, an entire road section may fail completely,
requiring full reconstruction at three times or more the cost, on average, of the costs of preventive
maintenance.17
The South African National Road Agency Ltd. (SANRAL) estimates that repair costs rise to six times
maintenance costs after three years of neglect and to 18 times after five years of neglect. To avoid such
escalating costs, SANRAL first “allocate[s] its available funding resources to ideal maintenance actions
(e.g., reseals and overlays), and thereafter to more extensive maintenance actions (e.g., rehabilitation),
and finally to new construction” (SANRAL 2004)18.
3.3.2. Higher vehicle operating and transport costs
Delayed maintenance has indirect costs as well. Neglected roads steadily become more difficult to use,
resulting in increased vehicle operating costs (more frequent repairs, more fuel use) and a reluctance by
transport operators to use the roads. This imposes a heavy burden on the economy: as passenger and
freight services are curtailed, there is a consequent loss of economic and social development
opportunities.
As roads deteriorate they get rougher. As roads get rougher, vehicle operating costs increase, especially
for the heavier vehicles like trucks and buses.
Table 3-1– Effect of Road Roughness on Vehicle Operating Costs (Index of VOC: Good = 100, at IRI=2.3)
Road condition
Vehicle class Fair (4.6 IRI) Poor (6.9 – 9.2 IRI)
Small car 106 114-26
Buses 104 109-16
Light diesel truck 111 123-38
Heavy truck 114 129-46
Articulated truck 112 127-44 Source: World Bank (1988); (IRI - International Roughness Index)
While Table 3-1 is based on relatively old data, more recent studies reach very similar conclusions that
as road roughness increases, vehicle operating costs also increase. For example, a recent study in
Morocco investigated the relationship between maintenance budgets and transport costs.19 The
conclusions of this study showed that an increase of €2.65 billion, over 20 years, would deliver savings
in transport costs of €7.5 billion. A World Bank study of maintenance strategies in Kyrgyz Republic 15 Foster, V., & Bieceno-Garmendia, C., (2011) Flagship Report: Africa’s Infrastructure: A Time for Transformation. 16 World Bank (1988). 17 World Bank (1988). 18 SANRAL (South African National Road Agency Ltd). 2004. Annual Report 2004: Sustainability Report. Pretoria, South Africa. 19 Mesnard, R., (2013) An application of HDM4 V2 in the Kingdom of Morrocco.
Enhancing Road Maintenance
In the OIC Member Countries
19
The results of longer travel times and reduced access
Farmers are reluctant to grow a marketable surplus crop because of the difficulties and costs of transporting the crop to markets
School enrolment and absenteeism is higher (both for teachers and students)
Health care standards are poor because of the difficulty in reaching doctors, health care workers and facilities to get timely and appropriate health care
Women’s working days are longer and harder, because of the time that it takes to reach water and fuel sources; two essential elements for daily life.
found that, over a 20 year period, increasing the maintenance budget by €320 million more than what
would be required for a strategy funding only routine maintenance and delaying all other maintenance
until reconstruction is required, would reduce transport costs by €2.1 billion.20
3.3.3. Reduced access
Poorly maintained roads mean longer travel times and reduced access. Longer travel times and reduced
access is not just an irritant. In the context of development and poverty alleviation, longer travel times
and reduced access take time away from other productive activities, and reduce the opportunities for
development. In short these are major barrier to development and poverty alleviation. Reduced, or loss
of, access leads not only to economic losses, but also to lower enrolment of children in schools, higher
rates of infant, child and maternal mortality, and a general disconnect from the process of national
development.21
The effects of poor maintenance of rural roads lead to particularly serious effects in terms of longer
travel times and reduced access. When large sections of the population are living in rural areas, rural
roads become a very important part of the road network in terms of providing access and helping to
reach development goals.
Lack of access has its effect at the most basic level of living. If there is poor access to health services,
people will remain unhealthy, children will die, and any epidemic will be likely to have catastrophic
results. If there is poor access to clean water, again health will suffer. If there is poor access to basic
information the household will be unaware of ideas and technology that might help them to lift their
level of living. And if there is poor access to education, children will in the future share the limitations
confronting their parents today. In addition, lack of access to markets ensures that whatever potential
that exists for marketing crops will be limited.
Thus, it would not be an exaggeration to state that a lack of maintenance, especially of the rural road
network, is often a major impediment to the achievement of a country’s poverty reduction goals.
Source: ILO (2007)
20 World Bank (2012). 21 Howe, J., (1997), Transport for the Poor or Poor Transport. ILO , Edmonds, G., (2005), Transport, Access and the Millenium Development Goals. ILO, ASIST AP 2005,
Enhancing Road Maintenance In the OIC Member Countries
20
3.4. Examples of Management of Road Sector – International Case Studies
This section provides some examples of how the road sector is organised in different countries across
the world. It also discusses the institutional structure and responsibilities for managing the road
networks, and separately provides some examples of road funds from across the world.
This study provides examples from two countries, South Africa and New Zealand. These two countries
have been selected because the South African National Roads Agency (SANRAL) and the New Zealand
Transport Agency (NZTA) are among the best organised and managed road agencies in the world.
Furthermore, SANRAL is also interesting because it is an example of a road agency in a middle income
country and illustrates what is possible with limited resources. The New Zealand example is an agency
that represents the “ideal” in terms of a road network should be managed and operated.
3.4.1. South Africa
The road network in South Africa consists of several types of roads, classified according to their
functionality and management, namely:
National roads are managed by SANRAL, a public agency with the Ministry of Transport as the
only shareholder. SANRAL was established by means of the South African National Roads Agency
Limited and National Roads Act (Act 7 of 1998). It is an independent statutory company
operating along commercial lines and with considerable autonomy from the government.22
Provincial/regional roads fall under the responsibility of the nine provinces. Eight of the nine
provinces operate on a traditional road authority structure that typically includes departments
such as Roads and Public Works for management and delivery of roads.
Local/municipal roads are managed using multiform institutional arrangements. Most
municipal road authorities have a traditional roads authority structure under the ownership of
the council. Two or more municipalities can form a transport authority to take over municipal
road functions and, currently, there are more than 250 “municipal road authorities” in operation.
In some metropolitan areas, like Johannesburg, Metropolitan Municipalities Roads Agencies have been
established as their delivery arm, under the guidance of a Roads Agency Board. The ownership of roads
still resides with the city, but the Metropolitan Roads Agency is responsible for the delivery of roads,
based on a performance contract that it has with the city’s contracting unit.
The coordination of and responsibility for the planning and delivery of the primary metropolitan road
network requires particular attention with many municipal road networks having both provincial and
national road components within their set-ups, where the “higher” spheres of government have tended
to dominate.
Finally, some 220,000 km of roads are unproclaimed, meaning that they were never formally adopted by
a particular government department as part of the official networks. Legally, no authority can spend
money on roads that are not proclaimed. These are typically access roads in rural areas.
22 SANRAL (2010). Our history. http://www.nra.co.za/live/content.php?Category_ID=21
The general state (or condition) of a gravel or paved road network system is described in terms of a
Visual Condition Index (VCI). The VCI of a road network is ideally quantified (bi-) annually and, if given
over time, shows the trend in road conditions. The VCI uses a five-point scale, that is, very good, good,
fair, poor, and very poor. Considering non-toll roads only, about 35 per cent of provincial and 15 per cent
of national roads are assessed as being in poor or very poor condition.23 Figure 3-1 provides an overview
of the quality and the expected quality of the non-toll national roads.
Figure 3-1 Forecasted quality of non-toll roads in South Africa24
Source: Consultant
SANRAL
SANRAL manages 19,704 km of the national road network and this is expected to grow to 35,000 km. Of
the national roads managed and operated by SANRAL, over 3,000 km are toll roads (see Table 3-2). Over
the past 10 years, SANRAL has also incorporated certain provincial roads that it has identified as being of
long-term strategic importance for the national road network.
As can be seen in Figure 3-2, SANRAL has a strong regional focus, with a head office being responsible
for a limited set of core services limited to providing corporate, financial, and engineering services. The
design and construction, operation and maintenance, and financial administration are all the
responsibility of the regional offices.
23 Council for Scientific and Industrial Research (2010). The condition of provincial road networks. www.csir.co.za 24 The Strategic Vision of SANRAL for the year 2010
Based on this admittedly limited review a few conclusions can be reached about the road sectors in
OIC countries, and the current state of repair and maintenance. It should be kept in mind that the
group of OIC countries is quite different in terms of their population, geography, size, and economic
development. These differences lead also to differences in the road sector and its performance.
Nevertheless, the conclusions that follow seem reasonable and defensible. The conclusions are:
The road sector in most OIC countries is over developed in terms of length relative to the
size of the population and GDP.
The share of motorways, highways, national and main roads in the total road network is
disproportionately large.
There is an acute lack of reliable and consistent data when it comes to expenditures in the
road sector. It is rather surprising to note that this data is not readily available.
For the limited number of countries for which data is available, there seems to be a capital
investment bias with the bulk of expenditures being rehabilitation and capital expenditures.
Not surprisingly given the above, the road network in most OIC countries is not in a very
good condition.
4.1. Overview of Road Maintenance
The OIC Member Countries follow very different maintenance protocols and regimes and hence
there is a wide range of variation in the state of repair of the road networks in the countries of the
OIC. The purpose of the current project is the assessment of the road maintenance strategies of OIC
25 AICD Background Paper 14 (Phase 1), (2008), the Burden of Road Maintenance: Roads in Sub-Saharan Africa; AICD Background Paper 15 (Phase 1), (200*) Financing Public Infrastructure in Sub-Saharan Africa: Patterns and Emerging Issues.
Enhancing Road Maintenance In the OIC Member Countries
52
Member States to support the development of a framework for identifying and evaluating policy
actions and investment priorities.
To achieve this, the need to provide an overview of road maintenance practices in OIC Member
States, the challenges they face, and recommendations for addressing these challenges is prevalent.
To collect the necessary information, a literature review was carried out, with the purpose to cover
the following issues:
Collecting case studies highlighting the economic and social benefits of regular road maintenance.
Gathering data and information to analyse the cost drivers of road maintenance and renewal in in sufficient detail to enable their comparison and assessment of relative importance.
Highlighting best practices with regards to maintenance management.
Gathering examples of alternative procurement and delivery service models, including the risks, costs and benefits of each model.
Gathering available data and information on the type and frequency of required maintenance, the efficiency of carrying out this maintenance, how it is carried out, using what technology, and the adequacy of the current processes for meeting future requirements.
Gathering available data and information on the institutional aspects of road maintenance; the allocation of responsibilities, budgeting, and availability of human resources.
Gathering available data and information on the how road maintenance is financed and the adequacy of financing to meet current and future maintenance requirements.
The results of the literature review are divided into two groups dealing with issues related to:
Organisation of road maintenance, and Funding
4.1.1. Organization of Road Maintenance
The typical road maintenance organisation is usually a part of a larger Ministry of Transport, or
Public Works Department (PWD). This organisation is responsible for the development and
maintenance of the road network. These road maintenance organisations either carry out the
maintenance activities themselves, or they contract out all or part of the maintenance activities. The
funds for undertaking the road maintenance activities are provided by the National Governments to
the Ministry of Transport or PWD which allocates a certain portion of the budget for maintenance
activities.
The above institutional structure has been identified as being linked several problems that make it
difficult to properly undertake needed maintenance activities required for a well performing road
network. These problems include competition for funds between road development and
maintenance, with maintenance activities loosing out and being underfunded relative to needs,
inefficient and slow execution of maintenance activities, and a near complete neglect of the
maintenance needs of rural roads.
Enhancing Road Maintenance In the OIC Member Countries
53
During the last decade, most governments have begun to realize the importance of road
maintenance and followed a path of institutional reform. The road sector reforms over the last
decade have mostly focused on:
1. Ensuring a larger and more stable flow of funds for road maintenance, and
2. Enhancing capacity to procure and/or execute the required maintenance works.
Through various initiatives of the World Bank, the Asian Development Bank and other development
agencies, there seems to be a broad consensus among stakeholders on the desirable institutional
structure for the road sector. This consensus revolves around the establishment and improvement of
road funds, providing ring-fenced funds for road maintenance based on some form of earmarked
revenue streams such as user charges or fuel levies. And second, the creation of an organisation
(usually a road agency) with the capability to procure, manage and execute maintenance works.
Road funds were created with the aim of improving the condition of the road networks by providing
more and stable funding for maintenance, and making road maintenance activities more business-
like. The assumption being that users would be willing to pay more for using better, and if they were
confident that their money (via the higher charges) was going to visibly improve the condition of the
roads. Despite the broad consensus about the desirability and effectiveness of road funds, only 18 of
the 57 OIC Member States have established a road fund. The OIC Member States that have
established road funds are mostly in Africa.
Table 4-4 OIC Countries with Road Funds
Road Fund Number of Countries Established 20 Under development or non-existent 37
Source: Consultant
The number of countries that do not have a road fund is clearly an issue for OIC Member States. It
should be underlined that it is not the presence or an absence of a road fund that is the issue, the
issue is whether there is an adequate and stable flow of funds to finance required maintenance
activities. Road funds are simply a mechanism for facilitating this.
Even the road funds that have been established are not all performing equally effectively. The
effective performance of road funds requires a sound legal framework and institutional structure. In
particular, for road funds to be effective there must be:
A clear legal basis for the establishment, operation and activities of the road fund,
A separation of functions, i.e., the road fund should only “fund” various activities and not be
involved in the execution or implementation of these activities,
Well defined user charges as the source of revenue,
Direct transfer of revenues to the road fund, without any political or other intervention
being required,
Operationally independent of the Ministry of Transport, Road Authority, or any other
government body involved in the management and operation of road networks,
Representation of stakeholders and users on the Board of the road fund,
Clear rules for allocating revenues to various activities,
Independent auditing of the activities and accounts of the road fund,
Enhancing Road Maintenance In the OIC Member Countries
54
Transparency regarding the activities and accounts of the road fund, both of which should be
publicly reported.
To varying degrees, the road funds that have been established in the OIC Member States are
characterized by the following:
The legal basis of many road funds remains weak.
The independence and autonomy of the road funds is not ensured, there is significant risk of
political interference as many of the representatives on the Boards of Road Funds are high-
ranking civil servants and public sector representatives are usually in a majority.
The participation of stakeholders in the road funds is very limited.
The accountability and transparency of road funds is mostly limited to conducting an annual
financial audit without any requirement for making the results of this audit public. There are
few disclosure requirements for legal documents and annual reports with financial data on
the activities of the road funds.
Road funds rarely, if ever, use data-based performance indicators for monitoring and
evaluating the impact of their funding activities. Thus, there is no link of the funding to
improvements in the performance of the road network.
Most road funds have a variety of revenue sources available to them, but the bulk of
revenues for the road funds still come from the traditional fuel levy and budget support from
general government revenues.
Despite many road funds having been established to fund maintenance activities, many road
funds finance road development and rehabilitation.
With regards to the OIC Member States that do not have road funds, there are a different set of issues
that have to be addressed. Most OIC Member States do not have a road fund. In these Member
States, the road maintenance activities are typically financed by general government tax revenues,
usually called a Force Account. The funds available for funding maintenance are determined using
some annual budget allocation process. This arrangement has been linked to the underfunding of
maintenance activities because of budget allocation processes that are flawed and politicised, and
pay little attention to the return on investment (which for maintenance activities can be quite high).
Furthermore, ministries that spend large amounts of money (such as the Ministry of Transport, or
the PWD) rarely win budgetary debates. Thus, maintenance rarely gets the optimal or needed level
of funding.
Another problem with the above institutional structure is that it leads to a capital bias – the
financing for maintenance is usually part of the annual budget, while new road construction is often
financed from a development budgets that are less constrained than the annual budget supported by
domestic revenue sources.
While road funds are viewed as the preferred mechanism for ensuring an adequate and stable flow
of revenue for financing maintenance activities, creating road agencies has been seen as a desirable
institutional response to the problems of poor management and operation of the road networks, and
by extension the poor execution and delivery of maintenance activities.
A large number of OIC Member States have created some sort of a road agency or a road authority;
this has not always delivered the expected benefits. There are several reasons for this.
Enhancing Road Maintenance In the OIC Member Countries
55
While the reforms and restructuring have taken place, the staffs of a road agency is still largely made
up of staff from the old road department and organisations. These staff often lacks the financial and
management skills needed for managing complicated maintenance contracts. Hiring new staff with
the requisite skill set is also complicated as the procedures for doing so are often the same as hiring
a civil servant, and the salaries are also similar. As the road sectors have expanded, the demand in
the private sector for such qualified and skilled people has also increased, making it hard for the
road agency to attract the needed talent.
The level of autonomy of the road agency in decision making varies; from total responsibility for the
road network to limited responsibility for execution of road maintenance programs. The freedom to
prioritize maintenance activities, allocate funds, and execute projects in ways that are consistent
with the assessed need for maintenance is essential for the road agency to perform better than the
typical road departments in the line Ministries of Transport. When a road agency does not have this
freedom, it is not surprising that the benefits that should follow from the creation of the road agency
do not.
The issue of leadership of the road agency is also an important one. All too often, the person leading
the new roads agency is a senior, politically connected serving, or ex civil servant rather being
chosen on the basis of an open solicitation procedure. This defeats the very purpose of creating the
road agency, i.e., to carry out maintenance activities based on need, rather than some other
consideration.
For a road agency to be effective, it must have a strong construction sector and companies with
whom it can partner to create a competitive procurement process, and advance the state of
technology with regards to road maintenance. The companies engaged in road maintenance in many
OIC Member States are often not conversant with the latest technology and techniques for road
maintenance and neither are they able to, for example, deal with competitive procurement practices
for maintenance, for example, performance based maintenance contracts.
There is a lack of competitive procurement practices because of maintenance works being carried
out using force account methods. The lack of competition all too often results in maintenance works
being delivered with poor quality, with delays, and too high a cost.
Most road agencies lack the data to carry out a serious prioritisation of maintenance needs and
projects. While the use of road asset management systems seems be becoming more common, it is
still not common for a road agency in an OIC Member States to have up to date data on the condition
of their road assets. More often than not, the available data is limited to a small section of the road
network, usually the motorways and highways and roads of national importance. There is a similar
lack of data regarding traffic volumes, an important input into planning road maintenance.
Finally, the maintenance of rural roads is almost always an oversight, even within a road agency.
While rural roads are not paved, building them does require some basic engineering skills and these
roads require regular and proper maintenance. Given that there is usually no specific organisation
or body to promote rural roads, the maintenance needs of rural roads are also often overlooked.
A second issue with maintenance being carried out by a national agency is the issue of competitive
bidding. If the maintenance activities of the agency are funded by force accounts rather than public
procurements using competitive bidding, there can be issues with regards to the costs and quality of
the maintenance activities that are being undertaken. This should not, however, be taken to mean
Enhancing Road Maintenance In the OIC Member Countries
56
that force accounts (for example such as the ones used in Tunisia and Indonesia) cannot be effective
in road maintenance, just that it seems that more often than not, they are not as effective as other
means to carry out road maintenance.
Despite the fact that force account performs satisfactorily in some countries, in some others it has
been proven to be ineffective in carrying out maintenance of road networks, due to the fact that
there is an over-supply of under-skilled and poorly supervised labour, resulting in low productivity
(Togo). In addition, in some cases it was noted that new equipment deteriorated quickly due to poor
maintenance and inappropriate use, as there is virtually no control of its use. As a result,
maintenance works should be contracted out to take advantage of competition and wider skills.
When the Ministry of Public Works and Highways, or a department within the Ministry of Transport
is responsible for maintenance activities, the maintenance activities are likely to suffer from the
same problems as when the maintenance is carried out by a national agency responsible for road
maintenance; there is no guarantee that the maintenance activities will not be underfunded, and the
lack of competitive bidding opens up questions regarding the cost and quality of maintenance
activities.
4.1.2. Funding
Developing countries experiencing high rates of growth spend between 2-3% of their GDP on
developing and maintaining their transport infrastructure. Some countries have invested an even
higher share of their GDP in the roads sector. For example, Japan invested between 3.5–3.8% of its
GDP in the roads sector during the years 1964–73. By comparison, for the OIC Member States for
which the data is available, the spending on the road sector ranges from between 0.25% for Bahrain
to 8.27% for Albania and nearly 15% of GDP for Libya.26 Albania, one of the poorest countries in the
world, is spending significant amounts of money on improving its road network which explains the
rather high percentage of expenditures on roads as a percentage of GDP. The remaining numbers are
either on the low side, or within what is seen historically and in other parts of the world. One general
observation is that low income countries tend to spend a higher percentage of GDP on roads. This,
however, is easily explained by the fact that these countries are also involved in developing their
road networks. Higher income countries have already developed their road networks and thus the
capital expenditures that are involved are smaller.
In terms of expenditures on maintenance, it is observed that maintenance expenditures are typically
lower than what is needed. There is, however, also a trade-off between maintenance and capital
expenditures. When maintenance expenditures are less than what is needed, it leads to larger
rehabilitation liabilities at some later date. Countries that are involved in developing their road
networks with large investment programs often have too little resources left over to adequately fund
the maintenance requirements.
The other important trade-off that is made when it comes to prioritising maintenance expenditures
is between motorways and highways and the smaller secondary and other roads (including rural
roads). As the size of the road networks increase, the resource requirements for maintaining the
network also increase. The resources, however, remain limited. In this case, there is some evidence
to suggest that the maintenance needs of the motorways and highways are met first, and what is left
is allocated to meet the maintenance needs of secondary and other roads.
26 Given the situation in Libya, the number for Libya should be used with some caution.
Enhancing Road Maintenance In the OIC Member Countries
57
The sources of revenue for funding maintenance activities are primarily from user charges and from
general tax revenues. In many cases, where OIC Member States have established a fuel levy to
provide revenues to the road funds, and/or to the transport sector, the level of this levy is too low to
provide adequate financing to cover the annual maintenance needs of these countries. This is
especially true for the OIC countries that are investing in further expanding their road networks. The
shortfall in funding from the fuel levies necessitates transfers from general tax revenues to finance
road maintenance activities. The magnitude of these transfers can vary from one year to the next,
and this leads to uncertainty about the total available funding for financing the maintenance of road
networks.
Thus, with regards to funding there are two major issues:
1. The lack of adequate and stable funding for maintaining the road networks. Despite the
establishment of the road funds in several Member States, adequate and stable funding for
maintenance activities remains elusive.
2. A tendency to seriously underfund the maintenance needs for the portions of the road
network that are not motorways, highways or national roads, requiring more expensive
rehabilitation works at some later stage.
4.1.3. Other Issues
There are a few other issues that need to be highlighted with regards to road maintenance.
First, there is a serious shortage of trained personnel and staff for carrying out maintenance
activities. It is increasingly difficult to find qualified personnel who are willing to come and work at
the road agency, or for the government. This shortage is especially severe in some countries where
lots of personnel retire in bunches and it becomes difficult to find staff to replace the retiring
personnel.
Another important issue is that of overloading of (especially freight vehicles) that use the road
network. The enforcement of weight controls is almost never carried out and is weak and
ineffective. Yet, overloading is one of the major causes of accelerated deterioration of pavement
conditions on the road networks. It is also not always clear which organization is responsible for
enforcing the weight limits.
Third, the design standards that are in place are not suited for handling the large, heavy, multiple
axle vehicles that are now commonly used to freight transport. Clearly, these obsolete design
standards contribute to increasing the maintenance requirements to more than what they would be
if the design standards were updated and reflected the development in vehicle technology over the
years.
Finally, the capability to engage in multi-year maintenance planning and budgeting remains very
weak in most of the OIC Member States. Even when the tools, for example the HDM-IV, are available,
they are either not properly used, or not used at all to structure the maintenance process and set
priorities. One of the primary reasons for this is the lack of proper data to support complex tools
such as HDM-IV, or RONET.
The results of the literature review presented in this chapter paint a not all too rosy picture of road
maintenance in OIC Member States. Based on the literature review the following can be concluded:
Enhancing Road Maintenance In the OIC Member Countries
58
The institutional development of the road maintenance sector in OIC Member States is
lagging behind international best practices in terms of establishing road funds and road
agencies. Thus, for example, a majority of OIC Member States still do not have an
operational road fund. Unfortunately, even when the road fund exists, its performance can
be improved. The situation with regards to road agencies is not significantly better.
Many OIC Member States still carry out routine and preventive maintenance using force
account methods, resulting in the well-known inefficiencies and delays in execution of the
works.
The governance, transparency of operation, and public accountability of the road
maintenance organisations is in need of improvement so that these organisations can make
decisions about road maintenance based on the needs and requirements rather than any
other considerations.
There is an issue with regards to the human resource side of government organisations
involved in road maintenance; there is a shortage of qualified staff and it is becoming
increasingly difficult for these organisations to attract the needed talent.
The capabilities of the construction sector in many OIC Member States need to be upgraded
and expanded so that they can undertake, for example, performance based maintenance
contracts.
The level of the fuel levy and road user charges is set at very low levels and need upward
revision.
The maintenance needs of, in particular the rural road networks, need to be given more
attention during the planning a budgeting process than what they currently receive.
4.2. Case Studies
The three case studies covered:
1. Morocco
2. Turkey
3. Senegal
4.2.1. Case Study – Morocco
Morocco is a large country covering an area of 446,550 square km. It is a low income country (see
Table 4-5) that has been investing significantly in expanding its road network. The road network is
divided into three road categories; National, Regional and Provincial. The road network includes
both paved and unpaved roads (see Table 4-6). In addition, there is also a developing expressway
network (see Table 4-8).
Morocco has also been investing in developing its rural roads network to increase the accessibility of
its rural population. In 2005, 54% of its rural population, 300,000 people had access to a rural road.
In 2012, after completion of the 2nd Rural Roads Program, 80% of its rural population, 3 million
people had access to a rural road. (see Table 4-7).
At the end of the completion of the 2nd Rural Road Program, 50% of the rural roads were
government owned. However, the objective of the Moroccan Government is to transfer ownership
for the entire rural roads network to the local communities that are served by these roads.
Enhancing Road Maintenance In the OIC Member Countries
59
The Ministry of Equipment, Transport & Logistics, and Directorate of Roads is responsible for the
development; operation and maintenance of the Moroccan road network. The AutoRoute du Maroc
is responsible for the development, operation and maintenance of the expressway network.
Falling directly under the Directorate of Roads is the Institute de Formation aux Engins et a
l’Entretien Routier (IFEER) and Le Centre National d’Etudes et de Recherches Routiers (CNER). The
IFEER is responsible for delivering the needed vocational education to support the road sector. The
CNER is responsible for supporting the technical development and maintenance of the road sector.
Table 4-5 Socio-economic Indicators for Morocco
MOROCCO latest data (2000-2013) Year 2013 Population 33,008,150 GNI per capita ($) 3,020 Surface (square KM) 446,550 Length of roads by GDP per capita (Km/$) 19 Density of roads (Km/Km2) 0.13
Source: Consultant
Description of Road Network
National roads make up about 20% of the total road network in Morocco, and most of these roads
are paved roads. In fact, the bulk of the roads in Morocco are paved – 72% of the road network is
paved. The length of the rural roads network is quite small compared to the road network – rural
roads were only 15,000 km in length compared to 57,334 km of the national, regional and provincial
roads network. Finally, the motorway network is quite small; it is only 770 km in length. However,
another 283 km of motorways are under construction, and 241 km are planned for construction.
Table 4-6 Road Network by Road Category
Category Paved (km) Unpaved (km) Total % National 10185 1214 11399 20 Regional 9510 581 10091 18 Provincial 21736 14108 35844 62 TOTAL 41431 15903 57334 100
Source: Consultant
Table 4-7 Rural Road Development Program
Period Length (km) 1st Rural Roads Program (PNRR1) 1995 – 2005 11,236 2nd Rural Roads Program (PNRR2) 2005 - 2012 15,000
Source: Consultant
Table 4-8 Expressway Network
Expressway Network Length (km) In service 770 Under construction 283 Planned 241
Source: Consultant
Enhancing Road Maintenance In the OIC Member Countries
60
Figure 4-9 Organisation of Ministry of Equipment, Transport & Logistics
Source: Consultant
Organization of Maintenance
The Ministry of Equipment, Transport and Logistics, Directorate of Roads is responsible for the
development, operation and maintenance of the road network in Morocco. There is a maintenance
department with the Directorate of Roads that is responsible for executing the required routine and
periodic maintenance, as well as the rehabilitation works. The Directorate of Roads develops two
types of maintenance plans: 1) a 5-year plan for preventive maintenance, and 2) a 2-year plan for
routine maintenance. The preventive maintenance needs are ranked using the HDM-IV model and
using Cost Benefit Analysis.
The Directorate of Roads has 55 regional and provincial directorates that are responsible for
carrying out emergency, routine and periodic (rehabilitation and reinforcement) maintenance.
Emergency maintenance is carried out using own staff, while most routine and preventive
maintenance is carried out by private contractors.
The CNER is responsible for carrying out:
Two yearly road condition survey of the road network.
Maintaining the Road Management System that includes a Road Data Bank (RIB) and a
Cartographic Data Bank (COB)
Research studies to determine, amongst other things, the optimal road strategy for road
maintenance
Enhancing Road Maintenance In the OIC Member Countries
61
The IFEER is responsible for providing vocational education to meet the requirements of the road
sector with regards to maintenance and construction, in particular to train equipment drivers,
operators, foreman, and site engineers. In addition to the IFEER, the Ministry of Equipment,
Transport & Logistics also has two institutes for training technicians in Fez and Agadir.
In addition to the IFEER, the Ministry of Equipment, Transport & Logistics also has engineering
schools in the cities of Oujda, Marrakech, and Casablanca.
The Ministry of Equipment, Transport & Logistics also maintains an on-going discussion with the
association of contractors (Association Marocaine des Routes) and the Federation Nationale des
Batiments et des Travaux. This is an important element of raising the level of quality among the
contractors and construction industry.
Finally, the Ministry of Equipment, Transport & Logistics, together with the Association Marocaine
des Routes has developed a Contractor Qualification System with several levels. At each level of this
qualification system, contractor has to satisfy increasingly stringent requirements with regards to
human resources, number of engineering staff, and capital of the company, equipment and
references. Once qualified, a contractor can bid for work suitable for their level of qualification for a
period of three years, after which the qualification must be renewed. This system of pre-qualification
is important in reducing the length of time required for procuring maintenance works.
Financing of Maintenance
The financing for road projects (including maintenance) comes from four sources:
1. General tax revenues
2. The road fund (Fonds Speciale Routiere)
3. Partners
4. External funds (La Caisse Pour Le Financement Routier)
Table 4-9 Funding by Source for Road Projects
General Budget (Million Dirhams)
FSR (Million Dirhams)
Partners (Million Dirhams)
CFR (Million Dirhams)
2015 2,026 3,207 106 2,408
2016 2,471 2,500 600 2,305 Source: Consultant
The maintenance works are financed via the General Budget and the road fund (FSR). In 2016 the
total budget was about 5,000 million Dirhams. Maintenance works got 29.5% (1,432 million
Dirhams) in 2016. This, however, is not even 50% of the financing needed to meet the maintenance
needs. According to studies, the annual financing needed to meet the maintenance requirements is
almost 3 million Dirham. Of the funds dedicated to maintenance, almost 71% of the funds are for
routine and periodic maintenance, with the remaining being for rehabilitation, reinforcement and
widening. The FSR get its revenues from fuel taxes.
Enhancing Road Maintenance In the OIC Member Countries
62
Issues in maintenance of the road network
Figure 4-10 shows the expansion of the road network since 1990, the road network has been
steadily growing from about 26,500 km in 1990 to over 42,000 km in 2014. Thus, the need for
maintenance and resources to finance the maintenance has been increasing. During this same
period, the volume of traffic on the road network has increased dramatically, from about 27 million
vehicle kilometres in 1990 to over 90 million vehicle kilometres in 2014.
Increase in traffic volumes - This dramatic increase in traffic volume means that the road network
needs to be properly maintained in order to handle this traffic. One of the problems is that the road
network is not designed to handle the larger heavier vehicles that are currently in use. The Moroccan
road network is designed to handle and axle load of 13 tonnes, whereas the current average axle
load is 19 – 20 tonnes. Thus, the pavement deterioration is much more rapid and severe than if the
road was designed to handle these higher axle loads. The road network is also not properly
designed to handle the heavy multi-axle Lorries that are routinely used for freight transport. Again,
the effect of this is more rapid and severe pavement deterioration than if the roads were designed
taking the traffic mix and volumes into account.
Figure 4-10 Evolution of Road Network 1990 - 2014
Source: Consultant
Overloading - Another issue that affects maintenance is the overloading of freight vehicles. Almost
40% of the vehicles do not respect the weight limits. Currently, there are 6 weighing stations in all of
Morocco. The Moroccan Government is looking at ways to expand the number of weighing stations
as this is having a serious effect on the condition of the road network.
Weather - Since 2008, severe rains and flooding have also caused problems in maintaining the road
network. As a result of severe rains and flooding in 2008, 2009, 2010, and 2014 destroyed several
roads requiring the equivalent of 3 years maintenance budget to rehabilitate the road network.
Figure 4-11 shows the condition of the road network. From 1990 to 2000, the percent of the road
network that was in Good of Fair condition was increasing. However with a peak in 2000 (66%), the
percent of the road network that was in Good or Fair condition started declining, falling to 53.8% in
2012. In 2012, the funding for maintenance was increased and this is immediately visible in an
increase in the per-cent of the road network that is in Good or Fair condition. The increase in
maintenance requirements because of a larger road network, the increase in traffic volumes,
When there are problems with this equipment, there is no one in Morocco who is able to carry out
the necessary maintenance and repair in Morocco. This means that the down time because of
equipment failure can be long, resulting in disruptions to scheduled surveys and other maintenance
related work.
Lessons Learned
The Moroccan road network appears to be a reasonably well managed and maintained road
network. The Moroccan authorities responsible for developing, managing and maintaining the road
networks have won the confidence of various international lending agencies and institutions such as
the World Bank, Japan International Cooperation Agency (JICA), and the European Investment Bank
(EIB). This is important as it testifies to the quality and ability of the organisations and personnel
involved in this process. This is also reflected in the strength and quality of the planning and other
processes supporting the maintenance of the road network. Thus, one important lesson that can
be drawn from Morocco is the importance of collecting data (CNER collects traffic volume
data at 250 points in Morocco and does the pavement condition survey every two years, and
maintains the Road Management System). Once the data has been collected it is used to
create multi-year plans, such as the two-year routine maintenance plans and the 5-year
maintenance plan.
Another important lesson from the Morocco case is the importance of training and educating staff
such as foreman, site engineers, equipment drivers, and operators. The Ministry of Equipment,
Transport and Logistics is heavily invested in educational institutions at all levels. The problems of
staffing notwithstanding, this emphasis on education has helped to raise the quality of engineering
works (including maintenance) in Morocco.
The dialogue with the industry is another noteworthy feature of the Moroccan Government’s
efforts to raise the quality of the contracting industry engaged in road maintenance. This has
resulted in the contractor qualification system for pre-qualifying contractors for bidding on
maintenance works which simplifies and expedites the procurement of maintenance works. This
has also motivated the Ministry to revisit the use of performance based maintenance contracts.
The department responsible for maintenance within the Ministry is at the same level as the
department responsible for executing construction projects. This is important as it makes clear
that maintenance is as important as construction. Acknowledging the importance of maintenance, a
large share of the resources available for maintenance is spent on routine maintenance and not on
rehabilitation.
Enforcement of weight limits is going to become increasingly important as the road network
expands further and traffic volumes increase. Overloading is clearly a problem, and enforcing
weight limits will increasingly become a priority if the road network is to be maintained in a good
condition.
Since 2008, the damage caused by severe rains to the Moroccan road network required
rehabilitation that was the equivalent of three years maintenance budget. Thus, clearly climate is a
factor that needs to be considered when estimating the resources needed for maintenance.
Enhancing Road Maintenance In the OIC Member Countries
65
4.2.2. Case Study – Turkey
Turkey is a large country with a total area covering 783,562 square km. Its area covers a high central
plateau (Anatolia); a narrow coastal plain; several mountain ranges. Turkey is a middle income
country that is now investing in developing a motorway network and increasing the share of the
network that is covered with an asphalt pavement.
Table 4-10 Socio Economic Indicators for Turkey
TURKEY latest data (2000-2013) Year 2013 Population 74,932,641 GNI per capita ($) 10,970 Surface (square km) 783,560 Length of roads by GDP per capita (Km/$) 35 Density of roads (Km/Km2) 0.50
Source: Consultant
Description of Road Network
The total length of the road network in Turkey is 388,366 kilometres. The road network is divided
into four categories, motorways, state highways, provincial roads, and other (see Table 4-11). There
are two things worth noting about the road network: 1) the total length of the road network that is
covered with asphalt/concrete is quite low (it seems that surface treatments are the preferred
pavement type), and 2) forest, rural and urban roads make up the large part of the total Turkish road
network.
Table 4-11 Length of Road Network by Road Type
Road category
Asphalt/concrete Surface Treatment
Other Total
Motorways
2,159 2,159
State highways
14,393 16,399 421 31,213
Provincial roads
2.702 27.327 2,864 33,065
Forest, rural, tourist, and urban roads
321,929 321,929
Total 19,254 43,726 325,214 388,366 Source: Consultant
Figure 4-12 shows the growth of the road network in Turkey, excluding motorways, forest, rural and
urban roads. What is quite striking about this graph is that the total length of state highways and
provincial roads has not increased by much since 1967, in 1967, the total length was 59,257 km and
in 2015 it was 64,278 km. The second thing this graph clearly shows is how the network of state
highways and provincial roads is increasingly paved with a surface treatment, or asphalt/concrete.
Enhancing Road Maintenance In the OIC Member Countries
66
Figure 4-12 Growth of State Highways and Provincial and Other Roads in Turkey (1967 – 2015)
Source: Consultant
Organisation of maintenance
The General Directorate of Highways (GDH) is responsible for maintain the motorways, state
highways and provincial roads. The GDH is an institution that falls under the Ministry of Transport
and Maritime Affairs. The total length of highway which is under the control of the GDH is 65,909
km.
Within the GDH there is a separate department, the Department of Facilities and Maintenance that is
responsible for the maintenance of the road network and another department that is responsible for
the surveys to collect data on the condition of the road network and other assets, the Department of
Surveys, Design and Environment. Furthermore, there are 18 regional divisions of the GDH, which
have 281 Maintenance Houses and 25 Motorway Maintenance and Operation Offices.
Maintenance works on state highways and provincial roads are carried out by the Regional Divisions
and the Districts. Each district conducts the maintenance works and snow and ice removal with its
own team within its geographic boundaries.
There are three types of maintenance works that are undertaken by the GDH:
Routine maintenance Snow and ice removal Emergency maintenance.
Routine maintenance works include:
Removing surface deformation on asphalt roads, Corrugation and rutting on surface of stabilized road, Repairing structures, such as, bridge, culvert, structures,
Enhancing Road Maintenance In the OIC Member Countries
67
Addressing the effects of flooding and erosion, and Clearing drainage systems, ditches and culverts as well as vegetation, etc. Snow and ice removal are also a prominent part of the maintenance works.
Most of the routine, periodic maintenance, rehabilitation and reinforcement works are contracted
out by GDH to private contractors. Private contractors are awarded three-year maintenance
contracts; these contracts are not performance based maintenance contracts.
Of the remaining roads, the construction and maintenance of the Touristic roads is done by the GDH,
but paid for by the Ministry of Tourism. The Village, Forest, and Urban roads are under the control
of the Provincial Special Administrations, The Ministry of Forests, and the municipalities,
respectively.
There is little information on how the maintenance is carried out for the village, forest, and urban
roads, or for that matter on the condition of these roads.
Figure 4-13 Organogram of Turkish General Directorate of Highways
Source: Consultant
Financing of maintenance
The General Directorate of Highways is a Government organisation that gets the bulk of its revenue
from the general budget. In addition, it also has a supplementary budget. A budget is prepared for
three years and submitted to the Turkish Parliament for approval. However, the Parliament
approves and allocates an annual budget for GDH every year. In the past, the investments made by
GDH have been supported by revenues from the supplementary budget, as well as from the Public
Enhancing Road Maintenance In the OIC Member Countries
68
Participation Fund (started in 1984), and Fuel Oil Consumption Fund (started in 1985). However,
both the Public Participation Fund and the Fuel Oil Consumption Fund have since been abolished.
Figure 4-14 shows the budget at the start of the year to the GDH, and the budget allocated to it at the
end of the year. This figure shows several things. First the budget allocation has grown and grown
significantly since 1980 and, second, the budget at the end of the year is significantly higher than the
budget at the start of the year.
Figures (Figure 4-14 and Figure 4-15) show the total budget that is available to the GDH. According
to the GDH, in 2014, they spend roughly 10–12% of their total budget on routine and periodic
maintenance. The rehabilitation and reinforcement works were not included in this 10% figure.
Figure 4-15 shows the ratio of the year-end budget to the initial budget for the GDH. This figure very
clearly shows that over the years, the ratio has increased to more than 2 – the budget allocation at
the end of the year is twice what it was at the start of the year. This is quite remarkable as it suggest
some a very high level of ad-hoc, off-budget funding. This off-budget funding does not appear till late
in the year, and this makes it difficult to plan for the annual maintenance needs as there is
uncertainty about the total amount of resources for maintenance activities. In terms of planning, this
uncertainty makes it difficult to engage in systematic annual and multi-year planning.
The revenues provided to GDH from the general budget are proving to be insufficient to cover the
costs of expanding the road network. Thus, lending by International Financial Institutions is being
used to supplement the revenues from the general budget.
In terms of the maintenance of the road sector, it was mentioned that rehabilitation and
reinforcement projects are viewed as capital projects and not as maintenance projects. This
rehabilitation and reinforcement projects are included in a 3 – yearly capital investment plan and
submitted with their budget to the Parliament for approval. Thus, works that what would be
considered as part of a maintenance plan are financed in Turkey using capital funds. This annual
0
0,5
1
1,5
2
2,5
3
1980 1997 2001 2005 2009 2013
Year-end/Initial
Enhancing Road Maintenance In the OIC Member Countries
69
budget approval process for capital projects means that there is little guarantee that the required
maintenance needs will be adequately financed in any given year.
Figure 4-15 Initial and Year End Budgets for Turkish GDH (1980 - 2014)
Source: Consultant
Issues in maintenance of road network
Decentralisation of responsibility for rural, forest, urban and touristic roads – In addition to
the roughly 66,000 km making up the national road network, there is an additional 321,000 km long
road network comprising rural, forest, touristic and urban roads. These roads are the responsibility
of the Ministry of Forests, Ministry of Tourism, and Municipalities, respectively. There is virtually no
information available on these roads at a national level (at least a country level overview of this road
network cannot be uncovered). This decentralisation is problematic on several levels. First, this
321,000 km is a huge network of roads, whose maintenance needs are bound to be large. It is
entirely unclear whether these needs are being met at all. Second, a large part of the benefits of such
roads are dependent on the roads being well maintained.
Lack of a maintenance management system – There is little by way of systematic up-to-date data
to support a systematic assessment of the maintenance needs of the road network. This lack of data
makes it difficult to prioritise maintenance projects, or to forecast future preventive maintenance
needs. There is also no adequate pavement deterioration model that can be used to forecast future
pavement conditions. Not having the necessary data or a pavement deterioration model means that
it is becomes very difficult to develop a good budget to request funding for maintenance activities.
Delays in addressing the maintenance needs of the road network – Routine and periodic
maintenance is postponed till such time that rehabilitation and reinforcement works are needed. It
seems that surface dressing is used to resurface roads in need of maintenance, without considering
the structural integrity of the underlying road.
Flawed technical solutions are applied to solve maintenance problems – It seems that in
Turkey surface treatments are applied every 3 – 4 years. This is surprising as in countries like
France, properly applied surface treatments can easily last for up to 10 years. This suggests that the
0 ₺
2.000.000.000 ₺
4.000.000.000 ₺
6.000.000.000 ₺
8.000.000.000 ₺
10.000.000.000 ₺
12.000.000.000 ₺
14.000.000.000 ₺
16.000.000.000 ₺ 1
98
0
19
90
19
95
19
96
19
97
19
98
19
99
20
00
20
01
20
02
20
03
20
04
20
05
20
06
20
07
20
08
20
09
20
10
20
11
20
12
20
13
20
14
Initial
Year End
Enhancing Road Maintenance In the OIC Member Countries
70
way surface treatments are being applied is not appropriate as they have a much shorter life
expectancy than what is normally the case, resulting in higher expense.
Lack of earmarked funding to finance maintenance activities – As a result of the lack of
earmarked funding, several of the larger maintenance works have to be financed via a capital
investment plan, where the “maintenance” projects compete with other projects. Sometimes they
get the needed funds, and sometimes they do not. This introduces uncertainty about whether a
given set of maintenance activities can be undertaken, quite regardless of the urgency of undertaking
these maintenance works.
Overloading of trucks – Almost 40% of the trucks on Turkish roads exceed the weight limits
specified for the roads. This accelerates the pavement deterioration process. Normally, the agency
that is in charge of the operations and maintenance of the road networks is also the agency in charge
of enforcing the weight limits. In Turkey, however, the enforcement of weight limits on the road
network is the responsibility of another, separate agency than the GDH.
Legal and regulatory framework is inhibiting innovative and modern contracting practices –
Apparently, the laws in Turkey do not allow for Turnkey Projects, where all aspects of a project are
outsourced. This also makes it difficult to introduce, for example performance based maintenance
contracts.
Lessons learned
Need for institutional reform - From the review of the organisational and financial aspects of road
maintenance in Turkey, it is quite clear that the institutional structure of the road sector needs to be
updated. There is no independent road authority, nor is there a road fund. As a consequence the
usual problems are observed with regards to maintenance that were also seen in many countries
prior to their undertaking institutional reforms of the road sector. These included a backlog of
maintenance works that are not being funded, variability in the annual budgets and funding of
maintenance works, and a lack of transparency.
Need for planning of preventive maintenance activities – It is clear that in Turkey most
maintenance works are not part of a short/medium term, or long-term maintenance plan. The data
and modelling tools needed to support such planning are urgently needed.
Turkey is a good example of the importance of a well-designed institutional framework, well
designed processes and legal and regulatory frameworks that allow the responsible agencies to
discharge their responsibilities in as cost – effective a manner as is possible. Turkey does not have
this, thus, the maintenance of Turkish roads is either not good enough, or it is unnecessarily
expensive.
4.2.3. Case Study – Senegal
Senegal is situated in the West part of the African continent in the Sub-Saharan region. The country
is classified as a lower middle-income by the World Bank. The surface area of Senegal covers
196,712 km2. In the north it borders the Islamic Republic of Mauritania; in the East, Mali; in the
South, Guinea-Bissau and the Republic of Guinea; and in the West there is the Atlantic Ocean.
According to the 2013 census, Senegal’s population was slightly more than 13.5 million. During the
period 1960 – 2002, the average growth rate of the population was 2.6%. However, from 2002 to
Enhancing Road Maintenance In the OIC Member Countries
71
2013 the population growth increased sharply to 35%. The population is quite unevenly distributed
across the country, 22% of the total population lives in the region of Dakar (0.3% of the total
surface), with an average density of 4,147 persons/km2.
Eleven Regions and thirty-four Departments compose the administrative division of Senegal. Each
Department includes sub-prefectures, towns, villages and rural communities.
The gross domestic product (GDP) has grown steady evolution from 5,403 billion FCFA in 2007 to
7,225 billion FCFA in 2012. In the period 2007 – 2012, the GDP grew by 33% with an average annual
GDP growth rate of 3.4%.
Description of Road Network
The road network in Senegal is divided in two categories:
Classified Network “réseau classé” (CN) (see Table 4-12): This network is under the supervision
of the Ministry of Infrastructure and Land Transport. In 2013, the total length of the CN was 15,609
km, and 36% of this network was paved. The assets of the CN are evaluated to be worth 1,860 billion
FCFA.
Table 4-12 Composition of the Classified Network (CN) in Senegal
Classified Network (CN) Total Classified Network (CN) Paved Roads
Departmental roads 38% 14%
Track roads 29% 2%
National roads 23% 78%
Regional roads 8% 47%
Urban roads 2% 100%
TOTAL 100% 36% Source: AGEROUTE
Non-classified Network “réseau non classé” (NCN): This network is under the administrations of
municipalities or villages. The length of the NCN is between 30,000–45,000 km.
Organization of Maintenance
The entity in charge of the definition and implementation of the road policy in Senegal is the
Ministry of Infrastructure and Land Transport (MILT) (“Ministère des Infrastructures, des Transports
terrestres et du Désenclavement”). A General Secretariat, Directorates, Administration Agencies,
Public Institutions and National Corporations make up the MILT.
For road maintenance, three entities from the MILT are responsible for maintaining the roads in
Senegal:
1. Directorate of Roads
2. Agency of Works and Management of Roads (AGEROUTE)
3. Fund for Autonomous Road Maintenance (FERA)
The Directorate of Roads implements the road policy defined by the Ministry of Infrastructure and
Land Transport. The main responsibilities of the Directorate of Roads are to:
Develop a coherent policy to manage all the road network in Senegal,
Enhancing Road Maintenance In the OIC Member Countries
72
Ensure a development planning of the road network, a program of investments and the
establishment of technical records to mobilize its financing,
Ensure a technical coordination of public and private organizations which intervene in road
maintenance and infrastructure,
Provide support to local authorities in road infrastructure,
Implement a national development strategy on rural roads,
Monitor freight trucks and heavy vehicles in coordination with the Public Private
Partnership-Afrique Pesagge-SA.
AGEROUTE is responsible of the management and coordination for the Classified Network in
Senegal. This agency works in close collaboration with the Directorates of Roads. The main
responsibilities of AGEROUTE are to:
Assess the needs of road infrastructure and maintenance in Senegal, Propose to the MILT a road guidance for the road sector, Develop road projects and works, Create a data base for the road sector in collaboration with the MILT, Develop a three-year Public Investment Program (PTIP) for the country in terms of road
maintenance, rehabilitation and new constructions. The PTIP is updated every year, Develop an annual road maintenance program (PERA), Propose road maintenance and financing strategies, Hire consultants and companies and ensure the good management of the companies
working on the classified road network, Conduct technical studies, including studies to assess the feasibility of road projects, Support local authorities in implementing road projects, Contribute to the successful completion of public works, Advise on any issues related to roads.
The main objective of FERA is to guarantee the continuous flow of resources for financing, in a timely
manner, maintenance of the road network in Senegal. The Board of FERA is made up of
representatives from government, transporters, users, private sector and other partners. FERA is the
most autonomous entity for road maintenance in Senegal. A more detailed description of FERA is
provided in the next section Financing of Maintenance.
These three entities (Directorate of Roads, AGEROUTE, and FERA) that are in-charge of road
maintenance are supervised by an Oversight Council the “Conseil de Surveillance” comprising
representatives from the road administration, road professionals and road users.
Financing of Maintenance
The Fund for Autonomous Road Maintenance, “Fonds d’Entretien Routier Autonome (FERA)” is the
entity in charge of financing the maintenance of the road network in Senegal. FERA was created in
2007 under the law decree no: 2007-1277. The institution has a legal basis and is guaranteed
financial autonomy. The mission of FERA is to mobilize sufficient resources for financing the
maintenance and operation of the entire road network.
The main sources for revenues for FERA are:
The annual budgetary allocation provided by Government and managed by the Consolidate
Budget for Investments, “Budget Consolidé d’Investissement (BCI)”,
Enhancing Road Maintenance In the OIC Member Countries
73
A Tax on Road Use (TRU). This special tax is an addition to the specific tax of fuel products. It
was established in 2008 by law decree after the modification of the Tax Code. The resources
from this special tax are a complement to the annual budget, increasing availability and flow
of additional resources,
Additional governmental subsidies managed by the BCI.
The Tax on Road Use (TRU) is levied on three fuel products:
1. 35 FCFA (around 7 cents USD) to the super gasoline (above 90 octane), it is 5.9% with
respect to the price in 2008.
2. 32 FCFA (around 6 cents USD) to the regular gasoline (below 90 octane), it is 8.5% with
respect to the price in 2008.
3. 16 FCFA (around 3 cents USD) to the diesel fuel, it is 3.3% with respect to the price in 2008.
In 2011, an increase of the TRU was established by law decree, doubling the level of taxes for super
gasoline, regular gasoline and diesel fuel. This resolution considerably increased revenues available
to FERA. This increase was necessary to maintain the level of road financing in Senegal. Today FERA
views this type of tax as providing it with a stable source of revenues.
Table 4-13 shows the actual level of collection and the forecasted collections of the TRU from 2009
to 2015.
Table 4-13 Evolution of the TRU collection in Senegal (2009-2015) (Millions of FCFA)
2009 2010 2011 2012 2013 2014 2015
Previsions TRU 16,000 22,500 24,500 24,500 25,000 26,000 26,000 Collection TRU 11,082 12,298 21,796 21,930 25,669 27,154 29,468 Gap TRU -4,918 -10,202 -2,704 -2,570 +669 +1,154 +3,468
Source: FERA
The doubling of the TRU has had an important effect on revenues since 2011 and more tax revenues
are actually being collected than what was expected.
The revenues available from various sources for financing road maintenance , together with the
revenue requirements for properly maintaining the road network are shown in Table 4-14. Table
4-14 shows that the available revenues are insufficient for properly maintaining the road network.
One of the innovative sources of financing being considered by FERA is to borrow money from a
commercial bank to finance the funding shortfall for maintenance activities. The rationale for this is
that the cost of delayed maintenance exceeds the cost of this loan. The loan itself would be
guaranteed by the guaranteed revenue sources from the TRU that come directly to FERA.
Enhancing Road Maintenance In the OIC Member Countries
74
Table 4-14 Sources of road financing and needs for road maintenance in Senegal (2009-2015) (Millions of FCFA)
2009 2010 2011 2012 2013 2014 2015 Tax of road use TRU 16,000 22,500 24,500 24,500 25,000 26,000 26,000 Budget BCI 21,000 22,500 22,500 22,500 25,200 25,000 26,000 Total budget road financing
37,000 45,000 47,000 47,000 50,200 51,000 52,000
Needs road maintenance 49,500 55,500 51,100 52,000 52,000 70,000 Paved roads in good and fair levels
52%
60%
61.5%
62.3%
66%
71%
74%
Unpaved roads in good and fair levels
31.5%
39.4%
39.4%
41%
41.7%
43%
45%
Source: FERA
Issues in maintenance of the road network
Overloading of vehicles – Overloading of both passenger and goods vehicles is a chronic problem.
According to a study carried out by the European Union, the cost of this overloading (because of
faster pavement deterioration) is estimated to be 35 billion FCFA.
Dependence of government tax revenues – A significant part of the FERA budget is financed from
general tax revenues allocated by the government. The volume of these funds varies from year to
year creating uncertainty about the total revenues available for maintenance activities in any given
year. This uncertainty makes it difficult to properly plan annual maintenance activities.
Obsolete design standards – The road network in Senegal is designed using an axle load of 10.5T /
axle. This is an obsolete standard that is inadequate for the heavier multi-axle goods vehicles that
use the road network in Dakar. The heavier vehicles using the road network leads to faster than
expected deterioration of the pavement and this in turn means more maintenance.
Availability of materials – There is a lack of suitable local materials for road maintenance and the
availability of cement is an issue. The lack of appropriate materials means that maintenance works
are often delayed and more expensive than what normally should be the case.
Problems with contractors – While the local contractors are technically qualified, in practice there
are problems with the quality of the works that are delivered.
Lesson Learned
Organisation of the road sector – The road sector is very well organised in terms of the structure
and institutional responsibilities. Very importantly, the management and operation of the road
network is managed by a Directorate of Roads, while the funding of the maintenance is provided by
an independent road fund.
Innovative financing sources – The FERA is going to borrow money from a commercial bank using
its guaranteed revenue sources to guarantee the loan. This is an innovative form of financing
maintenance activities and can be used as an example in other parts of the world.
Road fund is focused on preventive maintenance – The focus of the road fund (FERA) is on
financing preventive (routine and periodic) maintenance and this is important as it helps to reduce
unnecessary expenditures because of delayed maintenance.
Enhancing Road Maintenance In the OIC Member Countries
75
5. CONCLUSIONS AND RECOMMENDATIONS
5.1. Conclusions
While the road sector has been undergoing a lot of development and improvement, unfortunately, in many countries the problems that plagued it from more than a decade ago have still not been adequately addressed. These include:
The lengths of the road networks in OIC Member States, relative to GDP, are quite large when compared to the US and the EU28. Except for Egypt, Gabon, Guyana, Indonesia, Iran, Iraq, Jordan, Kuwait, Lebanon, Morocco, Palestine, Qatar, Saudi Arabia, Somalia, Tunisia, and Turkey, the remaining OIC Member States are spending too much on developing their road networks. From a maintenance perspective, it is almost a given that these countries will find it very difficult in the future to find resources to properly maintain their road networks, and preserve the value of their assets.
The density of coverage of the road networks in OIC Member States is quite low compared to the US and the EU28. Of course, this is not entirely surprising as the road networks in many of the OIC Member States are still developing and not mature. However, this observation together with the previous observation regarding the size of the road networks relative to the country’s GDP suggests that the development of the road networks, within any given country, seems to be focused around providing a limited number of high quality road links. Of course, there may be very good reasons for doing this, for example, the population of a country may be clustered in a few large cities, the geography of a country may require this, or something else.
There seems to be a clear focus in the OIC Member States on the paved road network, the share of the paved road network of the total road network is rather high in many in many OIC Member States. In fact, this share is higher than in the United States, and the European Union. The paved road network is more than 50% of the total road network in Algeria, Azerbaijan, Bahrain, Brunei, Comoros Islands, Djibouti, Egypt, Indonesia, Iran, Iraq, Jordan, Kazakhstan, Kuwait, Kyrgyz Republic, Lebanon, Lebanon, Libya, Morocco, Oman, Pakistan, Palestine, Qatar, Syria, Tajikistan, Tunisia, Turkey, United Arab Emirates, and Uzbekistan. The countries where the unpaved road networks are more than 50% of the total road network, with the exception of Afghanistan, Albania, and Bangladesh, all in Africa. Thus, the OIC countries seem to split into two groups; the CIS countries, North African and Middle Eastern countries form one group where the road network is mostly paved, and the African countries form the second group where the road network is mostly unpaved. From a road maintenance point of view this is important because unpaved roads require different and more regular maintenance than paved roads, and delaying maintenance can often mean that the benefits of unpaved roads are completely lost, often requiring expensive rehabilitation later on. On the other hand, the maintenance of paved roads is more expensive than that of unpaved roads.
There is insufficient attention given to rural roads relative to highways and other types of paved roads. In the OIC Member States, the share of motorways and highways in the total road network is almost 12.5% of the total road network, compared to 1% and 6% for the United States and the EU28, respectively. Rural roads are often the responsibility of lower level governments, for example, provincial or municipal governments. These governments are, more often than not, ill-equipped to properly maintain rural road networks, they do not have the resources or the technical expertise to do so. Based on systematic data on the funding that is available for rural road networks, it would not be unreasonable to infer from the data and evidence that the lower level roads (secondary, provincial and rural roads) are not the priority when it comes to allocating resources. Thus, it can be concluded that the condition of rural road networks in OIC Member States leaves a lot to be desired.
Enhancing Road Maintenance In the OIC Member Countries
76
The availability and quality of the data on the condition and use of the road networks in the OIC Member States remains worrisome. Either the data is not available, or when it is available, it is either dated, it is not easily accessible, or it is not complete. Not having this basic data suggests that it would be difficult, if not impossible, for the responsible organisations to empirically support a planning process to undertake regular preventive maintenance activities.
From the limited data and evidence that is collected on maintenance expenditures, there are two inescapable conclusions. First, given the size of the road networks in the OIC Member States, the expenditures on maintenance are much too low. And second, much of the expenditures on maintenance are classified as capital projects. The inadequate resources available for maintenance activities means that the condition of the road networks in many OIC Member States is not good and the value of these road assets will decline over time, unless remedial steps are taken. The classification of rehabilitation and reinforcement projects, usually considered to be periodic maintenance projects, as capital projects, clearly suggests that maintenance needs are not met until such time that they can no longer be deferred. This also indicates a problem with the funding that is available for maintenance, clearly it seems to be easier to get funding for capital projects than it is for maintenance activities.
The organisation of the road sector in many OIC Member States is still not optimal, or in line with what is considered to be desirable in many other countries. For example, all too often, there is no independent road authority that handles the management and operation of road networks, there is no earmarked, or ring fenced funding for the road sector in the form of a road fund, or something similar. Only 20 of the 57 OIC Member States have a road fund. Even the OIC Member States where they have set up a road fund, it is rather unfortunate that the road fund is not performing as intended because of a lack of a sound legal and institutional framework for its existence, or because of the way in which the road fund functioning. The separation of the procurement and funding activities is an essential step in improving the performance of the road sector, and the earmarking or ring fencing of funds is essential for providing adequate resources to the road sector.
As noted in the previous point, maintenance activities are chronically underfunded, in particular the routine and periodic maintenance activities. The maintenance needs of lower level roads (the secondary, provincial and rural roads) are also largely unmet. In many OIC Member States, the network of motorways and highways is relatively new. However, these motorways and highways will require
Many of the organisations and institutions in the road sector are facing difficulty in attracting qualified staff with the needed set of competences. There are two reasons for this. First, these organisations are mostly governmental organisations and the salaries and benefits are similar to those offered to civil servants, the processes for hiring are equally difficult, and the possibilities for career advancement are limited. A second problem is that as the road sectors in these countries have been developing, the government finds itself competing with the private sector for the limited pool of qualified individuals, and more often than not the government is not able to compete with the private sector.
The planning, prioritisation, budgeting, monitoring of road maintenance activities is weak, if not missing in most OIC Member States. As noted earlier, the data that is required to support the planning, prioritisation and budgeting of maintenance activities is either not available, or of poor quality. Thus, it is difficult to do this in any systematic and meaningful manner.
The design standards in use in many of the OIC Member States are not appropriate for the type of vehicles in use today. The road networks are built according to these old design standards which are not capable of dealing with the much higher volumes of traffic and the heavier vehicles in use today. Thus, the pavement deterioration rates are higher than what
Enhancing Road Maintenance In the OIC Member Countries
77
would be the case if the design standards were to reflect the current vehicle mix with heavier, multi-axle vehicles.
Finally, linked to the condition of the road network is the incidence of overloading of heavy motor vehicles, overloading is widespread. The lack of enforcement of the weight regulations is something that contributes to the faster deterioration of the pavement and needs to be corrected.
5.2. Recommendations
Formulating recommendations for a group of countries as diverse as the OIC Member States is a challenge because there is a great deal of variation in terms of the development and maturity of the road networks, and the organisations responsible for managing and operating these networks. Nevertheless, based on the preceding analysis, a set of recommendations are formulated that should be useful regardless of where a country stands in terms of the development of its road network.
The premise underlying the recommendations is that whatever organisation is responsible for managing, operating and financing the development and maintenance of the road networks should focus on its performance, and on improving its performance. The recommendations are designed to help organisations at different stages of development to evaluate and improve their performance. This perspective is deliberately chosen rather than the more traditional recommendations based on carrying out institutional and/or financial reforms. Of course, the recommendations encompass these two important dimensions as well.
The recommendations are formulated as a set of recommendations about supporting systems and procedures that should be followed by all authorities, regardless of the level of development of the road network. The remaining recommendations are formulated as steps in four phases:
Phase 1 – Preparing the organisation for monitoring performance
Use of performance indicators for decision-making - Performance monitoring implies the use of
indicators and data to make decisions. Performance indicators should be defined and used in a
consistent manner over time for making decisions about needs and requirements, investments,
maintenance prioritization, or anything else. The advantage of using performance indicators is that
it immediately increases the transparency, and by default, the accountability of those making these
decisions.
Data collection – Using performance indicators requires data that is relevant, timely, and accurate.
Thus, collecting and making available the relevant data should be basic requirement of organizations
in the road sector. At a minimum, an organization responsible for managing and operating a road
network must have an asset register, a periodic survey to collect information on the condition of its
assets, and collect data on traffic volumes and vehicle mix on the road network (for this information
to be useful it must be sufficiently detailed and accurate to permit forecasting of traffic volumes and
vehicle mix on the road network).
Financial Management Systems – A financial management system should be required to maintain
the accounts of the organization, and more importantly for producing reports linking the use of
financial resources to the performance of the road assets and various activities.
Enhancing Road Maintenance In the OIC Member Countries
78
Road Information System and Asset Management System – An integrated asset management
system, containing all relevant data on the assets (location and other attributes, and condition and
quality) should be used by the agency to maintain an up to date record on the condition of its assets.
This asset management system should be linked to the financial management system so as to permit
an analysis of the efficiency and effectiveness of various activities.
Project Management System – A project management system that is capable of managing and
monitoring projects is essential to the efficient performance of a highway agency. This project
management system needs to be able to monitor progress on projects on a daily basis, manage
project risks, and resource use on the project.
Risk Management Framework – As the problems associated with natural phenomenon such as
unusually heavy rainfall, extreme temperatures, flash floods seem to increasingly common,
organisations need to develop a risk framework that incorporates the risks associated with these
phenomenon and their potential consequences and incorporate these into their planning and
budgeting.
Phase 1 – Preparing the organization for monitoring performance
This phase is intended to prepare an organization for performance based management of road
networks. Thus, this phase is intended to:
Identify the shortcoming and needs with respect to the systems and procedures noted above
Collect needed information
Make changes to the institutional setting, including the legal and regulatory frameworks
Make necessary internal reforms in the organisation
In terms of the institutional setting, the following is required:
An autonomously functioning organisation that is authorised to take all decisions that it needs to take to ensure a well-functioning road network. In other words the organisation must be independent of political and other interference.
A clear and comprehensive mandate for the organisation that is responsible for managing and operating the road network. This mandate needs to extend beyond, for example, just the construction and maintenance of highways. It needs to included, for example, the authority for enforcing weight limits on the roads, for raising finances to finance various activities, etc.
The various functions of the organisation such as tolling, maintenance, planning, programming and budgeting should be separated as much as possible. For example, procurement, execution, and financing should not be in the hands of the same agency.
The funding of the organisation should be explicitly linked to targets specified in something like a Service Level Agreement (SLA) that elaborates what the organisation is expected to do with the resources allocated to it.
Enhancing Road Maintenance In the OIC Member Countries
79
In terms of the internal reforms at the organisation the following is needed:
Establishing of guidelines for identifying and assessing maintenance needs and prioritising them in such a way that the activities to meet the identified needs are clearly linked to the performance goals and targets of the organisation.
Internal separation of functions in such a way that the monitoring is separate from the actual activities themselves. Regular internal audits of performance should also be undertaken.
Phase 2 – Monitoring and improving performance
In this phase, there are three priorities, namely ensuring:
Human resources issues
Involvement of stakeholders and road users, and
Financial security for the organisation
In terms of the HR issues, the following need to be addressed:
The availability of properly qualified staff is becoming increasingly important at organisations responsible for managing and operating road networks. For example, historically such organisations have been dominated by engineers. Now, however, in addition to engineers, these organisations also need procurement specialists, project managers, data base specialists, data collection specialists, and numerous other skills.
Attracting and retaining this talent requires that organisations pay attention to the criteria used for employing staff (the criteria are still heavily weighted in favour engineering skills and competences), the career advancement possibilities for non-engineering staff, and the salary structure for these positions (many of these people are eminently employable in the private sector).
There are two aspects to the stakeholder involvement:
The first concerns the contractors who execute the works that are let by the organisation. The organisation responsible for the management and operation of the road networks requires a competitive, technologically advanced group of contractors that can participate in the kinds of works that are required, using advanced contract types (for example, performance based, multi-year maintenance contracts). If the contractors are not capable of doing this, the overall performance of the road sector will remain limited. Thus, improving the capabilities of the road sector, and a programme for engaging the road sector contractors is an important part of improving the overall performance of the sector.
The second aspect is involving the road users in the performance and functioning of the organisation. This involvement is an important way to build support for the organisation and help it in its interactions with the government in getting needed resources.
Finally, previously noted, the available resources for maintenance activities are limited and usually
too little, and the level of available resources also fluctuates from year to year, making it difficult to
engage in any form of serious planning. Thus, it is essential that the level of available resources is
adequate, and the annual variation in available resources is not so large so as to make planning
difficult. To do this three things are proposed:
Ring-fenced or earmarked budgets. What is important is that the revenue streams for the road network should be guaranteed and at a level that is commensurate with the ambitions, objectives, and targets for the road sector. Second, the decision for funding works should be taken by a body that is independent of both political pressures and interference, as well as
Enhancing Road Maintenance In the OIC Member Countries
80
independent of those taking decisions for procurement and execution of these works. Finally, as much as possible, these revenues should come from fees etc., from within the road users (for example, licence fees, a tax on fuels, or something similar).
Adequate funding. The level of funding should be linked to the targets that have been set for the road network in terms of performance.
Including a valuation of the value of all road assets in the books of the organisation. Estimating and setting a value of the road assets under the supervision of the organisation, and putting this on the organisation’s books will make it very clear whether the organisation is maintaining, increasing, or adversely affecting the value of its assets. Making this transparent also makes it possible to demonstrate the value and benefits of preventive maintenance.
Phase 3 – Measuring performance based on outputs
The fundamental difference in this phase from the earlier phases is that now the emphasis is on
realising the performance objectives in terms of the end-result, the outputs. Thus, for example, it is
no longer how many kilometres of the road network have been maintained. In this phase, the focus
would be on, for example, the cumulative delays resulting from maintenance works on the road
network. This focus makes it important to no longer just do the maintenance, but do it in ways that
minimise the interruptions and disturbances resulting from the maintenance works.
Enhancing Road Maintenance In the OIC Member Countries
84
APPENDIX: STATISTICAL OVERVIEW OF INDIVIDUAL COUNTRIES AFGHANISTAN latest data (2000-2013)
Year 2013
Population 30,551'674
GNI per capita ($) 690
Surface (Km2) 652'860
Year 2010
Motorways (Km)
Highways, main or national roads (Km) 16'388
Secondary or regional roads (Km)
Other roads (Km) 6'745
Total length of roads (Km) 23,133
Paved roads (%) 36
Paved roads (Km) 8,419
Non-paved roads (Km) 14,714
Length of roads by GDP per capita (Km/$)
41
Density of roads (Km/Km2) 0.04
Year 2010
Traffic volume (Mio Veh-Km) 296
Year 2013
Inland freight transport (Mio T-Km)
Inland passenger transport (Mio P-Km)
Road freight transport (Mio T-Km) 7,255
Road passenger transport (Mio P-Km)
Year 2013
Persons Killed / 100,000 population
Persons Injured /100,000 population 10
Injury accidents /100,000 population
Injury accidents / 100 Million Veh-Km
Year 2010
Government expenditures (Mio USD)
Central
Regional/Local
Private sector expenditures (Mio USD)
Total expenditures (Mio USD) 276.01
Investment expenditures (Mio USD) 275.08
Maintenance expenditures (Mio USD)
Other expenditures (Mio USD) 0.21
Year
Road Revenues (Mio USD)
Indirect: Fuel Tax
Direct: Toll
Others
Total revenues (Mio USD)
Authority in charge of Road Management National Road Authority
Management structure of Road Network
Motorways
Highways, main or national roads
Secondary or regional roads
Other roads
Sources: IRF World Road Statistics 2015; Road Revenues - Questionnaire WRS; Economic and demographic information WDI - World Bank.
Enhancing Road Maintenance In the OIC Member Countries
85
ALBANIA latest data (2000-2013)
Year 2013
Population 2,773,620
GNI per capita ($) 4,710
Surface (Km2) 28,750
Year 2002
Motorways (Km) 0
Highways, main or national roads (Km) 3,220
Secondary or regional roads (Km) 4,300
Other roads (Km) 10,480
Total length of roads (Km) 18,000
Paved roads (%) 39
Paved roads (Km) 7,020
Non-paved roads (Km) 10,980
Length of roads by GDP per capita (Km/$) 12
Density of roads (Km/Km2) 0.63
Year
Traffic volume (Mio Veh-Km)
Year
Inland freight transport (Mio T-Km)
Inland passenger transport (Mio P-Km)
Road freight transport (Mio T-Km)
Road passenger transport (Mio P-Km)
Year 2013
Persons Killed / 100,000 population 11
Persons Injured /100,000 population 90
Injury accidents /100,000 population 75
Injury accidents / 100 Million Veh-Km
Year 2013
Government expenditures (Mio USD)
Central
Regional/Local
Private sector expenditures (Mio USD)
Total expenditures (Mio USD)* 334.59
Investment expenditures (Mio USD)* 322.54
Maintenance expenditures (Mio USD)* 12.05
Other expenditures (Mio USD)
Year
Road Revenues (Mio USD)
Indirect: Fuel Tax
Direct: Toll
Others
Total revenues (Mio USD)
Authority in charge of Road Management Albanian Road Authority - Maintained by Ndërmarrja Shtetërore Rruga-Ura
Management structure of Road Network
Motorways Albanian Road Authority
Highways, main or national roads Albanian Road Authority
Secondary or regional roads Albanian Road Authority
Other roads Albanian Road Authority Sources: IRF World Road Statistics 2015; Road Revenues - Questionnaire WRS; Economic and demographic information WDI - World Bank. * Urban roads are not included.
Enhancing Road Maintenance In the OIC Member Countries
86
ALGERIA latest data (2000-2013)
Year 2013
Population 39,208,194
GNI per capita ($) 5,330
Surface (Km2) 2,381,740
Year 2010
Motorways (Km)
Highways, main or national roads (Km) 29,468
Secondary or regional roads (Km) 24,108
Other roads (Km) 60,079
Total length of roads (Km) 113,655
Paved roads (%) 77
Paved roads (Km) 87,607
Non-paved roads (Km) 26,048
Length of roads by GDP per capita (Km/$)
26
Density of roads (Km/Km2) 0.05
Year
Traffic volume (Mio Veh-Km)
Year 2011
Inland freight transport (Mio T-Km) 3,070
Inland passenger transport (Mio P-Km)
Road freight transport (Mio T-Km) 1,822
Road passenger transport (Mio P-Km)
Year 2013
Persons Killed / 100,000 population 12
Persons Injured /100,000 population 169
Injury accidents /100,000 population 110
Injury accidents / 100 Million Veh-Km
Year
Government expenditures (Mio USD)
Central
Regional/Local
Private sector expenditures (Mio USD)
Total expenditures (Mio USD)
Investment expenditures (Mio USD)
Maintenance expenditures (Mio USD)
Other expenditures (Mio USD)
Year
Road Revenues (Mio USD)
Indirect: Fuel Tax
Direct: Toll
Others
Total revenues (Mio USD)
Authority in charge of Road Management Ministère des Travaux Publics, Direction de l’Exploitation et de l’Entretien Routiers (DEER)
Management structure of Road Network
Motorways
Highways, main or national roads Direction de l'Exploitation et de l'Entretien Routiers (DEER)
Secondary or regional roads
Other roads Sources: IRF World Road Statistics 2015; Road Revenues - Questionnaire WRS; Economic and demographic information WDI - World Bank.
Enhancing Road Maintenance In the OIC Member Countries
87
AZERBAIJAN latest data (2000-2013)
Year 2013
Population 9,416,598
GNI per capita ($) 7,350
Surface (Km2) 86,600
Year 2013
Motorways (Km)
Highways, main or national roads (Km) 4,645
Secondary or regional roads (Km) 14,357
Other roads (Km)
Total length of roads (Km) 19,002
Paved roads (%) 99
Paved roads (Km) 18,841
Non-paved roads (Km) 161
Length of roads by GDP per capita (Km/$)
2.4
Density of roads (Km/Km2) 0.22
Year 2013
Traffic volume (Mio Veh-Km) 21,587
Year 2013
Inland freight transport (Mio T-Km) 26,710
Inland passenger transport (Mio P-Km) 22,337
Road freight transport (Mio T-Km) 14,120
Road passenger transport (Mio P-Km) 21,880
Year 2013
Persons Killed / 100,000 population 12
Persons Injured /100,000 population 31
Injury accidents /100,000 population 30
Injury accidents / 100 Million Veh-Km 13
Year 2011
Government expenditures (Mio USD)
Central 2250.46
Regional/Local
Private sector expenditures (Mio USD) 134.65
Total expenditures (Mio USD) 2385.11
Investment expenditures (Mio USD) 2181.80
Maintenance expenditures (Mio USD) 203.30
Other expenditures (Mio USD)
Year
Total revenues (Mio USD)
Authority in charge of Road Management
Ministry of Transportation - Road Transport Service (Yolnəqliyyatservis)
Management structure of Road Network
Motorways
Highways, main or national roads Ministry of Transportation - Road Transport Service (Yolnəqliyyatservis)
Secondary or regional roads Ministry of Transportation - Road Transport Service (Yolnəqliyyatservis)
Other roads Ministry of Transportation - Road Transport Service (Yolnəqliyyatservis)
Sources: IRF World Road Statistics 2015; Road Revenues - Questionnaire WRS; Economic and demographic information WDI - World Bank.
Enhancing Road Maintenance In the OIC Member Countries
88
BAHRAIN latest data (2000-2013)
Year 2013
Population 1,332,171
GNI per capita ($)
Surface (Km2) 760
Year 2013
Motorways (Km)
Highways, main or national roads (Km) 563
Secondary or regional roads (Km) 656
Other roads (Km) 3,055
Total length of roads (Km) 4,274
Paved roads (%) 83
Paved roads (Km) 3,544
Non-paved roads (Km) 730
Length of roads by GDP per capita (Km/$) 0.2
Density of roads (Km/Km2) 5.62
Year 2002
Traffic volume (Mio Veh-Km) 5,345
Year
Inland freight transport (Mio T-Km)
Inland passenger transport (Mio P-Km)
Road freight transport (Mio T-Km)
Road passenger transport (Mio P-Km)
Year 2013
Persons Killed / 100,000 population 6
Persons Injured /100,000 population 190
Injury accidents /100,000 population 122
Injury accidents / 100 Million Veh-Km
Year 2003
Government expenditures (Mio USD)
Central 79.31
Regional/Local
Private sector expenditures (Mio USD)
Total expenditures (Mio USD) 79.31
Investment expenditures (Mio USD) 62.53
Maintenance expenditures (Mio USD) 10.60
Other expenditures (Mio USD) 6.19
Year
Road Revenues (Mio USD)
Indirect: Fuel Tax
Direct: Toll
Others
Total revenues (Mio USD)
Authority in charge of Road Management Ministry of Works
Management structure of Road Network
Motorways
Highways, main or national roads
Secondary or regional roads
Other roads
Sources: IRF World Road Statistics 2015; Road Revenues - Questionnaire WRS; Economic and demographic information WDI - World Bank.
Enhancing Road Maintenance In the OIC Member Countries
89
BANGLADESH latest data (2000-2013)
Year 2013
Population 156,594,962
GNI per capita ($) 1,010
Surface (Km2) 148,460
Year 2003
Motorways (Km) 0
Highways, main or national roads (Km) 22,378
Secondary or regional roads (Km) 81,670
Other roads (Km) 135,178
Total length of roads (Km) 239,226
Paved roads (%) 10
Paved roads (Km) 22,726
Non-paved roads (Km) 216,500
Length of roads by GDP per capita (Km/$)
250
Density of roads (Km/Km2) 1.66
Year
Traffic volume (Mio Veh-Km)
Year
Inland freight transport (Mio T-Km)
Inland passenger transport (Mio P-Km)
Road freight transport (Mio T-Km)
Road passenger transport (Mio P-Km)
Year 2012
Persons Killed / 100,000 population 1
Persons Injured /100,000 population 1
Injury accidents /100,000 population 1
Injury accidents / 100 Million Veh-Km
Year
Government expenditures (Mio USD)
Central
Regional/Local
Private sector expenditures (Mio USD)
Total expenditures (Mio USD)
Investment expenditures (Mio USD)
Maintenance expenditures (Mio USD)
Other expenditures (Mio USD)
Year
Road Revenues (Mio USD)
Indirect: Fuel Tax
Direct: Toll
Others
Total revenues (Mio USD)
Authority in charge of Road Management
Roads and Highways Department - Ministry of Road Transport and Bridges
Management structure of Road Network
Motorways
Highways, main or national roads
Secondary or regional roads
Other roads
Sources: IRF World Road Statistics 2015; Road Revenues - Questionnaire WRS; Economic and demographic information WDI - World Bank.
Enhancing Road Maintenance In the OIC Member Countries
90
BENIN latest data (2000-2013)
Year 2013
Population 10,323,474
GNI per capita ($) 790
Surface (Km2) 114,760
Year 2004
Motorways (Km)
Highways, main or national roads (Km)
Secondary or regional roads (Km)
Other roads (Km)
Total length of roads (Km) 19,000
Paved roads (%) 10
Paved roads (Km) 1,805
Non-paved roads (Km) 17,195
Length of roads by GDP per capita (Km/$) 37
Density of roads (Km/Km2) 0.17
Year
Traffic volume (Mio Veh-Km)
Year
Inland freight transport (Mio T-Km)
Inland passenger transport (Mio P-Km)
Road freight transport (Mio T-Km)
Road passenger transport (Mio P-Km)
Year 2009
Persons Killed / 100,000 population 8
Persons Injured /100,000 population 46
Injury accidents /100,000 population
Injury accidents / 100 Million Veh-Km
Year 2009
Government expenditures (Mio USD)
Central 16.95
Regional/Local
Private sector expenditures (Mio USD)
Total expenditures (Mio USD)
Investment expenditures (Mio USD)
Maintenance expenditures (Mio USD)
Other expenditures (Mio USD)
Year
Road Revenues (Mio USD)
Indirect: Fuel Tax
Direct: Toll
Others
Total revenues (Mio USD)
Authority in charge of Road Management Ministère des Travaux Public et des Transports (MTPT)
Management structure of Road Network
Motorways
Highways, main or national roads Direction de l'Entretien Routier (DER)
Secondary or regional roads
Other roads
Sources: IRF World Road Statistics 2015; Road Revenues - Questionnaire WRS; Economic and demographic information WDI - World Bank.
Enhancing Road Maintenance In the OIC Member Countries
91
BRUNEI-DARUSSALAM latest data (2000-2013)
Year 2013
Population 417,784
GNI per capita ($)
Surface (Km2) 5,770
Year 2013
Motorways (Km)
Highways, main or national roads (Km)
Secondary or regional roads (Km)
Other roads (Km)
Total length of roads (Km) 3,167
Paved roads (%) 89
Paved roads (Km) 2,831
Non-paved roads (Km) 336
Length of roads by GDP per capita (Km/$) 0.1
Density of roads (Km/Km2) 0.55
Year
Traffic volume (Mio Veh-Km)
Year
Inland freight transport (Mio T-Km)
Inland passenger transport (Mio P-Km)
Road freight transport (Mio T-Km)
Road passenger transport (Mio P-Km)
Year 2013
Persons Killed / 100,000 population 8
Persons Injured /100,000 population 122
Injury accidents /100,000 population
Injury accidents / 100 Million Veh-Km
Year
Government expenditures (Mio USD)
Central
Regional/Local
Private sector expenditures (Mio USD)
Total expenditures (Mio USD)
Investment expenditures (Mio USD)
Maintenance expenditures (Mio USD)
Other expenditures (Mio USD)
Year
Total revenues (Mio USD)
Authority in charge of Road Management Department of Roads of Public Works Department (PWD) - Ministry of Development
Management structure of Road Network
Motorways
Highways, main or national roads Public Works Department (PWD) - Ministry of Development
Secondary or regional roads Public Works Department (PWD) - Ministry of Development
Other roads Public Works Department (PWD) - Ministry of Development
Sources: IRF World Road Statistics 2015; Road Revenues - Questionnaire WRS; Economic and demographic information WDI - World Bank.
Enhancing Road Maintenance In the OIC Member Countries
92
BURKINA FASO latest data (2000-2013)
Year 2013
Population 16,934,839
GNI per capita ($) 670
Surface (Km2) 274,220
Year 2013
Motorways (Km)
Highways, main or national roads (Km)
Secondary or regional roads (Km)
Other roads (Km)
Total length of roads (Km) 15,304
Paved roads (%) 24
Paved roads (Km) 3,642
Non-paved roads (Km) 11,662
Length of roads by GDP per capita (Km/$) 22
Density of roads (Km/Km2) 0.06
Year
Traffic volume (Mio Veh-Km)
Year
Inland freight transport (Mio T-Km)
Inland passenger transport (Mio P-Km)
Road freight transport (Mio T-Km)
Road passenger transport (Mio P-Km)
Year 2011
Persons Killed / 100,000 population 1
Persons Injured /100,000 population 31
Injury accidents /100,000 population
Injury accidents / 100 Million Veh-Km
Year 2009
Government expenditures (Mio USD)
Central
Regional/Local
Private sector expenditures (Mio USD)
Total expenditures (Mio USD) 206.44
Investment expenditures (Mio USD) 129.57
Maintenance expenditures (Mio USD) 76.87
Other expenditures (Mio USD)
Year
Road Revenues (Mio USD)
Indirect: Fuel Tax
Direct: Toll
Others
Total revenues (Mio USD)
Authority in charge of Road Management
Management structure of Road Network
Motorways
Highways, main or national roads
Secondary or regional roads
Other roads
Sources: IRF World Road Statistics 2015; Road Revenues - Questionnaire WRS; Economic and demographic information WDI - World Bank.
Enhancing Road Maintenance In the OIC Member Countries
93
CAMEROON latest data (2000-2013)
Year 2013
Population 22,253,959
GNI per capita ($) 1,290
Surface (Km2) 475,440
Year 2010
Motorways (Km)
Highways, main or national roads (Km)
Secondary or regional roads (Km)
Other roads (Km)
Total length of roads (Km) 49,751
Paved roads (%) 10
Paved roads (Km) 5,011
Non-paved roads (Km) 44,740
Length of roads by GDP per capita (Km/$) 43
Density of roads (Km/Km2) 0.10
Year
Traffic volume (Mio Veh-Km)
Year
Inland freight transport (Mio T-Km)
Inland passenger transport (Mio P-Km)
Road freight transport (Mio T-Km)
Road passenger transport (Mio P-Km)
Year 2013
Persons Killed / 100,000 population 5
Persons Injured /100,000 population 19
Injury accidents /100,000 population 9
Injury accidents / 100 Million Veh-Km
Year 2007
Government expenditures (Mio USD)
Central 527.39
Regional/Local
Private sector expenditures (Mio USD)
Total expenditures (Mio USD) 527.39
Investment expenditures (Mio USD) 229.75
Maintenance expenditures (Mio USD) 293.38
Other expenditures (Mio USD) 4.26
Year
Road Revenues (Mio USD)
Indirect: Fuel Tax
Direct: Toll
Others
Total revenues (Mio USD)
Authority in charge of Road Management
Management structure of Road Network
Motorways
Highways, main or national roads Ministry of Public Works
Secondary or regional roads Ministry of Public Works
Other roads Ministry of Public Works
Sources: IRF World Road Statistics 2015; Road Revenues - Questionnaire WRS; Economic and demographic information WDI - World Bank. web source: http://www.mintp.cm/fr/le-ministere/les-missions
Enhancing Road Maintenance In the OIC Member Countries
94
CHAD latest data (2000-2013)
Year 2013
Population 12,825,314
GNI per capita ($) 1,030
Surface (Km2) 1,284,000
Year 2006
Motorways (Km)
Highways, main or national roads (Km)
Secondary or regional roads (Km)
Other roads (Km)
Total length of roads (Km) 40,000
Paved roads (%)* 1
Paved roads (Km)* 334
Non-paved roads (Km)* 33,066
Length of roads by GDP per capita (Km/$) 56
Density of roads (Km/Km2) 0.03
Year
Traffic volume (Mio Veh-Km)
Year 2013
Inland freight transport (Mio T-Km)
Inland passenger transport (Mio P-Km)
Road freight transport (Mio T-Km)
Road passenger transport (Mio P-Km)
Year 2007
Persons Killed / 100,000 population 8
Persons Injured /100,000 population 42
Injury accidents /100,000 population
Injury accidents / 100 Million Veh-Km
Year
Government expenditures (Mio USD)
Central
Regional/Local
Private sector expenditures (Mio USD)
Total expenditures (Mio USD)
Investment expenditures (Mio USD)
Maintenance expenditures (Mio USD)
Other expenditures (Mio USD)
Year
Road Revenues (Mio USD)
Indirect: Fuel Tax
Direct: Toll
Others
Total revenues (Mio USD)
Authority in charge of Road Management
Management structure of Road Network
Motorways
Highways, main or national roads Ministère des Infrastructures, du Desenclavement et des Transports
Secondary or regional roads
Other roads Sources: IRF World Road Statistics 2015; Road Revenues - Questionnaire WRS; Economic and demographic information WDI - World Bank. web source: http://www.mcie-tchad.com/ministere/attributions-du-ministere.html * Latest % of paved road information (2000), total road network 33,400 Km.
Enhancing Road Maintenance In the OIC Member Countries
95
COMOROS latest data (2000-2013)
Year 2013
Population 734,917
GNI per capita ($) 840
Surface (Km2) 1,861
Year 2000
Motorways (Km)
Highways, main or national roads (Km)
Secondary or regional roads (Km)
Other roads (Km)
Total length of roads (Km) 880
Paved roads (%) 77
Paved roads (Km) 673
Non-paved roads (Km) 207
Length of roads by GDP per capita (Km/$) 2.3
Density of roads (Km/Km2) 0.47
Year
Traffic volume (Mio Veh-Km)
Year
Inland freight transport (Mio T-Km)
Inland passenger transport (Mio P-Km)
Road freight transport (Mio T-Km)
Road passenger transport (Mio P-Km)
Year 2007
Persons Killed / 100,000 population 2
Persons Injured /100,000 population 19
Injury accidents /100,000 population
Injury accidents / 100 Million Veh-Km
Year
Government expenditures (Mio USD)
Central
Regional/Local
Private sector expenditures (Mio USD)
Total expenditures (Mio USD)
Investment expenditures (Mio USD)
Maintenance expenditures (Mio USD)
Other expenditures (Mio USD)
Year
Road Revenues (Mio USD)
Indirect: Fuel Tax
Direct: Toll
Others
Total revenues (Mio USD)
Authority in charge of Road Management
Management structure of Road Network
Motorways
Highways, main or national roads
Secondary or regional roads
Other roads Sources: IRF World Road Statistics 2015; Road Revenues - Questionnaire WRS; Economic and demographic information WDI - World Bank.
Enhancing Road Maintenance In the OIC Member Countries
96
COTE D,IVOIRE latest data (2000-2013)
Year 2013
Population 20,316,086
GNI per capita ($) 1,450
Surface (Km2) 322,460
Year 2007
Motorways (Km) 142
Highways, main or national roads (Km) 7,000
Secondary or regional roads (Km) 8,240
Other roads (Km) 66,614
Total length of roads (Km) 81,996
Paved roads (%) 8
Paved roads (Km) 6,502
Non-paved roads (Km) 75,494
Length of roads by GDP per capita (Km/$) 72
Density of roads (Km/Km2) 0.25
Year
Traffic volume (Mio Veh-Km)
Year
Inland freight transport (Mio T-Km)
Inland passenger transport (Mio P-Km)
Road freight transport (Mio T-Km)
Road passenger transport (Mio P-Km)
Year 2008
Persons Killed / 100,000 population 4
Persons Injured /100,000 population 92
Injury accidents /100,000 population
Injury accidents / 100 Million Veh-Km
Year
Government expenditures (Mio USD)
Central
Regional/Local
Private sector expenditures (Mio USD)
Total expenditures (Mio USD)
Investment expenditures (Mio USD)
Maintenance expenditures (Mio USD)
Other expenditures (Mio USD)
Year
Road Revenues (Mio USD)
Indirect: Fuel Tax
Direct: Toll
Others
Total revenues (Mio USD)
Authority in charge of Road Management
Management structure of Road Network
Motorways
Highways, main or national roads Ministère des Infrastructures Economiques
Secondary or regional roads
Other roads Sources: IRF World Road Statistics 2015; Road Revenues - Questionnaire WRS; Economic and demographic information WDI - World Bank. web source: http://www.infrastructures.gouv.ci/principal.php?page=4
Enhancing Road Maintenance In the OIC Member Countries
97
DJIBOUTI latest data (2000-2013)
Year 2013
Population 872,932
GNI per capita ($)
Surface (Km2) 23,200
Year 2000
Motorways (Km)
Highways, main or national roads (Km)
Secondary or regional roads (Km)
Other roads (Km)
Total length of roads (Km) 3,065
Paved roads (%) 45
Paved roads (Km) 1,379
Non-paved roads (Km) 1,686
Length of roads by GDP per capita (Km/$) 4
Density of roads (Km/Km2) 0.13
Year
Traffic volume (Mio Veh-Km)
Year
Inland freight transport (Mio T-Km)
Inland passenger transport (Mio P-Km)
Road freight transport (Mio T-Km)
Road passenger transport (Mio P-Km)
Year
Persons Killed / 100,000 population
Persons Injured /100,000 population
Injury accidents /100,000 population
Injury accidents / 100 Million Veh-Km
Year
Government expenditures (Mio USD)
Central
Regional/Local
Private sector expenditures (Mio USD)
Total expenditures (Mio USD)
Investment expenditures (Mio USD)
Maintenance expenditures (Mio USD)
Other expenditures (Mio USD)
Year
Road Revenues (Mio USD)
Indirect: Fuel Tax
Direct: Toll
Others
Total revenues (Mio USD)
Authority in charge of Road Management
Management structure of Road Network
Motorways
Highways, main or national roads
Secondary or regional roads
Other roads Sources: IRF World Road Statistics 2015; Road Revenues - Questionnaire WRS; Economic and demographic information WDI - World Bank.
Enhancing Road Maintenance In the OIC Member Countries
98
EGYPT latest data (2000-2013)
Year 2013
Population 82,056,378
GNI per capita ($) 3,140
Surface (Km2) 1,001,450
Year 2010
Motorways (Km) 836
Highways, main or national roads (Km) 23,143
Secondary or regional roads (Km) 113,451
Other roads (Km)
Total length of roads (Km) 137,430
Paved roads (%) 92
Paved roads (Km) 126,724
Non-paved roads (Km) 10,706
Length of roads by GDP per capita (Km/$) 49
Density of roads (Km/Km2) 0.14
Year
Traffic volume (Mio Veh-Km)
Year
Inland freight transport (Mio T-Km)
Inland passenger transport (Mio P-Km)
Road freight transport (Mio T-Km)
Road passenger transport (Mio P-Km)
Year 2013
Persons Killed / 100,000 population 8
Persons Injured /100,000 population 27
Injury accidents /100,000 population 19
Injury accidents / 100 Million Veh-Km
Year 2010
Government expenditures (Mio USD)
Central
Regional/Local
Private sector expenditures (Mio USD)
Total expenditures (Mio USD) 528.97
Investment expenditures (Mio USD) 342.50
Maintenance expenditures (Mio USD) 186.44
Other expenditures (Mio USD) 0.02
Year 2010
Road Revenues (Mio USD)
Indirect: Fuel Tax 1.23
Direct: Toll 60.12
Others 89.82
Total revenues (Mio USD) 151.17
Authority in charge of Road Management
Management structure of Road Network
Motorways
Highways, main or national roads
Secondary or regional roads
Other roads Sources: IRF World Road Statistics 2015; Road Revenues - Questionnaire WRS; Economic and demographic information WDI - World Bank.
Enhancing Road Maintenance In the OIC Member Countries
99
GABON latest data (2000-2013)
Year 2013
Population 1,671,711
GNI per capita ($) 10,650
Surface (Km2) 267,670
Year 2007
Motorways (Km)
Highways, main or national roads (Km)
Secondary or regional roads (Km)
Other roads (Km)
Total length of roads (Km) 9,170
Paved roads (%) 12
Paved roads (Km) 1,098
Non-paved roads (Km) 8,072
Length of roads by GDP per capita (Km/$) 1.1
Density of roads (Km/Km2) 0.03
Year
Traffic volume (Mio Veh-Km)
Year
Inland freight transport (Mio T-Km)
Inland passenger transport (Mio P-Km)
Road freight transport (Mio T-Km)
Road passenger transport (Mio P-Km)
Year 2010
Persons Killed / 100,000 population 16
Persons Injured /100,000 population 36
Injury accidents /100,000 population
Injury accidents / 100 Million Veh-Km
Year
Government expenditures (Mio USD)
Central
Regional/Local
Private sector expenditures (Mio USD)
Total expenditures (Mio USD)
Investment expenditures (Mio USD)
Maintenance expenditures (Mio USD)
Other expenditures (Mio USD)
Year
Road Revenues (Mio USD)
Indirect: Fuel Tax
Direct: Toll
Others
Total revenues (Mio USD)
Authority in charge of Road Management
Management structure of Road Network
Motorways
Highways, main or national roads
Secondary or regional roads
Other roads Sources: IRF World Road Statistics 2015; Road Revenues - Questionnaire WRS; Economic and demographic information WDI - World Bank.
Enhancing Road Maintenance In the OIC Member Countries
100
GAMBIA latest data (2000-2013)
Year 2013
Population 1,849,285
GNI per capita ($) 500
Surface (Km2) 11,300
Year 2004
Motorways (Km) 0
Highways, main or national roads (Km) 1,652
Secondary or regional roads (Km) 1,300
Other roads (Km) 790
Total length of roads (Km) 3,742
Paved roads (%) 19
Paved roads (Km) 723
Non-paved roads (Km) 3,019
Length of roads by GDP per capita (Km/$) 9
Density of roads (Km/Km2) 0.33
Year 2003
Traffic volume (Mio Veh-Km) 74
Year 2003
Inland freight transport (Mio T-Km)
Inland passenger transport (Mio P-Km) 16.1
Road freight transport (Mio T-Km)
Road passenger transport (Mio P-Km) 16.1
Year 2007
Persons Killed / 100,000 population 4
Persons Injured /100,000 population 6
Injury accidents /100,000 population
Injury accidents / 100 Million Veh-Km
Year 2003
Government expenditures (Mio USD)
Central 19.03
Regional/Local
Private sector expenditures (Mio USD)
Total expenditures (Mio USD) 19.03
Investment expenditures (Mio USD) 18.90
Maintenance expenditures (Mio USD) 0.13
Other expenditures (Mio USD)
Year
Road Revenues (Mio USD)
Indirect: Fuel Tax
Direct: Toll
Others
Total revenues (Mio USD)
Authority in charge of Road Management National Road Authority NRA
Management structure of Road Network
Motorways
Highways, main or national roads National Road Authority NRA
Secondary or regional roads National Road Authority NRA
Other roads National Road Authority NRA Sources: IRF World Road Statistics 2015; Road Revenues - Questionnaire WRS; Economic and demographic information WDI - World Bank. web source: http://www.motwi.gov.gm/national-road-authority
Enhancing Road Maintenance In the OIC Member Countries
101
GUINEA latest data (2000-2013)
Year 2013
Population 11,745,189
GNI per capita ($) 460
Surface (Km2) 245,860
Year 2012
Motorways (Km)
Highways, main or national roads (Km) 7,625
Secondary or regional roads (Km) 15,525
Other roads (Km) 20,373
Total length of roads (Km) 43,348
Paved roads (%)* 10
Paved roads (Km)* 4,342
Non-paved roads (Km)* 40,006
Length of roads by GDP per capita (Km/$) 88
Density of roads (Km/Km2) 0.18
Year
Traffic volume (Mio Veh-Km)
Year
Inland freight transport (Mio T-Km)
Inland passenger transport (Mio P-Km)
Road freight transport (Mio T-Km)
Road passenger transport (Mio P-Km)
Year 2011
Persons Killed / 100,000 population 1
Persons Injured /100,000 population
Injury accidents /100,000 population
Injury accidents / 100 Million Veh-Km
Year 2009
Government expenditures (Mio USD)
Central 10.30
Regional/Local
Private sector expenditures (Mio USD)
Total expenditures (Mio USD)
Investment expenditures (Mio USD)
Maintenance expenditures (Mio USD)
Other expenditures (Mio USD)
Year
Road Revenues (Mio USD)
Indirect: Fuel Tax
Direct: Toll
Others
Total revenues (Mio USD)
Authority in charge of Road Management
Management structure of Road Network
Motorways
Highways, main or national roads
Secondary or regional roads
Other roads Sources: IRF World Road Statistics 2015; Road Revenues - Questionnaire WRS; Economic and demographic information WDI - World Bank. * Latest % of paved road information (2003), total network 44,348 Km.
Enhancing Road Maintenance In the OIC Member Countries
102
GUINEA-BISSAU latest data (2000-2013)
Year 2013
Population 1,704,255
GNI per capita ($) 590
Surface (Km2) 36,130
Year 2002
Motorways (Km)
Highways, main or national roads (Km)
Secondary or regional roads (Km)
Other roads (Km)
Total length of roads (Km) 3,455
Paved roads (%) 28
Paved roads (Km) 965
Non-paved roads (Km) 2,490
Length of roads by GDP per capita (Km/$) 11
Density of roads (Km/Km2) 0.10
Year 2013
Traffic volume (Mio Veh-Km) 4,148
Year
Inland freight transport (Mio T-Km)
Inland passenger transport (Mio P-Km)
Road freight transport (Mio T-Km)
Road passenger transport (Mio P-Km)
Year 2013
Persons Killed / 100,000 population 6
Persons Injured /100,000 population
Injury accidents /100,000 population
Injury accidents / 100 Million Veh-Km
Year
Government expenditures (Mio USD)
Central
Regional/Local
Private sector expenditures (Mio USD)
Total expenditures (Mio USD)
Investment expenditures (Mio USD)
Maintenance expenditures (Mio USD)
Other expenditures (Mio USD)
Year
Road Revenues (Mio USD)
Indirect: Fuel Tax
Direct: Toll
Others
Total revenues (Mio USD)
Authority in charge of Road Management
Management structure of Road Network
Motorways
Highways, main or national roads
Secondary or regional roads
Other roads Sources: IRF World Road Statistics 2015; Road Revenues - Questionnaire WRS; Economic and demographic information WDI - World Bank.
Enhancing Road Maintenance In the OIC Member Countries
103
GUYANA latest data (2000-2013)
Year 2013
Population 799,613
GNI per capita ($) 3,750
Surface (Km2) 214,970
Year 2013
Motorways (Km) 0
Highways, main or national roads (Km) 486
Secondary or regional roads (Km) 81
Other roads (Km) 889
Total length of roads (Km) 1,455
Paved roads (%) 39
Paved roads (Km) 566
Non-paved roads (Km) 889
Length of roads by GDP per capita (Km/$)
0.4
Density of roads (Km/Km2) 0.01
Year 2013
Traffic volume (Mio Veh-Km) 51,351
Year
Inland freight transport (Mio T-Km)
Inland passenger transport (Mio P-Km)
Road freight transport (Mio T-Km)
Road passenger transport (Mio P-Km)
Year 2013
Persons Killed / 100,000 population 14
Persons Injured /100,000 population
Injury accidents /100,000 population
Injury accidents / 100 Million Veh-Km
Year 2013
Government expenditures (Mio USD)
Central 39.86
Regional/Local
Private sector expenditures (Mio USD)
Total expenditures (Mio USD) 39.86
Investment expenditures (Mio USD) 35.07
Maintenance expenditures (Mio USD) 4.80
Other expenditures (Mio USD)
Year 2013
Road Revenues (Mio USD)
Indirect: Fuel Tax 45.97
Direct: Toll* 2.24
Others 0.00
Total revenues (Mio USD) 48.21
Authority in charge of Road Management Chief Roads and Bridge Office of the Ministry of Public Infrastructure
Management structure of Road Network
Motorways
Highways, main or national roads
Secondary or regional roads
Other roads
Sources: IRF World Road Statistics 2015; Road Revenues - Questionnaire WRS; Economic and demographic information WDI - World Bank. * PPP Berbice Bridge tolls are not included.
Enhancing Road Maintenance In the OIC Member Countries
104
INDONESIA latest data (2000-2013)
Year 2013
Population 249,865,631
GNI per capita ($) 3,580
Surface (Km2) 1,910,930
Year 2013
Motorways (Km)
Highways, main or national roads (Km) 38,570
Secondary or regional roads (Km) 53,642
Other roads (Km) 415,788
Total length of roads (Km) 508,000
Paved roads (%) 57
Paved roads (Km) 287,926
Non-paved roads (Km) 220,074
Length of roads by GDP per capita (Km/$)
146
Density of roads (Km/Km2) 0.27
Year
Traffic volume (Mio Veh-Km)
Year
Inland freight transport (Mio T-Km)
Inland passenger transport (Mio P-Km)
Road freight transport (Mio T-Km)
Road passenger transport (Mio P-Km)
Year 2013
Persons Killed / 100,000 population 11
Persons Injured /100,000 population 56
Injury accidents /100,000 population 40
Injury accidents / 100 Million Veh-Km
Year
Government expenditures (Mio USD)
Central
Regional/Local
Private sector expenditures (Mio USD)
Total expenditures (Mio USD)
Investment expenditures (Mio USD)
Maintenance expenditures (Mio USD)
Other expenditures (Mio USD)
Year
Road Revenues (Mio USD)
Indirect: Fuel Tax
Direct: Toll
Others
Total revenues (Mio USD)
Authority in charge of Road Management Ministry of Public Works
Management structure of Road Network
Motorways
Highways, main or national roads Ministry of Public Works
Secondary or regional roads Provincial Public Works Offices
Other roads Regency Public Works Offices Sources: IRF World Road Statistics 2015; Road Revenues - Questionnaire WRS; Economic and demographic information WDI - World Bank.
Enhancing Road Maintenance In the OIC Member Countries
105
IRAN latest data (2000-2013)
Year 2013
Population 77,447,168
GNI per capita ($) 5,780
Surface (Km2) 1,745,150
Year 2012
Motorways (Km) 2166
Highways, main or national roads (Km) 34,203
Secondary or regional roads (Km) 44,454
Other roads (Km) 195,775
Total length of roads (Km) 276,597
Paved roads (%) 64
Paved roads (Km) 176,272
Non-paved roads (Km) 100,325
Length of roads by GDP per capita (Km/$) 42
Density of roads (Km/Km2) 0.16
Year
Traffic volume (Mio Veh-Km)
Year
Inland freight transport (Mio T-Km)
Inland passenger transport (Mio P-Km)
Road freight transport (Mio T-Km)
Road passenger transport (Mio P-Km)
Year 2012
Persons Killed / 100,000 population 24
Persons Injured /100,000 population 384
Injury accidents /100,000 population 316
Injury accidents / 100 Million Veh-Km
Year
Government expenditures (Mio USD)
Central
Regional/Local
Private sector expenditures (Mio USD)
Total expenditures (Mio USD)
Investment expenditures (Mio USD)
Maintenance expenditures (Mio USD)
Other expenditures (Mio USD)
Year
Road Revenues (Mio USD)
Indirect: Fuel Tax
Direct: Toll
Others
Total revenues (Mio USD)
Authority in charge of Road Management
Management structure of Road Network
Motorways
Highways, main or national roads
Secondary or regional roads
Other roads Sources: IRF World Road Statistics 2015; Road Revenues - Questionnaire WRS; Economic and demographic information WDI - World Bank.
Enhancing Road Maintenance In the OIC Member Countries
106
IRAQ latest data (2000-2013)
Year 2013
Population 33,417,476
GNI per capita ($) 6,720
Surface (Km2) 435,240
Year 2012
Motorways (Km)
Highways, main or national roads (Km)
Secondary or regional roads (Km)
Other roads (Km)
Total length of roads (Km) 59,623
Paved roads (%)* 86
Paved roads (Km)* 40,764
Non-paved roads (Km)* 6,636
Length of roads by GDP per capita (Km/$) 9
Density of roads (Km/Km2) 0.14
Year
Traffic volume (Mio Veh-Km)
Year
Inland freight transport (Mio T-Km)
Inland passenger transport (Mio P-Km)
Road freight transport (Mio T-Km)
Road passenger transport (Mio P-Km)
Year 2013
Persons Killed / 100,000 population 7
Persons Injured /100,000 population 32
Injury accidents /100,000 population 29
Injury accidents / 100 Million Veh-Km
Year 2009
Government expenditures (Mio USD)
Central 243.70
Regional/Local
Private sector expenditures (Mio USD)
Total expenditures (Mio USD)
Investment expenditures (Mio USD)
Maintenance expenditures (Mio USD)
Other expenditures (Mio USD)
Year
Road Revenues (Mio USD)
Indirect: Fuel Tax
Direct: Toll
Others
Total revenues (Mio USD)
Authority in charge of Road Management
Management structure of Road Network
Motorways
Highways, main or national roads
Secondary or regional roads
Other roads Sources: IRF World Road Statistics 2015; Road Revenues - Questionnaire WRS; Economic and demographic information WDI - World Bank. * Latest % of paved road information (1996), total road network 47,400 Km.
Enhancing Road Maintenance In the OIC Member Countries
107
JORDAN latest data (2000-2013)
Year 2013
Population 6,459,000
GNI per capita ($) 4,950
Surface (Km2) 89,320
Year 2013
Motorways (Km) 0
Highways, main or national roads (Km) 2,754
Secondary or regional roads (Km) 1,894
Other roads (Km) 2,651
Total length of roads (Km) 7,299
Paved roads (%) 100
Paved roads (Km) 7,299
Non-paved roads (Km) 0
Length of roads by GDP per capita (Km/$)
1.4
Density of roads (Km/Km2) 0.08
Year
Traffic volume (Mio Veh-Km)
Year
Inland freight transport (Mio T-Km)
Inland passenger transport (Mio P-Km)
Road freight transport (Mio T-Km)
Road passenger transport (Mio P-Km)
Year 2013
Persons Killed / 100,000 population 12
Persons Injured /100,000 population 247
Injury accidents /100,000 population
Injury accidents / 100 Million Veh-Km
Year
Government expenditures (Mio USD)
Central
Regional/Local
Private sector expenditures (Mio USD)
Total expenditures (Mio USD)
Investment expenditures (Mio USD)
Maintenance expenditures (Mio USD)
Other expenditures (Mio USD)
Year
Road Revenues (Mio USD)
Indirect: Fuel Tax
Direct: Toll
Others
Total revenues (Mio USD)
Authority in charge of Road Management
Management structure of Road Network
Motorways
Highways, main or national roads
Secondary or regional roads
Other roads Sources: IRF World Road Statistics 2015; Road Revenues - Questionnaire WRS; Economic and demographic information WDI - World Bank.
Enhancing Road Maintenance In the OIC Member Countries
108
KAZAKHSTAN latest data (2000-2013)
Year 2013
Population 17,037,508
GNI per capita ($) 11,550
Surface (Km2) 2,724,900
Year 2011
Motorways (Km)
Highways, main or national roads (Km) 23,494
Secondary or regional roads (Km) 73,661
Other roads (Km)
Total length of roads (Km) 97,155
Paved roads (%) 89
Paved roads (Km) 86,217
Non-paved roads (Km) 10,938
Length of roads by GDP per capita (Km/$)
9
Density of roads (Km/Km2) 0.04
Year 2011
Traffic volume (Mio Veh-Km) 706
Year 2011
Inland freight transport (Mio T-Km) 344,779
Inland passenger transport (Mio P-Km) 180,570
Road freight transport (Mio T-Km) 121,074
Road passenger transport (Mio P-Km) 163,996
Year 2011
Persons Killed / 100,000 population 19
Persons Injured /100,000 population 85
Injury accidents /100,000 population 72
Injury accidents / 100 Million Veh-Km 1,693
Year 2011
Government expenditures (Mio USD)
Central
Regional/Local
Private sector expenditures (Mio USD)
Total expenditures (Mio USD)
Investment expenditures (Mio USD) 816.61
Maintenance expenditures (Mio USD)
Other expenditures (Mio USD)
Year 2010
Road Revenues (Mio USD)
Indirect: Fuel Tax 178.05
Direct: Toll
Others
Total revenues (Mio USD)
Authority in charge of Road Management
Management structure of Road Network
Motorways
Highways, main or national roads
Secondary or regional roads
Other roads Sources: IRF World Road Statistics 2015; Road Revenues - Questionnaire WRS; Economic and demographic information WDI - World Bank.
Enhancing Road Maintenance In the OIC Member Countries
109
KUWAIT latest data (2000-2013)
Year 2013
Population 3,368,572
GNI per capita ($)
Surface (Km2) 17,820
Year 2013
Motorways (Km)
Highways, main or national roads (Km)
Secondary or regional roads (Km)
Other roads (Km)
Total length of roads (Km) 7,321
Paved roads (%)* 85
Paved roads (Km)* 4,887
Non-paved roads (Km)* 862
Length of roads by GDP per capita (Km/$) 0.1
Density of roads (Km/Km2) 0.41
Year 2000
Traffic volume (Mio Veh-Km) only pass cars
4,450
Year
Inland freight transport (Mio T-Km)
Inland passenger transport (Mio P-Km)
Road freight transport (Mio T-Km)
Road passenger transport (Mio P-Km)
Year 2013
Persons Killed / 100,000 population 13
Persons Injured /100,000 population 266
Injury accidents /100,000 population
Injury accidents / 100 Million Veh-Km
Year
Government expenditures (Mio USD)
Central
Regional/Local
Private sector expenditures (Mio USD)
Total expenditures (Mio USD)
Investment expenditures (Mio USD)
Maintenance expenditures (Mio USD)
Other expenditures (Mio USD)
Year
Road Revenues (Mio USD)
Indirect: Fuel Tax
Direct: Toll
Others
Total revenues (Mio USD)
Authority in charge of Road Management
Management structure of Road Network
Motorways
Highways, main or national roads
Secondary or regional roads
Other roads Sources: IRF World Road Statistics 2015; Road Revenues - Questionnaire WRS; Economic and demographic information WDI - World Bank. * Latest % of paved road information (2004), total road network 5,749 Km.
Enhancing Road Maintenance In the OIC Member Countries
110
KYRGYZ REPUBLIC latest data (2000-2013)
Year 2013
Population 5,719,500
GNI per capita ($) 1,210
Surface (Km2) 199,949
Year 2007
Motorways (Km)
Highways, main or national roads (Km)
Secondary or regional roads (Km)
Other roads (Km)
Total length of roads (Km) 34,000
Paved roads (%)* 91
Paved roads (Km)* 16,835
Non-paved roads (Km)* 1,665
Length of roads by GDP per capita (Km/$) 47
Density of roads (Km/Km2) 0.17
Year 2010
Traffic volume (Mio Veh-Km) 4,336
Year 2011
Inland freight transport (Mio T-Km) 2,103
Inland passenger transport (Mio P-Km) 7,462
Road freight transport (Mio T-Km) 1,303
Road passenger transport (Mio P-Km) 7,379
Year 2011
Persons Killed / 100,000 population 18
Persons Injured /100,000 population 121
Injury accidents /100,000 population 87
Injury accidents / 100 Million Veh-Km
Year 2011
Government expenditures (Mio USD)
Central
Regional/Local
Private sector expenditures (Mio USD)
Total expenditures (Mio USD)
Investment expenditures (Mio USD) 188.72
Maintenance expenditures (Mio USD)
Other expenditures (Mio USD) 34.03
Year 2010
Road Revenues (Mio USD)
Indirect: Fuel Tax
Direct: Toll
Others 9.53
Total revenues (Mio USD)
Authority in charge of Road Management
Management structure of Road Network
Motorways
Highways, main or national roads
Secondary or regional roads
Other roads Sources: IRF World Road Statistics 2015; Road Revenues - Questionnaire WRS; Economic and demographic information WDI - World Bank. * Latest % of paved road information (2000), total road network 18,500 Km.
Enhancing Road Maintenance In the OIC Member Countries
111
LEBANON latest data (2000-2013)
Year 2013
Population 4,467,390
GNI per capita ($) 9,870
Surface (Km2) 10,450
Year 2013
Motorways (Km) 300
Highways, main or national roads (Km) 457
Secondary or regional roads (Km) 1,379
Other roads (Km) 4,550
Total length of roads (Km) 6,686
Paved roads (%) 95
Paved roads (%)* 6033
Paved roads (Km)* 318
Non-paved roads (Km)* 0.7
Density of roads (Km/Km2) 0.64
Year
Traffic volume (Mio Veh-Km)**
Year
Inland freight transport (Mio T-Km)**
Inland passenger transport (Mio P-Km)**
Road freight transport (Mio T-Km)**
Road passenger transport (Mio P-Km)**
Year 2013
Persons Killed / 100,000 population 9
Persons Injured /100,000 population 89
Injury accidents /100,000 population 88
Injury accidents / 100 Million Veh-Km
Year
Government expenditures (Mio USD)**
Central
Regional/Local
Private sector expenditures (Mio USD)**
Total expenditures (Mio USD)**
Investment expenditures (Mio USD)
Maintenance expenditures (Mio USD)
Other expenditures (Mio USD)
Year
Road Revenues (Mio USD)**
Indirect: Fuel Tax
Direct: Toll
Others
Total revenues (Mio USD)**
Authority in charge of Road Management
Management structure of Road Network
Motorways
Highways, main or national roads
Secondary or regional roads
Other roads Sources: IRF World Road Statistics 2015; Road Revenues - Questionnaire WRS; Economic and demographic information WDI - World Bank. * Latest % of paved road information (1996), total road network 6,350 Km. ** No data available by the Central Administration for Statistics Lebanon.
Enhancing Road Maintenance In the OIC Member Countries
112
LIBYA latest data (2000-2013)
Year 2013
Population 6,201,521
GNI per capita ($)
Surface (Km2) 1,759,540
Year 2000
Motorways (Km)
Highways, main or national roads (Km)
Secondary or regional roads (Km)
Other roads (Km)
Total length of roads (Km) 83,200
Paved roads (%) 57
Paved roads (Km) 47,590
Non-paved roads (Km) 35,610
Length of roads by GDP per capita (Km/$) 13
Density of roads (Km/Km2) 0.05
Year
Traffic volume (Mio Veh-Km)
Year
Inland freight transport (Mio T-Km)
Inland passenger transport (Mio P-Km)
Road freight transport (Mio T-Km)
Road passenger transport (Mio P-Km)
Year 2007
Persons Killed / 100,000 population 37
Persons Injured /100,000 population 118
Injury accidents /100,000 population
Injury accidents / 100 Million Veh-Km
Year 2005
Government expenditures (Mio USD)
Central
Regional/Local
Private sector expenditures (Mio USD)
Total expenditures (Mio USD) 6065.09
Investment expenditures (Mio USD)
Maintenance expenditures (Mio USD)
Other expenditures (Mio USD)
Year
Road Revenues (Mio USD)
Indirect: Fuel Tax
Direct: Toll
Others
Total revenues (Mio USD)
Authority in charge of Road Management
Management structure of Road Network
Motorways
Highways, main or national roads
Secondary or regional roads
Other roads Sources: IRF World Road Statistics 2015; Road Revenues - Questionnaire WRS; Economic and demographic information WDI - World Bank.
Enhancing Road Maintenance In the OIC Member Countries
113
MALAYSIA latest data (2000-2013)
Year 2013
Population 29,716,965
GNI per capita ($) 10,430
Surface (Km2) 330,800
Year 2012
Motorways (Km)
Highways, main or national roads (Km)
Secondary or regional roads (Km)
Other roads (Km)
Total length of roads (Km) 180,882
Paved roads (%) 78
Paved roads (Km) 141,195
Non-paved roads (Km) 39,687
Length of roads by GDP per capita (Km/$) 17
Density of roads (Km/Km2) 0.55
Year
Traffic volume (Mio Veh-Km) only pass cars
Year
Inland freight transport (Mio T-Km)
Inland passenger transport (Mio P-Km)
Road freight transport (Mio T-Km)
Road passenger transport (Mio P-Km)
Year 2011
Persons Killed / 100,000 population 24
Persons Injured /100,000 population 65
Injury accidents /100,000 population
Injury accidents / 100 Million Veh-Km
Year 2003
Government expenditures (Mio USD)
Central 346.56
Regional/Local
Private sector expenditures (Mio USD)
Total expenditures (Mio USD) 346.56
Investment expenditures (Mio USD) 0.69
Maintenance expenditures (Mio USD) 340.61
Other expenditures (Mio USD) 5.26
Year
Road Revenues (Mio USD)
Indirect: Fuel Tax
Direct: Toll
Others
Total revenues (Mio USD)
Authority in charge of Road Management
Management structure of Road Network
Motorways
Highways, main or national roads
Secondary or regional roads
Other roads Sources: IRF World Road Statistics 2015; Road Revenues - Questionnaire WRS; Economic and demographic information WDI - World Bank.
Enhancing Road Maintenance In the OIC Member Countries
114
MALDIVES latest data (2000-2013)
Year 2013
Population 345,023
GNI per capita ($) 5,600
Surface (Km2) 300
Year 2005
Motorways (Km)
Highways, main or national roads (Km)
Secondary or regional roads (Km)
Other roads (Km)
Total length of roads (Km) 88
Paved roads (%) 100
Paved roads (Km) 88
Non-paved roads (Km) 0
Length of roads by GDP per capita (Km/$) 0.03
Density of roads (Km/Km2) 0.29
Year
Traffic volume (Mio Veh-Km) only pass cars
Year
Inland freight transport (Mio T-Km)
Inland passenger transport (Mio P-Km)
Road freight transport (Mio T-Km)
Road passenger transport (Mio P-Km)
Year 2007
Persons Killed / 100,000 population 3
Persons Injured /100,000 population
Injury accidents /100,000 population
Injury accidents / 100 Million Veh-Km
Year
Government expenditures (Mio USD)
Central
Regional/Local
Private sector expenditures (Mio USD)
Total expenditures (Mio USD)
Investment expenditures (Mio USD)
Maintenance expenditures (Mio USD)
Other expenditures (Mio USD)
Year
Road Revenues (Mio USD)
Indirect: Fuel Tax
Direct: Toll
Others
Total revenues (Mio USD)
Authority in charge of Road Management
Management structure of Road Network
Motorways
Highways, main or national roads
Secondary or regional roads
Other roads Sources: IRF World Road Statistics 2015; Road Revenues - Questionnaire WRS; Economic and demographic information WDI - World Bank.
Enhancing Road Maintenance In the OIC Member Countries
115
MALI latest data (2000-2013)
Year 2013
Population 15,301,650
GNI per capita ($) 670
Surface (Km2) 1,240,190
Year 2013
Motorways (Km) 0
Highways, main or national roads (Km) 14,102
Secondary or regional roads (Km) 7,052
Other roads (Km) 67,870
Total length of roads (Km) 89,024
Paved roads (%) 7
Paved roads (Km) 6,209
Non-paved roads (Km) 82,815
Length of roads by GDP per capita (Km/$) 124
Density of roads (Km/Km2) 0.07
Year
Traffic volume (Mio Veh-Km) only pass cars
Year 2013
Inland freight transport (Mio T-Km) 5
Inland passenger transport (Mio P-Km)
Road freight transport (Mio T-Km) 4
Road passenger transport (Mio P-Km)
Year 2013
Persons Killed / 100,000 population 3
Persons Injured /100,000 population 54
Injury accidents /100,000 population 40
Injury accidents / 100 Million Veh-Km
Year 2013
Government expenditures (Mio USD)
Central 71.34
Regional/Local
Private sector expenditures (Mio USD)
Total expenditures (Mio USD) 71.34
Investment expenditures (Mio USD) 33.57
Maintenance expenditures (Mio USD) 37.77
Other expenditures (Mio USD)
Year
Road Revenues (Mio USD)
Indirect: Fuel Tax
Direct: Toll
Others
Total revenues (Mio USD)
Authority in charge of Road Management
Management structure of Road Network
Motorways
Highways, main or national roads
Secondary or regional roads
Other roads Sources: IRF World Road Statistics 2015; Road Revenues - Questionnaire WRS; Economic and demographic information WDI - World Bank.
Enhancing Road Maintenance In the OIC Member Countries
116
MAURITANIA latest data (2000-2013)
Year 2013
Population 3,889,880
GNI per capita ($) 1,060
Surface (Km2) 1,030,700
Year 2012
Motorways (Km)
Highways, main or national roads (Km)
Secondary or regional roads (Km)
Other roads (Km)
Total length of roads (Km) 11,790
Paved roads (%) 36
Paved roads (Km) 4,258
Non-paved roads (Km) 7,532
Length of roads by GDP per capita (Km/$) 11
Density of roads (Km/Km2) 0.01
Year
Traffic volume (Mio Veh-Km) only pass cars
Year
Inland freight transport (Mio T-Km)
Inland passenger transport (Mio P-Km)
Road freight transport (Mio T-Km)
Road passenger transport (Mio P-Km)
Year 2012
Persons Killed / 100,000 population 4
Persons Injured /100,000 population 33
Injury accidents /100,000 population 11
Injury accidents / 100 Million Veh-Km
Year
Government expenditures (Mio USD)
Central
Regional/Local
Private sector expenditures (Mio USD)
Total expenditures (Mio USD)
Investment expenditures (Mio USD)
Maintenance expenditures (Mio USD)
Other expenditures (Mio USD)
Year
Road Revenues (Mio USD)
Indirect: Fuel Tax
Direct: Toll
Others
Total revenues (Mio USD)
Authority in charge of Road Management
Management structure of Road Network
Motorways
Highways, main or national roads
Secondary or regional roads
Other roads Sources: IRF World Road Statistics 2015; Road Revenues - Questionnaire WRS; Economic and demographic information WDI - World Bank.
Enhancing Road Maintenance In the OIC Member Countries
117
MOROCCO latest data (2000-2013)
Year 2013
Population 33,008,150
GNI per capita ($) 3,020
Surface (Km2) 446,550
Year 2011
Motorways (Km) 1398
Highways, main or national roads (Km) 11,364
Secondary or regional roads (Km) 10,091
Other roads (Km) 35,844
Total length of roads (Km) 58,698
Paved roads (%) 71
Paved roads (Km) 41,419
Non-paved roads (Km) 17,279
Length of roads by GDP per capita (Km/$) 19
Density of roads (Km/Km2) 0.13
Year 2006
Traffic volume (Mio Veh-Km) only pass cars
23,037
Year
Inland freight transport (Mio T-Km)
Inland passenger transport (Mio P-Km)
Road freight transport (Mio T-Km)
Road passenger transport (Mio P-Km)
Year 2011
Persons Killed / 100,000 population 13
Persons Injured /100,000 population 329
Injury accidents /100,000 population 215
Injury accidents / 100 Million Veh-Km
Year 2000
Government expenditures (Mio USD)
Central 24.70
Regional/Local 185.29
Private sector expenditures (Mio USD)
Total expenditures (Mio USD) 209.99
Investment expenditures (Mio USD) 76.86
Maintenance expenditures (Mio USD) 108.43
Other expenditures (Mio USD) 26.08
Year
Road Revenues (Mio USD)
Indirect: Fuel Tax
Direct: Toll
Others
Total revenues (Mio USD)
Authority in charge of Road Management
Management structure of Road Network
Motorways
Highways, main or national roads
Secondary or regional roads
Other roads Sources: IRF World Road Statistics 2015; Road Revenues - Questionnaire WRS; Economic and demographic information WDI - World Bank.
Enhancing Road Maintenance In the OIC Member Countries
118
MOZAMBIQUE latest data (2000-2013)
Year 2013
Population 25,833,752
GNI per capita ($) 610
Surface (Km2) 799,380
Year 2012
Motorways (Km)
Highways, main or national roads (Km) 10,919
Secondary or regional roads (Km) 19,412
Other roads (Km)
Total length of roads (Km) 30,331
Paved roads (%) 21
Paved roads (Km) 6,303
Non-paved roads (Km) 24,028
Length of roads by GDP per capita (Km/$)
66
Density of roads (Km/Km2) 0.04
Year 2012
Traffic volume (Mio Veh-Km) 115,752
Year
Inland freight transport (Mio T-Km)
Inland passenger transport (Mio P-Km)
Road freight transport (Mio T-Km)
Road passenger transport (Mio P-Km)
Year 2011
Persons Killed / 100,000 population 7
Persons Injured /100,000 population 24
Injury accidents /100,000 population 15
Injury accidents / 100 Million Veh-Km
Year 2012
Government expenditures (Mio USD)
Central
Regional/Local
Private sector expenditures (Mio USD)
Total expenditures (Mio USD) 508.85
Investment expenditures (Mio USD) 360.43
Maintenance expenditures (Mio USD) 126.47
Other expenditures (Mio USD) 21.95
Year 2012
Road Revenues (Mio USD)
Indirect: Fuel Tax 108.70
Direct: Toll 12.95
Others 100.89
Total revenues (Mio USD) 222.55
Authority in charge of Road Management
Administraçao Nacional de Estradas
Management structure of Road Network
Motorways
Highways, main or national roads
Secondary or regional roads
Other roads Sources: IRF World Road Statistics 2015; Road Revenues - Questionnaire WRS; Economic and demographic information WDI - World Bank.
Enhancing Road Maintenance In the OIC Member Countries
119
NIGER latest data (2000-2013)
Year 2013
Population 17,831,270
GNI per capita ($) 400
Surface (Km2) 1,267,000
Year 2013
Motorways (Km)
Highways, main or national roads (Km)
Secondary or regional roads (Km)
Other roads (Km)
Total length of roads (Km) 19,710
Paved roads (%) 21
Paved roads (Km) 4,225
Non-paved roads (Km) 15,485
Length of roads by GDP per capita (Km/$) 47
Density of roads (Km/Km2) 0.02
Year
Traffic volume (Mio Veh-Km)
Year
Inland freight transport (Mio T-Km)
Inland passenger transport (Mio P-Km)
Road freight transport (Mio T-Km)
Road passenger transport (Mio P-Km)
Year 2013
Persons Killed / 100,000 population 5
Persons Injured /100,000 population 46
Injury accidents /100,000 population 36
Injury accidents / 100 Million Veh-Km
Year 2010
Government expenditures (Mio USD)
Central
Regional/Local
Private sector expenditures (Mio USD)
Total expenditures (Mio USD)
Investment expenditures (Mio USD) 229.77
Maintenance expenditures (Mio USD) 61.06
Other expenditures (Mio USD)
Year
Road Revenues (Mio USD)
Indirect: Fuel Tax
Direct: Toll
Others
Total revenues (Mio USD)
Authority in charge of Road Management
Management structure of Road Network
Motorways
Highways, main or national roads
Secondary or regional roads
Other roads Sources: IRF World Road Statistics 2015; Road Revenues - Questionnaire WRS; Economic and demographic information WDI - World Bank.
Enhancing Road Maintenance In the OIC Member Countries
120
NIGERIA latest data (2000-2013)
Year 2013
Population 173,615,345
GNI per capita ($) 2,710
Surface (Km2) 923,770
Year 2004
Motorways (Km) 0
Highways, main or national roads (Km) 15,688
Secondary or regional roads (Km) 18,715
Other roads (Km) 158,797
Total length of roads (Km) 193,200
Paved roads (%) 15
Paved roads (Km) 28,980
Non-paved roads (Km) 164,220
Length of roads by GDP per capita (Km/$) 299
Density of roads (Km/Km2) 0.21
Year
Traffic volume (Mio Veh-Km)
Year
Inland freight transport (Mio T-Km)
Inland passenger transport (Mio P-Km)
Road freight transport (Mio T-Km)
Road passenger transport (Mio P-Km)
Year 2010
Persons Killed / 100,000 population 3
Persons Injured /100,000 population 11
Injury accidents /100,000 population
Injury accidents / 100 Million Veh-Km
Year
Government expenditures (Mio USD)
Central
Regional/Local
Private sector expenditures (Mio USD)
Total expenditures (Mio USD)
Investment expenditures (Mio USD)
Maintenance expenditures (Mio USD)
Other expenditures (Mio USD)
Year
Road Revenues (Mio USD)
Indirect: Fuel Tax
Direct: Toll
Others
Total revenues (Mio USD)
Authority in charge of Road Management
Management structure of Road Network
Motorways
Highways, main or national roads
Secondary or regional roads
Other roads Sources: IRF World Road Statistics 2015; Road Revenues - Questionnaire WRS; Economic and demographic information WDI - World Bank.
Enhancing Road Maintenance In the OIC Member Countries
121
OMAN latest data (2000-2013)
Year 2013
Population 3,632,444
GNI per capita ($)
Surface (Km2) 309,500
Year 2013
Motorways (Km)
Highways, main or national roads (Km)
Secondary or regional roads (Km)
Other roads (Km)
Total length of roads (Km) 64,051
Paved roads (%) 51
Paved roads (Km) 32,605
Non-paved roads (Km) 31,446
Length of roads by GDP per capita (Km/$) 2.9
Density of roads (Km/Km2) 0.21
Year
Traffic volume (Mio Veh-Km)
Year
Inland freight transport (Mio T-Km)
Inland passenger transport (Mio P-Km)
Road freight transport (Mio T-Km)
Road passenger transport (Mio P-Km)
Year 2013
Persons Killed / 100,000 population 25
Persons Injured /100,000 population 297
Injury accidents /100,000 population 216
Injury accidents / 100 Million Veh-Km
Year
Government expenditures (Mio USD)
Central
Regional/Local
Private sector expenditures (Mio USD)
Total expenditures (Mio USD)
Investment expenditures (Mio USD)
Maintenance expenditures (Mio USD)
Other expenditures (Mio USD)
Year
Road Revenues (Mio USD)
Indirect: Fuel Tax
Direct: Toll
Others
Total revenues (Mio USD)
Authority in charge of Road Management
Management structure of Road Network
Motorways
Highways, main or national roads
Secondary or regional roads
Other roads Sources: IRF World Road Statistics 2015; Road Revenues - Questionnaire WRS; Economic and demographic information WDI - World Bank.
Enhancing Road Maintenance In the OIC Member Countries
122
PAKISTAN latest data (2000-2013)
Year 2013
Population 182,142,594
GNI per capita ($) 1,360
Surface (Km2) 796,100
Year 2013
Motorways (Km)
Highways, main or national roads (Km)
Secondary or regional roads (Km)
Other roads (Km)
Total length of roads (Km) 263,415
Paved roads (%) 69
Paved roads (Km) 182,900
Non-paved roads (Km) 80,515
Length of roads by GDP per capita (Km/$) 207
Density of roads (Km/Km2) 0.33
Year 2011
Traffic volume (Mio Veh-Km) 75,602
Year 2011
Inland freight transport (Mio T-Km) 179,711
Inland passenger transport (Mio P-Km) 343,384
Road freight transport (Mio T-Km) 177,954
Road passenger transport (Mio P-Km) 322,765
Year 2010
Persons Killed / 100,000 population 3
Persons Injured /100,000 population 7
Injury accidents /100,000 population 6
Injury accidents / 100 Million Veh-Km 16
Year
Government expenditures (Mio USD)
Central
Regional/Local
Private sector expenditures (Mio USD)
Total expenditures (Mio USD)
Investment expenditures (Mio USD)
Maintenance expenditures (Mio USD)
Other expenditures (Mio USD)
Year
Road Revenues (Mio USD)
Indirect: Fuel Tax
Direct: Toll
Others
Total revenues (Mio USD)
Authority in charge of Road Management
Management structure of Road Network
Motorways
Highways, main or national roads
Secondary or regional roads
Other roads Sources: IRF World Road Statistics 2015; Road Revenues - Questionnaire WRS; Economic and demographic information WDI - World Bank.
Enhancing Road Maintenance In the OIC Member Countries
123
PALESTINE latest data (2000-2013)
Year 2013
Population 4,169,506
GNI per capita ($)
Surface (Km2) 6,020
Year 2013
Motorways (Km)
Highways, main or national roads (Km) 733
Secondary or regional roads (Km) 1,243
Other roads (Km) 1,545
Total length of roads (Km) 3,521
Paved roads (%) 100
Paved roads (Km) 3,521
Non-paved roads (Km) 0
Length of roads by GDP per capita (Km/$) 1.3
Density of roads (Km/Km2) 0.58
Year
Traffic volume (Mio Veh-Km)*
Year
Inland freight transport (Mio T-Km)*
Inland passenger transport (Mio P-Km)*
Road freight transport (Mio T-Km)*
Road passenger transport (Mio P-Km)*
Year 2013
Persons Killed / 100,000 population 3
Persons Injured /100,000 population 183
Injury accidents /100,000 population 95
Injury accidents / 100 Million Veh-Km
Year
Government expenditures (Mio USD)*
Central
Regional/Local
Private sector expenditures (Mio USD)*
Total expenditures (Mio USD)*
Investment expenditures (Mio USD)
Maintenance expenditures (Mio USD)
Other expenditures (Mio USD)
Year
Road Revenues (Mio USD)*
Indirect: Fuel Tax
Direct: Toll
Others
Total revenues (Mio USD)*
Authority in charge of Road Management
Management structure of Road Network
Motorways
Highways, main or national roads
Secondary or regional roads
Other roads Sources: IRF World Road Statistics 2015; Road Revenues - Questionnaire WRS; Economic and demographic information WDI - World Bank. * No data available by the Palestinian Central Bureau of Statistics.
Enhancing Road Maintenance In the OIC Member Countries
124
QATAR latest data (2000-2013)
Year 2013
Population 2,168,673
GNI per capita ($) 86,790
Surface (Km2) 11,610
Year 2013
Motorways (Km)
Highways, main or national roads (Km) 1,018
Secondary or regional roads (Km) 967
Other roads (Km) 7,607
Total length of roads (Km) 9,592
Paved roads (%)* 90
Paved roads (Km)* 1,107
Non-paved roads (Km)* 123
Length of roads by GDP per capita (Km/$) 0.1
Density of roads (Km/Km2) 0.83
Year
Traffic volume (Mio Veh-Km)
Year
Inland freight transport (Mio T-Km)
Inland passenger transport (Mio P-Km)
Road freight transport (Mio T-Km)
Road passenger transport (Mio P-Km)
Year 2013
Persons Killed / 100,000 population 11
Persons Injured /100,000 population 304
Injury accidents /100,000 population
Injury accidents / 100 Million Veh-Km
Year
Government expenditures (Mio USD)
Central
Regional/Local
Private sector expenditures (Mio USD)
Total expenditures (Mio USD)
Investment expenditures (Mio USD)
Maintenance expenditures (Mio USD)
Other expenditures (Mio USD)
Year
Road Revenues (Mio USD)
Indirect: Fuel Tax
Direct: Toll
Others
Total revenues (Mio USD)
Authority in charge of Road Management
Management structure of Road Network
Motorways
Highways, main or national roads
Secondary or regional roads
Other roads Sources: IRF World Road Statistics 2015; Road Revenues - Questionnaire WRS; Economic and demographic information WDI - World Bank. * Latest % of paved road information (1996), total road network 1,230 Km.
Enhancing Road Maintenance In the OIC Member Countries
125
SAUDI ARABIA latest data (2000-2013)
Year 2013
Population 28,828,870
GNI per capita ($) 26,260
Surface (Km2) 2,149,690
Year 2005
Motorways (Km) 3891
Highways, main or national roads (Km) 9,705
Secondary or regional roads (Km) 33,924
Other roads (Km) 173,852
Total length of roads (Km) 221,372
Paved roads (%) 21
Paved roads (Km) 47,529
Non-paved roads (Km) 173,843
Length of roads by GDP per capita (Km/$) 17
Density of roads (Km/Km2) 0.10
Year 2005
Traffic volume (Mio Veh-Km) 110,352
Year
Inland freight transport (Mio T-Km)
Inland passenger transport (Mio P-Km)
Road freight transport (Mio T-Km)
Road passenger transport (Mio P-Km)
Year 2007
Persons Killed / 100,000 population 25
Persons Injured /100,000 population 139
Injury accidents /100,000 population
Injury accidents / 100 Million Veh-Km
Year 2000
Government expenditures (Mio USD)
Central
Regional/Local
Private sector expenditures (Mio USD)
Total expenditures (Mio USD) 550.38
Investment expenditures (Mio USD) 345.87
Maintenance expenditures (Mio USD) 138.62
Other expenditures (Mio USD) 65.88
Year
Road Revenues (Mio USD)
Indirect: Fuel Tax
Direct: Toll
Others
Total revenues (Mio USD)
Authority in charge of Road Management
Management structure of Road Network
Motorways
Highways, main or national roads
Secondary or regional roads
Other roads Sources: IRF World Road Statistics 2015; Road Revenues - Questionnaire WRS; Economic and demographic information WDI - World Bank.
Enhancing Road Maintenance In the OIC Member Countries
126
SENEGAL latest data (2000-2013)
Year 2013
Population 14,133,280
GNI per capita ($) 1,050
Surface (Km2) 196,710
Year 2013
Motorways (Km)
Highways, main or national roads (Km)
Secondary or regional roads (Km)
Other roads (Km)
Total length of roads (Km)* 15,609
Paved roads (%) 36
Paved roads (Km) 5,604
Non-paved roads (Km) 10,005
Length of roads by GDP per capita (Km/$) 15
Density of roads (Km/Km2) 0.08
Year 2000
Traffic volume (Mio Veh-Km) 4,013
Year
Inland freight transport (Mio T-Km)
Inland passenger transport (Mio P-Km)
Road freight transport (Mio T-Km)
Road passenger transport (Mio P-Km)
Year 2013
Persons Killed / 100,000 population 1
Persons Injured /100,000 population 15
Injury accidents /100,000 population 11
Injury accidents / 100 Million Veh-Km
Year 2000
Government expenditures (Mio USD)
Central
Regional/Local
Private sector expenditures (Mio USD)
Total expenditures (Mio USD) 22.98
Investment expenditures (Mio USD)
Maintenance expenditures (Mio USD) 22.98
Other expenditures (Mio USD)
Year
Road Revenues (Mio USD)
Indirect: Fuel Tax
Direct: Toll
Others
Total revenues (Mio USD)
Authority in charge of Road Management
Management structure of Road Network
Motorways
Highways, main or national roads
Secondary or regional roads
Other roads Sources: IRF World Road Statistics 2015; Road Revenues - Questionnaire WRS; Economic and demographic information WDI - World Bank. * National and regional roads.
Enhancing Road Maintenance In the OIC Member Countries
127
SIERRA LEONE latest data (2000-2013)
Year 2013
Population 6,092,075
GNI per capita ($) 660
Surface (Km2) 72,300
Year 2002
Motorways (Km) 0
Highways, main or national roads (Km) 2,138
Secondary or regional roads (Km) 1,950
Other roads (Km) 7,212
Total length of roads (Km) 11,300
Paved roads (%) 8
Paved roads (Km) 904
Non-paved roads (Km) 10,396
Length of roads by GDP per capita (Km/$) 41
Density of roads (Km/Km2) 0.16
Year
Traffic volume (Mio Veh-Km)
Year
Inland freight transport (Mio T-Km)
Inland passenger transport (Mio P-Km)
Road freight transport (Mio T-Km)
Road passenger transport (Mio P-Km)
Year 2012
Persons Killed / 100,000 population
Persons Injured /100,000 population
Injury accidents /100,000 population 43
Injury accidents / 100 Million Veh-Km
Year 2000
Government expenditures (Mio USD)
Central 1.47
Regional/Local
Private sector expenditures (Mio USD)
Total expenditures (Mio USD) 1.47
Investment expenditures (Mio USD)
Maintenance expenditures (Mio USD) 1.47
Other expenditures (Mio USD) 2.25
Year
Road Revenues (Mio USD)
Indirect: Fuel Tax
Direct: Toll
Others
Total revenues (Mio USD)
Authority in charge of Road Management
Management structure of Road Network
Motorways
Highways, main or national roads
Secondary or regional roads
Other roads Sources: IRF World Road Statistics 2015; Road Revenues - Questionnaire WRS; Economic and demographic information WDI - World Bank.
Enhancing Road Maintenance In the OIC Member Countries
128
SOMALIA latest data (2000-2013)
Year 2013
Population 10,495,583
GNI per capita ($)
Surface (Km2) 637,660
Year 2000
Motorways (Km)
Highways, main or national roads (Km)
Secondary or regional roads (Km)
Other roads (Km)
Total length of roads (Km) 22,100
Paved roads (%) 12
Paved roads (Km) 2,608
Non-paved roads (Km) 19,492
Length of roads by GDP per capita (Km/$) N/A GDP
Density of roads (Km/Km2) 0.03
Year
Traffic volume (Mio Veh-Km)
Year
Inland freight transport (Mio T-Km)
Inland passenger transport (Mio P-Km)
Road freight transport (Mio T-Km)
Road passenger transport (Mio P-Km)
Year 2012
Persons Killed / 100,000 population 2
Persons Injured /100,000 population 16
Injury accidents /100,000 population
Injury accidents / 100 Million Veh-Km
Year
Government expenditures (Mio USD)
Central
Regional/Local
Private sector expenditures (Mio USD)
Total expenditures (Mio USD)
Investment expenditures (Mio USD)
Maintenance expenditures (Mio USD)
Other expenditures (Mio USD)
Year
Road Revenues (Mio USD)
Indirect: Fuel Tax
Direct: Toll
Others
Total revenues (Mio USD)
Authority in charge of Road Management
Management structure of Road Network
Motorways
Highways, main or national roads
Secondary or regional roads
Other roads Sources: IRF World Road Statistics 2015; Road Revenues - Questionnaire WRS; Economic and demographic information WDI - World Bank.
Enhancing Road Maintenance In the OIC Member Countries
129
SUDAN latest data (2000-2013)
Year 2013
Population 37,964,306
GNI per capita ($) 1,550
Surface (Km2) 1,879,358
Year 2000
Motorways (Km)
Highways, main or national roads (Km)
Secondary or regional roads (Km)
Other roads (Km)
Total length of roads (Km) 11,900
Paved roads (%) 36
Paved roads (Km) 4,320
Non-paved roads (Km) 7,580
Length of roads by GDP per capita (Km/$) 33
Density of roads (Km/Km2) 0.005
Year
Traffic volume (Mio Veh-Km)
Year
Inland freight transport (Mio T-Km)
Inland passenger transport (Mio P-Km)
Road freight transport (Mio T-Km)
Road passenger transport (Mio P-Km)
Year 2007
Persons Killed / 100,000 population 7
Persons Injured /100,000 population 64
Injury accidents /100,000 population
Injury accidents / 100 Million Veh-Km
Year
Government expenditures (Mio USD)
Central
Regional/Local
Private sector expenditures (Mio USD)
Total expenditures (Mio USD)
Investment expenditures (Mio USD)
Maintenance expenditures (Mio USD)
Other expenditures (Mio USD)
Year
Road Revenues (Mio USD)
Indirect: Fuel Tax
Direct: Toll
Others
Total revenues (Mio USD)
Authority in charge of Road Management
Management structure of Road Network
Motorways
Highways, main or national roads
Secondary or regional roads
Other roads Sources: IRF World Road Statistics 2015; Road Revenues - Questionnaire WRS; Economic and demographic information WDI - World Bank.
Enhancing Road Maintenance In the OIC Member Countries
130
SURINAME latest data (2000-2013)
Year 2013
Population 539,276
GNI per capita ($) 9,370
Surface (Km2) 163,820
Year 2003
Motorways (Km) 0
Highways, main or national roads (Km) 0
Secondary or regional roads (Km) 4,304
Other roads (Km) 0
Total length of roads (Km) 4,304
Paved roads (%) 26
Paved roads (Km) 1,130
Non-paved roads (Km) 3,174
Length of roads by GDP per capita (Km/$) 1.6
Density of roads (Km/Km2) 0.03
Year 2000
Traffic volume (Mio Veh-Km) 1,380
Year
Inland freight transport (Mio T-Km)*
Inland passenger transport (Mio P-Km)*
Road freight transport (Mio T-Km)*
Road passenger transport (Mio P-Km)*
Year 2013
Persons Killed / 100,000 population 14
Persons Injured /100,000 population
Injury accidents /100,000 population
Injury accidents / 100 Million Veh-Km
Year
Government expenditures (Mio USD)*
Central
Regional/Local
Private sector expenditures (Mio USD)*
Total expenditures (Mio USD)*
Investment expenditures (Mio USD)
Maintenance expenditures (Mio USD)
Other expenditures (Mio USD)
Year
Road Revenues (Mio USD)*
Indirect: Fuel Tax
Direct: Toll
Others
Total revenues (Mio USD)*
Authority in charge of Road Management
Management structure of Road Network
Motorways
Highways, main or national roads
Secondary or regional roads
Other roads Sources: IRF World Road Statistics 2015; Road Revenues - Questionnaire WRS; Economic and demographic information WDI - World Bank. * No data available by the General Bureau of Statistics Suriname.
Enhancing Road Maintenance In the OIC Member Countries
131
TAJIKISTAN latest data (2000-2013)
Year 2013
Population 8,207,834
GNI per capita ($) 990
Surface (Km2) 142,550
Year 2000
Motorways (Km)
Highways, main or national roads (Km)
Secondary or regional roads (Km)
Other roads (Km)
Total length of roads (Km) 27,767
Paved roads (%)* 83
Paved roads (Km)* 11,330
Non-paved roads (Km)* 2,370
Length of roads by GDP per capita (Km/$) 200
Density of roads (Km/Km2) 0.19
Year 2001
Traffic volume (Mio Veh-Km) 3,071
Year
Inland freight transport (Mio T-Km)
Inland passenger transport (Mio P-Km)
Road freight transport (Mio T-Km)
Road passenger transport (Mio P-Km)
Year 2010
Persons Killed / 100,000 population 5
Persons Injured /100,000 population 23
Injury accidents /100,000 population
Injury accidents / 100 Million Veh-Km
Year
Government expenditures (Mio USD)
Central
Regional/Local
Private sector expenditures (Mio USD)
Total expenditures (Mio USD)
Investment expenditures (Mio USD)
Maintenance expenditures (Mio USD)
Other expenditures (Mio USD)
Year
Road Revenues (Mio USD)
Indirect: Fuel Tax
Direct: Toll
Others
Total revenues (Mio USD)
Authority in charge of Road Management
Management structure of Road Network
Motorways
Highways, main or national roads
Secondary or regional roads
Other roads Sources: IRF World Road Statistics 2015; Road Revenues - Questionnaire WRS; Economic and demographic information WDI - World Bank. * Latest % of paved road information (1996), total road network 13,700 Km.
Enhancing Road Maintenance In the OIC Member Countries
132
TOGO latest data (2000-2013)
Year 2013
Population 6,816,982
GNI per capita ($) 530
Surface (Km2) 56,790
Year 2007
Motorways (Km) 0
Highways, main or national roads (Km) 3,067
Secondary or regional roads (Km) 0
Other roads (Km) 8,585
Total length of roads (Km) 11,652
Paved roads (%) 21
Paved roads (Km) 2,447
Non-paved roads (Km) 9,205
Length of roads by GDP per capita (Km/$) 27
Density of roads (Km/Km2) 0.21
Year
Traffic volume (Mio Veh-Km)
Year
Inland freight transport (Mio T-Km)
Inland passenger transport (Mio P-Km)
Road freight transport (Mio T-Km)
Road passenger transport (Mio P-Km)
Year 2007
Persons Killed / 100,000 population 8
Persons Injured /100,000 population 31
Injury accidents /100,000 population
Injury accidents / 100 Million Veh-Km
Year 2007
Government expenditures (Mio USD)
Central
Regional/Local
Private sector expenditures (Mio USD)
Total expenditures (Mio USD) 17.13
Investment expenditures (Mio USD)
Maintenance expenditures (Mio USD) 17.13
Other expenditures (Mio USD)
Year
Road Revenues (Mio USD)
Indirect: Fuel Tax
Direct: Toll
Others
Total revenues (Mio USD)
Authority in charge of Road Management
Management structure of Road Network
Motorways
Highways, main or national roads
Secondary or regional roads
Other roads Sources: IRF World Road Statistics 2015; Road Revenues - Questionnaire WRS; Economic and demographic information WDI - World Bank.
Enhancing Road Maintenance In the OIC Member Countries
133
TUNISIA latest data (2000-2013)
Year 2013
Population 10,886,500
GNI per capita ($) 4,200
Surface (Km2) 163,610
Year 2013
Motorways (Km) 356
Highways, main or national roads (Km) 4,746
Secondary or regional roads (Km) 6,496
Other roads (Km) 7,842
Total length of roads (Km) 19,440
Paved roads (%) 78
Paved roads (Km) 15,090
Non-paved roads (Km) 4,350
Length of roads by GDP per capita (Km/$) 5
Density of roads (Km/Km2) 0.12
Year 2012
Traffic volume (Mio Veh-Km) 29,094
Year
Inland freight transport (Mio T-Km)
Inland passenger transport (Mio P-Km)
Road freight transport (Mio T-Km)
Road passenger transport (Mio P-Km)
Year 2013
Persons Killed / 100,000 population 14
Persons Injured /100,000 population 124
Injury accidents /100,000 population 82
Injury accidents / 100 Million Veh-Km
Year 2013
Government expenditures (Mio USD)
Central 370.15
Regional/Local 45.91
Private sector expenditures (Mio USD)
Total expenditures (Mio USD) 416.06
Investment expenditures (Mio USD) 393.84
Maintenance expenditures (Mio USD) 22.23
Other expenditures (Mio USD)
Authority in charge of Road Management Ministère de l'Equipement, Direction de l'exploitation et de l'entretien routier
Management structure of Road Network
Motorways Ministère de l'Equipement, Direction de l'exploitation et de l'entretien routier
Highways, main or national roads Ministère de l'Equipement, Direction de l'exploitation et de l'entretien routier
Secondary or regional roads Ministère de l'Equipement, Direction de l'exploitation et de l'entretien routier
Other roads Ministère de l'Equipement, Direction de l'exploitation et de l'entretien routier
Sources: IRF World Road Statistics 2015; Road Revenues - Questionnaire WRS; Economic and demographic information WDI - World Bank.
Enhancing Road Maintenance In the OIC Member Countries
134
TURKEY latest data (2000-2013)
Year 2013
Population 74,932,641
GNI per capita ($) 10,970
Surface (Km2) 783,560
Year 2013
Motorways (Km) 2127
Highways, main or national roads (Km) 31,341
Secondary or regional roads (Km) 32,155
Other roads (Km) 323,043
Total length of roads (Km) 388,666
Paved roads (%) 91
Paved roads (Km) 355,220
Non-paved roads (Km) 33,446
Length of roads by GDP per capita (Km/$)
35
Density of roads (Km/Km2) 0.50
Year 2013
Traffic volume (Mio Veh-Km) 99,431
Year 2013
Inland freight transport (Mio T-Km) 235,225
Inland passenger transport (Mio P-Km) 271,953
Road freight transport (Mio T-Km) 224,048
Road passenger transport (Mio P-Km) 268,178
Year 2013
Persons Killed / 100,000 population 5
Persons Injured /100,000 population 367
Injury accidents /100,000 population 215
Injury accidents / 100 Million Veh-Km 162
Year 2013
Government expenditures (Mio USD)
Central 6581.69
Regional/Local
Private sector expenditures (Mio USD)
Total expenditures (Mio USD) 6581.69
Investment expenditures (Mio USD) 5785.06
Maintenance expenditures (Mio USD) 796.64
Other expenditures (Mio USD)
Year 2013
Road Revenues (Mio USD)
Indirect: Fuel Tax
Direct: Toll 449.60
Others
Total revenues (Mio USD) 449.60
Authority in charge of Road Management GD of Highways
Management structure of Road Network
Motorways GD of Highways
Highways, main or national roads GD of Highways
Secondary or regional roads GD of Highways
Other roads Provincial Special Administrations, The Ministry of Forest and municipalities
Sources: IRF World Road Statistics 2015; Road Revenues - Questionnaire WRS; Economic and demographic information WDI - World Bank.
Enhancing Road Maintenance In the OIC Member Countries
135
TURKMENISTAN latest data (2000-2013)
Year 2013
Population 5,240,072
GNI per capita ($) 6,880
Surface (Km2) 488,100
Year 2000
Motorways (Km)
Highways, main or national roads (Km)
Secondary or regional roads (Km)
Other roads (Km)
Total length of roads (Km) 24,000
Paved roads (%) 81
Paved roads (Km) 19,488
Non-paved roads (Km) 4,512
Length of roads by GDP per capita (Km/$) 37
Density of roads (Km/Km2) 0.05
Year
Traffic volume (Mio Veh-Km)
Year
Inland freight transport (Mio T-Km)
Inland passenger transport (Mio P-Km)
Road freight transport (Mio T-Km)
Road passenger transport (Mio P-Km)
Year 2006
Persons Killed / 100,000 population 14
Persons Injured /100,000 population 33
Injury accidents /100,000 population
Injury accidents / 100 Million Veh-Km
Year
Government expenditures (Mio USD)
Central
Regional/Local
Private sector expenditures (Mio USD)
Total expenditures (Mio USD)
Investment expenditures (Mio USD)
Maintenance expenditures (Mio USD)
Other expenditures (Mio USD)
Year
Road Revenues (Mio USD)
Indirect: Fuel Tax
Direct: Toll
Others
Total revenues (Mio USD)
Authority in charge of Road Management
Management structure of Road Network
Motorways
Highways, main or national roads
Secondary or regional roads
Other roads Sources: IRF World Road Statistics 2015; Road Revenues - Questionnaire WRS; Economic and demographic information WDI - World Bank.
Enhancing Road Maintenance In the OIC Member Countries
136
UGANDA latest data (2000-2013)
Year 2013
Population 37,578,876
GNI per capita ($) 550
Surface (Km2) 241,550
Year 2003
Motorways (Km) 0
Highways, main or national roads (Km) 13,620
Secondary or regional roads (Km) 27,126
Other roads (Km) 30,000
Total length of roads (Km) 70,746
Paved roads (%) 23
Paved roads (Km) 16,272
Non-paved roads (Km) 54,474
Length of roads by GDP per capita (Km/$) 300
Density of roads (Km/Km2) 0.29
Year
Traffic volume (Mio Veh-Km)
Year
Inland freight transport (Mio T-Km)
Inland passenger transport (Mio P-Km)
Road freight transport (Mio T-Km)
Road passenger transport (Mio P-Km)
Year 2012
Persons Killed / 100,000 population 9
Persons Injured /100,000 population 41
Injury accidents /100,000 population
Injury accidents / 100 Million Veh-Km
Year
Government expenditures (Mio USD)
Central
Regional/Local
Private sector expenditures (Mio USD)
Total expenditures (Mio USD)
Investment expenditures (Mio USD)
Maintenance expenditures (Mio USD)
Other expenditures (Mio USD)
Year
Road Revenues (Mio USD)
Indirect: Fuel Tax
Direct: Toll
Others
Total revenues (Mio USD)
Authority in charge of Road Management
Management structure of Road Network
Motorways
Highways, main or national roads
Secondary or regional roads
Other roads Sources: IRF World Road Statistics 2015; Road Revenues - Questionnaire WRS; Economic and demographic information WDI - World Bank.
Enhancing Road Maintenance In the OIC Member Countries
137
UNITED ARAB EMIRATES latest data (2000-2013)
Year 2013
Population 9,346,129
GNI per capita ($)
Surface (Km2) 83,600
Year 2008
Motorways (Km)
Highways, main or national roads (Km)
Secondary or regional roads (Km)
Other roads (Km)
Total length of roads (Km) 4,080
Paved roads (%)* 100
Paved roads (Km)* 1,088
Non-paved roads (Km)* 0
Length of roads by GDP per capita (Km/$) 0.1
Density of roads (Km/Km2) 0.05
Year
Traffic volume (Mio Veh-Km)
Year
Inland freight transport (Mio T-Km)
Inland passenger transport (Mio P-Km)
Road freight transport (Mio T-Km)
Road passenger transport (Mio P-Km)
Year 2007
Persons Killed / 100,000 population 18
Persons Injured /100,000 population 188
Injury accidents /100,000 population 152
Injury accidents / 100 Million Veh-Km
Year
Government expenditures (Mio USD)
Central
Regional/Local
Private sector expenditures (Mio USD)
Total expenditures (Mio USD)
Investment expenditures (Mio USD)
Maintenance expenditures (Mio USD)
Other expenditures (Mio USD)
Year
Road Revenues (Mio USD)
Indirect: Fuel Tax
Direct: Toll
Others
Total revenues (Mio USD)
Authority in charge of Road Management
Management structure of Road Network
Motorways
Highways, main or national roads
Secondary or regional roads
Other roads Sources: IRF World Road Statistics 2015; Road Revenues - Questionnaire WRS; Economic and demographic information WDI - World Bank. * Latest % of paved road information (2000), total road network 1,088 Km.
Enhancing Road Maintenance In the OIC Member Countries
138
UZBEKISTAN latest data (2000-2013)
Year 2013
Population 30,241,100
GNI per capita ($) 1,880
Surface (Km2) 447,400
Year 2000
Motorways (Km)
Highways, main or national roads (Km)
Secondary or regional roads (Km)
Other roads (Km)
Total length of roads (Km) 81,600
Paved roads (%) 87
Paved roads (Km) 71,237
Non-paved roads (Km) 10,363
Length of roads by GDP per capita (Km/$) 146
Density of roads (Km/Km2) 0.18
Year
Traffic volume (Mio Veh-Km)
Year 2011
Inland freight transport (Mio T-Km) 48,583
Inland passenger transport (Mio P-Km) 75,585
Road freight transport (Mio T-Km) 26,050
Road passenger transport (Mio P-Km) 72,545
Year 2006
Persons Killed / 100,000 population 8
Persons Injured /100,000 population
Injury accidents /100,000 population
Injury accidents / 100 Million Veh-Km
Year
Government expenditures (Mio USD)
Central
Regional/Local
Private sector expenditures (Mio USD)
Total expenditures (Mio USD)
Investment expenditures (Mio USD)
Maintenance expenditures (Mio USD)
Other expenditures (Mio USD)
Year
Road Revenues (Mio USD)
Indirect: Fuel Tax
Direct: Toll
Others
Total revenues (Mio USD)
Authority in charge of Road Management
Management structure of Road Network
Motorways
Highways, main or national roads
Secondary or regional roads
Other roads Sources: IRF World Road Statistics 2015; Road Revenues - Questionnaire WRS; Economic and demographic information WDI - World Bank.
Enhancing Road Maintenance In the OIC Member Countries
139
YEMEN latest data (2000-2013)
Year 2013
Population 24,407,381
GNI per capita ($) 1,330
Surface (Km2) 527,970
Year 2005
Motorways (Km)
Highways, main or national roads (Km)
Secondary or regional roads (Km)
Other roads (Km)
Total length of roads (Km) 71,300
Paved roads (%) 9
Paved roads (Km) 6,203
Non-paved roads (Km) 65,097
Length of roads by GDP per capita (Km/$) 86
Density of roads (Km/Km2) 0.14
Year
Traffic volume (Mio Veh-Km)
Year
Inland freight transport (Mio T-Km)
Inland passenger transport (Mio P-Km)
Road freight transport (Mio T-Km)
Road passenger transport (Mio P-Km)
Year 2013
Persons Killed / 100,000 population 10
Persons Injured /100,000 population 52
Injury accidents /100,000 population 37
Injury accidents / 100 Million Veh-Km
Year
Government expenditures (Mio USD)
Central
Regional/Local
Private sector expenditures (Mio USD)
Total expenditures (Mio USD)
Investment expenditures (Mio USD)
Maintenance expenditures (Mio USD)
Other expenditures (Mio USD)
Year
Road Revenues (Mio USD)
Indirect: Fuel Tax
Direct: Toll
Others
Total revenues (Mio USD)
Authority in charge of Road Management
Management structure of Road Network
Motorways
Highways, main or national roads
Secondary or regional roads
Other roads Sources: IRF World Road Statistics 2015; Road Revenues - Questionnaire WRS; Economic and demographic information WDI - World Bank.