Education Journal 2017; 6(1): 5-21 http://www.sciencepublishinggroup.com/j/edu doi: 10.11648/j.edu.20170601.12 ISSN: 2327-2600 (Print); ISSN: 2327-2619 (Online) Enhancing Secondary School Students’ Understanding of Descriptive Statistics Using a Modeling Instructional Approach Mulugeta Woldemicheal Gebresenbet 1 , Mulugeta Atnafu Ayele 2 1 Department of Mathematics, College of Science, Dire Dawa University, Dire Dawa, Ethiopia 2 Department of Science & Mathematics Education, Addis Ababa University, Addis Ababa, Ethiopia Email address: [email protected] (M. W. Gebresenbet), [email protected] (M. A. Ayele) To cite this article: Mulugeta Woldemicheal Gebresenbet, Mulugeta Atnafu Ayele. Enhancing Secondary School Students’ Understanding of Descriptive Statistics Using a Modeling Instructional Approach. Education Journal. Vol. 6, No. 1, 2017, pp. 5-21. doi: 10.11648/j.edu.20170601.12 Received: October 12, 2016; Accepted: October 27, 2016; Published: January 10, 2017 Abstract: The purpose of this study is to explain how secondary students can enhance their understanding of descriptive statistics using Modeling Approach and to what extent do students improve their achievement of procedural and conceptual understanding in descriptive statistics using Modeling Instructional Approach. The study was conducted at two secondary schools in urban district in West Oromia Zone, Ethiopia. For comparisons, four grade nine sections with a total of 163 students were selected by purposive sampling technique. Quality Assurance Guide instrument was used to assess students’ models on Model Eliciting Activities (MEA). Standard questions were used for achievement tests on procedural and conceptual understanding of descriptive statistics. The quantitative data of the study was analyzed using descriptive statistics, and independent t-test. The qualitative data of the study was analyzed using thematic and content analyses. The findings of this study are: though students found MEAs cognitively challenging tasks, they constructed different models working in a team collaboratively. The study showed students more likely can enhance their critical understanding of descriptive statistics and gain modeling experiences working on relevant non-routine tasks like MEAs and doing project on their own themes. Also a statistically significant difference was found on conceptual understanding achievement test with medium effect size using Modeling Approach, but no statistical significant difference was found on procedural understanding achievement test except female comparison. The findings of this study suggested students more likely enhanced their understanding of descriptive statistics using Modeling Approach. Keywords: Descriptive Statistics, Non-Routine Problems, Model-Eliciting Activities, Understanding, Achievement 1. Introduction Modeling, as an alternative for problem solving, is getting recognition in Mathematics Education for advancing students’ understanding of a concept. However, research studies are needed on how to incorporate modeling problems in an education system so as to enhance students’ understanding of concepts and thereby improve students’ achievements. Therefore, in this study, teaching statistics using Modeling Approach, which establishes the problem leading to the study, is discussed. The background of the study, theoretical framework and modeling research, statement of the problem, objective and research question of the study, significance of the study, and delimitations of the study are described. 1.1. Background of the Study Teaching through problem solving considers problem solving as integral to the development of an understanding of any given mathematical content and process [1]. It is different from the practice of teaching for problem solving which deals with solving problems using the already taught concepts. It also differs from teaching about problem solving which deals with problem solving heuristics and strategies. A Modeling Approach in the study integrates Contextual and Socio-critical Modeling Perspectives for teaching statistics through problem solving and, therefore; justifies the statistics rather than treating it as a means to an end.
Transcript
Education Journal 2017; 6(1): 5-21
http://www.sciencepublishinggroup.com/j/edu
doi: 10.11648/j.edu.20170601.12
ISSN: 2327-2600 (Print); ISSN: 2327-2619 (Online)
Enhancing Secondary School Students’ Understanding of Descriptive Statistics Using a Modeling Instructional Approach
1Department of Mathematics, College of Science, Dire Dawa University, Dire Dawa, Ethiopia 2Department of Science & Mathematics Education, Addis Ababa University, Addis Ababa, Ethiopia
Modeling, as an alternative for problem solving, is getting
recognition in Mathematics Education for advancing
students’ understanding of a concept. However, research
studies are needed on how to incorporate modeling problems
in an education system so as to enhance students’
understanding of concepts and thereby improve students’
achievements. Therefore, in this study, teaching statistics
using Modeling Approach, which establishes the problem
leading to the study, is discussed. The background of the
study, theoretical framework and modeling research,
statement of the problem, objective and research question of
the study, significance of the study, and delimitations of the
study are described.
1.1. Background of the Study
Teaching through problem solving considers problem
solving as integral to the development of an understanding of
any given mathematical content and process [1]. It is
different from the practice of teaching for problem solving
which deals with solving problems using the already taught
concepts. It also differs from teaching about problem solving
which deals with problem solving heuristics and strategies. A
Modeling Approach in the study integrates Contextual and
Socio-critical Modeling Perspectives for teaching statistics
through problem solving and, therefore; justifies the statistics
rather than treating it as a means to an end.
6 Mulugeta Woldemicheal Gebresenbet and Mulugeta Atnafu Ayele: Enhancing Secondary School Students’ Understanding of Descriptive Statistics Using a Modeling Instructional Approach
Modeling problems could help enhancing students’ critical
understanding to deal with problems of socio-cultural and
environmental complex systems [2]. How far problems in
textbooks contribute for critical literacy aim and how
teachers utilize such problems that could promote critical
understanding is an under researched area in mathematics
education [3]. What remains to be explored is to study on
mathematical or statistical modeling as a critical tool for
enhancing students’ critical understanding of mathematics or
statistics [4].
Specifically, across all walks of life, statistics is essential
for understanding the world and serves as a critical tool for
solving socio-cultural problems. For example, the modeling
ability to interpret, describe, and explain data and
communicate results of data analysis is crucial in day to day
life [5]. One way to promote statistical reasoning is through
data modeling [6]. However, there are very few studies that
promote students’ statistical thinking and reasoning at school
using data modeling [1, 7]. According to Sriraman and
English [8], the issue of enhancing students’ statistical
reasoning through data modeling requires ‘substantial
research’.
If students gain the habit of working on statistical
problems using models of representation systems, then
models as thinking tools will help students to develop
statistical reasoning and problem solving abilities. Cobb [9]
argues that, “Data sets are concrete, statistical models are
abstracts, and every instant of modeling is an instance of
abstraction-as a process”. However, surprisingly, there is
little research on models and modeling in Statistics Education
[10].
A major goal of mathematics education in Ethiopia is to
develop problem-solving abilities of students in socio-
cultural context of their everyday life which is stated in
different official documents [11, 12]. Descriptive statistics is
part of Ethiopian secondary school mathematics curriculum
with the aim of teaching students for developing foundational
concepts of statistics to solve problems related with ‘every
bit of students’ everyday life’ [13].
The percentages of exercises and word problems tasks in
statistics unit in Ethiopian Grade Nine mathematics textbook
are 68% and 27% respectively. Although Ethiopian education
policy and documents on mathematical curriculum
recommend that there should be relevant problem solving
activities on socio-cultural issues, the percentage of statistical
problem solving tasks (4%) in Grade Nine textbook is very
low and non-routine statistical problem solving tasks are
almost non-existent. Researchers have indicated that
covering the text book is the most common teaching practice
in Ethiopia instead of engaging students with rich problem-
solving tasks [14]. This may lead teachers to use simple
textbooks problems, and as a result students couldn’t develop
cognitive abilities to solve problems in novel situations.
1.2. Theoretical Framework and Modeling Research
1.2.1. Contextual Modeling Perspective
It is for the purpose of motivating students in mathematics
activities using real life problems and for developing their
strategic competence to solve real world problems brought
modeling come into existence in schools [15]. Because
modeling activities starts from meaningful real life situations,
students could develop positive dispositions towards the
subject. Contextual Modeling also known as Models and
Modeling Perspective established as theoretical perspective
from research studies that have been done for more than three
decades by Lesh and his colleagues [16, 17]. It blends two
important, but separate research traditions in mathematics
education: problem solving and conceptual development.
That means, students would enhance their understanding of a
concept as they solve modeling problems simultaneously. In
this research the use of the term “mathematics” found in and
referred to in Contextual and Socio-critical Modeling
Perspectives literature includes statistics.
Theoretical perspectives for Contextual Modeling
Perspective research begin their roots from the perspectives
of Piaget, Vygotsky and American Pragmatists such as
William James, Charles Sanders Peirce, Oliver Wendell
Holmes, George Herbert Mead, and John Dewey [18]. It is
taken as a framework for developing models of students’
modeling. A model in this perspective is defined as “a system
of describing or (explaining, or designing) another system(s)
for clearly specified purpose [19].”
Like Piaget, the perspective focuses on the development of
elementary but deep cognitive structures with holistic
characteristics that are not derived from characteristics of
constituent parts [20]. It considers mathematics as the study
of structures and the conceptual systems are with-in or
between concept systems [21]. In Models and Modeling
Perspective, conceptual development is far more piecemeal
and situated than Pigetians suggest. It considers the term
‘decalage’ that Piaget used for ladder like a sequence of
development stages from concrete to abstract understanding
as fuzzy, poorly differentiated which occurs along a variety
of dimensions: concrete-abstract, simple-complex, situated-
students learning by putting them in situations where they
express their current ways of thinking in forms that will be
tested and revised in directions of increasing power without
introducing the concepts as if they are new ideas following
some other idea [16]. For instance, to teach the
interconnected concepts like center, variability and
distributions in descriptive statistics, it considers most
students could be at intermediate stage of development for
such concepts that it may not be good to teach them
sequentially like ‘topic-topic-topic’ approach. A central goal
of the perspective is to facilitate students’ development and
refinement of their own abilities to interpret situations
mathematically (statistically).
Statistical concepts in descriptive statistics are difficult to
learn because they are abstract [10]. So it would be possible
to teach students by creating a learning situation through
multiple dimensions of model development. For example, to
Education Journal 2017; 6(1): 5-21 7
learn about the statistical concept of mean, students could
start from their own intuitive definitions, work on concrete
activities like post-it note activities considering mean as a
balance point, discussing its meaning on a media article and
on textbooks and so on.
In Contextual Modeling Perspective models could be
expressed in external representation systems and they could
be outside the mind. This is the case where it obviously
differs from constructivism [22]. The perspective recognize
that the only way that anybody can have access to another
person’s internal conceptual system is when they are
expressed using some expressed media or representation
systems [16].
1.2.2. Modeling Research
There were only a few studies conducted on models and
modeling processes in Statistics Education [10], but some
studies using MEAs had been conducted and the relevant
studies related to statistics education would be reviewed to
answer the review question. The research background on the
effectiveness of MEAs built on five areas: research on the
use of MEAs in Science, Technology, Engineering and
mathematics (STEM) areas which includes statistics;
invention to learn activities and research on gifted education;
the role of prior knowledge; and research on problem-based
learning research on equity education.
MEAs possess specific qualities that ask students to
engage in multiple iterations to solve the problem similar to
the engineering design process [5]. The process of creating
and refining multiple iterations of the models has been
referred to as the process of, ‘express, test, and revise’ [23] in
an attempt to seek a highly refined mathematical model.
Magiera [24] argued that MEAs have provided problem-
solving experiences that help a wide range of mathematical
expertise that creates problem solvers, innovators, inventors,
self motivation and self reliance, logical thinkers,
technological literacy which supports the goal of STEM.
Researchers had found dramatic and positive results using
MEAs in STEM education at different school levels [25, 1,
26, 27].
Statistics Education research studies had indicated that
MEAs promote statistical reasoning and thinking at upper
primary and at introductory statistics courses. By considering
a real world problem, a set of data, the need for a solution,
students would experience the statistical enquiry cycle [28]
as they solve MEAs problems. Doer and English [29]
investigated students at primary were able to create
generalizable and reusable systems or models for selecting,
ranking, and weighting data.
To offer students statistical problem solving based on real
data Garfield, delMas and Zieffler [30] showed how to
develop MEAs funded by the CATALST (Change Agents for
Teaching and Learning Statistics) project. Noll, Gebresenbet
and Glover [31], using CATALST curriculum that involve
MEAs, explored various ways to support students’ thinking
and to help them answer informal statistical inference
questions in introductory statistics using dynamic statistical
software. MEAs have recently been shown to be effective in
statistics education for catalyzing group discourse during
cooperative learning [32, 33].
Cognitive researcher had found that students’ prior
knowledge and institution had conflict with new learning
[34]. Research suggested that the need for learning activities
that help students work through inconsistencies in their prior
knowledge and intuitions while at the same time building the
scaffolding for future learning [34]. MEAs have been
designed explicitly to reveal and test students’ intuition and
prior knowledge while at the same time providing for
extensions, revision, integration of these ideas to develop a
foundation for more abstract, formal ways of understanding
[35].
MEAs are primarily used to investigate students’ thinking
and hold great potential in situation in which other
assessment techniques fall short; a huge void is left in
understanding why students come up with the answers that
they do [5]. MEAs are typically used to ‘plow the field’ so
that seeds of learning more formal content may be planted
[30]. Researchers recommended that MEAs provides a richer
set of assessment data [5, 17].
1.3. Statement of the Problem
According to Word Bank report [36], the quality of
learning outcomes in developing countries has been poor.
Ethiopia, one of the developing countries, has conducted four
round national learning assessments on key subjects that
includes mathematics in 2010 and 2013 for grade 10 and 12
students. Both the two assessments have showed that
secondary students’ average achievement scores in
mathematics were found to be low; and most students in
secondary grade could not score at least 50% in mathematics
[37, 38].
Traditionally, statistical curricula follow ‘linear and
hierarchical approach’ to teach students foundational
statistics concepts adopting from the formalist mathematics
culture [39]. For example, many students are taught about
data distribution, measure of center, and variation
sequentially on how to construct them rather than how to use
them to think with data.
Modeling needs to be integrated within all topic areas
across the mathematics curriculum, and, there is a need,
across disciplines [1, 40]. There is, however, a limited
research on how to integrate other disciplines within
mathematics curriculum which can be done through
modeling instruction [1, 26]. Modeling, as an alternative for
problem solving, is getting recognition in Mathematics
Education for advancing students’ understanding of a concept
[8]. However, research studies are needed on how to
incorporate modeling problems in an education system so as
to enhance students’ understanding of concepts and thereby
improve students’ achievements [20]; and little is known
about Socio-critical Modeling that uses mathematics or
statistics as a critical tool for analyzing and solving socio-
cultural problems [3].
The more teachers incorporate and implement relevant
8 Mulugeta Woldemicheal Gebresenbet and Mulugeta Atnafu Ayele: Enhancing Secondary School Students’ Understanding of Descriptive Statistics Using a Modeling Instructional Approach
non-routine real-world problems within the curriculum, the
better their chances of enhancing secondary students’
understanding of descriptive statistics by giving them an
opportunity to develop their sense making and explain their
reasoning iteratively. Using Modeling Approach, student
could construct, revise and refine models; and they may
enhance their understanding of descriptive statistics and
apply statistics as a critical tool with positive attitude to solve
problems in socio-cultural problems.
1.4. Objectives of the Study
The major objective of this study is to explain how
secondary students can enhance their understanding of
descriptive statistics using Modeling Approach and to what
extent do students improve their achievement procedural and
conceptual understanding in descriptive statistics using
Modeling Instructional Approach. The specific objectives of
the study were:
To explain how secondary students can enhance their
understanding of descriptive statistics using Modeling
Approach
To assess the extent of secondary students improve their
achievement of procedural and conceptual understanding in
descriptive statistics using Modeling Instructional Approach
1.5. Research Questions
Based on the above objectives the following research
questions are tested in the study.
1. How secondary students can enhance their
understanding of descriptive statistics using Modeling
Approach?
2. There is no significant mean scores difference between
students who have learnt using Modeling and Non-
modeling Approach on achievement of pretest, posttest,
procedural and conceptual understanding of descriptive
statistics.
1.6. Significance of the Study
A study of the Modeling Approach to teach statistics is
important for several reasons. First, it helps to lay the ground
for further similar empirical studies across different school
settings and populations on how to enhance students’
understanding of descriptive statistics. Second, it serves as a
basis for further effectiveness and large scale studies for
teaching statistics using Modeling Approach. Third, the study
will show research directions on how to design curriculum
using transformative modeling framework in order to teach
students with social justice aim using statistics as a critical
tool. Fourth, it will help teachers as a heuristic devise on how
to prepare and implement relevant non-routine problem
solving tasks like MEAs. Fifth, the study will provide
directions on aspects of professional development that have
to be given for teachers for teaching statistics in secondary
schools. Finally, it will serve as an available asset for policy
decision makers, curriculum developer, and assessment
builders on how to include relevant non-routine problem
solving tasks in an education system.
1.7. Delimitations of the Study
This study is conducted in under-privileged urban
secondary schools setting in West Oromia Zone in Ethiopia.
It focuses on one statistics unit that contains descriptive
statistics lessons. The descriptive statistics deals with basic
ideas of data, distribution, center and variability. The study
site is delimited to one district in two governmental
secondary schools in non-technological school learning
environment except the use of calculators, post it notes and
plastic meters.
1.8. Structure of the Study
This study covers five main topics. The first topic
introduced the background of the study, theoretical
framework and modeling research, statement of the problem,
objective and research question of the study, significance of
the study, and delimitations of the study. The second topic
establishes the study’s materials and methods and provides
research approach and design and a rationale for using
transformative embedded mixed method research, the
sampling techniques and participants, instructional design for
the modeling approach, instruments of data collection,
validity and reliability of the instruments and data analysis.
The third topic presents and discusses on Modeling Approach
intervention based on classroom observation and students’
reports on MEAs. Then, this topic presents and discusses on
students’ achievements based on quantitative students’ scores
data on procedural and conceptual understanding
achievement tests of descriptive statistics. The fourth topic
discusses on the general findings of qualitative and
quantitative data towards answering the leading research
question in the study. The fifth topic ends with conclusions
and recommendations of the study for research and practice.
2. Materials and Methods
This topic presents the research approach and methods
used to investigate secondary students’ understanding of
descriptive statistics using Modeling Approach. A
transformative embedded mixed design in a pragmatism
paradigm underpinned this study. To answer the research
questions and to test the hypotheses, a transformative
embedded mixed research design with lens of two modeling
perspectives were used.
2.1. Research Approach and Design
The research problems of this study led a transformative
embedded mixed method approach both quantitative and
qualitative forms to be utilized [41]. The rationale for
choosing the research approach was the nature of the mixed
research question; that is, to what extent and how students’
enhance their understanding of descriptive statistics using
Modeling Approach. To investigate to what extent and how
students’ enhance their understanding of descriptive statistics
Education Journal 2017; 6(1): 5-21 9
using Modeling Approach may be complex at classroom
level which involves intertwined understanding strands that
may require simplification of discrete variables and more
holistic qualitative approach.
The transformative embedded mixed design in this study
used quasi-experimental design for collecting quantitative
data using achievement tests. The rationale for using quasi-
experimental design is to compare the effect of teaching
approaches in the natural school setting, not by assigning
students to random or equated groups but by following
students in groups formed by their schools and using
statistical methods to control for prior achievement [42]. To
test the research hypothesis, the quasi-experimental design
used in this study is known as non-equivalent control group
pretest and posttest design as shown below.
Experimental Group: NR O1 X O2
Control Group: NR O1 O2
In this design, NR represents non-randomization, O1
represents pretest, X represent the treatment implemented,
and O2 represent the posttest [43]. For explaining the
intervention (the Modeling Approach), case study design was
used based on the data that included students’ solution
artifacts on MEAs. The case study used was explanatory type
to answer the how research questions on students’
understanding of descriptive statistics using Modeling
Approach [44]. The unit of analysis in this study was
classroom practices of Modeling Approach, teams of students
who participated on the intervention to investigate how
students’ enhance their understanding of descriptive statistics.
Besides, means of students’ achievement scores on
procedural and conceptual understanding were compared.
2.2. Sampling Techniques and Participants
This study was conducted at West Oromia Region schools
(School A and School B; pseudonyms) in Ethiopia based on
grade 9 secondary mathematics school curriculum which had
one unit of descriptive statistics with 22 period allotments. From
the two high schools, 163 students participated in this study
from four grade 9 sections. Two teachers were selected one from
school A, and the other from school B based on their willingness
to participate in the research, and then two non-equivalent intact
grade 9 classes from each school taught by the selected teacher
were selected. The sampling method used to select the four
classes for the quasi-experimental design was purposive
sampling because the method would allow creating intact
classroom group for the quasi experimental design. Lottery
method was used to assign classes for Modeling and Non-
modeling Approaches in the two schools. In both schools, one
class of students was taught using Modeling Instructional
Approach and the other as a comparison class was taught using
Non-Modeling Instructional Approach.
2.3. Instructional Design for the Modeling Approach
Three MEAs were designed for this study as described in
Table 1 based on the six principles of constructing MEAs
[16] with other statistical activities using representations
systems. The MEAs had four main components: newspaper
article, readiness or warm up questions, data table, and a
problem statement. Each component serves a valid purpose
and used to engage problem solvers in the task [45].
Table 1. Descriptions of the four Model Eliciting Activities.
Title of MEA Problem Context Statistical Concept Objectives with Social Agency
Safe-Water
Students are asked to write a report based on 20 households data
to give an awareness program for rural people how to drink safe
water and keep their environment sanitation and hygiene.
Different graphs, distribution,
average, little or a lot
variability
To provide awareness on health
and sanitation problems
Millennium
Dam
Students are asked to write a report based on three grade 9
sections of students’ data on the contribution of money to
Ethiopian Millennium dam which is going to be sent by the
director for the news agency.
Outliers, measure of centers
(mean, median and mode)
Range
Empower students on their
contribution for developing their
identity
Tourist
Students are asked to give reliable information based on the
weather data of five tourist sites on what to eat, cloth and shoes
to wear.
Distribution , measure of
center, measure of variation
Use variability in everyday life like
knowing variability of weather
conditions
The purpose of the newspaper was to familiarize students
with the context of the problem and to develop their statistical
literacy. This article required 15 minutes or so to read and
provide further information for the second part of MEAs. The
second part of an MEA was readiness questions or warm-up
questions. These questions were designed to evaluate their
understanding of their reading and basic statistical literacy
ability of the media article. The third part of MEA was a
problem statement which required students pose and solve
problems on the socio-cultural problem situations. The fourth
part of an MEA was usually a data table that may be used to
solve the problem. After finishing the MEA, there would be
other follow up activities that used system of representations
and MEA extension problems. For example, in Safe-Water
MEA students were introduce other graphs from simple graph
type dot plot to histogram and how to interpret by comparing
distribution of various graphs. Then, as assignment students
wrote a report for Ministry of Water and Energy on Safe-Water
MEA based on their own data and got feedback on the
structural similarity of the pervious client report on Safe-Water
MEA. Students were expected to use the newly introduced
representation systems in the MEA extension problem.
2.4. Instruments of Data Collection
2.4.1. Probing Work-Sheet for MEAs
Based on the modeling cycle, a worksheet with the
10 Mulugeta Woldemicheal Gebresenbet and Mulugeta Atnafu Ayele: Enhancing Secondary School Students’ Understanding of Descriptive Statistics Using a Modeling Instructional Approach
following probing questions were prepared and given for the
students: What is the thing that the client wants you to do for
him/her? How could you use the data using your model so
that it is meaningful for the client purpose? Could you show
how to use the statistical models to provide some solution for
the problem? What are your interpretations on the models
you made in question 3? Do you think your statistical models
enough for the client purpose and have limitations? Write
your team report/letter/news.
Quality Assurance Guide
The quality assurance Guide was designed to help
teachers, researcher and students evaluate the products that
were developed in response to the MEAs with the following
characteristics: (a) the goal is to develop conceptual tools, (b)
the client purposes are known and met, and (c) the tool must
be sharable with other people and must be useful in situations
where the data are different than those specified in the
problem as shown in Table 2.
Table 2. Quality Assurance Guide.
Performance Level How useful is the product? What might the client say?
Level one: Require Redirection
The product is on the wrong track. Working longer or harder
won’t work. The students may require some additional feedback
from the teacher.
“Start over. This won’t work. Think about it
differently. Use different ideas or procedures.
Level two: Require Major
Extensions or Refinements
The product is a good start toward meeting the client’s needs, but
a lot more work is needed to respond to all of the issues.
“You’re on the right track, but this still needs a lot
more work before it’ll be a form that’s useful.”
Level three: Requires only
Minor Editing
The product is nearly ready to be used. It still needs a few small
modifications, additions, or refinements.
“Hmmm, this is close to what I need. You just
need to add or change a few small things.”
Level four: Useful for this
Specific Data Given
No changes will be needed to meets the immediate needs of the
client.
“Ahhh, this will work well as it is, I won’t even
need to do anything”.
Level five: Sharable or
Reusable
The tool not only works for the immediate situation, but it also
would be easy for others to modify and use in similar situations
“Excellent, this tool will be easy for me to modify
or use in other similar situations-when the data are
slightly different.”
The Quality Assurance Guide was used to quantitatively
assess students’ models. The levels were designed to
categorize how well students’ solution artifacts or reports
satisfy the needs of the client and how well they explained
their reports in general way [35]. The range of response went
from level 5, where the response satisfied the needs of the
client for the current situation and for other similar situations
as well, 1, where the response were going in the wrong
direction and the team would need to rethink their reports
completely.
2.4.2. Pretest and Posttest Assessments
To investigate the extent of prior statistical knowledge
differences between Modeling and Non-modeling groups, an
assessment was designed from Ethiopian National Primary
Leaving Mathematics Examinations by selecting 15
questions related to basic statistics concepts from year 2008-
2014. This assessment which was used as a pretest contained
15 items and all were closed ended multiple choice items.
The items dealt with basic concepts of reading graphs like pie
chart, bar graphs and calculating percentage, mean, median
and mode. Two posttests assessments were used to compare
students’ procedural and conceptual understanding of
descriptive statistics after they learnt descriptive statistics
unit. The posttest on procedural understanding had been
collected from Ethiopian Secondary Leaving National
Mathematics Examination from 2008 to 2014. The test
contained 15 closed ended multiple choice items and the
questions asked were procedural questions for calculating
measure of center and measure of variation, identifying
primary and secondary data, and reading information from
bar graph. The other posttest given was on students’
conceptual understanding of descriptive statistics. The items
contained 15 closed-ended multiple choice items and selected
from the ARTIST website which includes statistical
reasoning assessment items on descriptive statistics. ARTIST
assessment items were created for assessing statistical
literacy, reasoning and thinking [10]. The researchers adopted
the ARTIST assessment items related with the conceptual
understanding of descriptive statistics.
2.5. Validity and Reliability
Content and face validity were used for this study. The
instruments were provided for experts in the field to review
the instrument and for language experts if there were any
difficulty in the language use. Finally, 10 teachers at three
schools who taught the lesson were asked to give comments
on pretest and posttests of the achievement instruments. Test
items which did not fit the purpose were dropped based on
experts and teachers comments. Test-retest reliability tests
were used to check the reliability of achievement tests on the
intervention. The students in the pilot study took the tests and
one week later took the same test again. A test-retest
reliability analysis yielded a reliability of 0.85 for
achievement pre-test, 0.71 for posttest in procedural
understanding achievement test and 0.75 for conceptual
and debriefing, negative case analysis, clarification of
researcher bias, member checking, and external audit was
used for the qualitative data.
2.6. Method of Data Analysis
Both quantitative and qualitative data collection methods
Education Journal 2017; 6(1): 5-21 11
administered during and after the implementation of the
Modeling instruction. The source of data for the research was
students’ reports on the four MEAs and achievement tests.
Content analysis of teams of students’ models on the four
MEAs was made using Quality Assurance Guide. Descriptive
statistics such as means and standard deviations of pretests
and posttests students’ scores were reported. Data on
achievement tests on procedural and conceptual
understanding of descriptive statistics were analyzed using t-
test based on the statistical assumptions.
3. Results
The result is on Modeling Approach intervention based on
students’ models on the MEAs with follow up activities to
answer the research question on how students enhance their
understanding of descriptive statistics using Modeling
Approach.
3.1. Students’ Models for MEAs
3.1.1. Students’ Models for Safe-Wate MEA
For safe-water MEA a newspaper article with title
‘ETHIOPIA: Safe water - a glass half full’ is given as a
reading homework to students. For the next class readiness or
warm up questions were given for discussion like: How is
water treated in your family? Do you drink tap water, boiled
water, spring water or rain water? How many glasses of
water do you drink per day in average? Explain. Have you
ever seen or heard about how Ethiopian rural people fetch
and treat drinking water? What do you think children under
the age of 5 are much more vulnerable for water born
diseases? Next students were introduced different types of
graphs and interpreted by comparing distribution of various
graphs. Finally, students were given a data table on
‘Demography and background information for 20 families’
households’ and asked to write the report and prepare the
posters. Therefore, below are the responses of students’
model at different levels.
a) Students’ Models at Level 1: Safe-Water MEA: Two
teams of students were at level 1on Safe-Water MEA. The
reports were unrelated to the clients’ needs and did not fit the
purpose of the task. For example, one team of students drew
the bar graph as shown in Figure 1 and a report. First, they
drew the bar graph putting on the x-axis the name of the
representative of the 20 householders. Then, they drew the
annual income of householders in thousands on the y-axis.
The report and a bar graph presented by the team of the
students’ model on Safe-Water MEA at Level 1 were as
follows.
Report: Dear Ladies and Gentlemen, today we will give
you an awareness program on keeping the sanitation of
latrine houses. We have drawn a bar graph with the
income of family in thousand birr and the number of
children whose age are greater than or equal to the age of
5 years old. From the graph, we see that a family with 22
thousand birr income has 4 children, a family with 15
thousand birr income has again 4 children and a family
who has 40 thousand birr income has 5 children and so on.
Each family has better income and at least has 2 children
at home. Thus, a family should keep the latrine clean
together and should not use open deification and wash
hands after going to latrine house. We thank you for your
attention!
Name of Family representative
Figure 1. Team of students’ model on Safe-Water MEA at Level 1.
They tried to modify the graph putting the income of
householders on the x-axis and the number of children on the
y-axis. But, they couldn’t justify why they drew the graph. In
addition, the report merely included little data from the
provided data table and partial data was used for the bar
graph. The report needs a complete redirection.
b) Students’ Models at Level 2: Safe-Water MEA:
Seven teams’ of students were at this level. One team of
students’ drew pie chart on drinking water sources and
histogram on the number of families whose age was
greater or equal to 5 as shown in Figure 2. The team drew
a histogram with the bars overlapping, but the variable on
the x-axis was a discrete variable. The team showed
meaningful interpretation, though they selected only two
variables. The work was on the right direction, but it
needs adjustment to satisfy the clients’ needs. The team
had to redraw the histogram by labeling the axis and
making the bars non-overlapping. The report and a
histogram presented by the team of the students’ model on
Safe-Water MEA at Level 2 were given below.
Report: Good morning! Today, we will see how to treat
drinking water in a family. Based on our data as shown in
the pie chart, for 20 householder families 40% of drinking
water source is protected well, 35% -borehole, 15% -
spring and 10% comes from rain water. The histogram has
also showed the number of family members whose age is
greater or equal to 5. There are 3 householders who have 2
family members, 6 householders who have 3 family
members, 5 house holders have 4 family members and
another 5 householders have 5 members and one
householder have the maximum number of family
members which is 6. Dear families, the water you drink is
not well treated which causes many water born diseases
like typhoid and typhus. We should first boil the water and
then cool it for drinking purpose. Every family member
should feel responsible for keeping the water safe. We
thank you for listening!
12 Mulugeta Woldemicheal Gebresenbet and Mulugeta Atnafu Ayele: Enhancing Secondary School Students’ Understanding of Descriptive Statistics Using a Modeling Instructional Approach
Figure 2. Team of students’ model on Safe-Water MEA at Level 2.
c) Students’ Models at Level 3: Safe-Water MEA: Nine
teams of students were at level 3. Teams of students’ reports
at this level were closely ready to give an awareness program
on safe drinking water, but the reports needs some
modifications. Among these teams of students, one team of
students prepared a report on safe drinking water on how to
wash hands after using a latrine as shown in Figure 3. The
two bar graphs and the pie charts were appropriate and
visible except they need titles. The interpretations on the
graphs were correct and used more than three variables
unlike the students’ models at Level 2. The report and a
histogram presented by the team of the students’ model on
Safe-Water MEA at Level 3 were given below.
Report: Welcome! How are you? We are going to discuss
with you on keeping our environment sanitation and on how
to give our children safe drinking water based on data and
graphs. As the graph shows, out of 20 householders’ in our
rural community, there are 8 householders who have used
protected well for drinking water source, 2 householders use
rain water, 3 from spring and 7 get from Borehole water
source. There are family members who do not wash their
hands. For example, out of 9 people 6 people do not wash
hands taking 9 householders sample from the 20
householders. This is a serious matter because 50% of
householders in the community use open defecation. Hence
based on the data we need a solution to keep our children
safe because every family have at least one child except two
householders. Children are most affected by unsafe water. We
recommend the following solution: (1) All people have to
wash their hands, and (2) All people have to save the
children. Next time we will see how to filter and treat the
water.
Figure 3. Team of students’ model on Safe-Water MEA at Level 3.
d) Students’ Models at Level 4: Safe-Water MEA: One
team of students’ was at level 4. The team wrote the report to
give an awareness program for the society. The team drew
histogram for the income of the householders for 20 families
and the income ranges from 13 thousand birr to 90 thousand
birr. They also drew bar graphs and pie charts. Then, they
made association with the area each householders had in its
compounds. They could see the paradox in that the area the
20 householders own was large and they had high incomes.
But, half of the householders with their family practiced open
deification. This was interesting, because they had created
relations among the variables looking at some data pattern.
But, the report might not be sharable or reusable if the data
provided or the context was different. The report presented
by the team of the students’ model on Safe-Water MEA at
Level 4 was given below.
Report: Dear Ladies and Gentlemen, Good morning! We
have called you to solve the problems the community have
for building the latrine and keeping our environment safe and
wash our hands. Based on our data we found that 20
householders had better income and enough area. The people
income ranges from 13 thousand birr to 90 thousand birr
yearly. It surprises us because half of them (50%) practice
open defecation and lack no latrine houses. Most of the
people use water sources like protected well (40%), borehole
(35%), spring water (15%), and rain water (10%). All of this
water sources may contain impurities and should be treated.
But, we need also to build pump water or ask the government
to get tap water service. So we need to solve the problem
together. How could we create awareness for every member
of our family young and old to wash hands? How we build
latrines in our compound? And how do we get safe drinking
water? Please, give us your comments if you have any better
options!
3.1.2. Students’ Models for Millennium Dam MEA
The second MEA is on Millennium Dam with title ‘Dams
Education Journal 2017; 6(1): 5-21 13
and hydropower in Ethiopia’ is given as a reading homework
to students and followed by readiness or warm up questions
for discussion such as: What is the average capacity of
hydropower plants commissioning before 2012? What will
be the average capacity of hydropower commissioning in
between 2012 to 2015? Compare your answer with the first
question. Which contractor has done the most hydropower
plants in Ethiopia? Which country or organization supports
Ethiopia most in constructing hydropower plants in terms of
cost? And “Poverty is our number one enemy!” Explain the
pros and cons of using hydropower plants in Ethiopia in
relation to our poverty? Next students were given a data table
on ‘the contribution made by Karamara secondary High
school students in three grade 9 sections to build the
Millennium dam which is collected by the school record
office’ and asked to write the report. Therefore, below are the
responses of students’ model at different levels.
a) Students’ Model at Level 1: Millennium Dam MEA:
Two teams of students were at this level. One team wrote the
report without meeting the client’s needs as shown below in
the report, because the director wanted a news report to be
given for a news agency based on three Grade 9 sections
money contribution for the Millennium dam. The models
needed to be done again with teacher’s feedbacks. The report
presented by the team of the students’ model on Millennium
dam at Level 1 was given below.
NEWS: Secondary Students in School A contribute money
for the Millennium Ethiopian dam by buying a bond of 2415
birr. The school director Teshome Bikila told the media that it
is not the first time for students to buy bonds for the
Millennium dam. He explained that the students’ strong
contribution will continue in the future. Some students stated
that besides their education they are ready to give support for
the country’s continuing development and be there to give
the necessary help. They said that this bond buying is one
part of ensuring the country’s development. We present the
details as we get more on the NEWS!
b) Students’ Model at Level 2: Millennium Dam MEA:
Four teams of students were at this level. One team of
students’ report included the number of the participation of
girls and boys as shown below in the news. The report did
not include other data like what were sources of money the
students got to contribute for the Millennium dam and the
age of students who made contribution. The report presented
by the team of the students’ model on Millennium dam at
Level 2 was given below.
NEWS: Here are the breaking NEWS! First the headlines!
Secondary students in school A have contributed money for
the Millennium dam. I am Alexander Fikadu, the presenter.
Stay with us! In Oromia town, students in secondary school
have supported by donating money to Ethiopia Millennium
dam. From the three sections a total of 2364 birr has been
donated and separately grade 9 section A students has
contributed 771 birr and each students in average contributed
38.55 birr. In this section equal number of girls and boys
were participated. In grade 9 in section B, students had
contributed 837 birr and each students in average contributed
41.5. In section B, 7 girls and 13 boys participated. In section
C, students had contributed 576 and each students in average
contributed 37.80 birr. In section C, 11 girls and 9 boys
participated.
c) Students’ Model at Level 3: Millennium Dam MEA:
Twelve teams of students were at this level. They were
similar to teams at level 2, but they used more than three
models like sum, mean and mode or median and mode. They
worked on more than three variables on the provided data.
For example, one team of students wrote a report working on
four variables: sex of the students, amount of money
contribution, sources of money contribution and sections of a
student as shown below in the news. The students had used
mean and mode to prepare the news; however, they could not
identify the mean was affected by extreme values. They did
not use the age of the students from the provided data to
satisfy the client’s need. In their report, they used figures like
39.9834 birr which may confuse listeners, since it is not
common way to describe currency with four decimal places.
The report presented by the team of the students’ model on
Millennium dam at Level 3 was given below.
NEWS: First the Headlines! Students in School A have
contributed money for the Millennium dam. Students in three
grade 9 sections contribute 2399 birr and 32 girls and 28
boys take part in the contribution. All students in average
contributed 39.9834 birr. The sources from where students
get the money for the dam contribution include families,
friends, uncle, brother and the like. Out of these sources most
students contributed from their pocket and they are 24
students. To finalize the news, students’ contribution for the
Millennium dam is encouraging.
d) Students’ Model at Level 4: Millennium dam MEA:
One team of students was at this level. The team identified
that one student in section B had contributed 200 birr which
attributed section B students’ contribution to be the highest
among the three sections as shown below in the news
presented by the team of students. The team had used models
like sum, extreme value, median and range. They had used
variables such as students’ age, sex, students’ contribution of
money, and students sections. They used the provided data
and variables except money source to prepare the report.
They recognized the highest value which could affect the
mean of section B contribution. This created an opportunity
to teach the median is more appropriate than mean, whenever
data contain extreme values or outliers. The report presented
by the team of the students’ model on Millennium dam at
Level 4 was given below.
NEWS: Here is the news! First the headlines! From three
grades 9 sections, 28 girls and 32 boys had contributed
money for the Millennium dam. The girls’ participation is
encouraging. Students’ ages in the three sections are between
13 and 22. From the three sections, students in section B
contribute the highest amount, because one student has
contributed 200 birr. The students contributed 2399 birr. In
average, a student contributes close to 35 birr. We ask, your
excuse, not showing you the video. We have finished the
news and invited you to watch the rest programs!
14 Mulugeta Woldemicheal Gebresenbet and Mulugeta Atnafu Ayele: Enhancing Secondary School Students’ Understanding of Descriptive Statistics Using a Modeling Instructional Approach
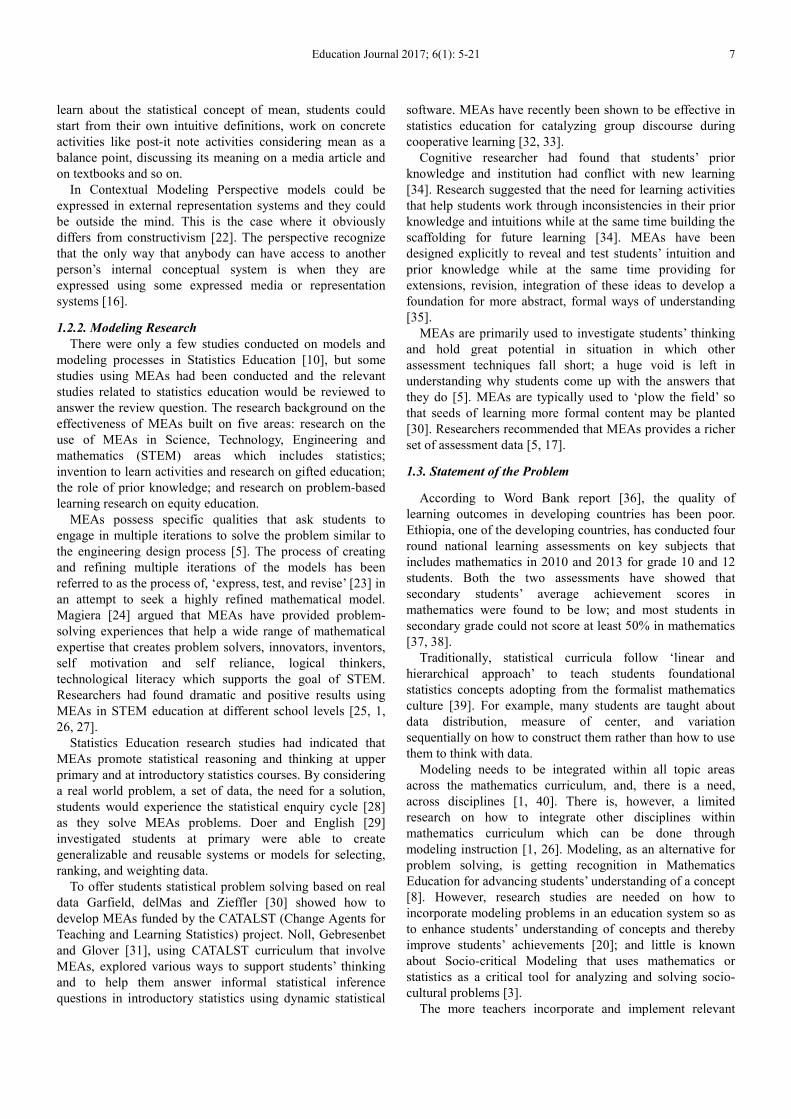
3.1.3. Students’ Models for Tourist MEA
The third MEA is on Tourist with title ‘Ethiopia's
Historical & Natural Tourist Attractions’ is given as a reading
homework to students and followed by readiness or warm up
questions for discussion such as: What does it tells you about
the temperature in Addis when it says in an average the
temperature is 61 degrees Fahrenheit? What do you think the
temperature in Addis Abeba might be for 6 different days in
the year? Why do you make these choices? Next students
were given a data table on ‘the climate data for the four
tourist attraction sites’ and asked to write a report for the
tourist describing and comparing the climate data for the four
tourist attraction sites telling them what type of clothes they
should wear and what type of food(drinks) they should take
or have. Therefore, below are the responses of students’
model at different levels.
a) Students’ Models at Level 1: Tourist MEA: Two teams
of students were at this level. For example, a team of students
gave general information on what clothes and shoes to wear,
what food to eat and what drinks to drink, but they barely
used data in their report to meet the client needs. The report
presented by the team of the students’ model on Tourist MEA
at Level 1 was given below.
Dear Tourist, it is advisable that a tourist visit a country in
September because the weather condition is conducive.
When the tourist wants to visit a country, he should not bring
clothes for cold weather, that is, he/she should bring light
clothes. The shoes should be Sandals as there is no snow in
the tourist sites. The tourist needs to bring an umbrella in
case it rains. Besides, the tourist should bring fast foods and
a) Follow up Activities for Safe-Water MEA. Students did
the following follow up activities on Safe-Water MEA:
distinguishing distribution, little or a lot variability and Safe-
Water MEA extension problem. Students in a team of three or
four compared different distributions of dots plots and
explained possible reason why students’ score in
mathematics could differ using center and variation
informally as shown in Figure 6. Students were also
introduced the concept of variability informally by asking
16 Mulugeta Woldemicheal Gebresenbet and Mulugeta Atnafu Ayele: Enhancing Secondary School Students’ Understanding of Descriptive Statistics Using a Modeling Instructional Approach
them to describe whether a variable had a little or a lot of
variability that could measure about themselves on a daily or
weekly basis and examine over a period of week or month.
Finally, revisiting Safe-Water MEA as an extension problem,
student was given an individual assignment to write a report
on safe drinking water in their community.
Figure 6. Comparing data distribution using dot plots.
b) Follow up Activities for Millennium Dam MEA.
Students did the following Millennium Dam MEA follow up
activities: choosing appropriate measure of center and Post-it
Note activities. On choosing appropriate measure of center,
students used the students’ survey data by using graphs to
decide which ‘typical’ value (mean or median) is appropriate
examining a graph of distribution of variable. Students in
their team did Post-it Notes activities to get sense of the
mean as the ‘balance’ point as a representative of data and to
show a median is not affected by extreme values. Further,
students were introduced the concept of mean deviations on
the Post-it Notes activity investigating the distance of each
data points from the mean. For example, they showed the
mean age of 10 students was 21 by explaining that the mean
might not be the age of one of the students in the data sets.
That is, they were able to move all post-it notes, yet the mean
age was still 21 years as shown in Figure 7.
Figure 7. Team showing none of students age is 21 but mean is 21
c) Follow up Activities for Tourist MEA. One extension
problem on Football MEA was to write a report or a news
using statistical concepts on top ten provided data statistics
for European and Ethiopian football clubs (English-Premier
League, Spain-La Liga, Italy-Seria A, Germany-
Buendeseliga and Ethiopia-Ethio League). In ‘How big is
your head?’ follow up activity, each team of students’ was
given a plastic meters and collected data on head
circumference for each member of the team. One student
from each team wrote the team data on the blackboard and
one student was selected to measure the head circumference
of every student in the class.
Students were asked what the typical head circumference
was looking at the distribution of the two data sets using dot
plots. Students compared the two dot plots with respect to
center and spread. Then, the students were asked what could
be the possible reason for the variability of the data in the
measurements of neck circumferences. Students were elicited
why the variation existed and discussed the sources of data
variability such as natural and measurement variability.
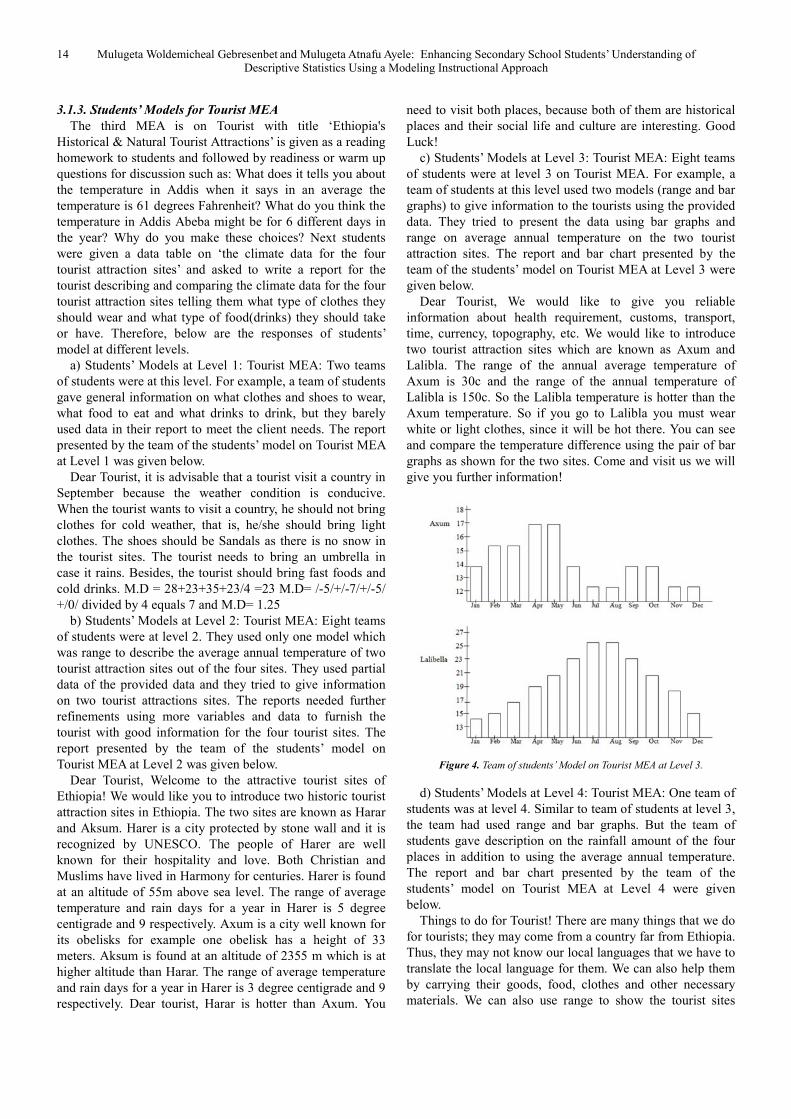
As extension to Tourist MEA, students described variation
of weather data for three Towns for five consecutive days
from TV, Radio or newspaper. Lastly, teams of students had
compared the size of standard deviation in pair of histogram
visually without calculating the standard deviation as shown
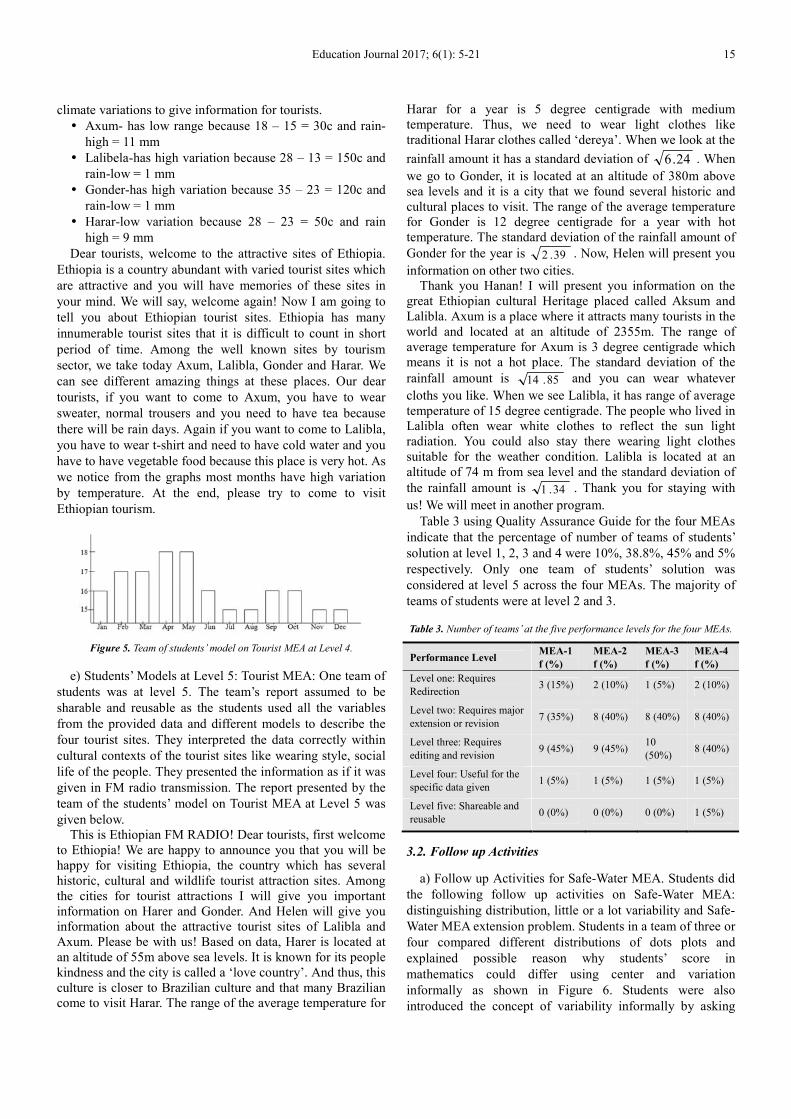
in Figure 8.
Education Journal 2017; 6(1): 5-21 17
Figure 8. Students’ solutions comparing standard deviation using histogram.
3.3. Results on Achievement Test
A descriptive analysis including sample means, standard
deviation, and independent sample t-test were conducted to
test hypotheses based on Skewness-Kurtosis normality test at
α = 0.05 significance level to compare scores of students’
using achievement tests on prior knowledge, procedural and
conceptual understanding between students who learned
descriptive statistics using Modeling and Non-modeling
Approach. The prior knowledge test was taken as a pretest
and achievement tests on procedural and conceptual
understanding of descriptive statistics was taken as posttests.
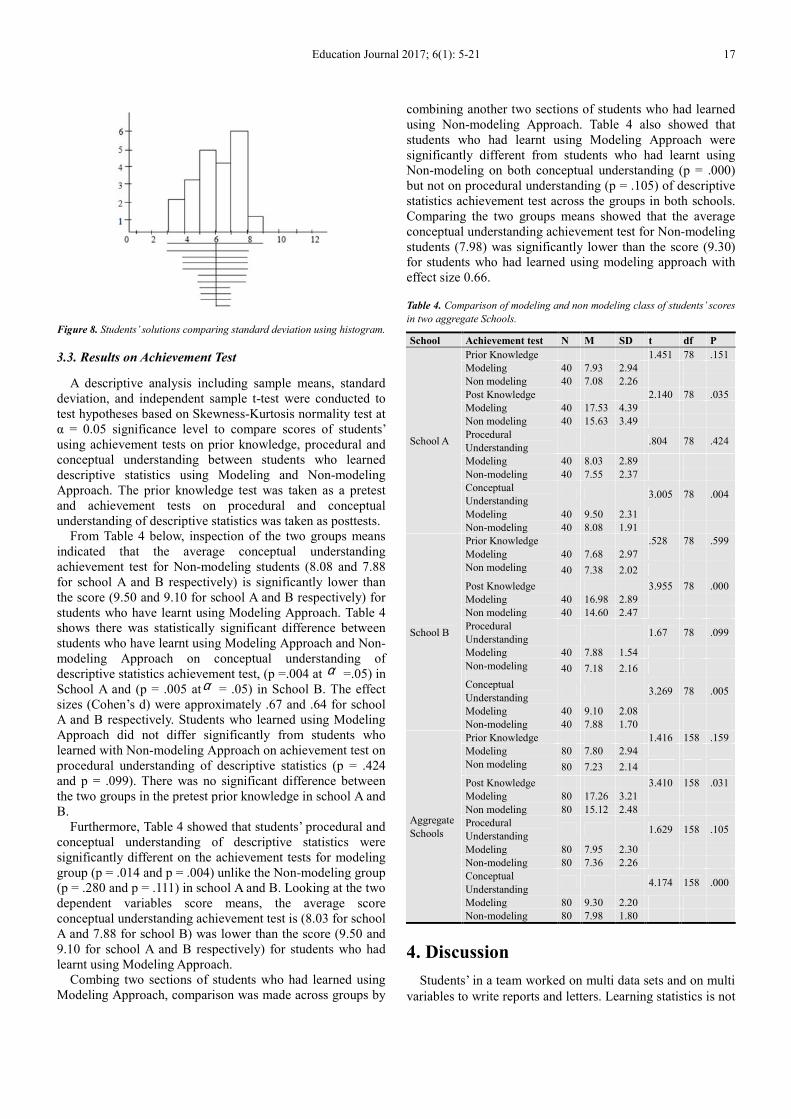
From Table 4 below, inspection of the two groups means
indicated that the average conceptual understanding
achievement test for Non-modeling students (8.08 and 7.88
for school A and B respectively) is significantly lower than
the score (9.50 and 9.10 for school A and B respectively) for
students who have learnt using Modeling Approach. Table 4
shows there was statistically significant difference between
students who have learnt using Modeling Approach and Non-
modeling Approach on conceptual understanding of
descriptive statistics achievement test, (p =.004 at α =.05) in
School A and (p = .005 atα = .05) in School B. The effect
sizes (Cohen’s d) were approximately .67 and .64 for school
A and B respectively. Students who learned using Modeling
Approach did not differ significantly from students who
learned with Non-modeling Approach on achievement test on
procedural understanding of descriptive statistics (p = .424
and p = .099). There was no significant difference between
the two groups in the pretest prior knowledge in school A and
B.
Furthermore, Table 4 showed that students’ procedural and
conceptual understanding of descriptive statistics were
significantly different on the achievement tests for modeling
group (p = .014 and p = .004) unlike the Non-modeling group
(p = .280 and p = .111) in school A and B. Looking at the two
dependent variables score means, the average score
conceptual understanding achievement test is (8.03 for school
A and 7.88 for school B) was lower than the score (9.50 and
9.10 for school A and B respectively) for students who had
learnt using Modeling Approach.
Combing two sections of students who had learned using
Modeling Approach, comparison was made across groups by
combining another two sections of students who had learned
using Non-modeling Approach. Table 4 also showed that
students who had learnt using Modeling Approach were
significantly different from students who had learnt using
Non-modeling on both conceptual understanding (p = .000)
but not on procedural understanding (p = .105) of descriptive
statistics achievement test across the groups in both schools.
Comparing the two groups means showed that the average
conceptual understanding achievement test for Non-modeling
students (7.98) was significantly lower than the score (9.30)
for students who had learned using modeling approach with
effect size 0.66.
Table 4. Comparison of modeling and non modeling class of students’ scores
in two aggregate Schools.
School Achievement test N M SD t df P
School A
Prior Knowledge 1.451 78 .151
Modeling 40 7.93 2.94
Non modeling 40 7.08 2.26
Post Knowledge 2.140 78 .035
Modeling 40 17.53 4.39
Non modeling 40 15.63 3.49
Procedural
Understanding .804 78 .424
Modeling 40 8.03 2.89
Non-modeling 40 7.55 2.37
Conceptual
Understanding 3.005 78 .004
Modeling 40 9.50 2.31
Non-modeling 40 8.08 1.91
School B
Prior Knowledge .528 78 .599
Modeling 40 7.68 2.97
Non modeling 40 7.38 2.02
Post Knowledge 3.955 78 .000
Modeling 40 16.98 2.89
Non modeling 40 14.60 2.47
Procedural
Understanding 1.67 78 .099
Modeling 40 7.88 1.54
Non-modeling 40 7.18 2.16
Conceptual
Understanding 3.269 78 .005
Modeling 40 9.10 2.08
Non-modeling 40 7.88 1.70
Aggregate
Schools
Prior Knowledge 1.416 158 .159
Modeling 80 7.80 2.94
Non modeling 80 7.23 2.14
Post Knowledge 3.410 158 .031
Modeling 80 17.26 3.21
Non modeling 80 15.12 2.48
Procedural
Understanding 1.629 158 .105
Modeling 80 7.95 2.30
Non-modeling 80 7.36 2.26
Conceptual
Understanding 4.174 158 .000
Modeling 80 9.30 2.20
Non-modeling 80 7.98 1.80
4. Discussion
Students’ in a team worked on multi data sets and on multi
variables to write reports and letters. Learning statistics is not
18 Mulugeta Woldemicheal Gebresenbet and Mulugeta Atnafu Ayele: Enhancing Secondary School Students’ Understanding of Descriptive Statistics Using a Modeling Instructional Approach
only doing, but also involves describing and interpreting
situations statistically [20]. The finding of the study suggests
students can draw conclusion informally from data in a
context on MEAs as contents of students’ reports showed.
Students can construct, test and revise their models by
expressing their thinking through representation systems
[17]. The multiplicity of students’ reports on MEAs showed
students can develop authorships of ideas than relaying
simply on text books and teachers.
The finding also suggested students found the MEAs
relevant to their life and they were ‘hard fun’ activities.
Students were able to go through the modeling cycle and they
were able to think ‘outside of the subject box’ in
multidisciplinary areas. Statistics is at an intersection of
many subjects, since all subjects will use some data to work
with concepts. This is an opportunity to all allow students to
work with a team in multi-disciplinary area which is the
ability and understanding needed beyond school in an age of
information [6]. Students get used to the statistical inquiry
cycle doing MEAs [28]. By working on real world problem,
a set of data and the need for a solution, students would
experience the statistical inquiry cycle.
Much emphasis is given to Science, Technology,
Engineering and Mathematics Education in Ethiopia
Education System [13]. Hence, Modeling Approach would
come into spotlight to bring together different disciplines.
Working on relevant non-routine problems like MEAs
starting from lower grades would create opportunities to
students to prepare them for their future careers like
engineering and other sciences. The finding of the study
among others indicated it is possible to develop students’
modeling experiences from early grades [6, 7, 20].
According to Freire [46], it is better if students select the
investigative themes by themselves than investigative themes
assigned by a teacher. Students had developed their critical
understanding of descriptive statistics using statistics as
critical tool towards solving the socio-cultural problems.
Students were working on themes that arose from educational
to economic to social life and culture problems. Students
were presenting awareness program on avoiding copying
during examination, avoiding bad addiction habits, keeping
dental care and body weight regularly, and resolving
problems on gender issues.
Gustine [47] used both statistics and mathematics with
social agency, but there were a number of subtle similarity
and differences in this study from his approach. Gustine
chose the investigative themes for students, but in the
Modeling Approach, students first worked on MEAs
problems with investigative themes having relevance with
socio-cultural problems. Then, students selected the themes
by themselves towards helping others with sympathetic
understanding. In the Modeling Approach, students learned
according to the time plan of the lessons on descriptive
statistics set by Ministry of Education on Grade Nine
curriculum syllabuses. One of the advantage of MEA was it
took not more than two or three periods unlike other non-
routine problem solving tasks that requires an extended
period of time.
Students’ were able to develop their critical productive
disposition towards statistics. Students’ had used different
entertainment and fun using statistics as a critical tool to give
an awareness program on their project themes. Students had
used drama, live interview, fashion show, poems which could
add value to their productive dispositions towards statistics as
a tool that could be used in their everyday life to solve their
own and society’s problems. Students could enhance the
statistical thinking which basically emphasis making
conclusion based on data in a context.
Many defenders raises practical issues by claiming that it is
not possible to teach statistics using Modeling Approach due to
time constraints and content coverage in the school programs.
Of course, some problem-driven curriculum may take longer
period of time than the allotted time in schools [5]. However,
as this study among others showed, MEAs did not take longer
more than one or two periods that time constraints may not be
a problem [5, 20]. Students need to develop both content and
process objectives for learning descriptive statistics. Most
importantly, the best possible ranges of problem types that
involve routine and non-routine problems need to be used.
Students could learn on big ideas of descriptive statistics using
MEAs based on few design principles as this study suggests.
Further, students could be benefited more if they do extended
open-ended projects to experience statistical investigative
processes that could save enough time to meet the process
objectives as this study findings suggested.
Students were able to create fun and different styles when
they wrote reports and news on the MEAs. This could create
positive dispositions towards statistics, because students were
having fun in the class despite the fact that MEAs are
cognitively challenging tasks. A study had showed that
students would engage in statistics class if they are motivated
and got some fun in the class [48]. Students found that
working in MEAs were ‘hard fun’ to develop their
dispositions towards statistics. Students were reporting their
solution using news and letters in funny ways which had
created students motivations to work on MEAs. Though data
modeling was challenging, students were able to engage and
preserve in completing the modeling cycle, because students
got a chance to present their report in their own styles as
observed in modeling class which is supported by similar
research findings [42].
As a doctor inquires further tests to understand fully the
patient case, the study administered achievement tests to
investigate to what extent students understand descriptive
statistics using Modeling Approach. The core finding of the
study suggested students could enhance their conceptual
understanding of descriptive statistics with medium effect size
without compromising their procedural understanding of
descriptive statistics using Modeling Approach. This finding is
similar with other studies using problem-driven curriculum [49].
5. Conclusion and Recommendations
The topic presents a summative claim on what has been
Education Journal 2017; 6(1): 5-21 19
found related to the study purpose, aim and design. It
addresses on how far the findings have answered the research
questions. The topic presents concluding remarks on the
degree of certainty with which the findings from the specific
context could be generalized in contributing to answering the
central question, and then it points out recommendations and
suggestions for future research.
5.1. Conclusion
Students worked on relevant non-routine problem solving
tasks called MEAs and representation systems to lay the
basic foundations for important learning outcome in statistics
education such as statistical literacy, reasoning and thinking.
In an age of information, students at their youth age need to
solve relevant non-routine problem solving tasks to enhance
their critical understanding which could enable them to cope
up with the nature of problems in daily life. Students could
get a sense of social agency using statistics as a critical tool
solving socio-cultural problems using data modeling.
The study revealed that students who learned using
Modeling approach could enhance their understanding of
descriptive statistics. Students’ could elicit their models by
externalizing thinking through representation systems
working on MEAs and develop their models by testing,
revising, and refining iteratively with follow up activities.
The findings of this study are reminders that Modeling
Approach more likely enhances students’ understanding of
descriptive statistics with similar school settings, but needs
further efficacy study at different school settings and
populations; it also needs large scale effectiveness study to
meet the interests of stakeholders in an education system.
5.2. Recommendations
The researchers prepared the themes of MEAs selecting
topical issues from the society. To set non routine
interdisciplinary problems within the interest of all
stakeholders, key stakeholders such as teachers, students,
STEM educators, and social-agents should co-ordinate being
evolving experts. The study was conducted in non-
technological environment, but technology will further
strength the use of Modeling Approach making the
representation system dynamic. Statistics Educators and
researchers will play a major role informing what big ideas
and cognitive process need to include in the curriculum.
Social-agents also identify investigative themes that could
create sense of social agency solving social problems.
Modeling Approach curriculum drives its epistemology of
constructing, testing and revising models from engineering as
they are heavy users of mathematics and the nature of
problems beyond school are of these types [20].
After the problem-driven curriculum is set, then it is
operationally implemented in the Modeling Instructional
Approach. The main elements in interaction in Modeling
Instructional Approach are the modeling tasks, students and
the teacher. The tasks involve MEAs which are non-routine
problem solving tasks. The study suggests that students find
them relevant. If the tasks are not relevant, the teacher and
other stakeholders need to find sensitive and timely issues
going back to design the curriculum. Thus, the curriculum
and the instruction would inform each other back and forth.
Problem-driven curriculum using Modeling Approach would
give a framework to see what goals drive every action in the
instruction.
Then, teacher also makes interpretation of students’
models on MEAs. Statistics involves not only doing analysis
on data sets, but also it involves interpreting realistic
complex situations. Finally, teachers could assess students’
individual cognition using assessment tool that asks
statistical reasoning.
The finding of this study suggests that if there is a synergy
of curriculum, instruction and assessment using Modeling
Approach in an education system, students likely could
enhance their understanding of descriptive statistics. This is
preliminary research which could inform problem solving
policy in secondary mathematics curriculum, but further
research is needed to inform the policy better as discussed
below.
References
[1] English, L. D. (2013a). Complex modeling in primary and middle schools years: An interdiscplinary approach. In G. A. Stillman, G. Kasier, & J. P. Werner Blum, Teaching mathematical modelling: Connecting research to practice (pp. 491-503). New York.London: Springer.
[2] Kaiser, G., & Schwarz, B. (2006). Mathematical modeling as a bridge between school and university mathematics. ZDM, 196-208.
[3] Stillman, G. A., Kasier, G., Blum, W. & Brown, J. (2013). Teaching mathematical modeling: Connecting research to practice. London: Springer.
[4] Kaiser, G., Blohomhoj, M., & Siriraman, B. (2006). Towards a didactical theory for mathematical modeling. ZDM, 82-85.
[5] Chamberlin, S. A., & Coxbill, E. (2012). Using Model-Elicting Activities to introduce upper elementary students to Statistical Reasoning and Mathematical Modeling. In L. H. Mayes, Quantitative reasoning and mathematical modeling: A driver for STEM integrated education and teaching in context. (pp. 169-179). Wyoming: Wyoming Insititute for the Study of Mathematics Education, Laramie, WY.
[6] English, L. D. (2013b). Surviving an avalanche of data. Teaching Children Mathematics, 364-372.
[7] Kinnear, V. (2013). Young children statistical reasoning: A tale of two contexts. A dissertation thesis. Queensland Technology University of Technology, Australia.
[8] Sriraman, B., & English, L. (2010). Theories of Mathematics Education: New Frointers. Springer.
[9] Cobb, G. W. (2007). One possible framework for thinking about experential learning. International Statistical Review, 336-347.
20 Mulugeta Woldemicheal Gebresenbet and Mulugeta Atnafu Ayele: Enhancing Secondary School Students’ Understanding of Descriptive Statistics Using a Modeling Instructional Approach
[10] Garfield, J., & Ben-Zvi, D. (2008). Developing students' statistsical reasoning: Connecting research and teaching practice. London: Springer.
[11] Ministry of Education (MoE) (2009a). Education and development, Ministry of Education, Addis Ababa, Ethiopia.
[12] Ministry of Education (MoE) (2010a). Education Sector Development Program IV (ESDP IV): Program action plan, Federal Ministry of Education, Addis Abeba, Ethiopia.
[13] Ministry of Education (MoE) (2010b). Mathematics teacher’s guide for Grade 9, Ministry of Education, Addis Ababa Ethiopia.
[14] Micheal, K. & O'Connell, A. (2014). Statistics Education in Ethiopia: Successes, challenges and opportunities. In K. Makar, B. de Sousa & R. Gould (Eds.) Sustainably in Statistics Education. Proceedings of the ninthth International Conference on Teaching Statistics (ICOTS-9, July, 2014, Flagstaff, Arizona, USA). Voorburg, The Netherlands: International Statistical Institute.
[15] Kaiser, G. (2010). Introduction: ICTMA and the reaching of modeling and application. In L. Richard, P. L. Galbraith, C. R., Haines, & A. Harford (Eds.), Modeling students' mathematical modeling competencies (PP. 1-2). New York: Springer.
[16] Lesh, R., & Doerr, H. (Eds.). (2003). Beyond constructivism:Models and Modeling Perspectives on mathematices problem solving , learning and teaching. London: Lawrance Erlbaum Assocciate Publisher. [17] Lesh, R., & Fennewald, T. (2010). The nature of Models and Modeling: Introduction to part I modeling: What is it? why we do it? In R. Lesh, P. L. Galbraith, C. R. Haines, & A. Hurford, Modeling students' mathematical competencies (pp. 5-12). London: Springer.
[17] Kaiser, G., & Sriraman, B. (2006). A global survey of international perspectives on modeling in mathematics education. ZDM, 38(3), 302-310.
[18] Ferri, R. B., & Lesh, R. (2013). Should interpretation systems considered to be Models if they only function implicitly. In G. A. Stillman, G. Kaiser, & W. Blum, Teaching mathematical modelling: Connecting research and practice (pp. 57-66). New York; London: Springer.
[19] Lesh, R. (2012). Research on Model and Modeling and implication for common core state curriculum standards. In L. H. Mayes, Quantitative reasoning and mathematical modeling: A driver for STEM integrated education and teaching in context. (pp. 169-179). Wyoming: Wyoming Insititute for the Study of Mathematics Education, Laramie, WY.
[20] Lesh, R., Yoon, C., & Zawojewski, J. (2007). John Dewey revisited-Making mathematics practical versus making practice mathematical. In R. A. Lesh, E. Hamilton, & J. J. Kaput, Foundations for the future in Mathematics Education (pp. 315-348). Mahwah, NJ London: Lawrance Erlbaum Associate Publisher.
[21] Glasersfeld, E. v. (2003). Book review: Beyond constructivism, Models and Modeling Perspectives on mathematics problem solving, learning and teaching. ZDM, 325-329.
[22] Hamilton, E., Lesh, R. Lester, F. & Yoon, C. (2007). The use of reflection tool in building personal models. In R. Lesh, E. Hamilton, & J. J. Kaput (Eds.), Foundations for future in
Mathematics Education (pp. 1-6). Mahwha: NJ: Lawrence Erlbaum.
[23] Magiera, M. T. (2013). An aluminium Bat Activity supports goals of STEM learning by engaging students in resourcful problem solving. Mathematics Teaching in the Middle School, 349-355.
[24] Diefes-Dux, H., Whittenberg, L., & McKee, R. (2013). Mathematics modeling at the intersection of elementary mathematics, art and engineering Education. In L. D English & J. T Mulligan (Eds.), Reconceptualizing early mathematics learning, advance in Mathematics Education, 309-325. doi:10.1007/978-94-007-6440-8_15
[25] Mousoulides, N. G., & English, L. D. (2012). Modeling as a bridge between real world problems and school mathematics. The 12th International Congress on Mathematics Education, 1-10.
[26] Shuman, L. J, Besterfield-Sacre, M. E, Bursic, K. M, Vedic, N. S., & Siewiorek, N. (2012). CCLI. Model-Eliciting Activities, American Society for Engineering Education, 1-12.
[27] Wild, C., & Pfannkuch, M. (1999). Statistical thinking in emperical enquiry. International Statistical Review , 223-265.
[28] Doerr, H. M., & English, L. D. (2003). A modeling perspective on students' mathematical reasoning about data. Journal for Research in Mathematics Education, 110-136.
[29] Garfield, J., delMass, R. C., & Ziefeller, A. (2009). Using Model-Eliciting Activities (MEAs) in statistics classroom. Roundtable Presentation at the Joint Statistical Meetings (pp. 1-7). Washington DC: University of Minnesota.
[30] Noll, J., Geberesenbet, M., & Glover, E. D. (2012). A Modeling and simulation approach to informal inference:Successes and challenges. The 12th International Congress on Mathematical Education: Teaching and Learning of Statistics (TSG-12) (pp. 141-150). South Korea, Seoul: International Congress on Mathematical Education.
[31] Hjalmarson, M. A., Moore, T. J., & delMass, R. (2011). Statistical analysis when the data is an image: Elicting student thinking about sampling and variability. Statistics Education Research Journal, 15-34.
[32] Pearl, D. K., Garfield, J. B., delMas, R., Groth, R. E., Kaplan, J. J., MaGowan, H., & Lee, H. S. (2012). Connecting research to practice in a culture of assessment for introductory college level Statistics. [Online: http:// www.causeweb.org/research/guidelines/ResearchReport_DEC_2012.PDF].
[33] Schwartz, D. L., Sears, D., & Chang, J. (2007). Reconsidering prior knowledge. In M. Lovett and P. Shah (Eds.), Thinking with data (pp. 319-344). New York: Erlbaum.
[34] Lesh, R., Hoover, M., Hole, B., Kelly, A., & Post, T. (2000). Principles for developing thought-revealing activities for students and teachers. In A. Kelly & R. Lesh (Eds.), Handbook of research in Mathematics and Science Education (pp. 113–149). Mahwah, NJ: Lawrence Erlbaum and Associates.
[35] World Bank (2006). Assessing national achievement levels in education. (Eds.) Greaney V. & Kellenghan.
[36] Ethiopian National Examination Agency (2010). Ethiopian First National Learning Assessment (Grade 10 and 12).
Education Journal 2017; 6(1): 5-21 21
[37] Ethiopian National Examination Agency (2013). Ethiopian Second National Learning Assessment (Grade 10 and 12).
[38] Meletiou-Mavrotheris, M. (2007). The Formalist mathematical tradition as an obstacle to stochastical reasoning. In K. Francois, & J. P. V Bandegem (Eds.) Philosophical dimensions in Mathematics Education (PP. 131-155). Springer
[39] Gouvea, J. S., Sawtelle, V., Geller, B. D., & Turpen, C. (2013). A framework for analyzing interdiscplinary tasks: Implication for student learning and curricular design. CBE- Life Science Education, 187-205.
[40] Creswell, J. W. (2014). Research design: Quantitative, qualitative, mixed Method (4th ed.). Thousand Oaks, CA: Sage Publication.
[41] Boaler, J. (2009). When politics took the place of inquiry : A response to the national mathematics advisory panel's review of instructional practice. Educational Researchers, 588-594. doi:10.3102/0013189X08327998
[42] Campell, D. T., & Stanley, J. C. (1963). Experimental and quasi Experimental designs. USA: Houghton Mifflin Company.
[43] Yin, R. K. (2003). Case study research: Design and methods (3rd ed.). Thousand Oaks: Sage Publications.
[44] Chamberlin, S. A. & Moon, S. M. (2005). Model-Eliciting Activities as a tool to develop and identify creatively gifted mathematicians. The Journal of Secondary Gifted Education, 37-47.
[45] Freire, P. (1970). Pedagogy of the Oppressed. The Seabury Press. New York.
[46] Gutstein, E. (2006). Reading and writing the world with mathematics: Towards a pedagogy for social Justice. USA: Routeldge.
[47] Lesser, L. M., Wall, A. A., Carver, R. H., Pearl, D. K., Martin, N., Kupier, S., . . . Weber, J. J. (2013). Using fun in statistics classroom: An exploratory study of college instructors' hesitation and motivations. Journal of Statistics Education , 1-3.
[48] Schoenfeld, A. (2004). The math wars. Educational Policy, 256-286.