P - 176 Enhancing Seismic Imaging Through Close Spatial Sampling in Fold Belt Terrain; A Case Study Balak P R, Durga Prasad* Y V, Kandpal M C, Regional Computer Centre, ONGC, GPS, A&AA Basin, Jorhat, Email : [email protected], [email protected]Summary Seismic imaging in geologically complex fold belt area is a known challenge for acquisition and processing geophysicists world over. Conventional processing approaches on many occasions fail to produce the best possible image of the subsurface in the presence of strong noise and weak signal strength. A different acquisition and processing strategy has to be adopted to enhance the signal. Attempts are being made in field of acquisition and processing of seismic data to get a meaningful picture of the sub-surface in the fold belt areas all over the globe. One such attempt has been made in North of Gojalia area in the Tripura fold belt of Assam-Arakan basin, India. 2D CDP surveys carried out in north of Gojalia failed to meet the geological objectives. Later, a 3D survey was conducted in the same area to solve the imaging problem associated with Gojalia anticline. Initially, 3D data was processed using conventional approach. The conventionally processed seismic data exhibited reasonably good seismic reflections in the flanks of Gojalia anticline while only patchy reflections were seen in the anticline. Thus conventional processing approach could not yield good results in fold belt areas. Hence, a different data acquisition and processing approach was adopted which worked well and the imaging quality improved considerably in the crestal part of the structure but quality of the processed output was not consistent throughout the area. To improve the seismic imaging in the anticline part, an experimental 2D line was shot with a close spatial sampling of ten meters and traversed close to the dip direction. This 2D line was processed with similar processing parameters as those adopted for 3D data processing. This resulted in a 2D section that showed better imaging in the crestal part as well as the flanks of Gojalia anticline. Further, experimental processing of this 2D line was done with various spatial samplings and it was found that the quality deteriorated with larger spatial sampling. Introduction Gojalia anticline is one of the prominent hydrocarbon bearing structures in south western Tripura in north eastern part of India (Figure 1). The area of study lies in the northern part of the Gojalia anticline. The presence of commercial gas was proved by wells drilled in the surveyed area. Precise mapping of faults, possible extension of sands of the proven wells and identifying any additional prospects are the objectives of the project. Commitment to fulfill these objectives needed good quality seismic data. Special efforts were required at the acquisition and processing stages for improvement of event stand out and resolution in the crestal as well as the flank parts of the anticline. Seismic data acquired and processed using conventional methods failed to image the anticline properly and to map the faults. In order to improve the data quality, data acquisition parameters were modified based on modeling studies. Enhancement of event continuity, resolution and precise definition of faults was achieved through focused data processing by recomputing and application of field and residual statics and model based velocity analysis. The paper deals with these special efforts which enhanced the
Transcript
P - 176
Enhancing Seismic Imaging Through Close Spatial Sampling in Fold Belt Terrain; A Case Study
Balak P R, Durga Prasad* Y V, Kandpal M C,Regional Computer Centre, ONGC, GPS, A&AA Basin, Jorhat, Email : [email protected], [email protected]
Summary
Seismic imaging in geologically complex fold belt area is a known challenge for acquisition and processing geophysicists world over. Conventional processing approaches on many occasions fail to produce the best possible image of the subsurface in the presence of strong noise and weak signal strength. A different acquisition and processing strategy has to be adopted to enhance the signal. Attempts are being made in field of acquisition and processing of seismic data to get a meaningful picture of the sub-surface in the fold belt areas all over the globe. One such attempt has been made in North of Gojalia area in the Tripura fold belt of Assam-Arakan basin, India.
2D CDP surveys carried out in north of Gojalia failed to meet the geological objectives. Later, a 3D survey was conducted in the same area to solve the imaging problem associated with Gojalia anticline. Initially, 3D data was processed using conventional approach. The conventionally processed seismic data exhibited reasonably good seismic reflections in the flanks of Gojalia anticline while only patchy reflections were seen in the anticline. Thus conventional processing approach could not yield good results in fold belt areas. Hence, a different data acquisition and processing approach was adopted which worked well and the imaging quality improved considerably in the crestal part of the structure but quality of the processed output was not consistent throughout the area.
To improve the seismic imaging in the anticline part, an experimental 2D line was shot with a close spatial sampling of ten meters and traversed close to the dip direction. This 2D line was processed with similar processing parameters as those adopted for 3D data processing. This resulted in a 2D section that showed better imaging in the crestal part as well as the flanks of Gojalia anticline. Further, experimental processing of this 2D line was done with various spatial samplings and it was found that the quality deteriorated with larger spatial sampling.
Introduction
Gojalia anticline is one of the prominent hydrocarbon bearing structures in south western Tripura in north eastern part of India (Figure 1). The area of study lies in the northern part of the Gojalia anticline. The presence of commercial gas was proved by wells drilled in the surveyed area. Precise mapping of faults, possible extension of sands of the proven wells and identifying any additional prospects are the objectives of the project. Commitment to fulfill these objectives needed good quality seismic data. Special efforts were required at the acquisition and processing
stages for improvement of event stand out and resolution in the crestal as well as the flank parts of the anticline. Seismic data acquired and processed using conventional methods failed to image the anticline properly and to map the faults. In order to improve the data quality, data acquisition parameters were modified based on modelingstudies. Enhancement of event continuity, resolution and precise definition of faults was achieved through focused data processing by recomputing and application of field and residual statics and model based velocity analysis. The paper deals with these special efforts which enhanced the
imaging in this part of geologically complex areas of Assam Arakan fold belt.
Figure 1: Location map of the area
Figure 2 : Structure map of Tripura
Brief geology of the study area
The Tripura fold belt, a part of the Assam Arakan basin is characterized by a series of long, narrow, doubly plunging anticlines with intervening broad synclines. The Gojalia anticline is located in the southern part of Tripura and is en-echelon to Baramura structure in the north-east and Tichna structure in the north-west. It is a NNW-SSE trending, elongated, and doubly plunging asymmetric anticline, about 40 km long, with flat crest and steeply dipping flanks (Figure 3). The beds are sub-vertical to overturned at the boundary of the Bokabil and Tipam Formations and the dip decreases sharply away from the contact towards the
synclines. The anticline grades into the Bogapha Syncline to the east and the Abhaya Syncline to the west. Two major longitudinal reverse faults, Bhuratali in the east and Belonia in the west, affect the two limbs of the anticline. The plunge dips in the north vary from 2° to 3° and in the southern plunge dips vary between 4° to 5°. The anticline exposes about 2134m of Tertiary sediments of the Bokabil and Tipam Formations. The Bokabil Formation is exposed in the core of the anticline, whereas the Tipam Formation is exposed along the flanks.
Figure 3 : Structure of Gojalia anticline
Data acquisition
The Gojalia anticline is fairly well covered with 60 fold 2-D seismic data acquired during 2003-04 (I of Table 1). The 2D lines were shot with group interval of 20m and shot interval of 40m with 240 channels symmetric split spread.Subsequently, 3-D seismic data was acquired during 2005-06 (II of Table 1) with 36 fold and a bin size of 20m x 40mover the Gojalia anticline, Group Interval being 40m and shot interval 80m. However, the processed data of 2D and 3D vintages could not bring out the structural / stratigraphic picture clearly on the crestal part of the anticline. It was felt that data acquisition needed closer sampling and closer velocity analysis during processing. Thus, an experimental 2D line was shot with 100 fold and 10m group interval using asymmetric split spread geometry in the dip direction of the anticline (Figure 4). The shot interval was 30m. The acquisition parameters of all the three surveys are shown in Table 1.
The recording instrument used was same for all the three vintages. Same explosive source was used in all the three cases.
Study Area
Gojalia structure
3D Surveyarea
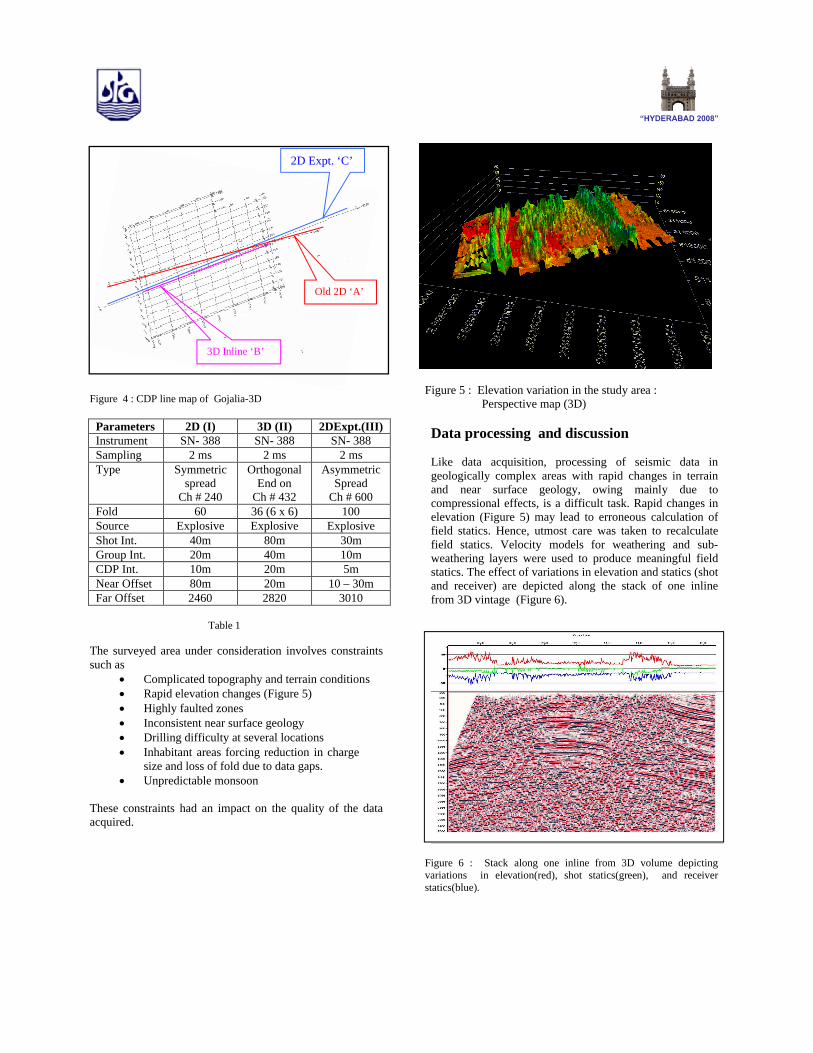
Figure 4 : CDP line map of Gojalia-3D
Parameters 2D (I) 3D (II) 2DExpt.(III)Instrument SN- 388 SN- 388 SN- 388Sampling 2 ms 2 ms 2 msType Symmetric
The surveyed area under consideration involves constraints such as
Complicated topography and terrain conditions Rapid elevation changes (Figure 5) Highly faulted zones Inconsistent near surface geology Drilling difficulty at several locations Inhabitant areas forcing reduction in charge
size and loss of fold due to data gaps. Unpredictable monsoon
These constraints had an impact on the quality of the data acquired.
Figure 5 : Elevation variation in the study area : Perspective map (3D)
Data processing and discussion
Like data acquisition, processing of seismic data in geologically complex areas with rapid changes in terrain and near surface geology, owing mainly due to compressional effects, is a difficult task. Rapid changes in elevation (Figure 5) may lead to erroneous calculation of field statics. Hence, utmost care was taken to recalculatefield statics. Velocity models for weathering and sub-weathering layers were used to produce meaningful field statics. The effect of variations in elevation and statics (shot and receiver) are depicted along the stack of one inline from 3D vintage (Figure 6).
Figure 6 : Stack along one inline from 3D volume depicting variations in elevation(red), shot statics(green), and receiverstatics(blue).
3D Inline ‘B’
2D Expt. ‘C’
Old 2D ‘A’
The data pertaining to all the three surveys were processed using exhaustive determination of residual statics and high density velocity analysis using modeling studies (Figure 7). The process of amplitude deconvolution and random noise attenuation parameters were arrived at after thorough testing. The processing parameters and the processing flow were kept same for all the three surveys, namely,conventional 2D, 3D and experimental 2D.
Figure 7 : Seismo geological model used for high density velocity analysis
Figure 8: Migrated section (Old 2D line ‘A’ with spatial sampling of 20 m)
The processed data of conventional 2D survey (Figure 8) did not fulfill the geological objective. The processed 3D data (Figure 9) showed considerable improvement in the imaging but was not consistent throughout. However, the processed output of the experimental 2D line yielded better results (Figure 10).
A comparison of the processed outputs of three vintages shows that the spatial sampling has a telling effect on the imaging of the subsurface. Poor spatial sampling often results in poor illumination of subsurface or the structure of interest (Andrew Long et al., 2004). Poor image quality is often caused by irregular and inadequate spatial sampling and also leads to incomplete illumination of the subsurface (Biondi, 2007).
Figure 9 : Migrated section ( An inline ‘B’ from 3D volume Bin size 20m X 40m with spatial sampling of 40m)
Figure 10 : Migrated section (Experimental 2D line ‘C’ with spatial sampling of 10 m)
To have an assessment of the effect of spatial sampling, the 2D experimental line data which was acquired with a station interval of 10m was decimated and also processedfor station interval of 20m (Figure 11) in order to make it equivalent with the earlier vintages.
Comparison of the processed outputs (Figures: 8,9, 10 and 11) show very clearly that spatial sampling during data acquisition is one of the most important parameters to properly image the geologically complex anticlines present in the fold belt areas of Assam Arakan Basin. Equally important is the proper calculation of field statics and residual statics in this type of rapidly changing terrain.
Figure 11: Migrated section (Experimental 2D line ‘C’ with spatial sampling of 20m)
Conclusions
It is distinctively evident from the processed output of experimental 2D line that when the data is acquired with reduced spatial sampling, improvement in event continuity and resolution is improved and results in better imaging of the structure. It is therefore concluded that a revisit to Gojalia anticline with a reduced spatial sampling during data acquisition will enhance the imaging in the area. Emphasis on model based data acquisition parameters is a key for improved data in this type of geologically complex areas. Emphasis on focused efforts through high density velocity picking, recalculation of field and residual statics and model based velocity analysis will enhance seismic imaging in Assam Arakan fold belt areas.
References
1. Andrew Long et al., 2004, PGS Technology,Optimal marine streamer acquisition with HD3D
2. Biondo Biondi,2007, Concepts and Applications in 3D Seismic Imaging, SEG/EAGE
Acknowledgements
The authors express their gratitude to Shri S.Choudhury, GM-Basin Manager, Shri G. Sarvesam, GM-HGS, Chennai, and Shri B.K.Das GM-HGS, Jorhat, for giving the opportunity to work on this project. The authors express thanks to Shri B.S.N.Murthy, DGM,
Shri S.Panigrahi, DGM, Shri C.M.Varadarajan, DGM fortheir valuable suggestions during this work.