Page 1
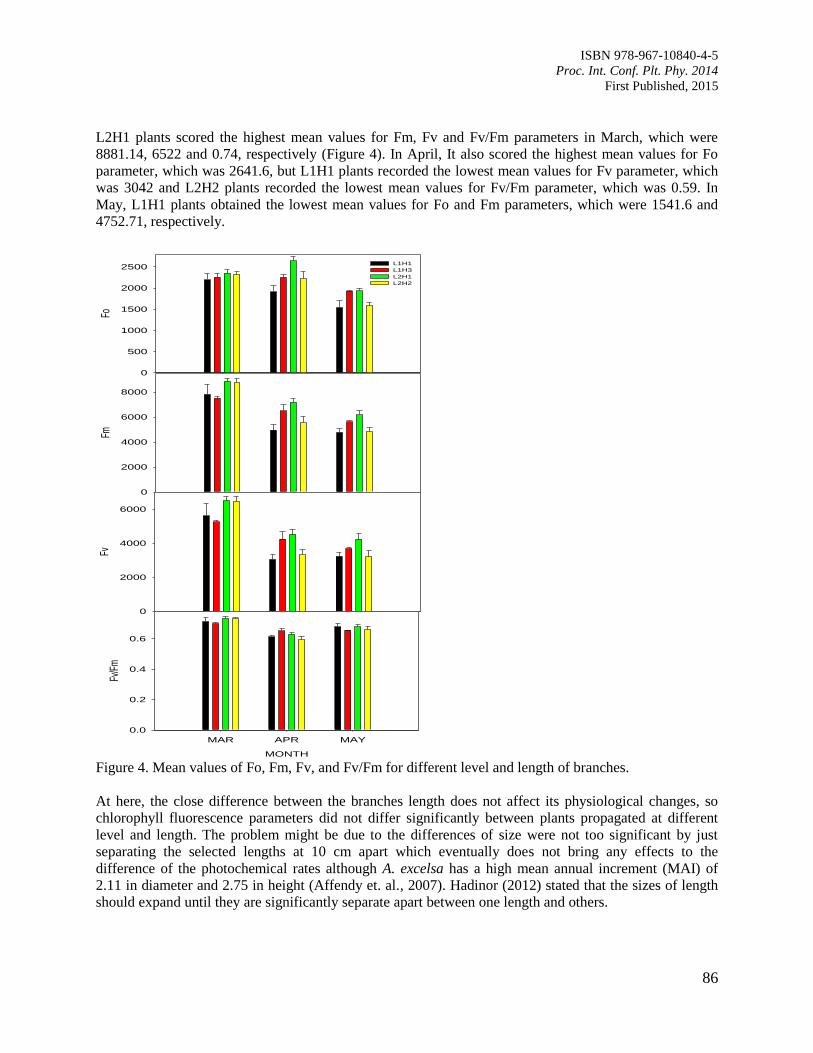
i
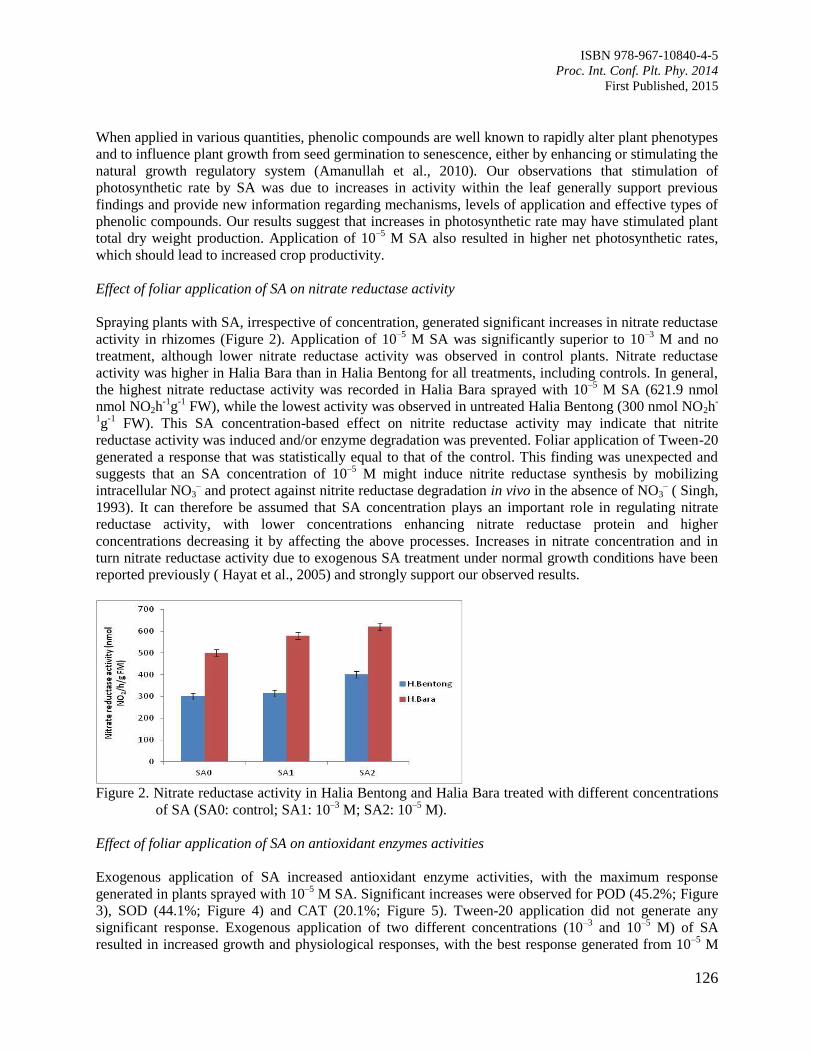
Enhancing Strategic Plant Physiological Research and
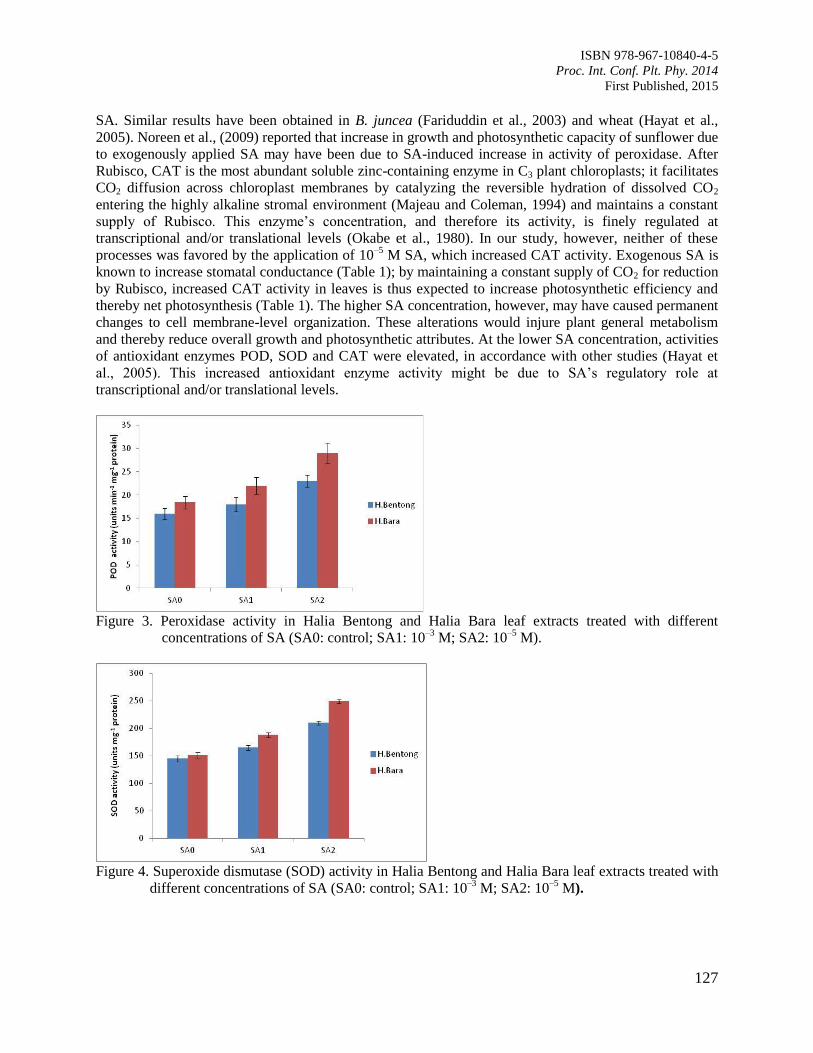
Technologies for Sustainable Resources
Ahmad Nazarudin Mohd Roseli
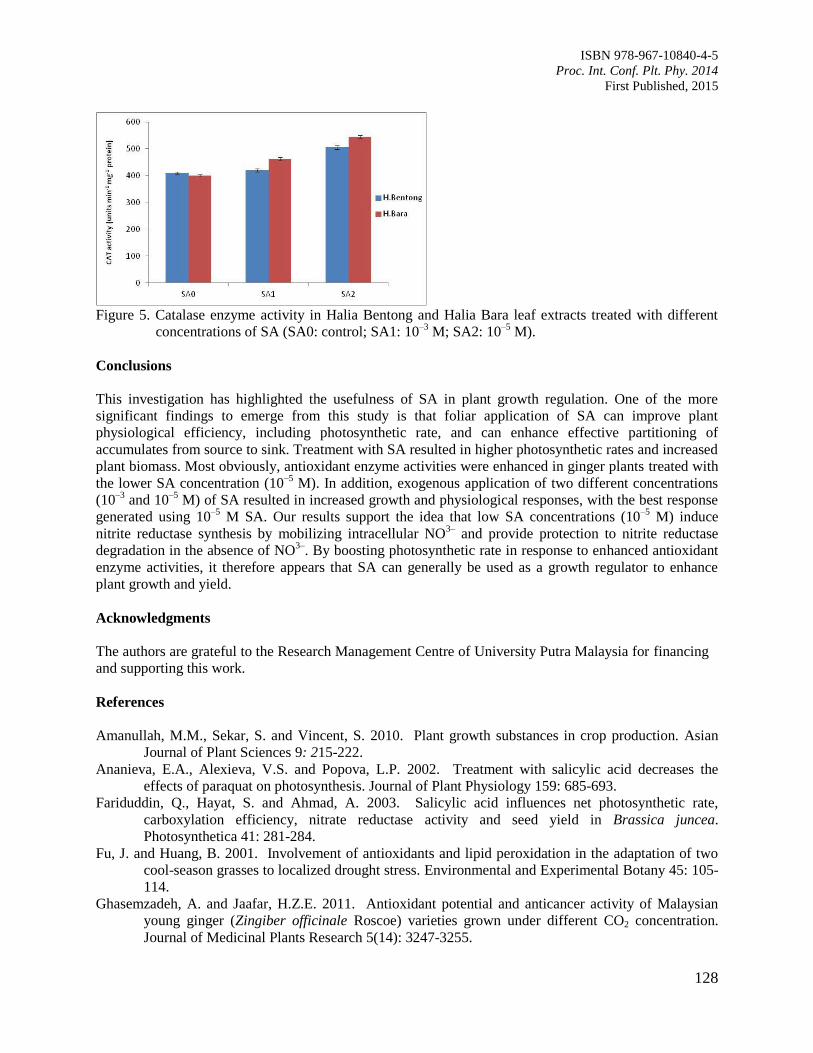
Tsan Fui Ying
Normaniza Osman
Roohaida Othman
Phebe Ding
Siti Hajar Ahmad
Siti Aishah Hassan
Puteri Edaroyati Megat Wahab
Hazandy Abdul Hamid
Lok Eng Hai
Soetanto Abdoellah
A. Adi Prawoto
John Bako Baon
Md Sarwar Jahan
Malaysian Society of Plant
Physiology
Indonesian Coffee & Cocoa
Research Institute
Page 2
ISBN 978-967-10840-4-5
Proc. Int. Conf. Plt. Phy. 2014
First Published, 2015
ii
PROCEEDINGS OF THE INTERNATIONAL CONFERENCE ON PLANT PHYSIOLOGY 2014
Enhancing Strategic Plant Physiological Research and
Technologies for Sustainable Resources
held at Discovery Kartika Plaza Hotel, Bali, Indonesia (26-28 August 2014)
Ahmad Nazarudin Mohd Roseli
Tsan Fui Ying
Normaniza Osman
Roohaida Othman
Phebe Ding
Siti Hajar Ahmad
Siti Aishah Hassan
Puteri Edaroyati Megat Wahab
Hazandy Abdul Hamid
Lok Eng Hai
Soetanto Abdoellah
A. Adi Prawoto
John Bako Baon
Md Sarwar Jahan
Organized by
Malaysian Society of Plant
Physiology
Indonesian Coffee & Cocoa
Research Institute
Publisher
Malaysian Society of Plant Physiology
(Persatuan Fisiologi Tumbuhan Malaysia)
Beg Berkunci No. 282, Pejabat Pos UPM
43409 UPM, Serdang, Selangor
URL: http//mspp.org.my
Page 3
ISBN 978-967-10840-4-5
Proc. Int. Conf. Plt. Phy. 2014
First Published, 2015
iii
CONTENTS Page
Table of contents iii
CHAPTER 1: PLANT GROWTH, DEVELOPMENT AND PRODUCTION 1
1. Vegetative Propagation in Cocoa (Theobroma cacao): Effects of Propagation
Environment and Rooting Substrates on Rooting Behaviour of Cocoa Stem Cuttings
Tee, Y.K. and Lamin, K.
2
2. Effect of Tuber Seed Size on Vine Growth and Yield of Dioscorea hispida
Zakaria, A.J. and Nordin, M.N.
8
3. The Effect of Tapping Intensity and Stimulation on Latex Physiological Characters and
Incidence of Tapping Panel Dryness
Eva, H. and Kuswanhadi.
13
4. Cellular Changes in Cocoa Clones Graft Compatibility
Rozita, O., Nurashikin, A. and Razi, I.
20
5. Innovation on Pepper (Piper nigrum L.) Farming to Ensure High Production of Planting
Materials
Chen, Y.S. and Kho, P.E.
25
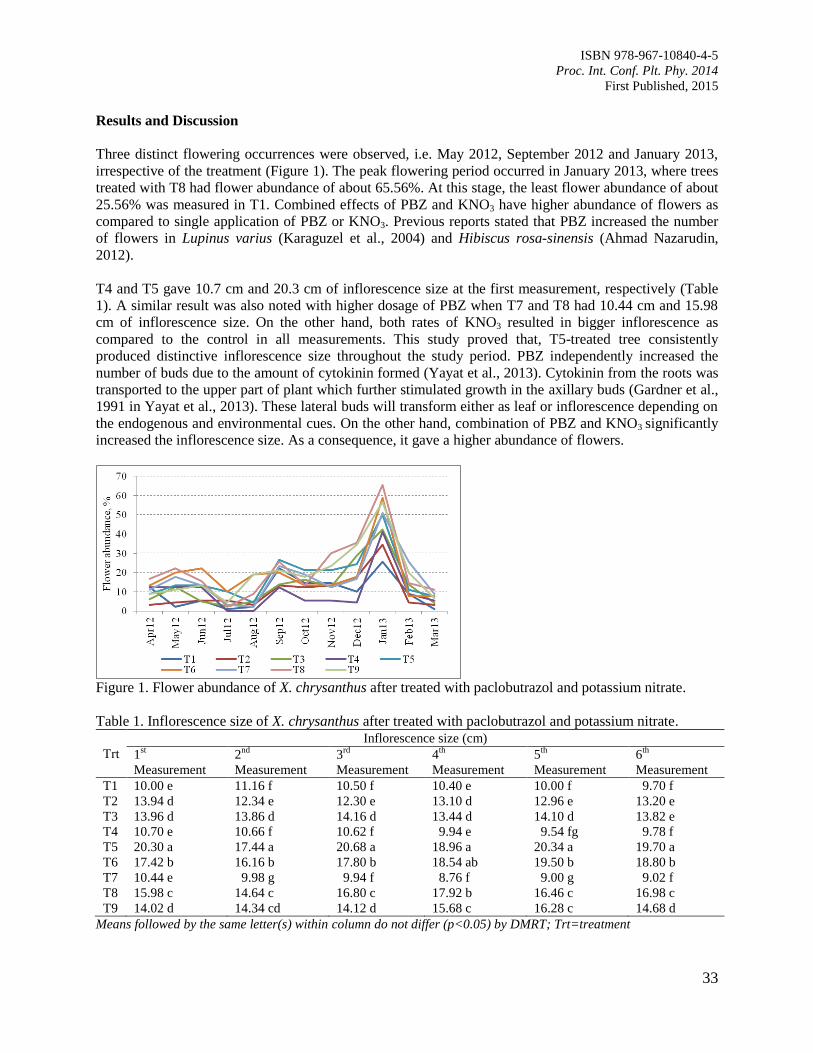
6. Flowering Improvement of a Landscape Tree, Xanthostemon chrysanthus by Using
Paclobutrazol and Potassium Nitrate
Ahmad Nazarudin, M.R., Tsan, F.Y. and Normaniza, O.
32
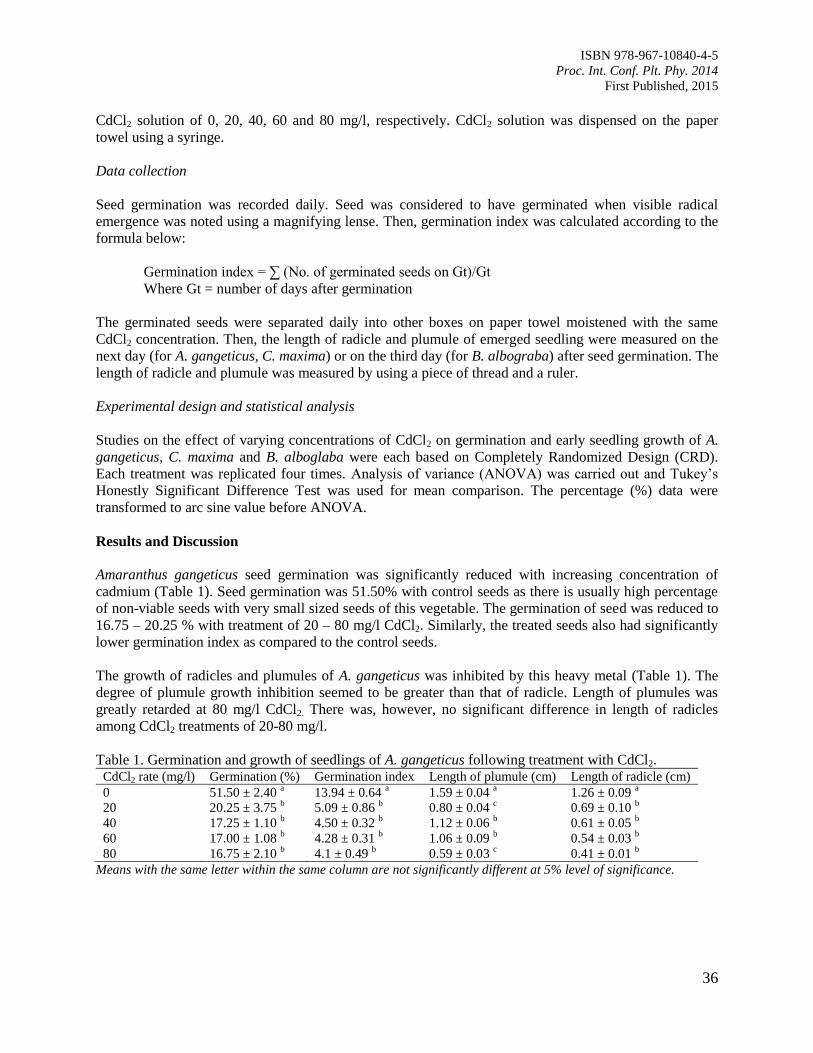
7. Cadmium Effect on Seed Germination and Seedling Growth of Amaranthus gangeticus,
Cucurbita maxima and Brassica alboglaba
Tsan, F.Y., Hasimah, M., Engku Abdul Fattah, E.A. and Nurul Haslidawani, M.H.
35
8. Yield Analysis of Rice between System of Rice Intensification (SRI) and Conventional
Farming in Sabak Bernam District, Selangor, Malaysia – A Case Study
Tsan, F.Y. and Orlando, G.J.
40
CHAPTER 2: ECOPHYSIOLOGY AND STRESS BIOLOGY 48
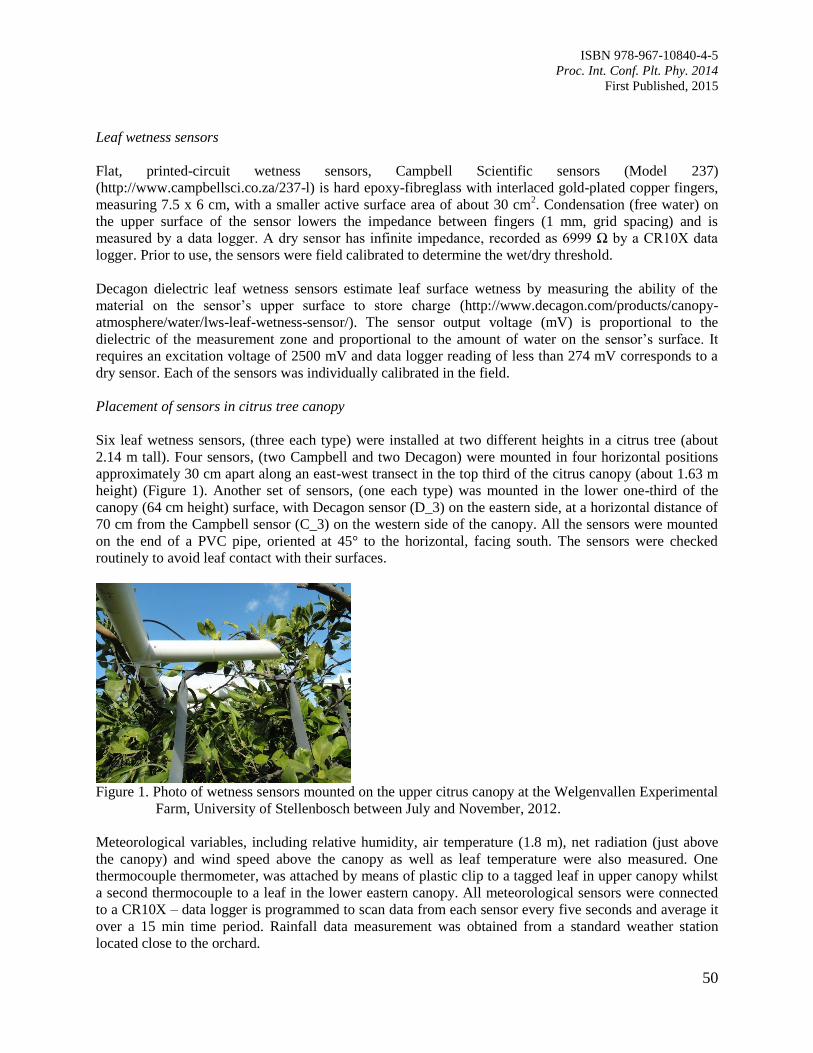
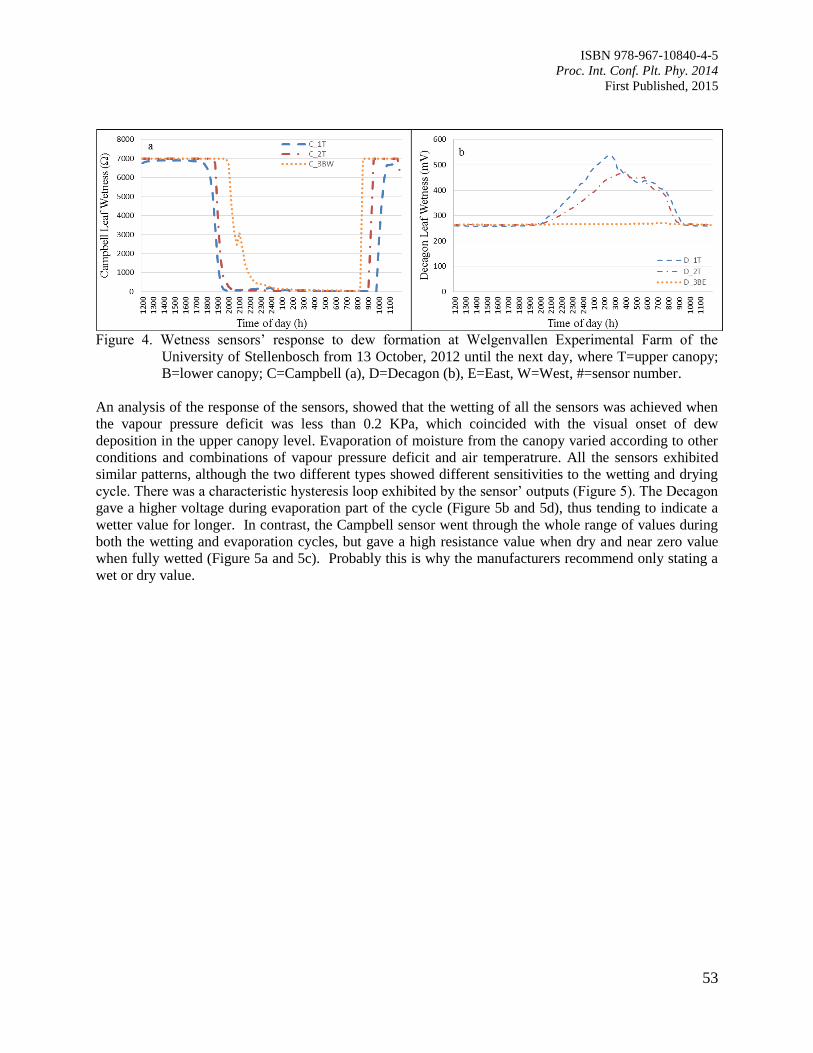
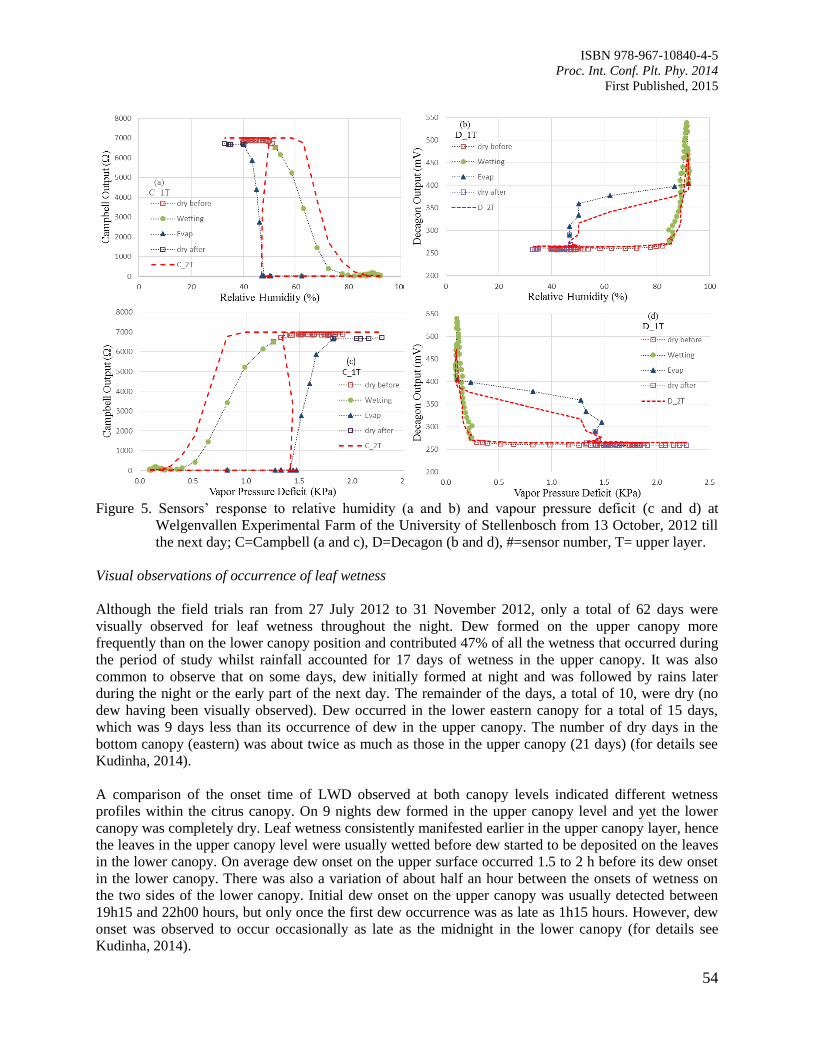
9. Comparison of Leaf Wetness in Upper and Lower Citrus Canopy
Walker, S. and Kudinha, M.T.
49
10. Antiodixant Defence System in Iron Deficient Groundnut Plants
Mann, A. and Singh Amrit, L.
59
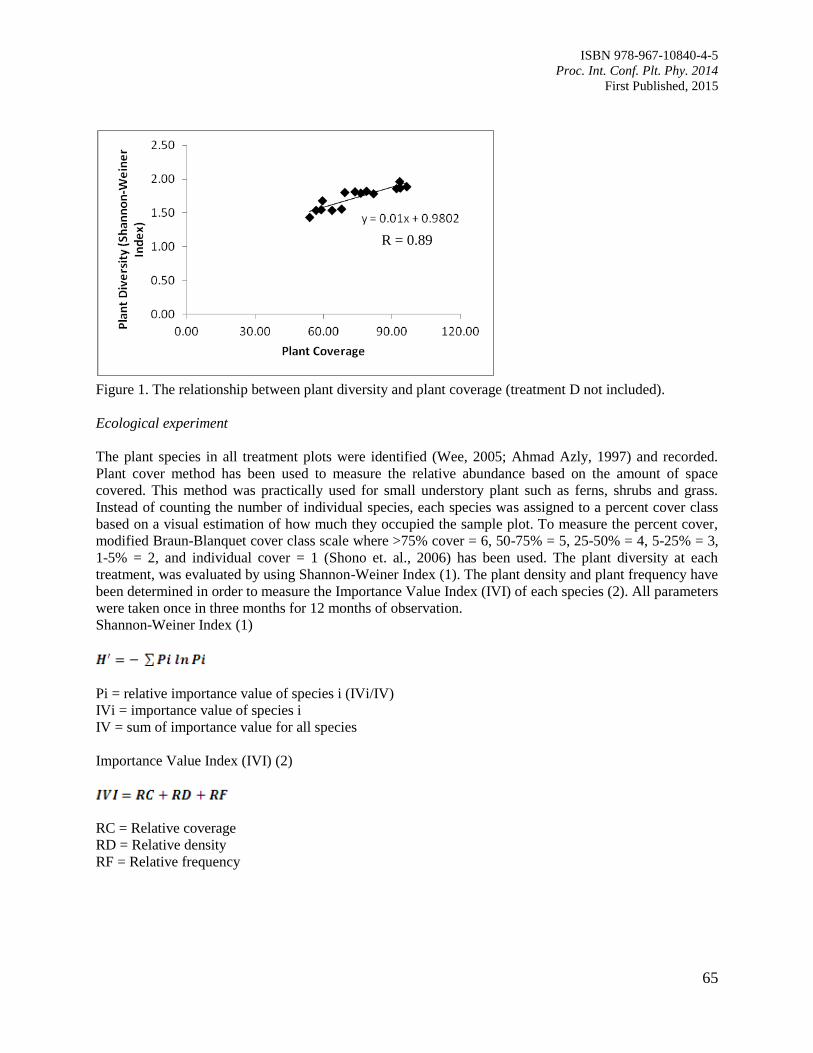
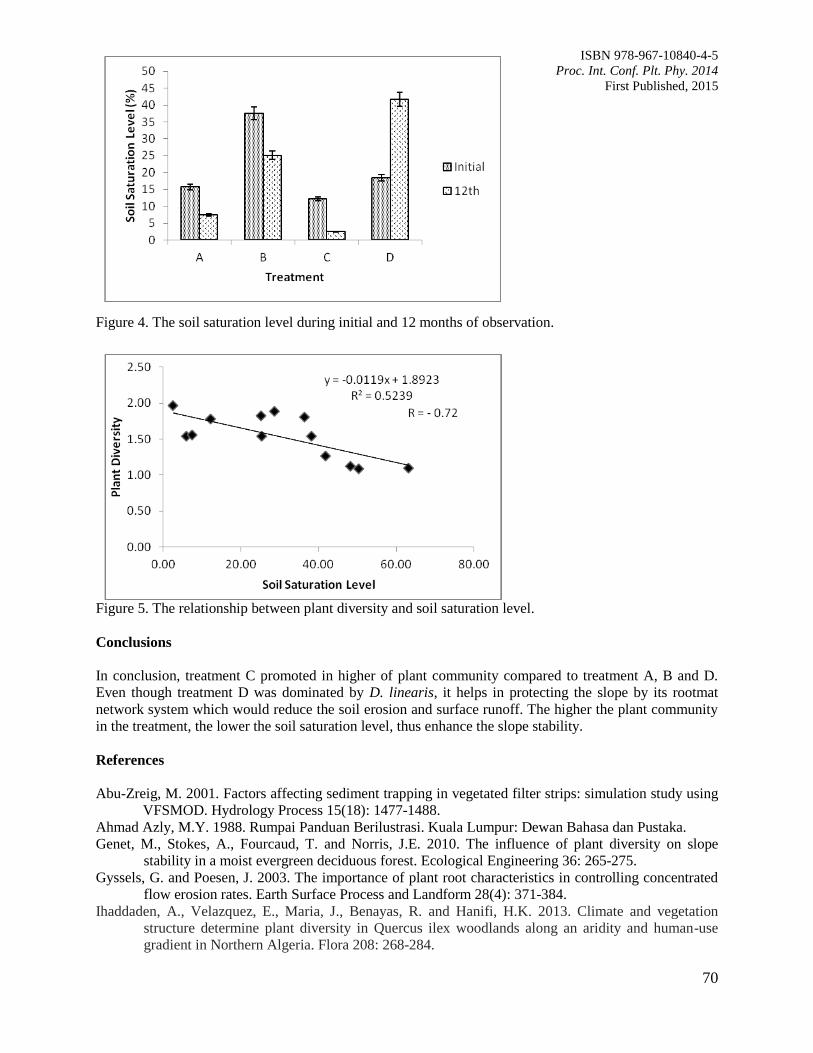
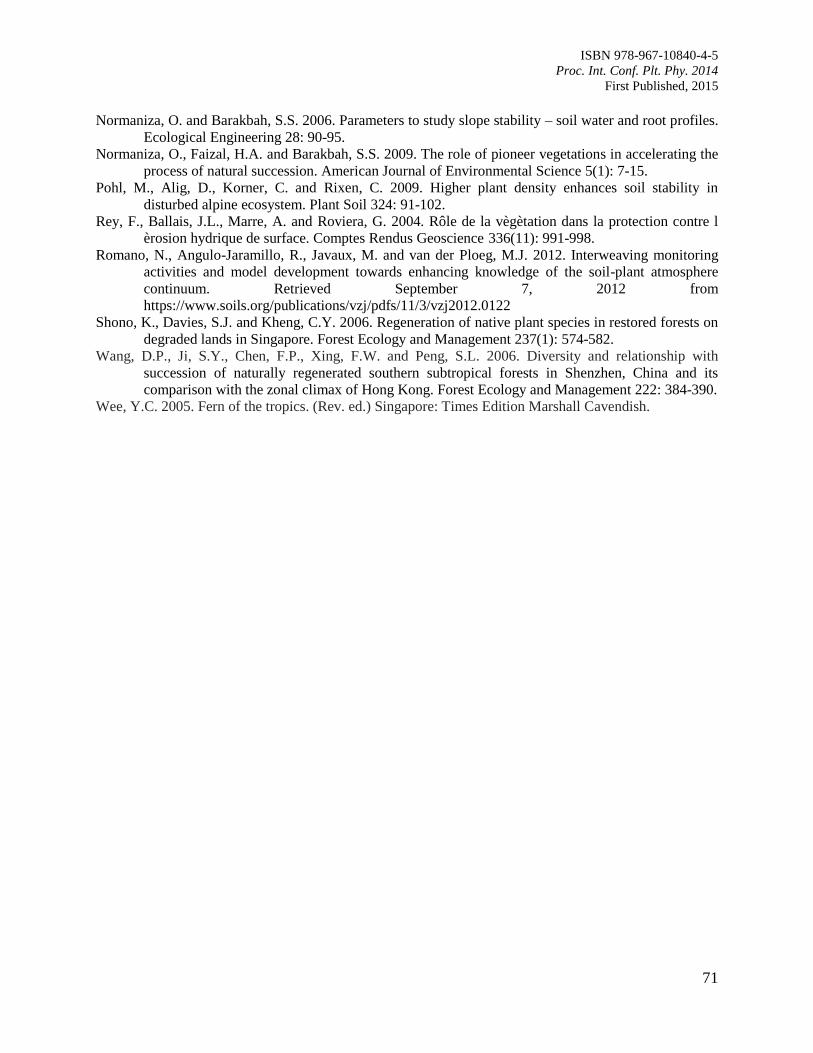
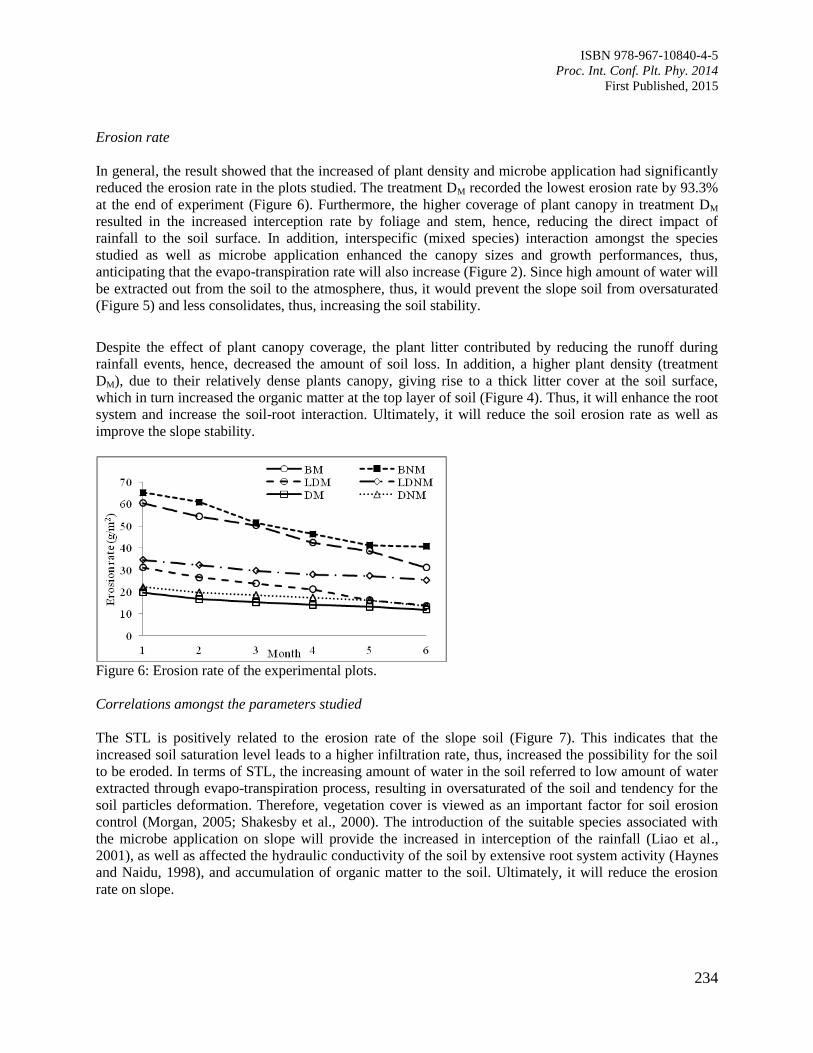
11. The Contribution of Plant Community towards Slope Protection
Nurul Izzaty, A.Z., Normaniza, O. and Rozainah, M.Z.
64
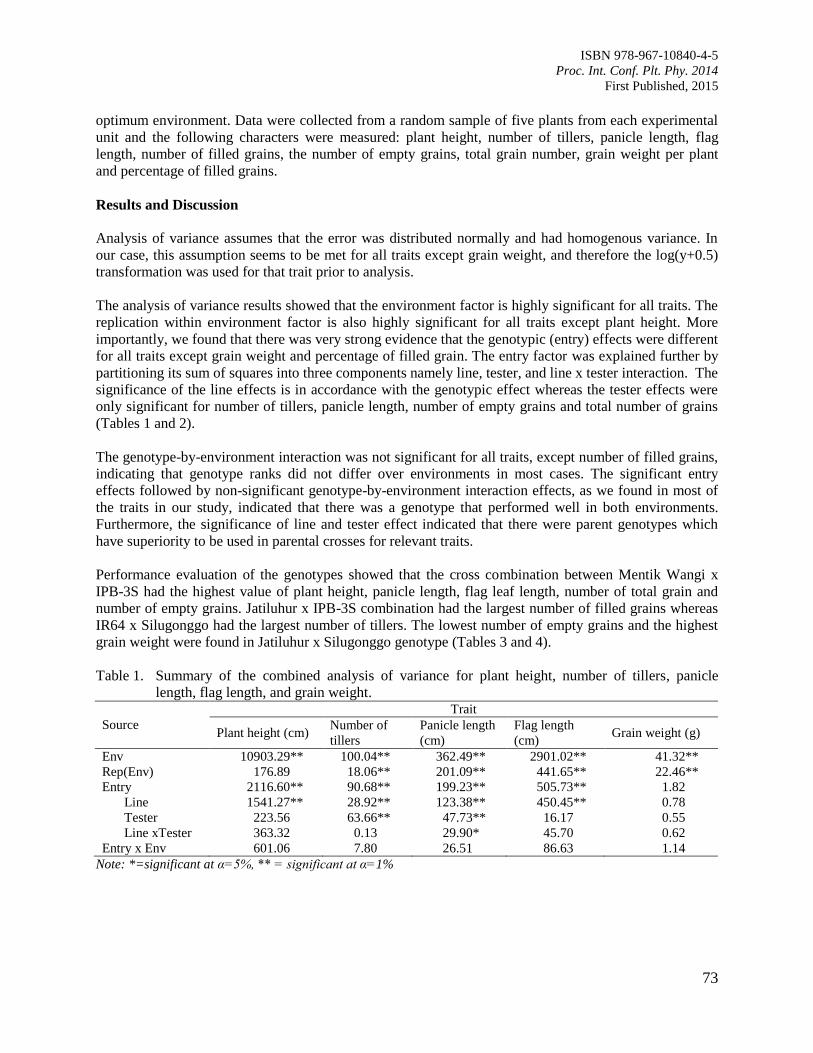
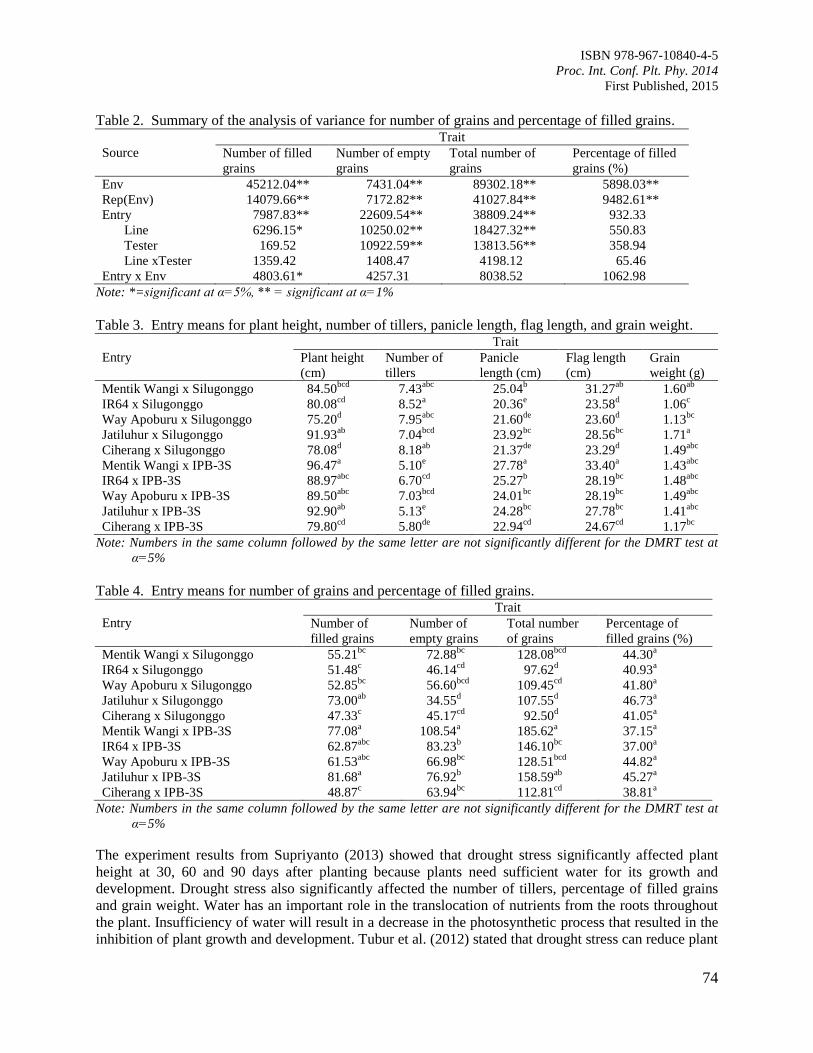
12. Evaluation of Rice Genotypes under Drought and Optimum Environmental Conditions
Suwarno, P.M., Wirnas, D. and Junaedi, A.
72
Page 4
ISBN 978-967-10840-4-5
Proc. Int. Conf. Plt. Phy. 2014
First Published, 2015
iv
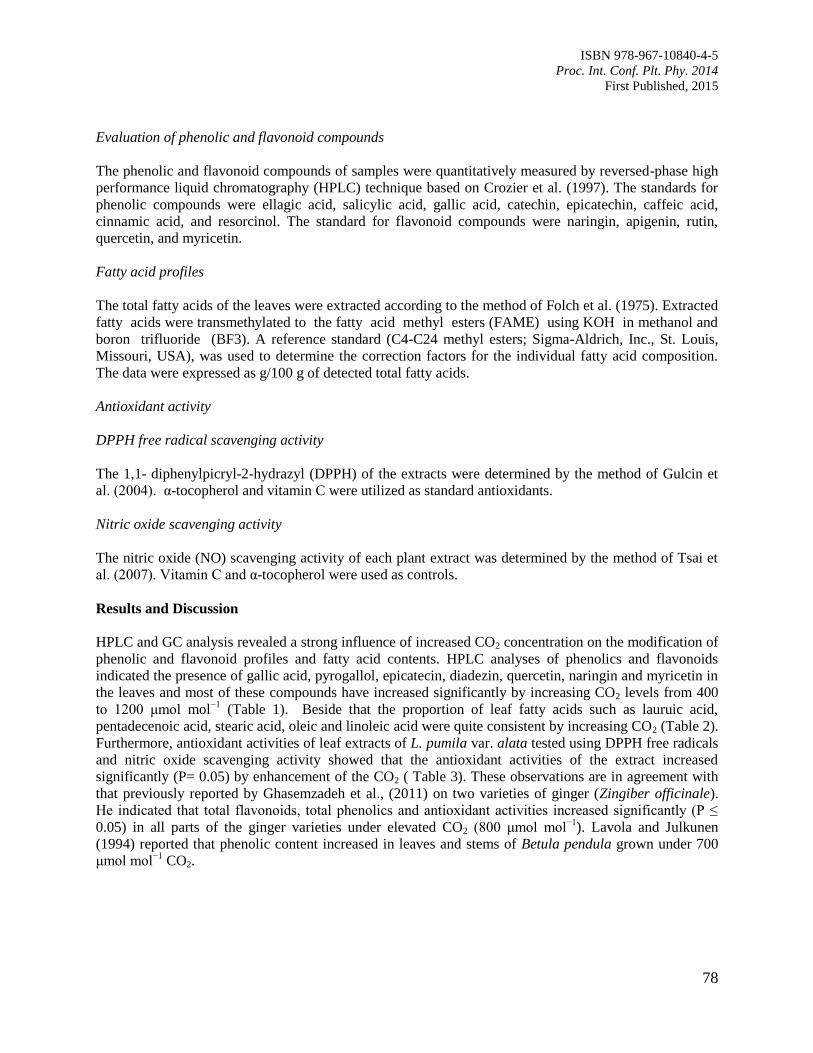
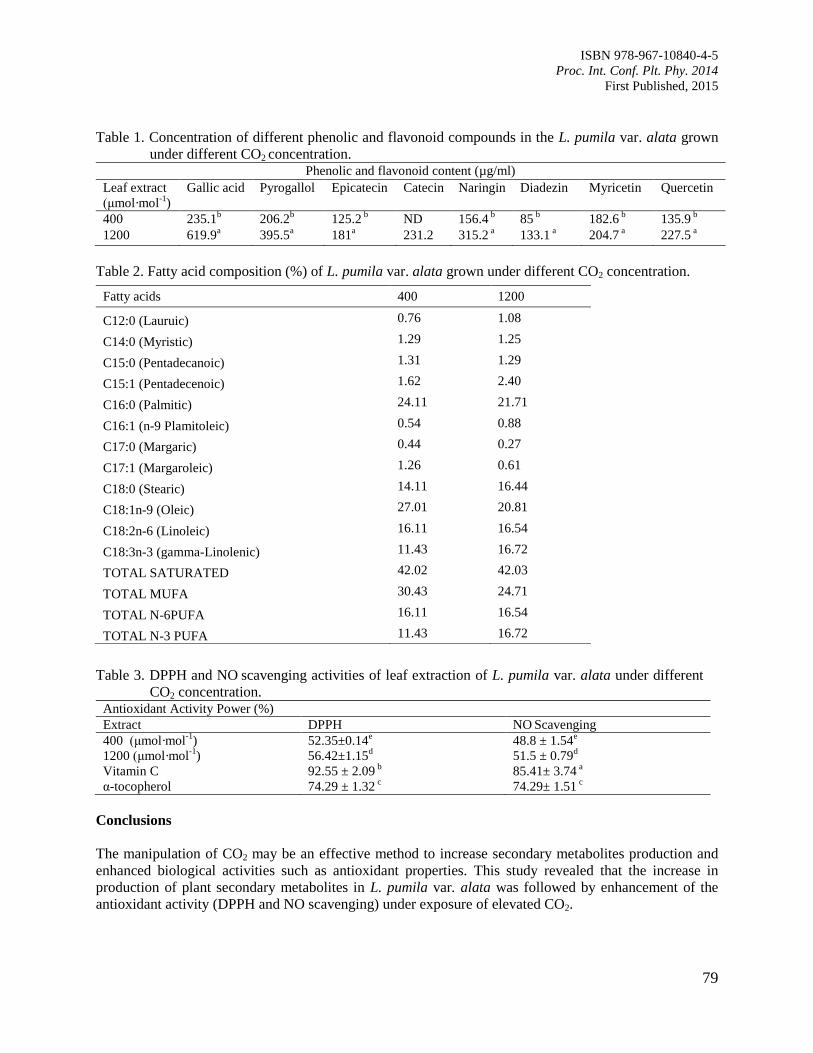
13. Response of CO2 Enrichment on Phytochemical Screening, Fatty Acid Content and Their
Antioxidant Activity on Labisia pumila var. alata
Karimi, E. and Jaafar, H.Z.E.
77
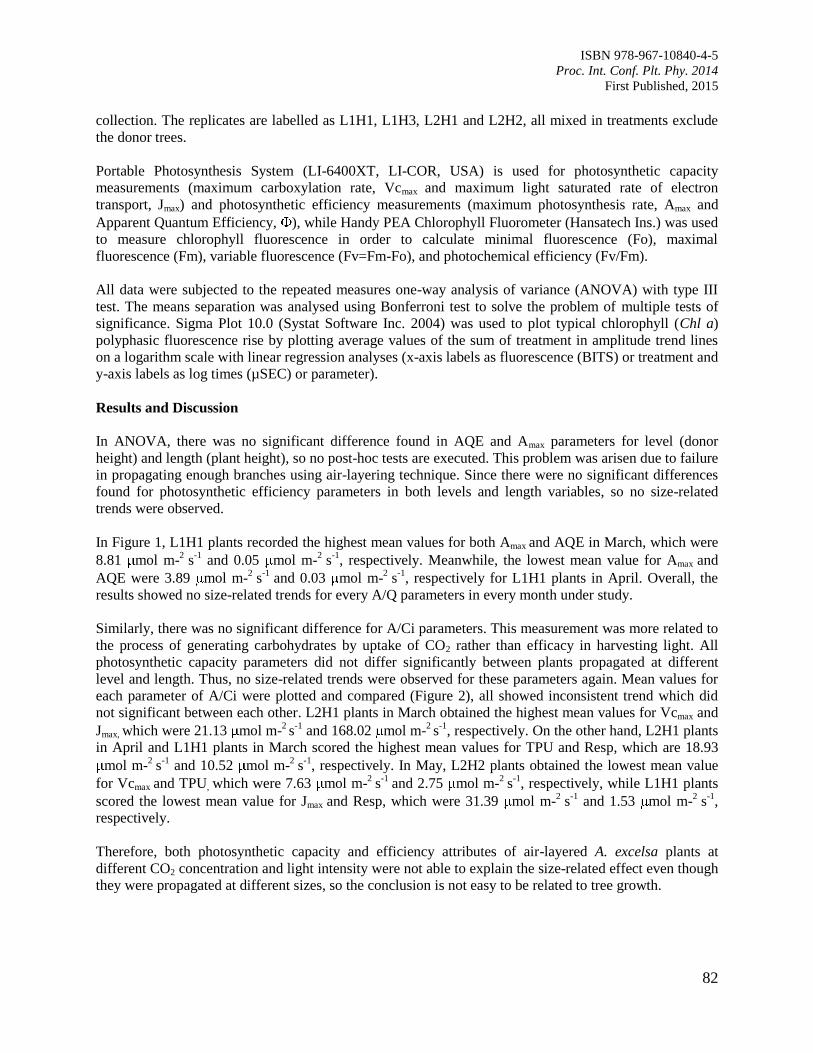
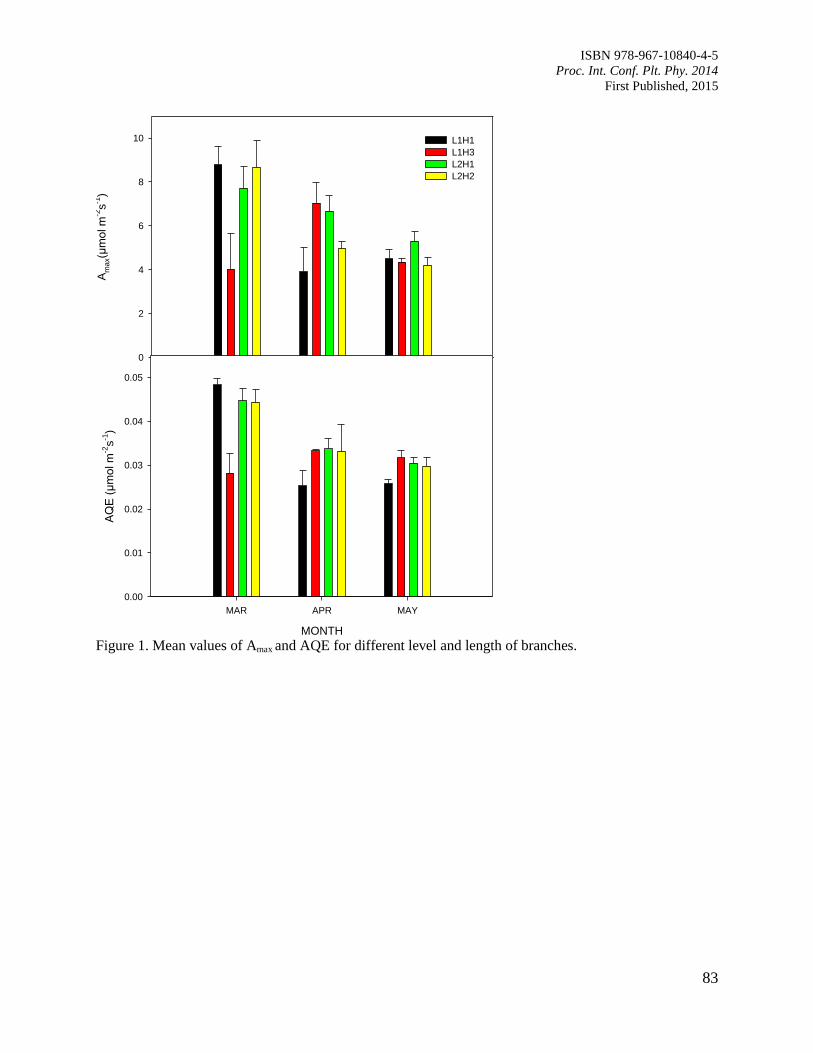
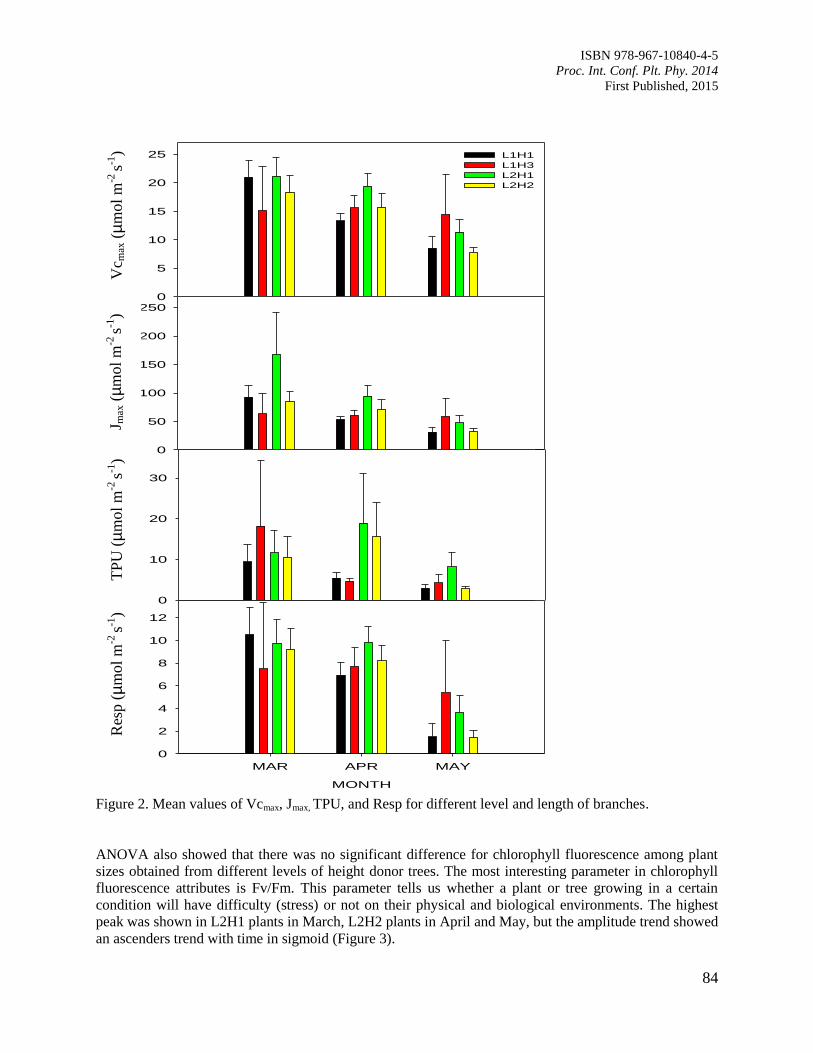
14. Assessment of Biochemical Processes on Different Sizes of Air-Layered Azadirachta
excelsa (Jack) M. Jacobs
Yap, M.L., Hazandy, A.H. and Kamil, I.
81
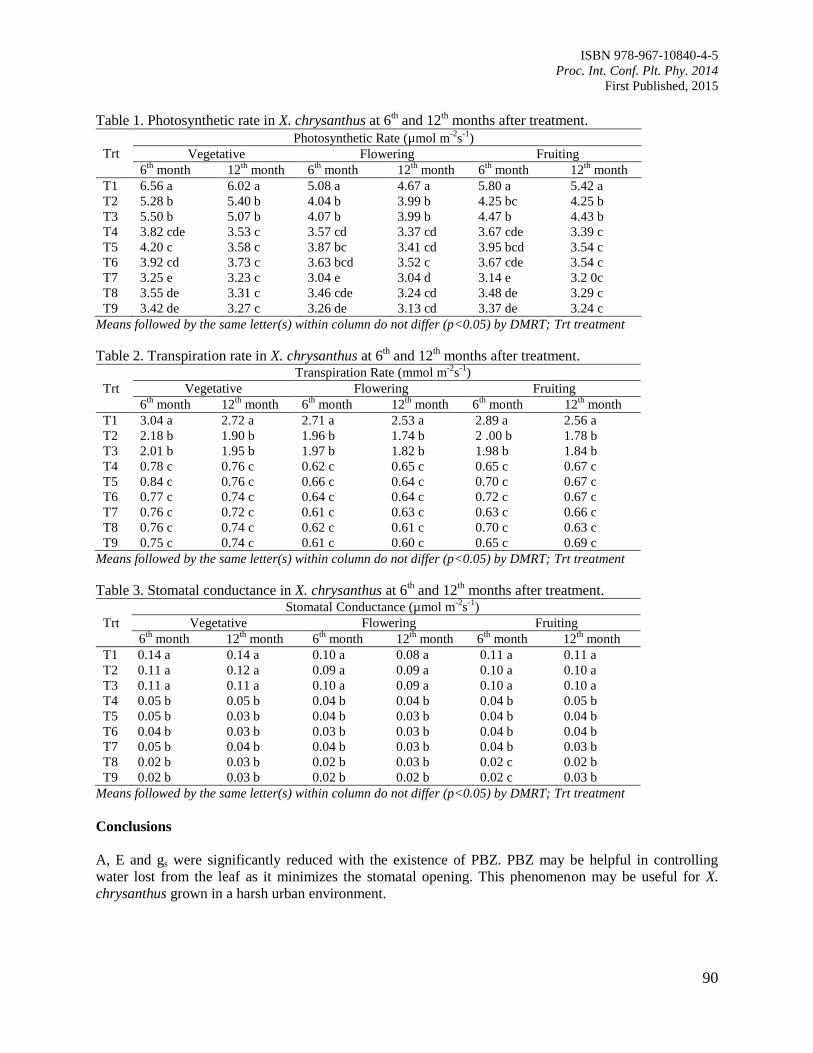
15. Physiological Changes of Xanthostemon chrysanthus as Affected by Paclobutrazol and
Potassium Nitrate
Ahmad Nazarudin, M.R., Tsan, F.Y. and Normaniza, O.
88
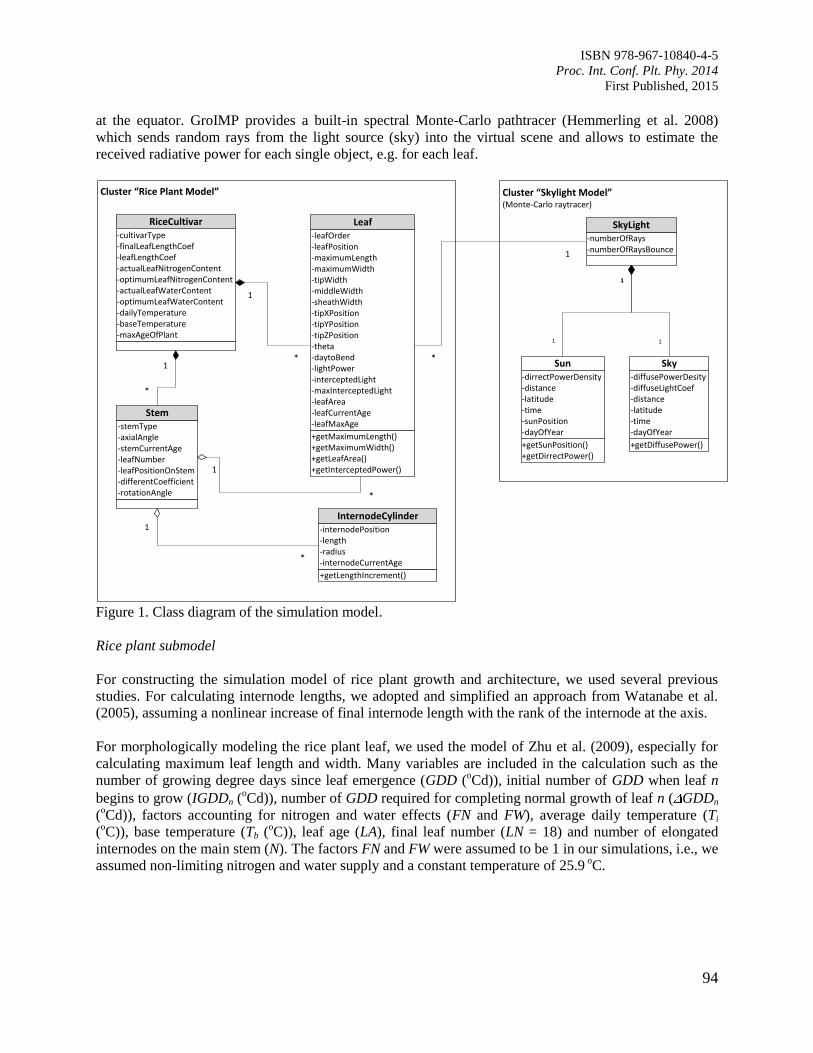
16. Determining the Influence of Plant Architecture on Light Interception of Virtual Rice
Plants on the Simulation Platform GroIMP
Utama, D.N., Ong, Y., Streit, K. and Kurth, W.
92
17. Changes of Empty Locul Proportion of Bean Characteristic in Robusta Coffee (Coffea
canephora) Caused by Drought Stress
Sumirat, U.
102
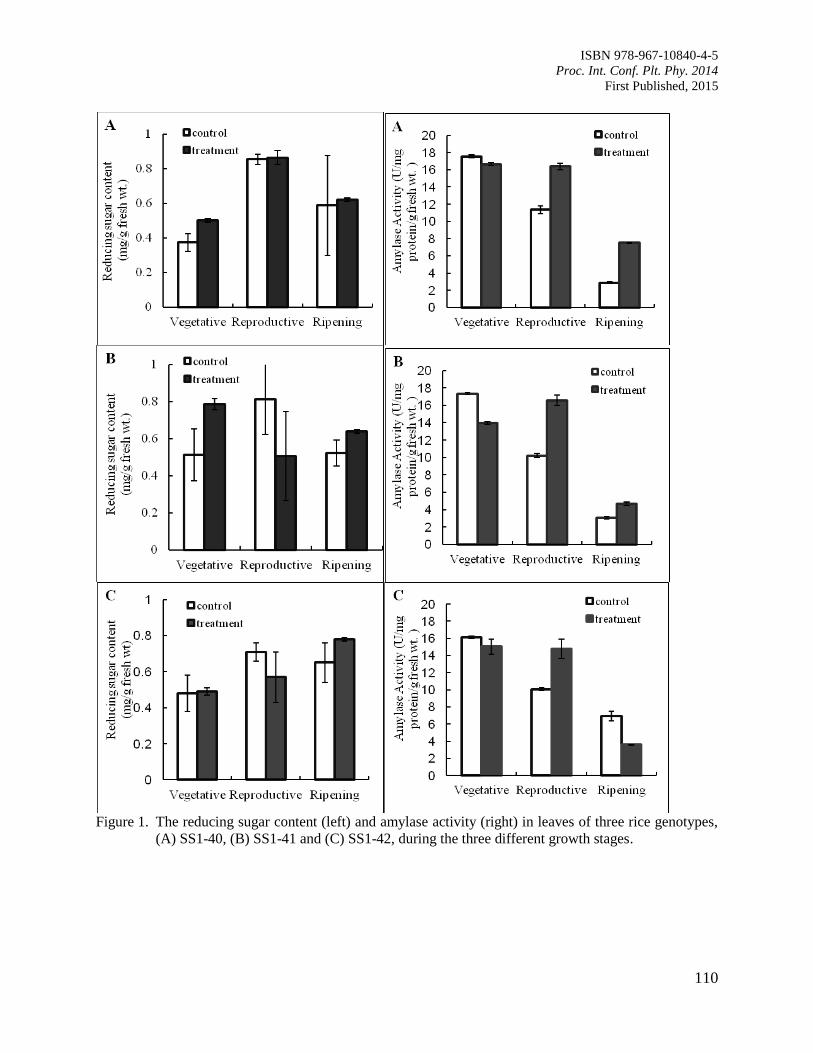
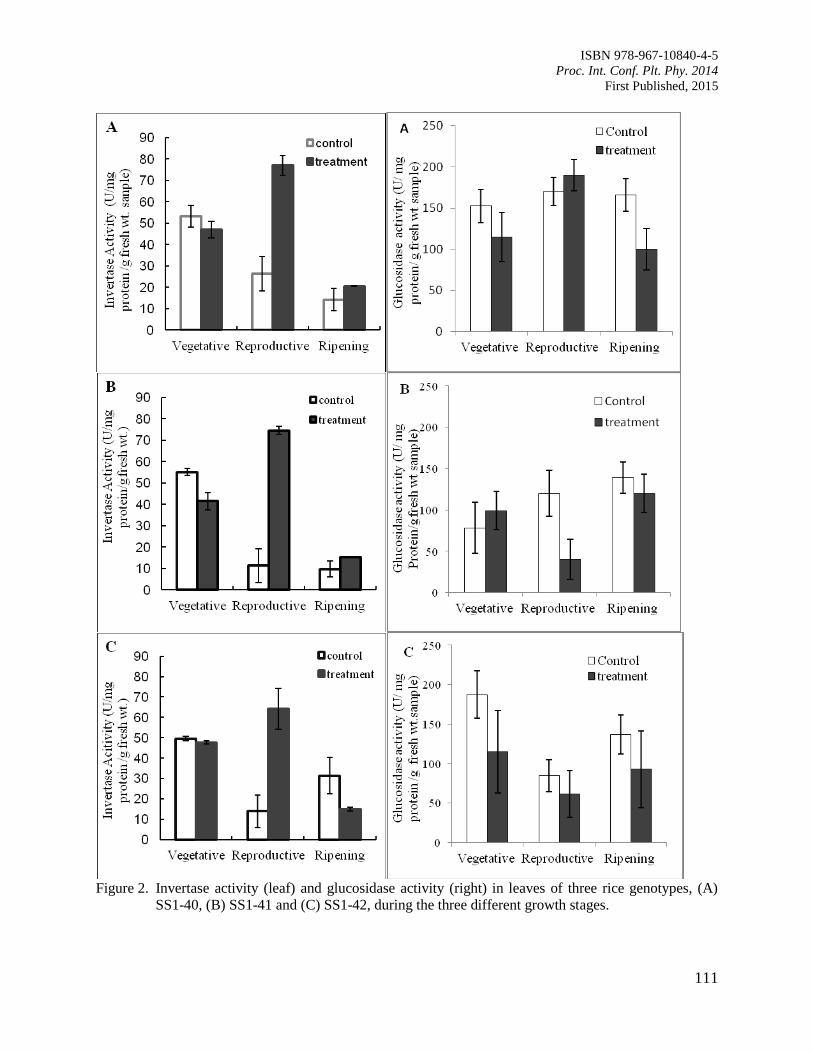
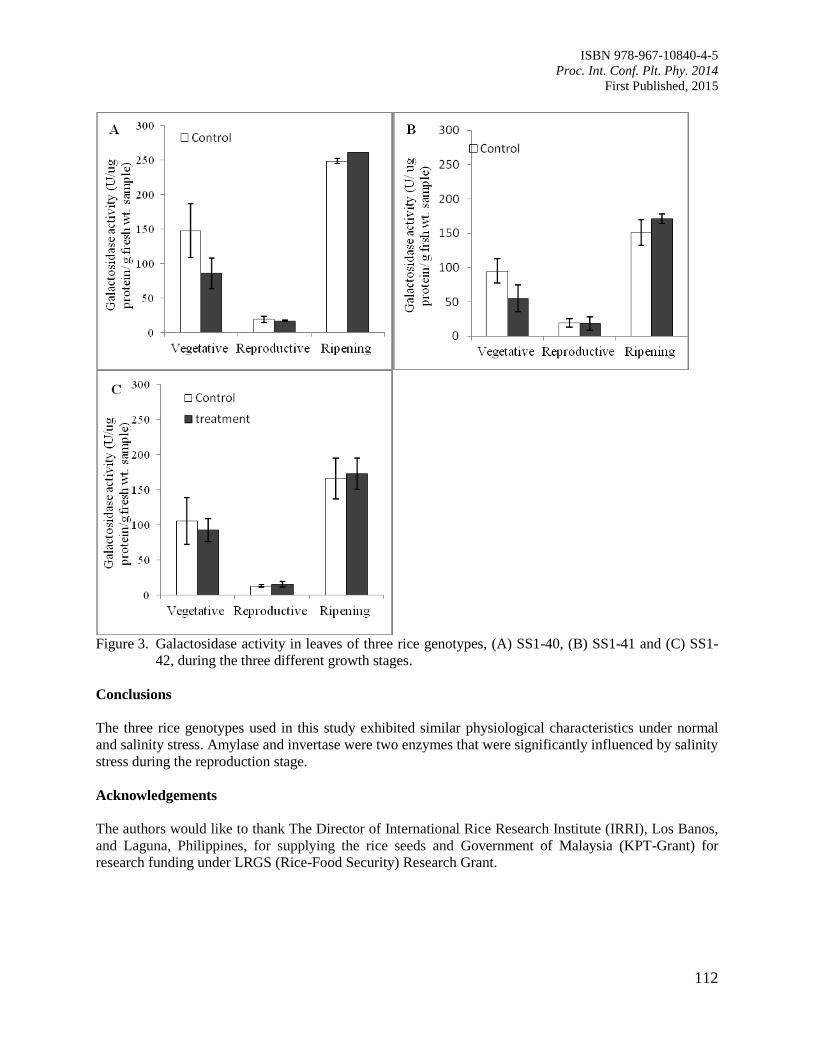
18. Glycosidases Activity in Salinity-Tolerant Rice Grown on Saline Soil under Malaysia
Condition
Aziz, A., Fatinah, A.A., Hidayah, M.S., Abdullah, M.Z. and Marziah, M.
107
19. Solar UV-B and UV-A/B Exclusion Effects on Intraspecific Variations in Physiological
Responses of Wheat Varieties
Kataria, S., Baroniya, S.S. and Guruprasad, K.N.
114
20. Role of Salicylic Acid as a Plant Growth Regulator on Some Physiological Features and
Antioxidant Enzyme Activity in Ginger (Zingiber officinale Roscoe)
Ali, G. and Hawa, Z.E.J.
122
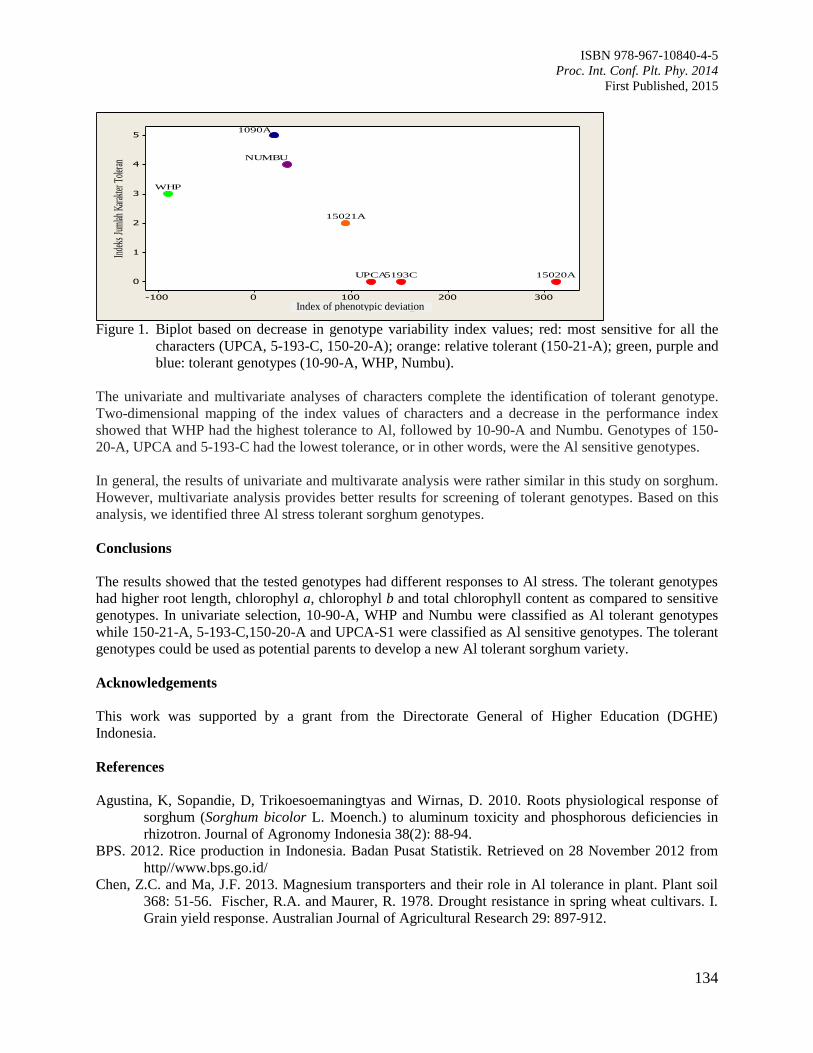
21. Screening of Sorghum (Sorghum bicolor L. Moench) Genotypes for Aluminium Stress
Tolerance in Nutrient Culture
Lestari, T., Sopandie, D., Trikoesoemaningtyas. and Ardie, S.W.
130
CHAPTER 3: POSTHARVEST TECHNOLOGY AND QUALITY CONTROL 136
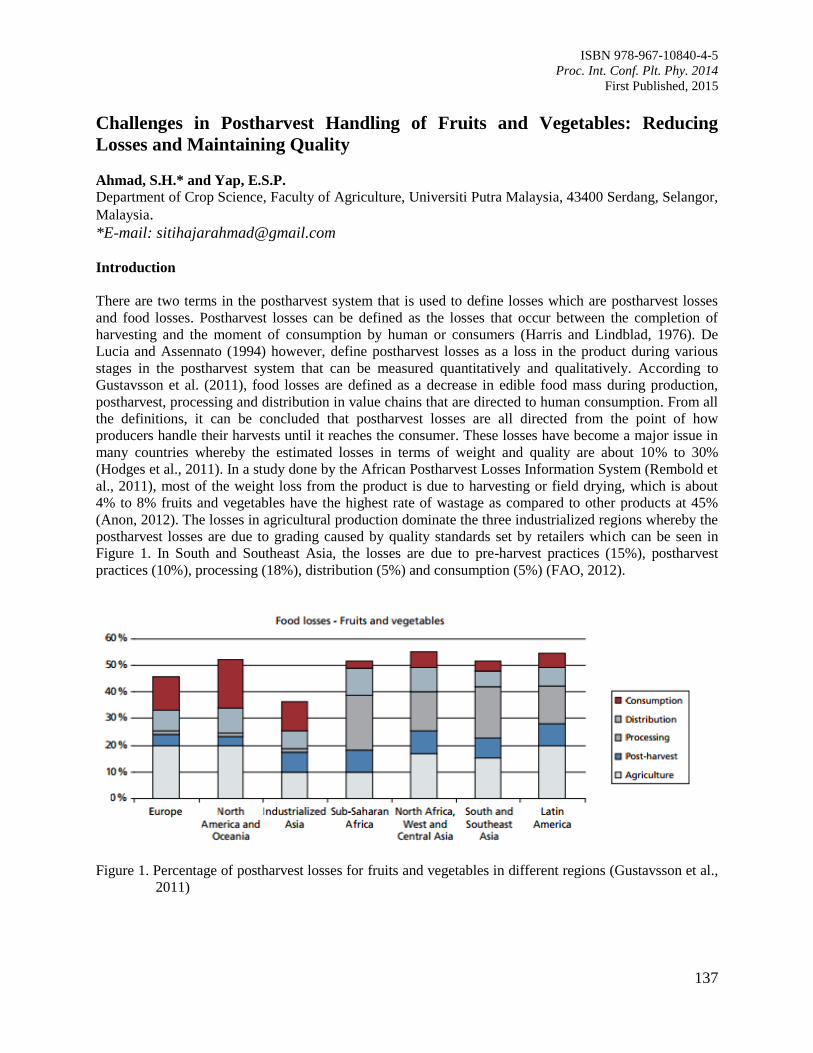
22. Challenges in Postharvest Handling of Fruits and Vegetables: Reducing Losses and
Maintaining Quality
Ahmad, S.H. and Yap, E.S.P.
137
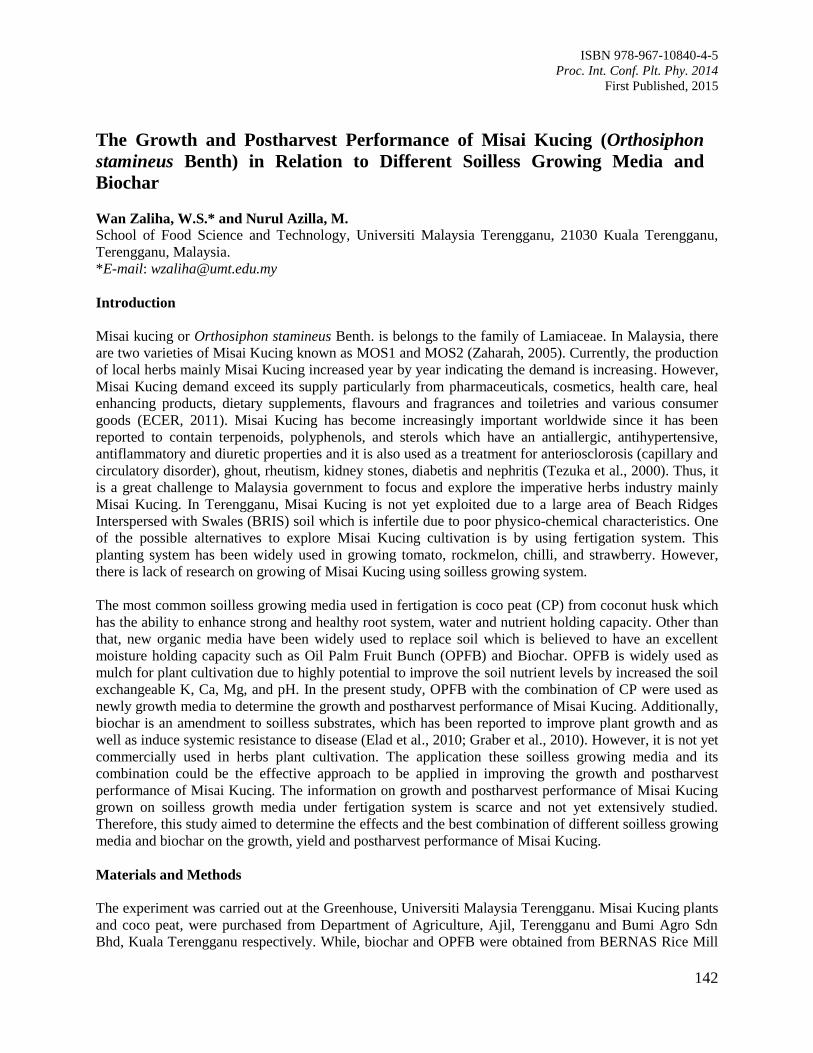
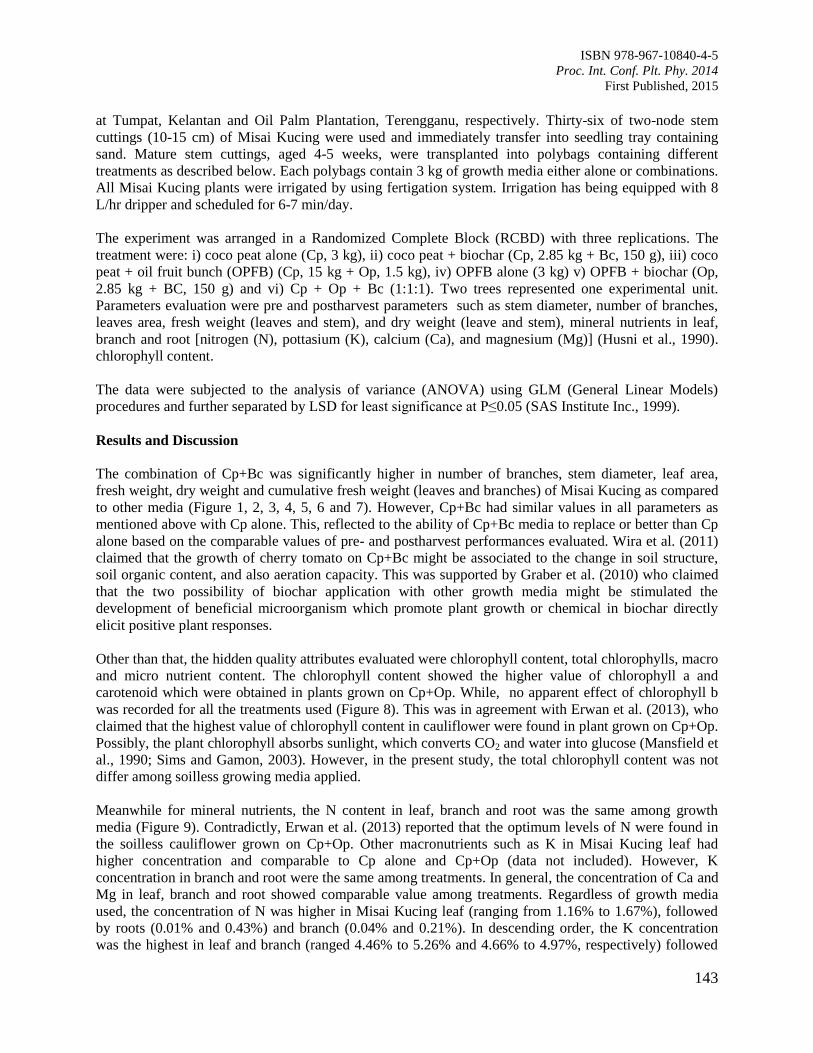
23. The Growth and Postharvest Performance of Misai Kucing (Orthosiphon stamineus
Benth) in Relation to Different Soilless Growing Media and Biochar
Wan Zaliha, W.S. and Nurul Azilla, M.
142
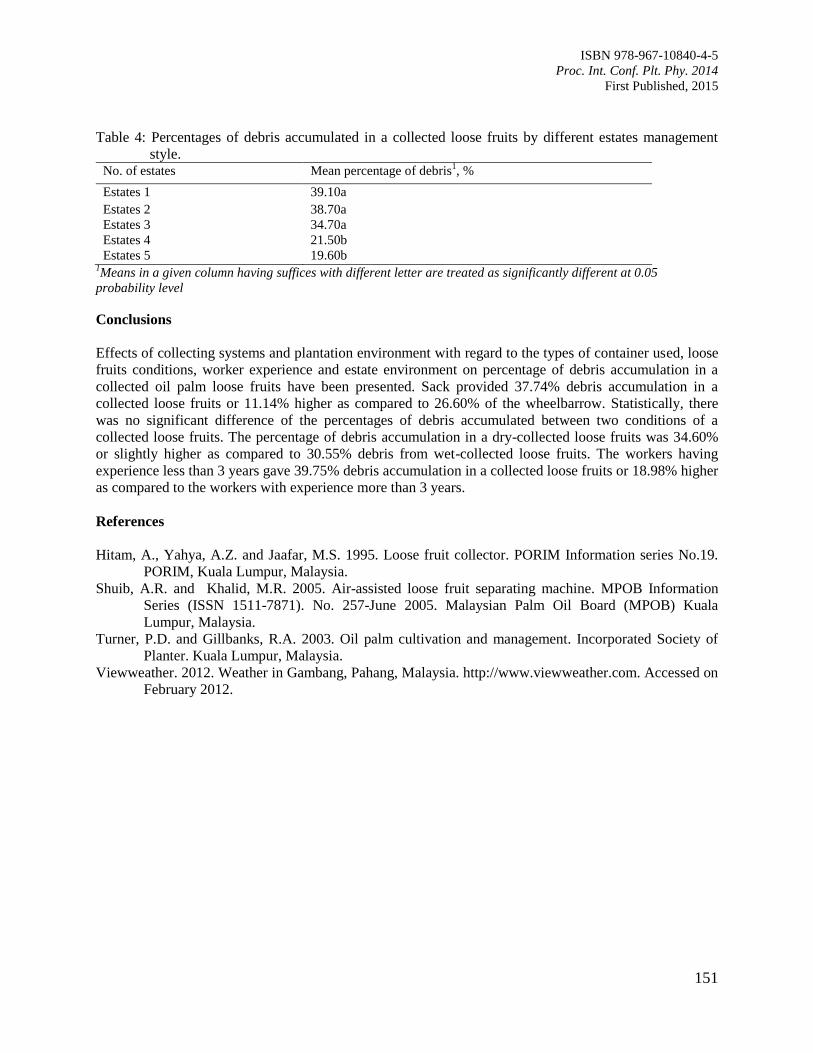
24. Effects of Collecting Systems and Plantation Environment on Debris Accumulation in a
Collected Oil Palm Loose Fruits
Darius, E.P. and Muhammad Fairulnizam, H.
147
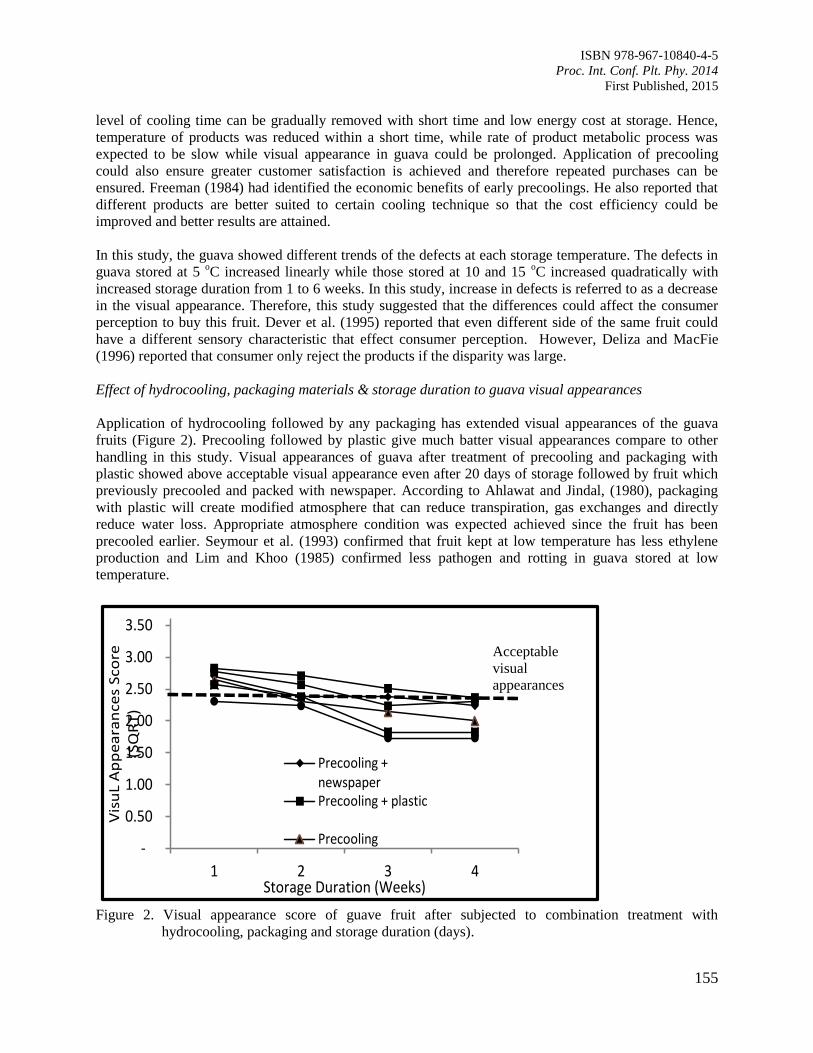
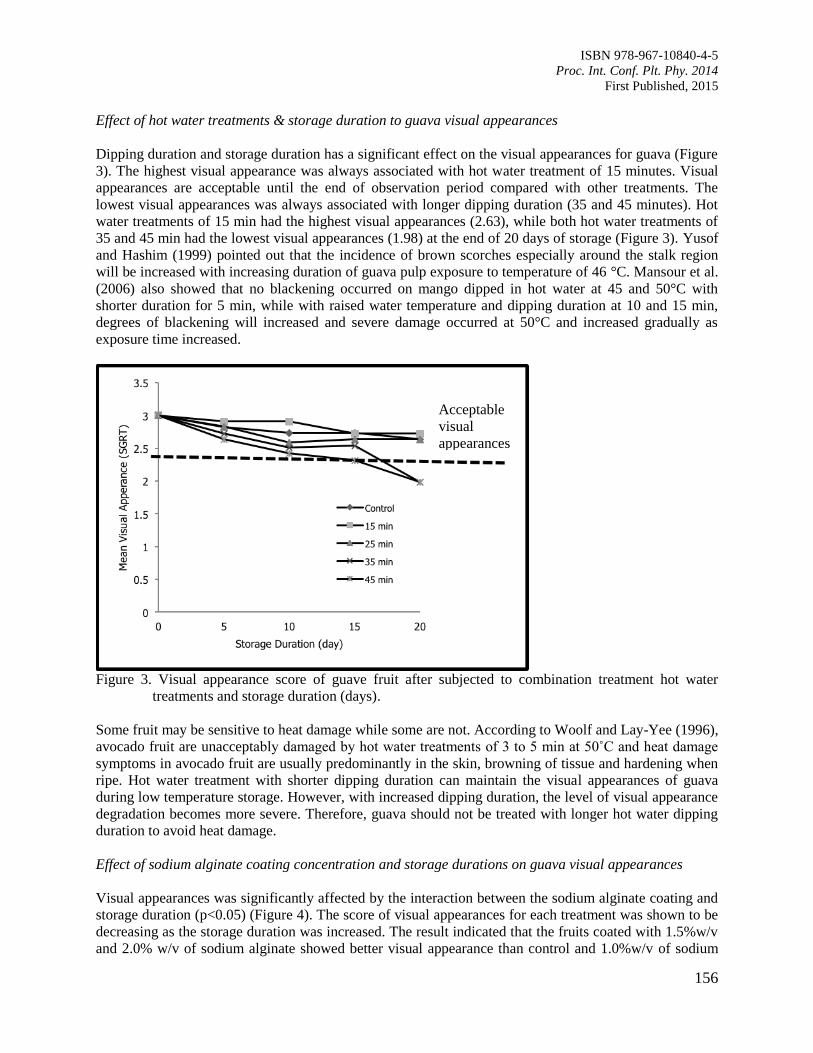
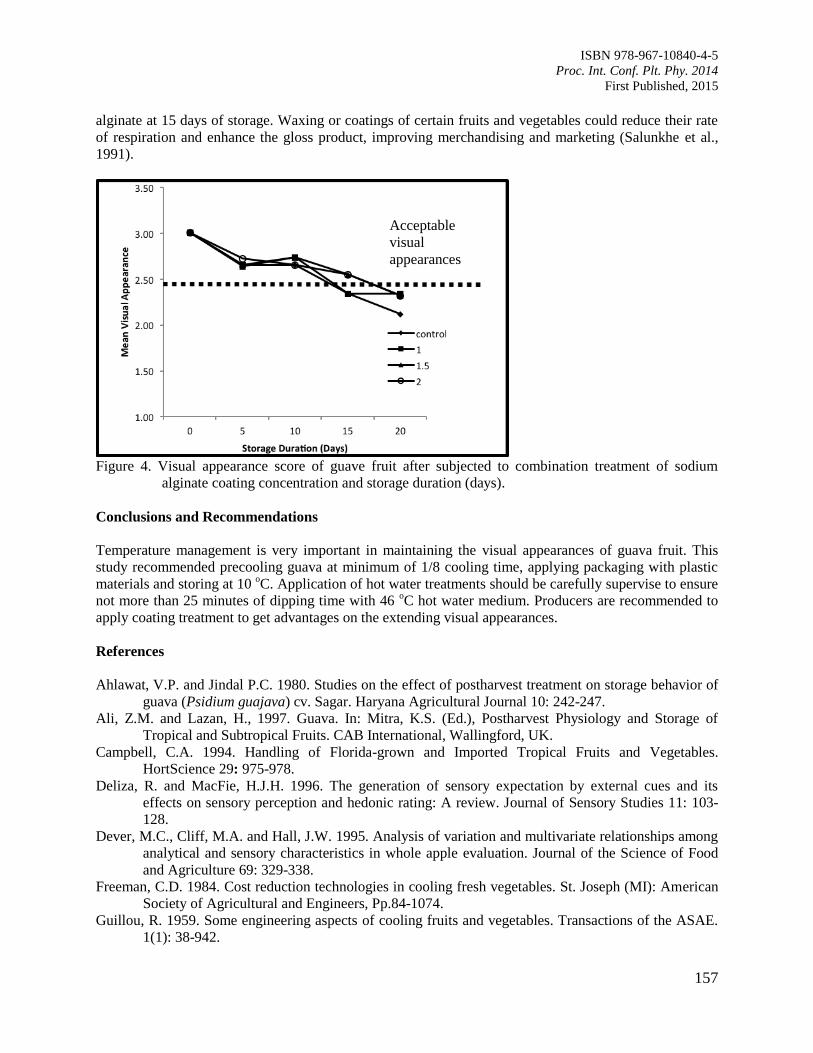
25. Postharvest Life of Guava Fruit under Selected Postharvest Handling Practices
Silip, J.J., Yung, R.R., Lim, K.S., Mohamad, M. and Hamdan, S.M.
152
Page 5
ISBN 978-967-10840-4-5
Proc. Int. Conf. Plt. Phy. 2014
First Published, 2015
v
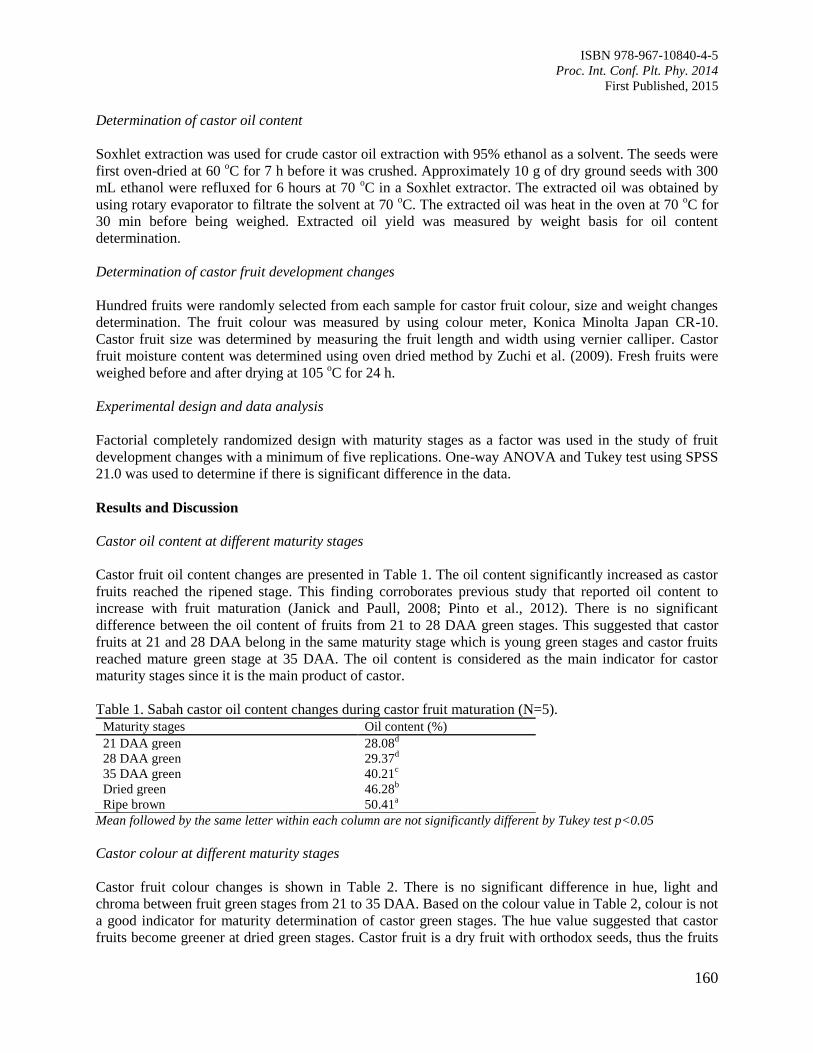
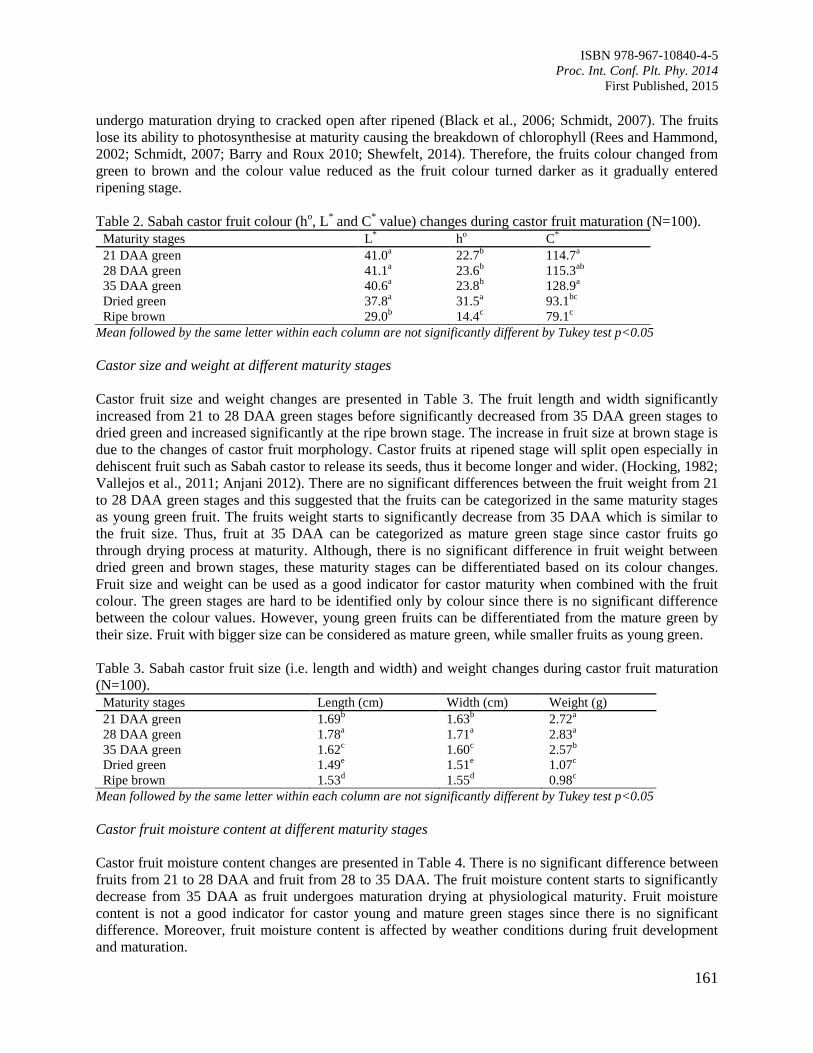
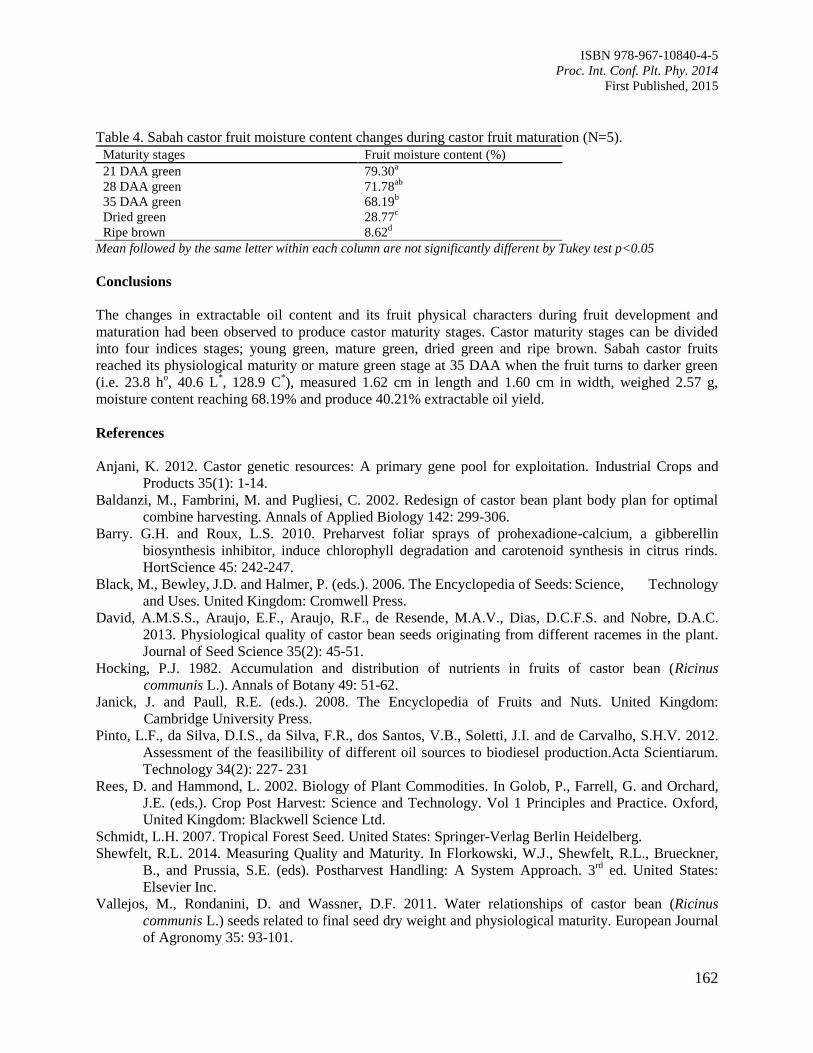
26. Sabah Castor (Ricinus communis Linn) Maturity Stages Based on Oil Content and Fruit
Development Changes
Hilarion, C.C.C., Silip, J.J., Atong, M., Jalloh, M.B. and Gansau, J.A.
159
CHAPTER 4: BIOTECHNOLOGY 164
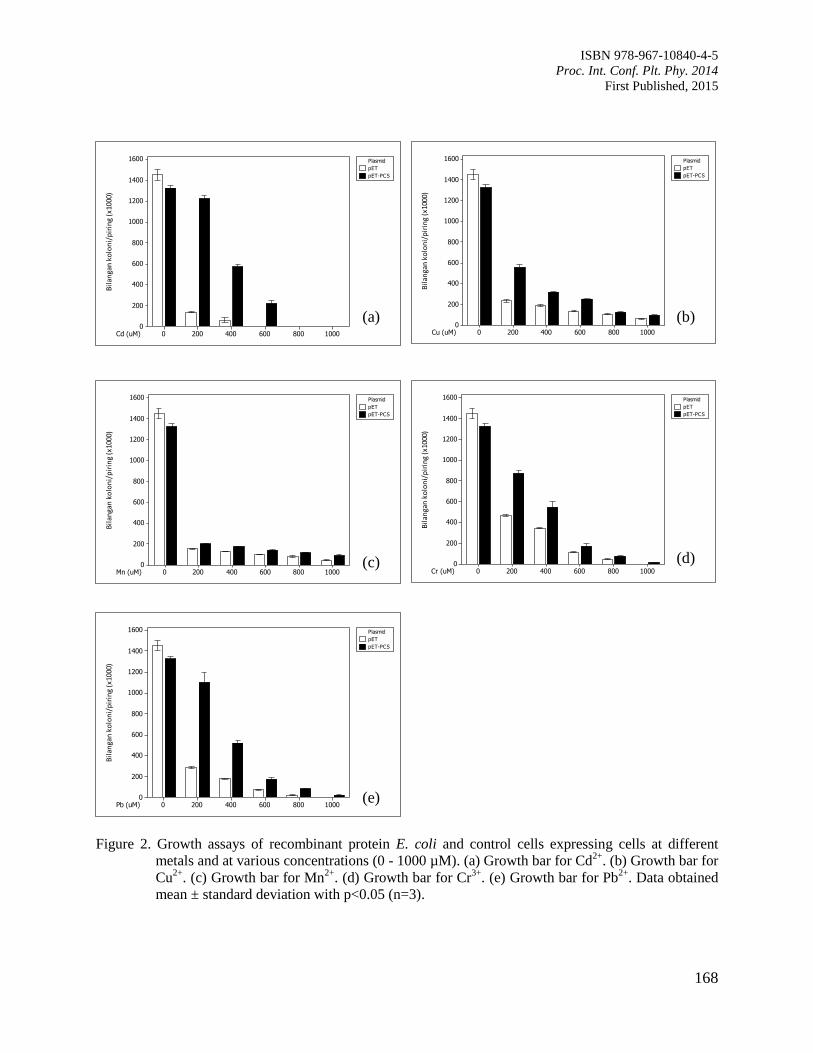
27. Functional Analysis of Eucheuma denticulatum Gene Involved in Phytoremediation
Othman, R. and Murthy, S.
165
28. In vitro Regeneration of Jatropha curcas: Cotyledonary Leaf Induced More Shoots than
Other Explants
Azmi, A.R., Maheran, A.A., Mariah, A.H. and Halimi, M.S.
171
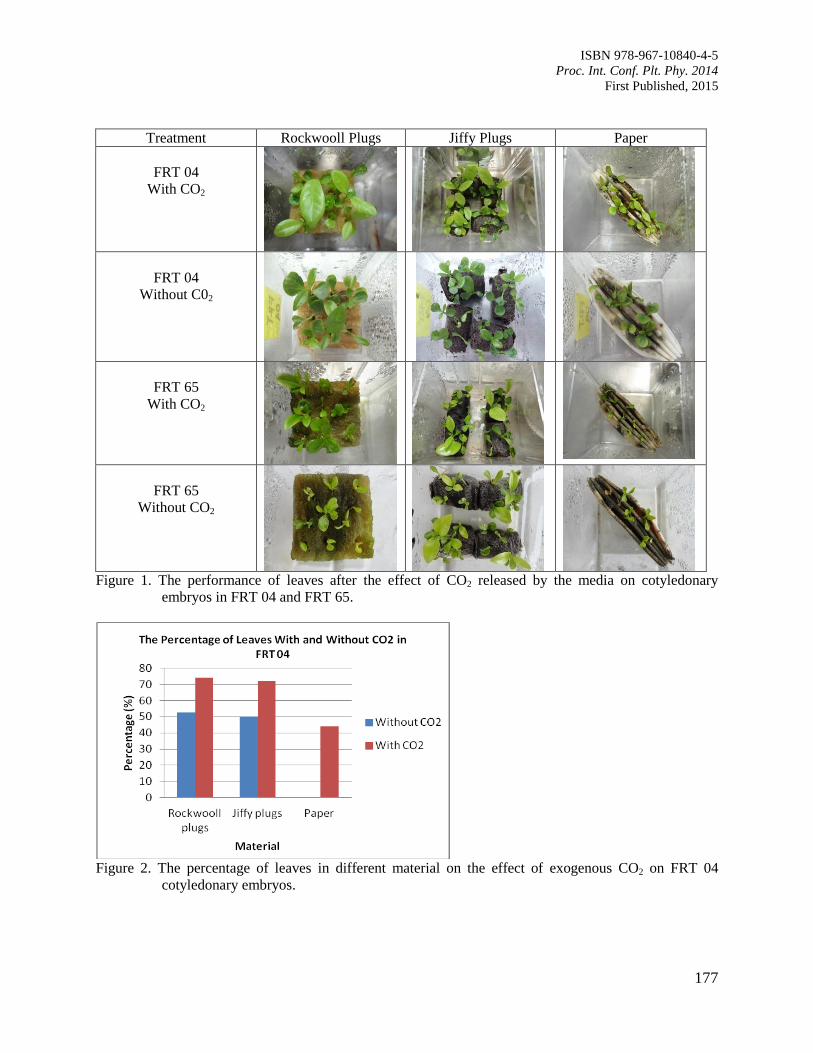
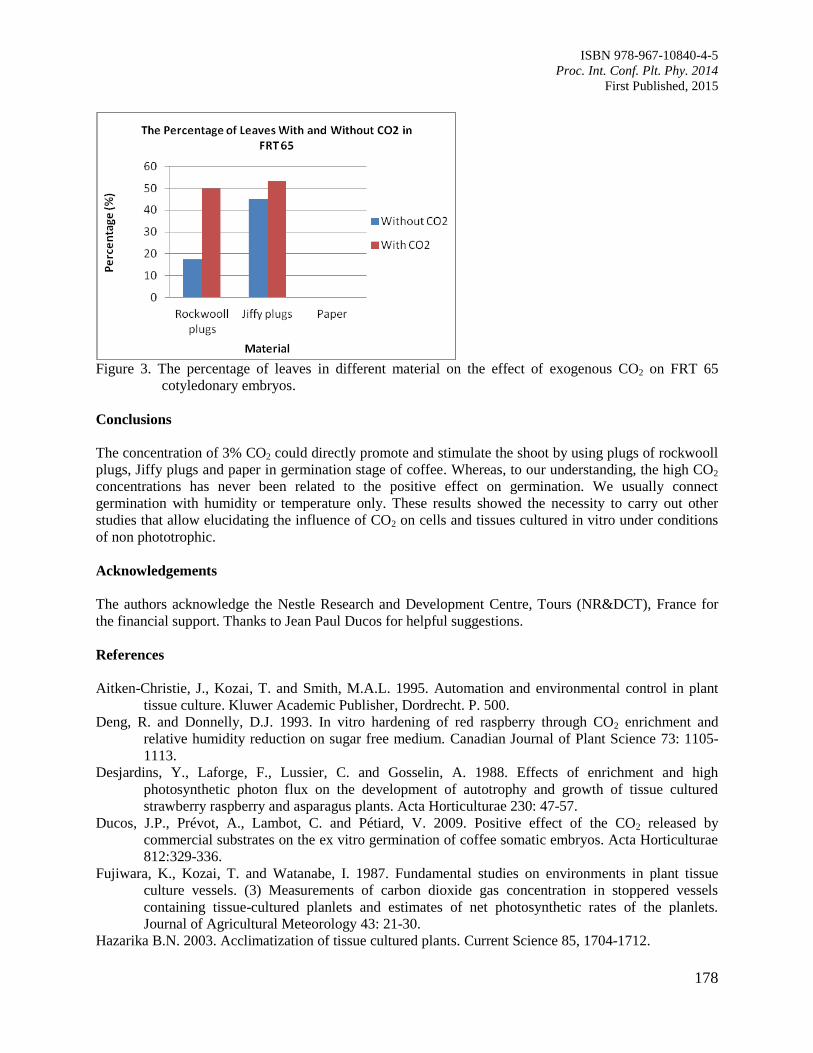
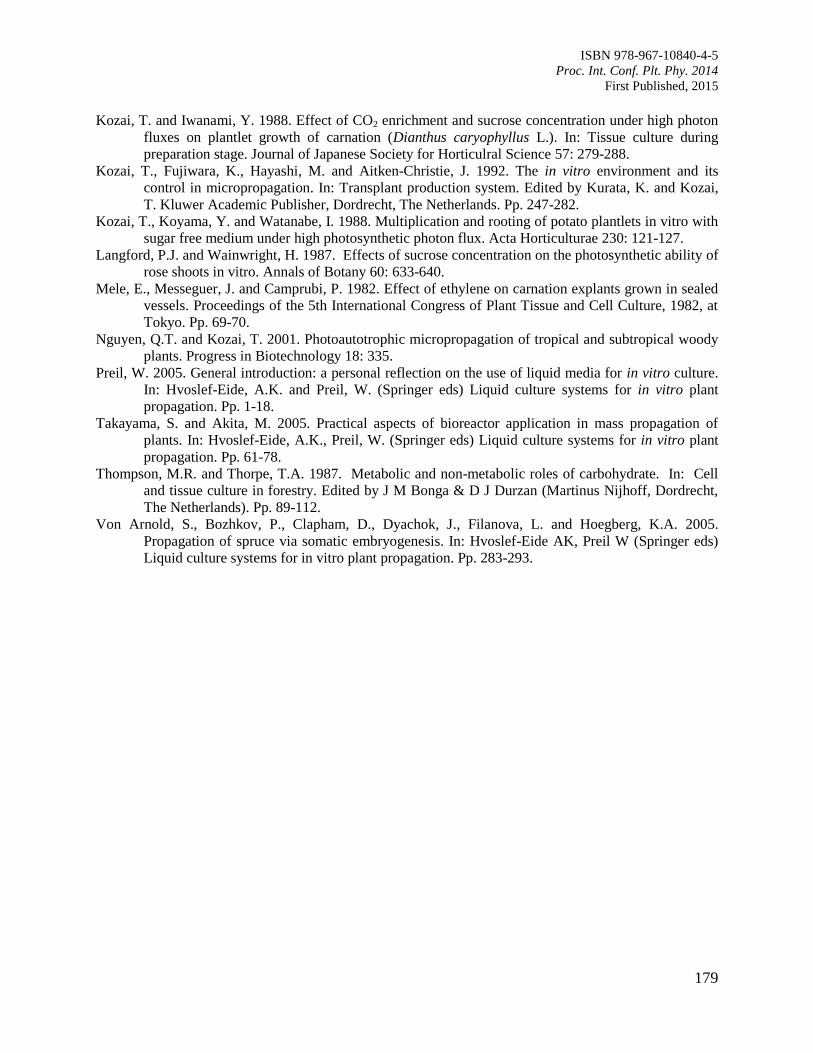
29. The Effects of Carbon Dioxide in the ex vitro Germination on Coffee Somatic
Embryogenesis
Rina, A.
175
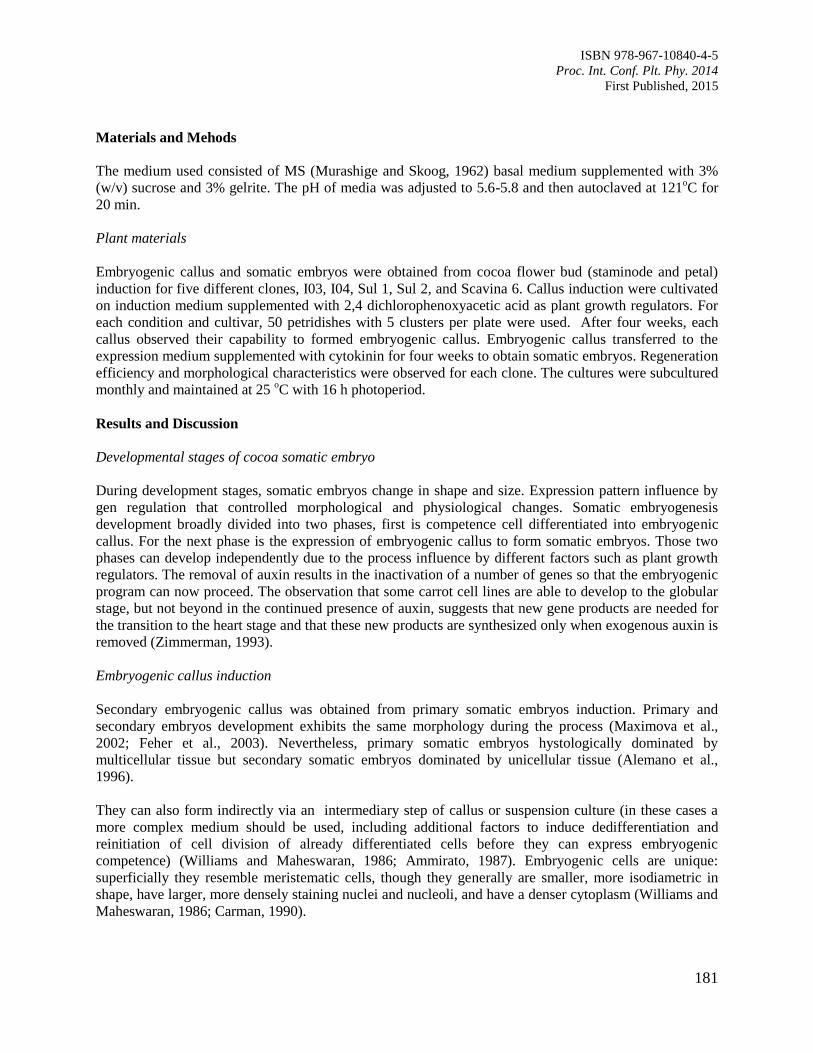
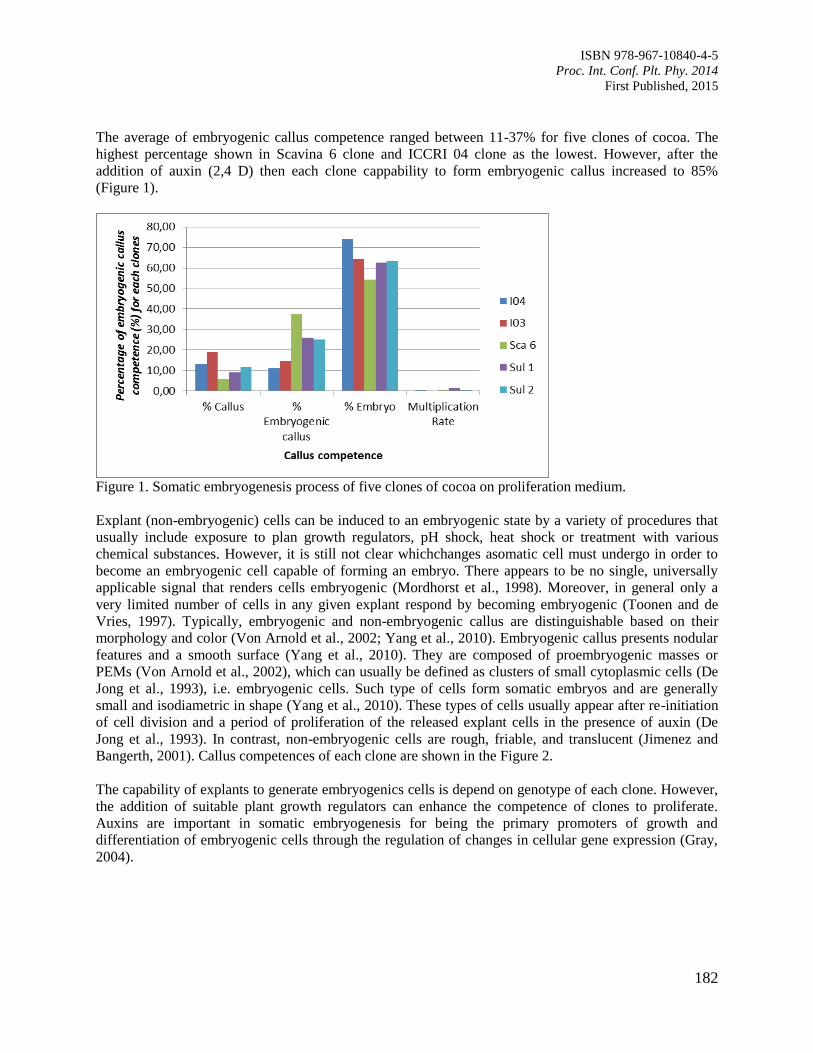
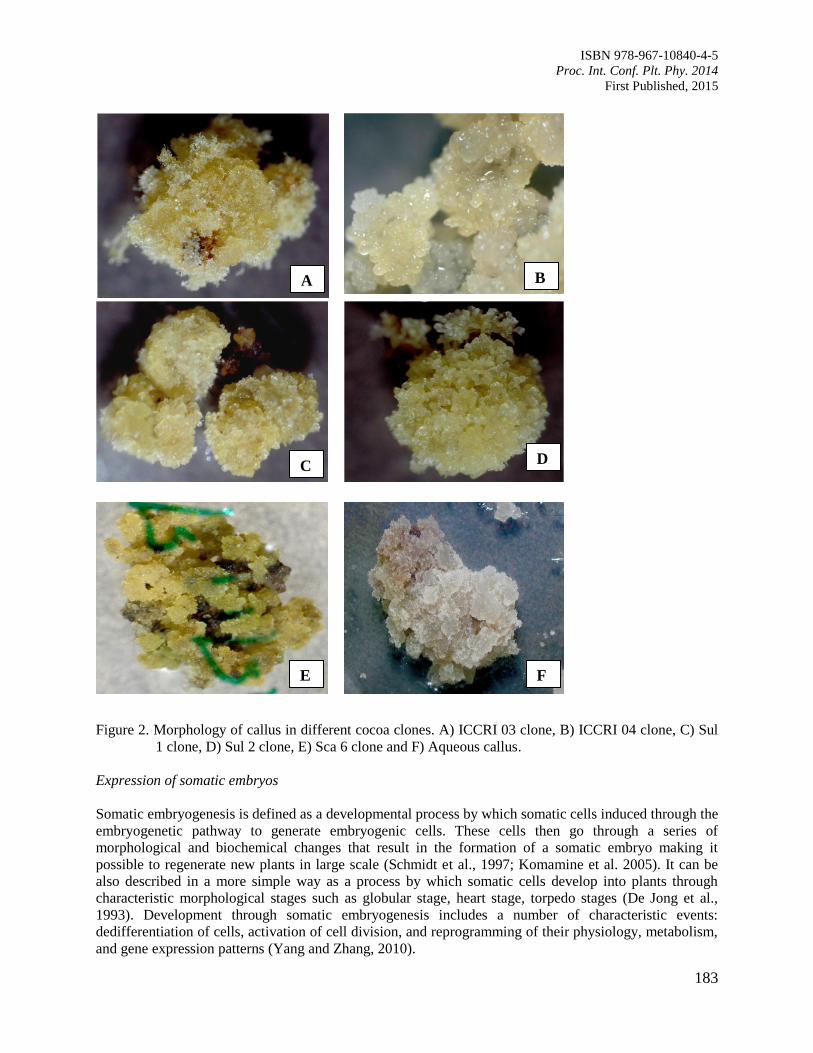
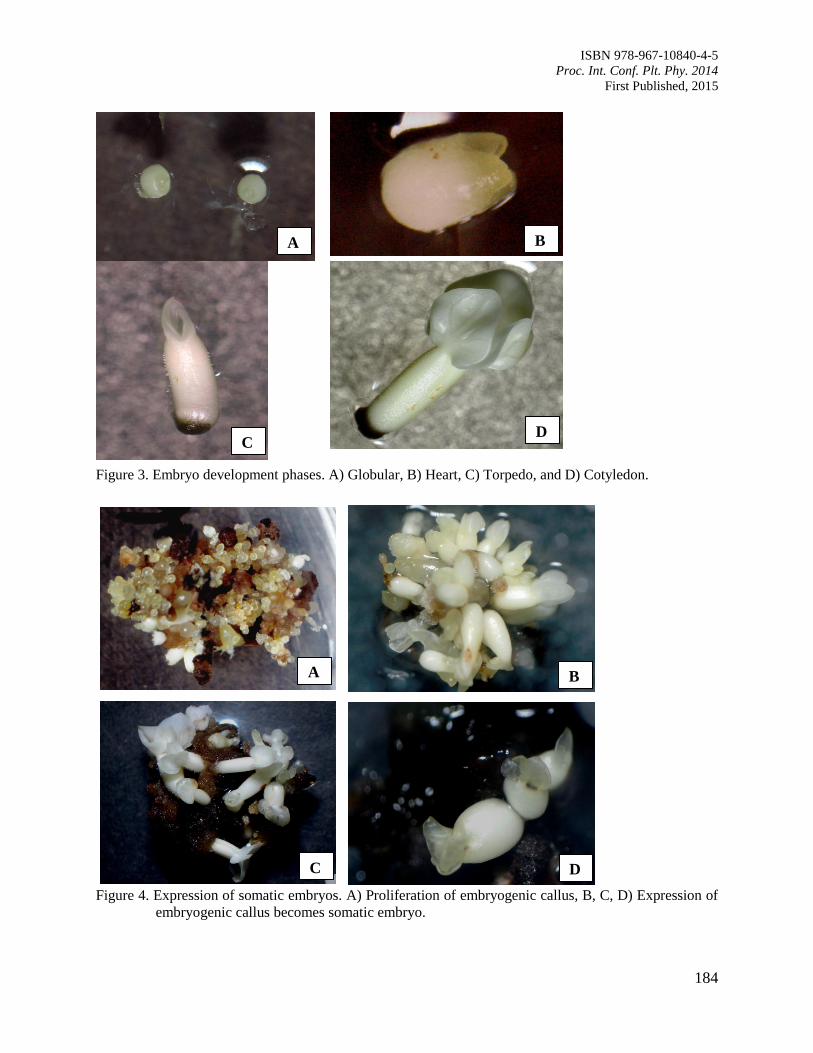
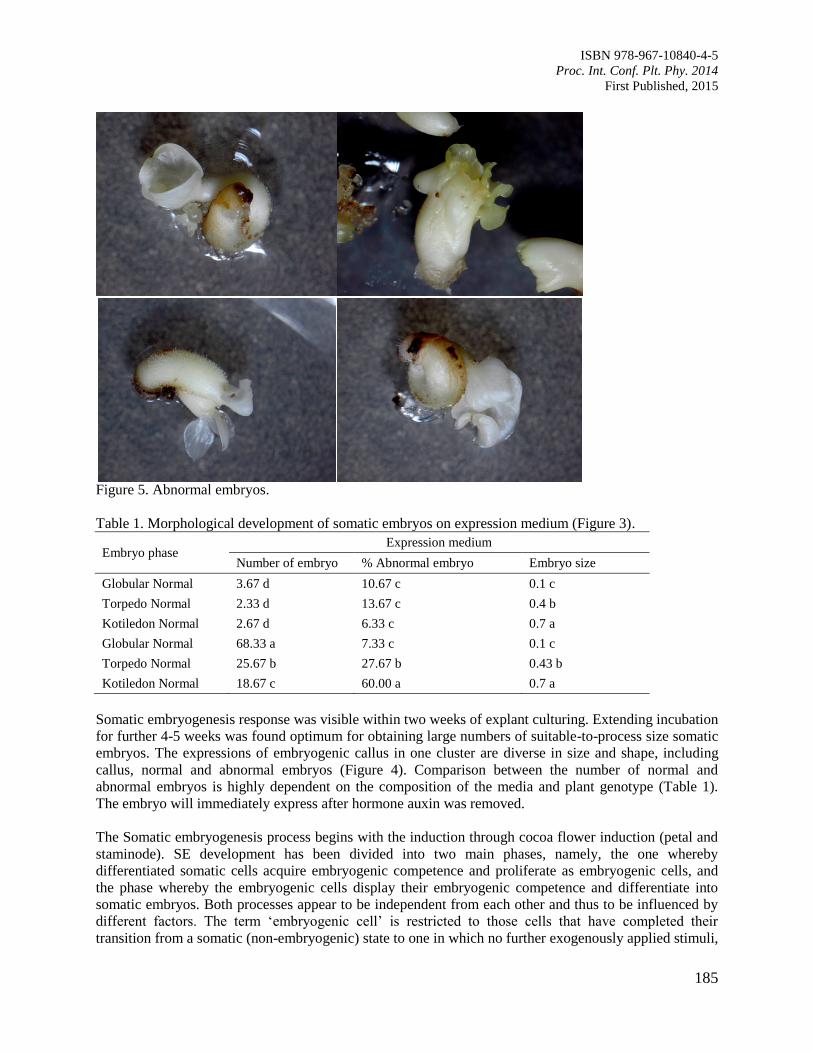
30. Characterizing Patterns in Developmental Stages of Somatic Embryo of Cocoa
(Theobroma cacao L.)
Pancaningtyas, S.
180
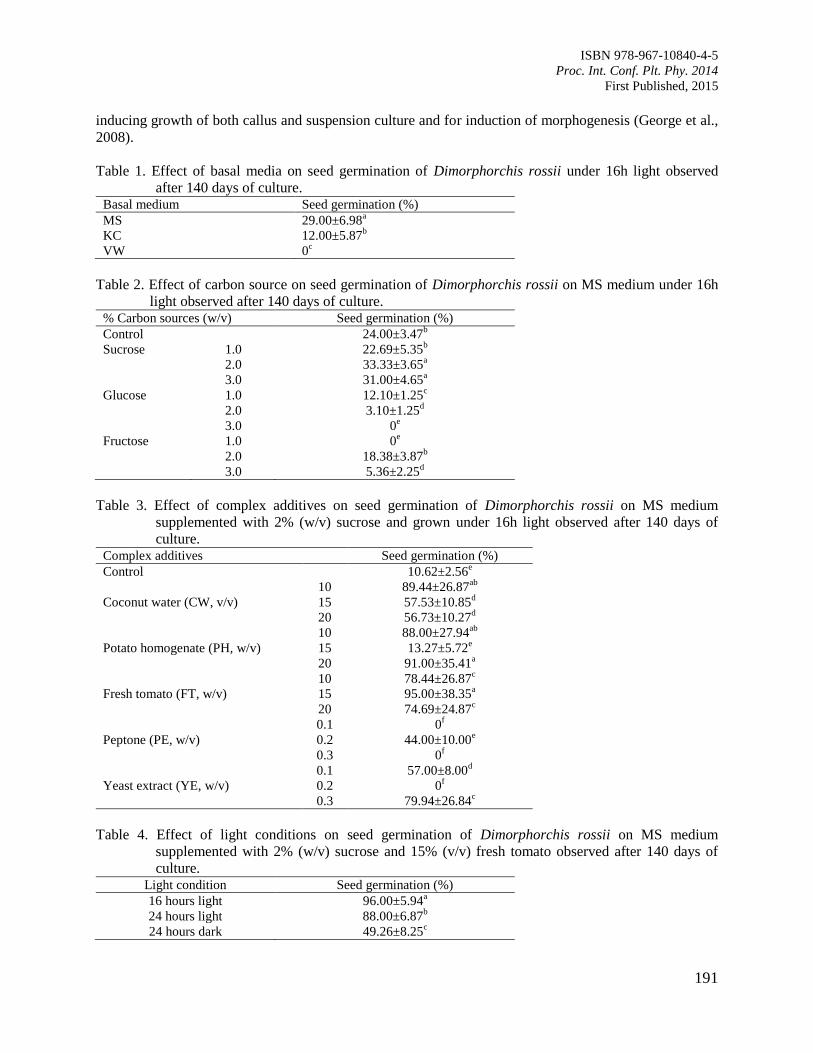
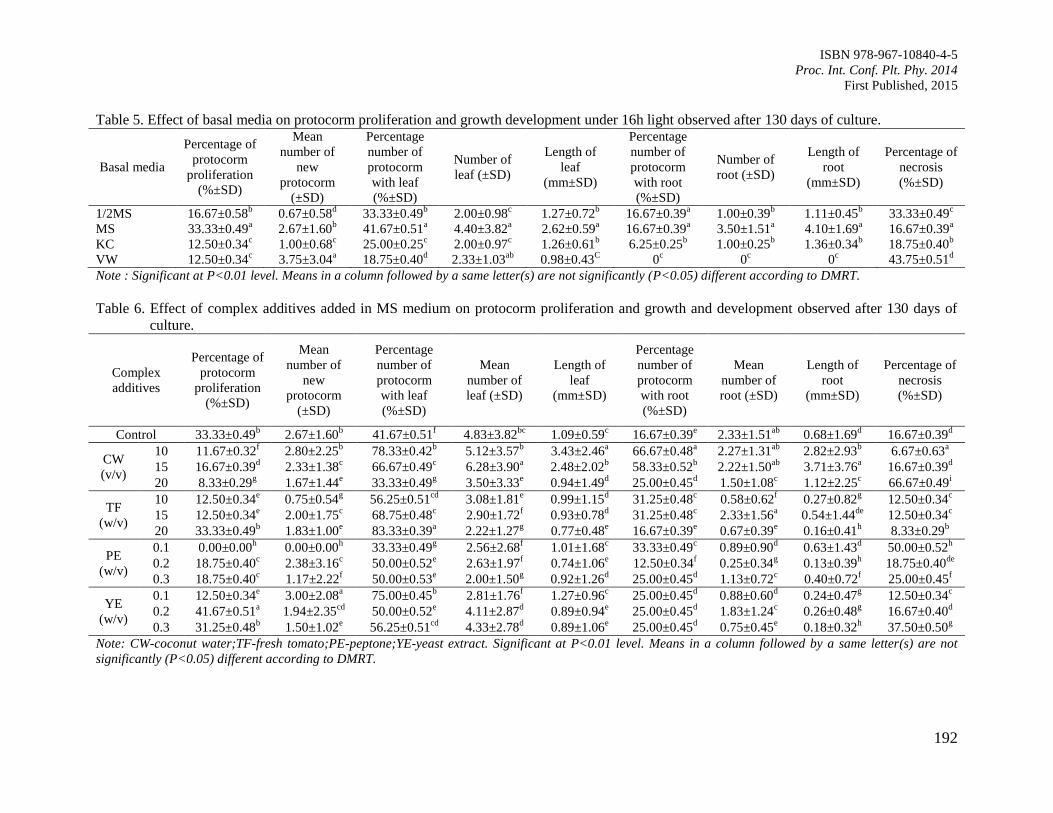
31. In vitro Seeds Germination, Protocorms Proliferation and Shoots Development of
Borneo Wild Native Orchid, Dimorphorchis rossii
Gansau, J.A., Roslina, J. and Spiridrin, S.J.
189
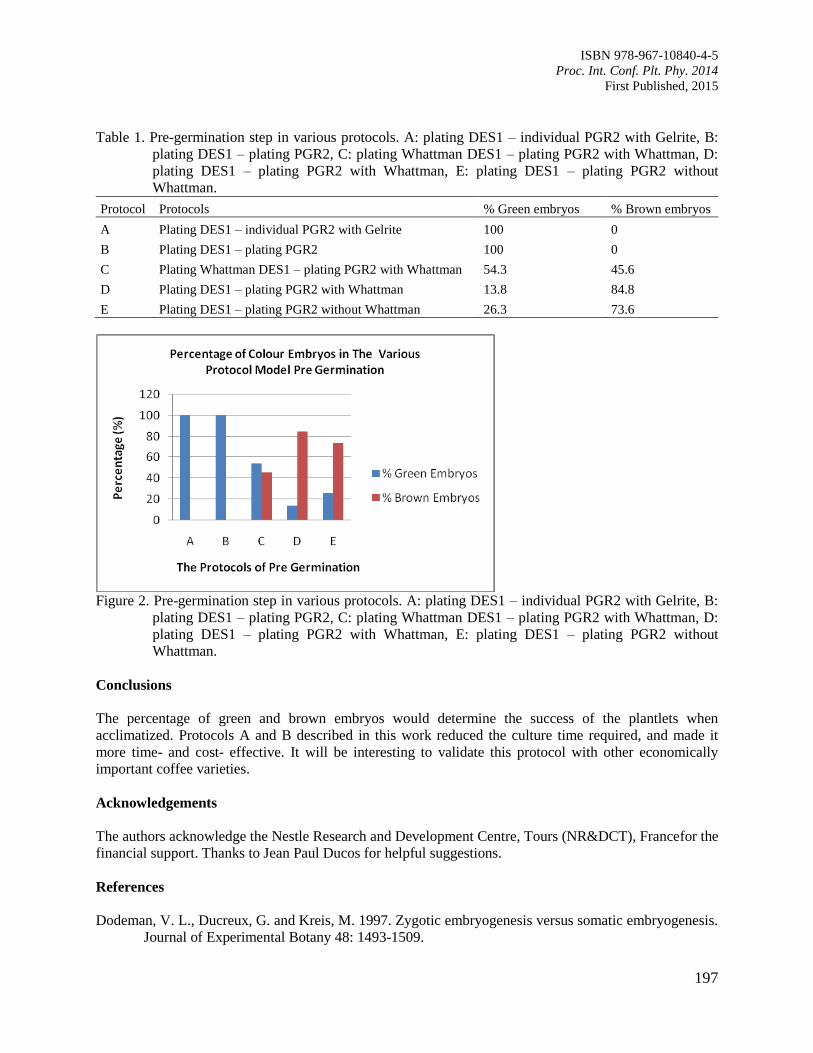
32. Pregermination of Coffea canephora cv Robusta Young Embryo by the Plating Method
in Somatic Embryogenesis Propagation
Rina, A.
194
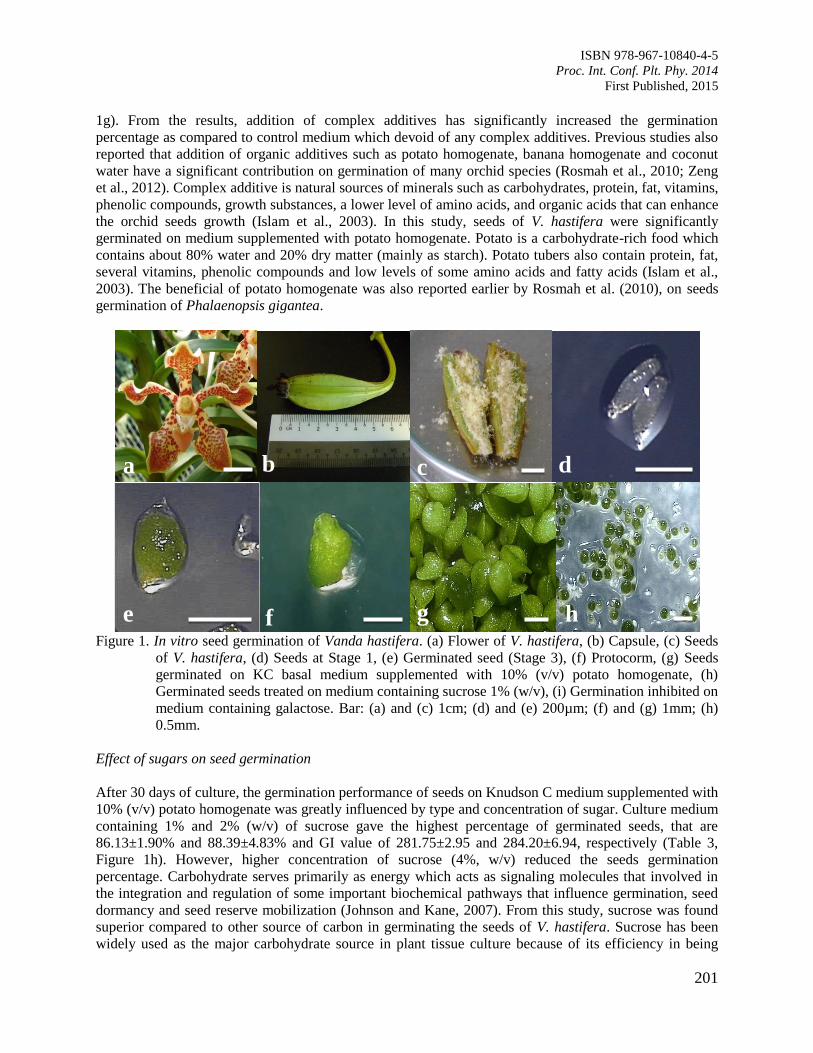
33. Asymbiotic Germination of Borneo Endemic Orchid Vanda hastifera Immature Seed
Gansau, J.A., Bong, C.S., Hartinie, M. and David, D.
199
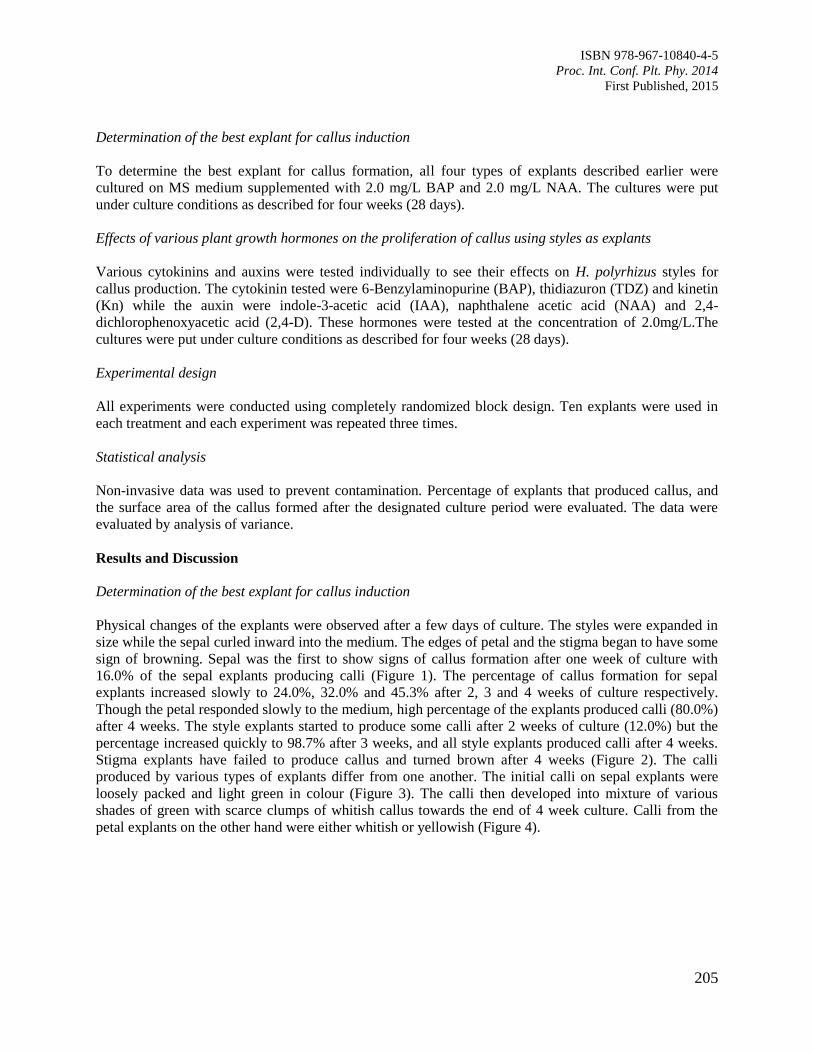
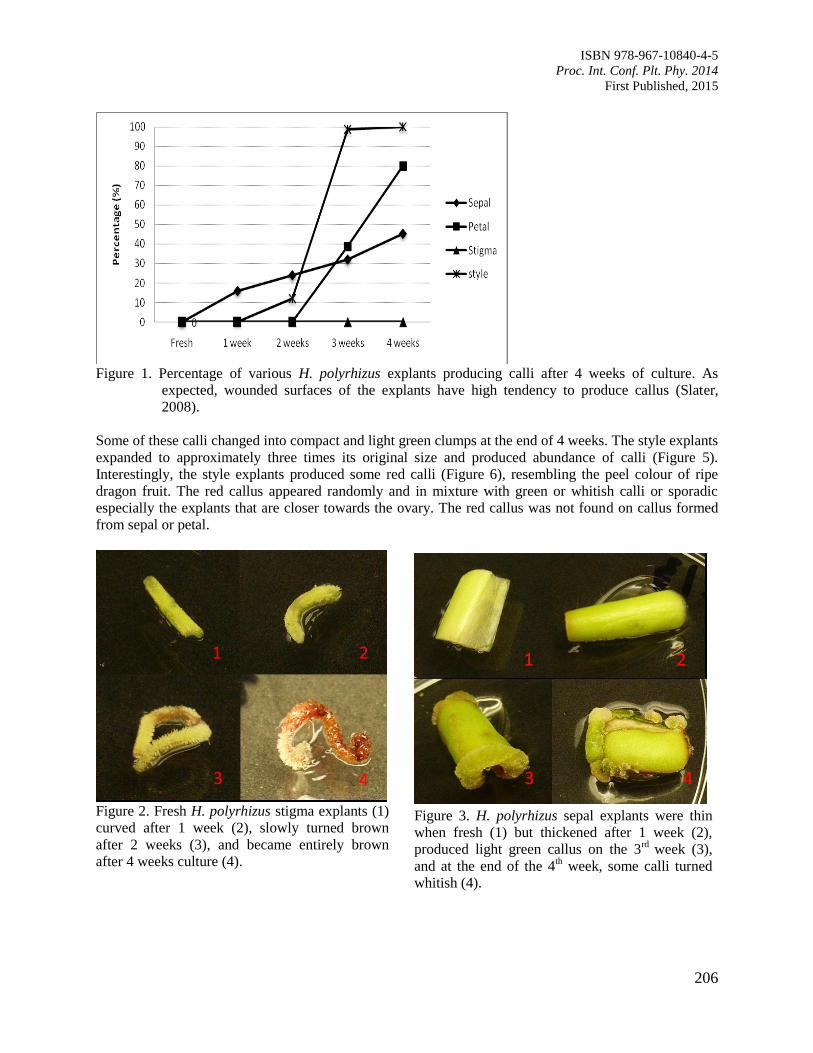
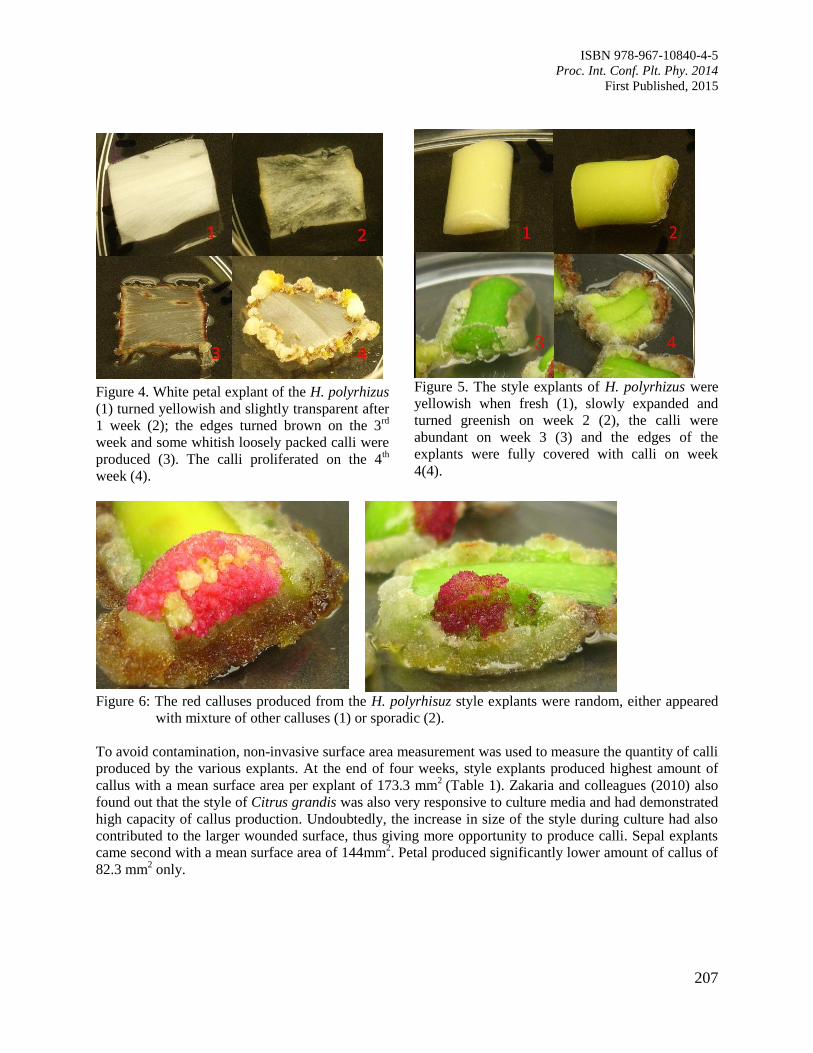
34. Formation of Callus in Hylocereus polyrhizus Using Immature Flower Parts
Yap, L.V., Davies, J.J., Nur Izzati, M. and Nur Farhana, A.H.
204
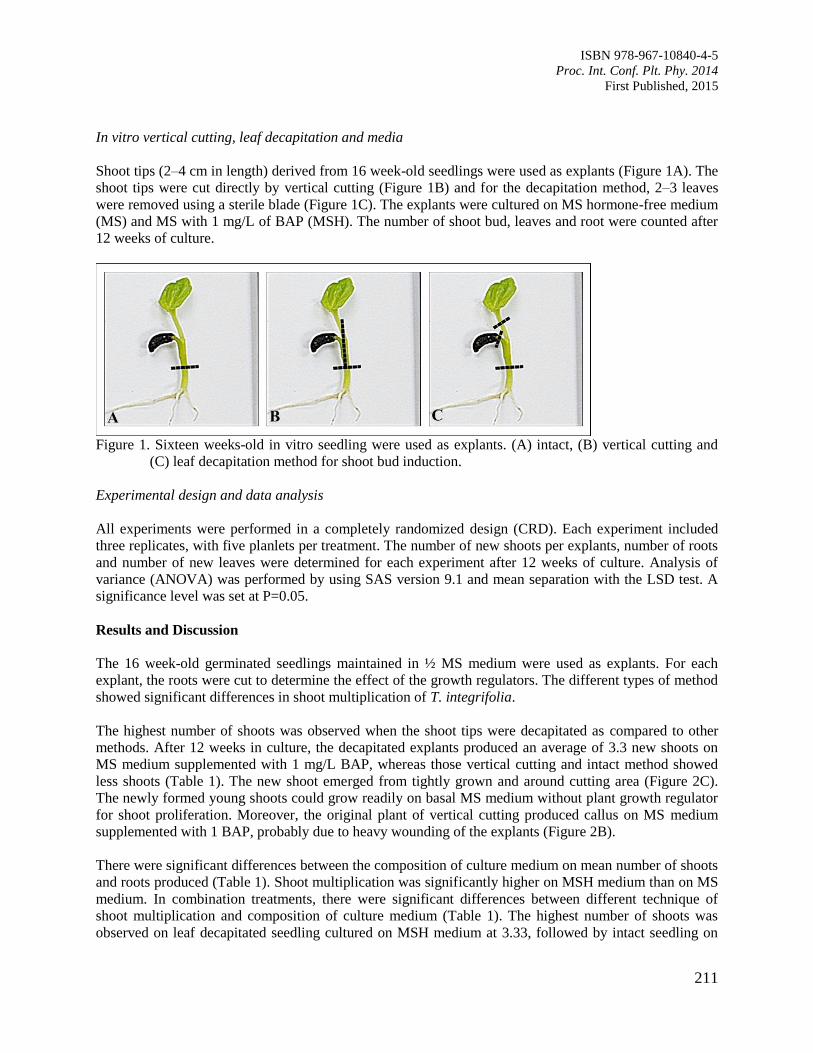
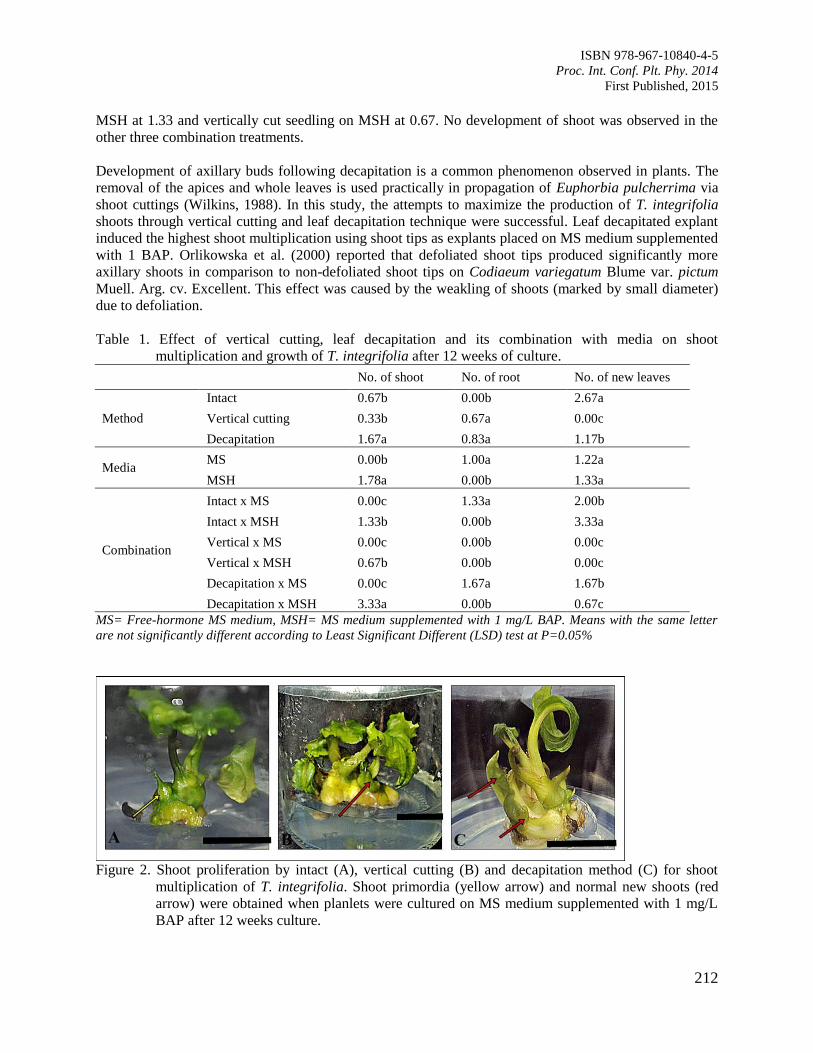
35. Effect of in vitro Vertical Cutting and Leaf Decapitation on Shoot Multiplication of
Janggut Adam (Tacca integrifolia)
Mohd Zulhilmi, M., Abdullah, T.L., Maheran, A.A. and Stanslas, S.
210
CHAPTER 5: NUTRITION, PLANT-MICROBE INTERACTION AND
INNOVATIVE PRACTICES
214
36. Mycorrhizal Symbiosis in Managing Phosphorus Efficiency in Theobroma cacao L.
Baon, J.B.
215
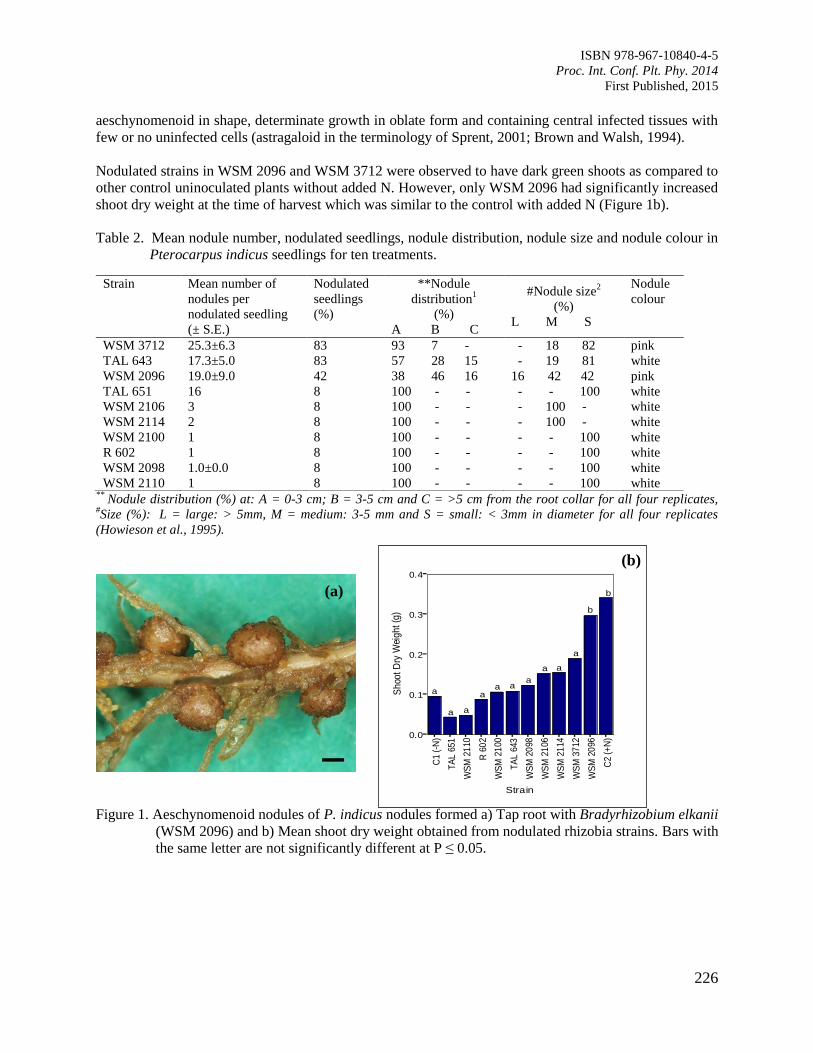
37. Root Nodulation and Nitrogen-Fixation in Pterocarpus indicus
Lok, E.H., Dell, B. and O’Hara, G.
224
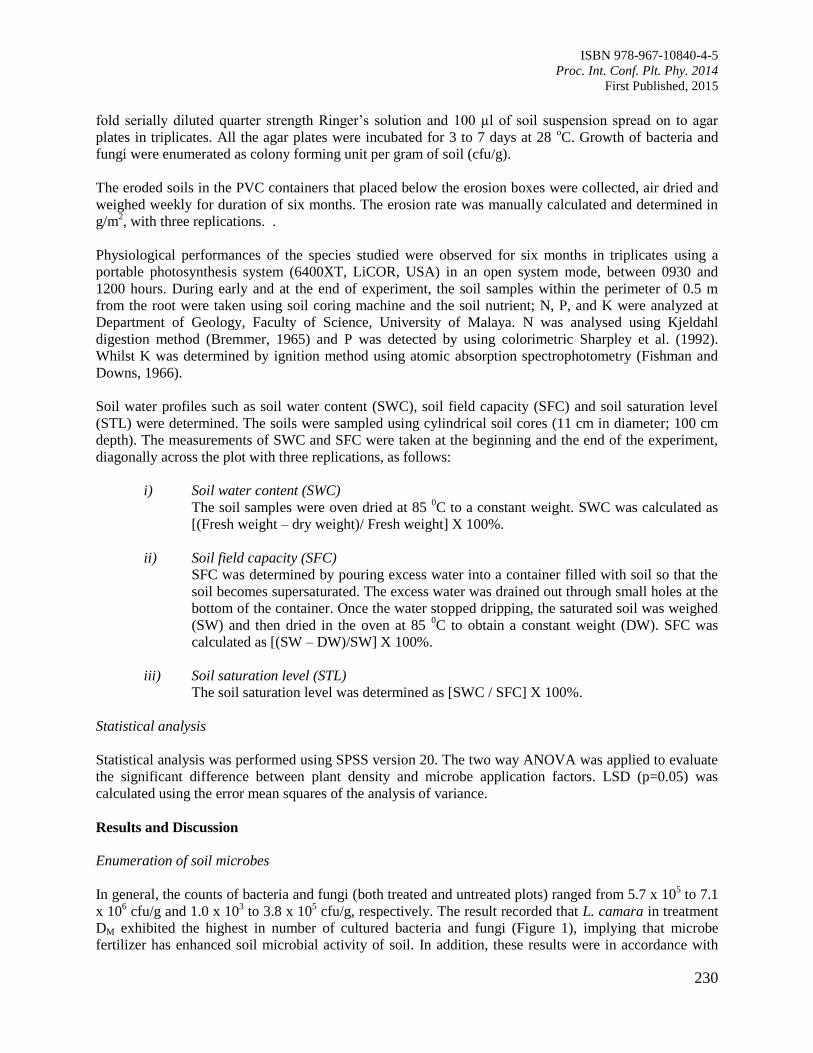
38. Interaction of Microbes Application and Vegetation Cover towards Slope Protection
Normaniza, O., Aimee, H., Tan, G.Y.A., Rozainah, M.Z. and Noorlidah, A.
229
Page 6
ISBN 978-967-10840-4-5
Proc. Int. Conf. Plt. Phy. 2014
First Published, 2015
vi
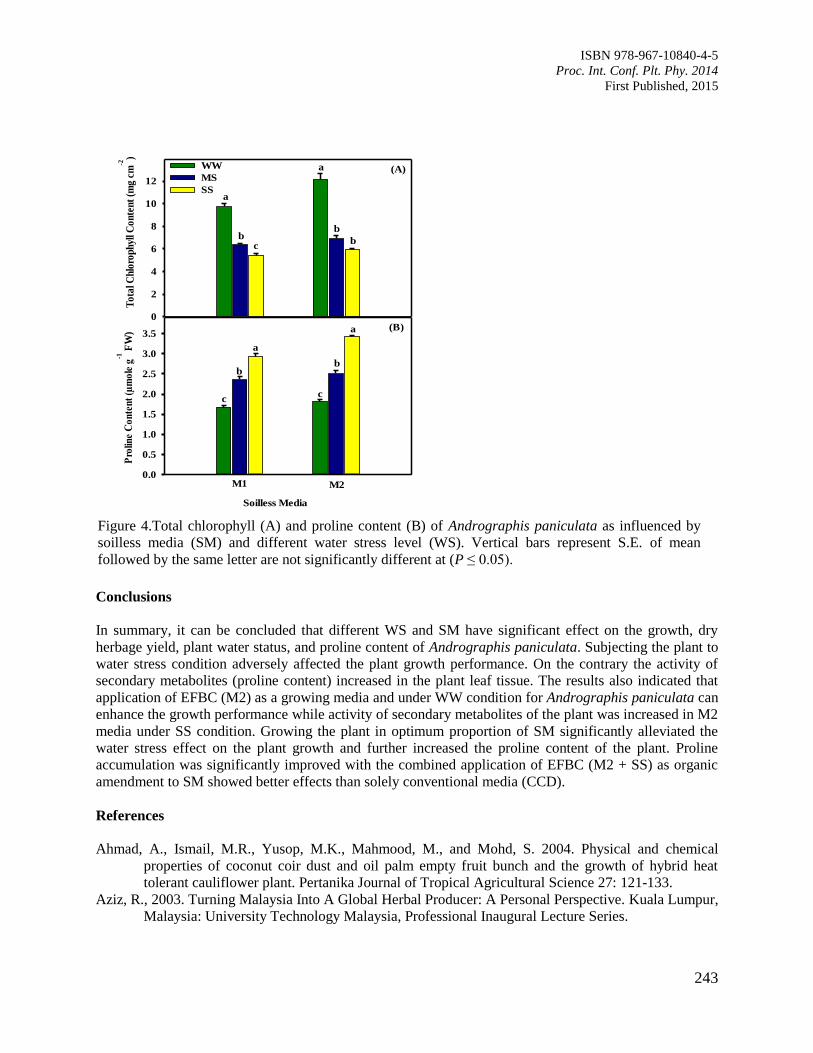
39. Biomass Production, Physiological Changes and Secondary Metabolites of Andrographis
paniculata Influenced by EFB Media and Water Stress
Siti Zaharah, S., Shara Salih, A., Radziah, O. and Puteri Edaroyati, M.W.
237
40. Approaches Used to Compare Cropping Systems
Jagatheeswaran, S. and Walker, S.
246
41. Corm Nursery Technique for Mass Propagation of Banana Seedlings of Musa acuminata
cv. Berangan
Ahmad Yusuf, M.K. and Suhaimi, O.
250
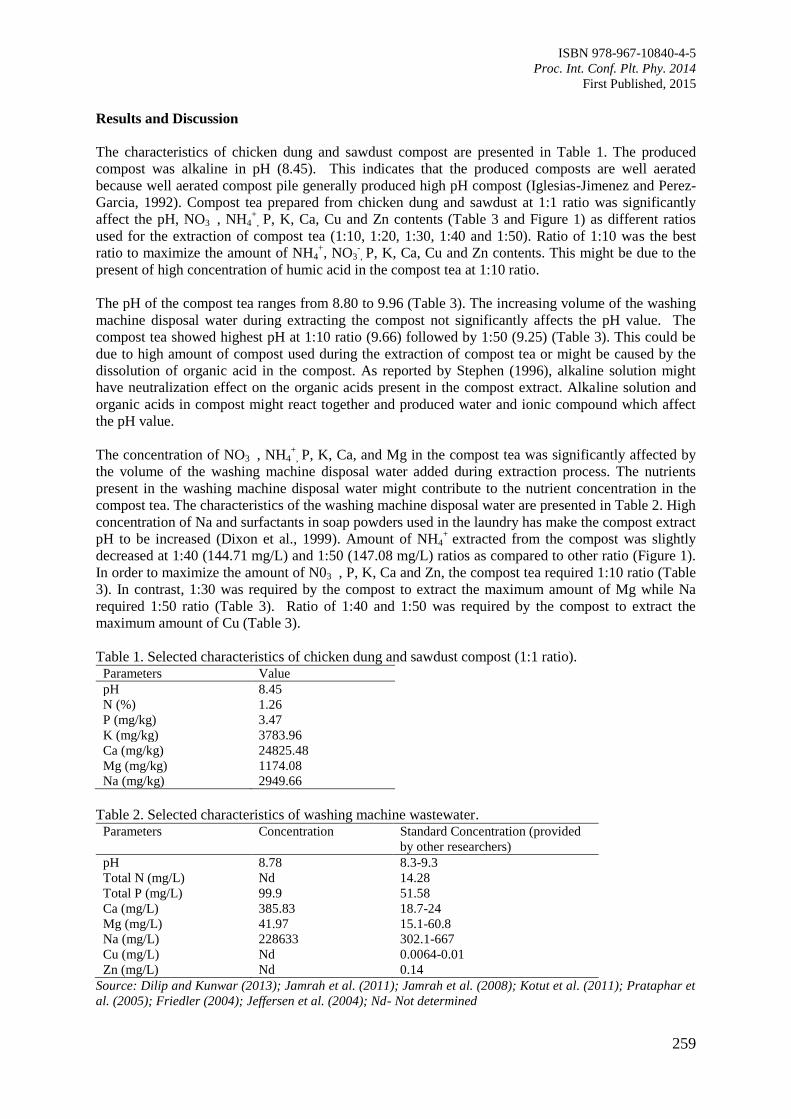
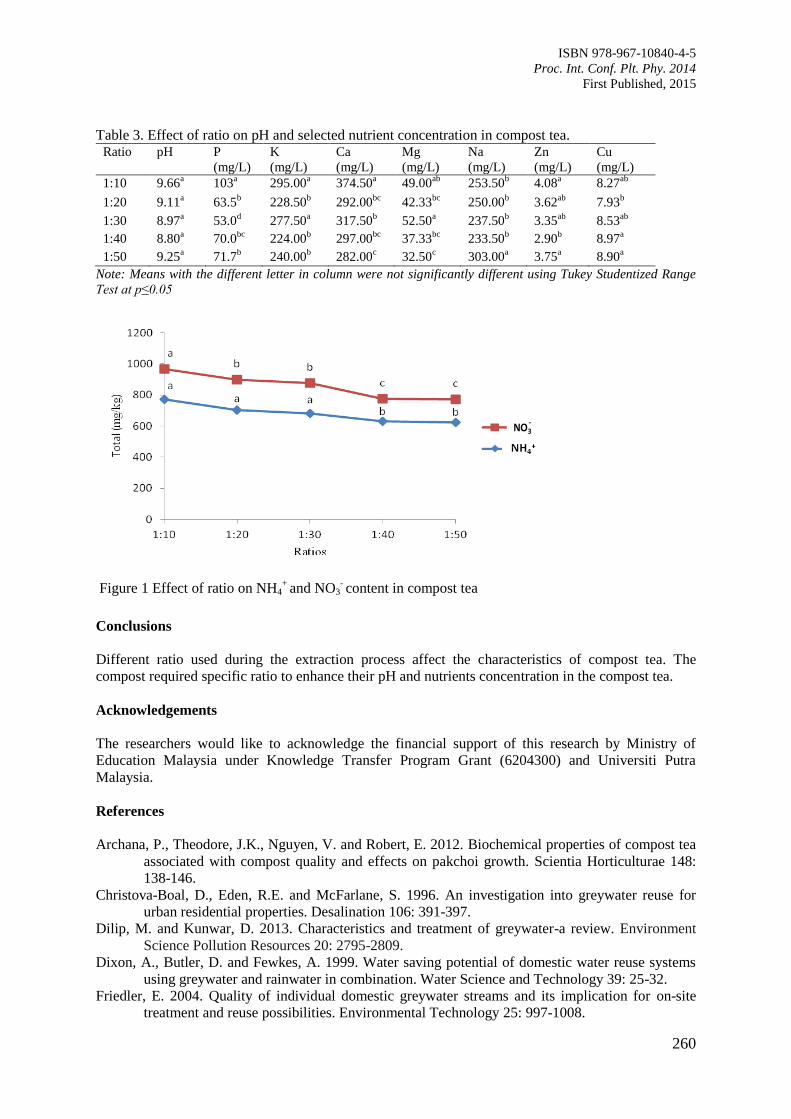
42. Effect of Ratios on pH and Selected Nutrient Contents in Compost Tea Produced from
Agricultural Waste
Saidin, A.A., Kasim, S., Ahmed, O.H., and Shuib, E.M.
258
43. Effect of Using Leguminous Cover Crop (Calopogonium mucunoides Desv.) on Leaf N,
Chlorophyll Content and Gas Exchange Rate of Black Pepper (Piper nigrum L.)
Sulok, K.M.T., Zainudin, S.R., Jarroop, Z., Shang, C.Y. and Lanying, F.
262
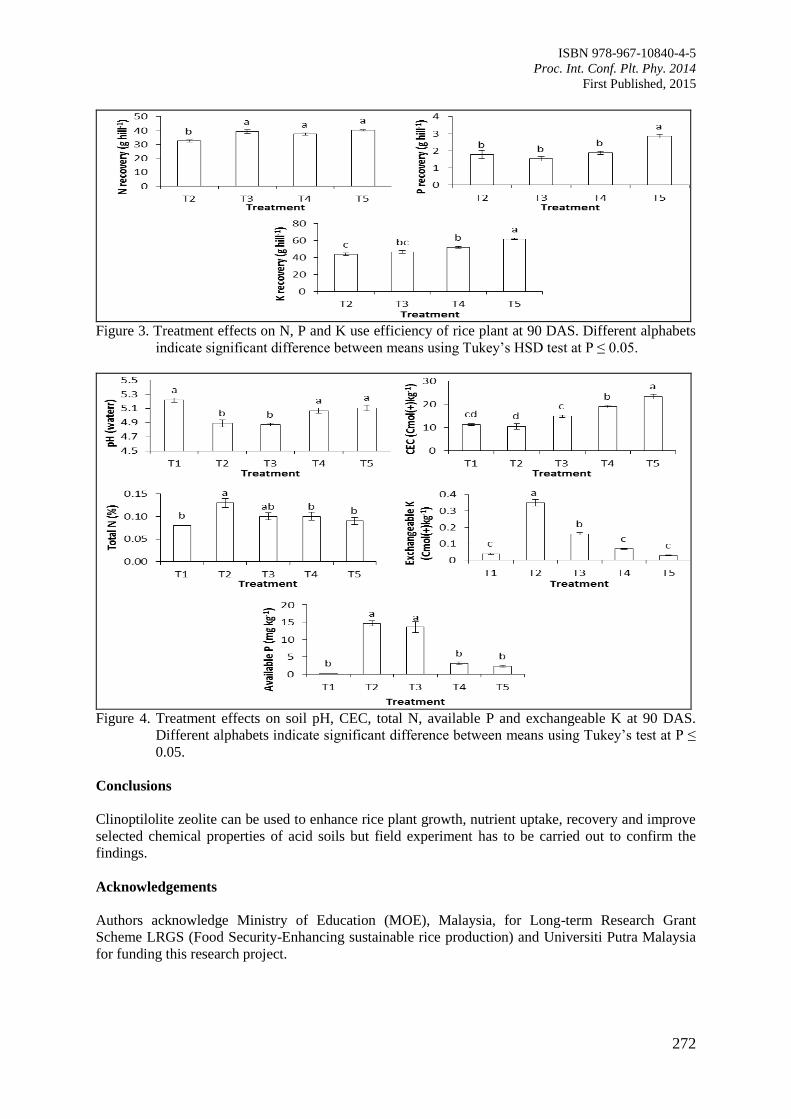
44. Improving Rice (Oryza sativa L. cv. MR219) Growth, Nutrient Uptake and Recovery
Using Clinoptilolite Zeolite
Palanivell, P., Ahmed, O.H., Susilawati, K. and Nik Muhamad, A.M.
269
CHAPTER 6: PEST AND DISEASE MANAGEMENT, BEST PRACTICES AND
CURRENT TECHNIQUES
274
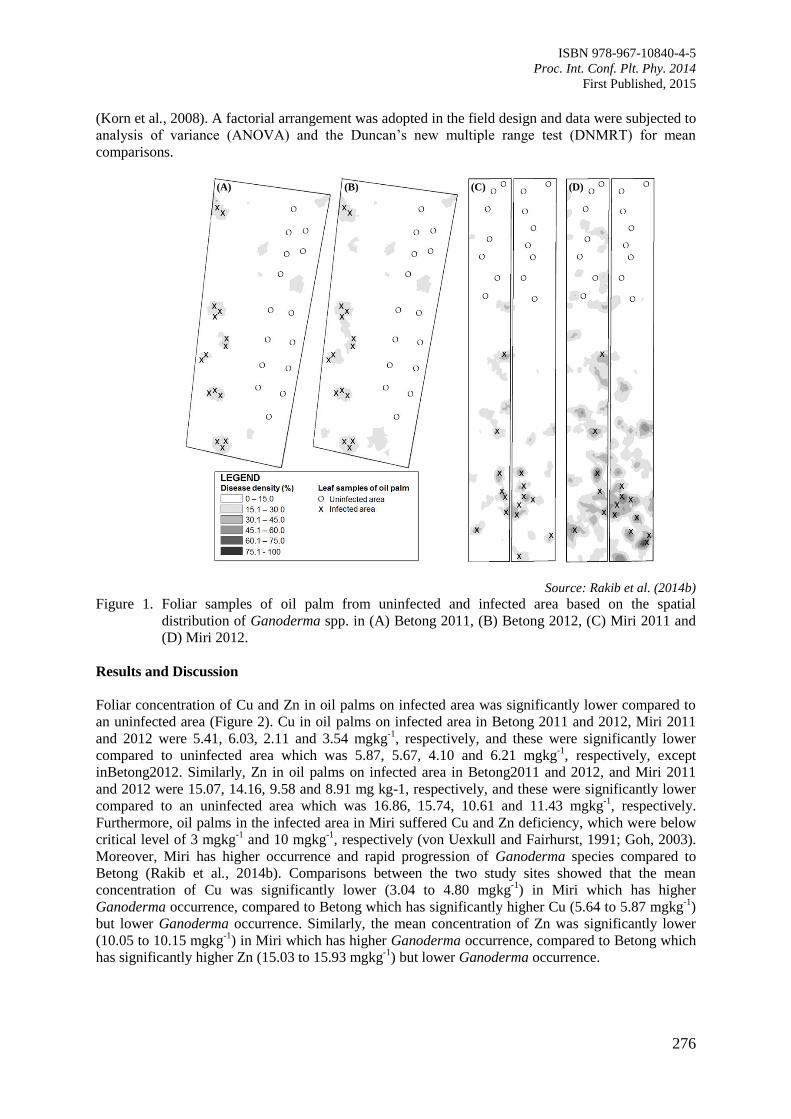
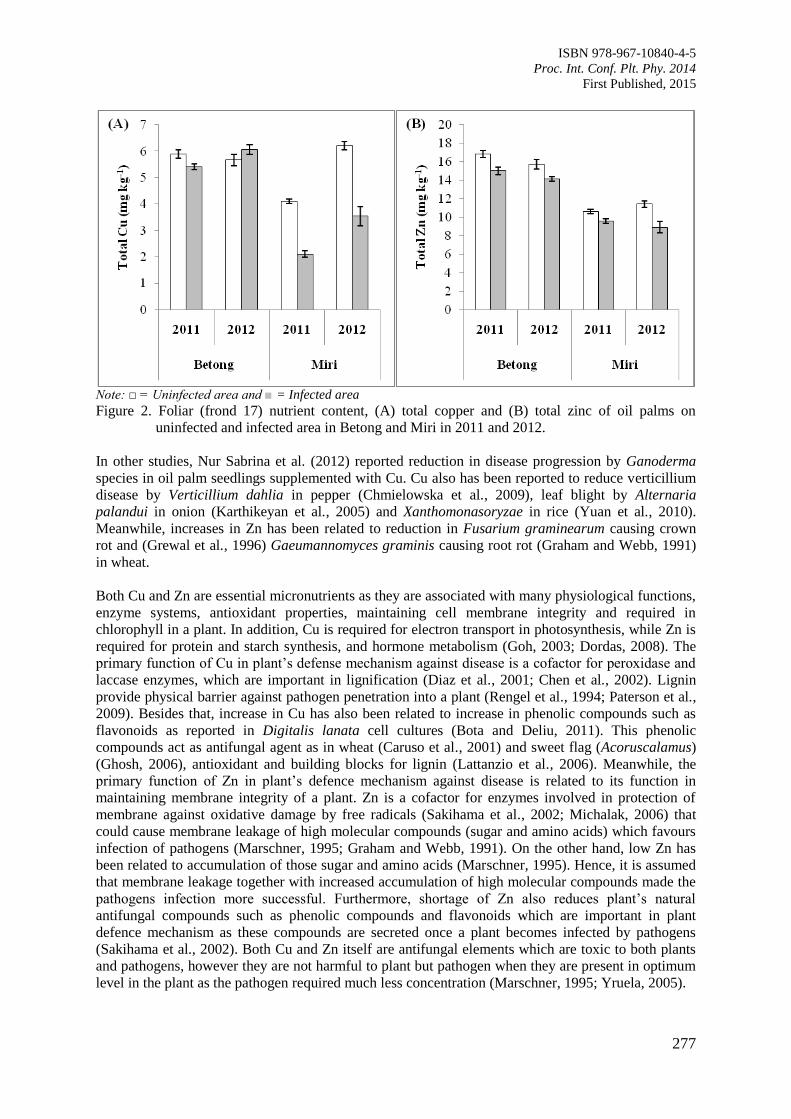
45. Association of Copper and Zinc to Ganoderma spp. Spatial Distribution in Oil Palm
(Elaeis guineensis) Plantations on Peat
Rakib, M.R.M., Bong, C.F.J., Khairulmazmi, A. and Idris, A.S.
275
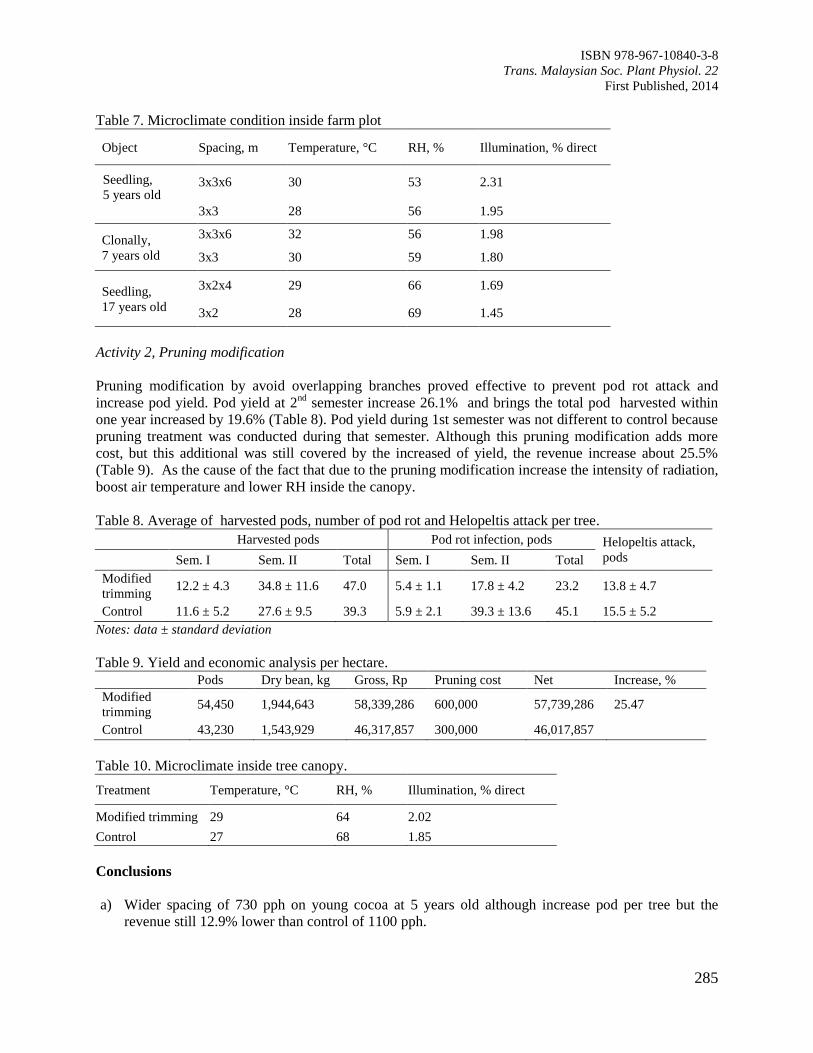
46. Improving Cocoa Yield and Suppress Pod Rot Disease through Thinning and Pruning
Modification
Prawoto, A.A.
280
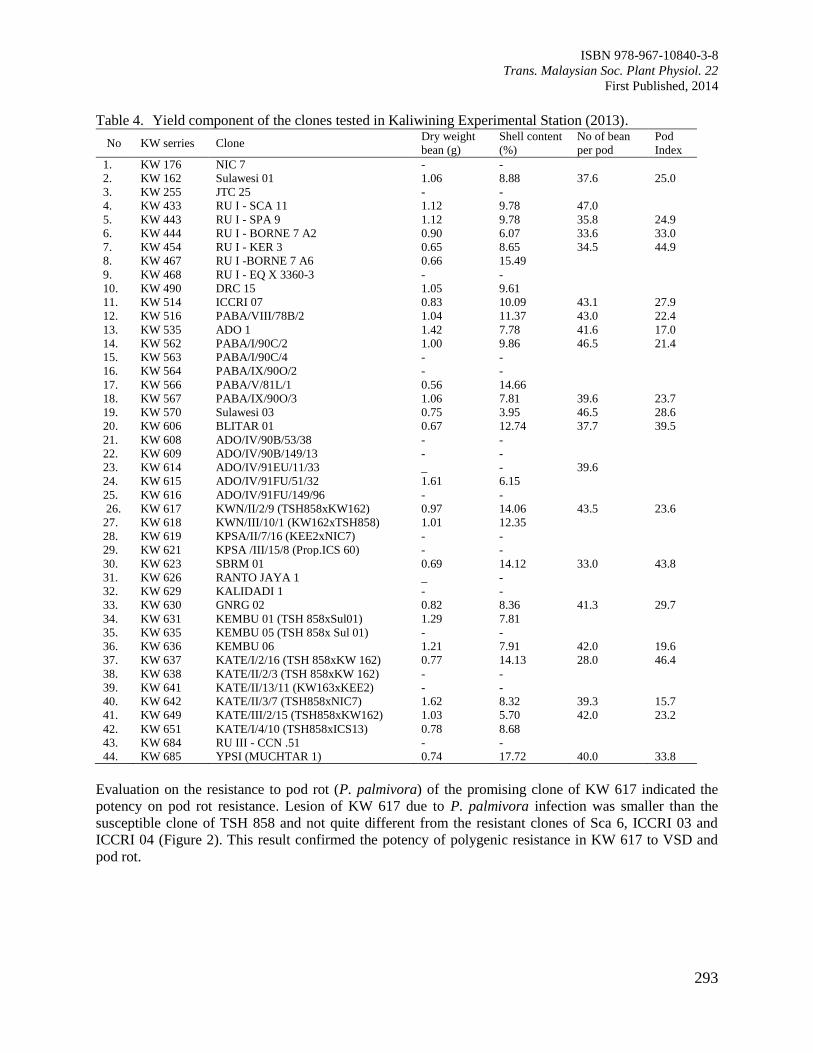
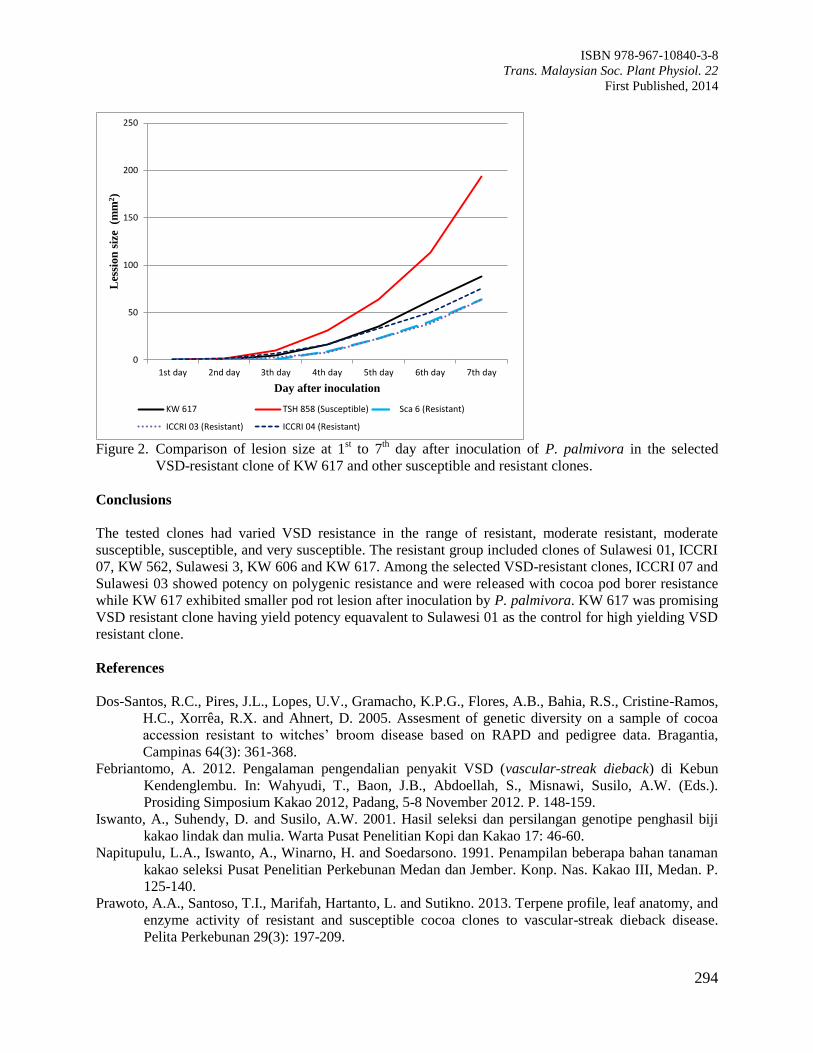
47. Clonal Selection on Cocoa Resistance to Vascular-Streak Dieback
Susilo, A.W. and Anita-Sari, I.
288
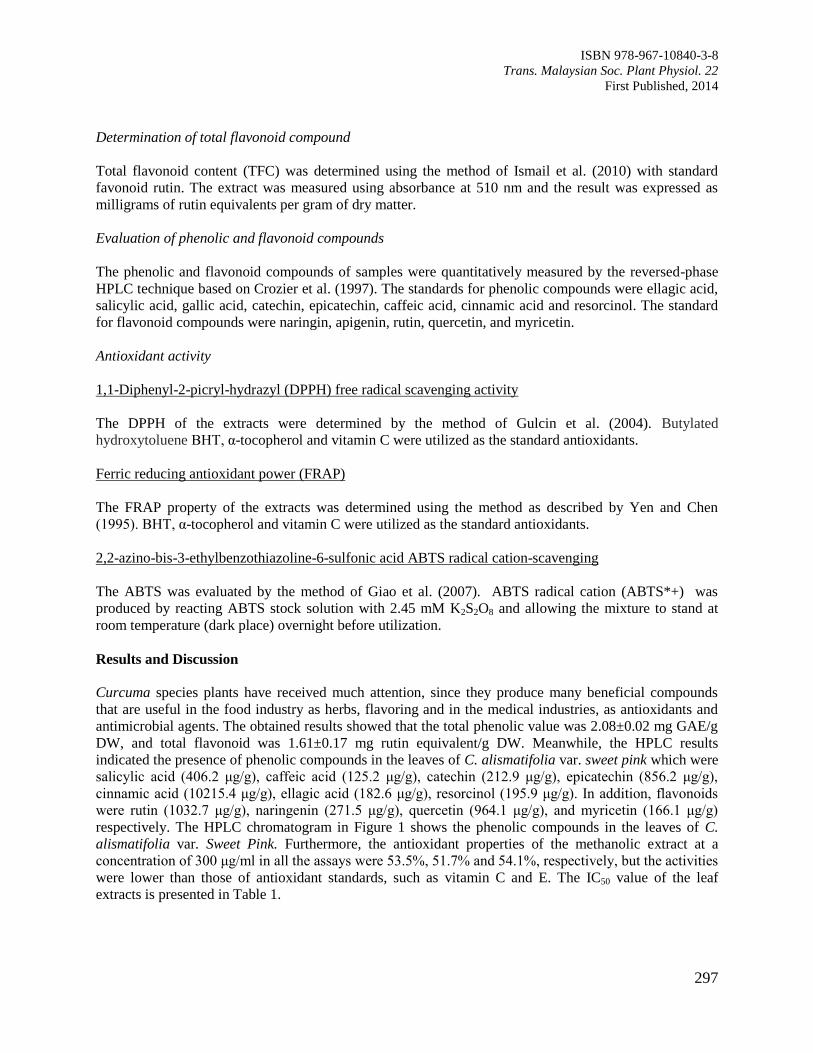
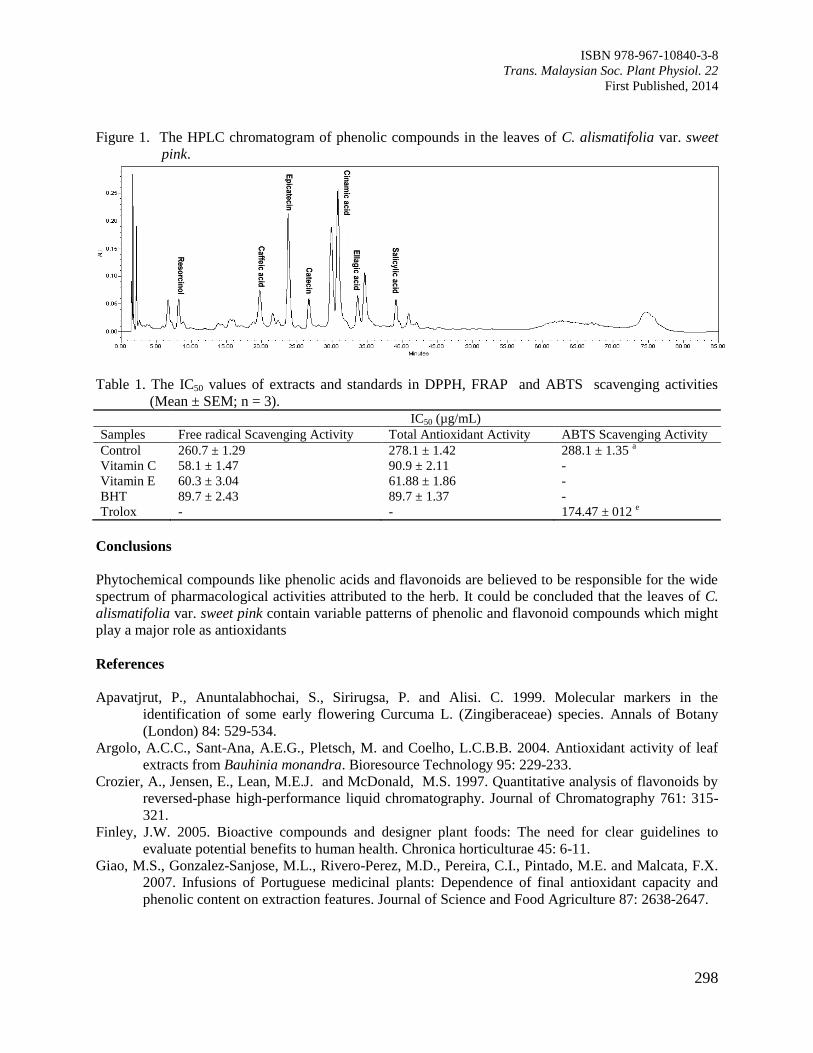
48. Bioactive Compounds Profiling and Their Antioxidant Properties in the Leaves of
Curcuma alismatifolia (Zingiberaceae)
Taheri, S., Abdullah, T.L. and Karimi, E.
296
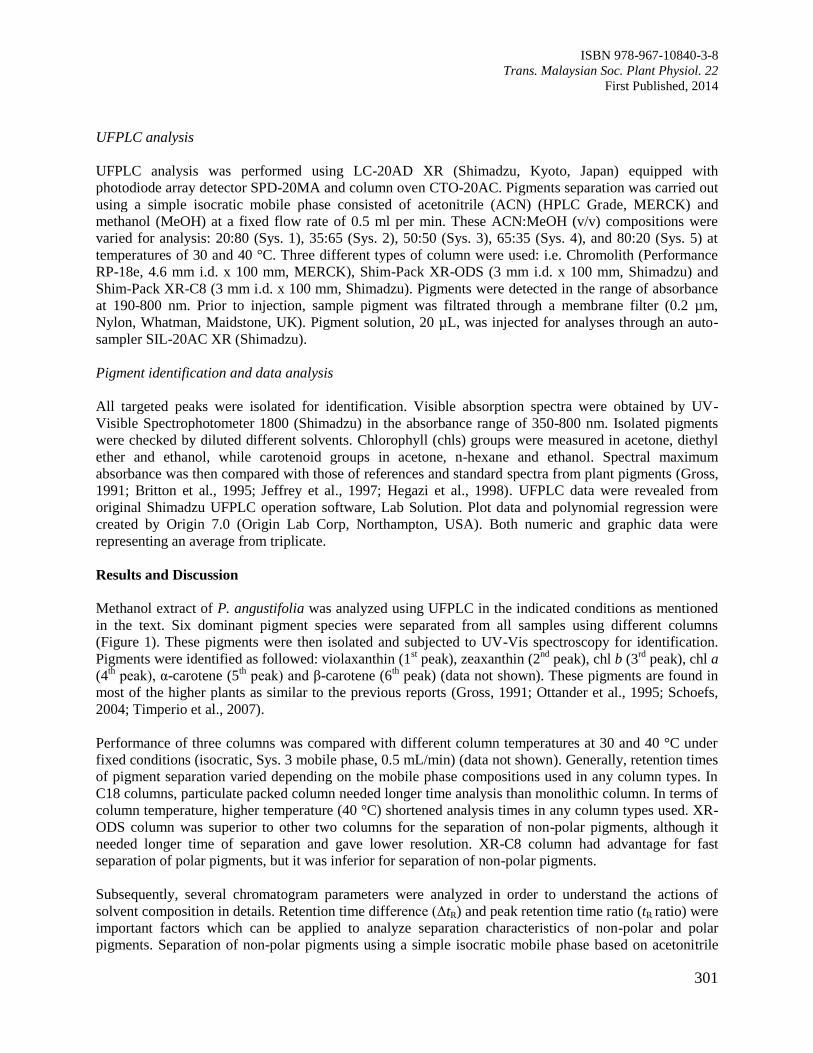
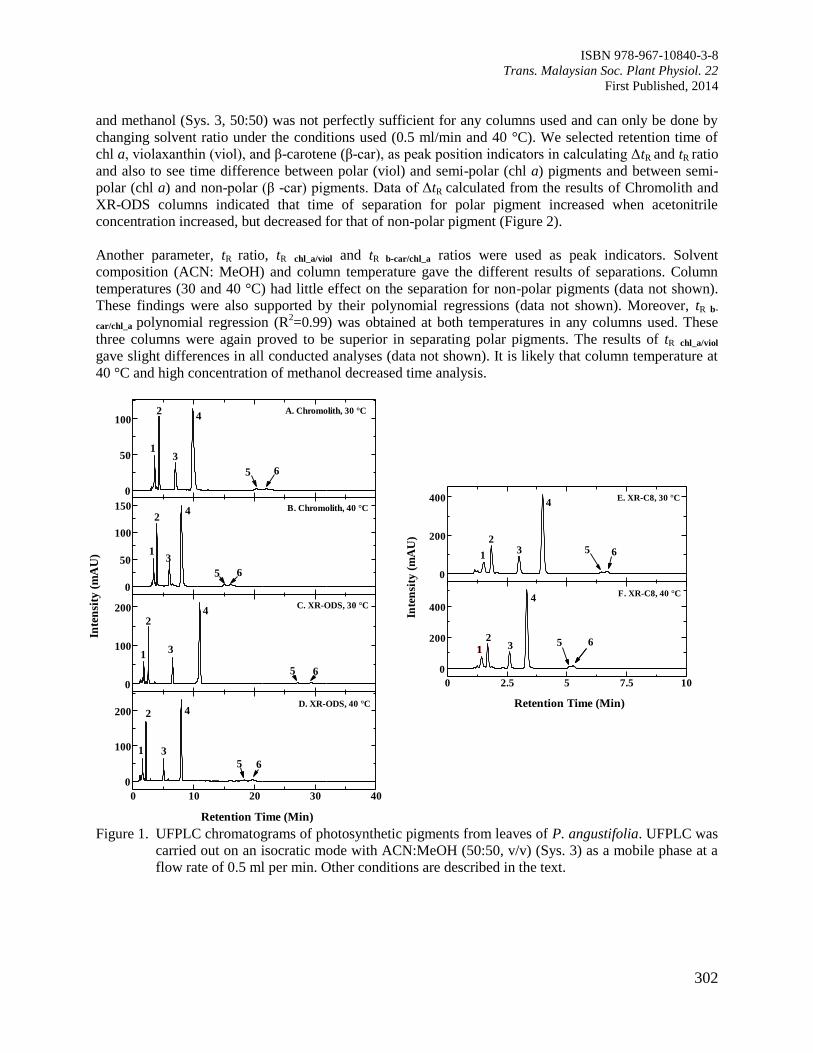
49. Comparison of Column Performance between Monolithic and Particulate Packing for the
Separation of Photosynthetic Pigments
Indriatmoko, Shioi, Y., Brotosudarmo, T.H.P. and Limantara, L.
300
50. Chlorophyll Values of Local Green Vegetables Common in Malang, East Java
Dettling, M., Indrawati, R., Indriatmoko, Adhiwibawa, M.A.S., Brotosudarmo, T.H.P.
and Limantara, L.
305
Page 7
ISBN 978-967-10840-4-5
Proc. Int. Conf. Plt. Phy. 2014
First Published, 2015
1
CHAPTER 1
PLANT GROWTH, DEVELOPMENT
AND PRODUCTION
Page 8
ISBN 978-967-10840-4-5
Proc. Int. Conf. Plt. Phy. 2014
First Published, 2015
2
Vegetative Propagation in Cocoa (Theobroma cacao): Effects of Propagation
Environment and Rooting Substrates on Rooting Behaviour of Cocoa Stem
Cuttings
Tee, Y.K.1,*
and Lamin, K.1
1Malaysian Cocoa Board, 5th, 6th and 7th Floor, Wisma SEDCO, Locked Bag 211, 88999 Kota Kinabalu,
Sabah, Malaysia.
*E-mail: [email protected]
Introduction
Cocoa (Theobroma cacao L.) is an important industrial crop with nutritional value. In Malaysia, the cocoa
industry is facing an imbalanced growth in upstream and downstream activities due to low cocoa
production which need to be overcome in order to sustain cocoa development. The growing demand for
cocoa products coupled with increasing number of diseases due to infection has led to the concept of
enhancing commercial planting materials which is disease tolerant and is high yielding. Thus, methods
have been developed to enhance the development of cocoa planting materials and its deployment through
combined approaches of biotechnology, applied horticulture and technology transfer.
Vegetative propagation or macro-propagation is one of the techniques used in propagating superior
commercial cocoa clones. Propagation of cuttings can be an alternative method when seedling supplies
are limited by sporadic flowering, low cocoa seed production and poor germination (Pohio et al., 2005,
Dickinson et al., 2010, Pijut et al., 2011). However, successful rate of cocoa propagation using cuttings
can vary considerably according to their genetic constitution (Nanda et al., 1968). Propagation by stem
cuttings especially in recalcitrant species like cocoa needs high technical expertise to achieve an
acceptable rooting percentage including specialized facilities that can produce rooted cuttings, thus
making it difficult for famers to adopt in a large scale. Non-mist propagation system is a low cost and
low-tech system which is suitable to be used by farmers where cuttings are well supplied with water at the
cutting base while the leaves are in a shady and moist condition due to evaporation of water from the leaf
surface. Non-mist propagators provide good environment for stem cuttings with low vapour pressure
deficit (VPD) to minimise water stress. Moreover, in cocoa stem cuttings propagation, environment is the
most important aspect that encourages the physiological activity such as photosynthesis and transpiration
in the leaf in order to minimize the physiological stress experienced by the stem tissues following harvest
(Leakey et al., 1994). A study by Hartmann et al. (1997) indicated that physiological shock arising from
the cuttings from its stock plant can be minimized by controlling the propagation environment.
The significant difference in the growing conditions between cuttings grown in other media and those
grown in soil is the amount of space available for root development. For example, coconut coir fiber,
perlite and vermiculite are suitable for use as growing medium in many crops (Evans et al., 1996). These
media improve structure, aeration and moisture capacity when used as growing media. However, there is
no research conducted on the utilisation of coconut coir fibre, perlite and vermiculite as rooting substrates
in cocoa cuttings. Thus, the objectives of this study were to select cocoa clones suitable to be propagated
using stem cuttings and to study the effects of rooting substrates as well as modified atmosphere of
propagation chambers on the vegetative propagation of commercial cocoa clones through cuttings.
Materials and Methods
A series of nursery experiment was conducted in order to investigate the effects of four different rooting
substrates (perlite and sand, vermiculite and sand and coconut coir fibre and sand) on five commercial
Page 9
ISBN 978-967-10840-4-5
Proc. Int. Conf. Plt. Phy. 2014
First Published, 2015
3
cocoa clones (KKM22, MCBC1, LKMS1, PBC123 and BR25) using a modified atmosphere of non-mist
propagator. Semi-hardwood cuttings of cocoa clones with four internodes were harvested from two-year
old trees of different cocoa clones in the fields. The mean diameter of cuttings was 0.4 cm. The base of
each cutting was cut with a slant. The leaves were trimmed into half of their original size to reduce
transpiration. Cuttings were also disinfected by soaking in a prepared Benex® fungicide containing an
active ingredient of 50% w/w benomyl with 5 g in 10 L of distilled water for 15 min. The basal cuttings
of 0.5-1.0 cm were dipped with ‘Seradix®’ (with IBA - indolebutyric acid as active ingredient) hormone
powder at 8000 ppm and propagated in a non-mist wooden propagator which acts as a propagation
chamber.
The propagator was constructed following the design of Leaky et al. (1990). Wooden propagator (3.0 x
1.0 x 0.8 m) had three compartments. Stones formed as the base material (0.1 m) in each of the
compartments followed by gravels (0.1 m thick on top of stones) and lastly the rooting medium (0.2 m
thick on top of gravels). Treatments of rooting substrates were Treatment 1 [Perlite and sand (1:2 v/v)],
Treatment 2 [Vermiculite and sand (1:2 v/v)] and Treatment 3 [Coconut coir fiber and sand (1:2 v/v)].
Each rooting substrates were sterilized using an autoclave. The non-mist propagation system creates an
altered ambient carbon dioxide concentration by enclosing the cuttings in a sealed propagation chamber.
Air humidity of the chamber was maintained by the provision of water beneath the rooting medium in the
wooden propagator and through spraying of water once a week. The temperature and the relative
humidity were recorded every 30 min during rooting period by using a temperature and humidity data
logger (Watchdog A-Series Logger-A150, Spectrum Technologies, Inc., United States).
The experiment was conducted for two months using a completely randomized design with four
replications. Thereafter, a total of 480 cuttings (3 treatments x 4 replications x 20 samples = 240 samples)
were used with rooting allowed in the chamber for 60 days. Assessment of treatment effects were
recorded two months after propagation using percentage of survival (percentage of cuttings with roots and
shoots divided by the total number of cuttings planted), percentage of cuttings with shoots (total number
of cuttings with shoots divided by the total number of cuttings planted) and percentage cuttings with roots
(total number of cuttings with roots divided by the total number of cuttings planted). Survived cuttings
with successful rooting were transplanted to the polybags. Data were analysed using ANOVA and
separation of means was carried out using Duncan’s multiple range test.
Results and Discussion
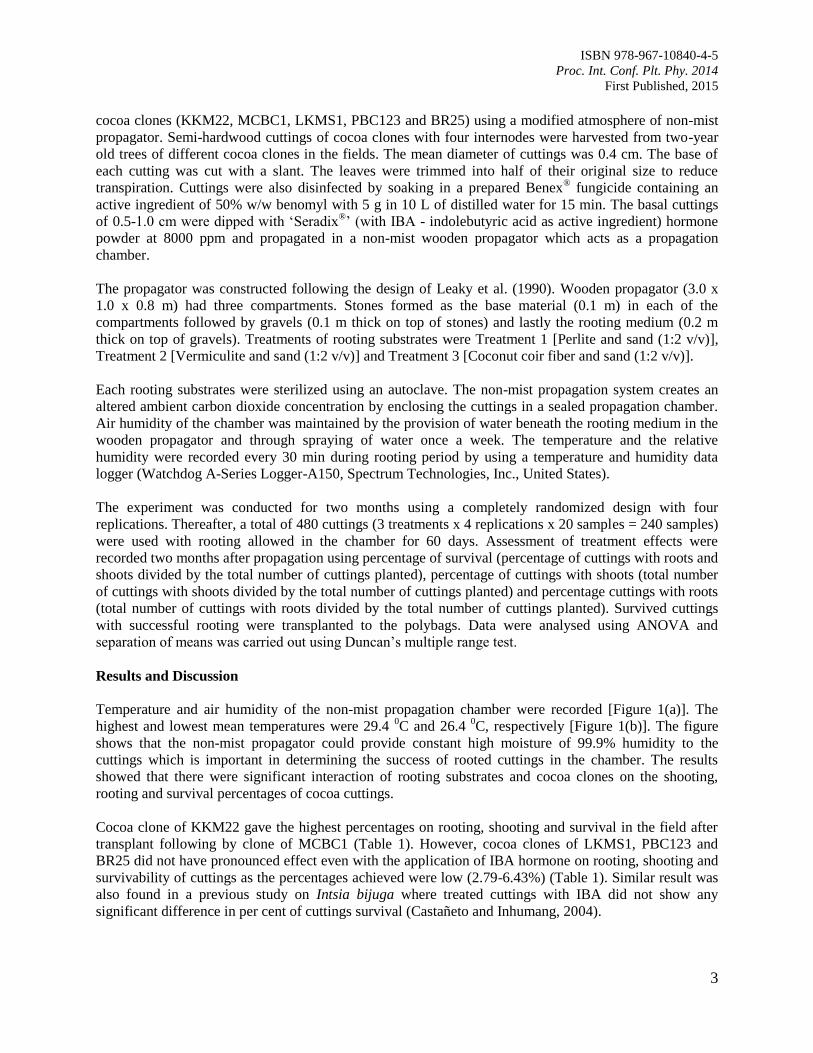
Temperature and air humidity of the non-mist propagation chamber were recorded [Figure 1(a)]. The
highest and lowest mean temperatures were 29.4 0C and 26.4
0C, respectively [Figure 1(b)]. The figure
shows that the non-mist propagator could provide constant high moisture of 99.9% humidity to the
cuttings which is important in determining the success of rooted cuttings in the chamber. The results
showed that there were significant interaction of rooting substrates and cocoa clones on the shooting,
rooting and survival percentages of cocoa cuttings.
Cocoa clone of KKM22 gave the highest percentages on rooting, shooting and survival in the field after
transplant following by clone of MCBC1 (Table 1). However, cocoa clones of LKMS1, PBC123 and
BR25 did not have pronounced effect even with the application of IBA hormone on rooting, shooting and
survivability of cuttings as the percentages achieved were low (2.79-6.43%) (Table 1). Similar result was
also found in a previous study on Intsia bijuga where treated cuttings with IBA did not show any
significant difference in per cent of cuttings survival (Castañeto and Inhumang, 2004).
Page 10
ISBN 978-967-10840-4-5
Proc. Int. Conf. Plt. Phy. 2014
First Published, 2015
4
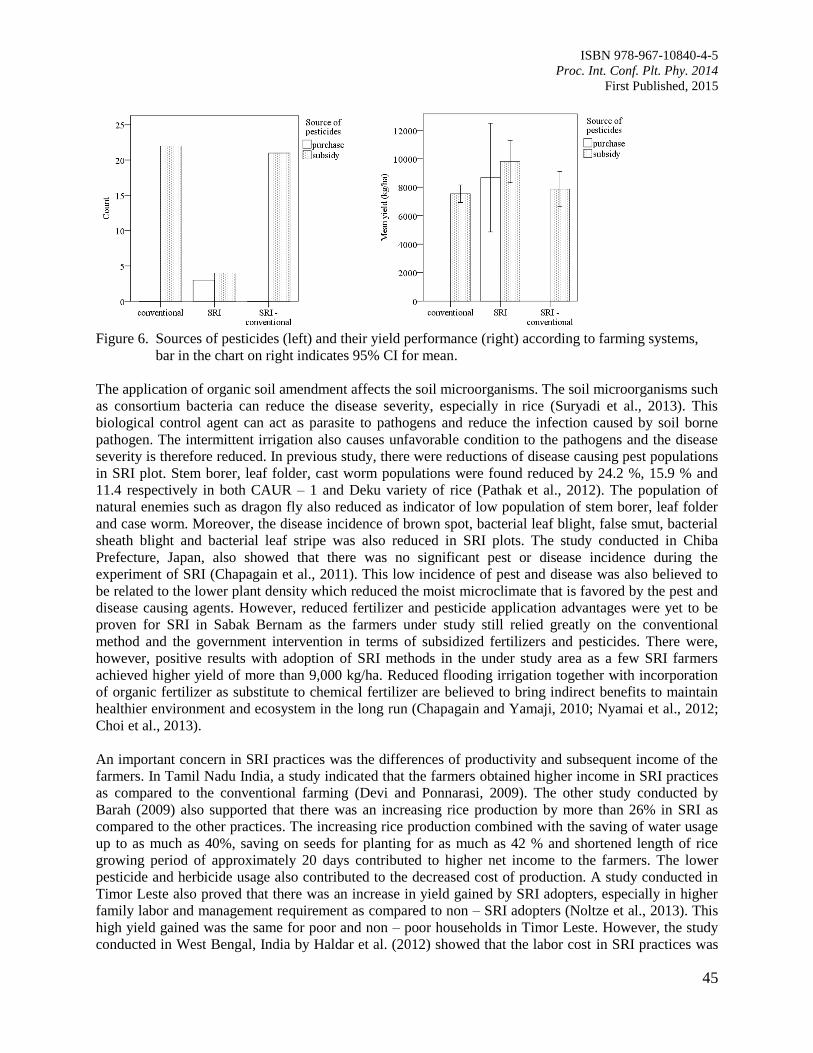
Figure 1. The structure of propagator and the temperature and humidity conditions in the propagator (a)
Non-mist propagator (b) Modified environment in the non-mist propagator with temperature
and relative humidity recorded during eight month trial of cuttings.
Table 1. Summary of the variance analysis on shooting, rooting and percentage of survival of cocoa
cuttings.
Factor Percentage (%)
Shooting Rooting Survival in field
Rooting substrates (A)
Perlite and sand (P+S) 22.58 a 21.06
a 8.47
b
Vermiculite and sand (V+S) 22.45 a 19.62
a 12.25
a
Coconut coir fiber and sand (CCF+S) 14.49 b 12.61
b 7.70
b
Clones (B)
KKM22 65.42 a 56.43
a 25.76
a
MCBC1 18.75 b 16.93
b 10.08
b
LKMS1 5.93 c 6.43
c 4.96
c
PBC123 5.43 cd
5.53 cd
3.77 cd
BR25 3.68 d 3.49
d 2.79
d
Interaction A x B ** ** **
Means followed by the same letter in the same column are not significantly different by DMRT at P≤0.05.
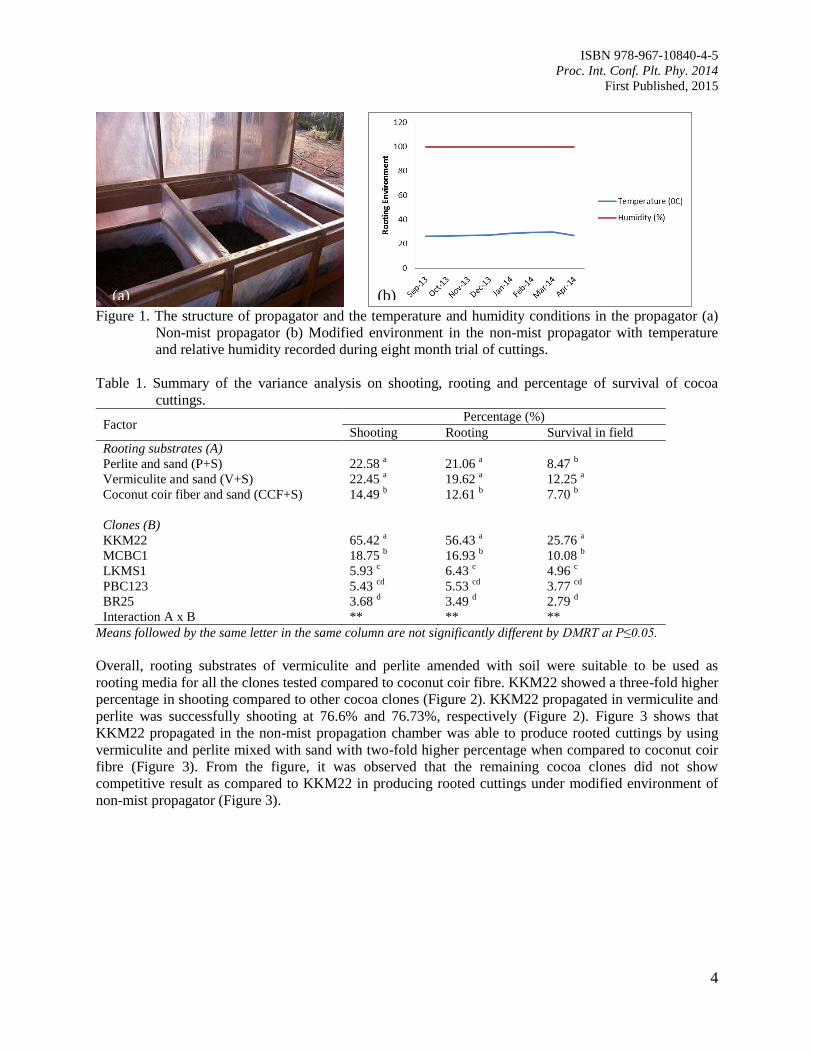
Overall, rooting substrates of vermiculite and perlite amended with soil were suitable to be used as
rooting media for all the clones tested compared to coconut coir fibre. KKM22 showed a three-fold higher
percentage in shooting compared to other cocoa clones (Figure 2). KKM22 propagated in vermiculite and
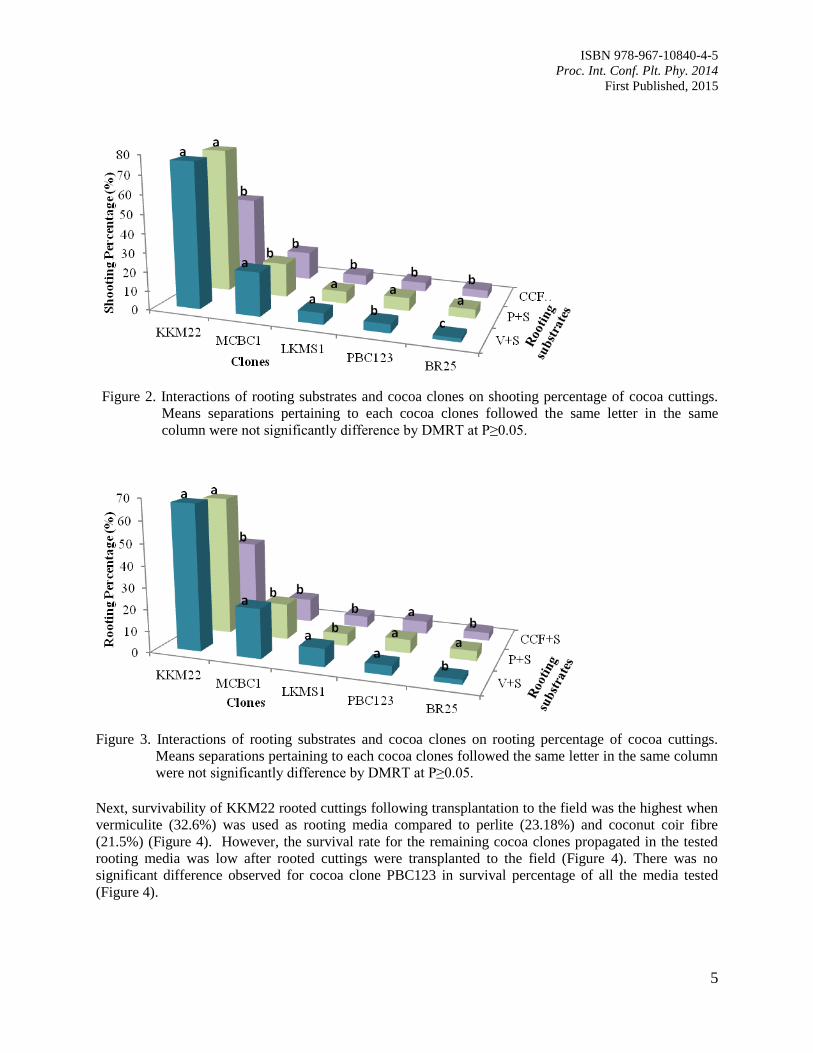
perlite was successfully shooting at 76.6% and 76.73%, respectively (Figure 2). Figure 3 shows that
KKM22 propagated in the non-mist propagation chamber was able to produce rooted cuttings by using
vermiculite and perlite mixed with sand with two-fold higher percentage when compared to coconut coir
fibre (Figure 3). From the figure, it was observed that the remaining cocoa clones did not show
competitive result as compared to KKM22 in producing rooted cuttings under modified environment of
non-mist propagator (Figure 3).
(a) (b)
Page 11
ISBN 978-967-10840-4-5
Proc. Int. Conf. Plt. Phy. 2014
First Published, 2015
5
Figure 2. Interactions of rooting substrates and cocoa clones on shooting percentage of cocoa cuttings.
Means separations pertaining to each cocoa clones followed the same letter in the same
column were not significantly difference by DMRT at P≥0.05.
Figure 3. Interactions of rooting substrates and cocoa clones on rooting percentage of cocoa cuttings.
Means separations pertaining to each cocoa clones followed the same letter in the same column
were not significantly difference by DMRT at P≥0.05.
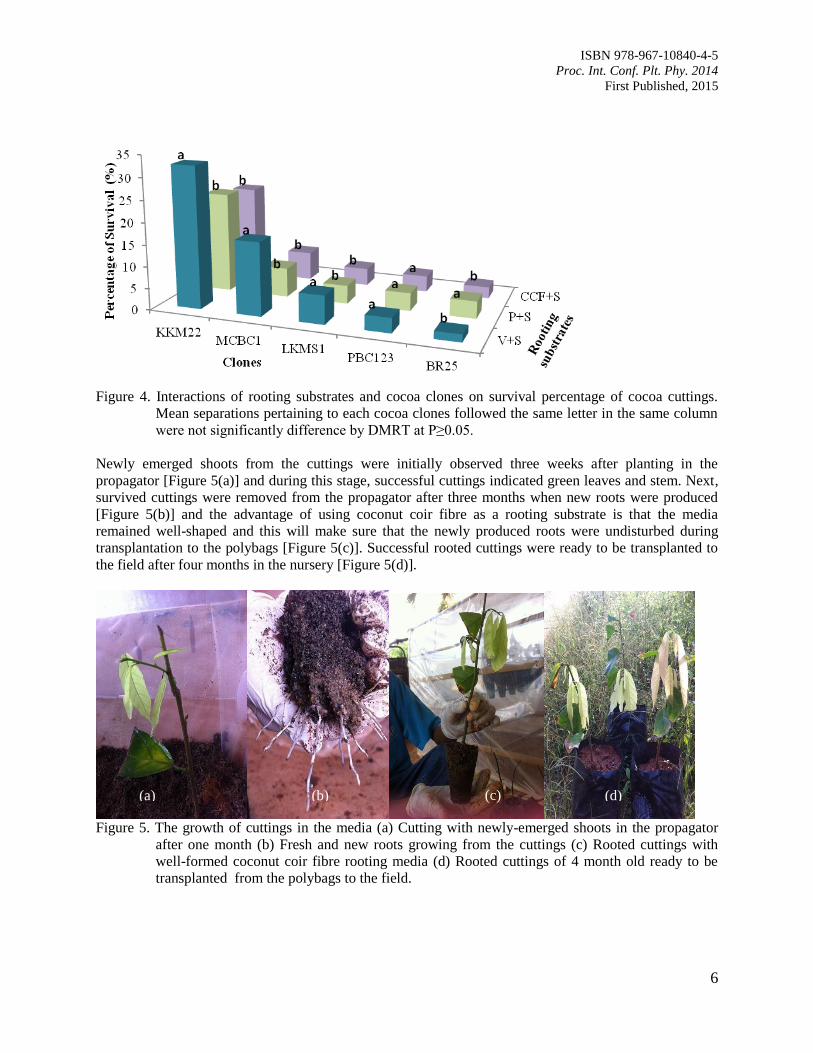
Next, survivability of KKM22 rooted cuttings following transplantation to the field was the highest when
vermiculite (32.6%) was used as rooting media compared to perlite (23.18%) and coconut coir fibre
(21.5%) (Figure 4). However, the survival rate for the remaining cocoa clones propagated in the tested
rooting media was low after rooted cuttings were transplanted to the field (Figure 4). There was no
significant difference observed for cocoa clone PBC123 in survival percentage of all the media tested
(Figure 4).
Page 12
ISBN 978-967-10840-4-5
Proc. Int. Conf. Plt. Phy. 2014
First Published, 2015
6
Figure 4. Interactions of rooting substrates and cocoa clones on survival percentage of cocoa cuttings.
Mean separations pertaining to each cocoa clones followed the same letter in the same column
were not significantly difference by DMRT at P≥0.05.
Newly emerged shoots from the cuttings were initially observed three weeks after planting in the
propagator [Figure 5(a)] and during this stage, successful cuttings indicated green leaves and stem. Next,
survived cuttings were removed from the propagator after three months when new roots were produced
[Figure 5(b)] and the advantage of using coconut coir fibre as a rooting substrate is that the media
remained well-shaped and this will make sure that the newly produced roots were undisturbed during
transplantation to the polybags [Figure 5(c)]. Successful rooted cuttings were ready to be transplanted to
the field after four months in the nursery [Figure 5(d)].
Figure 5. The growth of cuttings in the media (a) Cutting with newly-emerged shoots in the propagator
after one month (b) Fresh and new roots growing from the cuttings (c) Rooted cuttings with
well-formed coconut coir fibre rooting media (d) Rooted cuttings of 4 month old ready to be
transplanted from the polybags to the field.
(a) (b) (d)
cc
(b) (c)
(c)
Page 13
ISBN 978-967-10840-4-5
Proc. Int. Conf. Plt. Phy. 2014
First Published, 2015
7
Conclusions
The cuttings of cocoa clone KKM22 can be successfully propagated in the non-mist propagator by
applying hormone and all the tested rooting substrates. Non-mist propagator is more economical and
affordable to farmers when compared to mist propagator in propagating cocoa through stem cuttings.
Furthermore, non-mist propagator can be used in rural areas which have lack of electricity and limited
water supply. In addition, the percentages of shooting, rooting and survivability in the field after
transplanting can be improved by manipulating the concentration of IBA hormone in order to increase the
efficiency of vegetative propagation method by carrying out cuttings in cocoa.
References
Castañeto, Y.T. and Inhumang, I. 2004. Rooting of ipil (Intsia bijuga Colebr.) cuttings from seedlings
using indolebutyric acid (IBA). Meristem 4: 9-12.
Dickinson, G.R., Wallace, H.M. and Lee, D.J. 2010. Controlled pollination methods for creating
Corymbia hybrids. Silvae Genetica 59: 233-241.
Evans, M.R., Konduru, S. and Stamps, R.H. 1996. Source variation in physical and chemical properties of
coconut coir dust. Horticulturae Science 31: 965-967.
Hartmann, H.T., Kester, D.E. and Davis, JR. F.T. 1997. Plant Propagation: Principles and Practices. 6 ed.
New York: Englewood Clipps/Prentice Hall, p. 770.
Leakey, R.B.B., Mesen, J.F., Tchoundjeu, Z., Longman, K.A., Dick, J.McP., Newton, A., Matin, A.,
Grace, J., Munro, R.C. and Muthoka, P.N. 1990. Low technology techniques for the vegetative
propagation of tropical trees. Commonwealth Forestry Review 69: 247-257.
Leakey, R.R.B., Newton, A.C. and Dick, J.McP. 1994. Capture of genetic variation by vegetative
propagation: processes determining success. In Tropical Trees: The Potential for Domestication
and the Rebuilding of Forest Resources. Leakey, R.R.B. and Newton, A.C. (Eds.), HMSO.,
London, pp 72-83.
Nanda, K.K., Purohit, A.N. and Anand, V.K. 1968. Seasonal rooting response of stem cuttings of some
forest tree species to auxins. Indian Forest: 154-162.
Pijut, P.M., Woeste, K.E. and Michler, C.H. 2011. Promotion of adventitious root formation of difficult-
to-root hardwood tree species. Horticultural Reviews 38: 213-251.
Pohio, K.E., Wallace, H.M., Peters, R.F., Smith, T.E. and Trueman, J. 2005. Cuttings of Wollemi pine
tolerate moderate photo inhibition and remain highly capable of root formation. Trees 19: 587-595.
Page 14
ISBN 978-967-10840-4-5
Proc. Int. Conf. Plt. Phy. 2014
First Published, 2015
8
Effect of Tuber Seed Size on Vine Growth and Yield of Dioscorea hispida
Zakaria, A.J.* and Nordin, M.N.
Agropolis UniSZA, Universiti Sultan Zainal Abidin, Tembila Campus, 22200 Besut, Terengganu Darul
Iman, Malaysia.
*E-mail: [email protected]
Introduction
Dioscorea hispida is a long climber plant with thorny vines and fibrous root system. The roots can
develop into small oval to round tubers when young and elongate as they grow bigger. The tubers are
brown and covered by fibrous rootlets. Locally, it is known as ubi gadong and can be naturally growing
mostly along the river banks where the soils are mostly sandy loam. It is neglected due to its poisonous
“dioscorine” content. Recently D. hispida is becoming popular as the toxins can now be removed and the
tuber can then be consumed by both human and as animal feed supplying carbohydrates. Traditionally the
toxins are removed by soaking the sliced tuber in running water for about 7 days. Recently rapid toxin
removal can be achieved by using an automatic spinning water circulation system (Hudzari et al., 2011).
The plant can easily be propagated using the underground tuber found attached to the main plant. The
tuber varies in number and sizes. In this study the different sizes of tuber was grown to determine which
size would be optimum to be used for seed tuber. It is important to determine the optimum tuber seed size
as this is also the economic part of the plant.
Materials and Methods
Dioscorea hispida tuber were categorised into seven sizes based on tuber weight as 25, 50, 100, 200, 400,
800 and 1600 g. As it was very difficult to obtain the exact tuber size according to the categorised weight,
ranges of tuber sizes close to the categorised size were selected. For each category 16 tuber seed were
selected and sown in black polyethylene bag of sizes 37 cm x 44 cm. The 7 treatments of different sizes
of tuber seed sizes were arranged in randomized complete block design with four replications and four
experimental plants per treatments. The categorization and mean tuber seed size was shown in Table 1.
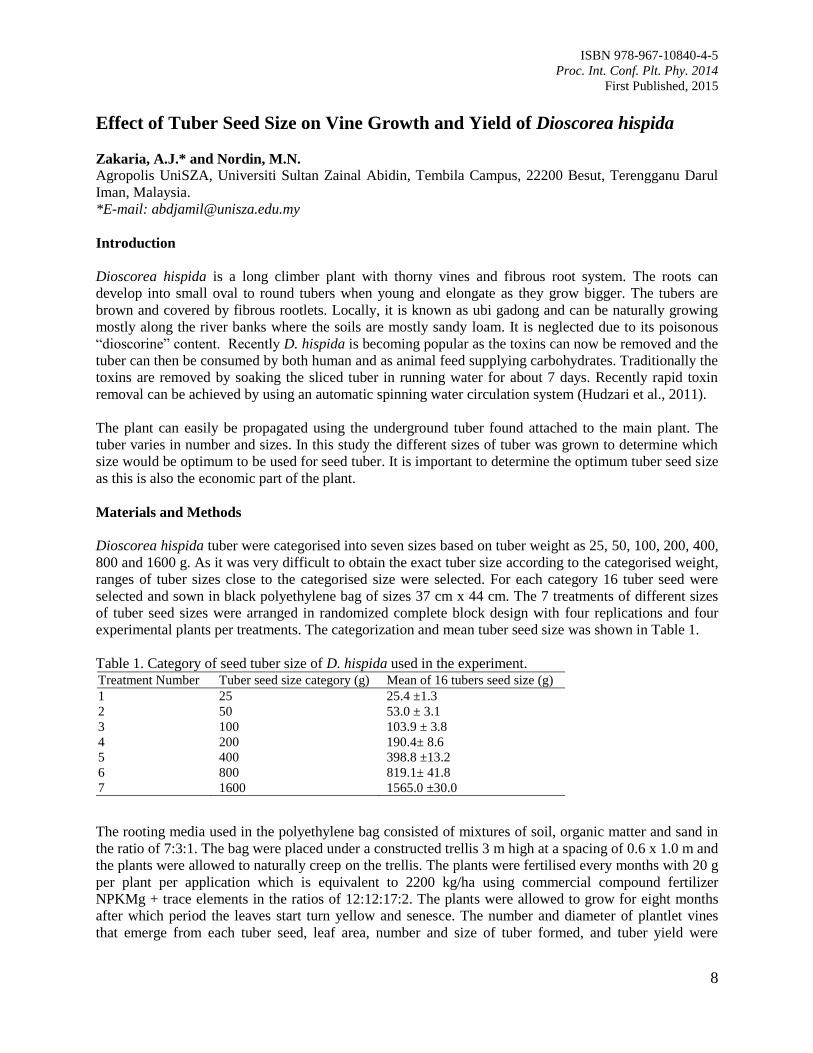
Table 1. Category of seed tuber size of D. hispida used in the experiment.
The rooting media used in the polyethylene bag consisted of mixtures of soil, organic matter and sand in
the ratio of 7:3:1. The bag were placed under a constructed trellis 3 m high at a spacing of 0.6 x 1.0 m and
the plants were allowed to naturally creep on the trellis. The plants were fertilised every months with 20 g
per plant per application which is equivalent to 2200 kg/ha using commercial compound fertilizer
NPKMg + trace elements in the ratios of 12:12:17:2. The plants were allowed to grow for eight months
after which period the leaves start turn yellow and senesce. The number and diameter of plantlet vines
that emerge from each tuber seed, leaf area, number and size of tuber formed, and tuber yield were
Treatment Number Tuber seed size category (g) Mean of 16 tubers seed size (g)
1 25 25.4 ±1.3
2 50 53.0 ± 3.1
3 100 103.9 ± 3.8
4 200 190.4± 8.6
5 400 398.8 ±13.2
6 800 819.1± 41.8
7 1600 1565.0 ±30.0
Page 15
ISBN 978-967-10840-4-5
Proc. Int. Conf. Plt. Phy. 2014
First Published, 2015
9
recorded. Harvesting of tubers was done when all the leaves drop and the plant stated to go into dormancy
stage.
Data collected were statistically analysed for ANOVA using MINITAB 16 and when significant,
comparisons of means were analysed using Tukeys’s test at 95% confidence level.
Results
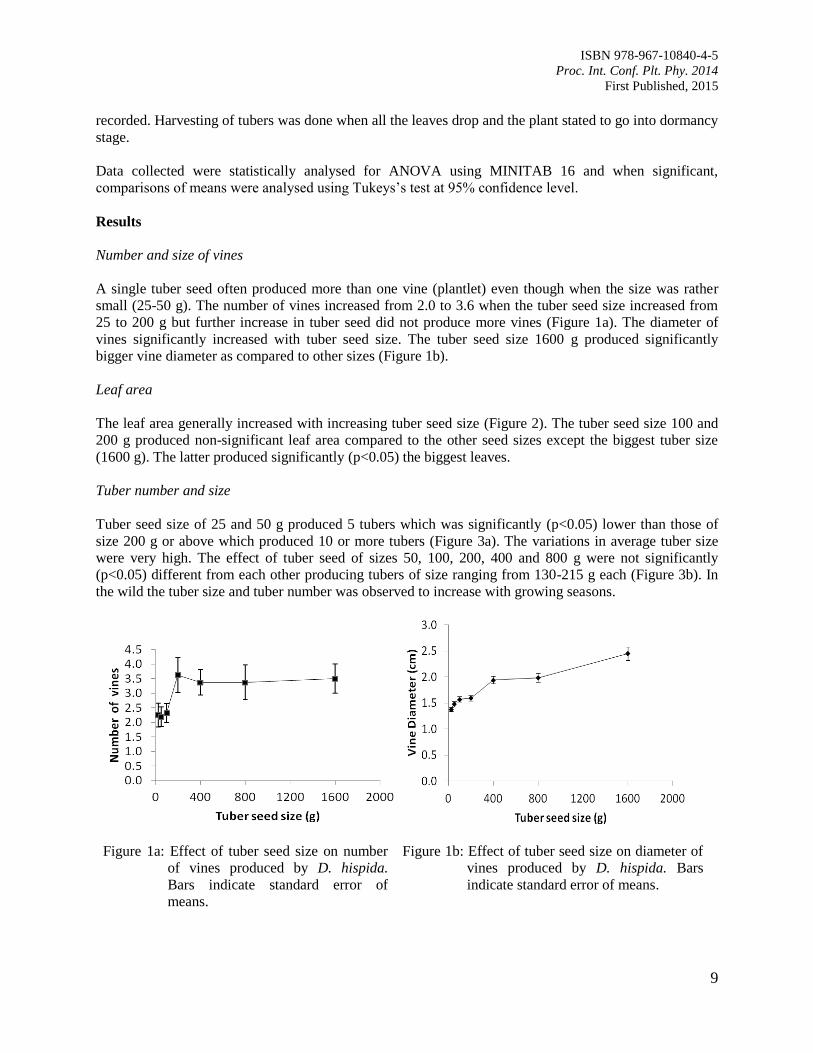
Number and size of vines
A single tuber seed often produced more than one vine (plantlet) even though when the size was rather
small (25-50 g). The number of vines increased from 2.0 to 3.6 when the tuber seed size increased from
25 to 200 g but further increase in tuber seed did not produce more vines (Figure 1a). The diameter of
vines significantly increased with tuber seed size. The tuber seed size 1600 g produced significantly
bigger vine diameter as compared to other sizes (Figure 1b).
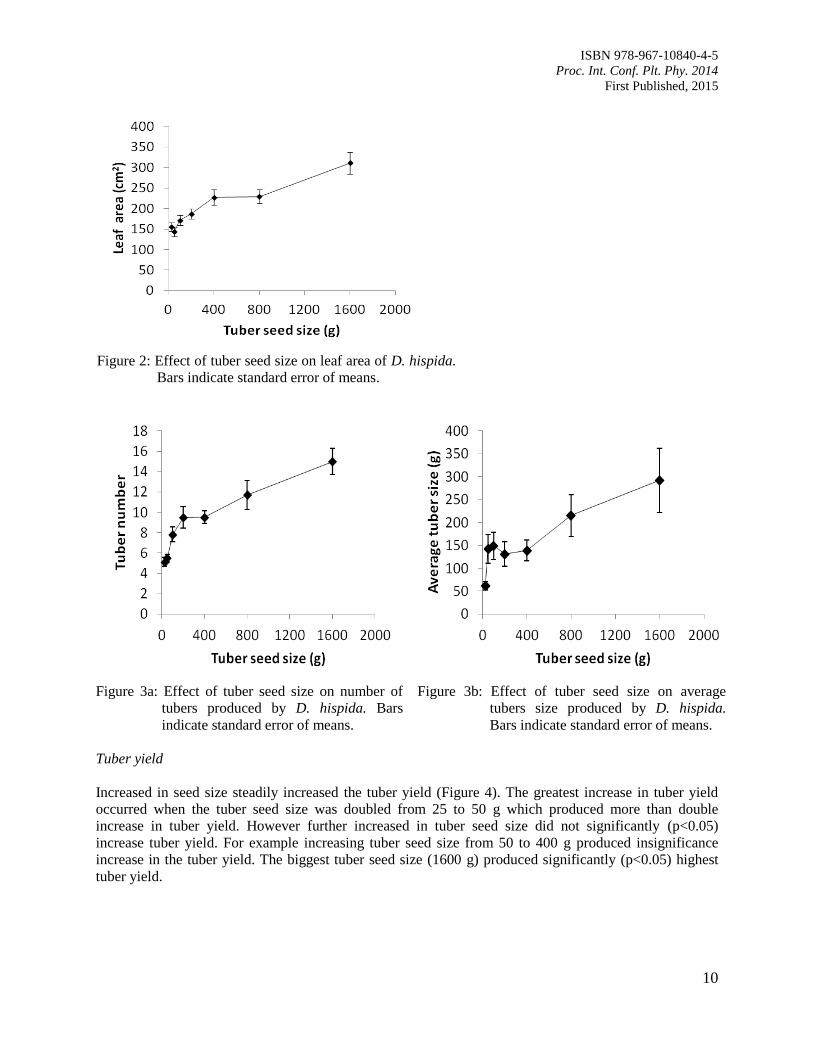
Leaf area
The leaf area generally increased with increasing tuber seed size (Figure 2). The tuber seed size 100 and
200 g produced non-significant leaf area compared to the other seed sizes except the biggest tuber size
(1600 g). The latter produced significantly (p<0.05) the biggest leaves.
Tuber number and size
Tuber seed size of 25 and 50 g produced 5 tubers which was significantly (p<0.05) lower than those of
size 200 g or above which produced 10 or more tubers (Figure 3a). The variations in average tuber size
were very high. The effect of tuber seed of sizes 50, 100, 200, 400 and 800 g were not significantly
(p<0.05) different from each other producing tubers of size ranging from 130-215 g each (Figure 3b). In
the wild the tuber size and tuber number was observed to increase with growing seasons.
Figure 1a: Effect of tuber seed size on number
of vines produced by D. hispida.
Bars indicate standard error of
means.
Figure 1b: Effect of tuber seed size on diameter of
vines produced by D. hispida. Bars
indicate standard error of means.
Page 16
ISBN 978-967-10840-4-5
Proc. Int. Conf. Plt. Phy. 2014
First Published, 2015
10
Figure 3a: Effect of tuber seed size on number of
tubers produced by D. hispida. Bars
indicate standard error of means.
Figure 3b: Effect of tuber seed size on average
tubers size produced by D. hispida.
Bars indicate standard error of means.
Tuber yield
Increased in seed size steadily increased the tuber yield (Figure 4). The greatest increase in tuber yield
occurred when the tuber seed size was doubled from 25 to 50 g which produced more than double
increase in tuber yield. However further increased in tuber seed size did not significantly (p<0.05)
increase tuber yield. For example increasing tuber seed size from 50 to 400 g produced insignificance
increase in the tuber yield. The biggest tuber seed size (1600 g) produced significantly (p<0.05) highest
tuber yield.
Figure 2: Effect of tuber seed size on leaf area of D. hispida.
Bars indicate standard error of means.
Page 17
ISBN 978-967-10840-4-5
Proc. Int. Conf. Plt. Phy. 2014
First Published, 2015
11
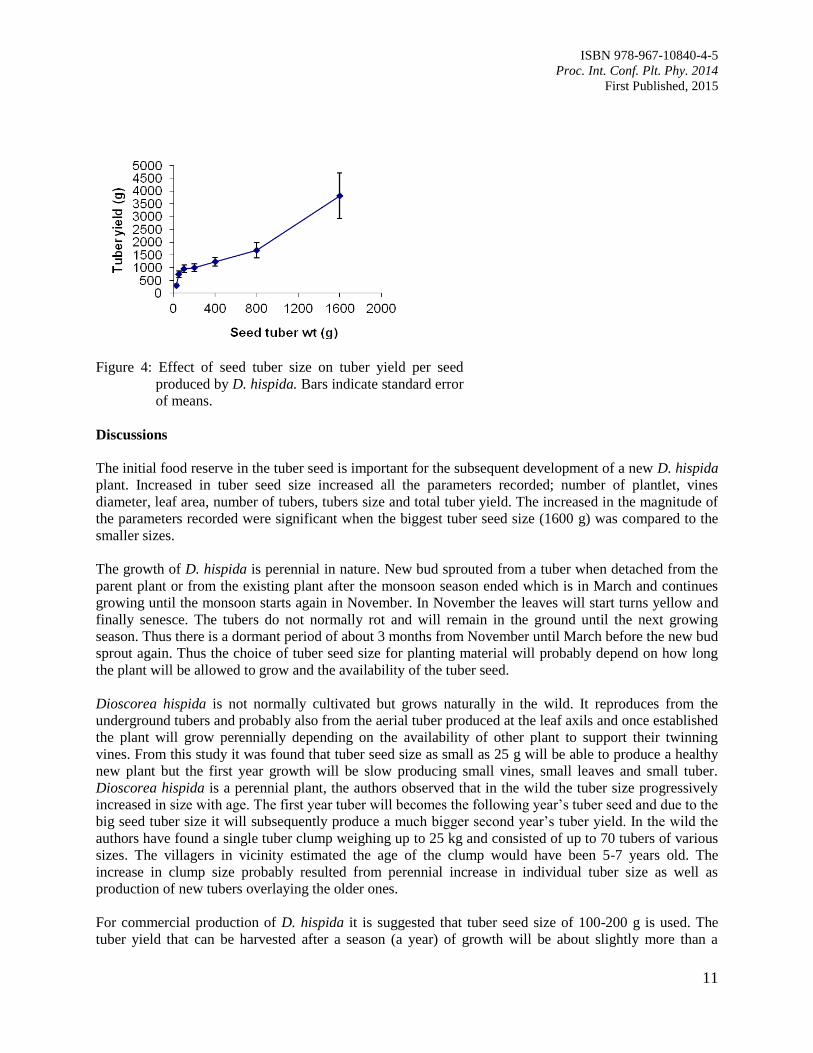
Figure 4: Effect of seed tuber size on tuber yield per seed
produced by D. hispida. Bars indicate standard error
of means.
Discussions
The initial food reserve in the tuber seed is important for the subsequent development of a new D. hispida
plant. Increased in tuber seed size increased all the parameters recorded; number of plantlet, vines
diameter, leaf area, number of tubers, tubers size and total tuber yield. The increased in the magnitude of
the parameters recorded were significant when the biggest tuber seed size (1600 g) was compared to the
smaller sizes.
The growth of D. hispida is perennial in nature. New bud sprouted from a tuber when detached from the
parent plant or from the existing plant after the monsoon season ended which is in March and continues
growing until the monsoon starts again in November. In November the leaves will start turns yellow and
finally senesce. The tubers do not normally rot and will remain in the ground until the next growing
season. Thus there is a dormant period of about 3 months from November until March before the new bud
sprout again. Thus the choice of tuber seed size for planting material will probably depend on how long
the plant will be allowed to grow and the availability of the tuber seed.
Dioscorea hispida is not normally cultivated but grows naturally in the wild. It reproduces from the
underground tubers and probably also from the aerial tuber produced at the leaf axils and once established
the plant will grow perennially depending on the availability of other plant to support their twinning
vines. From this study it was found that tuber seed size as small as 25 g will be able to produce a healthy
new plant but the first year growth will be slow producing small vines, small leaves and small tuber.
Dioscorea hispida is a perennial plant, the authors observed that in the wild the tuber size progressively
increased in size with age. The first year tuber will becomes the following year’s tuber seed and due to the
big seed tuber size it will subsequently produce a much bigger second year’s tuber yield. In the wild the
authors have found a single tuber clump weighing up to 25 kg and consisted of up to 70 tubers of various
sizes. The villagers in vicinity estimated the age of the clump would have been 5-7 years old. The
increase in clump size probably resulted from perennial increase in individual tuber size as well as
production of new tubers overlaying the older ones.
For commercial production of D. hispida it is suggested that tuber seed size of 100-200 g is used. The
tuber yield that can be harvested after a season (a year) of growth will be about slightly more than a
Page 18
ISBN 978-967-10840-4-5
Proc. Int. Conf. Plt. Phy. 2014
First Published, 2015
12
kilogram per clump. However for annual planting system where the tuber is planned to be harvested after
one growing season, a bigger tuber seed size of 400 g is recommended, as it will produce higher tuber
yield. However further study need to be conducted to determine agronomic requirements especially on
planting density, fertilizer requirements and trellis system. With better planting management it is
envisaged that higher yield will be obtained.
Conclusions
Tuber seed size as small as 25 g can be used as planting materials for D. hispida. Better growth in the
form of more and bigger vines, bigger leaf area, more and bigger tuber sizes and higher yields were
obtained by using bigger tuber seed size of 100-200 g. Bigger tuber seed size up to 1600 g produced
linearly better plants and higher yield. Tuber seed size up to 400 g is recommended for annual
commercial production of D. hispida. More studies need to be conducted to determine agronomic
requirements especially on planting density, fertilizer requirements and trellis system to produce higher
tuber yield.
Acknowledgements
The authors thanked the Economic Planning Unit of the state of Terengganu, Malaysia for funding this
project.
References
Hudzari, R.M., Somad, M.A.H.A., Rizuwan, Y.M., Asimi, M.N.N.A. and Abdullah, B.C. 2011.
Development of automatic alkaloid removal system for Dioscorea hispida. Frontiers in Science
1(1): 16-20.
Page 19
ISBN 978-967-10840-4-5
Proc. Int. Conf. Plt. Phy. 2014
First Published, 2015
13
The Effect of Tapping Intensity and Stimulation on Latex Physiological
Characters and Incidence of Tapping Panel Dryness
Eva, H.1,*
and Kuswanhadi.1
Sembawa Research Centre, Indonesian Rubber Research Institute, Jalan Raya Palembang P. Balai, Km
29, Po. Box 1127, 30001 Palembang, Indonesia.
*E-mail: [email protected]
Introduction
Rubber tree (Hevea brasiliensis) is a main source of the natural rubber which is most widely cultivated.
The rubber particles are found in the latex which are synthesized and stored in specific cell called latex
vessel. Latex contains 30-45% of the rubber hydrocarbon, 10-20% of lutoid particles, 1-3% of Frey-
Wyssling particles, 1-3% of carbohydrates, 1% of proteins, 1.6% of lipids, and other constituents (Nair,
2000). Rubber biosynthesis begins with sucrose as a precursor to the formation of polyisoprene with the
cytosolic mevalonate pathway (Keng et al., 2012). Latex was harvested by a system called tapping, done
by removing a thin layer of bark so that latex can come out from latex vessel.
An ideal harvest system is to give optimum yield, to reduce tapping cost, and to increase the economical
life span, and to maintain plant health. In common harvest system in Indonesian, especially in
smallholder, tapping is conducted every day. Although recommended system for smallholder is
conventional tapping i.e. half spiral every two days. Intensive tapping can decrease yield and produce low
quality latex, indicated by declining dry rubber content. Wimalaratne (1973) reported that increasing
intensity of tapping from two days to every day lowered yield by 21.6% in RRIC 52 clone. Latex volume
decreased with intensive tapping. Similarly, the dry rubber content decreased by 3.56% with daily
tapping. Furthermore, it declined the economical life span, as a result more bark consumption so basal
panel only tapped three years. Addition, negative effect of intensive tapping can lead to more incidence of
tapping panel dryness (Wimalaratne, 1973; Yeang and Paranjothy, 1982).
On the other hand, the problem in rubber cultivation recently is a shortage labour having good skill in
latex harvesting and the severe rising salary of labour. One of the ways to solve this condition is to change
of tapping day into low frequency tapping with stimulation. Kuswanhadi and Junaidi (1986) defined that
the combination of low frequency tapping and stimulation rose yield. In addition, stimulant application in
low frequency tapping resolved the decline of yield due to decreasing of tapping frequency. Further, it can
reduce labour requirement, save bark consumption, and maintain the health of trees (Sivakumaran et al.,
1982; Abraham, 1984; Kuswanhadi and Junaidi, 1986; Commere and Escbach, 1988). Total production of
the low frequency tapping was higher than intensive tapping with equal bark consumption (Sivakumaran
et al., 1982).
Stimulant application is the part of a way to increase the production, which has been widely adopted by
commercial estates than smallholders. Stimulation can increase yield by extending duration of latex flow
as a result increasing of lutoid stability (Wargadipura, 1981; Coupe and Chrestin, 1989; Jacob et al.,
1989; Krishnakumar et al., 2011). The using of stimulation in exploitation system must follow by
management and discipline in order to get sustainable yield. Incorrect application can lead to more
incidence of tapping panel dryness, althought the major factors is still unknown. Many opinions are that
the tapping panel dryness is the caused by abiotic factors, biotic factors, variation genotype, nutrient
status, and intensity of tapping (van de sype, 1984; Sivakumaran and Zainab, 1996; Senevirathna, 2006).
The high metabolism clones are more susceptible than medium and low metabolism clones (Sivakumaran
et al., 1988). Both the high intensity of tapping and over stimulation are important factors to cause the
Page 20
ISBN 978-967-10840-4-5
Proc. Int. Conf. Plt. Phy. 2014
First Published, 2015
14
incidence of tapping panel dryness. The purpose of this study was to evaluate the response of clones
having difference in latex metabolism activity to low intensity tapping with stimulation and to study their
effects on yield and incidence of tapping panel dryness.
Materials and Methods
The experiment was carried out in the experimental field of Sembawa Research Centre since April 2010
to November 2012. The experimental was arranged in a Completely Randomized Block Design with 9
treatments and three replications. The experiment used PB 260, RRIM 600, and PB 217 clones which
were planted in 2004. Details of treatments are listed in Table 1.
Table 1. Details of tapping treatments. Treatments Notation Exploitation system
A S/2 d1 Intensive tapping, without stimulation
B S/2 d1 ET2.5% Ga1 12/y (m) Intensive tapping, with stimulation 12 times/year
C S/2 d1 ET2.5% Ga1 24/y (2w) Intensive tapping, with stimulation 24 times/year
D S/2 d2 Conventional exploitation, without stimulation
E S/2 d2 ET2.5% Ga1 12/y (m) Conventional exploitation, with stimulation 12 times/year
F S/2 d2 ET2.5% Ga1 24/y (2w) Conventional exploitation, with stimulation 24 times/year
G S/2 d4 Low frequency tapping, without stimulation
H S/2 d4 ET2.5% Ga1 12/y (m) Low frequency tapping, with stimulation 12 times/year
I S/2 d4 ET2.5% Ga1 24/y (2w) Low frequency tapping, with stimulation 24 times/year
The production was assessed by weighing the cup lump from each tree. Dry rubber content was assessed
by gravimetric method, based on ratio between dry and wet matter from 5 g of latex. Latex drying was
conducted at 100 0C until constant weight was reached. The latex physiology parameters i.e. sucrose and
inorganic phosphorous concentration in latex were measured every month. The sucrose and the inorganic
phosphorous were measured on the clear serum prepared in TCA called TCA serum (Tricloroacetic acid)
after latex coagulation, by the anthrone method (Dische, 1962) and the molybdate ammonium method
(Taussky dan Shorr, 1953), respectively.
The observation of dry cut length was done by visual estimation of dry cut length percentage which was
then converted to value score according to Table 2.
Table 2. Score of tapping panel dryness. Score Tapping panel condition (%)
0
1
2
3
4
Healthy cut (no dry cut)
1-25% dry cut
26-50% dry cut
51-75% dry cut
76-100% dry cut
Results and Discussion
For all of the clones evaluated, the exploitation system with low frequency tapping produced the highest
yield in terms of gram dry rubber/tree/tapping (g/t/t), whereas the intensive tapping system produced
lower g/t/t than conventional exploitation system. The addition of stimulation in conventional tapping
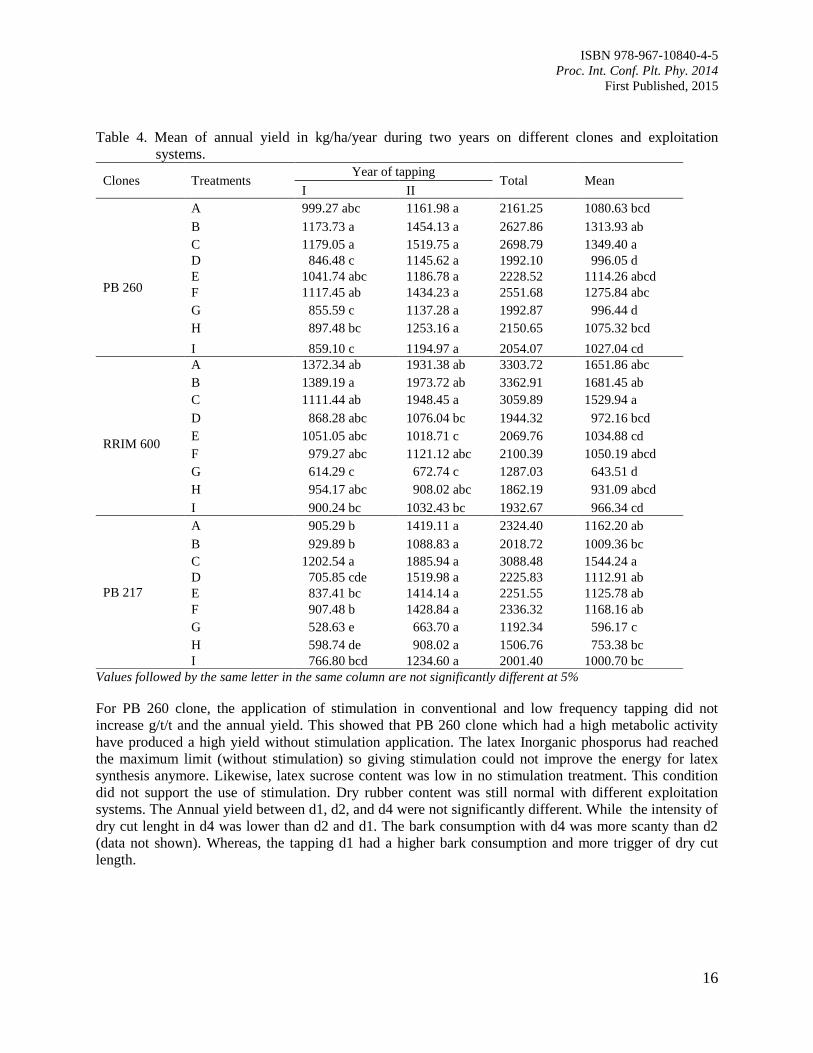
system did not improve yield anymore (Table 3). The total yield during two years on intensive tapping
system was the highest (Table 4). It occured on all of the three clones caused by higher number of tapping
days in this case. For the mean yield for two years, the highest yield was achieved by intensive tapping
Page 21
ISBN 978-967-10840-4-5
Proc. Int. Conf. Plt. Phy. 2014
First Published, 2015
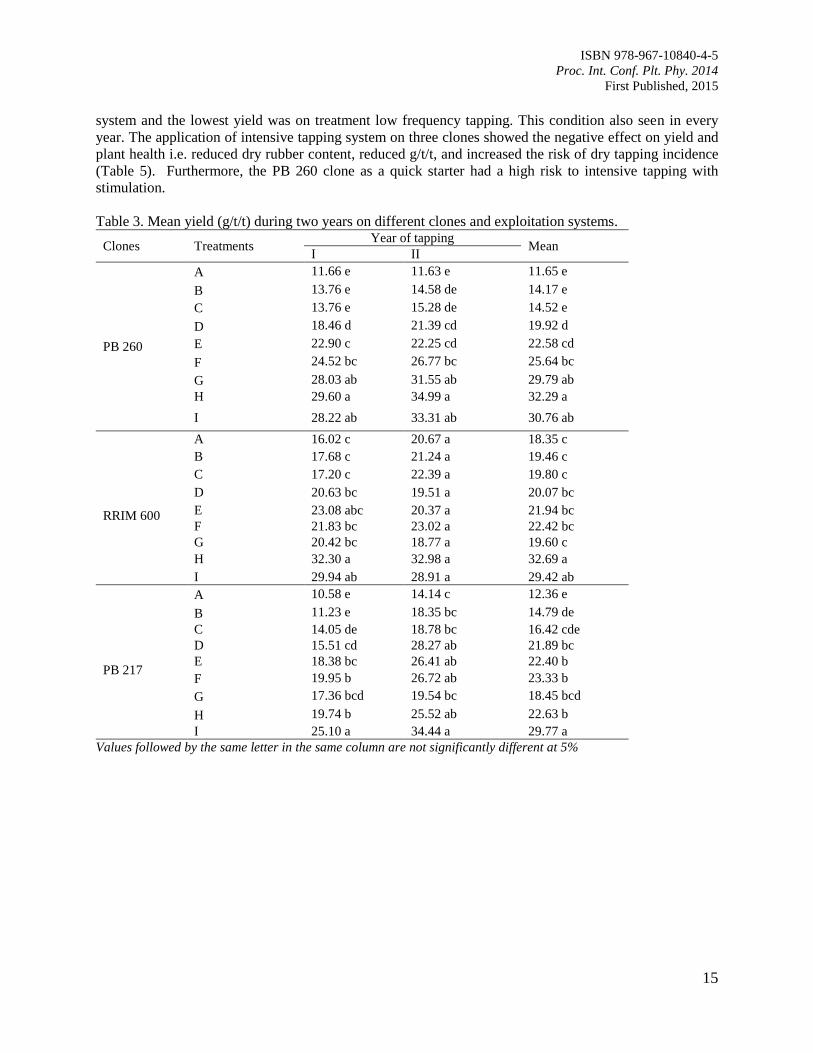
15
system and the lowest yield was on treatment low frequency tapping. This condition also seen in every
year. The application of intensive tapping system on three clones showed the negative effect on yield and
plant health i.e. reduced dry rubber content, reduced g/t/t, and increased the risk of dry tapping incidence
(Table 5). Furthermore, the PB 260 clone as a quick starter had a high risk to intensive tapping with
stimulation.
Table 3. Mean yield (g/t/t) during two years on different clones and exploitation systems.
Clones Treatments Year of tapping
Mean I II
PB 260
A 11.66 e 11.63 e 11.65 e
B 13.76 e 14.58 de 14.17 e
C 13.76 e 15.28 de 14.52 e
D 18.46 d 21.39 cd 19.92 d
E 22.90 c 22.25 cd 22.58 cd
F 24.52 bc 26.77 bc 25.64 bc
G 28.03 ab 31.55 ab 29.79 ab
H 29.60 a 34.99 a 32.29 a
I 28.22 ab 33.31 ab 30.76 ab
RRIM 600
A 16.02 c 20.67 a 18.35 c
B 17.68 c 21.24 a 19.46 c
C 17.20 c 22.39 a 19.80 c
D 20.63 bc 19.51 a 20.07 bc
E 23.08 abc 20.37 a 21.94 bc
F 21.83 bc 23.02 a 22.42 bc
G 20.42 bc 18.77 a 19.60 c
H 32.30 a 32.98 a 32.69 a
I 29.94 ab 28.91 a 29.42 ab
PB 217
A 10.58 e 14.14 c 12.36 e
B 11.23 e 18.35 bc 14.79 de
C 14.05 de 18.78 bc 16.42 cde
D 15.51 cd 28.27 ab 21.89 bc
E 18.38 bc 26.41 ab 22.40 b
F 19.95 b 26.72 ab 23.33 b
G 17.36 bcd 19.54 bc 18.45 bcd
H 19.74 b 25.52 ab 22.63 b
I 25.10 a 34.44 a 29.77 a
Values followed by the same letter in the same column are not significantly different at 5%
Page 22
ISBN 978-967-10840-4-5
Proc. Int. Conf. Plt. Phy. 2014
First Published, 2015
16
Table 4. Mean of annual yield in kg/ha/year during two years on different clones and exploitation
systems.
Values followed by the same letter in the same column are not significantly different at 5%
For PB 260 clone, the application of stimulation in conventional and low frequency tapping did not
increase g/t/t and the annual yield. This showed that PB 260 clone which had a high metabolic activity
have produced a high yield without stimulation application. The latex Inorganic phosporus had reached
the maximum limit (without stimulation) so giving stimulation could not improve the energy for latex
synthesis anymore. Likewise, latex sucrose content was low in no stimulation treatment. This condition
did not support the use of stimulation. Dry rubber content was still normal with different exploitation
systems. The Annual yield between d1, d2, and d4 were not significantly different. While the intensity of
dry cut lenght in d4 was lower than d2 and d1. The bark consumption with d4 was more scanty than d2
(data not shown). Whereas, the tapping d1 had a higher bark consumption and more trigger of dry cut
length.
Clones Treatments Year of tapping
Total Mean I II
PB 260
A 999.27 abc 1161.98 a 2161.25 1080.63 bcd
B 1173.73 a 1454.13 a 2627.86 1313.93 ab
C 1179.05 a 1519.75 a 2698.79 1349.40 a
D 846.48 c 1145.62 a 1992.10 996.05 d
E 1041.74 abc 1186.78 a 2228.52 1114.26 abcd
F 1117.45 ab 1434.23 a 2551.68 1275.84 abc
G 855.59 c 1137.28 a 1992.87 996.44 d
H 897.48 bc 1253.16 a 2150.65 1075.32 bcd
I 859.10 c 1194.97 a 2054.07 1027.04 cd
RRIM 600
A 1372.34 ab 1931.38 ab 3303.72 1651.86 abc
B 1389.19 a 1973.72 ab 3362.91 1681.45 ab
C 1111.44 ab 1948.45 a 3059.89 1529.94 a
D 868.28 abc 1076.04 bc 1944.32 972.16 bcd
E 1051.05 abc 1018.71 c 2069.76 1034.88 cd
F 979.27 abc 1121.12 abc 2100.39 1050.19 abcd
G 614.29 c 672.74 c 1287.03 643.51 d
H 954.17 abc 908.02 abc 1862.19 931.09 abcd
I 900.24 bc 1032.43 bc 1932.67 966.34 cd
PB 217
A 905.29 b 1419.11 a 2324.40 1162.20 ab
B 929.89 b 1088.83 a 2018.72 1009.36 bc
C 1202.54 a 1885.94 a 3088.48 1544.24 a
D 705.85 cde 1519.98 a 2225.83 1112.91 ab
E 837.41 bc 1414.14 a 2251.55 1125.78 ab
F 907.48 b 1428.84 a 2336.32 1168.16 ab
G 528.63 e 663.70 a 1192.34 596.17 c
H 598.74 de 908.02 a 1506.76 753.38 bc
I 766.80 bcd 1234.60 a 2001.40 1000.70 bc
Page 23
ISBN 978-967-10840-4-5
Proc. Int. Conf. Plt. Phy. 2014
First Published, 2015
17
Table 5. Latex physiological parameters on different clones and exploitation systems.
Clones Treatments Sucrose (mM) Inorganic phosporus (mM) DRC (%) DCL
PB 260
A 2.34 a 15.80 ab 35.45 de 2
B 2.18 a 19.08 a 36.42 cd 4
C 2.11 a 18.79 a 34.70 e 4
D 2.35 a 14.50 b 36.69 bcd 1
E 2.10 a 15.86 ab 37.40 abc 3
F 2.09 a 19.14 a 36.72 bcd 2
G 1.82 a 14.26 b 38.18 ab 0
H 2.30 a 15.95 ab 37.75 abc 2
I 2.39 a 17.54 ab 38.30 a 1
RRIM 600
A 8.34 a 11.78 abcd 34.89 ab 0
B 4.55 cd 16.04 a 34.64 ab 2
C 6.88 abc 14.72 ab 32.71 c 2
D 7.27 ab 7.63 d 35.55 ab 0
E 5.34 bcd 10.12 bcd 34.24 b 1
F 5.93 bcd 11.91 abcd 34.51 ab 0
G 5.23 bcd 7.50 d 34.82 ab 2
H 4.35 d 9.79 cd 35.33 ab 2
I 4.88 bcd 13.49 abc 35.76 a 0
PB 217
A 7.10 a 7.35 bcd 33.98 bc 2
B 4.96 c 10.48 a 32.04 d 2
C 4.95 c 10.85 a 32.53 d 1
D 6.59 ab 5.05 d 36.59 a 2
E 5.15 c 8.85 abc 33.94 bc 2
F 4.89 c 9.65 ab 33.76 c 1
G 5.87 bc 6.75 cd 35.09 b 0
H 5.47 c 8.16 abc 35.08 b 0
I 5.37 c 10.20 a 34.23 bc 1
Values followed by the same letter in the same column are not significantly different at 5%
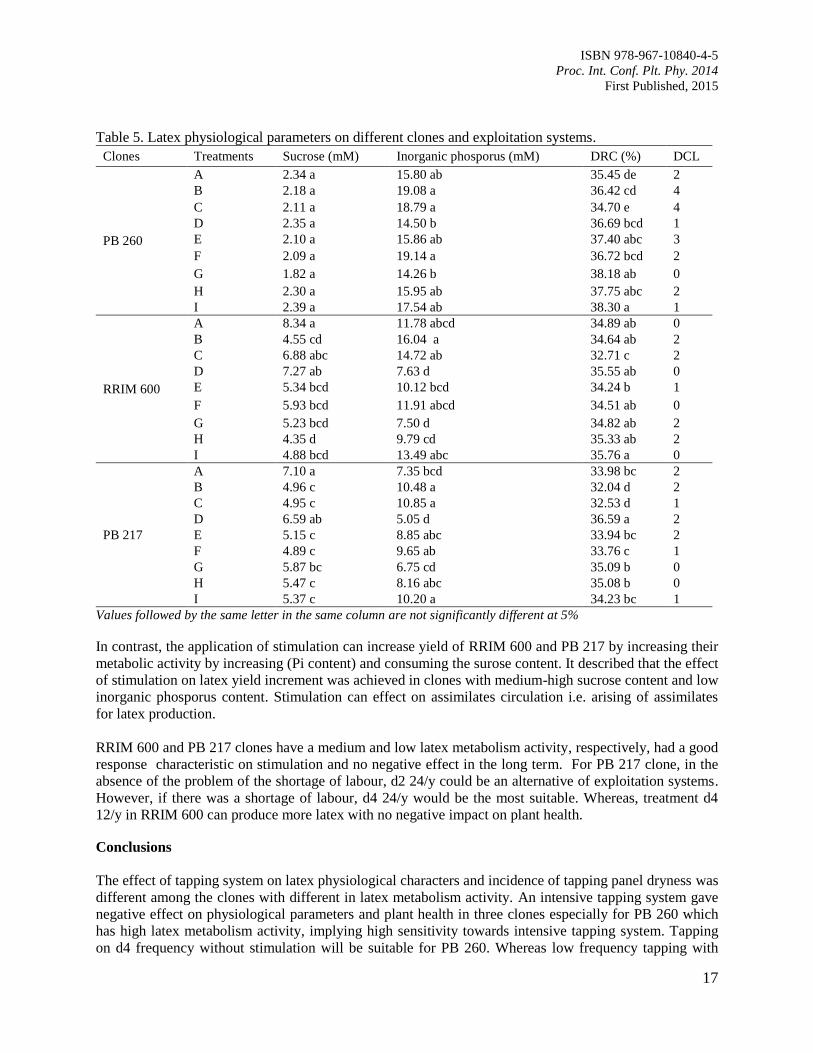
In contrast, the application of stimulation can increase yield of RRIM 600 and PB 217 by increasing their
metabolic activity by increasing (Pi content) and consuming the surose content. It described that the effect
of stimulation on latex yield increment was achieved in clones with medium-high sucrose content and low
inorganic phosporus content. Stimulation can effect on assimilates circulation i.e. arising of assimilates
for latex production.
RRIM 600 and PB 217 clones have a medium and low latex metabolism activity, respectively, had a good
response characteristic on stimulation and no negative effect in the long term. For PB 217 clone, in the
absence of the problem of the shortage of labour, d2 24/y could be an alternative of exploitation systems.
However, if there was a shortage of labour, d4 24/y would be the most suitable. Whereas, treatment d4
12/y in RRIM 600 can produce more latex with no negative impact on plant health.
Conclusions
The effect of tapping system on latex physiological characters and incidence of tapping panel dryness was
different among the clones with different in latex metabolism activity. An intensive tapping system gave
negative effect on physiological parameters and plant health in three clones especially for PB 260 which
has high latex metabolism activity, implying high sensitivity towards intensive tapping system. Tapping
on d4 frequency without stimulation will be suitable for PB 260. Whereas low frequency tapping with
Page 24
ISBN 978-967-10840-4-5
Proc. Int. Conf. Plt. Phy. 2014
First Published, 2015
18
different frequency of stimulation can increase latex yield without imposing any negative impact on
plants health for RRIM 600 and PB 217 which have medium-low latex metabolism activity. d4 12/y and
d4 24/y. respectively.
References
Abraham, P.D. 1984. Tapping and exploitation physiology research at the Rubber Research Institute of
Malaysia. Proceeding of exploitation, physiology and amelioration in Hevea. Montpellier. France.
Pp. 204-208.
Commere, J. and Escbach, J.M. 1988. The advantages of low intensity upward tapping in Cote d’ivore.
Proceeding of exploitation, physiology, and amelioration in Hevea. Paris. Pp. 167-175.
Coupe, M. and Chrestin, H. 1989. Physico-Chemical and Biochemical Mechanism of Hormonal
(Ethylene) Stimulation. In: Physiology of Rubber Tree Latex. Pp. 295-319.
Dische, Z.M. 1962. Carbohydrate Chem. Acad. Press. New York. Pp. 477-517.
Jacob, J.L., Prevot, J.C., Roussel, D., Lacrotte, R., Serres, D’Auzac, E., Eschbachk J.M. and Omont, H.
1989. Field Limiting Factors. Latex Physiological Parameters. Latex Diagnosis. and Clonal
Typology. In: Physiology of Rubber Tree Latex. CRC Press. Inc. Boca Raton. Florida. Pp. 345-
382.
Keng, S.C., Mohd Noor, M.I., Bahari, A., Kamal Ghazali, A., Alias, H., Mohd Zainuddin, Z., Chee, C.H.
and Kiew, L.W. 2012. Metabolic routes affecting rubber biosynthesis in Hevea brasiliensis latex.
Journal of Experimental Botany 63(5): 1863-1871.
Kuswanhadi and Junaidi, U. 1986. Sistem sadap berintensitas rendah untuk memperpanjang masa
produksi tanaman karet. Laporan Penelitian 2(3): 15-20.
Krishnakumar, R. Helen, R.L.. Ambily, P.K. and Jacob, J. 2011. A Modified Stimulation Method in
Hevea brasiliensis for Reducing Oxidative Stress. IRRDB International Rubber Conference 15-
16 December 2011. Thailand.
Nair, N.U. 2000. Biochemistry and Physiology of Latex Production in Natural Rubber: Agromanagement
and Crop Processing. The Rubber Research Institute of India. Rubber Board. Kottayam. India.
Pp. 125-130.
Seneviranthna, A.M.W.K. 2006. Current status of tapping oanel dryness in some Sri Lanka high yielding
clones of rubber and associated factors. International Natural Rubber Conference. Ho Chi Minh
City. Vietnam. Pp. 83-104.
Sivakumaran, S. Haridas, G. and Abraham, P.D. 1988. Problem of tree dryness with high yielding
precocious clones and methods to exploit such clones. Proceeding of exploitation, physiology,
and amelioration in Hevea. Montpellier. France. Pp. 109-117.
Sivakumaran, S., Pakianathan, S.W. and Abraham, P.D. 1982. Long-term ethephon stimulation. II. Effect
of continuous ethephon stimulation with low frequency tapping systems. Journal of the Rubber
Research Institute of Malaysia 30(3): 174-196.
Sivakumaran, S. and Zainab, H. 1996. Nutrient status in relation to tree dryness. IRRDB Symposium on
Agonomy Aspects of the cultivation of Natural Rubber. Sri Lanka. Pp. 153-158
Taussky, H.H. and Shorr, E. 1953. A micro colorimetric methods for the determination of inorganic
phosphorus. Journal of Biological Chemistry 202: 675-685.
van de sype, H. 1984. The dry cut syndrome of Hevea brasiliensis evolution. agronomical. and
physiological aspects. Proceeding of exploitation, physiology, and amelioration in Hevea.
Montpellier. France. Pp. 153-158.
Wargadipura, R. 1981. Pengujian Efikasi Stimulan Ethrel 2.5% Ready Mix Pada Tanaman Karet. Menara
Perkebunan 49(2): 31-35.
Wimalaratne, S.D. 1973. Economic evaluation of tapping systems. Journal Rubber Research Institute Sri
Lanka 50(1&2): 40-54.
Page 25
ISBN 978-967-10840-4-5
Proc. Int. Conf. Plt. Phy. 2014
First Published, 2015
19
Yeang, H.Y. and Paranjothy, K. 1982. Initial physiological changes in Hevea latex and latex flow
characteristics associated with intensive tapping. Journal of the Rubber Research Institute of
Malaysia 30(1): 31-44.
Page 26
ISBN 978-967-10840-4-5
Proc. Int. Conf. Plt. Phy. 2014
First Published, 2015
20
Cellular Changes in Cocoa Clones Graft Compatibility
Rozita, O.1,*
, Nurashikin, A.2 and Razi, I.
3
1Malaysian Cocoa Board, Lock Bag 211, 88999 Kota Kinabalu, Sabah, Malaysia.
2Faculty of Agriculture;
3Institute of Tropical Agriculture, Universiti Putra Malaysia, 43400 Serdang,
Selangor, Malaysia.
*E-mail: [email protected]
Introduction
Clonal planting materials have been widely used in cocoa cultivation in Malaysia. In previous years,
many high yielding clones had been released and recommended for planting. However, some of the
selected clones were not resistant or at least tolerant to pests and diseases. Among the clones, PBC 130
was considered as a high yielding clone, even though it is highly susceptible to vascular streak dieback
disease (VSD) caused by Ceratobasidium theobromae. One of the promising methods to control VSD in
mature cocoa is through canopy replacement since the fungus penetrates the vascular system of
susceptible clones via the shoots. The canopy of the susceptible clones was replaced by the tolerant clones
through side grafting on the branches. Initially, the susceptible clone was grafted to hybrid rootstock.
Then, it was regrafted using tolerant clones at the stem or branches. However, graft incompatibility was a
problem observed in grafted plants, causing dieback. Evaluation of graft compatibility in this experiment
was conducted because it involved two stages of grafting since there was no known report on this type of
grafting. The first stage involved grafting between hybrid rootstock with first clone (e.g. PBC 130). The
second stage involved grafting the first clone (PBC 130) with another clone (e.g. PBC 123). Since there
was a possibility of nutrients and water blockage due to the two stages grafting, this study was very
important and need to be investigated.
Factors influencing the success of grafting rootstocks on scion include size, growth habit of tree and also
fruiting including precocity, bud formation and numbers, fruit set and yield, fruit size, quality and
maturity. Using the observed effects of rootstock on vigour to obtain uniform growth in plantings of
several cocoa clones requires good knowledge on scions and rootstocks (Phang, 2004). In the present
study, PBC 130 clone which is known to be susceptible to VSD disease was grafted with selected VSD
tolerant clones. The graft compatibility of the union between PBC 130 and VSD tolerant clones was
analyzed through anatomical study. The objective of this study was to observe the development of callus
cells and tissues of the graft union during graft union formation.
Materials and Methods
This study was carried out at the Malaysian Cocoa Board Research and Development Centre, Jengka,
Pahang. The treatments were laid out in Randomized Complete Block Design (RCBD) with four
replications. Four clones PBC 123, QH 1003, KKM 25 and MCBC 1 were selected for grafting. These
clones were considered tolerant to VSD disease based on the previous study.
Cocoa seeds from seed gardens were used to obtain uniform seedlings and to reduce error of experiment.
The seeds were sown in polybag of size 30 x 45 cm. There were two stages of graft combinations (Figure
1). After three months, the seedlings were grafted with PBC130 clone using top grafting technique. Three
months later, four selected clones were grafted to the PBC130 clone also using top grafting technique.
This method was applied to within the natural field conditions of mature cocoa. Graft unions were
sampled from each cocoa clones at 10, 20, 30 and 40 days after grafting.
Page 27
ISBN 978-967-10840-4-5
Proc. Int. Conf. Plt. Phy. 2014
First Published, 2015
21
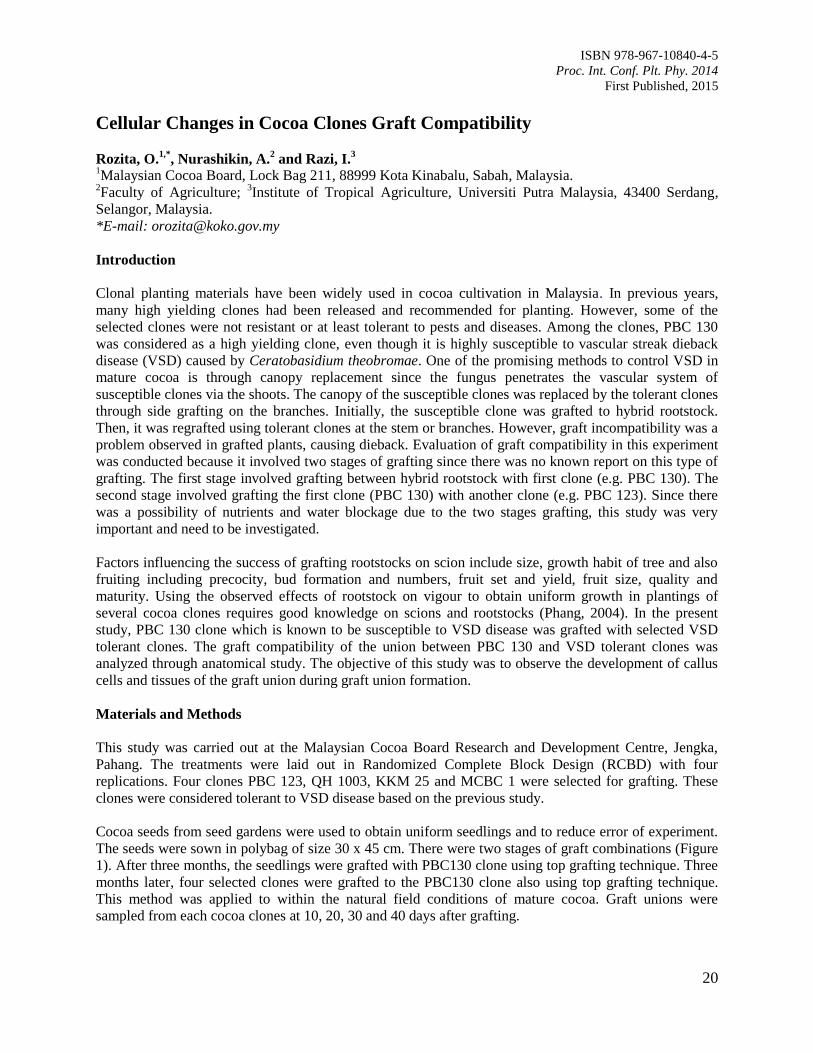
Figure 1. Cocoa rootstock (a) grafted with PBC 130 (b) and then regrafted with a selected clone (c).
Fixation: The graft union portions (approximately 3 cm in length) of the stock/scion combinations at 10,
20, 30 and 40 days after grafting were fixed in formalin acetic acid (FAA) for at least three days to stop
physiological processes of the samples before being subjected to further anatomical study. The samples
were soaked in 4% ethylenediamine for seven days to soften the woody graft and were subsequently
soaked in distilled water at two hours interval in two to three changes to remove ethylenediamine
(Carlquist, 1982).
Dehydration and infiltration processes: The samples were then dehydrated and infiltrated following the
tertiary-butanol alcohol (TBA) series as described by Johansen (1940) with minor modifications.
Embedding: Paraplast was liquefied at temperature above 59 0C. Liquid paraplast was then poured into a
paper mold at half of the mold. The specimens were arranged with the parts to be seen at the bottom
surface. When the samples were semi hardened, the specimen was covered again with liquid paraplast for
full coverage.
Sectioning: Transverse sections of a graft union were cut at 20 µm with a rotary microtome. In order to
mount the specimen, a drop of albumin was applied on the slide and was evenly spread. Ribbons
containing tissue sections were cut into suitable lengths and placed on the slides that were then placed on
a hot plate maintained at 35 0C.
Staining: The specimens were stained with fuchsin acid and toluidine blue. Slides were prepared and
mounted with cover slips and applied with Canada Balsam mounting medium. The stained samples were
viewed using CANON digital imaging camera system.
Results and Discussion
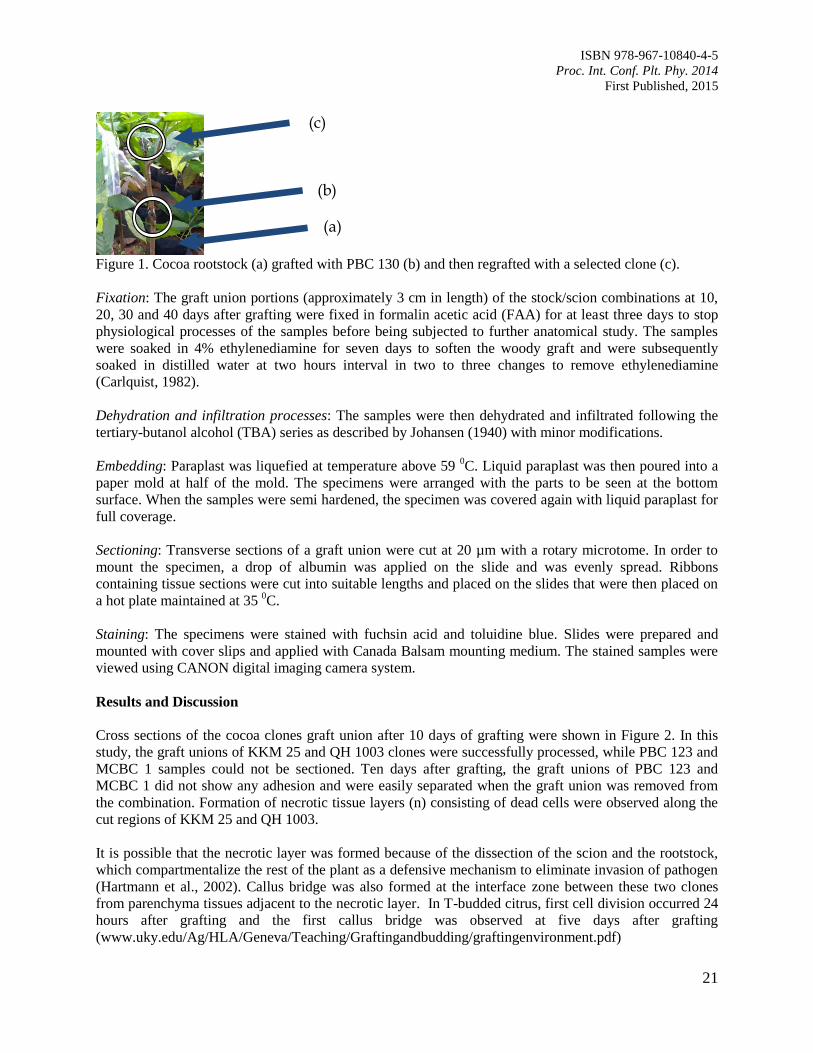
Cross sections of the cocoa clones graft union after 10 days of grafting were shown in Figure 2. In this
study, the graft unions of KKM 25 and QH 1003 clones were successfully processed, while PBC 123 and
MCBC 1 samples could not be sectioned. Ten days after grafting, the graft unions of PBC 123 and
MCBC 1 did not show any adhesion and were easily separated when the graft union was removed from
the combination. Formation of necrotic tissue layers (n) consisting of dead cells were observed along the
cut regions of KKM 25 and QH 1003.
It is possible that the necrotic layer was formed because of the dissection of the scion and the rootstock,
which compartmentalize the rest of the plant as a defensive mechanism to eliminate invasion of pathogen
(Hartmann et al., 2002). Callus bridge was also formed at the interface zone between these two clones
from parenchyma tissues adjacent to the necrotic layer. In T-budded citrus, first cell division occurred 24
hours after grafting and the first callus bridge was observed at five days after grafting
(www.uky.edu/Ag/HLA/Geneva/Teaching/Graftingandbudding/graftingenvironment.pdf)
(b)
(a)
(c)
Page 28
ISBN 978-967-10840-4-5
Proc. Int. Conf. Plt. Phy. 2014
First Published, 2015
22
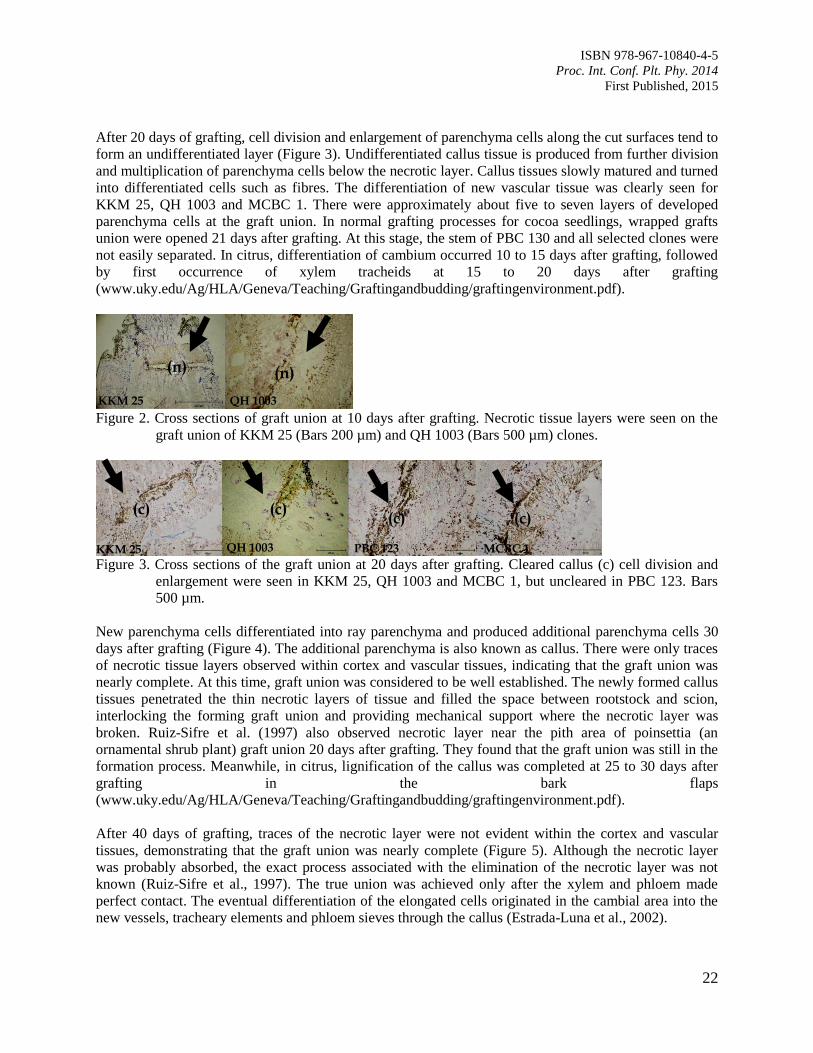
After 20 days of grafting, cell division and enlargement of parenchyma cells along the cut surfaces tend to
form an undifferentiated layer (Figure 3). Undifferentiated callus tissue is produced from further division
and multiplication of parenchyma cells below the necrotic layer. Callus tissues slowly matured and turned
into differentiated cells such as fibres. The differentiation of new vascular tissue was clearly seen for
KKM 25, QH 1003 and MCBC 1. There were approximately about five to seven layers of developed
parenchyma cells at the graft union. In normal grafting processes for cocoa seedlings, wrapped grafts
union were opened 21 days after grafting. At this stage, the stem of PBC 130 and all selected clones were
not easily separated. In citrus, differentiation of cambium occurred 10 to 15 days after grafting, followed
by first occurrence of xylem tracheids at 15 to 20 days after grafting
(www.uky.edu/Ag/HLA/Geneva/Teaching/Graftingandbudding/graftingenvironment.pdf).
Figure 2. Cross sections of graft union at 10 days after grafting. Necrotic tissue layers were seen on the
graft union of KKM 25 (Bars 200 µm) and QH 1003 (Bars 500 µm) clones.
Figure 3. Cross sections of the graft union at 20 days after grafting. Cleared callus (c) cell division and
enlargement were seen in KKM 25, QH 1003 and MCBC 1, but uncleared in PBC 123. Bars
500 µm.
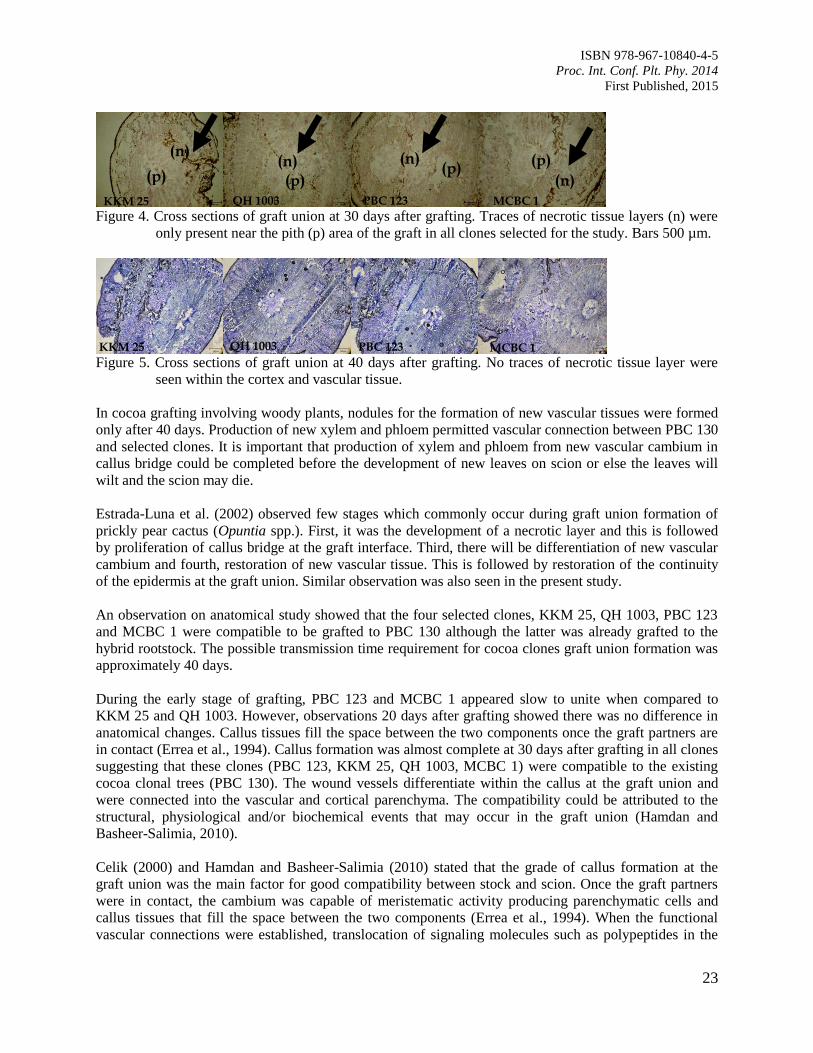
New parenchyma cells differentiated into ray parenchyma and produced additional parenchyma cells 30
days after grafting (Figure 4). The additional parenchyma is also known as callus. There were only traces
of necrotic tissue layers observed within cortex and vascular tissues, indicating that the graft union was
nearly complete. At this time, graft union was considered to be well established. The newly formed callus
tissues penetrated the thin necrotic layers of tissue and filled the space between rootstock and scion,
interlocking the forming graft union and providing mechanical support where the necrotic layer was
broken. Ruiz-Sifre et al. (1997) also observed necrotic layer near the pith area of poinsettia (an
ornamental shrub plant) graft union 20 days after grafting. They found that the graft union was still in the
formation process. Meanwhile, in citrus, lignification of the callus was completed at 25 to 30 days after
grafting in the bark flaps
(www.uky.edu/Ag/HLA/Geneva/Teaching/Graftingandbudding/graftingenvironment.pdf).
After 40 days of grafting, traces of the necrotic layer were not evident within the cortex and vascular
tissues, demonstrating that the graft union was nearly complete (Figure 5). Although the necrotic layer
was probably absorbed, the exact process associated with the elimination of the necrotic layer was not
known (Ruiz-Sifre et al., 1997). The true union was achieved only after the xylem and phloem made
perfect contact. The eventual differentiation of the elongated cells originated in the cambial area into the
new vessels, tracheary elements and phloem sieves through the callus (Estrada-Luna et al., 2002).
(c)
KKM 25 QH 1003 PBC 123 MCBC 1
(c) (c) (c)
(n) (n)
KKM 25 QH 1003
Page 29
ISBN 978-967-10840-4-5
Proc. Int. Conf. Plt. Phy. 2014
First Published, 2015
23
Figure 4. Cross sections of graft union at 30 days after grafting. Traces of necrotic tissue layers (n) were
only present near the pith (p) area of the graft in all clones selected for the study. Bars 500 µm.
Figure 5. Cross sections of graft union at 40 days after grafting. No traces of necrotic tissue layer were
seen within the cortex and vascular tissue.
In cocoa grafting involving woody plants, nodules for the formation of new vascular tissues were formed
only after 40 days. Production of new xylem and phloem permitted vascular connection between PBC 130
and selected clones. It is important that production of xylem and phloem from new vascular cambium in
callus bridge could be completed before the development of new leaves on scion or else the leaves will
wilt and the scion may die.
Estrada-Luna et al. (2002) observed few stages which commonly occur during graft union formation of
prickly pear cactus (Opuntia spp.). First, it was the development of a necrotic layer and this is followed
by proliferation of callus bridge at the graft interface. Third, there will be differentiation of new vascular
cambium and fourth, restoration of new vascular tissue. This is followed by restoration of the continuity
of the epidermis at the graft union. Similar observation was also seen in the present study.
An observation on anatomical study showed that the four selected clones, KKM 25, QH 1003, PBC 123
and MCBC 1 were compatible to be grafted to PBC 130 although the latter was already grafted to the
hybrid rootstock. The possible transmission time requirement for cocoa clones graft union formation was
approximately 40 days.
During the early stage of grafting, PBC 123 and MCBC 1 appeared slow to unite when compared to
KKM 25 and QH 1003. However, observations 20 days after grafting showed there was no difference in
anatomical changes. Callus tissues fill the space between the two components once the graft partners are
in contact (Errea et al., 1994). Callus formation was almost complete at 30 days after grafting in all clones
suggesting that these clones (PBC 123, KKM 25, QH 1003, MCBC 1) were compatible to the existing
cocoa clonal trees (PBC 130). The wound vessels differentiate within the callus at the graft union and
were connected into the vascular and cortical parenchyma. The compatibility could be attributed to the
structural, physiological and/or biochemical events that may occur in the graft union (Hamdan and
Basheer-Salimia, 2010).
Celik (2000) and Hamdan and Basheer-Salimia (2010) stated that the grade of callus formation at the
graft union was the main factor for good compatibility between stock and scion. Once the graft partners
were in contact, the cambium was capable of meristematic activity producing parenchymatic cells and
callus tissues that fill the space between the two components (Errea et al., 1994). When the functional
vascular connections were established, translocation of signaling molecules such as polypeptides in the
MCBC 1 PBC 123 QH 1003 KKM 25
(n) (n) (n)
(n) MCBC 1 PBC 123 KKM 25 QH 1003
(p) (p)
(p) (p)
Page 30
ISBN 978-967-10840-4-5
Proc. Int. Conf. Plt. Phy. 2014
First Published, 2015
24
phloem could be significant for cell recognition and offers good compatibility between graft partners
(Hartmann et al., 2002). When several functional phloem and xylem connections cross the graft, a graft
union was considered to be successful and complete. Plasmodesmata were important communication
pathways in plants. These were channels in the plant cell walls allowing passage of macromolecules and
solutes between the neighbouring cells. A recent study demonstrated that insufficient plasmodesmatal
coupling at an early stage of development might result in graft incompatibility (Pina et al., 2009).
Conclusions
KKM 25, PBC 123, QH 1003 and MCBC 1 were compatible with PBC 130 although the latter was
already grafted to the hybrid rootstock. Evidence supporting this was the establishment of the vascular
tissue continuity observed through histological examination within 40 days after grafting, and also the
excellent growth observed 50 days after grafting.
Acknowledgements
We would like to thank Dr. Lee Choon Hui, the Director General of Malaysian Cocoa Board, Mr. Haya
Ramba, Director of Cocoa Upstream Technology, all staff of Malaysian Cocoa Board Jengka, Pahang and
Nilai, Negeri Sembilan and all staff of Faculty of Agriculture and Institute of Tropical Agriculture,
Universiti Putra Malaysia. The project was funded by a MOSTI Science-Fund Grant (05-03-13-SF0044).
References
Carlquist, S. 1982. The use of ethylenediamine in softening hard plant structures for paraffin sectioning.
Stain Technology 57(5): 311-317.
Celik, H. 2000. The effects of different grafting methods applied by manual grafting units on grafting
success in grapevines. Turkish Journal of Agriculture and Forestry 24: 499-504.
Errea, P., Felipe, A. and Herrero, M. 1994. Graft establishment between compatible and incompatible
Prunus spp. Journal of Experimental Botany 45(272): 393-401.
Estrada-Luna, A.A., Lopez-Peralta, C. and Cardenas-Soriano, E. 2002. In vitro micrografting and the
histology of graft union formation of selected species of prickly pear cactus (Opuntia spp.)
Scientia Horticulturae 92: 317-327.
Hamdan, A. and Basheer-Salimia, R. 2010. Preliminary compatible between some table-grapevine scion
and phylloxera-resistant rootstock cultivars. Jordan Journal of Agricultural Sciences 6(1): 1-10.
Hartmann, H.T., Kester, D.E., Davies F.T. and Geneve, R.L. 2002. Plant propagation: principles and
practices, 7th ed. Prentice-Hall, Inc. Upper Saddle River, New Jersey, USA.
Johansen, D.A. 1940. Plant Microtechnique. McGraw Hill, NY. pp: 523
Phang, T.Y. 2004. Rootstock effects on cocoa in Sabah, Malaysia. Experimental Agriculture 40: 445-452.
Pina, A., Errea, P., Schulz, A. and Martens, H.L. 2009. Cell-to-cell transport plasmodesmata in tree callus
cultures. Tree Physiology 29: 809-818.
Ruiz-Sifre, G., Dole, J.M., Kahn, B.A., Richardson, P.E. and Ledford, J. 1997. Correlation of poinsettia
graft union development with transmission of the free-branching characteristic. Scientia
Horticulturae 69: 135-143.
Page 31
ISBN 978-967-10840-4-5
Proc. Int. Conf. Plt. Phy. 2014
First Published, 2015
25
Innovation on Pepper (Piper nigrum L.) Farming to Ensure High Production
of Planting Materials
Chen, Y.S. and Kho, P.E.
Department of Research and Development, Malaysian Pepper Board, Lot 1115 Jalan Utama, Pending
Industrial Area, 93916 Kuching, Sarawak, Malaysia.
E-mail: [email protected] ; [email protected]
Introduction
Black pepper or scientifically known as Piper nigrum L. is a perennial woody vine from the family
Piperaceae. The plant is primarily cultivated for its fruit which widely used as spice in culinary
preparation, food flavouring, seasoning, perfumery and as a condiment throughout the world (Philip et al.,
1992; Bhat et al., 1995; Joseph et al., 1996). It has gained a global recognition as the “King of spice” due
to its monetary value and trade in the international spice market (Srinivasan, 2007). Black pepper is an
important cash crop with potential for export in Malaysia particularly in Sarawak whereby more than 98%
of pepper was produced from the state of Sarawak. According to the International Pepper Community
(IPC) 2011, Malaysia has the distinction of being the world’s fifth largest pepper producer country with
an output of 25,600,000 kg and total export of 14,201,000 kg which worth RM285.27 million in year
2011. In addition to this, domestic consumption of pepper shot up by 11% to 7,828,000 kg compared to
7,069,000 kg in year 2010. Pepper planting was a lucrative endeavor and the demand on food and non-
food pepper based products is expected to increase in future. Consequently, a constant supply of planting
materials is essential for sustaining and boosting up the pepper productivity of the nation.
A pepper plant has two types of branches. One is the straight, upward growing, orthotropic, monopodial
with adventitious roots at each node clinging on the support. This type of branch is referred to as the
‘orthotropic branch’. It is also called the “orthotropic stem’, ‘orthotropic shoot’, ‘terminal shoot’ or
simply ‘the terminal’. Whilst, the other is the lateral growing, plagiotropic, sympodial branch which bear
flower and fruit spikes at the node. This type of branch is known as the ‘plagiotropic branch’, ‘lateral
branch’ or ‘the lateral’.
Pepper cuttings used for planting is sourced from the orthotropic branch (terminal shoot) of a healthy and
vigorously growing young vine with varying number of nodes. Traditionally in Sarawak, a five- to seven-
node cutting is used for planting. Currently, the five-node cutting is recommended. First round of pruning
is normally carried out at six months after planting and subsequent pruning at four-month intervals. Under
the traditional practice, a vine normally produces about seven to ten (7-10) five-node cuttings in its first
year after planting and another sixteen to twenty-two (16-22) five-node cuttings in its second year of
planting (Sim et al., 2011).
The Malaysian Government targets at increasing the pepper cultivated area from the current 14,174 to
15,150 ha by year 2015 and to 15,800 ha by year 2020. This means there will be an increase of 976 ha of
pepper cultivated area in the next five years. Based on a planting density of 2,000 vines per hectare, there
will be a need for 390,400 cuttings per year in order to achieve this target. However, the traditional
planting method is relatively slow and is unable to sustain the constant supply of planting material.
Besides low productivity, the occurrence of pests and diseases has restricted pepper cutting production
through conventional method. Therefore, this innovative farming method is undoubtedly a novel yet
creative way to produce adequate planting material for large-scale pepper cultivation in years to come.
Besides, the production of pepper cuttings through this new farming approach would create potential
Page 32
ISBN 978-967-10840-4-5
Proc. Int. Conf. Plt. Phy. 2014
First Published, 2015
26
extra income for estimated 67,247 of pepper smallholders in Malaysia, who traditionally cultivate pepper
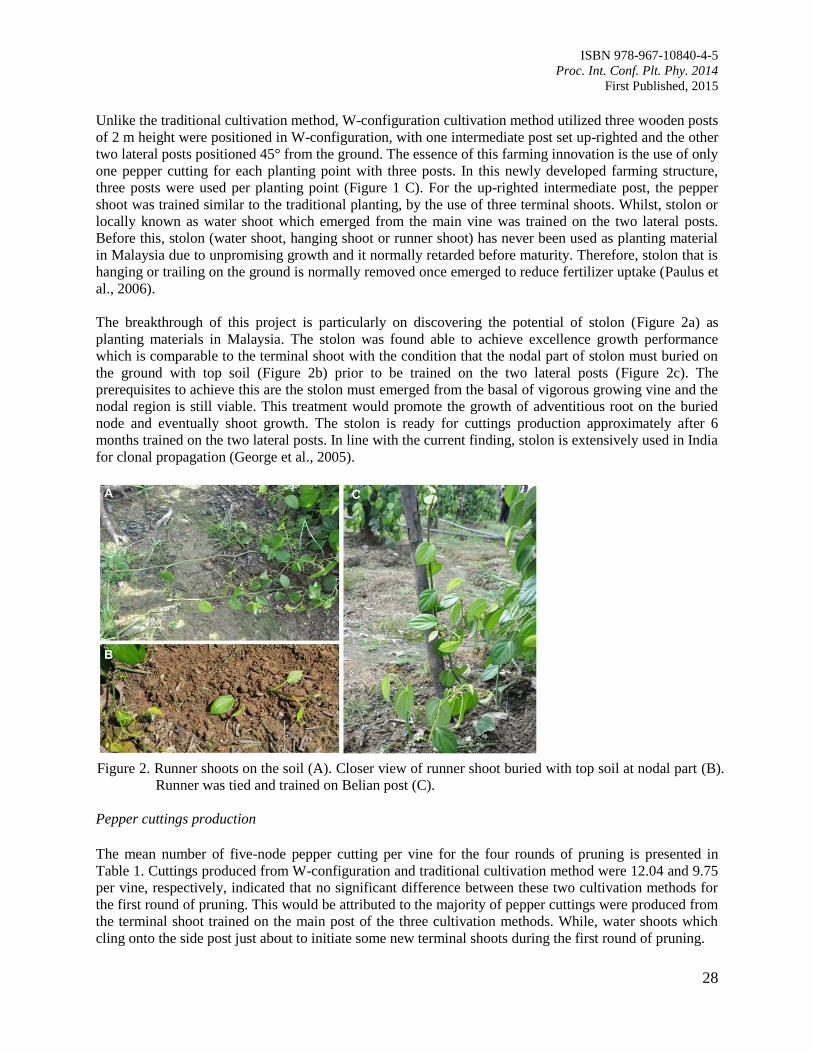
only for the peppercorn production.
Materials and Methods
Planting materials
The planting material used in this project is five-node cuttings which obtained from the terminal shoot of
young pepper vine with the age of about 1-2 years old. To achieve high survival rate, pepper cuttings
were rooted for up to two months at sand bin before transplanting to the field. In order to ensure the
homogeneity of the experiment plot, only single pepper variety was used i.e. cv. Semongok Aman.
Establishment of experimental plot
An average of 0.1296 ha planting area which is located at Rapak, Sri Aman, Sarawak, Malaysia has been
identified as the experimental plot for this invention. Approximately 315 vines of pepper were planted for
the assessment on pepper cuttings production. The single pepper vine was trained in a way that three
wooden posts of 2 m height were positioned in W-configuration, with one intermediate post set up-
righted and the other two lateral posts positioned 45° from the ground. The yield of cuttings production
for W-configuration cultivation method was obtained from the cuttings sourced from all of the three posts
per vine while the control only taking into account the intermediate up-righted post which comparable to
the traditional planting. The production of pepper cutting was statistically analyzed using independent
Student-t test at p=0.05 by statistical software, SPSS Statistic Version 16.0 (SPSS Inc., Chicago, IL).
ROI analysis The analysis takes into account for the pepper cuttings production per cycle (2 years) in 1 ha of planting
area, with a planting density of 2,000 vines per ha. The parameters of investment cost mainly are made up
of non-factor cost which consists of pepper posts (Eusideroxylon zwageri post), pepper cuttings,
fertilizers, dolomite, weedicide, pesticide and miscellaneous farm implements, whilst, labour cost is
considered as factor cost. The gross revenue is solely depending on the cuttings production. All of the
statistical data were sourced from Division of Production & Entrepreneurs Farmers Development,
Malaysian Pepper Board. The standard market price for fresh cutting or un-rooted cutting is currently RM
3.00 per cutting and the return on investment is calculated based on the formula below:
Results and Discussion
Farm structural innovation
For pepper vine support, Belian (Eusideroxylon zwageri) post is recommended by considering the
durability and selectivity of pepper adventitious root to cling onto the hardwood support. Thus, the
use of Belian wood as support in this new cultivation will be remained as practiced in traditional planting.
In W-configuration cultivation method, the suggested size of Belian post is preferably not less than 76.2
mm in diameter and not less than 127 mm in height. W-configuration cultivation method consists of three
wooden posts of 2 m height were positioned in W-configuration, with one intermediate post set up-
Return on Investment (ROI) = (Gain from Investment - Cost of Investment)
Cost of Investment
Page 33
ISBN 978-967-10840-4-5
Proc. Int. Conf. Plt. Phy. 2014
First Published, 2015
27
righted and the other two lateral posts positioned 45° from the ground as shown in Figure 1. The farm
structural design is similar to the traditional planting method whereas both of the distance between row
and between vines is recommended at least 2 m (Figures 1C and D).
Figure 1. Structural design of pepper vine on Belian post. Experimental plot (A). Post arrangement
for W-configuration cultivation method (B). Horizontal view of pepper vine in single row
(C). Arial view of two row of pepper vines (D).
Good agricultural practise (GAP)
Traditional cultivation practise in Malaysia is to train a five-node cutting onto a post with the three lower
nodes are buried in the soil at an angle of 20º to 35° while the fourth node is level with the ground
surface. The fifth node is above ground and placed close to the support. All cuttings are advisable to
orientate in one direction to ease the fertilizer application later on.
The newly developed terminal shoots are trained on the support by tying at a point just below
each node to the support with fiber of plant origin such as raffia or strings removed from a jute
sack (gunny sack). To ensure good development of adventitious roots, every node is to be tied
properly to the support (Sim et al., 2011). The first harvest of cuttings is normally carried out by
the time vine has reached six months old. As a result of cutting harvest, the terminal shoot is
pruned back to about 0.5 m from the mound. However, three new terminal shoots which
originating from the axillary buds are allowed to develop (Paulus et al., 2006; Sim et al., 2011).
Page 34
ISBN 978-967-10840-4-5
Proc. Int. Conf. Plt. Phy. 2014
First Published, 2015
28
Unlike the traditional cultivation method, W-configuration cultivation method utilized three wooden posts
of 2 m height were positioned in W-configuration, with one intermediate post set up-righted and the other
two lateral posts positioned 45° from the ground. The essence of this farming innovation is the use of only
one pepper cutting for each planting point with three posts. In this newly developed farming structure,
three posts were used per planting point (Figure 1 C). For the up-righted intermediate post, the pepper
shoot was trained similar to the traditional planting, by the use of three terminal shoots. Whilst, stolon or
locally known as water shoot which emerged from the main vine was trained on the two lateral posts.
Before this, stolon (water shoot, hanging shoot or runner shoot) has never been used as planting material
in Malaysia due to unpromising growth and it normally retarded before maturity. Therefore, stolon that is
hanging or trailing on the ground is normally removed once emerged to reduce fertilizer uptake (Paulus et
al., 2006).
The breakthrough of this project is particularly on discovering the potential of stolon (Figure 2a) as
planting materials in Malaysia. The stolon was found able to achieve excellence growth performance
which is comparable to the terminal shoot with the condition that the nodal part of stolon must buried on
the ground with top soil (Figure 2b) prior to be trained on the two lateral posts (Figure 2c). The
prerequisites to achieve this are the stolon must emerged from the basal of vigorous growing vine and the
nodal region is still viable. This treatment would promote the growth of adventitious root on the buried
node and eventually shoot growth. The stolon is ready for cuttings production approximately after 6
months trained on the two lateral posts. In line with the current finding, stolon is extensively used in India
for clonal propagation (George et al., 2005).
Figure 2. Runner shoots on the soil (A). Closer view of runner shoot buried with top soil at nodal part (B).
Runner was tied and trained on Belian post (C).
Pepper cuttings production
The mean number of five-node pepper cutting per vine for the four rounds of pruning is presented in
Table 1. Cuttings produced from W-configuration and traditional cultivation method were 12.04 and 9.75
per vine, respectively, indicated that no significant difference between these two cultivation methods for
the first round of pruning. This would be attributed to the majority of pepper cuttings were produced from
the terminal shoot trained on the main post of the three cultivation methods. While, water shoots which
cling onto the side post just about to initiate some new terminal shoots during the first round of pruning.
Page 35
ISBN 978-967-10840-4-5
Proc. Int. Conf. Plt. Phy. 2014
First Published, 2015
29
The number of five-node pepper cutting per vine varied significantly among the two cultivation methods
for the second, third and fourth round of pruning. W-configuration recorded the highest mean number of
cuttings produced with 11.19 cutting per vine or equivalent to 59.85% increment as compared to 7.00
cutting per vine produced from traditional cultivation method. This elucidated that the W-configuration
planting methods can achieve more promising cutting production rate as compared to traditional planting
method.
Table 1. Production of five-node cutting from pepper planted with different cultivation methods.
Cultivation Method Number of vine Number of five-node cutting/vine
P1 P2 P3 P4 Mean
W-configuration 24 12.04a 12.17
a 12.38
a 11.29 11.19
a
Single post (Control) 24 9.75a 6.83
c 6.71
b 4.71
b 7.00
b
*Means followed by the same superscript letter within a column are not significantly different at p=0.05 by DMRT
*Note: P1 = 1st round of pruning; P2 = 2
nd round of pruning; P3 = 3
rd round of pruning; P4 = 4
th round of pruning
ROI analysis
Implementation of W-configuration cultivation method for the production of pepper cutting at stock
nursery or plantation is a novelty in of all of the pepper producing countries. A ROI analysis has been
carried out to assess the viability of investment into this type of farming approach. The cost estimation for
establishment and maintenance of pepper farm mainly for the production of pepper cutting per cycle (1 ha
= 2000 vines) was calculated base on the cost of production sourced from the Annual report of Division
of Production & Entrepreneurs Farmers Development, Malaysian Pepper Board.
1. ROI on cutting production via W-configuration cultivation method per cycle (2 years) in 1 hectare:
*Gain from Investment = mean number of cutting for each round of pruning X 2,000 vines X price per
cutting = [(12.04 x 2,000) + (12.17 x 2,000) + (12.38 x 2,000) + (11.29 x 2,000)] x RM3 = RM287,280.00
*Cost of Investment per cycle (2 years) = RM213,081 (Malaysian Pepper Board 2012).
2. ROI on cutting production via W-configuration cultivation method per cycle (2 years) in 1 ha for the
subsequence cycle with excluded cost of Belian support:
*Cost of Investment per cycle (2 years) after excluded cost of Belian support at the subsequence
planting cycle = RM63,081.00 (Malaysian Pepper Board, 2012).
Return on Investment (ROI) = (Gain from Investment - Cost of Investment)
Cost of Investment
= RM (287,280 - 213,081) = 0.35
RM 213,081
Return on Investment (ROI) = (Gain from Investment - Cost of Investment)
Cost of Investment
= RM (287,280-63,081) = 3.55
RM 63,081
Page 36
ISBN 978-967-10840-4-5
Proc. Int. Conf. Plt. Phy. 2014
First Published, 2015
30
Based on ROI calculation as in (1), the pepper cutting production plantation via implementation of W-
configuration cultivation method can achieved viable index of 0.35 which equivalent to 35% of return
from over all of the investment cost. Via the implementation of W-configuration cultivation method, a
pepper entrepreneur which invested in a pepper cutting stock nursery with estimated cost of RM213, 081,
can generated approximately RM74,578.35 of income in the second year of planting.
In addition, the return would be much more lucrative for the subsequence cycles as the cost of Belian
support that has attributed to the greatest amount of investment cost for pepper plantation is reusable.
That means the establishment cost for the subsequence planting cycle can be reduced up to 70%. The
profit can increased dramatically up to 355% of the investment cost for the subsequence cycles of
planting which excluded the cost of Belian support as shown in calculation (2). The ROI analysis revealed
that the newly developed farming method for the production and commercialization and of pepper
cuttings is very viable for investment.
3. ROI on cutting production via traditional cultivation method per cycle (2 years) in 1 ha:
*Gain from Investment= mean number of cutting for each round of pruning X 2,000 vines X price per
cutting = [(9.75 x 2,000) + (6.83 x 2,000) + (6.71 x 2,000) + (4.71 x 2,000)] x RM3 = RM168,000.00
*Cost of Investment per cycle (2 years) = RM 113,081.00 (Malaysian Pepper Board 2012).
4. ROI on cutting production via traditional cultivation method per cycle (2 years) in 1 ha for the
subsequence cycle with excluded cost of Belian support:
*Cost of Investment per cycle (2 years) after excluded cost of Belian support at the subsequence planting
cycle = RM63,081.00 (Malaysian Pepper Board, 2012).
Pepper cuttings production via W-configuration method marked 59.85% greater than the traditional
planting methods for the first cycle (2 years) of planting. Inversely, the ROI index on cutting production
via traditional cultivation method for the first cycle of planting is 0.49 as compared to 0.35 for W-
configuration cultivation method. This could be attributed to the additional cost of two Belian posts for
each planting point had increased the cost of investment. The newly developed planting method, even
though are less viable as compared to traditional planting method in the first cycle of planting, are able to
upsurge the profit as much as 355% when omitted the cost of reusable Belian post during the subsequent
Return on Investment (ROI)
= (Gain from Investment - Cost of Investment)
Cost of Investment
= RM (168,000-113,081)
=
0.49
RM 113,081
Return on Investment (ROI)
= (Gain from Investment - Cost of Investment)
Cost of Investment
= RM (168,000-63,081)
=
1.66
RM 63,081
Page 37
ISBN 978-967-10840-4-5
Proc. Int. Conf. Plt. Phy. 2014
First Published, 2015
31
planting cycle. Meanwhile, the traditional method was only capable of achieving ROI index of 1.66 for
the subsequence planting cycle. Thus, the W-configuration planting method is more recommended for
investment in long run.
Conclusions
The invention of W-configuration cultivation method is anticipating in overcoming the planting materials
shortage problem in Malaysia, at the same time to evaluate the viability of establishing pepper stock
nursery or plantation which mainly for cuttings production purpose. The ROI analysis proven the
feasibility of this newly developed cultivation method to create potential new income for pepper
smallholders in Malaysia.
W-configuration cultivation method is aiming at mass production of planting materials and targeting at
the possibility of increasing the yield per hectare in long run. However, the trial is on-going and a
conclusive result on yield performance will only revealed at year 2015. This is a breakthrough in pepper
farming innovation, particularly in ensuring high production of pepper cutting and at the same time to
maximize the land used. Besides, the essence of this method is the utilization of only one five-node
pepper cutting for the three posts or per vine. This new farming concept will be disseminating to pepper
farmer in Malaysia in years to come as an alternative way to generate income from the selling of pepper
cuttings other than peppercorn production.
Acknowledgements
The authors would like to thank Mr. Liew Tet Chin for granting permission to conduct the experimental
plot in the pepper farm under his tenure. Appreciation also goes to Mr. Wan Ambi, Mr. Melvin Alexander
Anak Lanyeh and Mr. Sang Jam, research assistants of Malaysian Pepper Board for their technical
assistance in the field.
References
Bhat, S.R., Chandel, K.P.S. and Malik, S.K. 1995. Plant regeneration from various explants of cultivated
Piper species. Plant Cell Report 14: 98-402.
George, C.K., Abdullah, A. and Chapman, K. 2005. Pepper production guide for Asia and the Pacific.
Joint effort of the International Pepper Community (IPC) and Food and Agricultural Organization
of United Nations (FAO). IPC. Bangkok (Thailand).
Joseph, B., Joseph, D. and Philip, V.J. 1996. Plant regeneration from somatic embryos in black pepper.
Plant Cell, Tissue and Organ Culture 47: 87-90.
Malaysian Pepper Board. 2012. Annual report of Division of Production & Entrepreneurs Farmers
Development, Malaysian Pepper Board.
Paulus A.D., Megir G. and Eng, L. 2006. Pepper Technology Package. Booklet produced by Department
of Agriculture, Sarawak, 31 pp.
Philip, V.J., Dominic, J., Triggs, G.S. and Dickinson, N.M. 1992. Micropropagation of black pepper
(Piper nigrum L.) through shoot tip cultures. Plant Cell Report 12: 41-44.
Sim, S.L., Paulus, A.D. and Eng, L. 2011. Manual for production of quality planting material of pepper.
Malaysian Pepper Board.
Srinivasan, K. 2007. Black pepper and its pungent principle-piperine: A review of diverse physiological
effects. Critical Reviews in Food Science and Nutrition 47: 735-748.
Page 38
ISBN 978-967-10840-4-5
Proc. Int. Conf. Plt. Phy. 2014
First Published, 2015
32
Flowering Improvement of a Landscape Tree, Xanthostemon chrysanthus by
Using Paclobutrazol and Potassium Nitrate
Ahmad Nazarudin, M.R.1,*
, Tsan, F.Y.2 and Normaniza, O.
3
1Forest Research Institute Malaysia, 52109 Kepong, Selangor, Malaysia.
2Faculty of Plantation and Agrotechnology, Universiti Teknologi MARA, 40450 Shah Alam, Selangor,
Malaysia. 3Institute of Biological Sciences, Faculty of Science, Universiti Malaya, 50603 Kuala Lumpur, Malaysia.
*E-mail: [email protected]
Introduction
Flowering is influenced by endogenous and environmental factors which trigger the change of shoot
meristem from generating leaves to the development of reproductive organs. The ability to flower is
regarded as an establish state; once maturity is attained, plants will continue to flower provided that the
normal-inducing circumstances are imposed (Hackett, 1985). Flower development is manipulated by the
climatic conditions during bud differentiation. Dry weather induces flower bud formation and significant
precipitation promotes development of vegetative buds (Heller, 1996). Since the climate of the tropical
region is uniform throughout the year, the landscapes always look green. Thus, alternative techniques to
turn the monotonous landscape into captivating sceneries are crucial. These techniques should be
convenient and practical for landscape tree management. Previous study showed that the application of
paclobutrazol (PBZ) and potassium nitrate (KNO3) promoted flowering (Ahmad Nazarudin, 2012;
Eshghi et al., 2012).
Thus, this study aimed to determine the effects of PBZ and KNO3 on the flowering of Xanthostemon
chrysanthus (F. Muell.) Benth planted in an urban park in Kuala Lumpur. This species is also known as
golden penda (Myrtaceae) and is usually chosen for urban landscapes due to its distinctive yellow
inflorescence. It is native to tropical northen Australia, New Guinea, Indonesia and the Philippines
(Sosef et al., 1998).
Materials and Methods
A study plot consisted of 81 existing trees was established in Metropolitan Recreational Batu Park, Kuala
Lumpur. These trees aged about six years at the commencement of the study with the average height and
average stem diameter at breast height of 6 m and 10 cm, respectively. The experiment was based on a
Completely Randomized Design with nine treatments, T1(0 gl-1
PBZ + 0 g KNO3), T2(0 gl-1
PBZ + 100 g
KNO3), T3(0 gl-1
PBZ + 200 g KNO3), T4(0.125 gl
-1 PBZ
+ 0 g KNO3), T5(0.125 gl
-1 PBZ + 100 g KNO3),
T6(0.125 gl-1
PBZ + 200 g KNO3), T7(0.25 gl-1
PBZ + 0 g KNO3), T8(0.25 gl-1
PBZ + 100 g KNO3) and
T9(0.25 gl-1
PBZ + 200 g KNO3) and nine replicates. PBZ was applied as soil drench at an application
volume of 1 l per tree, while the control plants were applied with 1 l of plain water. Application of PBZ
was carried out one time at the start of the study. Meanwhile, KNO3 (13.7:0:38.4) was applied at three
months intervals.
Weekly, flower abundance (%) was scored. Inflorescence size (mm) was measured at full bloom by using
a digital caliper. Data obtained were subjected to ANOVA and the treatment means were then compared
using Duncan’s Multiple Range Test.
Page 39
ISBN 978-967-10840-4-5
Proc. Int. Conf. Plt. Phy. 2014
First Published, 2015
33
Results and Discussion
Three distinct flowering occurrences were observed, i.e. May 2012, September 2012 and January 2013,
irrespective of the treatment (Figure 1). The peak flowering period occurred in January 2013, where trees
treated with T8 had flower abundance of about 65.56%. At this stage, the least flower abundance of about
25.56% was measured in T1. Combined effects of PBZ and KNO3 have higher abundance of flowers as
compared to single application of PBZ or KNO3. Previous reports stated that PBZ increased the number
of flowers in Lupinus varius (Karaguzel et al., 2004) and Hibiscus rosa-sinensis (Ahmad Nazarudin,
2012).
T4 and T5 gave 10.7 cm and 20.3 cm of inflorescence size at the first measurement, respectively (Table
1). A similar result was also noted with higher dosage of PBZ when T7 and T8 had 10.44 cm and 15.98
cm of inflorescence size. On the other hand, both rates of KNO3 resulted in bigger inflorescence as
compared to the control in all measurements. This study proved that, T5-treated tree consistently
produced distinctive inflorescence size throughout the study period. PBZ independently increased the
number of buds due to the amount of cytokinin formed (Yayat et al., 2013). Cytokinin from the roots was
transported to the upper part of plant which further stimulated growth in the axillary buds (Gardner et al.,
1991 in Yayat et al., 2013). These lateral buds will transform either as leaf or inflorescence depending on
the endogenous and environmental cues. On the other hand, combination of PBZ and KNO3 significantly
increased the inflorescence size. As a consequence, it gave a higher abundance of flowers.
Figure 1. Flower abundance of X. chrysanthus after treated with paclobutrazol and potassium nitrate.
Table 1. Inflorescence size of X. chrysanthus after treated with paclobutrazol and potassium nitrate.
Trt
Inflorescence size (cm)
1st
Measurement
2nd
Measurement
3rd
Measurement
4th
Measurement
5th
Measurement
6th
Measurement
T1 10.00 e 11.16 f 10.50 f 10.40 e 10.00 f 9.70 f
T2 13.94 d 12.34 e 12.30 e 13.10 d 12.96 e 13.20 e
T3 13.96 d 13.86 d 14.16 d 13.44 d 14.10 d 13.82 e
T4 10.70 e 10.66 f 10.62 f 9.94 e 9.54 fg 9.78 f
T5 20.30 a 17.44 a 20.68 a 18.96 a 20.34 a 19.70 a
T6 17.42 b 16.16 b 17.80 b 18.54 ab 19.50 b 18.80 b
T7 10.44 e 9.98 g 9.94 f 8.76 f 9.00 g 9.02 f
T8 15.98 c 14.64 c 16.80 c 17.92 b 16.46 c 16.98 c
T9 14.02 d 14.34 cd 14.12 d 15.68 c 16.28 c 14.68 d
Means followed by the same letter(s) within column do not differ (p<0.05) by DMRT; Trt=treatment
Page 40
ISBN 978-967-10840-4-5
Proc. Int. Conf. Plt. Phy. 2014
First Published, 2015
34
Conclusion
Combined effects of PBZ and KNO3 (T5) increased the flower abundance and inflorescence size. This
practice has the potential as a tool to improve the flowering of this species under local climatic conditions.
Acknowledgements
Thanks are due to the Kuala Lumpur City Hall for site permission. This work was funded by the Ministry
of Agriculture and Agro-based Industry Malaysia (05-03-10-SF1030).
References
Ahmad Nazarudin, M.R. 2012. Effects of paclobutrazol, uniconazole and flurprimidol on growth and
flowering responses in potted Hibiscus rosa-sinensis L. Journal of Tropical Plant Physiology 4:
28-39.
Eshghi, S., Safizadeh, M.R., Jamali, B. and Sarseifi, M. 2012. Influence of foliar application of volk oil,
dormex, gibberellic acid and potassium nitrate on vegetative growth and reproductive
characteristics of strawberry cv. ‘Merak’. Journal of Biological and Environmental Science 6(16):
35-38.
Hackett, W.P. 1985. Juvenility, maturation and rejuvenation in woody plant. Horticultural Reviews 7:
190-155.
Heller, J. 1996. Physic nut. Jatropha curcas L. Promoting the conservation and use of underutilized and
neglected crops 1. Institute of Plant Genetics and Crop Plant Research, Gatersleben/ International
Plant Genetic Resources Institute (IPGRI), Rome.
Karaguzel, O, Baktir, I., Cakmakci, S. and Ortacesme, V. 2004. Growth and flowering responses of
Lupinus varius L. to paclobutrazol. HortScience 39(7): 1659-1663.
Sosef, M.S.M., Hong, L.T. and Prawirohatmodjo, S. 1998. Plant Resources of South-East Asia No. 5(3).
Timber trees: Lesser-known timbers. Back-huys Publishers, Leiden. 859 pp.
Yayat, R.S., Ramadhani, R. and Jajang, S.H. 2013. Paclobutrazol application and shading levels effect to
the growth and quality of Begonia (Begonia rex-cultorum) cultivar Marmaduke. Asian Journal of
Agriculture and Rural Development 3(8): 566-575.
Page 41
ISBN 978-967-10840-4-5
Proc. Int. Conf. Plt. Phy. 2014
First Published, 2015
35
Cadmium Effect on Seed Germination and Seedling Growth of Amaranthus
gangeticus, Cucurbita maxima and Brassica alboglaba
Tsan, F.Y.*, Hasimah, M., Engku Abdul Fattah, E.A. and Nurul Haslidawani, M.H. Faculty of Plantation and Agrotechnology, Universiti Teknologi MARA, 40450 Shah Alam, Selangor,
Malaysia.
*E-mail: [email protected]
Introduction
Heavy metals have been broadly recognized as being very toxic to plants (Li et al., 2005). Plants may be
directly affected with heavy metals by air pollutants, and indirectly through contamination of soil and
water (Farooqi et al., 2009). As plants are part of the food chain, heavy metal contaminated plants may
pose a risk to humans and animals through food contamination. Cadmium is a highly toxic pollutant that
affects many metabolic processes of plants. Reduction in the length of roots and shoots in the treatment of
cadmium can be caused by depletion of mitotic meristematic zones (Muhammad et al., 2008).
Poultry manure has been used extensively in organic vegetable farming. However, it is an important
source of toxic heavy metal contamination introduced to soil as the media for food production. Cadmium
is one of the highly toxic heavy metals that are easily found with application of poultry manure on
farmlands (Shafiq et al., 2008). This heavy metal is not only affecting seed germination and seedling
growth but is also highly dangerous for human health (Das et al., 1997; Munzuroglu and Zengin, 2006;
Bavi et al., 2011; Liu et al., 2011; Rehman et al., 2011; Janicka-Russak et al., 2012). In the current paper,
several studies were carried out concurrently to determine the seed germination and subsequent early
seedling growth of some common vegetables of different families, i.e. Amaranthus gangeticus, Cucurbita
maxima and Brassica alboglaba, as affected by cadmium chloride (CdCl2) at varying concentrations.
Materials and Methods
Test material
Seeds of A. gangeticus, C. maxima and B. alboglaba purchased from a local seed supplier were
germinated in three concurrent studies as mentioned.
Location of study
All experimentations were carried out in Laboratory of Plantation and Agrotechnology, Universiti
Teknologi MARA, Selangor, Malaysia. The average temperature and relative humidity of the air-
conditioned laboratory was 25±2 C and 55±5%, respectively.
Cadmium chloride solution preparation
CdCl2 solutions of 60, 40 and 20 mg/l were prepared by serial dilution of the stock solution of 80 mg/l
CdCl2. Control of 0 mg/l CdCl2 was distilled water.
Seed germination and initial seedling growth
Seeds were germinated in a bright place near the window in the laboratory. Seed germination
experimentations were done in enclosed transparent plastic boxes on paper towel moistened with 10 ml
Page 42
ISBN 978-967-10840-4-5
Proc. Int. Conf. Plt. Phy. 2014
First Published, 2015
36
CdCl2 solution of 0, 20, 40, 60 and 80 mg/l, respectively. CdCl2 solution was dispensed on the paper
towel using a syringe.
Data collection
Seed germination was recorded daily. Seed was considered to have germinated when visible radical
emergence was noted using a magnifying lense. Then, germination index was calculated according to the
formula below:
Germination index = ∑ (No. of germinated seeds on Gt)/Gt
Where Gt = number of days after germination
The germinated seeds were separated daily into other boxes on paper towel moistened with the same
CdCl2 concentration. Then, the length of radicle and plumule of emerged seedling were measured on the
next day (for A. gangeticus, C. maxima) or on the third day (for B. albograba) after seed germination. The
length of radicle and plumule was measured by using a piece of thread and a ruler.
Experimental design and statistical analysis
Studies on the effect of varying concentrations of CdCl2 on germination and early seedling growth of A.
gangeticus, C. maxima and B. alboglaba were each based on Completely Randomized Design (CRD).
Each treatment was replicated four times. Analysis of variance (ANOVA) was carried out and Tukey’s
Honestly Significant Difference Test was used for mean comparison. The percentage (%) data were
transformed to arc sine value before ANOVA.
Results and Discussion
Amaranthus gangeticus seed germination was significantly reduced with increasing concentration of
cadmium (Table 1). Seed germination was 51.50% with control seeds as there is usually high percentage
of non-viable seeds with very small sized seeds of this vegetable. The germination of seed was reduced to
16.75 – 20.25 % with treatment of 20 – 80 mg/l CdCl2. Similarly, the treated seeds also had significantly
lower germination index as compared to the control seeds.
The growth of radicles and plumules of A. gangeticus was inhibited by this heavy metal (Table 1). The
degree of plumule growth inhibition seemed to be greater than that of radicle. Length of plumules was
greatly retarded at 80 mg/l CdCl2. There was, however, no significant difference in length of radicles
among CdCl2 treatments of 20-80 mg/l.
Table 1. Germination and growth of seedlings of A. gangeticus following treatment with CdCl2. CdCl2 rate (mg/l) Germination (%) Germination index Length of plumule (cm) Length of radicle (cm)
0 51.50 ± 2.40 a 13.94 ± 0.64
a 1.59 ± 0.04
a 1.26 ± 0.09
a
20 20.25 ± 3.75 b 5.09 ± 0.86
b 0.80 ± 0.04
c 0.69 ± 0.10
b
40 17.25 ± 1.10 b 4.50 ± 0.32
b 1.12 ± 0.06
b 0.61 ± 0.05
b
60 17.00 ± 1.08 b 4.28 ± 0.31
b 1.06 ± 0.09
b 0.54 ± 0.03
b
80 16.75 ± 2.10 b 4.1 ± 0.49
b 0.59 ± 0.03
c 0.41 ± 0.01
b
Means with the same letter within the same column are not significantly different at 5% level of significance.
Page 43
ISBN 978-967-10840-4-5
Proc. Int. Conf. Plt. Phy. 2014
First Published, 2015
37
Table 2. Germination and growth of seedlings of C. maxima following treatment with CdCl2. CdCl2 rate (mg/l) Germination % Germination index Length of plumule (cm) Length of radicle (cm)
0 95.00 ± 2.04 ab
4.00 ± 0.13 a 1.25 ± 0.02
a 4.74 ± 0.16
a
20 96.25 ± 2.39 a 3.91 ± 0.14
a 1.09 ± 0.07
a 4.50 ± 0.18
a
40 93.75 ± 3.15 ab
3.77 ± 0.07 ab
0.76 ± 0.03 b 3.12 ± 0.20
bc
60 87.50 ± 3.23 ab
3.26 ± 0.17 bc
0.74 ± 0.03 b 3.69 ± 0.15
b
80 82.50 ± 2.5 b 3.08 ± 0.77
c 0.70 ± 0.04
b 2.64 ± 0.07
c
Means with the same letter within the same column are not significantly different at 5% level of significance.
On the other hand, CdCl2 at concentrations up to 60 mg/l generally did not affect total seed germination
of C. maxima significantly but those treated with 60 mg/l CdCl2 showed lower germination index than
seeds treated with lower concentrations of CdCl2 (Table 2). For subsequent seedling growth performance,
CdCl2 at ≥40 mg/l significantly reduced the initial seedling growth in terms of length of plumule and
radicle (Table 2). At this level of 40 mg/l CdCl2, soil is generally considered contaminated with cadmium.
Growth inhibition of radicle increased significantly and simultaneously with increasing CdCl2
concentration, indicating that radicle of C. maxima was more sensitive to this heavy metal than plumule,
which is in contrary to that demonstrated by A. gangeticus seeds.
Table 3. Germination and growth of seedlings of B. albograba following treatment with CdCl2. CdCl2 rate (mg/l) Germination % Germination index Length of plumule (cm) Length of radicle (cm)
0 75.00± 2.38 a 9.44±0.12
a 2.00±0.03
a 1.36±0.02
a
20 76.00± 4.32 a 10.02±0.75
a 1.98±0.05
a 1.23±0.08
ab
40 69.00± 1.73 a 9.38±0.40
a 1.95±0.03
a 1.04±0.02
b
60 75.50± 4.57 a 10.57±0.68
a 1.94±0.00
a 0.63±0.09
c
80 69.00± 3.70 a 9.27±0.56
a 1.71±0.04
b 0.53±0.04
c
Means with the same letter within the same column are not significantly different at 5% level of significance.
Brassica alboglaba seeds could tolerate CdCl2 up to 80 mg/l (Table 3). These treatments did not result in
significant difference in seed germination of this vegetable. However, CdCl2 at concentrations of ≥40
mg/l also resulted in significant inhibition of radicle growth while only the highest concentration of 80
mg/l CdCl2 significantly retarded plumule elongation (Table 3). There was significant and simultaneous
greater radical growth inhibition with increasing CdCl2 concentration. This also indicated that radicle of
B. alboglaba was more sensitive to this heavy metal than the plumule.
The effect of cadmium is dependent on species of vegetables (Raziuddin et al., 2011). Cadmium affects
seed germination and development of plumule and radicle of vegetables at certain level. The
accumulation of cadmium in leaves and roots was proportional to the concentration of cadmium in the
growth solution in the study conducted by Zou et al. (2012). There were studies indicated that the effect
of heavy metals on plants is dependent on the amount of toxic substance taken up from a given
environment (Farooqi et al., 2009). According to Januskaitine (2012), the roots can easily uptake
cadmium and have the heavy metal loaded into the xylem for its transport into leaves (Li et al., 2005;
Kiran and Sahin, 2006). Hence, cadmium was more obviously seen as affected development of leaves in
this case. According to Yadav (2010), cadmium also caused reduction in photosynthesis, water uptake
and nutrient uptake of plants when plants were grown in excessive cadmium.
Page 44
ISBN 978-967-10840-4-5
Proc. Int. Conf. Plt. Phy. 2014
First Published, 2015
38
Conclusions
CdCl2 at rates of 20-80 mg/l affected seed germination, germination index, growth of plumules and
radicles of A. gangeticus. The seeds of C. maxima, on the other hand, could not tolerate CdCl2 above 40
mg/l. Seed of B. alboglaba was more tolerant to CdCl2. They were not affected by CdCl2 of up to 80 mg/l.
However, it may tolerate cadmium well at rates up to 60 mg/l CdCl2 only, i.e. 0.33 mM cadmium, as the
subsequent elongation of plumule and radicle was significantly affected with cadmium higher than that
level. Further studies on the subsequent growth and possibilities of cadmium bioaccumulation in these
vegetables are necessary, even with cadmium availability of <40 mg/l CdCl2, for food safety.
References
Bavi, K., Kholdebarin, B. and Moradshah, A. 2011. Effect of cadmium on growth, protein content and
peroxidase activity in pea plants. Pakistan Journal of Botany 43(4): 1467-1470.
Das, P., Samantaray, S. and Rout, G.R. 1997. Studies on cadmium toxicity in plants: a review.
Environmental Pollution 98(1): 29-36.
Farooqi, Z.R., Zafar Iqbal, M., Kabir, M. and Shafiq, M. 2009. Toxic effects of lead and cadmium on
germination and seedling growth of Albiza lebbeck (L.) benth. Pakistan Journal of Botany 41(1):
27-33.
Janicka-Russak, M., Kabala, K. and Burzynski, M. 2012, Different effects of cadmium and copper on H+-
ATPase activity in plasma membrane vesicles from Cucumis sativus roots. Journal of
Experimental Botany 63(11): 4133-4142.
Januskaitene, I. 2012, The effect of cadmium on several photosynthetic parameters of pea (Pisum sativum
L.) at two growth stages. Agriculture 99(1): 71-76.
Kiran, Y. and Sahin, A. 2006. The effects of cadmium on seed germination, root development and mitotic
of root tip cells of lentil (Lens culinaris Medik). World Journal of Agricultural Sciences 2(2):
196-200.
Li, W., Khan, M.A., Yamaguchi, S. and Kamiya, Y. 2005. Effects of heavy metals on seeds germination
and early seedling growth of Arabidopsos thaliana. Plant Growth Regulation 46: 45-50.
Liu, D.L., Hu, K.Q., Ma, J.J., Qiu, W.W., Wang, X.P. and Zhang, S.P. 2011. Effects of cadmium on the
growth and physiological characteristics of sorghum plants. African Journal of Biotechnology
10(70): 15770-15776.
Muhammad, S., Iqbal, M.Z. and Mohammad, A. 2008. Effect of lead and cadmium on germination and
seedling growth of Leucaena leucocephala. Journal of Applied Science and Environmental
Management 12(2): 61-66.
Munzuroglu, O. and Zengin, F.K. 2006. Effect cadmium on germination, coleoptiles and root growth of
barley seeds in presence of gibberellic acid and kinetin. Journal of Environmental Biology 27(4):
671-677.
Raziuddin, Farhatullah, Hassan, G., Akmal, M., Salim Shah, S., Mohammad, F., Shafi, M., Bakht, J. and
Zhou, W. 2011. Effect of cadmium and salinity on growth and photosynthesis parameters of
Brassica species. Pakistan Journal of Botany 43(1): 333-340.
Rehman, F., Khan, F.A., Varshney, D., Naushin, F. and Rastogi, J. 2011. Effect of cadmium on the
growth of tomato. Biological and Medicine 3(2): 187-190.
Shafiq, M., Zafar, I.M. and Athar, M. 2008. Effect of lead and cadmium on germination and seedling
growth of Leucaena leucocephala. Journal of Applied Sciences and Environmental Management
12(2): 61-66.
Yadav, S.K. 2010, Heavy metals toxicity in plants: An overview on the role of glutathione and
phytochelatins in heavy metal stress tolerance of plants. South African Journal of Botany 76: 167-
179.
Page 45
ISBN 978-967-10840-4-5
Proc. Int. Conf. Plt. Phy. 2014
First Published, 2015
39
Zou, J., Yue, J., Jiang, W. and Liu, D. 2012. Effect of cadmium stress on root tip cells and some
physiological Indexes in Allium cepa var.Agrogarum L. Acta Biologica Cracoviensa Series
Botanica 54/1: 129-141.
Page 46
ISBN 978-967-10840-4-5
Proc. Int. Conf. Plt. Phy. 2014
First Published, 2015
40
Yield Analysis of Rice between System of Rice Intensification (SRI) and
Conventional Farming in Sabak Bernam District, Selangor, Malaysia – A
Case Study
Tsan, F.Y.* and Orlando, G.J.
Faculty of Plantation and Agrotechnology, Universiti Teknologi MARA, 40450 Shah Alam, Selangor,
Malaysia.
*E-mail: [email protected]
Introduction
The production of rice has been started a long time ago since the emergence of the civilization, especially
in Asia. Furthermore, it has been considered as one of the world’s most sustainable and productive
farming systems (Mutert and Fairhurst, 2002). In Malaysia, the production of rice has been highly
demanded because of the needs of the Malaysians for it as the staple food. There was an increased
production of paddy from 2,375,604 Mt in 2007 to 2,575,988 Mt in 2011 (Jabatan Pertanian Malaysia,
2012). In addition, the high demand for rice leads to the importation of rice (Tey and Radam, 2011). Due
to the unstable food security, Malaysian government planned for several new approaches. One of the new
approaches in rice production is called System of Rice Intensification (SRI). SRI was developed and
started in Madagascar some 30 years ago and started gaining popularity in the other countries. SRI was
developed by Fr. Henri de Laulanié after about 20 years of experimentations and observations to help the
Madagascar’s people in facing the food scarcity and economic unstability (Uphoff, 2006).
In conventional method of rice planting, the recommended age of seedlings used is around 21 – 24 days
old (Anon, 2010). In SRI practices, younger seedlings are much required because they can contribute to
higher grain yield. The transplanting of younger seedlings avoids additional root and shoot dry matter
accumulation. This practice also will not damage the root system during transplanting process. The
undamaged root system of the seedlings eventually will reduce the number of unsuccessful growth of the
seedlings. The efficiency of young seedlings to utilize the resources can effectively produce a great
number of tillers, larger leaf area and much taller plants. The younger seedlings may also promote the
microorganism population in rhizosphere and this can favor the growth and yield of paddy.
One or two seedlings transplanting is among the common practices in SRI. One or two seedlings planted
per hill in paddy field may reduce the competition in terms of nutrient needs between the root systems
(Chapagain and Yamaji, 2010). The increased number of tillers, larger leaf area index and higher dry
matter produced from a single seedling are presumed to have contributed to the better yield.
Wider planting spacing in SRI is recommended because it can give higher yield and net income to the
farmers (Krishna and Biradarpatil, 2009; Lin et al., 2009; Chapagain and Yamaji, 2010). Wider planting
distance per hill produces remarkable longer roots and larger stem diameter. These properties allow the
plant to absorb more nutrients and increase the root absorption area in the soil. The wider spacing at
reduced plant density also reduces the competition between plants in terms of nutrient and sunlight needs,
hence, high yield can be achieved under SRI.
Water management in SRI is a different method as compared to conventional method. In SRI, reduced
usage of water by means of intermittent irrigation demonstrated many benefits as compared to continuous
flooding in paddy field (Nyamai et al., 2012; Choi et al., 2013). The water requirement in paddy field
under SRI was 55.6% less as compared to the conventional practices. However, such irrigation practices
in SRI produced less yield as compared to conventional farming in salt – affected soils because of the
Page 47
ISBN 978-967-10840-4-5
Proc. Int. Conf. Plt. Phy. 2014
First Published, 2015
41
salinity stress (Menete et al., 2008). Another advantage in intermittent irrigation is the reduced methane
(CH4) emission by 74 – 79.5 % (Setyanto and Kartikawati, 2011; Suryavanshi et al., 2013). The
intermittent irrigation also causes unfavorable condition to the pathogen and, therefore, disease severity is
reduced (Pathak et al., 2012).
SRI practices recommend the use of organic manures to replace any organic and inorganic fertilizer as far
as the cost of production is concerned. Organic manures not only supply the least nutrient for the plant but
they are also used as soil amendment. This soil amendment can eventually change the soil chemical and
physical properties, affect the microbial activities in the soil to degrade the soil organic matters and help
release the nutrients bound to the soil (Rajeshwar and Aariff Khan, 2008; Suryadi et al., 2013).
The Food Price Crisis in 2007 and 2008 influenced the production of food in Malaysia, including rice
production. The implementation of SRI to solve the above problem in Malaysia has taken place in several
granaries under Department of Agriculture (DoA). As influenced by the conventional practices that have
been done for a long time, some farmers, however, may adopt different practices in SRI. Some
differences in the SRI practices may lead to differences in yield. These differences can be analyzed
against the rice yield under conventional rice farming for improvement purposes.
This study was aimed to analyze the differences in terms of SRI practices adopted by the farmers in Sabak
Bernam District, DoA Selangor. It is an important rice granary. The rice yield differences between SRI
practices and conventional farming of the main season in 2013 were explained with their agronomic
practices.
Materials and Methods
Study location
The study was conducted in Sabak Bernam District as many farmers there adopted SRI practices. Sabak
Bernam is located in the southern west of Peninsular Malaysia. Paddy cultivation is one of the largest
food production activities in Sabak Bernam. It is cultivated in irrigated system introduced by British
colonial long time ago. Most paddy farmers there planted MR220 paddy variety as recommended by DoA
Selangor.
Sampling
There were a total of 104 paddy farmers in Sabak Bernam registered under DoA Selangor. Samples were
randomly selected from this area. A total of 50 farmers provided the required information for this study
with 28 farmers registered as SRI farmers and the other 22 farmers were still attached to conventional
paddy cultivation.
Study procedure
Face to face interviews were used as the tools to collect data from the selected farmers as mentioned. A
questionnaire was designed to assist data collection on farmer demography, husbandry practices and yield
in main season from the respondents.
Page 48
ISBN 978-967-10840-4-5
Proc. Int. Conf. Plt. Phy. 2014
First Published, 2015
42
Data analysis
Data on demography and husbandry practices were subjected to descriptive analysis. Yield differences,
on the other hand, were subjected analysis of variance and treatment means were compared using
Duncan’s multiple range test.
Results and Discussion
From Figure 1, it was found that majority registered SRI farmers were still practicing conventional
methods in rice farming. Only 14% of them followed some of the SRI methods in irrigation, nutrient and
pest management. This indicates that more intensive extension services or field visits should be
considered and implemented by the authorized bodies to promote SRI among farmers, especially the SRI
registered farmers.
Figure 1 shows that SRI enabled significantly higher yield as compared to conventional farming. SRI
farmers gained mean yield of 9,317 kg/ha. With conventional practices, mean yield was 7,543 kg/ha.
Farmers registered for SRI scheme but still practiced conventional farming methods had mean yield of
7,874 kg/ha.
Most SRI farmers were in the classes of 36 – 55 years old (Figure 2). Most conventional farmers, on the
other hand, were found in the older age categories, and the oldest farmer of 75 years old was also in the
category of conventional farming. Educational background was presumed to affect the perception and
adoption of this new rice cultivation technology. Sita Devi and Ponnarasi (2009) suggested that the age
differences of farmers were related to the probability of SRI technology adoption. The younger farmers
realize that adoption of new practices can increase their yield and productivity.
Figure 1. Distribution of farmers according to farming system (left) and yield (right), n=50, bar in the
chart on right indicates 95% CI for mean, means having the same letter in the chart on right are
not significantly different at 5% level of significance.
Page 49
ISBN 978-967-10840-4-5
Proc. Int. Conf. Plt. Phy. 2014
First Published, 2015
43
Figure 2. Distribution of farmers according to age.
Most farmers were cultivating paddy in their own land (Figure 3). Only small number of them rented land
for living through rice cultivation while other small number of farmers worked on both own and rented
land for rice production for living. There was no obvious difference in rice production according to land
tenureship in this important rice granary.
Figure 3. Land ownership (left) and their yield performance (right) according to farming systems, bar in
the chart on right indicates 95% CI for mean.
All farmers, including the SRI farmers, practiced direct seeding. Labor shortage was presumed to be
related to the failure to adopt reduced seeding rate and plant density practices through transplanting
method in SRI. With water management, there were only a few SRI farmers (four persons) that practiced
intermittent wet and dry technique, as recommended with SRI, and they obtained high yield of almost
9,000 kg/Ha (Figure 4). With conventional farmers, the best yield achieved was below 8,000 kg/ha.
Page 50
ISBN 978-967-10840-4-5
Proc. Int. Conf. Plt. Phy. 2014
First Published, 2015
44
Figure 4. Irrigation practices (left) and their yield performance (right) according to farming systems, bar
in the chart on right indicates 95% CI for mean.
In nutrient management, organic fertilizer application was practiced only by small number of SRI farmers
while conventional farmers still depended solely on subsidized chemical fertilizers (Figure 5). Organic
soil amendment was proved to allow SRI farmers to gain profitable yield of above 9,000 kg/ha while
conventional subsidized fertilizers combined with other SRI practices was best in enhancing high yield of
paddy, giving yield of almost 10,000 kg/ha. Conventional farmers had yield of below 8,000 kg/ha.
In pest management, most farmers practiced chemical control of insect pests, diseases and weeds with
subsidized chemicals (Figure 6). Only a few SRI farmers bought additional effective pesticides, in
addition to subsidized pesticides, for the mentioned chemical control of pests and weeds.
Figure 5. Nutrient management (left) and their yield performance (right) according to farming systems,
bar in the chart on right indicates 95% CI for mean.
Page 51
ISBN 978-967-10840-4-5
Proc. Int. Conf. Plt. Phy. 2014
First Published, 2015
45
Figure 6. Sources of pesticides (left) and their yield performance (right) according to farming systems,
bar in the chart on right indicates 95% CI for mean.
The application of organic soil amendment affects the soil microorganisms. The soil microorganisms such
as consortium bacteria can reduce the disease severity, especially in rice (Suryadi et al., 2013). This
biological control agent can act as parasite to pathogens and reduce the infection caused by soil borne
pathogen. The intermittent irrigation also causes unfavorable condition to the pathogens and the disease
severity is therefore reduced. In previous study, there were reductions of disease causing pest populations
in SRI plot. Stem borer, leaf folder, cast worm populations were found reduced by 24.2 %, 15.9 % and
11.4 respectively in both CAUR – 1 and Deku variety of rice (Pathak et al., 2012). The population of
natural enemies such as dragon fly also reduced as indicator of low population of stem borer, leaf folder
and case worm. Moreover, the disease incidence of brown spot, bacterial leaf blight, false smut, bacterial
sheath blight and bacterial leaf stripe was also reduced in SRI plots. The study conducted in Chiba
Prefecture, Japan, also showed that there was no significant pest or disease incidence during the
experiment of SRI (Chapagain et al., 2011). This low incidence of pest and disease was also believed to
be related to the lower plant density which reduced the moist microclimate that is favored by the pest and
disease causing agents. However, reduced fertilizer and pesticide application advantages were yet to be
proven for SRI in Sabak Bernam as the farmers under study still relied greatly on the conventional
method and the government intervention in terms of subsidized fertilizers and pesticides. There were,
however, positive results with adoption of SRI methods in the under study area as a few SRI farmers
achieved higher yield of more than 9,000 kg/ha. Reduced flooding irrigation together with incorporation
of organic fertilizer as substitute to chemical fertilizer are believed to bring indirect benefits to maintain
healthier environment and ecosystem in the long run (Chapagain and Yamaji, 2010; Nyamai et al., 2012;
Choi et al., 2013).
An important concern in SRI practices was the differences of productivity and subsequent income of the
farmers. In Tamil Nadu India, a study indicated that the farmers obtained higher income in SRI practices
as compared to the conventional farming (Devi and Ponnarasi, 2009). The other study conducted by
Barah (2009) also supported that there was an increasing rice production by more than 26% in SRI as
compared to the other practices. The increasing rice production combined with the saving of water usage
up to as much as 40%, saving on seeds for planting for as much as 42 % and shortened length of rice
growing period of approximately 20 days contributed to higher net income to the farmers. The lower
pesticide and herbicide usage also contributed to the decreased cost of production. A study conducted in
Timor Leste also proved that there was an increase in yield gained by SRI adopters, especially in higher
family labor and management requirement as compared to non – SRI adopters (Noltze et al., 2013). This
high yield gained was the same for poor and non – poor households in Timor Leste. However, the study
conducted in West Bengal, India by Haldar et al. (2012) showed that the labor cost in SRI practices was
Page 52
ISBN 978-967-10840-4-5
Proc. Int. Conf. Plt. Phy. 2014
First Published, 2015
46
75% higher than conventional practices in Kharif season (main season) and Rabi season (off season).
Higher labor cost eventually did not affect the net income of the farmers because the higher yield and the
reduction of other costs had covered the labor cost as a whole. The increasing rice yield for about 0.3%
was corresponding to the additional labor input by 3% (Noltze et al., 2013). It was due to the hiring of the
skilled labor in managing SRI practices. The method applied for growing rice in SRI also affects the
management of nursery. The lower cost in purchasing seeds, lower irrigation usage, and shorter duration
for growing the seedlings in the nursery beds allowed the reduction of nursery cost by 76% as compared
to the conventional methods (Haldar et al., 2012). Due to reduction of cost in nursery stages and field
stages, the farmers in West Bengal acquired higher income in Kharif and Rabi season of Rs 14,613 and
Rs 22,966 per hectare, respectively, as compared to conventional methods.
Conclusion and Recommendations
SRI should be encouraged among the rice farmers as there was significant higher yield with such
practices as compared to conventional rice farming. Further study should be conducted to represent SRI
practiced in other rice granaries in Malaysia. In addition, this study in Sabak Bernam only relied on the
production and yield of paddy in main season. Production and yield of paddy in off – season also needs to
be studied so that more representing scenario of SRI and conventional farming practices in Sabak
Bernam, and in Malaysia as a whole, can be analysed for improvement. The outcome of the study is
hoped to be used to strengthen the understanding of SRI among the rice growers in Malaysia. The results
on the different SRI practices carried out by the farmers can be a platform for DoA to conduct
experimentations and to standardize the practices for the future needs.
References
Anon. 2010. More Rice for People, More Water for The Planet : The System of Rice Intensification
(SRI). WWF – ICRISAT, Hyderabad, India.
Barah, B.C. 2009. Economic and ecological benefits of System of Rice Intensification (SRI) in Tamil
Nadu. Agriculture Economics Research Review 22: 209-214.
Chapagain, T. and Yamaji, E. 2010. The effects of irrigation method, age of seedling and spacing on crop
performance, productivity and water - wise rice production in Japan. Paddy Water Environment
8: 81-90.
Chapagain, T., Riseman, A. and Yamaji, E. 2011. Assessment of System of Rice Intensifcation (SRI) and
conventional practices under organic and inorganic management in Japan. Rice Science 18(4):
311-320.
Choi, J.D., Park, W.J., Park, K.W. and Lim, K.J. 2013. Feasibility of SRI methods for reduction of
irrigation and NPS pollution in Korea. Paddy Water Environment 11: 241-248.
Devi, K.S. and Ponnarasi, T. 2009. An economic analysis of modern rice production technology and its
adoption behavior in Tamil Nadu. Agricultural Economics Research Review 22: 341-347.
Haldar, S., Honnaiah and Govindaraj, G. 2012. System of Rice Intensification (SRI) method of rice
cultivation in West Bengal (India): An economic analysis. International Association of
Agricultural Economists (IAAE) Triennial Conference, 18–24 August, 2012, Brazil, International
Association of Agricultural Economists (IAAE).
Jabatan Pertanian Malaysia. 2012. Keluasan bertanam dan pengeluaran padi malaysia mengikut negeri,
2007-2011. Retrieved April 8, 2013, from http://www.doa.gov.my/c/ document_library/
get_file?uuid=35c14631-ca10-4a26-a191-fdd64708dce4&groupId=38371
Krishna, A. and Biradarpatil, N. K. 2009. Influence of seedling age and spacing on seed yield and quality
of short duration rice under system of rice intensification cultivation. Karnataka Journal of
Agriculture Science 22(1): 53-55.
Page 53
ISBN 978-967-10840-4-5
Proc. Int. Conf. Plt. Phy. 2014
First Published, 2015
47
Lin, X.Q., Zhu, D.F., Chen, H.Z., Cheng, S.H. and Uphoff, N. 2009. Effect of plant density and nitrogen
fertilizer rates on grain yield and nitrogen uptake of hybrid rice (Oryza sativa L.). Journal of
Agricultural Biotechnolofy and Sustainable Development 1(2): 44-53.
Menete, M.Z., van Es, H.M., Brito, R.M.L., DeGloria, S.D. and Famba, S. 2008. Evaluation of System of
Rice Intensification (SRI) component practices and their synergies on salt affected soils. Field
Crops Research 109: 34-44.
Mutert, E. and Fairhurst, T.H. 2002. Developments in rice production in Southeast Asia. Better Crops
International 15: 12-17.
Noltze, M., Schwarze, S. and Qaim, M. 2013. Impacts of natural resource management technologies on
agricultural yield and household income: The System of Rice Intensification in Timor Leste.
Ecological Economics 85: 59-68.
Nyamai, M., Mati, B.M., Home, P.G., Odongo, B., Wanjogu, R. and Thuranira, E.G. 2012. Improving
land and water productivity in basin rice cultivation in Kenya through System of Rice
Intensification (SRI). Agricultural Engineering International, CIGR Journal 14(2): 1-9.
Pathak, M., Shakywar, R.C., Sah, D. and Singh, S. 2012. Prevalence of insect pests, natural enemies and
diseases in SRI (System of Rice Intensification) of rice cultivation in North East Region. Annals
of Plant Protection Sciences 20(2): 375-379.
Rajeshwar, M. and Aariff Khan, M.A. 2008. Comparison of System of Rice Intensification (SRI) and
conventional method of rice planting under Nagarjuna Sagar project left canal command area of
Andhra Pradesh, India. An Asian Journal of Soil Science 3(1): 53-57.
Setyanto, P. and Kartikawati, R. 2011. Integrated rice crop management for low emittance of methane.
Indonesian Journal of Agriculture 4(1): 8-16.
Sita Devi, K. and Ponnarasi, T. 2009. An economic analysis of modern rice production technology and its
adoption behaviour in Tamil Nadu. Agricultural Economics Research Review 22: 341-347.
Suryadi, Y., Susilowati, D., Akhdiya, A., Kadir, T.S. and Wibowo, B. 2013. Efficacy of consortium
bacteria for control rice diseases under System of Rice Intensification (SRI) in West Java -
Indonesia. Albanian Journal of Agricultural Science 12(1): 143-147.
Suryavanshi, P., Singh, Y.V., Prasanna, R., Bharia, A. and Shivay, Y.S. 2013. Pattern of methane
emission and water productivity under different methods of rice crop establishment. Paddy Water
Environment 11: 321-329.
Tey, Y. and Radam, A. 2011. Demand patterns of rice imports in Malaysia: Implications for food
security. Food Security 3: 253-261.
Uphoff, N. 2006. The System of Rice Intensification (SRI) as a Methodology for Reducing Water
Requirements in Irrigated Rice Production. IRRI, Los Baños, Philippines, 23 p.
Page 54
ISBN 978-967-10840-4-5
Proc. Int. Conf. Plt. Phy. 2014
First Published, 2015
48
CHAPTER 2
ECOPHYSIOLOGY AND
STRESS BIOLOGY
Page 55
ISBN 978-967-10840-4-5
Proc. Int. Conf. Plt. Phy. 2014
First Published, 2015
49
Comparison of Leaf Wetness in Upper and Lower Citrus Canopy
Walker, S.1,2,*
and Kudinha, M.T.1,3
1University of the Free State, Bloemfontein, South Africa.
2Crops for the Future Research Centre, the University of Nottingham Malaysia Campus, Jalan Broga,
43500 Semenyih, Selangor, Malaysia. 3Cape Peninsular University of Technology, Bellville, South Africa.
*E-mail: [email protected]
Introduction
Leaf wetness is an important parameter as it influences the infection and growth of many plant diseases.
Therefore, many phytopathological models use leaf wetness duration in combination with other factors to
assess the infection and pest severity as well as to manage disease control activities in an efficient way.
According to Timmer and Zitco (1996) model-based decisions on fungicide applications in citrus resulted
in reduced disease, large increases in fruit production and elimination of unnecessary sprays. However,
leaf wetness is difficult to measure or estimate because it is driven by both atmospheric conditions and
their interaction with the structure, composition and physiology of the crop canopy. Leaves at different
positions within a canopy become wet and/or dry at different times, which results in the spatial variation
in length of time each leaf is wet. This spatial variability is an important aspect to be considered when
measuring leaf wetness duration (LWD) (Santos et al., 2008), since a thorough understanding of the
heterogeneity within a crop canopy is critical for implementing a disease-warning system reliant on LWD
input data.
Several scientific instruments can monitor leaf wetness, including Campbell Scientific leaf wetness sensor
that operates by measuring electrical resistance, and has been used in studies investigating spatial
variability of leaf wetness duration in different crop canopies such as apples, coffee, grape, maize, cotton
and bananas (Henshall et al., 2005; Sentelhas et al., 2005; Dalla Marta et al., 2008; Santos et al., 2008).
However, the sensors may require field calibration. A more recent design, Decagon Devices wetness
sensor detects wetness based on electrical capacitance (Gleason et al., 2008) with high resolution and very
small amounts of water. This study aimed to compare the upper and lower canopy leaf wetness within a
citrus canopy using both these sensors.
Materials and Methods
Description of field site
The study was conducted at the Welgenvallen Experimental Farm of the University of Stellenbosch
(latitude 33.56 S, longitude 18.52 E, altitude 157 m) in Western Cape, South Africa. The citrus orchard,
planted in 1994, consists of mature, fruit bearing Citrus unshiu Marchovitch citrus trees not irrigated
during this field trial experiment. The region is characterized by a Mediterranean climate with cool, wet
winters and warm, dry, summers. The mean annual precipitation is 673 mm (about 70% in winter)
brought by the dominant westerly and northwesterly moisture laden winds. Mean midday maximum
temperatures range from 16 °C in July to 24 oC in December and winter night temperature drops to 6.6 °C
in July. The 2012 winter season was distinctly wetter and colder, with total rainfall recorded in June, July
and August, 2012 about 140 mm more than long-term mean.
Page 56
ISBN 978-967-10840-4-5
Proc. Int. Conf. Plt. Phy. 2014
First Published, 2015
50
Leaf wetness sensors
Flat, printed-circuit wetness sensors, Campbell Scientific sensors (Model 237)
(http://www.campbellsci.co.za/237-l) is hard epoxy-fibreglass with interlaced gold-plated copper fingers,
measuring 7.5 x 6 cm, with a smaller active surface area of about 30 cm2. Condensation (free water) on
the upper surface of the sensor lowers the impedance between fingers (1 mm, grid spacing) and is
measured by a data logger. A dry sensor has infinite impedance, recorded as 6999 Ω by a CR10X data
logger. Prior to use, the sensors were field calibrated to determine the wet/dry threshold.
Decagon dielectric leaf wetness sensors estimate leaf surface wetness by measuring the ability of the
material on the sensor’s upper surface to store charge (http://www.decagon.com/products/canopy-
atmosphere/water/lws-leaf-wetness-sensor/). The sensor output voltage (mV) is proportional to the
dielectric of the measurement zone and proportional to the amount of water on the sensor’s surface. It
requires an excitation voltage of 2500 mV and data logger reading of less than 274 mV corresponds to a
dry sensor. Each of the sensors was individually calibrated in the field.
Placement of sensors in citrus tree canopy
Six leaf wetness sensors, (three each type) were installed at two different heights in a citrus tree (about
2.14 m tall). Four sensors, (two Campbell and two Decagon) were mounted in four horizontal positions
approximately 30 cm apart along an east-west transect in the top third of the citrus canopy (about 1.63 m
height) (Figure 1). Another set of sensors, (one each type) was mounted in the lower one-third of the
canopy (64 cm height) surface, with Decagon sensor (D_3) on the eastern side, at a horizontal distance of
70 cm from the Campbell sensor (C_3) on the western side of the canopy. All the sensors were mounted
on the end of a PVC pipe, oriented at 45° to the horizontal, facing south. The sensors were checked
routinely to avoid leaf contact with their surfaces.
Figure 1. Photo of wetness sensors mounted on the upper citrus canopy at the Welgenvallen Experimental
Farm, University of Stellenbosch between July and November, 2012.
Meteorological variables, including relative humidity, air temperature (1.8 m), net radiation (just above
the canopy) and wind speed above the canopy as well as leaf temperature were also measured. One
thermocouple thermometer, was attached by means of plastic clip to a tagged leaf in upper canopy whilst
a second thermocouple to a leaf in the lower eastern canopy. All meteorological sensors were connected
to a CR10X – data logger is programmed to scan data from each sensor every five seconds and average it
over a 15 min time period. Rainfall data measurement was obtained from a standard weather station
located close to the orchard.
Page 57
ISBN 978-967-10840-4-5
Proc. Int. Conf. Plt. Phy. 2014
First Published, 2015
51
Visual observations of dew
The existence of wetness on the leaves was assessed by visual observation, involving visual inspections
for wetness on the surface of selected leaves (20 leaves with no visible damage within 30 cm of a wetness
sensor) in upper and lower eastern canopy position each tagged and numbered for unique identification.
Human visual inspections of dew onset were based on the first appearance of small water droplets on any
one of the tagged leaves. A leaf was considered to be “wet” (assigned = 1) when one-tenth (10%) of its
upper surface area was visually wet. Leaves with no visual evidence of surface wetness were considered
“dry” (flagged as 0). When the leaf upper surface area was completely wet, it was assigned a value of 10
that designated 100 % leaf wetness. These visual observations were done every 15 min starting from
18h00 until complete surface wetness, and again from sunrise until complete dew dissipating in the
morning for some selected days from 27 July until 30 November 2012 (total = 62 days) (Kudinha, 2014).
A single day (13 Oct, 2012) when dew formed will be presented as an example in this paper.
Data analysis
The observed daily LWD data began at 12h15 and ended at 12h00 (24h), by summing all the 15 min time
intervals when the wetness was visually observed. The observed days were split into dew days and rainy
days, defined as a day with measured rainfall ≥ 0.25 mm. T-test at 5% probability was performed to
determine if mean LWD were statistically significant from each other during days when wetness resulted
from dew, rain or both events.
Results and Discussion
Variation of weather data on a dew day considering the upper canopy
An analysis of dew days, indicated that dew was mostly deposited on the leaf whenever the leaf
temperature reached the dew point temperature (Figure 2). To illustrate the variation of meteorological
parameters a typical dew day was analyzed for this paper, 13th October, 2012. The variation of
meteorological variables as well as wetness sensors’ response was examined from 12h15 on 13th October
until 12h00 the next day. On this night, both the air and leaf temperature began to fall sharply after sunset
at 18h00. The decrease in air temperature was accompanied by an increase in relative humidity. Dew was
observed to form on the night of 13th October 2012 at 19h15 when the leaf temperature reach the dew
point temperature at that time (Figure 2) this was also confirmed by the visual observations (Figure 3).
This onset of dew deposition was also recorded by the wetness sensors. In the case of the Campbell
sensors, the sensor readings fell from 6999 Ω to below 1000 Ω (Figure 4a), whilst for the Decagon
sensors, voltage increased from a baseline voltage of about 270 mV (Figure 4b) as an indication of the
leaf wetting process. A sudden change (seen as kink on graph) in one of the Campbell sensors could have
been caused by droplets dropping off the sensors, followed by more wetting given the further decrease in
temperature (Figure 4a).
The wetness response seemed to mimic the visual observations of canopy wetness because when the
canopy was visually observed to be wet, the wetness sensors’ outputs also correctly indicated it to be wet
in most of the cases. A similar pattern was also observed when the canopy was observed to be dry. Visual
observations of wetness indicated that canopy was wet when relative humidity was mainly greater than
82% and above and dry below 45%, which agreed with sensors’ response (Figure 5). In the case of vapour
pressure deficit, values of vapour pressure deficit less than 1.5 KPa were associated with observed
Page 58
ISBN 978-967-10840-4-5
Proc. Int. Conf. Plt. Phy. 2014
First Published, 2015
52
wetness when the leaf was evaporating (Figure 6), a trend that the wetness sensors also depicted
(Kudinha, 2014).
Figure 2. Variation of meteorological parameters at Welgenvallen Experimental Farm of the University of
Stellenbosch from 13 October, 2012 until the next day with Tmean = air temperature (°C), RH
= air relative Humidity (%), Dew PtTemp = dew point temperature (°C); TleafTop = leaf
temperature in upper layer (°C); wind=wind speed above canopy; Net Rad=Net Radiation from
the automatic weather station.
Figure 3. Visually observed upper (Top) and lower (B) canopy wetness within a citrus canopy at
Welgenvallen Experimental Farm of the University of Stellenbosch from 13 October, 2012
until the next day. 0= dry, 1=wet.
Page 59
ISBN 978-967-10840-4-5
Proc. Int. Conf. Plt. Phy. 2014
First Published, 2015
53
Figure 4. Wetness sensors’ response to dew formation at Welgenvallen Experimental Farm of the
University of Stellenbosch from 13 October, 2012 until the next day, where T=upper canopy;
B=lower canopy; C=Campbell (a), D=Decagon (b), E=East, W=West, #=sensor number.
An analysis of the response of the sensors, showed that the wetting of all the sensors was achieved when
the vapour pressure deficit was less than 0.2 KPa, which coincided with the visual onset of dew
deposition in the upper canopy level. Evaporation of moisture from the canopy varied according to other
conditions and combinations of vapour pressure deficit and air temperatrure. All the sensors exhibited
similar patterns, although the two different types showed different sensitivities to the wetting and drying
cycle. There was a characteristic hysteresis loop exhibited by the sensor’ outputs (Figure 5). The Decagon
gave a higher voltage during evaporation part of the cycle (Figure 5b and 5d), thus tending to indicate a
wetter value for longer. In contrast, the Campbell sensor went through the whole range of values during
both the wetting and evaporation cycles, but gave a high resistance value when dry and near zero value
when fully wetted (Figure 5a and 5c). Probably this is why the manufacturers recommend only stating a
wet or dry value.
Page 60
ISBN 978-967-10840-4-5
Proc. Int. Conf. Plt. Phy. 2014
First Published, 2015
54
Figure 5. Sensors’ response to relative humidity (a and b) and vapour pressure deficit (c and d) at
Welgenvallen Experimental Farm of the University of Stellenbosch from 13 October, 2012 till
the next day; C=Campbell (a and c), D=Decagon (b and d), #=sensor number, T= upper layer.
Visual observations of occurrence of leaf wetness
Although the field trials ran from 27 July 2012 to 31 November 2012, only a total of 62 days were
visually observed for leaf wetness throughout the night. Dew formed on the upper canopy more
frequently than on the lower canopy position and contributed 47% of all the wetness that occurred during
the period of study whilst rainfall accounted for 17 days of wetness in the upper canopy. It was also
common to observe that on some days, dew initially formed at night and was followed by rains later
during the night or the early part of the next day. The remainder of the days, a total of 10, were dry (no
dew having been visually observed). Dew occurred in the lower eastern canopy for a total of 15 days,
which was 9 days less than its occurrence of dew in the upper canopy. The number of dry days in the
bottom canopy (eastern) was about twice as much as those in the upper canopy (21 days) (for details see
Kudinha, 2014).
A comparison of the onset time of LWD observed at both canopy levels indicated different wetness
profiles within the citrus canopy. On 9 nights dew formed in the upper canopy level and yet the lower
canopy was completely dry. Leaf wetness consistently manifested earlier in the upper canopy layer, hence
the leaves in the upper canopy level were usually wetted before dew started to be deposited on the leaves
in the lower canopy. On average dew onset on the upper surface occurred 1.5 to 2 h before its dew onset
in the lower canopy. There was also a variation of about half an hour between the onsets of wetness on
the two sides of the lower canopy. Initial dew onset on the upper canopy was usually detected between
19h15 and 22h00 hours, but only once the first dew occurrence was as late as 1h15 hours. However, dew
onset was observed to occur occasionally as late as the midnight in the lower canopy (for details see
Kudinha, 2014).
Page 61
ISBN 978-967-10840-4-5
Proc. Int. Conf. Plt. Phy. 2014
First Published, 2015
55
In the upper, there was a gradual increase of wet leaf area observed as well as the presence of wetness in
almost all the leaves. However, in the lower canopy level, the pattern of wetness was that it mainly took
place on the outside leaves, followed by some of the leaves in the interior. Wetness was observed in 60%
to 100% of the leaves in the upper canopy level, while only a few leaves in the lower canopy wetted (10%
to 60%) with exception of two nights when a high incidence was observed in both canopy levels. The two
nights were characterized by high relative humidity and lower temperatures which could have resulted in
high dew deposition, which could have resulted from rains that fell shortly before that. There was never a
single dew day that all the leaves in the lower canopy position became wet (Kudinha, 2014). Rain,
especially when intense, caused the leaves in all the canopy positions to wet almost simultaneously,
which minimized the differences in LWD between the canopy positions.
Comparison of visually observed LWD at different canopy positions
The statistical analysis of the data revealed that LWD was not homogeneous throughout the canopy and
varied according to canopy position (height) and type of wetness (Table 1). The vertical distribution of
wetness duration in the canopy depended on whether rain or dew was the source of wetness. The
differences between mean LWD in the lower eastern and lower western horizontal positions were not as
pronounced (not significantly different) as the difference between the upper canopy and any one of the
lower canopy positions (significantly different). The greatest differences in mean daily LWD among the
canopy positions were observed during days when wetness resulted from dew. These differences in mean
LWD between the upper and the two lower canopy positions during dew days were 1.9 h and 1.7 h
corresponding to the eastern and western lower canopy positions respectively yet the lower canopy
positions differed by less than 30 minutes regardless of the source of wetness. Although the mean daily
LWD at the upper canopy and the lower canopy positions were significantly different, the lower canopy
positions were not significantly different from each other (Table 1). The same pattern persisted when both
rain and dew days were combined. During rainy days, there was no significant difference between all the
canopy positions and the mean daily LWD in the upper and lower canopy positions differed by about 1 h.
Table 1. Mean daily leaf wetness duration (LWD) (in hours per day) in three citrus canopy positions,
comparing dew only days, rainy only days and days receiving both rain and dew selected from
observation period 27 July to 30 November, 2013.
Type of wetness Top canopy Bottom canopy
Eastern Western
Dew 12.2a 10.3
b 10.7
b
Rain 15.5a 14.3
a 14.1
a
Rainy and dew days combined 14.0a 12.9
b 12.6
b
Mean in same row followed by same letter are not significantly different by t–test at 5% probability level
Discussion of spatial variations
The observed total LWD, calculated as the sum of the wet hours during the entire period amounted to 725
h in the upper canopy level compared to 527 h in the lower canopy. This indicates a gap of 198 h between
the upper and lower canopy levels and confirms that there are differences between the two canopy
positions. These differences can be attributed to the night thermal patterns that occur in the citrus canopy.
During the night, the mean air temperature profile at the top of the canopy becomes unstable due to loss
of long wave radiation and thus the unstable lower vegetation layer is capped and thereby decoupled from
the above the above – canopy region (Jacobs et al., 1995). Air and leaf temperature data show that the leaf
temperatures in the upper canopy layer (8.32 ± 3.17 o
C) were slightly lower than the average air
temperature (8.65 ± 2.75 oC) compared to higher leaf temperatures in the lower canopy layer (mean 9.12
Page 62
ISBN 978-967-10840-4-5
Proc. Int. Conf. Plt. Phy. 2014
First Published, 2015
56
± 2.97 oC). The leaves in the upper canopy were cooler than those in the lower canopy by 0.80
oC. A
study of leaf wetness spatial variability within grapevine canopy by Dalla Marta et al. (2008) seem to
confirm the findings of this study although they found that in the upper canopy layer, leaves were cooler
than those in the bottom layer by about 0.6 oC. However, the higher leaf temperature difference in the
citrus could be due to the fact that the citrus canopy had a very dense canopy. The higher leaf
temperatures in this lower canopy layer seemed to have given rise to lower condensation in this canopy
layer due the cooling process lasting longer.
The explanation for the early deposition of dew on the top canopy is related to the exposure of the top
canopy to the sky. In a mature canopy such as the citrus, the top canopy is directly exposed to the sky, and
consequently is generally the first region to exhibit wetness (Santillàn-Nūñez, 2009). The leaves in this
layer create a barrier that reduces radiant and convective heat loss from the ground, delaying the cooling
of surfaces of the lower canopy, and thereby subsequently delays dew formation (Batzer et al., 2008). The
overall result was that, dew deposition occurred earlier in the upper canopy than in the lower canopy.
Shorter dew events in the lower canopy level were a result of late dew onset as all the canopy positions
dried almost at the same time.
When examining both dew and rainy days, there was a significant effect of canopy position on mean
LWD. The differences in LWD variability are associated not only with weather conditions but also the
plant structures as well as the planting system, crop age and crop management (Sentelhas et al., 2005).
According to Monteith and Unsworth (1990), the LWD inside the crop canopy can be longer or shorter
than the top depending on the crop structural characteristics and consequently on its microclimate. For
example, in particular the trichomes could act as condensation points preventing dew reaching the leaf
surface, which would appear as dry to an observer. In this study, the LWD also showed spatial variability
within a citrus canopy. The daily mean LWD between the upper and lower was about 2 h similar to
results for apple trees (Sentelhas et al., 2005; Batzer et al., 2008; Wittich, 1995). Generally citrus and
apple trees have a similar shape of canopy which is characterized by upper canopy which has
unobstructed exposure to the sky and is generally the first to exhibit wetness during both dew and rain
events. On the other hand, LWD spatial variability is expected to be different for other canopies. For
example, LWD in coffee plants lower was 1.5 h longer than the top (Sentelhas et al., 2005; Santos et al.,
2008). The reason for this is that the conical shape of the coffee plants exposes leaves at all the levels to
the sky and promotes the beginning of wetness almost immediately.
These findings emphasize it is not only the weather parameters that affect LWD but also by plant
structure and height which affect the microclimate. It can therefore be concluded that the citrus canopy in
Stellenbosch showed spatial variability in LWD and this variable was not only affected by weather
conditions but also by canopy characteristics such as plant height, leaf exposition and leaf area index,
whose interaction determines the microclimate These findings point to the importance of taking
cognizance of the spatial heterogeneity of LWD in citrus, if measurements are required for disease-
warning systems. The understanding of LWD variability is crucial as it can help to improve the
performance of the disease warning systems. Since factors such as arrangement of plants, crop age and
crop management practices can affect the crop-climate microclimate, it is possible the pattern of spatial
variability of LWD in citrus can change as citrus trees grow old and bigger and if crop management
practices also change. Griffiths (1978) suggested that during the daylight hours, the added vertical
currents of the thermals can cause an almost independent cell (between plants if there is space between
them) to develop and at ground level the air may flow at 180o to that of the free air above the trees. This
wind flow could promote a drying process that starts in the top canopy followed by the bottom and finally
the middle layer. As micromet measurements were not performed between the citrus rows, this cannot be
conclusive and would have to be a recommendation for a future micromet study.
Page 63
ISBN 978-967-10840-4-5
Proc. Int. Conf. Plt. Phy. 2014
First Published, 2015
57
Since the daily LWD was longest in the upper citrus canopy, this canopy level should be considered as
the as a standard for measurements considering its use in diseases-warning systems in citrus. Moreover,
visual observations of wetness in the upper canopy of the citrus can be used as calibration indicators of
wetness for the lower canopy. The longer the LWD duration, the more susceptible the citrus would be to
diseases that require a longer wetness period to infect a leaf somewhere in the canopy (Hahn, 2009). The
mean average LWD was about 10 h, and so the citrus in Stellenbosch could be more susceptible to
pathogens that require a minimum of at least 10 h to infect the citrus plants assuming other weather
conditions for their development were favourable (Vincent & Garcia-Jimenez, 2008).
Conclusions
It can be concluded that both Decagon and unpainted Campbell sensors placed in the upper canopy level
proved to be good estimators of leaf wetness duration, although they differ in response to evaporation and
drying cycles. However, the sensors placed in the lower canopy provided a poor representation of the leaf
wetness, so they should not be used as input into disease warning systems.
References
Batzer, J.C., Gleason, M.L., Taylor, S.E., Koehler, K.J. and Montero, J.E.B.A. 2008. Spatial
heterogeneity of leaf wetness duration in apple trees and its influence on performance of a
warning system for sooty blotch and flyspeck. Plant Disease 92: 164-170.
Dalla Marta, A., Martinelli L. and Orlandini, S. 2008. Leaf wetness spatial variability within a grapevine
canopy. American Journal of Enology and Viticulture 59 (1): 78-82.
Gleason, M.L., Duttweiler, K. B., Batzer, J.C., Taylor, S.E., Sentelhas, P.C., Monteiro, J.E.B.A. and
Gillespie, T.J. 2008. Obtaining weather data for input to crop disease warning systems: Leaf
wetness duration as a case study. Scientia Agricola 65: 76-87.
Griffiths, J.F. 1978. Applied climatology, an introduction. 2nd
Ed. Oxford University Press.
Hahn, F. 2009. Actual pathogen detection: Sensors and algorithms - a review. Algorithms 2: 301-338.
Henshall, W.R., Beresford, R.M., Chynoweth, R.W. and Ramankutty, P. 2005. Comparing surface
wetness inside and outside grape canopy for region-wide assessment of plant disease risk. New
Zealand Plant Protection 58: 80-83.
Jacobs, A.F.G. and Nieveen, J.P. 1995. Formation of dew and the drying process within crop canopies.
Meteorological Applications 2: 249-256.
Kudinha, M.T. 2014. Leaf wetness duration measurements in a citrus canopy. PhD, University of the Free
State, Bloemfontein, South Africa.
Monteith, J.L. and Unsworth, M.H. 1990. Principles of Environmental Physics. Edward Arnold. London,
England, pp 21.
Santillàn-Nūñez 2009. Spatial variability of leaf wetness duration within a citrus canopy. MSc Thesis,
University of Florida, USA.
Santos, E.A., Sentelhas, P.C., Pezzopane, J.M., Angelocci, R. and Monteiro, J.E.B.A. 2008. Spatial
variability of leaf of leaf wetness duration in cotton, coffee and banana crop canopies, Scientia
Agricola 65: 18-25.
Sentelhas, P.C., Dalla Marta, A., Gillespie, T.J., Orlandini, S., Santos, E.A., Gillespie, T.J. and Gleason,
M.L. 2007. Suitability of relative humidity as an estimator of leaf wetness duration. Agricultural
and Forest Meteorology 148: 392-400.
Sentelhas, P.C., Gillespie, T.J., Batzer, J.C., Gleason, M.L., Monteiro, J.E.B.A., Pezzopane, J.R. and
Pedro, M.J. 2005. Spatial variability of leaf wetness duration in different crop canopies.
International Journal of Biometeorology 49: 363-370.
Timmer, L.W. and Zitko, S.E. 1996. Evaluation of a model for prediction of post-bloom fruit drop of
citrus. Plant Disease 80: 380-383.
Page 64
ISBN 978-967-10840-4-5
Proc. Int. Conf. Plt. Phy. 2014
First Published, 2015
58
Vincent, A. and Garcia-Jimenez, J. 2008. Risk of establishment of non-indigenous diseases of citrus fruit
and foliage in Spain: An approach using meteorological databases and tree canopy climate data.
Phytoparasitology 36(1): 7-19.
Wittich, K.P. 1995. Some remarks on dew duration on top of an orchard. Agricultural and Forest
Meteorology 72: 167-180.
Page 65
ISBN 978-967-10840-4-5
Proc. Int. Conf. Plt. Phy. 2014
First Published, 2015
59
Antiodixant Defence System in Iron Deficient Groundnut Plants
Mann, A.* and Singh Amrit, L.
ICAR-Directorate of Groundnut Research, Junagadh 362001 Gujarat, India.
*E-mail: [email protected]
Introduction
Iron is one of the essential micro-nutrients required by the plants. It plays an important role in the
synthesis of chlorophyll, carbohydrate production, cell-respiration, chemical reduction of nitrate, sulphate
and N assimilation, component of cytochrome oxidase, ferredoxin protein and several enzyme systems.
Iron deficiency symptoms appear on younger leaves indicating yellowish inter-veinal areas of leaves
(commonly referred to as iron chlorosis). In general, plants are prone to iron deficiency in alkaline,
calcareous soils, coarse textured soils, eroded soils, low organic matter soils and cold weathered areas
soils except flooded rice field soils. In India more than one-third of the soil is calcareous and spread
mostly in the low rainfall areas of the western (Gujarat, Maharashtra, Rajasthan and Karnatka) and central
(M.P. U.P.) parts of the country where groundnut is a major crop. Therefore iron chlorosis is causing
considerable yield reductions. The crops sensitive to iron chlorosis are groundnut, citrus, field bean,
grapes, soybean, vegetables and ornamentals.
Groundnut is grown during kharif (July-October) as well as during rabi-summer (Feb-May) seasons. In
calcerous soils of Saurashtra, Gujarat more than 60% groundnut fileds showed chlorosis during rabi-
summer season compared with less than 20% during kharif season. During Kharif, groundnut crop is
grown as rainfed while during rabi-summer season crop, most of the farmers give frequent irrigation
mainly due to the high evapo-transpiration demand of the crop. As a result, majority of the groundnut
fields show chlorosis and remain chlorotic throughout the cropping season. Plant Fe deficiency has
economic significance because crop quality and yields can be severely compromised and the use of
expensive corrective methods is often required (Alvare-Fernandez et al., 2004). Despite the ubiquitous
presence of Fe in the earth’s crust, the low solubility of Fe compounds in many soils prevents plant Fe
uptake and induces development of Fe deficiency symptoms. Crop genotypes differ greatly in their
response to iron availability (iron stress) in the soil and have been designated as iron-inefficient
(susceptible to iron chlorosis) and iron-efficient cultivars (Brown and Jolley, 1989; Singh and Chaudhari,
1993). Iron efficient genotypes have already been identified for many crop plants, although reports on a
limited number of groundnut genotypes are available, an extensive and systematic investigation has not
been undertaken for the identification of genotypes tolerant to lime induced iron chlorosis for use in
breeding programmes.
A deficiency in mineral nutrients is generally not considered as a stress factor for plants. In this context,
the study of Fe deficiency is particularly appealing. First, Fe deficiency is a worldwide problem,
enormously detrimental to plant production. Secondly, Fe is a transition metal of pivotal importance in
reactions involving active oxygen (Halliwell and Gutteridge, 1989) and a constituent of antioxidant
enzymes such as catalase, peroxidases and SOD. On the other hand, there is little information about the
relationship between iron-deficiency and the onset of oxidative stress status (Iturbe-Ormaetxe et al., 1995)
despite both the world-wide problems represented by scarce iron bioavailability in the soil and the well
known double role which iron plays within the cell metabolism. Thus, in this work we have investigated
effect of Fe deficiency on oxidative stress in groundnut plants. In view of this, the present research
activity was planned to study the correlation between Fe and enzyme activities in groundnut (Arachis
hypogea) by comparing the antioxidant enzymes of Fe-sufficient (Fe+) and Fe-deficient (Fe-) leaves.
Page 66
ISBN 978-967-10840-4-5
Proc. Int. Conf. Plt. Phy. 2014
First Published, 2015
60
Materials and Methods
Plant materials and treatments
Eight Fe-efficient and eight Fe-inefficient groundnut genotypes, as listed in Table 1, were sown in twelve
nutrient blocks of size 4x5m each in a randomized block design (RBD) with two replicates. In each
replicate 60 plants of each genotype were grown in adjacent rows each 5 m long. The row to row and seed
to seed spacing were 45 cm and 8 cm respectively with Fe-efficient and inefficient genotypes in separate
nutrient blocks. The plants were supplied with iron free nutrient solution at required intervals. At the
vegetative stage, 20–25 d after sowing, Fe was added in the form of nutrient solution with FeSO4 through
rooting medium. The treatments included T1 as control where no nutrients were applied; T2 was nutrient
supply with Fe source (Fe+) and T3 nutrient supply without Fe source (Fe-). The third mature leaf from
top was taken for sampling after three days of iron treatments.
Table 1. List of groundnut genotypes. Sr No Fe inefficient Sr No. Fe efficient
1 NRCG 7472 9 ICGV 86590
2 NRCG 162 10 ICGV 86031
3 CO2 11 CSMG 9510
4 NRCG 7599 12 GG 7
5 TIRUPATI 4 13 GIRNAR 2
6 MH 1 14 CSMG 84-1
7 JL 220 15 ICGV 000348
8 VRI 3 16 KADIRI 9
Enzyme extraction: Fresh leaf samples from control and treated plants were ground with liquid nitrogen,
and suspended in 0.1 M phosphate buffer, pH 7.5 containing 0.5 mM EDTA. The Brie was passed
through four layers of cheese cloth and the filtrate was centrifuged at 15000 rpm for 20 min at 4°C and
resulting supernatant was used for enzyme assays. Then respective enzyme assays were performed
according to the following methods:
Peroxidase (EC 1.11.1.7): The enzyme activity was estimated by the method of Bergmeyer (1974). To
begin with enzyme assay, the reaction mixture containing 0.5 mL enzyme extract, 100 mM phosphate
buffer, pH 6.1, 12 mM H2O2 and 96 mM guaiacol was mixed. Final volume was made up to 3.0 ml with
distilled water. Absorbance due to formation of tetra-guaiacol was recorded at 470 nm. The enzyme
activity was expressed as units min–1
mg–1
protein.
Catalase (EC 1.11.1.6): Catalase activity was estimated by the UV method of Aebi (1983). The reaction
mixture contained 50 μL enzyme extract, 12.5 mM H2O2 and 50 mM potassium phosphate buffer.
Decrease in absorbance was recorded at 240 nm for 30s. The enzyme activity was expressed as μ moles
H2O2 decomposed min-1
mg-1
protein by using the H2O2 extinction coefficient 36 μM-1
cm-1
.
Superoxide dismutase (EC 1.15.1.1): The activity of superoxide dismutase was estimated by the method
of Giannopolitis and Ries (1977). The reaction mixture contained 0, 0.2, 0.3, 0.5 and 1.0 mL enzyme
extract in different sets. To each set, 200 mM methionine, 2.25 mM nitroblue tetrazolium, 3 mM EDTA
and 1.5 M Na2CO3 were added. Total reaction volume was brought to 3 mL adjusting the pH to 10.2. At
the end, 2 μM riboflavin was added. The tubes were shaken and placed 30 cm from the light source
consisting of two 15-W fluorescent lamps. The reaction was allowed to run for 15 min and then stopped
by switching off the lights. The tubes were immediately covered with black cloth. The absorbance was
recorded at 560 nm. A non-irradiated reaction mixture which did not develop a colour, served as control.
Page 67
ISBN 978-967-10840-4-5
Proc. Int. Conf. Plt. Phy. 2014
First Published, 2015
61
However, in the presence of SOD, the reaction was inhibited and the amount of inhibition was used to
quantify the enzyme. LogA560 was plotted as a function of volume of enzyme extract used in the reaction
mixture. From the resultant graph, the volume of enzyme extract corresponding to 50 % inhibition of the
photochemical reaction was obtained and considered as one enzyme unit. The enzyme activity was
expressed as units min-1
mg-1
protein.
Glutathione reductase (EC 1.11.1.9): Glutathione reductase activity was estimated by the method of
Goldberg and Spooner (1983). To 0.1 mL enzyme extract, 200 mM K-phosphate buffer (pH 7.5), 0.015
mM EDTA and 20 mM oxidised glutathione were added. After 5 min, 2.0 mM NADH was added and
mixed thoroughly. The absorbance was recorded at 412 nm at intervals of 5 s. The enzyme activity was
expressed as nmole NADH oxidized min-1
mg-1
protein.
Results and Discussion
In leaves supplied with iron source, the catalase and peroxidase activities were higher which decreased by
almost 50% with elimination of Fe from nutrients (Fe-), whereas the effect on glutathione reductase was
not significant. On the other hand, superoxide dismutase activity was increased by 20-35 % among
different genotypes under Fe deficiency in Fe-inefficient genotypes. The genotypes e.g. NRCG 162,
MH1, VRI3 etc, which are unable to utilize the available iron efficiently(Fe-inefficient) are having less
activities of catalase, peroxidase in the absence of Fe whereas higher activity in presence of Fe. From the
results, it is clear that the reactive oxygen scavenging (ROS) enzyme activities are less in the inefficient
genotypes showing that the plants are lacking iron and thus showing Fe deficiency symptoms.
Figure 1. The activities of superoxide dismutase, catalase, peroxidase and glutathione reductase in Fe-
efficient and inefficient groundnut (A. hypogea) genotypes in presence (Fe+) and in absence of
ion (Fe-).
Catalase activity
Peroxidase activity GR activity
Page 68
ISBN 978-967-10840-4-5
Proc. Int. Conf. Plt. Phy. 2014
First Published, 2015
62
SOD is a major scavenger of O2-
and its enzymatic action results in the formation of H2O2 and O2.
Peroxidase decomposes H2O2, by oxidation of co-substrates whereas catalase breaks down H2O2 into
water and molecular oxygen (Mittler, 2002). The capacity to scavenge ROS and to reduce their damaging
effects on macromolecules appears to represent an important stress tolerance trait. In the present
investigation, increased SOD activity following iron deficiency leads to increased H2O2 production but on
the other hand, the decreased capacity to detoxify the enhanced H2O2 may be due to unsuccessful
activation or reduced production of heme containing antioxidant enzymes like peroxidase and catalase. As
an abiotic stress for plants, iron deficiency was shown to affect the expression and the activity of certain
peroxidase isoenzymes and induces secondary oxidative stress in dicotyledonous species (Ranieri et al.,
2001). Zaharieva et al., (2004) found in sugar beet roots that iron deficiency resulted in the decreased
activity of APX and increased content of GSH. The activities of several antioxidant enzymes were greater
than the controls in Mg-deficient bean leaves (Cakmak and Marschner, 1992) and Mn-deficient needles of
Norway spruce trees which may reflect a response of plants to increased free radical production. It has
been suggested that plants exposed to iron deficiency may be more sensitive to oxidative stress because
iron is a constituent of enzymes associated with the cellular antioxidant system such as APX, CAT,
peroxidase, and Fe-SOD (Kumar et al., 2010).
The relationship between decreased iron availability in the nutrient media and the possible onset of
oxidative stress is becoming more evident. The decrease in activity of catalase and peroxidase may also
be due to the fact that these two are heme containing enzymes and their activities are dependent on Fe.
Thus the changes in activities of antioxidant enzymes are due to oxidative stress induced by Fe deficiency
suggesting that groundnut plants come under Fe stress affecting their growth.
Conclusions
The results of the present study clearly showed that there were differential genotypic variations in
activities of scavenging enzymes in groundnut cultivars grown under different iron nutrient conditions.
The groundnut plants which were moderately tolerant to iron deficiency might have active ROS
scavenging system, in addition to other tolerance mechanisms, to cope with stress. Therefore, plants with
the ability to scavenge and/or control the level of cellular ROS may be useful in future to withstand
nutrient deficiency conditions.
References
Aebi, H. 1983. Catalase. In: Bergmies, H, (ed.), Methods of Enzyme Analysis. Verlag Chemie, Wenhein.
Pp 273-277.
Alvarez-Fernández, A., García-Laviña, P., Fidalgo, J., Abadía, J. and Abadía, A. 2004. Foliar fertilization
to control iron chlorosis in pear (Pyruscommunis L.) trees. Plant and Soil 262: 5-15.
Bergmeyer, H.U. 1974. Methods of Enzymatic Analysis. vol II, Academic Press, New York.
Brown, J.C. and Jolley, V.D. 1989. Strategy I and Strategy II mechanisms affecting iron availability to
plants may be established too narrow or limited. Journal of Plant Nutrition 11:1077-1097.
Cakmak, I. and Marschner, H. 1992. Magnesium deficiency and high light intensity enhance activities of
superoxide dismutase, ascorbate peroxidase and glutathione reductase in bean leaves. Plant
Physiology 98: 1222-1227.
Giannopolitis, C.N. and Ries, S.K. 1977. Superoxide dismutase I. Occurrence in higher plants. Plant
Physiology 59: 309-314.
Goldberg, D.M. and Spooner, R.J. 1983. Glutathione reductase. In: Bergmies, H. (ed.), Methods of
Enzyme Analysis. vol. 3, Pp 258-265.
Halliwell, B. and Gutteridge, J.M.C. 1989. Free radicals in biology and medicine. 2nd
edition. Oxford:
Oxford University Press.
Page 69
ISBN 978-967-10840-4-5
Proc. Int. Conf. Plt. Phy. 2014
First Published, 2015
63
Iturbe-Ormaetxe, I., Moran, J.F., Arreses-Igor, C., Gogorcena, Y., Klucas, R.V. and Becana, M. 1995.
Activated oxygen and antioxidant defences in iron-deficient pea plants. Plant Cell and Environment
18: 421-429.
Kumar, P., Tewari, R.K. and Sharma, P.N. 2010. Sodium nitroprusside-mediated alleviation of iron
deficiency and modulation of antioxidant responses in maize plants. AoB Plants. doi: 10.1093/aobpla/plq002.
Mittler, R. 2002. Oxidative stress, antioxidants and stress tolerance. Trends in Plant Science 7: 405-410.
Ranieri, A., Castagna, A., Baldan, B. and Soldatini, G.F. 2001. Iron deficiency differently affects
peroxidase isoforms in sunflower. Journal of Experimental Botany 52(354): 25-35.
Singh, A.L. and Chaudhari, V. 1993. Screening of groundnut germplasm collection and selection of
genotypes tolerant of lime-induced iron' chlorosis. Journal of Agricultural Science. Cambridge.121:
1-7.
Zaharieva, T., Gogorcena, Y. and Abadía, J. 2004. Dynamics of metabolic responses to iron deficiency in
sugar beet roots. Plant Science 166: 1045-1050.
Page 70
ISBN 978-967-10840-4-5
Proc. Int. Conf. Plt. Phy. 2014
First Published, 2015
64
The Contribution of Plant Community towards Slope Protection
Nurul Izzaty, A.Z.*, Normaniza, O. and Rozainah, M.Z.
Institute of Biological Sciences, Faculty of Science, University of Malaya (UM), 50603 Kuala Lumpur,
Malaysia.
*E-mail: [email protected]
Introduction
Plant diversity might refer to as variety of plant species community existed in an ecosystem. Plant
diversity can be measured in different ways, but usually expressed as species richness at a given area
(Ihaddaden et. al., 2013). As the slope being cut for urban development due to increasing in population
growth, the potential of reducing in variety of plant species was high. Consequently, increased the risk of
soil erosion and from time over time might lead to landslide.
Variety of plant community efficiently helps in mitigating the soil erosion in two ways: active and passive
protection (Rey et. al., 2004) such as allow soil fixation by the root systems (Gyssels and Poesen, 2003)
and increase the quantity of eroded sediments being trapped within the catchment due to the aerial part
(Abu-Zreig, 2001) of vegetation, respectively. It is anticipated that plant diversity (Pohl et al., 2009;
Genet et. al., 2010) and good pioneer (Normaniza and Barakbah, 2009) were amongst the crucial aspects
to enhance slope stability. In addition, higher in plant diversity would also greater the root systems such
as root length density (RLD) (Normaniza and Barakbah, 2006) and its distribution, thus, could reduce the
soil water content (SWC) on slope and saturation level (STL). Hence, the aim of this study was to observe
the influence of different plant coverage with respect to plant diversity.
Materials and Methods
Experimental set-up
The experimental plots of 5 m x 5 m for each were set up with four different coverages; 0% (Treatment
A), 10% (Treatment B), 50% (Treatment C) and 100% (Treatment D) in three replications at Guthrie
Corridor Expressway, Sungai Buloh, Selangor. The slope coverage had been chosen by visual estimation,
and the plant coverage represented the plant diversity as resulted from the preliminary analysis conducted
(Figure 1). However, treatment D was not included in the analysis because during the survey conducted,
most of 100% coverage slope was dominated by fern and low diversity. Therefore, treatment D was
regarded as stable plot as they undergo succession process to reach the climax stage of slope community
which slightly different from the forest community. According to Wang et. al. (2006), the plant diversity
might be decreasing when the dominance plant species overwhelmed others and might be increasing later
when the community developed into its zonal climax.
Page 71
ISBN 978-967-10840-4-5
Proc. Int. Conf. Plt. Phy. 2014
First Published, 2015
65
Figure 1. The relationship between plant diversity and plant coverage (treatment D not included).
Ecological experiment
The plant species in all treatment plots were identified (Wee, 2005; Ahmad Azly, 1997) and recorded.
Plant cover method has been used to measure the relative abundance based on the amount of space
covered. This method was practically used for small understory plant such as ferns, shrubs and grass.
Instead of counting the number of individual species, each species was assigned to a percent cover class
based on a visual estimation of how much they occupied the sample plot. To measure the percent cover,
modified Braun-Blanquet cover class scale where >75% cover = 6, 50-75% = 5, 25-50% = 4, 5-25% = 3,
1-5% = 2, and individual cover = 1 (Shono et. al., 2006) has been used. The plant diversity at each
treatment, was evaluated by using Shannon-Weiner Index (1). The plant density and plant frequency have
been determined in order to measure the Importance Value Index (IVI) of each species (2). All parameters
were taken once in three months for 12 months of observation.
Shannon-Weiner Index (1)
Pi = relative importance value of species i (IVi/IV)
IVi = importance value of species i
IV = sum of importance value for all species
Importance Value Index (IVI) (2)
RC = Relative coverage
RD = Relative density
RF = Relative frequency
R = 0.89
Page 72
ISBN 978-967-10840-4-5
Proc. Int. Conf. Plt. Phy. 2014
First Published, 2015
66
Soil hydrological properties
The soil water profile such as soil water content (SWC), soil field capacity (SFC) and saturation level
(SL) were measured. Cylindrical soil cores (11 cm in diameter; 45 cm of soil depth) were sampled by
using a soil coring machine (Eijelkamp Agrisearch Equipment, Model Cobra, The Netherlands).
(1) Soil Water Content (SWC)
The soil water content (SWC) was determined by oven-drying the soil sample about 85oC in the
oven to obtain dry weight (DW). Before that, the fresh weight (FW) of soil sample was taken.
The soil water content was calculated by using a formula:
[(FW-DW)/FW] x 100]
(2) Soil Field Capacity (SFC)
The soil field capacity was determined by pouring excess water into a container filled with soil so
that the soil was supersaturated. The excess water was then drained out through small holes at the
bottom of the container. Once the water stop dripping, the saturated soil was weighed (SW) and
oven dried at 85oC to obtain a constant weight (DW). SFC was calculated by using a formula:
[(SW-DW)/SW] x 100]
(3) Soil Saturation level (STL)
Saturation level was the ratio of Soil Water Content (SWC) and Soil Field Capacity (SFC). If the
value of SWC is less than SFC, the risk for landslide is low and vice versa. This measurement
was important to determine the risk of slope failure.
[(SWC/SFC)] x 100]
Results and Discussion
Ecological experiment
Overall, there were 16 plant species found at the study sites. For 12 months of observation, distribution of
species showed that Dicranopteris linearis, Lycopodium sp. and Melastoma malabathricum were present
in all treatments (Table 1). In terms of species richness, treatment A and D recorded the lowest with six
species, whilst treatment C was the highest. Species richness of treatment B was nine species. In addition,
it has been recorded that the species richness increased from initial observation by 20%, 29%, 25% and
50% increment in treatment A, B, C and D, respectively.
Page 73
ISBN 978-967-10840-4-5
Proc. Int. Conf. Plt. Phy. 2014
First Published, 2015
67
Table 1. Plant species, species richness (initial and 12 months observation) and species richness increment
during 12 months of observation.
There was a significant interaction in mean for plant diversity between treatment A, B, C and D, F(3,16)
= 20.89, p < .05 (Table 2). Treatment C was recorded as the most diverse following Shannon-Weiner
Index amongst other treatments which was 1.9 followed by 1.7, 1.5, and 1.2 for treatment B, A and D,
respectively (Figure 2), indicating higher slope coverage contributed to variety of plant community in the
ecosystem. However, treatment D with the highest coverage amongst other treatments had the least
diverse in plant diversity. From the observation, treatment D was dominated by fern, Dicranopteris
linearis. The allelophatic effect (the ability of an organism to produce biochemical that can influence the
survival and growth of other species) of this type of fern supress the growth of other plant species. In
addition, the mean plant diversity between initial and 12 months of observation was significant, F(1,16) =
5.22, p < .05 (Table 2). The plant diversity in treatment A, B, C and D has been increased by 5.8%, 8.4%,
14% and 11%, respectively, from the initial observation. This result indicates that the higher the plant
diversity, the higher the plant diversity increment.
Plot Plant species (initial) Number of species
(initial - 0 month)
Number of species
(12 months) Increment (%)
A Dicranopteris linearis (fern) 5 6 20
Lycopodium sp. (fern)
Lygodium flexuosum (fern)
Melastoma malabathricum (shrub)
Grass A
Ageratum conyzoides (weed)
B Dicranopteris linearis (fern) 7 9 29
Lycopodium sp. (fern)
Nephrolepis biserata (fern)
Melastoma malabathricum (shrub)
Legume creepers (legumes)
Grass B
Ageratum conyzoides (weed)
Acacia mangium (legumes)
Macaranga sp. (tree)
C Dicranopteris linearis (fern) 8 10 25
Lycopodium sp. (fern)
Legume creepers (legumes)
Stenochlaena palustris (fern)
Asystasia sp. (weed)
Nephrolepis biserata (fern)
Lygodium flexuosum (fern)
Melastoma malabathricum (shrub)
Imperata cylindrica (grass)
Ageratum conyzoides (weed)
D Dicranopteris linearis (fern) 4 6 50
Lycopodium sp. (fern)
Nephentes sp.
Melastoma malabathricum (shrub)
Species X
Imperata cylindrica (grass)
Page 74
ISBN 978-967-10840-4-5
Proc. Int. Conf. Plt. Phy. 2014
First Published, 2015
68
Table 2. Two-way ANOVA between treatment and months of observation (0 and 12 months) on plant
diversity. Tests of Between-Subjects Effects
Dependent Variable: PlantDiversity
Source Type III Sum of Squares df Mean Square F Sig. Partial Eta
Squared
Corrected Model 1.550a 7 .221 9.827 .000 .811
Intercept 52.333 1 52.333 2322.044 .000 .993
Treatment 1.412 3 .471 20.887 .000 .797
Month .118 1 .118 5.218 .036 .246
Treatment * Month .021 3 .007 .303 .823 .054
Error .361 16 .023
Total 54.244 24
Corrected Total 1.911 23
a. R Squared = .811 (Adjusted R Squared = .729)
Figure 2. The plant diversity during initial and 12 months of observation.
Figure 3 showed the best three plant species that grow in the treatments based on their importance value
index (IVI). D. linearis was a dominant plant species that present in all treatments with IVI value 1.20,
0.91, 1.18 and 1.78 in treatment A, B, C and D, respectively. D. linearis was a pioneer species which
could grow under harsh condition on slope such as lack of water and nutrient availability. Furthermore, as
it presents in highway cutslope, D. linearis contributed in reducing the risk of soil erosion surface runoff
on slope by its rootmat network system (Shono, 2006). The highest IVI value of D. linearis in treatment
D explained the least diversity at the plot. D. linearis commonly forms dense thicket abundantly along the
highway, therefore, supress the growth of other plant species, resulting in lower diversity in treatment D.
Page 75
ISBN 978-967-10840-4-5
Proc. Int. Conf. Plt. Phy. 2014
First Published, 2015
69
Figure 3. The importance value index (IVI) of the plant species with higher IVI value at treatment A, B, C
and D.
Soil hydrological properties
Higher in plant diversity would greater the root systems such as root length density (RLD) (Normaniza
and Barakbah, 2006) and root distribution, hence the potential of water being absorbed by roots will be
higher. The absorbed water transported by the negative pressure gradient to the leaf before transpired out
to the atmosphere. This pathway of water from soil to the atmosphere via plants was called soil-plant-
atmosphere continuum (SPAC) (Romano et. al., 2012). Throughout 12 months of observation, the soil
saturation level (STL) in treatment C showed the lowest value which is 3% (Figure 4). Higher in plant
diversity was assisted in reducing the STL of slope. It was observed that the plant diversity in treatment A
was much lower compared to treatment B by 18%. The reason behind this was, low diversity in treatment
A had caused the evaporation occurred directly from soil, slightly amount of water being absorbed by
plant, thus reduced the STL, yet increases the risk of soil erosion. Besides that, the shallow root system of
fern in treatment B which has the lower water absorption capacity caused the STL to be higher than
treatment A. Even though the STL in treatment D had greatly increased from initial observation, it had
been observed that, STL in all treatments were < 50%. Therefore, it indicates that the slope soil in all
treatments were at unsaturated level. However, despite of the inconsistent result, interestingly, an inverse
relationship between plant diversity and soil saturation level (R = -0.72) approved that higher in plant
diversity had reduced the soil saturation level of slope (Figure 5).
Page 76
ISBN 978-967-10840-4-5
Proc. Int. Conf. Plt. Phy. 2014
First Published, 2015
70
Figure 4. The soil saturation level during initial and 12 months of observation.
Figure 5. The relationship between plant diversity and soil saturation level.
Conclusions
In conclusion, treatment C promoted in higher of plant community compared to treatment A, B and D.
Even though treatment D was dominated by D. linearis, it helps in protecting the slope by its rootmat
network system which would reduce the soil erosion and surface runoff. The higher the plant community
in the treatment, the lower the soil saturation level, thus enhance the slope stability.
References
Abu-Zreig, M. 2001. Factors affecting sediment trapping in vegetated filter strips: simulation study using
VFSMOD. Hydrology Process 15(18): 1477-1488.
Ahmad Azly, M.Y. 1988. Rumpai Panduan Berilustrasi. Kuala Lumpur: Dewan Bahasa dan Pustaka.
Genet, M., Stokes, A., Fourcaud, T. and Norris, J.E. 2010. The influence of plant diversity on slope
stability in a moist evergreen deciduous forest. Ecological Engineering 36: 265-275.
Gyssels, G. and Poesen, J. 2003. The importance of plant root characteristics in controlling concentrated
flow erosion rates. Earth Surface Process and Landform 28(4): 371-384.
Ihaddaden, A., Velazquez, E., Maria, J., Benayas, R. and Hanifi, H.K. 2013. Climate and vegetation
structure determine plant diversity in Quercus ilex woodlands along an aridity and human-use
gradient in Northern Algeria. Flora 208: 268-284.
Page 77
ISBN 978-967-10840-4-5
Proc. Int. Conf. Plt. Phy. 2014
First Published, 2015
71
Normaniza, O. and Barakbah, S.S. 2006. Parameters to study slope stability – soil water and root profiles.
Ecological Engineering 28: 90-95.
Normaniza, O., Faizal, H.A. and Barakbah, S.S. 2009. The role of pioneer vegetations in accelerating the
process of natural succession. American Journal of Environmental Science 5(1): 7-15.
Pohl, M., Alig, D., Korner, C. and Rixen, C. 2009. Higher plant density enhances soil stability in
disturbed alpine ecosystem. Plant Soil 324: 91-102.
Rey, F., Ballais, J.L., Marre, A. and Roviera, G. 2004. Rôle de la vègètation dans la protection contre l
èrosion hydrique de surface. Comptes Rendus Geoscience 336(11): 991-998.
Romano, N., Angulo-Jaramillo, R., Javaux, M. and van der Ploeg, M.J. 2012. Interweaving monitoring
activities and model development towards enhancing knowledge of the soil-plant atmosphere
continuum. Retrieved September 7, 2012 from
https://www.soils.org/publications/vzj/pdfs/11/3/vzj2012.0122
Shono, K., Davies, S.J. and Kheng, C.Y. 2006. Regeneration of native plant species in restored forests on
degraded lands in Singapore. Forest Ecology and Management 237(1): 574-582.
Wang, D.P., Ji, S.Y., Chen, F.P., Xing, F.W. and Peng, S.L. 2006. Diversity and relationship with
succession of naturally regenerated southern subtropical forests in Shenzhen, China and its
comparison with the zonal climax of Hong Kong. Forest Ecology and Management 222: 384-390.
Wee, Y.C. 2005. Fern of the tropics. (Rev. ed.) Singapore: Times Edition Marshall Cavendish.
Page 78
ISBN 978-967-10840-4-5
Proc. Int. Conf. Plt. Phy. 2014
First Published, 2015
72
Evaluation of Rice Genotypes under Drought and Optimum Environmental
Conditions
Suwarno, P.M., Wirnas, D.* and Junaedi, A.
Department of Agronomy and Horticulture, Faculty of Horticulture, Bogor Agricultural University, Jl.
Meranti Kampus IPB Dramaga, Bogor 16680.
*E-mail: [email protected]
Introduction
Rice production in Indonesia is almost entirely dependent on rice cultivation, and many obstacles
occurred such as climate change that causes disruption of water availability. Drought will cause
disruption of the metabolic processes of plants such as impaired absorption of nutrients, inhibition of cell
division and enlargement, decreased enzyme activity and stomata closure so that the growth and
development of plants become constrained (Asmara, 2011). Jumin (2002) reported about the lack of water
on the process of photosynthesis as a result of stomata closing. Water has direct and indirect
consequences on photosynthesis since crop water deficit will affect all metabolic processes in the plant
which resulted in disruption of the growth process (Pugnaire et al., 1999). Drought stress problem can be
solved in two ways, either by changing the environment in order to minimize the stress or by improving
plant genotypes that are tolerant to drought stress.
Plant breeding is a field of expertise that can be directed to create drought-resistant rice genotypes.
Tolerance to drought stress is indicated by its ability to survive and minimize yield lost at low water
potential conditions. Drought resistant rice varieties can be obtained by selection of segregated
populations derived from crosses involving drought resistant genotypes. This study aimed to understand
the phenotypic variability of 10 rice genotypes developed from crosses among two inbred varieties as
male parents and five inbred varieties as female parents.
Materials and Methods
The experiment was conducted from August to November 2012 at IPB Experimental Station Sawah Baru,
Bogor. The material consisted of ten genotypes developed from crosses among two inbred varieties,
Silugonggo and IPB-3S as male parents (referred to as “tester” thereafter) and five inbred varieties,
Mentik Wangi, IR64, Way Apoburu, Jatiluhur and Ciherang as female parents (referred to as “line”). The
F1 plants were grown in two irrigation treatments, optimum, where irrigation was applied along the
growing season, and sub-optimum, where irrigation was applied until 3 weeks after transplanting and
stopped thereafter. A Randomized Complete Block Design with 3 replications was used and the linear
model is as follows:
where, is the response variables, is the grand mean, is the effect of environment-i, is the
effect of block-k within environment-i, is the effect of genotype-j, is the interaction effect of
genotype-j and environment-i, and is the intra-block error.
Rice seeds were germinated on petri dish for three days then planted on seedling trays. After three weeks,
seeds were transplanted to plots in the screenhouse. Irrigation on a regular basis was applied on the sub-
optimum condition for only three weeks after sowing, while sufficient irrigation was applied on the
Page 79
ISBN 978-967-10840-4-5
Proc. Int. Conf. Plt. Phy. 2014
First Published, 2015
73
optimum environment. Data were collected from a random sample of five plants from each experimental
unit and the following characters were measured: plant height, number of tillers, panicle length, flag
length, number of filled grains, the number of empty grains, total grain number, grain weight per plant
and percentage of filled grains.
Results and Discussion
Analysis of variance assumes that the error was distributed normally and had homogenous variance. In
our case, this assumption seems to be met for all traits except grain weight, and therefore the log(y+0.5)
transformation was used for that trait prior to analysis.
The analysis of variance results showed that the environment factor is highly significant for all traits. The
replication within environment factor is also highly significant for all traits except plant height. More
importantly, we found that there was very strong evidence that the genotypic (entry) effects were different
for all traits except grain weight and percentage of filled grain. The entry factor was explained further by
partitioning its sum of squares into three components namely line, tester, and line x tester interaction. The
significance of the line effects is in accordance with the genotypic effect whereas the tester effects were
only significant for number of tillers, panicle length, number of empty grains and total number of grains
(Tables 1 and 2).
The genotype-by-environment interaction was not significant for all traits, except number of filled grains,
indicating that genotype ranks did not differ over environments in most cases. The significant entry
effects followed by non-significant genotype-by-environment interaction effects, as we found in most of
the traits in our study, indicated that there was a genotype that performed well in both environments.
Furthermore, the significance of line and tester effect indicated that there were parent genotypes which
have superiority to be used in parental crosses for relevant traits.
Performance evaluation of the genotypes showed that the cross combination between Mentik Wangi x
IPB-3S had the highest value of plant height, panicle length, flag leaf length, number of total grain and
number of empty grains. Jatiluhur x IPB-3S combination had the largest number of filled grains whereas
IR64 x Silugonggo had the largest number of tillers. The lowest number of empty grains and the highest
grain weight were found in Jatiluhur x Silugonggo genotype (Tables 3 and 4).
Table 1. Summary of the combined analysis of variance for plant height, number of tillers, panicle
length, flag length, and grain weight.
Source
Trait
Plant height (cm) Number of
tillers
Panicle length
(cm)
Flag length
(cm) Grain weight (g)
Env 10903.29** 100.04** 362.49** 2901.02** 41.32**
Rep(Env) 176.89 18.06** 201.09** 441.65** 22.46**
Entry 2116.60** 90.68** 199.23** 505.73** 1.82
Line 1541.27** 28.92** 123.38** 450.45** 0.78
Tester 223.56 63.66** 47.73** 16.17 0.55
Line xTester 363.32 0.13 29.90* 45.70 0.62
Entry x Env 601.06 7.80 26.51 86.63 1.14
Note: *=significant at α=5%, ** = significant at α=1%
Page 80
ISBN 978-967-10840-4-5
Proc. Int. Conf. Plt. Phy. 2014
First Published, 2015
74
Table 2. Summary of the analysis of variance for number of grains and percentage of filled grains.
Source
Trait
Number of filled
grains
Number of empty
grains
Total number of
grains
Percentage of filled
grains (%)
Env 45212.04** 7431.04** 89302.18** 5898.03**
Rep(Env) 14079.66** 7172.82** 41027.84** 9482.61**
Entry 7987.83** 22609.54** 38809.24** 932.33
Line 6296.15* 10250.02** 18427.32** 550.83
Tester 169.52 10922.59** 13813.56** 358.94
Line xTester 1359.42 1408.47 4198.12 65.46
Entry x Env 4803.61* 4257.31 8038.52 1062.98
Note: *=significant at α=5%, ** = significant at α=1%
Table 3. Entry means for plant height, number of tillers, panicle length, flag length, and grain weight.
Entry
Trait
Plant height
(cm)
Number of
tillers
Panicle
length (cm)
Flag length
(cm)
Grain
weight (g)
Mentik Wangi x Silugonggo 84.50bcd
7.43abc
25.04b 31.27
ab 1.60
ab
IR64 x Silugonggo 80.08cd
8.52a 20.36
e 23.58
d 1.06
c
Way Apoburu x Silugonggo 75.20d 7.95
abc 21.60
de 23.60
d 1.13
bc
Jatiluhur x Silugonggo 91.93ab
7.04bcd
23.92bc
28.56bc
1.71a
Ciherang x Silugonggo 78.08d 8.18
ab 21.37
de 23.29
d 1.49
abc
Mentik Wangi x IPB-3S 96.47a 5.10
e 27.78
a 33.40
a 1.43
abc
IR64 x IPB-3S 88.97abc
6.70cd
25.27b 28.19
bc 1.48
abc
Way Apoburu x IPB-3S 89.50abc
7.03bcd
24.01bc
28.19bc
1.49abc
Jatiluhur x IPB-3S 92.90ab
5.13e 24.28
bc 27.78
bc 1.41
abc
Ciherang x IPB-3S 79.80cd
5.80de
22.94cd
24.67cd
1.17bc
Note: Numbers in the same column followed by the same letter are not significantly different for the DMRT test at
α=5%
Table 4. Entry means for number of grains and percentage of filled grains.
Entry
Trait
Number of
filled grains
Number of
empty grains
Total number
of grains
Percentage of
filled grains (%)
Mentik Wangi x Silugonggo 55.21bc
72.88bc
128.08bcd
44.30a
IR64 x Silugonggo 51.48c 46.14
cd 97.62
d 40.93
a
Way Apoburu x Silugonggo 52.85bc
56.60bcd
109.45cd
41.80a
Jatiluhur x Silugonggo 73.00ab
34.55d 107.55
d 46.73
a
Ciherang x Silugonggo 47.33c 45.17
cd 92.50
d 41.05
a
Mentik Wangi x IPB-3S 77.08a 108.54
a 185.62
a 37.15
a
IR64 x IPB-3S 62.87abc
83.23b 146.10
bc 37.00
a
Way Apoburu x IPB-3S 61.53abc
66.98bc
128.51bcd
44.82a
Jatiluhur x IPB-3S 81.68a 76.92
b 158.59
ab 45.27
a
Ciherang x IPB-3S 48.87c 63.94
bc 112.81
cd 38.81
a
Note: Numbers in the same column followed by the same letter are not significantly different for the DMRT test at
α=5%
The experiment results from Supriyanto (2013) showed that drought stress significantly affected plant
height at 30, 60 and 90 days after planting because plants need sufficient water for its growth and
development. Drought stress also significantly affected the number of tillers, percentage of filled grains
and grain weight. Water has an important role in the translocation of nutrients from the roots throughout
the plant. Insufficiency of water will result in a decrease in the photosynthetic process that resulted in the
inhibition of plant growth and development. Tubur et al. (2012) stated that drought stress can reduce plant
Page 81
ISBN 978-967-10840-4-5
Proc. Int. Conf. Plt. Phy. 2014
First Published, 2015
75
height, number of leaves, number of tillers, panicle length, harvest index as well as increasing the
percentage of empty grains.
Genotype performance of line and tester parents was evaluated from the average value of its F1 plants,
which also indicated the general combining ability of the respective parent. Genotype Jatiluhur as a parent
line had the highest value for plant height and number of filled grains per plant. Genotype IR64 as a
parent line had the highest number of tillers whereas Mentik Wangi had the longest panicle and flag leaf,
and also the largest total number of grains (Tables 5 and 6).
Table 5. Line and tester means for plant height, number of tillers, panicle length, flag length, and grain
weight.
Entry
Trait
Plant height
(cm)
Number of
tillers
Panicle length
(cm)
Flag length
(cm)
Grain
weight (g)
Line
Mentik Wangi 90.48ab
6.27bc
26.41a 32.33
a 1.52
IR64 84.93bc
7.53a 23.04
bc 26.09
bc 1.29
Way Apoburu 83.78bc
7.40a 23.05
bc 26.36
bc 1.34
Jatiluhur 92.46a 6.00
c 24.12
b 28.14
b 1.55
Ciherang 78.94c 6.99
ab 22.16
c 23.98
c 1.33
Tester
Silugonggo 82.17 7.82a 22.55
b 26.25 1.42
IPB-3S 89.53 5.95b 24.86
a 28.45 1.40
Note: Numbers in the same column followed by the same letter are not significantly different for the DMRT test at
α=5%
Table 6. Line and tester means for number of grains and percentage of filled grains
Entry
Trait
Number of
filled grains
Number of
empty grains
Total number of
grains
Percentage of
filled grains (%)
Line
Mentik Wangi 66.14ab
90.71a 156.85
a 40.72
IR64 57.69bc
66.37b 124.06
bc 38.79
Way Apoburu 58.06bc
62.83b 120.89
bc 43.62
Jatiluhur 77.73a 57.66
b 135.39
ab 45.93
Ciherang 48.10c 54.56
b 102.66
c 39.93
Tester
Silugonggo 55.73 51.47b 107.20
b 42.99
IPB-3S 66.40 79.92a 146.33
a 40.61
Note: Numbers in the same column followed by the same letter are not significantly different for the DMRT test at
α=5%
Genotype performance of parent tester IPB-3S had the highest value for panicle length and total number
of grains. Genotype Silugonggo as another tester, had the highest value for number of tillers, grain weight
per plant and number of empty grains.
Conclusions
Genotypic effect was significant for plant height, number of tillers, panicle length, leaf length and number
of grains per panicle. In contrast, genotype-by-environment interactions were not significant for all traits
except number of filled grains. IPB-3S, Mentik Wangi and Jatiluhur exhibited better estimated
Page 82
ISBN 978-967-10840-4-5
Proc. Int. Conf. Plt. Phy. 2014
First Published, 2015
76
performance than the others in our experiment, indicating that these genotypes could be used as potential
parents in subsequent plant breeding programs.
References
Asmara, R.N., 2011. Pertumbuhan dan Hasil Sepuluh Kultivar Padi Gogo pada Kondisi Cekaman
Kekeringan dan Responnya Terhadap Pemberian Abu Sekam Program Studi Agronomi - Program
Pascasarjana, Universitas Jenderal Soedirman, Purwokwerto.
Jumin, H.B. 2002. Agroekologi Suatu Pendekatan Fisiologi. Raja Grafindo Persada. Jakarta.
Pugnaire, F.I, Serrano, L. and Pardos, J. 1999. Constrains by Water Stress on Plant Growth. In M.
Pessarakli (Ed.). Handbook of plant and crop stress. 2nd Edition. Marcell Dekker. New York.
Supriyanto, B. 2013. Influences of water stress to growth and yields of Jambu local up land rice (Oryza
sativa Linn). Jurnal Agrifor 12(1): 77-82.
Tubur, H.W., Chozin, M.A., Santosa, E. and Junaedi, A. 2012. Respon Agronomi Varietas Padi terhadap
Periode Kekeringan pada Sistem Sawah. Jurnal Agronomi Indonesia 40 (3): 167-173.
Page 83
ISBN 978-967-10840-4-5
Proc. Int. Conf. Plt. Phy. 2014
First Published, 2015
77
Response of CO2 Enrichment on Phytochemical Screening, Fatty Acid
Content and Their Antioxidant Activity on Labisia pumila var. alata
Karimi, E.* and Jaafar, H.Z.E.
*
Departments of Crop Science, Faculty of Agriculture, Universiti Putra Malaysia, 43400 UPM Serdang,
Selangor, Malaysia.
*E-mail: [email protected] ; [email protected]
Introduction
Plant secondary metabolites are rich sources of bioactive constituents used in pharmaceutical industry,
food additives, flavors, and other industrial materials. These substances are also known to play a major
role in the adaptation of plants to their environment (Bourgaud et al., 2001). Recent scientific attention
has been directed towards the cancer preventive potential for naturally occurring constituents of
antioxidant, vitamins, flavonoids and phenolic compounds that have anticarcinogenic or antioxidant
potential. Plants products are regarded as potential chemopreventive agents that act to block, reverse or
prevent the development of invasive cancers (Reddy et al., 2007).
Elicitation with CO2 enrichment has been shown to increase plant growth, development, and yield of
agricultural crops and this response is a function of CO2 concentration and duration as well as the
interaction with other environmental factors (Ibrahim et al., 2010). The prospect of improving
photosynthesis in crops through CO2 enrichment has created the interest of plant scientists for many
years. Enriching plants with high levels of CO2 has been proven to increase plant growth, morphology,
development, and yield of many crops, and this response are the functions of CO2 rate and duration of
exposure. Crops under enriched CO2 atmosphere acquire positive features with enhanced plant adaptation
and growth. The greatest advantages of CO2 enrichment is in the enhancement of leaf gas exchange
capacity, particularly under undesirable climatic conditions (Ibrahim, 2012).
Labisia pumila (Myrsinaceae), also locally known as Kacip Fatimah has been used by many generations
to induce and facilitate childbirth as well as a post-partum medicine by Malay women (Karimi et al.,
2013). The exposure of medicinal plants to high level of CO2 may give a positive response in the form of
increased of bioactive compounds and their biological activities such as anti-oxidative properties. This
study is carried out to evaluate the phytochemical screening, fatty acid and their antioxidant properties of
the leaves of Labisia pumila var. alata under different levels of CO2 enrichment.
Materials and Methods
Plant material
Three-months old L. pumila var alata were planted in soil-less medium containing coco-peat, burnt paddy
husk and well composted chicken manure in 5:5:1 (v/v) ratio in 25-cm diameter polyethylene bags.
Carbon dioxide enrichment treatment started when the seedlings reached four months of age where plants
were exposed to 400 and 1,200 μmol mol−1
CO2. Healthy and uniform seedlings in terms of leaf numbers
were selected, cleaned, separated, freeze dried and stored for further analysis.
Plant extraction
Samples were extracted using methanol solvent and the extraction techniques used were reflux method
(Crozier et al., 1997) with slight modifications.
Page 84
ISBN 978-967-10840-4-5
Proc. Int. Conf. Plt. Phy. 2014
First Published, 2015
78
Evaluation of phenolic and flavonoid compounds
The phenolic and flavonoid compounds of samples were quantitatively measured by reversed-phase high
performance liquid chromatography (HPLC) technique based on Crozier et al. (1997). The standards for
phenolic compounds were ellagic acid, salicylic acid, gallic acid, catechin, epicatechin, caffeic acid,
cinnamic acid, and resorcinol. The standard for flavonoid compounds were naringin, apigenin, rutin,
quercetin, and myricetin.
Fatty acid profiles
The total fatty acids of the leaves were extracted according to the method of Folch et al. (1975). Extracted
fatty acids were transmethylated to the fatty acid methyl esters (FAME) using KOH in methanol and
boron trifluoride (BF3). A reference standard (C4-C24 methyl esters; Sigma-Aldrich, Inc., St. Louis,
Missouri, USA), was used to determine the correction factors for the individual fatty acid composition.
The data were expressed as g/100 g of detected total fatty acids.
Antioxidant activity
DPPH free radical scavenging activity
The 1,1- diphenylpicryl-2-hydrazyl (DPPH) of the extracts were determined by the method of Gulcin et
al. (2004). α-tocopherol and vitamin C were utilized as standard antioxidants.
Nitric oxide scavenging activity
The nitric oxide (NO) scavenging activity of each plant extract was determined by the method of Tsai et
al. (2007). Vitamin C and α-tocopherol were used as controls.
Results and Discussion
HPLC and GC analysis revealed a strong influence of increased CO2 concentration on the modification of
phenolic and flavonoid profiles and fatty acid contents. HPLC analyses of phenolics and flavonoids
indicated the presence of gallic acid, pyrogallol, epicatecin, diadezin, quercetin, naringin and myricetin in
the leaves and most of these compounds have increased significantly by increasing CO2 levels from 400
to 1200 μmol mol−1
(Table 1). Beside that the proportion of leaf fatty acids such as lauruic acid,
pentadecenoic acid, stearic acid, oleic and linoleic acid were quite consistent by increasing CO2 (Table 2).
Furthermore, antioxidant activities of leaf extracts of L. pumila var. alata tested using DPPH free radicals
and nitric oxide scavenging activity showed that the antioxidant activities of the extract increased
significantly (P= 0.05) by enhancement of the CO2 ( Table 3). These observations are in agreement with
that previously reported by Ghasemzadeh et al., (2011) on two varieties of ginger (Zingiber officinale).
He indicated that total flavonoids, total phenolics and antioxidant activities increased significantly (P ≤
0.05) in all parts of the ginger varieties under elevated CO2 (800 μmol mol−1
). Lavola and Julkunen
(1994) reported that phenolic content increased in leaves and stems of Betula pendula grown under 700
μmol mol−1
CO2.
Page 85
ISBN 978-967-10840-4-5
Proc. Int. Conf. Plt. Phy. 2014
First Published, 2015
79
Table 1. Concentration of different phenolic and flavonoid compounds in the L. pumila var. alata grown
under different CO2 concentration. Phenolic and flavonoid content (µg/ml)
Leaf extract
(μmol·mol-1
)
Gallic acid Pyrogallol Epicatecin Catecin Naringin Diadezin Myricetin Quercetin
400 235.1b 206.2
b 125.2
b ND 156.4
b 85
b 182.6
b 135.9
b
1200 619.9a 395.5
a 181
a 231.2 315.2
a 133.1
a 204.7
a 227.5
a
Table 2. Fatty acid composition (%) of L. pumila var. alata grown under different CO2 concentration.
Table 3. DPPH and NO scavenging activities of leaf extraction of L. pumila var. alata under different
CO2 concentration. Antioxidant Activity Power (%)
Extract DPPH NO Scavenging
400 (μmol·mol-1
) 52.35±0.14e 48.8 ± 1.54
e
1200 (μmol·mol-1
) 56.42±1.15d 51.5 ± 0.79
d
Vitamin C 92.55 ± 2.09 b 85.41± 3.74
a
α-tocopherol 74.29 ± 1.32 c 74.29± 1.51
c
Conclusions
The manipulation of CO2 may be an effective method to increase secondary metabolites production and
enhanced biological activities such as antioxidant properties. This study revealed that the increase in
production of plant secondary metabolites in L. pumila var. alata was followed by enhancement of the
antioxidant activity (DPPH and NO scavenging) under exposure of elevated CO2.
Fatty acids 400 1200
C12:0 (Lauruic) 0.76 1.08
C14:0 (Myristic) 1.29 1.25
C15:0 (Pentadecanoic) 1.31 1.29
C15:1 (Pentadecenoic) 1.62 2.40
C16:0 (Palmitic) 24.11 21.71
C16:1 (n-9 Plamitoleic) 0.54 0.88
C17:0 (Margaric) 0.44 0.27
C17:1 (Margaroleic) 1.26 0.61
C18:0 (Stearic) 14.11 16.44
C18:1n-9 (Oleic) 27.01 20.81
C18:2n-6 (Linoleic) 16.11 16.54
C18:3n-3 (gamma-Linolenic) 11.43 16.72
TOTAL SATURATED 42.02 42.03
TOTAL MUFA 30.43 24.71
TOTAL N-6PUFA 16.11 16.54
TOTAL N-3 PUFA 11.43 16.72
Page 86
ISBN 978-967-10840-4-5
Proc. Int. Conf. Plt. Phy. 2014
First Published, 2015
80
References
Bourgaud, F., Gravot, A., Milesi, S. and Gontier, E. 2001. Production of plant secondary metabolites: a
historical perspective. Plant Science 161(5): 839-851.
Crozier, A., Jensen, E., Lean, M.E.J. and McDonald, M.S. 1997. Quantitative analysis of flavonoids by
reversed-phase high-performance liquid chromatography. Journal of Chromatography 761: 315-
321.
Folch, J., Lees, M. and Sloane Stanley, G.H. 1975. A simple method for the isolation and purification of
total lipids from animal tissues. Journal of Biological Chemistry 1: 497-509.
Ghasemzadeh, A. and Jaafar, H.Z.E. 2011. Antioxidant potential and anticancer activity of Malaysian
young ginger (Zingiber officinale Roscoe) varieties grown under different CO2 concentration.
Journal of Medicinal Plants Research 5(14): 3247-3255.
Gulcin, I., Gungor Sat, I., Beydemir, S., Elmastas, M. and Irfan Kufrevioglu, O. 2004. Comparison of
antioxidant activity of clove (Eugenia caryophylata Thunb) buds and lavender (Lavandula
stoechas L.). Food Chemistry 87: 393-400.
Ibrahim, M.H., Jaafar, H.Z.E., Harun, M.H. and Yusop, M.R. 2010. Changes in growth and
photosynthetic patterns of oil palm (Elaeis guineensis Jacq.) seedlings exposed to short-term CO2
enrichment in a closed top chamber. Acta Physiolagiae Plantarum 32: 305-313.
Karimi, E., Jaafar, H.Z.E. and Ahmad, S. 2013. Antifungal; anti-inflammatory and cytotoxicity activities
of three varieties of Labisia pumila benth: From microwave obtained extracts. BMC
Complementary and Alternative Medicine 13: 1-10.
Lavola, A. and Julkunen, T.R. 1994. The effect of elevated carbon dioxide and fertilization on primary
and secondary metabolites in Befula pendula (Roth). Oecologia 99: 315-321.
Namdeo, A.G. 2007. Plant Cell Elicitation for Production of Secondary Metabolites.
Pharmacognosy Reviews 1(1): 69-79.
Reddy, L., Odhav, B. and Bhoola, K.D. 2007. Natural products for cancer prevention: a global
perspective. Pharmacology & Therapeutics 99(1):1-13
Page 87
ISBN 978-967-10840-4-5
Proc. Int. Conf. Plt. Phy. 2014
First Published, 2015
81
Assessment of Biochemical Processes on Different Sizes of Air-Layered
Azadirachta excelsa (Jack) M. Jacobs
Yap, M.L.1,*
, Hazandy, A.H.1,2
and Kamil, I.2
1Laboratory of Sustainable Bioresource Management, Institute of Tropical Forestry and Forest Products,
Universiti Putra Malaysia, 43400 UPM, Serdang, Selangor, Malaysia. 2Department of Forest Production, Faculty of Forestry, Universiti Putra Malaysia, 43400 Serdang,
Selangor, Malaysia.
*E-mail: [email protected]
Introduction
The tree gives response to the changes of the surrounding natural environment. We concern about the
factors that actually controlling the growth of trees especially when their cell structures are totally
different with other organisms. “Do the trees ageing?” is the question that always keeps reverberating in
ecophysiologist minds since the answer still remains unclear. Many theories and hypotheses have derived
to explain this issue.
Hazandy et al. (2009) has discussed vastly on some theories and evidences related to net primary
productivity of forest. He stated that most of the productivity was triggered by to the existing factors such
as nutrient, maturation, reproduction, maintenance respiration, and hydraulic limitation. However, among
those factors, hydraulic limitation seems to be the most likely that has caused it. It proposes that as trees
get taller, the hydraulic resistance increases and photosynthetic rate decreases, which eventually lead all
trees to face hydraulic limitations to growth (Ryan and Yoder, 1997).
The hydraulic limitation hypothesis is proved in reciprocal grafting experiments between seedlings and
older trees by Hazandy and Mencuccini (2009). Their studies focused on separating the size effect rather
than age, thus it only concludes that size is the dominant factor in controlling tree growth of broadleaved
species. Ambrose et al. (2009) has further suggested that tree size correlates more strongly with the
observed foliar modifications than tree age and further concluded that the age factor affecting the
photosynthetic characteristics is only significant during the early few years of tree development, while the
size factor dominates the characteristics afterwards.
Therefore, in this study, we propagated different sizes of branches from similar age donors in order to
understand the tree's structures and functions especially involving water relation in trees. It is related to
the investigation of soil-plant-atmosphere continuum which is very important in controlling the overall
growth of tree and gas exchange. The objectives of this study are to assess the photosynthetic efficiency
and capacity of different sizes of air-layered Azadirachta excelsa plants affected by different light
intensity (A/Q response curves) and carbon dioxide concentrations (A/Ci response curves), respectively
and to examine the changes in chlorophyll fluorescence of these plants. These three measurements are the
best indicators to determine the internal biochemical changes when plants are vegetatively propagated at
different sizes.
Materials and Methods
The study was conducted in the nursery of Faculty of Forestry, UPM using two donor trees in Ayer Hitam
Forest Reserve and Faculty of Forestry, UPM. Thirty air-layered plants from different branches length
(30, 40, 50, and 60 cm) and three levels of donor height (3, 4 and 5 m height above ground level) were
transferred in polybags and arranged in a complete randomized design (CRD) prior to three months data
Page 88
ISBN 978-967-10840-4-5
Proc. Int. Conf. Plt. Phy. 2014
First Published, 2015
82
collection. The replicates are labelled as L1H1, L1H3, L2H1 and L2H2, all mixed in treatments exclude
the donor trees.
Portable Photosynthesis System (LI-6400XT, LI-COR, USA) is used for photosynthetic capacity
measurements (maximum carboxylation rate, Vcmax and maximum light saturated rate of electron
transport, Jmax) and photosynthetic efficiency measurements (maximum photosynthesis rate, Amax and
Apparent Quantum Efficiency, ), while Handy PEA Chlorophyll Fluorometer (Hansatech Ins.) was used
to measure chlorophyll fluorescence in order to calculate minimal fluorescence (Fo), maximal
fluorescence (Fm), variable fluorescence (Fv=Fm-Fo), and photochemical efficiency (Fv/Fm).
All data were subjected to the repeated measures one-way analysis of variance (ANOVA) with type III
test. The means separation was analysed using Bonferroni test to solve the problem of multiple tests of
significance. Sigma Plot 10.0 (Systat Software Inc. 2004) was used to plot typical chlorophyll (Chl a)
polyphasic fluorescence rise by plotting average values of the sum of treatment in amplitude trend lines
on a logarithm scale with linear regression analyses (x-axis labels as fluorescence (BITS) or treatment and
y-axis labels as log times (µSEC) or parameter).
Results and Discussion
In ANOVA, there was no significant difference found in AQE and Amax parameters for level (donor
height) and length (plant height), so no post-hoc tests are executed. This problem was arisen due to failure
in propagating enough branches using air-layering technique. Since there were no significant differences
found for photosynthetic efficiency parameters in both levels and length variables, so no size-related
trends were observed.
In Figure 1, L1H1 plants recorded the highest mean values for both Amax and AQE in March, which were
8.81 mol m-2
s-1
and 0.05 mol m-2
s-1
, respectively. Meanwhile, the lowest mean value for Amax and
AQE were 3.89 mol m-2
s-1
and 0.03 mol m-2
s-1
, respectively for L1H1 plants in April. Overall, the
results showed no size-related trends for every A/Q parameters in every month under study.
Similarly, there was no significant difference for A/Ci parameters. This measurement was more related to
the process of generating carbohydrates by uptake of CO2 rather than efficacy in harvesting light. All
photosynthetic capacity parameters did not differ significantly between plants propagated at different
level and length. Thus, no size-related trends were observed for these parameters again. Mean values for
each parameter of A/Ci were plotted and compared (Figure 2), all showed inconsistent trend which did
not significant between each other. L2H1 plants in March obtained the highest mean values for Vcmax and
Jmax, which were 21.13 mol m-2 s
-1 and 168.02 mol m-
2 s
-1, respectively. On the other hand, L2H1 plants
in April and L1H1 plants in March scored the highest mean values for TPU and Resp, which are 18.93
mol m-2
s-1
and 10.52 mol m-2
s-1
, respectively. In May, L2H2 plants obtained the lowest mean value
for Vcmax and TPU, which were 7.63 mol m-2
s-1
and 2.75 mol m-2
s-1
, respectively, while L1H1 plants
scored the lowest mean value for Jmax and Resp, which were 31.39 mol m-2
s-1
and 1.53 mol m-2
s-1
,
respectively.
Therefore, both photosynthetic capacity and efficiency attributes of air-layered A. excelsa plants at
different CO2 concentration and light intensity were not able to explain the size-related effect even though
they were propagated at different sizes, so the conclusion is not easy to be related to tree growth.
Page 89
ISBN 978-967-10840-4-5
Proc. Int. Conf. Plt. Phy. 2014
First Published, 2015
83
MONTH
MAR APR MAY
Am
ax(µ
mo
l m
-2s
-1)
0
2
4
6
8
10 L1H1
L1H3
L2H1
L2H2
MONTH
MAR APR MAY
AQ
E (
µm
ol m
-2s
-1)
0.00
0.01
0.02
0.03
0.04
0.05
Figure 1. Mean values of Amax and AQE for different level and length of branches.
Page 90
ISBN 978-967-10840-4-5
Proc. Int. Conf. Plt. Phy. 2014
First Published, 2015
84
MONTH
MAR APR MAY
Vcm
ax (µ
mol
m-2
s-1)
0
5
10
15
20
25 L1H1
L1H3
L2H1
L2H2
MONTH
MAR APR MAY
J max
(µm
ol m
-2s-1
)
0
50
100
150
200
250
MONTH
MAR APR MAY
TPU
(µm
ol m
-2s-1
)
0
10
20
30
MONTH
MAR APR MAY
Resp
(µm
ol m
-2s-1
)
0
2
4
6
8
10
12
Figure 2. Mean values of Vcmax, Jmax, TPU, and Resp for different level and length of branches.
ANOVA also showed that there was no significant difference for chlorophyll fluorescence among plant
sizes obtained from different levels of height donor trees. The most interesting parameter in chlorophyll
fluorescence attributes is Fv/Fm. This parameter tells us whether a plant or tree growing in a certain
condition will have difficulty (stress) or not on their physical and biological environments. The highest
peak was shown in L2H1 plants in March, L2H2 plants in April and May, but the amplitude trend showed
an ascenders trend with time in sigmoid (Figure 3).
Vc m
ax (
µm
ol
m-2
s-1)
J max
(µ
mo
l m
-2 s-1
) T
PU
(µ
mol
m-2
s-1)
Res
p (
µm
ol
m-2
s-1)
Page 91
ISBN 978-967-10840-4-5
Proc. Int. Conf. Plt. Phy. 2014
First Published, 2015
85
Figure 3. Chlorophyll Fluorescence graphs.
Page 92
ISBN 978-967-10840-4-5
Proc. Int. Conf. Plt. Phy. 2014
First Published, 2015
86
L2H1 plants scored the highest mean values for Fm, Fv and Fv/Fm parameters in March, which were
8881.14, 6522 and 0.74, respectively (Figure 4). In April, It also scored the highest mean values for Fo
parameter, which was 2641.6, but L1H1 plants recorded the lowest mean values for Fv parameter, which
was 3042 and L2H2 plants recorded the lowest mean values for Fv/Fm parameter, which was 0.59. In
May, L1H1 plants obtained the lowest mean values for Fo and Fm parameters, which were 1541.6 and
4752.71, respectively.
MONTH
MAR APR MAY
Fo
0
500
1000
1500
2000
2500L1H1
L1H3
L2H1
L2H2
MONTH
MAR APR MAY
Fm
0
2000
4000
6000
8000
MONTH
MAR APR MAY
Fv
0
2000
4000
6000
MONTH
MAR APR MAY
Fv/F
m
0.0
0.2
0.4
0.6
Figure 4. Mean values of Fo, Fm, Fv, and Fv/Fm for different level and length of branches.
At here, the close difference between the branches length does not affect its physiological changes, so
chlorophyll fluorescence parameters did not differ significantly between plants propagated at different
level and length. The problem might be due to the differences of size were not too significant by just
separating the selected lengths at 10 cm apart which eventually does not bring any effects to the
difference of the photochemical rates although A. excelsa has a high mean annual increment (MAI) of
2.11 in diameter and 2.75 in height (Affendy et. al., 2007). Hadinor (2012) stated that the sizes of length
should expand until they are significantly separate apart between one length and others.
Page 93
ISBN 978-967-10840-4-5
Proc. Int. Conf. Plt. Phy. 2014
First Published, 2015
87
Conclusions
The biochemical processes of air-layered plants of different sizes were observed through measuring the
photosynthetic capacity and efficiency. The internal responses of carboxylation and electron transport
together with efficiency in harvesting light of every air-layered plant with different sizes did not
significantly affected. Overall results showed that the effects of length path of donor trees have been
showed through air-layered technique and the selected size differences were found too little to prove that
hydraulic constraint affects photosynthesis process as tree increase in height. The air-layering shock was
also not found to affect the plants when the mean value of photochemical efficiency was about eighty
percent (in a range of 70 to 80% can be considered healthy for tropical plants). Further researches can be
carried out by increasing the size of selected lengths, elongating the observation period or comparing the
mother tree branches with air-layered plants in a specific time, so that we may observe much to get more
comprehensive details on the physiological changes of a stand.
References
Affendy, H., Razak, W., Azani-Alias, M. and Salim, R. 2007. Growth Performance of 9-Years-Old
Selected 5 Indigenous Wood Species Planted on Degraded Forest Land. International Journal of
Agricultural Research 2: 302-306.
Ambrose, A.R., Sillett, S.C. and Dawson, T.E. 2009. Effects of Tree Height on Branch Hydraulics, Leaf
Structure and Gas Exchange in California Redwoods. Plant Cell Environment 32: 743-757.
Hadinor, N.F. 2012. Photochemical Capacity and Efficiency of Air-Layered Azadirachta excelsa (Jack)
Jacobs. Unpublished BSc. Thesis. UPM, Serdang.
Hazandy, A.H. and Mencuccini, M. 2009. Age- and Size-Related Changes in Physiological
Characteristics and Chemical Composition of Acer pseudoplatanus and Fraxinus excelsior Trees.
Tree Physiology 29: 27-38.
Hazandy, A.H., Mencuccini, M. and Nor-Aini, A.S. 2009. Net primary productivity of forest: A Review
of current issue. Pertanika Journal of Tropical Agricultural Science 32(2): 111-123.
Ryan, M.G. and Yoder, B.J. 1997. Hydraulic Limits to Tree Height and Tree Growth: What Keeps Trees
from Growing beyond a Certain Height? Bioscience 47: 235-242.
Page 94
ISBN 978-967-10840-4-5
Proc. Int. Conf. Plt. Phy. 2014
First Published, 2015
88
Physiological Changes of Xanthostemon chrysanthus as Affected by
Paclobutrazol and Potassium Nitrate
Ahmad Nazarudin, M.R.1,*
, Tsan, F.Y.2 and Normaniza, O.
3
1Forest Research Institute Malaysia (FRIM), 52109 Kepong, Selangor, Malaysia.
2Faculty of Plantation and Agrotechnology, Universiti Teknologi MARA (UiTM), 40450 Shah Alam,
Selangor, Malaysia. 3Institute of Biological Sciences, Faculty of Science, Universiti Malaya (UM), 50603 Kuala Lumpur,
Malaysia.
*E-mail: [email protected]
Introduction
Paclobutrazol (PBZ) has been extensively used in controlling excessive growth of plants, improving
flower, and increasing drought and salinity tolerance of various plant species. PBZ inhibits gibberellins
(GA) biosynthesis in plants, reduces cell elongation and plant growth (Kamountsis and Chronopoulu-
Sereli, 1999) but was found highly effective in protecting plants from various environmental stresses that
interfere with their normal physiological processes (Fernandez et al., 2006; Sankar et al., 2007).
Urban area is often associated with compacted and infertile soil, lack of nutrients and exposure to heat
stress (Lorenz and Lal, 2009; Pickett and Cadenasso 2009), resulting in poor growth quality. Poor growth
quality is closely related to soil nutrients. After nitrogen (N) and phosphorus (P), soils are usually most
deficient in potassium (K). K plays a significant role in photosynthesis, synthesis of amino acids and
proteins, development of lignin and cellulose, resistance against diseases and insect pests and root
expansion. Mengel (2007) stated that K has a great regulatory role within plant cells and organs such as
activating enzymes, osmosis regulation and photosynthesis, and loading and unloading of sugar in
phloem.
Thus, this study was conducted to determine the effects of PBZ and potassium nitrate (KNO3) on the
physiological response at three growth stages (flushing, flowering and fruiting) in a landscape tree,
Xanthostemon chrysanthus (F. Muell.) Benth. This species is native to tropical northern Australia, New
Guinea, Indonesia and the Philippines (Sosef et al., 1998) and belongs to the Myrtaceae family.
Materials and methods
A research plot consisted of 81 trees was established at Metropolitan Batu Park, Kuala Lumpur. These
trees aged about six years at the start of the study with the average height and average stem diameter at
breast height of 6 m and 10 cm, respectively. The experiment was based on a Completely Randomized
Design (CRD) with nine treatments and nine replicates. The treatments were T1(0 gL-1
PBZ + 0 g KNO3),
T2(0 gl-1
PBZ + 100 g KNO3), T3(0 gl-1
PBZ + 200 g KNO3), T4(0.125 gl
-1 PBZ
+ 0 g KNO3), T5(0.125
gl-1
PBZ + 100 g KNO3), T6(0.125 gl-1
PBZ + 200 g KNO3), T7(0.25 gl-1
PBZ + 0 g KNO3), T8(0.25 gl-1
PBZ + 100 g KNO3) and T9(0.25 gl-1
PBZ + 200 g KNO3). PBZ was applied as soil drench at an
application volume of 1 l per tree, while the control plants were applied with 1 l of tap water. Application
of PBZ was carried out one time at the commencement of the study. KNO3 (13.7:0:38.4) was applied at
three months intervals.
Randomly, the first three fully expanded leaves from five trees of each treatment were selected for the
measurements of photosynthetic rate (A), transpiration rate (E) and stomatal conductance (gs). These
measurements were recorded twice, at sixth and twelfth month after treatment by using a portable
Page 95
ISBN 978-967-10840-4-5
Proc. Int. Conf. Plt. Phy. 2014
First Published, 2015
89
photosynthetic system, Li-6400 (LICOR Nebraska, USA). The A and gs were measured in mol m-2
s-1
,
whereas E was measured in mmol m-2
s-1
. These parameters were recorded with vegetative, flowering and
fruiting branches. Data obtained were subjected to ANOVA and the treatment means were then compared
using Duncan’s Multiple Range Test.
Results and discussion
A of X. chrysanthus was significantly different between the control and other treatments in all growth
stages at sixth and twelfth month after treatment (Table 1). Trees treated with PBZ alone and combination
of PBZ and KNO3 gave lower A as compared to the control tree in all growth stages. For vegetative
growth stage, the highest A was observed in the control tree, while T7-treated tree had the lowest A at
sixth month after treatment. The same pattern was also recorded at twelfth month after treatment. A of the
control tree remained the highest whereas T7 resulted in the lowest A in both measurement times. PBZ at
this rate consistently resulted in the lowest A even after flowering. These results revealed that A was
greatly reduced by PBZ. Greater reduction of A was measured with higher concentration of PBZ. For
instance, during flowering, lower A was observed at six months after treatment with T7 (3.04 mol m-2
s-1
)
as compared to T4 (3.57 mol m-2
s-1
), showing that the concentration of PBZ influenced the physiological
capacity of the tree. Similar results of reduced A were also reported in M. indica (Shivashankara and
Mathai, 2000; Urban et al., 2004). According to Urban et al. (2004), the decrease in A in M. indica leaves
close to inflorescence was attributed to a decreased in stomatal conductance (gs) and the associated
decreased in intercellular partial pressure of CO2. These results suggested that A was also influenced by
the growth stages as well as the environmental factors. Gaussoin et al. (1997) also stated that treated
plants frequently had a moderate restraining outcome on CO2 exchange rate, thus perhaps minimizing the
A.
Meanwhile, E was found highest in all growth stages in the control tree as compared to other treatments
(Table 2). Treatment with PBZ alone or in combination of PBZ and KNO3 also reduced the E. In other
words, the existence of PBZ affected this physiological performance of the tree. In this study, the cells in
the leaf of the treated plants were compactly arranged as compared to the control. As a consequence, the
inter-cellular CO2 content in the leaf may be reduced, thus resulting in lower readings of A and E.
Significant difference in gs was only observed between the control and PBZ-treated trees (Table 3). The
existence of PBZ consistently reduced gs in all growth stages. At six month after treatment, T8 and T9
had significantly the lowest gs as compared to other treatments with fruiting stage. PBZ was presumed to
control the stomata aperture which further influences the gas exchange in the leaf. Therefore, PBZ-treated
tree had lower rate of biochemical processes as compared to those without PBZ application. The
reduction in A would also cause reduction in E as both processes are closely connected with stomata
behaviour and LA (Salisbury and Ross, 1992; Abod and Jeng, 1993). The decline in E would
subsequently decrease the amount of water lost through stomata. According to Olsen and Andersen
(1995), reduction in E would protect the plant against abiotic stress due to water limitation or drought
episode.
Plants treated with these triazoles frequently had a moderate restraining effect on CO2 exchange rate, thus
reducing A (Gaussoin et al., 1997). In potted Syzygium myrtifolium, PBZ reduced A and E but the gs was
not affected (Ahmad Nazarudin et al., 2012). Fletcher et al. (2000) reported that PGRs-treated plants
showed reduction in transpiration, used less water and may be able to survive drought better than
untreated plants.
Page 96
ISBN 978-967-10840-4-5
Proc. Int. Conf. Plt. Phy. 2014
First Published, 2015
90
Table 1. Photosynthetic rate in X. chrysanthus at 6th and 12
th months after treatment.
Trt
Photosynthetic Rate ( mol m-2
s-1
)
Vegetative Flowering Fruiting
6th
month 12th
month 6th
month 12th
month 6th
month 12th
month
T1 6.56 a 6.02 a 5.08 a 4.67 a 5.80 a 5.42 a
T2 5.28 b 5.40 b 4.04 b 3.99 b 4.25 bc 4.25 b
T3 5.50 b 5.07 b 4.07 b 3.99 b 4.47 b 4.43 b
T4 3.82 cde 3.53 c 3.57 cd 3.37 cd 3.67 cde 3.39 c
T5 4.20 c 3.58 c 3.87 bc 3.41 cd 3.95 bcd 3.54 c
T6 3.92 cd 3.73 c 3.63 bcd 3.52 c 3.67 cde 3.54 c
T7 3.25 e 3.23 c 3.04 e 3.04 d 3.14 e 3.2 0c
T8 3.55 de 3.31 c 3.46 cde 3.24 cd 3.48 de 3.29 c
T9 3.42 de 3.27 c 3.26 de 3.13 cd 3.37 de 3.24 c
Means followed by the same letter(s) within column do not differ (p<0.05) by DMRT; Trt treatment
Table 2. Transpiration rate in X. chrysanthus at 6th and 12
th months after treatment.
Trt
Transpiration Rate (mmol m-2
s-1
)
Vegetative Flowering Fruiting
6th
month 12th
month 6th
month 12th
month 6th
month 12th
month
T1 3.04 a 2.72 a 2.71 a 2.53 a 2.89 a 2.56 a
T2 2.18 b 1.90 b 1.96 b 1.74 b 2 .00 b 1.78 b
T3 2.01 b 1.95 b 1.97 b 1.82 b 1.98 b 1.84 b
T4 0.78 c 0.76 c 0.62 c 0.65 c 0.65 c 0.67 c
T5 0.84 c 0.76 c 0.66 c 0.64 c 0.70 c 0.67 c
T6 0.77 c 0.74 c 0.64 c 0.64 c 0.72 c 0.67 c
T7 0.76 c 0.72 c 0.61 c 0.63 c 0.63 c 0.66 c
T8 0.76 c 0.74 c 0.62 c 0.61 c 0.70 c 0.63 c
T9 0.75 c 0.74 c 0.61 c 0.60 c 0.65 c 0.69 c
Means followed by the same letter(s) within column do not differ (p<0.05) by DMRT; Trt treatment
Table 3. Stomatal conductance in X. chrysanthus at 6th and 12
th months after treatment.
Trt
Stomatal Conductance (µmol m-2
s-1
)
Vegetative Flowering Fruiting
6th
month 12th
month 6th
month 12th
month 6th
month 12th
month
T1 0.14 a 0.14 a 0.10 a 0.08 a 0.11 a 0.11 a
T2 0.11 a 0.12 a 0.09 a 0.09 a 0.10 a 0.10 a
T3 0.11 a 0.11 a 0.10 a 0.09 a 0.10 a 0.10 a
T4 0.05 b 0.05 b 0.04 b 0.04 b 0.04 b 0.05 b
T5 0.05 b 0.03 b 0.04 b 0.03 b 0.04 b 0.04 b
T6 0.04 b 0.03 b 0.03 b 0.03 b 0.04 b 0.04 b
T7 0.05 b 0.04 b 0.04 b 0.03 b 0.04 b 0.03 b
T8 0.02 b 0.03 b 0.02 b 0.03 b 0.02 c 0.02 b
T9 0.02 b 0.03 b 0.02 b 0.02 b 0.02 c 0.03 b
Means followed by the same letter(s) within column do not differ (p<0.05) by DMRT; Trt treatment
Conclusions
A, E and gs were significantly reduced with the existence of PBZ. PBZ may be helpful in controlling
water lost from the leaf as it minimizes the stomatal opening. This phenomenon may be useful for X.
chrysanthus grown in a harsh urban environment.
Page 97
ISBN 978-967-10840-4-5
Proc. Int. Conf. Plt. Phy. 2014
First Published, 2015
91
Acknowledgements
The authors would like to thank the Kuala Lumpur City Hall (DBKL) for site permission. This work was
funded by the Ministry of Agriculture and Agro-based Industry Malaysia (05-03-10-SF1030).
References
Abod, S.A. and Jeng, L.T. 1993. Effects of Paclobutrazol and its Method of Application on the Growth
and Transpiration of Acacia mangium Seedlings. Pertanika Journal of Tropical Agricultural
Science 16(2): 143-150.
Ahmad Nazarudin, M.R., Tsan, F.Y. and Mohd Fauzi, R. 2012. Morphological and physiological response
of Syzygium myrtifolium (Roxb.) Walp. to paclobutrazol. Sains Malaysiana 41(10): 1187-1192.
Fernandez, J.A., Balenzategui, L., Banon, S. and Franco, J.A. 2006. Induction of drought tolerance by
paclobutrazol and irrigation deficit in Phillyrea angustifolia during the nursery period. Scientia
Horticulturae 107: 277-283.
Fletcher, R.A., Gilley, A., Sankhla, N. and Davis, T.D. 2000. Triazoles as plant growth regulators and
stress protectants. Horticultural Reviews 24: 55-138.
Gaussoin, R.E., Branham, B.E. and Flore, J.A. 1997. Carbon dioxide exchange rate and chlorophyll
content of turf grasses treated with flurprimidol and mefluidide. Journal of Plant Growth
Regulation 16: 73-78.
Kamountsis, A.P. and Chronopoulou-Sereli, A.G. 1999. Paclobutrazol affects growth and flower bud
production in gardenia under different light regimes. HortScience 34(4): 674-675.
Lorenz, K. and Lal, R. 2009. Biochemical C and N cycles in urban soils. Environment International 35: 1-
8.
Mengel, S. 2007. Potassium. In A.V. Barker and D.J. Pilbean (Eds.), Handbook of Plant Nutrition
(pp.395-402). CRC Taylor and Francis, New York.
Olsen, W.W. and Andersen, A.S. (1995). Growth retardation of Osteospermum ecklonis. Acta
Horticulturae 397: 129-138.
Pickett, S.T.A. and Cadenasso, M.L. 2009. Altered resources, disturbance, and heterogeneity: a
framework for comparing urban and non-urban soils. Urban Ecosystem 12: 23-44.
Salisbury, F.B. and Ross, C. 1992. Plant physiology (4th ed.). New York: Freeman and Worth.
Sankar, B., Jaleel, A., Manivannan, P., Kishorekumar, A., Somasundaram, R. and Panneerselvam, R.
2007. Effect of paclobutrazol on water stress amelioration through antioxidants and free radical
scavenging enzymes in Arachis hypogaea L. Colloids and Surfaces B: Biointerfaces 60: 229-235.
Shivashankara, K.S. and Mathai, C.K. 2000. Inhibition of photosynthesis by flowering in mango
(Mangifera indica L.). A study by gas exchange methods. Scientia Horticulturae 83(3): 205-212.
Sosef, M.S.M., Hong, L.T. and Prawirohatmodjo, S. 1998. Plant Resources of South-East Asia No. 5(3).
Timber trees: Lesser-known timbers. Back-huys Publishers, Leiden. 859 pp.
Urban, L., Lu, P. and Thibaud, R. 2004. Inhibitory effect of flowering on leaf photosynthesis in mango.
Tree Physiology 24: 387-399.
Page 98
ISBN 978-967-10840-4-5
Proc. Int. Conf. Plt. Phy. 2014
First Published, 2015
92
Determining the Influence of Plant Architecture on Light Interception of
Virtual Rice Plants on the Simulation Platform GroIMP
Utama, D.N.*, Ong, Y., Streit, K. and Kurth, W.
University of Göttingen, Department of Ecoinformatics, Biometrics and Forest Growth, Göttingen,
Germany.
*E-mail: [email protected]
Introduction
Simulation models make activities of scientific experimental analysis simple and low risk. By analyzing,
designing, constructing and parameterizing, the real condition can be precisely simplified and technically
shifted into a virtual environment; and it can reduce time, cost, and risk in doing a large number of
experiments. One promising approach for simulation in plant sciences is represented by functional-
structural plant models (FSPMs). Indeed, FSPMs or virtual plants constitute a new generation of models
that can be used to assess plant performance in a virtual world by processing parameters of 3-D structure
and development. FSPMs also explicitly reflect the structural aspects of plant architecture, internal
functional aspects, and environmental impacts (Renton, 2013). They enable an upscaling from the organ
to the individual and plant stand level. One of the pioneering groups was that of de Reffye et al. (1988). In
one of their studies (de Reffye et al. 1995), they combined qualitative botanical analysis and quantitative
statistical analysis to create a simulation model for 3-D tree architecture with agroforestry applications,
with using data that were categorized into growth processes, branching processes, and geometric aspects.
Perttunen et al. (1996) designed the model LIGNUM that describes the 3-D structure of a tree crown
(segments, branching points, and buds) and defines growth in terms of the carbon metabolism taking
place in units which correspond to the organs of the tree. Lindenmayer and Prusinkiewicz used L-
systems, i.e., parallel string rewriting systems, for representing the architectural development of plants
(Prusinkiewicz and Lindenmayer 1990). This approach from formal language theory was used to simulate
ontogenesis in dependence on the light regime in crop plants like maize (Fournier and Andrieu 1999,
Pommel et al. 2001) and wheat (Fournier et al. 2003). Cieslak et al. (2008) used an L-system based model
of kiwifruit to compare a quasi-Monte Carlo radiation model with a radiosity-based model.
In the field of forest ecology, Umeki et al. (2010) developed an FSPM to calculate annual photosynthetic
gains in beech saplings (Fagus crenata). The calculation of annual photosynthetic gains was used to
determine the influence of foliar phenology and shoot inclination on carbon economy. In a similar spirit,
Kennedy (2010) used FSPMs as virtual laboratories to evaluate the effect of alternative local plant
architectures on the performance of the whole canopy. He obtained results about the functional
significance of foliage parameters for understanding the architectural development of the plant and its
foliage. Likewise, Han et al. (2012) used FSPMs for investigating the influence of geometrical traits
(internode length, leaf area, branching angle and shoot top diameter) on light interception efficiency of
apple trees.
The model GreenLab (Yan et al. 2004), based on the early structural plant model Amap (de Reffye et al.
1988) and its physiologically-enhanced version AmapHydro (de Reffye et al. 1999), calculates the
dynamics of organ numbers and organ biomasses of individual plants. It uses a two-scale automaton for
morphogenesis and the assumption of constant water-use efficiency to link water conduction and carbon
acquisition. Hua and Kang (2013) employed GreenLab to find a shape of a (simplified) tree which
maximizes its light interception. Song et al. (2007) used the model GreenLab to assist plant phenotyping
on two rice cultivars: Seedlings of the wild type Nippon Bare and one of its T-DNA organogenesis
Page 99
ISBN 978-967-10840-4-5
Proc. Int. Conf. Plt. Phy. 2014
First Published, 2015
93
deficient mutants named Phyllo were investigated to analyze the variability in carbon sinks and sources
among genotypes, taking phyllochron and tillering rate into account.
As the rice plant (Oryza sativa L.) is a popular staple food in several countries, it is a strong reason to
study it intensively. By using an FSPM, we simulated the rice plant under skylight and calculated the total
amount of intercepted light at the end of its vegetative growth. In this preliminary study, we used a
limited number of combinations of morphological parameters. In a future study, we will use more
parameters. It is our objective to use such virtual experiments to identify parameter combinations which
are optimal in terms of light interception. In the future, this could guide the breeding of new rice cultivars
for improved resource exploitation. Zheng et al. (2008) did also employ a spatial light model to compare
the architecture of different cultivars of hybrid rice. However, they did not use virtually-grown plants, but
digitized real plants, thus limiting the scope of potential improvements.
Materials and Methods
Several previous studies were conceptually adopted to develop our model. We used the model of 3-D
virtual rice plants developed by Watanabe et al. (2005) to specify rice plant architecture and to obtain
appropriate functions for presenting all growth stages of rice plants, especially for setting the angle
between the main stem and tillers, and in modeling the internode length. We also used study results from
Gao et al. (1992) for modeling the dynamics of rice development day by day. We used Zhu et al. (2009)
to model leaf morphology of rice, especially to determine leaf length, leaf width, leaf number, and to
describe the lengths and number of tillers. Furthermore, for the virtual radiation regime of our simulated
plants, we employed the Monte-Carlo pathtracer which is implemented as part of the software GroIMP
(Kniemeyer et al. 2014) and its configurable sky model which was designed by Hemmerling and Buck-
Sorlin (unpubl.) based on concepts from Goudriaan and van Laar (1994).
Model formalism and language
Our simulation model is implemented on the software GroIMP, an open-source 3-D modelling platform
(Kniemeyer et al. 2014) which uses a graph-based data structure to represent objects and scenes, and
which provides a compiler for the programming language XL (eXtended L-system language; Kniemeyer
2008, Kniemeyer and Kurth 2007). XL is an extension of the general-purpose language Java and supports
the specification of rule-based developmental models according to the formalism of parallel graph
grammars, the latter being a generalization of L-systems from string to graph rewriting. The vertices of
the graphs stand for plant organs (leaves, internodes) and for geometrical transformations, the edges stand
for relationships among organs (successor, branching, part-of). Among the vertex classes (organ types), a
hierarchy with inheritance of properties can be defined, like in Java and other object-oriented languages.
XL and the platform GroIMP have already been used for several FSPMs of crop and ornamental plants,
including barley (Buck-Sorlin et al. 2005), rose (Buck-Sorlin et al. 2011), cucumber (Chen et al. 2014)
and rice (Xu et al. 2011).
Model structure
Our model is composed of two submodels, describing the rice plant and the radiation regime (Figure 1).
The submodel for the rice plant simulates the 3-D morphology and development of an individual plant
and is based on 4 vertex types (classes), named RiceCultivar, Leaf, Stem and InternodeCylinder. In the
present study, we restrict ourselves to the vegetative growth stages, but the model could easily be
extended to include an inflorescence class as well. The submodel for the skylight is based on 3 classes;
SkyLight, Sun and Sky. It describes the movement of the sun and the intensities of direct and diffuse light
from different directions, depending on time and date. We parameterized it with a geographical position
Page 100
ISBN 978-967-10840-4-5
Proc. Int. Conf. Plt. Phy. 2014
First Published, 2015
94
at the equator. GroIMP provides a built-in spectral Monte-Carlo pathtracer (Hemmerling et al. 2008)
which sends random rays from the light source (sky) into the virtual scene and allows to estimate the
received radiative power for each single object, e.g. for each leaf.
Cluster “Rice Plant Model” Cluster “Skylight Model”(Monte-Carlo raytracer)
+getMaximumLength()+getMaximumWidth()+getLeafArea()+getInterceptedPower()
-leafOrder-leafPosition-maximumLength-maximumWidth-tipWidth-middleWidth-sheathWidth-tipXPosition-tipYPosition-tipZPosition-theta-daytoBend-lightPower-interceptedLight-maxInterceptedLight-leafArea-leafCurrentAge-leafMaxAge
Leaf
-numberOfRays-numberOfRaysBounce
SkyLight
*
1
-cultivarType-finalLeafLengthCoef-leafLengthCoef-actualLeafNitrogenContent-optimumLeafNitrogenContent-actualLeafWaterContent-optimumLeafWaterContent-dailyTemperature-baseTemperature-maxAgeOfPlant
RiceCultivar
1
*
-stemType-axialAngle-stemCurrentAge-leafNumber-leafPositionOnStem-differentCoefficient-rotationAngle
Stem
+getLengthIncrement()
-internodePosition-length-radius-internodeCurrentAge
InternodeCylinder
1
*
1
*
1
*
+getSunPosition()+getDirrectPower()
-dirrectPowerDensity-distance-latitude-time-sunPosition-dayOfYear
Sun
+getDiffusePower()
-diffusePowerDesity-diffuseLightCoef-distance-latitude-time-dayOfYear
Sky
1
1
1
1
Figure 1. Class diagram of the simulation model.
Rice plant submodel
For constructing the simulation model of rice plant growth and architecture, we used several previous
studies. For calculating internode lengths, we adopted and simplified an approach from Watanabe et al.
(2005), assuming a nonlinear increase of final internode length with the rank of the internode at the axis.
For morphologically modeling the rice plant leaf, we used the model of Zhu et al. (2009), especially for
calculating maximum leaf length and width. Many variables are included in the calculation such as the
number of growing degree days since leaf emergence (GDD (oCd)), initial number of GDD when leaf n
begins to grow (IGDDn (oCd)), number of GDD required for completing normal growth of leaf n ( GDDn
(oCd)), factors accounting for nitrogen and water effects (FN and FW), average daily temperature (Ti
(oC)), base temperature (Tb (
oC)), leaf age (LA), final leaf number (LN = 18) and number of elongated
internodes on the main stem (N). The factors FN and FW were assumed to be 1 in our simulations, i.e., we
assumed non-limiting nitrogen and water supply and a constant temperature of 25.9 oC.
Page 101
ISBN 978-967-10840-4-5
Proc. Int. Conf. Plt. Phy. 2014
First Published, 2015
95
The rice leaf that is morphologically modeled is illustrated (Figure 2). Here, the virtual leaf is divided into
two parts; they are determined by startingPoint, middlePoint and tipPoint. The maximum leaf length LLn
(Zhu et al. 2009) was used to model the fully grown leaf length from startingPoint to tipPoint. The
maximum leaf width LWn (Zhu et al. 2009) was used to model leftCurveOnY and rightCurveOnY.
Figure 2. Schematic view of leaf model.
Skylight model
Our skylight model utilizes a Monte-Carlo pathtracer which is implemented as part of the software
GroIMP (Kniemeyer et al. 2014) and its configurable sky model which was successfully designed by
Hemmerling and Buck-Sorlin (unpubl.) based on concepts from Goudriaan and van Laar (1994). We
employed the model for the virtual radiation regime of our simulated plants. It can simulate the movement
of sun position and the intensities of direct and diffuse light from different directions, depending on time
and date. We parameterized it with a geographical position at the equator. To construct the virtual sun that
can produce direct light, we used the GroIMP method “lightnode”; and on the other hand, to construct the
virtual sky that can produce diffuse light, we initialized the lightnode method for 72 different positions,
approximating a continuous sky. The 72 different lightnode positions for modeling the sky dome are
visualized in Figure 3.
Figure 3. Position of 72 light nodes in our sky model, using GroIMP.
Page 102
ISBN 978-967-10840-4-5
Proc. Int. Conf. Plt. Phy. 2014
First Published, 2015
96
Linking light and structure
To illustrate how light interception of individual leaves is obtained in the simulation program, it can
technically be explained by one part of XL code below. We have called the corresponding procedure
absorb(). By using several parameters, such as day, hour and leaf order, the procedure can calculate how
much light is intercepted by every single leaf. The search pattern ‘l:Leaf’ in line 3 of the code looks for all
leaf objects in the current virtual structure, and assigns to the them the temporary label ‘l’ used in the
following lines. The symbol ‘::>’ indicates an update rule, i.e., a rule which does not modify the topology
of the current structure, but only properties of objects – in our case the amount of absorbed light, called
‘lightPower’, which is technically regarded as a property of each leaf. In this case, the calculation is only
done on the main stem, a restriction which is enforced by the condition ‘if(l[leafOrder] == 0)’. The leaf
order is 0 on the main stem and 1 on tillers. The method call ‘lm.getAbsorbedPower3d(l).integrate()’ is
the command used by our light model to accumulate radiative power over the whole spectrum for leaf l;
and ‘sum((* l:Leaf, l[leafOrder == 0 *)[lightPower])’ is the command used to sum up all light power that
was captured by all leaves on the main stem.
protected void absorb (several parameters)
[
l:Leaf ::>
if (l[leafOrder] == 0)
l[lightPower] = lm.getAbsorbedPower3d(l).integrate();
interceptedLight = sum((* l:Leaf, l[leafOrder] == 0 *)[lightPower]);
totalInteceptedLight += interceptedLight;
]
Results and Discussion
Two parameters were tentatively chosen to determine the influence of rice plant architecture on light
interception. These were the starting day for a leaf to bend (SDB) and the inter-segment leaf bending
angle (theta; see Figure 4). We used 4 values of SDB (4, 5, 6 and 7) to modify the day one leaf starts to
bend. Indeed, all leaves in our rice plant need 8 days on average to fully grow, except the first leaf that
takes 4 days. Here we want to analyze the significance of influence of SDB on plant architecture and
thereby on accumulated light interception. Regarding theta we used 7 values. Then, we can partially
determine the influence of plant architecture on light interception by combining these two parameters. In
this study, we focused on measuring the accumulation of light intercepted by leaves on the main stem
only.
Page 103
ISBN 978-967-10840-4-5
Proc. Int. Conf. Plt. Phy. 2014
First Published, 2015
97
Figure 4. Schematic lateral view of discretized, bent leaf showing the meaning of angle theta.
Figure 5 describes one example of data generated from our model. It is a 3-D diagram showing
accumulated light interception during the vegetative stage of the modified cultivar Wungxiangjing 14 by
combining the two parameters mentioned above. The diagram resulted from two experiments in
generating the growth of a virtual rice plant, by rotating the whole virtual plant by 10o for the second
experiment. To generate the model, we made several assumptions: 6 types of rice plant cultivar (including
4 artificial cultivars with morphology “between” two existing cultivars, obtained by linear interpolation of
parameters); hour by hour sun positions; 4 values of starting day to bend; 7 values of theta; 18 tillers,
where 12 are primary tillers and 6 are secondary tillers (Watanabe et al. 2005; Zhu et al. 2009); primary
tillers have 14 leaves and secondary tillers have 11 leaves (Zhu et al. 2009); the primary tiller axial angle
is 32o and the secondary tiller axial angle is 23
o (Watanabe et al. 2005); and 65 vegetative stage days.
The result from the example above shows that the highest value of accumulated light interception can be
reached in combination of SDB 4 and theta 3.0o, we call it the optimum combination. This pattern of the
highest accumulated light interception occurred as well on almost all other cultivars (one other existing
cultivar and three proposed virtual ones), except the proposed virtual cultivar 3. All results similarly show
that the rice plant with optimum combination of SDB 4 and theta 3.0o experimentally can reach the
highest accumulated light interception; except the proposed virtual cultivar 3 which gets the highest value
of accumulated light interception for the combination of SDB 4 and theta 2.8o. Figure 6 shows the
architecture of the optimal modification of cultivar Wungxiangjing 14 in its vegetative stage.
2.42.6
2.83.0
0.00
0.50
1.00
4 5 6 7
thet
a (o
)
Rel
ativ
e A
ccu
mu
late
d L
igh
t In
terc
epti
on
Staring Day to Bend
Figure 5. Relative accumulated virtual light interception on cultivar Wungxiangjing 14 with modified
architecture.
Page 104
ISBN 978-967-10840-4-5
Proc. Int. Conf. Plt. Phy. 2014
First Published, 2015
98
Figure 6. Simplified wireframe (left side) and detailed (right side) view of rice plant 3-D architecture of
virtual modified cultivar Wungxiangjing 14. Total height of the plant is 62.33 cm.
Furthermore, figure 7 illustrates the comparison of accumulated light interception based on a fixed value
of each cultivar’s total leaf area on main stem (TLA) for the optimum parameter combination. In this case,
we took a TLA of approximately 70 cm2. The TLA value of 70 cm
2 is the highest value of TLA that
cultivar Wungxiangjing 14 can reach in its vegetative stage. Figure 7 shows that the cultivar Yungdao 6
has the highest value of accumulated light interception for a TLA of 70 cm2. Figure 8 shows the temporal
development of TLA in all 6 virtual cultivars. The accumulated light interception based on TLA of each
cultivar in their vegetative stage were shown (Figure 9).
0.800.820.840.860.880.900.920.940.960.981.00
Rel
ativ
e A
ccu
mu
late
d L
igh
t In
terc
epti
on
Figure 7. Relative accumulated light interception based on a fixed total leaf area of 70 cm
2.
Page 105
ISBN 978-967-10840-4-5
Proc. Int. Conf. Plt. Phy. 2014
First Published, 2015
99
0
20
40
60
80
100
120
140
160
180
0 100 200 300 400 500 600
nth
Da
y
Total Leaf Area (cm2)
Yungdao 6
Proposed 1
Proposed 2
Proposed 3
Proposed 4
Wungxiangjing 14
Figure 8. Day-by-day development of total leaf area on main stem in the 6 virtual cultivars.
0.00
0.10
0.20
0.30
0.40
0.50
0.60
0.70
0.80
0.90
1.00
0 5
15 25 35 45 55 65 75 85 95
10
5
Re
lati
ve A
ccu
mu
late
d L
igh
t In
terc
epti
on
Total Leaf Area (cm2)
Yungdao 6
Proposed 1
Proposed 2
Proposed 3
Proposed 4
Wungxiangjing 14
Figure 9. Relative accumulated light interception based on total leaf area in vegetative stage.
Conclusions
We successfully developed a model that has two submodels: rice plant and skylight model. The rice plant
model technically imitates an above-ground real rice plant in its vegetative stage. The skylight model was
developed to model the movement of the sun and intensities of diffuse light. From our first results, it can
be concluded that the plant architecture and leaf shape influence the quantity of intercepted light, which
essentially depends on many parameters, such as leaf-nitrogen content, leaf-water content, daily
temperature, maximum plant age, leaf area, starting day for leaves to bend, angle for leaves to bend,
number and position of tillers, axial angle of tillers, and other coefficients. Promisingly, future studies can
be conducted to study further botanical parameters of the plant by using optimization techniques to
propose and recommend a new good performance plant, particularly for rice.
Page 106
ISBN 978-967-10840-4-5
Proc. Int. Conf. Plt. Phy. 2014
First Published, 2015
100
References
Buck-Sorlin, G.H., Kniemeyer, O. and Kurth, W. 2005. Barley morphology, genetics and hormonal
regulation of internode elongation modelled by a Relational Growth Grammar. New Phytologist
166(3): 859-867.
Buck-Sorlin, G.H., de Visser, P.H.B., Henke, M., Sarlikioti, V., van der Heijden, G.W.A.M., Marcelis,
L.F.M. and Vos, J. 2011. Towards a functional-structural plant model of cut-rose - simulation of
light environment, light absorption, photosynthesis and interferences with the plant structure.
Annals of Botany 108(6): 1121-1134.
Chen, T.W., Henke, M., de Visser, P.H., Buck-Sorlin, G., Wiechers, D., Kahlen, K. and Stützel, H. 2014.
What is the most prominent factor limiting photosynthesis in different layers of a greenhouse
cucumber canopy? Annals of Botany 144: 677-688.
Cieslak, M., Lemieux, C., Hanan, J. and Prusinkiewicz, P. 2008. Quasi-Monte Carlo simulation of the
light environment of plants. Functional Plant Biology 35(10): 837-849.
de Reffye, P., Edelin, C., Françon, J., Jaeger, M. and Puech, C. 1988. Plant models faithful to botanical
structure and development. Computer Graphics 22: 151-158.
de Reffye, P., Houllier, E., Blaise, E., Barthelemy, L.D., Dauzat, J. and Auclair, D. 1995. A model
simulating above- and below-ground tree architecture with agroforestry applications.
Agroforestry Systems 30: 175-197.
de Reffye, P., Blaise, F., Chemouny, S., Jaffuel, S., Fourcaud, T. and Houllier, F. 1999. Calibration of
hydraulic growth model on the architecture of cotton plants. Agronomie 19: 265-280.
Fournier, C., F. and Andrieu, B. 1999. ADEL-maize: an L-system based model for the integration of
growth processes from the organ to the canopy. Application to regulation of morphogenesis by
light availability. Agronomie 19(3-4): 313-327.
Fournier, C., Andrieu, B., Ljutovac, S. and Saint-Jean, S. 2003. ADEL-wheat: a 3D architectural model of
wheat development. In: Hu, B.G. and Jaeger, M. Tsinghua (Eds.) Plant Growth Modeling and
Applications. UP/Springer. Pp. 54-66.
Gao, L., Jin, Z., Huang, Y. and Zhang, L. 1992. Rice clock model – a computer model to simulate rice
development. Agriculture and Forest Meteorology 60: 1-16.
Goudriaan, J. and van Laar, H.H. 1994. Modelling Potential Crop Growth Processes. Kluwer Academic
Publishers, Dordrecht 1994.
Han, L., Costes, E., Boudon, F., Cokelaer, T., Pradal, C., Da Silva, D. and Faivre, R. 2012. Investigating
the influence of geometrical traits on light interception efficiency of apple trees: a modelling
study with MAppleT. The IEEE 4th International Symposium on Plant Growth Modeling,
Simulation, Visualization and Applications, 2012, pp. 152-159.
Hemmerling, R., Kniemeyer, O., Lanwert, D., Kurth, W. and Buck-Sorlin, G. 2008. The rule-based
language XL and the modelling environment GroIMP illustrated with simulated tree competition.
Functional Plant Biology 35: 739-750.
Hua, J. and Kang, M. 2013. Optimize tree shape: targeting for best light interception. Proceeding of the
7th International Conference on Functional-Structural Plant Models, 2013.
Kennedy, M.C. 2010. Functional-structural models optimize the placement of foliage units for multiple
whole-canopy functions. Journal of Ecological Society of Japan 25: 723-732.
Kniemeyer, O. 2008. Design and Implementation of a Graph Grammar Based Language for Functional-
Structural Plant Modeling [Dissertation]. Cottbus: University of Technology Cottbus.
Kniemeyer, O. and Kurth, W. 2007. The Modeling Platform GroIMP and the Programming Language
XL. Third International Symposium, AGTIVE 2007, Kassel, Germany, October 10-12, 2008,
Lecture Notes in Computer Science 5088, Springer, Berlin. Pp. 570-572.
Kniemeyer, O., Hemmerling, R., Streit, K., Ong, Y. and Kurth, W. 2014. Website of GroIMP (Growth-
grammar related Interactive Modelling Platform). http://www.grogra.de.\
Page 107
ISBN 978-967-10840-4-5
Proc. Int. Conf. Plt. Phy. 2014
First Published, 2015
101
Perttunen, J., Sievänen, R., Nikinmaa, E., Salminen, H., Saarenmaa, H. and Väkevä, J. 1996. LIGNUM: a
tree model based on simple structural units. Annals of Botany 77: 87-98.
Pommel, B., Sohbi, Y. and Andrieu, B. 2001. Use of virtual 3D maize canopies to assess the effect of plot
heterogeneity on radiation interception. Agricultural and Forest Meteorology 110(1): 55-67.
Prusinkiewicz, P. and Lindenmayer, A. 1990. The Algorithmic Beauty of Plants. Springer, Berlin 1990.
(288 pp.)
Renton, M. 2013. Aristotle and adding an evolutionary perspective to models of plant architecture in
changing environment. Opinion Article in Plant Science 4(284): 1-4.
Song, Y., Luquet, D., Mathieu, A., de Reffye, P. and Dingkuhn, M. 2007. Using Greenlab model to assist
to analyse rice morphogenesis: case of phyllo mutant and its wild type ‘Nippon Bare’. Second
International Symposium on Plan Growth Modeling, Simulation, Visualization and Applications.
Pp. 169-172.
Umeki, K., Kikuzawa, K. and Sterck, F.J. 2010. Influence of foliar phenology and shoot inclination on
annual photosynthetic gain in individual beech saplings: a functional-structural modeling
approach. Forest Ecology and Management 259, 2141-2150.
Watanabe, T., Hanan, J.S., Room, P.M., Hasegawa, T., Nakagawa, H. and Takahashi, W. 2005. Rice
morphogenesis and plant architecture: measurement, specification and the reconstruction of
structural development by 3D architectural modelling. Annals of Botany 95: 1131-1143.
Xu, L., Henke, M., Zhu, J., Kurth, W. and Buck-Sorlin, G. 2011. A Functional–Structural Model of Rice
Linking Quantitative Genetic Information with Morphological Development and Physiological
Processes. Annals of Botany 107, 2011: 817-828.
Yan, H.-P., Kang, M.-Z., de Reffye, P. and Dingkuhn, M. 2004. A dynamic, architectural plant model
simulating resource-dependent growth. Annals of Botany 93(5): 591-602.
Zheng, B., Shi, L., Ma, Y., Deng, Q., Li, B. and Guo, Y. 2008. Comparison of architecture among
different cultivars of hybrid rice using a spatial light model based on 3-D digitising. Functional
Plant Biology 35(10): 900-910.
Zhu, Y., Chang, L., Tang, L., Jiang, H., Zhang, W. and Cao, W. 2009. Modelling leaf shape dynamics in
rice. NJAS – Wageningen Journal of Life Sciences 57: 73-81.
Page 108
ISBN 978-967-10840-4-5
Proc. Int. Conf. Plt. Phy. 2014
First Published, 2015
102
Changes of Empty Locul Proportion of Bean Characteristic in Robusta Coffee
(Coffea canephora) Caused by Drought Stress
Sumirat, U.
Researcher at Indonesian Coffee and Cocoa Research Institute. Jl. PB Sudirman 90, Jember 68118
Indonesia.
E-mail: [email protected]
Introduction
Robusta (Coffea canephora) coffee is the second world largest coffee production of the only two
important commercial species of 124 members in Coffea genus (Davis et al., 2011). Economic value of
this commodity has become increasingly important since the contribution to the world coffee production
continuously growing up to 42 % in the latest year, compared to Arabica coffee (United States
Department of Agriculture, 2014). This species is known sensitive to the drought stress which causing not
only loss of production but also can destruct the architectural of plant (Nunes, 1976; da Matta, 2004;
Pinheiro et al., 2005). Recently, Brazil as the world biggest coffee producer is suffering due to long dry
season that causing loses of 4.2 million of 60 kg-bags compared to the previous year (United States
Department of Agriculture, 2014). This stress in the next future is predicted occurred more serious along
with the occurrence of global warming.
Composition of bean characteristics in coffee as described by Wormer (1964) is an aspect that also
affected by drought stress (Sumirat, 2008). In addition to normal form of bean, there are three forms of
abnormal bean which commonly found in Robusta coffee and contributed to the low productivity and low
physical quality of coffee bean (Wrigley, 1988, Wintgens, 2004) namely round bean (peaberry or
caracole), triage and empty locul. Concerning the empty locul, Sumirat (2008) considered that the origin
of the empty locul is actually come from the failure of pollination in one cavity, and also from the failure
growth of endosperm. In this study, we would like to report the phenomenon of proportion changes on
empty locul caused by drought stress with only discussing the empty locul that originally come from the
failure growth of endosperm, including the unusual contrary phenomenon of decreasing proportions of
empty locul which possibly play as survival mechanism of coffee tree under drought condition, or even
linked to the resistance mechanism.
Materials and Methods
This study was conducted at Kaliwining experimental garden of Indonesian Coffee and Cocoa Research
Institute, East Java, Indonesia. The experimental field is located in the area having climate type C to D
(dry climate type) based on Schmidt and Ferguson (1951) classification system on the altitude of 45 m
asl. Observation was conducted on 79 progenies of hybrid population of BP 961 x BP 409. The genetic
backgrounds of the two parents are Congolese (SG2) group (Crouzillat et al., 2004). BP 409 is a
commercial clone having high yield and high tolerance to drought stress, whereas BP 961 is a promising
high yielding clone. Each progeny was single tree planted by using 2.5 m x 2.5 m as planting distance
under shading tree of Lamtoro (Leucaena leucocephala).
Impact of drought stress on the proportion changes of empty locul was studied by comparing the
observation on two consecutive harvest years having short two months dry season in the first year and
long five months dry season the second year. Observations of proportions of empty locul were done
firstly by harvesting 100 random cherries from each progenies, then all type of bean characteristics were
Page 109
ISBN 978-967-10840-4-5
Proc. Int. Conf. Plt. Phy. 2014
First Published, 2015
103
counted to obtain each proportion. Cluster analysis was used to identify the proportion changes of empty
locul by using hierarchical clustering method of complete linkage with Euclidean distance.
Results and Discussion
General situation of the site and proportion of empty locul
Maximum temperature during the longer dry season was 32.6 °C in average, lower than the shorter dry
season that was reached 33 °C in average. This condition perhaps due to shorter days light during the
longer dry season which only covered 69 % compared to 79 % in average during the shorter dry season.
By those conditions, we recorded that numbers of dried branches on this population were 35 % in average
during the longer drought season. The coffee flowers were bloomed before the first dry month arrived on
shorter dry season, while the flowers in longer dry season were bloomed in the first and second month of
dry season.
Observations of proportion of empty locul on two consecutive different length of dry season were found
interesting phenomenon of relatively unchanged proportion of empty locul in term of mean, minimum
and maximum proportion of population as showed in Figure 1. Minimum proportion was showed
decreasing while it is generally known that drought stress is impacted to increase proportion of empty
locul as showed in mean and maximum proportion. The unusual phenomenon was also occurred in the
histogram that shows decreasing frequency of the member grouped in highest proportion of empty locul,
while frequency of the member grouped in lowest proportion was in the contrary. This phenomenon could
be the reason for relatively unchanged the mean, minimum and maximum proportion of empty locul in
this population. From Figure 1 also, we see that proportion of empty locul could reach more than 30 %
which is considering high by Hulupi et al. (1997).
Changes of empty locul proportion caused by drought stress
Observations of proportion changes on empty locul due to drought stress were found three groups as
showed in Figure 2. According to Figure 2, we then exploring data characteristic from each group to get a
better understand of this impact as described in Table 1. Based on Table 1, Group 2 and 3 has the same
phenomenon of increasing proportion of empty locul but with different level. In average, Group 3 has an
extreme multiplication proportion of empty locul (339.6 %) rather than Group 2 (68.1 %). Although the
average proportion of empty locul is seem extremely increasing, the differences proportion of empty locul
between short and long drought period were only 12.9 % and 4.2 % in Group 3 and Group 2, respectively.
Actually, the most interesting result from this study was the impact of drought stress to 31.6 % of
progenies and the parental of BP 961which showed decreasing proportion of empty locul as showed in
Group 1. The average proportion of empty locul in this group was multiplied 22.9 % lower after hit by
drought condition with the differences only 2.9 % between the short and long dry season. In the contrary,
the drought tolerant parental of BP 409 (Nur and Zaenudin, 1992; Erwiyono, 2003) was showed
increasing proportion of empty locul, together with Group 2 and 3.
Results of this study showed that most of progenies showing increasing proportions of empty locul when
exposed to drought stress as probably inherited from the drought-tolerant-parental BP 409 which showed
the same situation. The rest of progenies were showed in the contrary of decreasing proportion of empty
locul as probably inherited from the less drought-tolerant-parental BP 961 which also showed the same
situation. Increasing proportion of empty locul caused by drought stress is a common phenomenon as like
as recently seen in Brazilian coffee. This condition is due to less nutrient uptake and less plant
metabolisms (Kumar, 1979) which lead to limited distribution and promote for competition to obtain
assimilate products, and finally will be contributed to the increase proportion of empty locul (Sumirat,
Page 110
ISBN 978-967-10840-4-5
Proc. Int. Conf. Plt. Phy. 2014
First Published, 2015
104
2008; Yahmadi, 1973). However, increasing proportion of empty locul in the high tolerant genotype of
BP 409 should be assumed as survival mechanism of coffee plant to drought stress. This assumption was
supported by lower changes proportions of empty locul rather than the average value of Group 2 and even
for Group 3. These facts suggest that empty locul proportion could be used as selection tool in the
breeding to obtain tolerant genotype to drought stress. On the other hand, the unusual phenomenon of
decreasing proportion of empty locul was occurred in less drought tolerant genotype of BP 961.
Therefore, decreasing proportion of empty locul in Group 1should not be interpreted as a better tolerance
to drought stress. We assumed that this situation was due to very low tolerance of the trees to drought
stress because actually drought stress will impact to cherries drops, mainly at pinhead stage (Yahmadi,
1973). Longer drought stress will be then impacted to leaves drops and dried branches (Nur and
Zaenudin, 1999). High numbers of cherries drops and or dried branches will directly reducing numbers of
survival cherries. So when drought condition is finish, the trees will only need to support the growth for
less number of cherries and reducing competition on distribution of assimilate products. Due to this
condition, beans filling will more supported and finally will reducing proportion of empty locul.
Figure 1. Histogram of proportion of empty locul in shorter and longer dry season.
This result, however, should be verified before it used for selection of drought tolerant coffee, especially
to define the tolerance criteria, mainly for selection inside the Group 2 only. One should be considered is
how to compromise between the multiplication proportion of empty locul that shows increasing in
extreme and the differences proportion between short and long drought period that only reach maximum
20.5 %. For examples, there is a possibility that a genotype shows extreme multiplication proportion of
empty locul but with relatively small difference proportion of empty locul between shorter and longer dry
season. Referring back to the suggestion of Hulupi et al. (1997) for good commercial variety that contain
no more than 10 % for total abnormal bean, proportion of empty locul originally coming from failure
growth of endosperm perhaps tolerated to maximum 2 %.
On the other hand, there are also several plant characteristics that have been known linked to the tolerance
to drought stress as described by da Matta (2004) and Pinheiro et al. (2005). However, depth of rooting
(Pinheiro et al., 2005) is seemed more interesting as plant characteristic for selection in coffee to drought
stress especially at seedling phase. No less important, genetic background is also contributed to the level
of tolerance to drought stress. From two widest cultivated genetic groups of Robusta coffee in the world,
Quillou (SG1) has been known having better tolerance to drought stress rather than Congolese (SG2)
(Cramer, 1957).
Empty locul (%)
Shorter dry season Empty locul (%)
Longer dry season
Mean : 10.1
Min. : 2.0
Max. : 33.0
Mean : 12.9
Min. : 1.0
Max. : 34.0
Page 111
ISBN 978-967-10840-4-5
Proc. Int. Conf. Plt. Phy. 2014
First Published, 2015
105
C67
C56
C41
C43
C52
C38
C22
C63
C28
C27
C30
C20
C94
C48
C46
C45
C36
C35
C13
C16
C14
C93
C76
C12
C47
C10
C74
C53
C72
C37
C19
C26C7
C59
BP
409
C5
C66
C21
C85
C44
C32
C29
C73C3
C68
C65
C33
C55
C71
C24
C81C8
C39
C23
C75
C17
C11
C80C9
C51C4
C2
C83
C88
BP9
61C
42C
77C
31C
58C
70C
57C
40C
15C
69C
60C
79C
18C6
C82
C34C1
0,00
33,33
66,67
100,00
Sim
ilar
ity
(%)
Group 1 Group 2 Group 3
Figure 2. Three groups formed based on changes of empty locul proportion due to drought stress.
The arrows show position of the two parental.
Table 1. Description of changes proportion of empty locul from three formed groups
Group Members
(%)
Differences proportion of empty locul
due to drought stress (%)
Multiplication proportion of empty
locul due to drought stress (%)
Mean Min. Max. Mean Min. Max.
Group 1 31.6 -2.9 -10.5 0.6 -22.9 -77.1 4.5
Group 2 59.5 4.2 1.1 10.5 68.1 4.1 263.0
Group 3 8.9 12.9 6.0 20.5 339.6 273.3 400.0
Parent BP 409 --- 3.5 --- --- 38.9 --- ---
Parent BP 961 --- -6.5 --- --- -46.4 --- ---
Conclusions
According to the results of this research, it could be concluded that:
1. Drought stress is relatively not impacted to the changes proportion of empty locul in term of mean
and range value (2-33 % at shorter dry season vs 1-34 % at longer dry season) of studied population.
2. Cluster analysis confirmed three groups correspond to the impact of drought stress to proportion
changes of empty locul namely a group that shows increasing proportion in extreme, a group that
shows lower increasing proportion, and a group that shows decreasing proportion.
3. Changes proportions of empty locul were shows extreme multiplication, while differences proportion
between the shorter and the longer dry season were shows only maximum 20.5 %.
4. The drought tolerant parent was placed in the group that shows lower increasing proportion of empty
locul, suggest the increasing proportion of empty locul is a mechanism of resistance to the drought
stress.
5. The drought less-tolerant parent was placed in the group that shows decreasing proportion of empty
locul, suggest the existence of other survival mechanism under drought stress.
Page 112
ISBN 978-967-10840-4-5
Proc. Int. Conf. Plt. Phy. 2014
First Published, 2015
106
References
Cramer, P.J.S. 1957. A review of literature of coffee research in Indonesia. F.L. Wellman (ed). SIC
Editorial, Inter-American Institute of Agriculture Sciences. Turrialba, Costa Rica. 262 p.
Crouzillat, D., Rigoreau, M., Bellanger, L., Priyono, P., Mawardi, S., Syahrudi, McCarthy, J., Tanksley,
S., Zaenudin, I. and Petiard, V. 2004. A Robusta consensus genetic map using RFLP and
microsatellite markers for the detection of QTL. Proceedings of 20th ASIC conference, Pp. 546-
453.
Davis, A.P., Tosh, J., Ruch, N. and Fay, M.F. 2011. Growing coffee: Psilanthus (Rubiaceae) subsumed
on the basis of molecular and morphological data; implication for the size, morphology,
distribution and evolutionary history of Coffea. Botanical Journal of the Linnean Society 167:
357-377.
Da Matta, F.M. 2004. Exploring drought tolerance in coffee: a physiological approach with some insight
for plant breeding. Brazilian Journal of Plant Physiology 16(1): 1-6.
Erwiyono, R. 2005. Lengas tanah dan turgiditas beberapa klon kopi Robusta di dataran aluvial berpola
hujan musiman. Pelita Perkebunan 21: 113-130.
Hulupi, R., Rahardjo, P. and Mawardi, S. 1997. Pewarisan abnormalitas biji pada kopi Arabika. Pelita
Perkebunan, 13, 53-62.
Kumar, D. 1979. Some aspect plant-water-nutrient relationships in Coffea arabica L. Kenya Coffee 44:
15-21
Nunes, M.A. 1976. Significance of plant water deficits to growth and yield: a review. Journal of Coffee
Research 6: 4-21.
Nur, A.M. and Zaenudin. 1992. Adaptasi beberapa klon kopi Robusta terhadap tekanan kekeringan. Pelita
Perkebunan 8: 55-60.
Nur, A.M. and Zaenudin. 1999. Perkembangan buah dan pemulihan pertumbuhan kopi Robusta akibat
cekaman kekeringan. Pelita perkebunan 15: 162-174.
Pinheiro, H.A., DaMatta, F.M., Chaves, A.R.M., Loureiro, M.E. and Ducatti, C. 2005. Drought tolerance
is associated with rooting depth and stomatal control of water use in clones of Coffea canephora.
Annals of Botany 96: 101-108.
Schmidt, F.H. and Ferguson, J.H.A. 1951. Rainfall types based on wet and dry period ratios for Indonesia
with Western New Guinea. Verhandelingen no. 42, Kementerian Perhubungan Djawatan
Meteorologi dan Geofisika, Jakarta
Sumirat, U. 2008. Dampak musim kemarau panjang terhadap karakteristik biji kopi Robusta. Pelita
Perkebunan 24(2): 80-94.
United States Department of Agriculture. 2014. Coffee: World market and trade. Circular series, June.
Retrieved on July 30, 2014 http://www.fas.usda.gov/commodities/coffee.
Wrigley, G. 1988. Coffee. Longman, London.
Wormer, T.M. 1964. Normal and abnormal development of coffee berries. Kenya Coffee 29: 91-106.
Wintgens, J.N. 2004. The Coffee Plant, In: Wintgens, J.N. (ed). Coffee: Growing, Processing, Sustainable
Production. WILEY-VCH Verlag GmbH & Co. KgaA, Weinheim. Pp. 3-24.
Yahmadi, M. 1973. Pengaruh kemarau panjang terhadap tanaman kopi. Menara Perkebunan 41: 235-240.
Page 113
ISBN 978-967-10840-4-5
Proc. Int. Conf. Plt. Phy. 2014
First Published, 2015
107
Glycosidases Activity in Salinity-Tolerant Rice Grown on Saline Soil under
Malaysia Condition
Aziz, A.1,*, Fatinah, A.A.
2, Hidayah, M.S.
2, Abdullah, M.Z.
1 and Marziah, M.
3
1School of Science and Food Technology, Universiti Malaysia Terengganu, Kuala Terengganu,
Terengganu, Malaysia. 2School of Fundamental Science, Universiti Malaysia Terengganu, Kuala Terengganu, Terengganu
Malaysia. 3Department of Biochemistry, Universiti Putra Malaysia, 43400 Serdang, Selangor, Malaysia.
*E-mail: [email protected]
Introduction
Rice is well known for carbohydrate source and also one of the major staple food consumed widely by
human population all over the world, especially in Asian countries. Demand for the sufficient rice supply
increased yearly with increasing human population. However, its production can be influenced by the
abiotic stresses, the uncontrollable limitating factors, worldwide. Salinity in the soil is one of the abiotic
factors that become the main cause in yield reduction of the crop (Kumar et al., 2010). Salinity lowers the
osmotic potential, nutritional disruption and alters various metabolic pathway that lead to morphological
and physiological changes (Ashraf and Harris, 2004; Yang et al., 2008). Under salinity stress condition,
plants possess various defense strategies, including homeostasis mechanisms of mineral ions (Sairam et
al., 2005) and carbohydrate (Gupta et al., 2011). Salinity stress inhibits starch accumulation due to the
limited rate of photosynthesis (Danai-Thambale et al., 2011). Under such condition, glycosidase enzyme
plays a role in carbohydrate homeostasis by breaking down the polysaccharide into simple sugar which is
subsequently utilized as energy in metabolism (Sekhwal et al., 2013). Carbohydrate degradation during
growth and development phases may differ between genotypes (Zhen at el., 2012). This paper reports the
reducing sugar content and glycosidase enzyme activity in three salinity tolerant rice genotypes grown on
saline soil under Malaysian condition.
Materials and Methods
Plant material and treatment
Three salt-tolerant rice genotypes, namely SS1-40 [IR 66946-3R-178-1-1(FL 478)], SS1-41 [CSR 28] and
SS1-42 [IR 55179-3B-11-3] were obtained from International Rice Research Institute (IRRI), Los Banos,
and Laguna, Philippines. The experimental design used was Completely Randomized Design and carried
out in glass house. Selected seeds were germinated and sown for 15 days in normal soil and subsequently
transferred to saline soil for salinity treatment. The soil was taken from Kemasin, Bachok, Kelantan and
filled in a planting trough located in the green house at Universiti Malaysia Terengganu. Triplicates were
used for each genotype. The salinity level of the soil in the trough was adjusted to EC 8 ds/m with
seawater. Plants were observed daily and the water level, pH and salinity were monitored weekly. For
enzyme and reducing sugar quantification, one healthy leaf from each genotype was harvested during the
vegetative (45 days after seeding), reproductive (70 days after seeding) and ripening (90 days after
seeding) stages. The required morphological traits were recorded accordingly.
Reducing sugar content
The total reducing sugar content was measured according to Nelson (1944) and Somogyi (1952). Each
sample was ground in ice-cold distilled water at ratio 1:1 (w/v) and centrifuged at 2,000X g for 15 min.
Page 114
ISBN 978-967-10840-4-5
Proc. Int. Conf. Plt. Phy. 2014
First Published, 2015
108
Then, 1.0 ml supernatant was added with 2.0 ml sodium phosphate buffer (pH 6.4). Subsequently, 0.5 ml
solution was mixed with 0.5 ml distilled water and 1.0 ml Nelson reagent. The mixture was incubated in a
water bath at 100 C for 20 min. The solution was cooled to room temperature, added with 1.0 ml
Arsenomolybdate reagent and made up the volume to 10 ml with distilled water. Absorbance was read at
510 nm using spectrophotometer. The reducing sugar content was calculated based on glucose standard
curve.
Glycosidase assay
At harvest, one gram of fresh leaf was homogenated using a mortar and pestle at 4 C with 5.0 ml
extraction buffer; McIlvaine buffer (pH 5) for β-glucosidase, McIlvainne buffer (pH 3.5) for β-
galactosidase and acetate buffer (pH 4.7) for amylase and invertase. Each homogenate was centrifuged at
10,000X g for 20 min at 4 C. The supernatant was discovered and used for the assay or stored at -20 C.
Amylase (EC 3.2.1.1) activity was measured according to Niku-Paavola et al. (1972). One ml of 1% (w/v)
starch dissolved in 100 mM acetate buffer (pH 4.7) was added to 250 μl of crude enzyme. The mixture
was incubated at 27 C for 15 min. Subsequently, 2.0 ml dinitrosalicyclic acid (DNS) reagent was added
and boiled in water bath for 5 min. The volume was adjusted to 10 ml with 1 ml potassium sodium
tartrate and distilled water. Absorbance was measured at 560 nm using spectrophotometer. The
absorbance readings were compared against maltose standard.
Invertase (EC 3.2.1.26) activity was measured according to Perumalla et al. (1994). One ml of 2% (w/v)
starch dissolved in 20 mM acetate buffer (pH 4.7) was added to 250 μl crude enzyme. The solution was
incubated at 27 C for 30min. Then, 1.0 ml Nelson-Somogyi's solution was added and boiled for 5 min.
The mixture was then cooled and 0.5 ml Nelson's Arsenomolybdate solution was added followed by
addition of 4 ml distilled water. It was mixed well and absorbance was measured at 650 nm using
spectrophotometer and compared against glucose standard.
β-glucosidase and β-galactosidase assay were conducted as the method described by the Alcantara et al.
(2006). An amount of 0.2 ml p-nitrophenol glycosidase (pNPG) substrate was added with 10 µl of crude
extract in 10 µl McIlvaine buffer of pH 3.2 for β-galactosidase and pH 5 for β-glucosidase. The mixtures
were incubated in the water bath at 30 C for 20 min. The reaction was stopped by the addition of 1.0 ml
of 0.2 M Na2CO3. The amount of p-nitrophenol (pNP) released was measured using spectrophotometer at
420 nm. The specific enzyme activity was quantified by the total activity per total protein. One unit of
enzyme released was defined as the amount of enzyme that released 1 µmol pNP per minute from pNP-
Gal. Total protein concentration was estimated according to Bradford method (Bradford, 1976), with
Bovine Serum Albumin (BSA) as the standard, using spectrophotometer at 595 nm. One unit of enzyme
(UE) is defined as the amount of enzyme that released one mol of pNP from pNPG per ml per min under
the assay condition. The specific activity is expressed as UE per mg of protein.
Statistical analysis
Data were subjected to normality test and statistically analyzed using multi-variance and the significant
differences were identified by post hoc Tukey’s honestly significant difference (HSD) test at p<0.05 using
Statistical Package for Social Sciences (SPSS).
Results and Discussion
The salinity stress was found to alter the morphological traits of the three genotypes (Table 1). Salinity
stress reduced the length of leaves, panicles and height of plants of SS1-40 and SS1-42, but increased
Page 115
ISBN 978-967-10840-4-5
Proc. Int. Conf. Plt. Phy. 2014
First Published, 2015
109
these parameters in SS1-41. However, no significant difference was observed on the width of leaves.
Salinity stress also affected the leaf angle, type of panicles and leaf senescence, but genotype specific.
Interestingly, variety SS1-42 exhibited early and faster leaf senescence than the control plant. Early
senescence is a good trait for rice; however, its mechanism remained unclear (Liu et al., 2008).
Reducing sugar content
Results showed that reducing sugar content in rice leaf was not significantly different between the control
and under salinity stress (Figure 1). The level of reducing sugar in the leaves is dependent on the
portioning of sugar and starch accumulation. Rice accumulates starch instead of sugar during salinity
stress (Pattanagul and Thitisaksakul, 2008; Danai-Tambhele et al., 2011). In addition, the reducing sugar
content was higher during the reproduction stage compared to vegetative and ripening stages.
Table 1. The morphology traits of rice genotypes under control and salinity treatment.
Morphological traits
SS1-40 SS1-41 SS1-42
Control Salinity
Treatment Control
Salinity
Treatment Control
Salinity
Treatment
Flag-leaf length (cm) 38.5±0.5 25.5±0.5 16.3±2.3 33.6±1.0 35.5±0.5 28.6±2.2
Flag-leaf width (cm) 1.3±0.2 1.4±0.2 1.1±0.1 1.3±0.2 1.4±0.2 1.3±0.2
Leaf length (cm) 58.0±2.0 25.6±2.2 13.5±0.5 52.5±0.5 37.0±0.8 38.9±0.2
Leaf width (cm) 1.0±0.3 0.8±0.1 1.0±0.08 1.2±0.3 1.0±0.3 1.0±0.3
Panicle length (cm) 20.8±1.0 17.4±0.6 19.3±2.3 22.0±2.0 18.5±0.5 18.1±0.1
Seedling height (cm) 78.3±2.3 65.3±2.3 87.8±1.0 93.0±3.0 84.0±0.8 73.2±0.5
Leaf angle Erect Erect Erect Erect Erect Droopy
Panicle type Compact Compact Compact Inter-mediate Intermediate Compact
Leaf senescence Slow Late and slow Slow Slow Intermediate Early and fast
Flag-leaf angle Erect droopy Erect Erect Erect Erect
Data are means ± Sd
Glycosidase activity
Amylase activity was influenced by the salinity stress during the vegetative and reproductive stages
(Figure 1). Its activity was lower than control plant during the vegetative stage, but higher during the
reproductive stage. Under normal condition, both amylase and invertase enzymes were high during the
vegetative stage, but gradually reduced during the reproductive to ripening stages. On the other hand,
under salinity stress, no significant difference in amylase activity was observed during the vegetative and
reproductive stages. However, invertase activity increased during the reproductive stage (Figure 2) and
drastically dropped during the ripening stage. This phenomenon suggesting salinity stress triggered the
starch and sucrose degrading activity in rice leaves under salinity stress. However, the reducing sugar
content in the leaves during these stages was altered by salinity stress. This might be due to active
carbohydrate rearrangement and transportation during the reproductive stage.
Glucosidase and galactosidase activities were not significantly different between control and salinity
treated plant (Figures 2 and 3). The enzyme activities varied between genotypes and growth stages.
Galactosidase activity was highest during the ripening phase (Figure 3). This might be due to its
biological functions in fruit ripening, remodeling of carbohydrate for storage (Alcantara et al., 2006) and
plant senescence (Tanthanuch et al., 2008). In addition, glycosidase activity is important in hydrolysis of
the bond in starch to produce smaller molecules of monosaccharides that are crucial for cereal production
(Santosh et al., 1999). Glycoside hydrolases carry out many functions in plants such as starch metabolism,
transport, mechanism against biotic and abiotic stress and cell wall remodeling (Sekhwal et al., 2013).
Page 116
ISBN 978-967-10840-4-5
Proc. Int. Conf. Plt. Phy. 2014
First Published, 2015
110
Figure 1. The reducing sugar content (left) and amylase activity (right) in leaves of three rice genotypes,
(A) SS1-40, (B) SS1-41 and (C) SS1-42, during the three different growth stages.
Page 117
ISBN 978-967-10840-4-5
Proc. Int. Conf. Plt. Phy. 2014
First Published, 2015
111
Figure 2. Invertase activity (leaf) and glucosidase activity (right) in leaves of three rice genotypes, (A)
SS1-40, (B) SS1-41 and (C) SS1-42, during the three different growth stages.
Page 118
ISBN 978-967-10840-4-5
Proc. Int. Conf. Plt. Phy. 2014
First Published, 2015
112
Figure 3. Galactosidase activity in leaves of three rice genotypes, (A) SS1-40, (B) SS1-41 and (C) SS1-
42, during the three different growth stages.
Conclusions
The three rice genotypes used in this study exhibited similar physiological characteristics under normal
and salinity stress. Amylase and invertase were two enzymes that were significantly influenced by salinity
stress during the reproduction stage.
Acknowledgements
The authors would like to thank The Director of International Rice Research Institute (IRRI), Los Banos,
and Laguna, Philippines, for supplying the rice seeds and Government of Malaysia (KPT-Grant) for
research funding under LRGS (Rice-Food Security) Research Grant.
Page 119
ISBN 978-967-10840-4-5
Proc. Int. Conf. Plt. Phy. 2014
First Published, 2015
113
References
Alcantara, P.H.N., Martim, L., Silva, C.O., Dietrich, S.M.C. and Buckeridge, M.S. 2006. Purification of a
β-galactosidase from cotyledons of Hymenaea courbacil L. (Leguminose). Enzyme properties
and biological function. Plant Physiology and Biochemistry 44: 619-627.
Ashraf, M. and Harris, P.J.C. 2004. Potential biochemical indicators of salinity tolerance in plants. Plant
Science 166: 3-16.
Bradford, M.M. 1976. A rapid and sensitive method for quantitation of microgram quantities of protein
utilizing the principle of protein-dye-binding. Analytical Biochemistry 72: 248-254.
Danai-Tambhale S., Kumar, V. and Shriram, V. 2011. Differential response of two scented indica rice
(Oryza sativa) cultivars under salt stress. Journal of Stress Physiology & Biochemistry 7: 4.
Gupta, A.K., Kaur, K. and Kaur, N. 2011. Stem reserve mobilization and sink activity in wheat under
drought conditions. American Journal of Plant Sciences 2: 70-77.
Kumar, V., Shriram, V., Kavi Kishor, P.B., Jawali, N. and Shitole, M.G. 2010. Enhanced proline
accumulation and salt stress tolerance of transgenic indica rice by over expressing P5CSF129A
gene. Plant Biotechnology Reports 4(1): 37-48.
Liu, L, Zhou, Y., Zhou, G., Ye, R., Zhao, L., Li, X. and Lin, Y. 2008. Identification of early senescence-
associated genes in rice flag leaves. Plant Molecular Biology 67: 37-55.
Nelson, N. 1944. Photometric adaptation of the Somogyi method for determination of glucose. The
Journal of Biological Chemistry 53: 375-380.
Niku-Paavola, M.L., Nummi, M., Kachkin, A., Daussant, J. and Enari, T.M. 1972. The isoelectric
focusing electrophoresis of wheat beta-amylases. Cereal Chemistry 49: 580-585.
Pattanagul, W. and Thitisaksakul, M. 2008. Effect of salinity stress on growth and carbohydrate
metabolism in three rice (Oryza sativa L.) cultivars differing in salinity tolerance. Indian Journal
of Experimental Biology 46: 736-742.
Perumalla, C.J., Hellebust, J.A. and Goldman, C.A. 1994. Invertase activity in root growth. In: Goldman,
C.A. (Ed.). Tested studies for laboratory teaching, Volume 15. Proceedings of the 15th
Workshop/Conference of the Association for Biology Laboratory Education (ABLE). Pp.93-108.
Sairam, R.K., Srivastava, G.C., Agarwal, S. and Meena, R.C. 2005. Differences in response to salinity
stress in tolerant and susceptible wheat genotypes. Biologia Plantarum 49(1): 85-91.
Santosh, T.R., Balasubrahamaniam, K.K. and Latitha, K. 1999. Enhancement of β-galactosidase of
Trigonella foenum-graecum by exposure to the allelochemical mimosine. Journal of Agriculture
Food Chemistry 47: 462-467.
Sekhwal, M.K., Sharma, V. and Sarin, R. 2013. Annotation of glycoside hydrolases in Sorghum bicolor
using proteins interaction approach. Journal of Proteome Science & Computational Biology.
DOI: 10.7243/2050-2273-2-2.
Somogyi, M. 1952. Notes on sugar determination. Journal of Biological Chemistry 195: 19-23.
Tanthanuch, W., Chantarangsee, M., Maneesan, J. and Ketudat-Cairns, J. 2008. Genomic and expression
analysis of glycosyl hydrolase family 35 genes from rice (Oryza sativa L.). BMC Plant Biology
8: 84.
Yang, C., Shi, D. and Wang, D. 2008. Comparative effects of salt and alkali stresses on growth, osmotic
adjustment and ionic balance of an alkali-resistant halophyte and ionic balance of an alkali-
resistant halophyte Suaede glauca (Bge). Plant Growth Regulation 56: 179-190.
Zhen, Z.H., Liu, Q., Song, H.X., Rong, X.M. and Ismail, A.M. 2012. Responses of different rice (Oryza
sativa L.) genotypes to salt stress and relation to carbohydrate metabolism and chlorophyll
content. African Journal of Agricultural Research 7: 19-27.
Page 120
ISBN 978-967-10840-4-5
Proc. Int. Conf. Plt. Phy. 2014
First Published, 2015
114
Solar UV-B and UV-A/B Exclusion Effects on Intraspecific Variations in
Physiological Responses of Wheat Varieties
Kataria, S.*, Baroniya, S.S. and Guruprasad, K.N.
School of Life Sciences, Devi Ahilya University, Khandwa Road, Indore 452 001, India.
*E-mail: [email protected]
Introduction
Plants are inevitably exposed to solar UV-B radiation, since they are immobile. Owing to natural
latitudinal gradient in total atmospheric ozone column thickness, prevailing solar angles, elevation above
sea level and optical amplification effect, natural variations in UV-B irradiances at the ground are
produced (Ballare et al., 2011). The attenuation of the stratospheric ozone has led to the enhanced UV-B
radiation on the surface of land in recent decades (Ballare et al., 2011). The amount of UV-B radiation
reaching tropical latitudes is higher than in temperate because the lower solar zenith angle leads to a less
atmospheric UV-B absorption in tropics. The significant declining trend in total ozone column (TOC)
confirm at numerous stations lying in the northern India suggesting the potential vulnerability of plants to
increased UV-B under field conditions (Sahoo et al., 2005). Numerous studies have shown that enhanced
and ambient UV-B radiation can affect physiological and biochemical processes of many plant species,
including altered plant photosynthesis (Kataria and Guruprasad, 2012a; Kataria et al., 2013), changes in
the carbon partitioning from growth pools to secondary metabolic pathways (Bassman, 2004), and thus
changes in crop morphology, crop reproductive organ abortion and yield reduction (Mohammed and
Tarpley, 2010; Kataria et al., 2013).
Wheat is one of the major world food crops, the main regions of wheat production are tropics and
subtropical regions. The effects of enhanced UV-B radiation on intraspecific responses in wheat has been
extensively studied on physiology and yield but with the majority of studies considering the effect of
enhanced UV-B radiation with lamp supplementation on the physiological and biochemical aspects (Li et
al., 2000) in growth chambers and greenhouses where the unnatural spectral balance of radiation can lead
to unrealistic conclusions, which may have substantially changed plant sensitivity to UV-B. It is
important in experiments to maintain a realistic balance between various spectral regions since both UV-
A (315-400 nm) and visible (400-700 nm) radiation can have ameliorating effects on responses of plants
to UV-B (Caldwell et al., 1995). Unfortunately, very few studies have been conducted under field
conditions to assess the effects of ambient UV-B and UV-A radiation on intraspecific responses in terms
of growth and yield of wheat (Kataria and Guruprasad, 2012b) by the exclusion of solar UV components.
However, the effects of ambient UV-B and UV-A radiation on intraspecific responses in terms of
physiological characteristics like chlorophyll fluorescence, gas exchange parameters and the enzymes
involved in carbon and nitrogen metabolism like Carbonic anhydrase, Rubisco and Nitrate Reductase
(NRA) in wheat varieties has not been investigated yet.
In this study, we grew wheat varieties in field under ambient and reduced levels of UV-B radiation with
the objective to (1) determine, UV-B and UV-A radiation affects wheat physiology under field
conditions; and (2) assessment of the intraspecific differences in physiological response of four wheat
varieties to UV-B/UV-A radiation in the fields. We hypothesized that exclusion of UV-B radiation will
increases specific leaf weight and chlorophyll content, and affects other physiological processes, i.e.
carbon fixation by increased PSII efficiency and reducing power will result in the increased activity of
CA, Rubisco and nitrogen fixation by increase in Nitrate Reductase activity which will ultimately
increased the yield of wheat varieties. These changes will results in intraspecific differences in
physiological response under field conditions
Page 121
ISBN 978-967-10840-4-5
Proc. Int. Conf. Plt. Phy. 2014
First Published, 2015
115
Materials and Methods
Seeds of Indian wheat (Triticum aestivum L.) varieties; Naveen Chandausi (HI 1418), Swarna (HI 1479),
Vidisha (DL 788-2) and Purna (HI 1544) were collected from Regional Wheat Research Station, Indian
Agriculture Research Institute, Indore. Field experiments under natural sunlight were conducted in the
Botanical Garden of School of Life Sciences, Indore (2244
-N), India. The experiments were carried out
during October 2012 to January 2013 when the average daily solar UV-B dose was approximately 50%
higher than the average daily dose received in the temperate region. Seeds were sown in the field area of
160 cm ×160 cm in 120 cm rows planted 23 cm apart with 5 cm plant spacing within the row under iron
cages of dimensions [4 feet L × 4 feet W × 5 feet H]. The iron cages were wrapped with UV cut-off
Polyester filters (Garware polyester Ltd., Mumbai) that selectively cut-off UV-B (<315 nm) and UV-A/B
(<400 nm) radiation. Two types of controls were taken for the present study; plants were grown either in
the cages covered with polythene filter that transmits all the ambient solar radiation (filter control FC) or
in open field without any filters, exposed to natural solar radiation (open control OC). Absolute solar
irradiance without UV-B or UV-A/B was measured using a radiometer (Solar Light Co. Inc. (PMA 2100),
Glenside, PA, U.S.A.).
Growth data collection and analysis
Plants were sampled randomly in triplicates from all the treatments at 80 days after the emergence of
seedlings (DAE). After 80 DAE the sampled plants in each plot were harvested and taken to the
laboratory. The roots of the plants were gently washed in water to remove soil particles, biomass was
determined on a top-loading balance. For total biomass accumulation, the above ground parts of the plants
and for leaf biomass, leaves were oven-dried at 105 C for 24 h to constant weight. Area of flag leaves was
measured using portable laser leaf area meter CID-202 scanning planimeter (CID Inc., USA).
Subsequently, plants were dried to a constant weight at 60 C, and the specific leaf weight (SLW; ratio of
leaf dry weight to leaf area) of flag leaves was determined.
Physiological and biochemical measurements
Photosynthetic pigment, total chlorophyll was extracted from the flag leaves of wheat varieties with 80%
acetone at 80 DAE. The amount of total chlorophyll was quantified using the formulae of Wellburn and
Lichtenthaler (1984). Accumulation of UV-B absorbing substances (UAS) was determined
spectrophotometrically from acidified methanol extract by the method of Mazza et al. (1999).
Chlorophyll a (Chl a) fluorescence induction kinetics of dark-adapted (30 min) flag leaves of each variety
of wheat was measured using a Handy PEA fluorimeter (Plant Efficiency Analyzer, Hansatech
Instruments, King’s Lynn, Norfolk, UK). The JIP-test parameters were calculated by using a chlorophyll
fluorescence analyzing program (Biolyzer HP 3 software, Bioenergetics Laboratory, University of
Geneva, Switzerland). Net photosynthesis (Pn, µmol CO2 m-2
s-1
) and stomatal conductance (gs, mol H2O
m-2
s-1
) was measured by a portable photosynthetic system (Li- 6200, LI-COR Inc., Lincoln, Nebraska,
Serial No. PPS 1332 USA) in intact plants grown in normal sunlight or UV excluded sun light under field
conditions.
Carbonic anhydrase (CA) activity was determined by the method described by Li et al. (2004). Rubisco
activity was measured according to the method of Singh and Singh (2001) by ribulose-1,5-bisphosphate
dependent incorporation of 14
CO2 into acid-stable product which was estimated by liquid scintillation
counting in fully opened matured flag leaves at 80 DAE of each variety of wheat. Soluble protein content
was estimated by the method of Lowry et al. (1951) using Bovine serum albumin (BSA) as a standard.
Page 122
ISBN 978-967-10840-4-5
Proc. Int. Conf. Plt. Phy. 2014
First Published, 2015
116
Nitrate reductase activity (NRA) in the flag leaves was determined by the intact tissue assay method of
Jaworski (1971).
Results and Discussion
To the best of our knowledge, this is the first report to suggest the existence of intraspecific responses to
ambient UV radiation under field conditions in terms of photosynthetic characteristics like Chl a
fluorescence and the activities of enzymes like CA, Rubisco and NRA in wheat varieties. Exclusion of
ambient UV radiation from solar spectrum significantly enhanced many components of the growth and
biomass allocation of wheat varieties (Kataria and Guruprasad, 2012a). The result indicated that leaf area,
specific leaf weight and leaf weight ratio were increased in all the four varieties of wheat grown without
UV compared with those grown under ambient UV. Out of the four varieties of wheat, two varieties
Purna and Vidisha showed significant enhancement in leaf weight ratio and specific leaf weight (SLW). A
maximum of 43% increase in leaf weight ratio was observed after the exclusion of UV-B and UV-A/B
respectively in variety Vidisha. SLW was also enhanced 24% by removal of UV-B alone and UV-B
along with UV-A in variety Vidisha. It indicates that plant grown in ambient conditions like OC and FC,
the leaf weight ratio and SLW was decreased, the decrease in leaf thickness may have increased the UV-B
penetration within leaves and it leads to decreased photosynthetic rates and dry weight accumulation in
OC and FC plants. Whereas UV exclusion increased the LWR and SLW, indicates larger biomass
partition to leaves and increased leaf thickness. Similar results were observed in other UV-B exclusion
studies like in Vaccinium uliginosum and Sorghum bicolor (Albert et al., 2010; Kataria and Guruprasad,
2012a).
Changes in photosynthetic characteristics have often been used as an index to assess crop sensitivity to
UV-B radiation. Photosynthetic pigments like Chlorophyll b was significantly increased while
chlorophyll a increased to a lesser extent, leading to a decrease in chlorophyll a/b ratio in UV excluded
plants in all the four varieties. The total chlorophyll content was also higher after the exclusion of UV
radiation. Similarly, Under UV-B exclusion, chlorophyll content of C3 and C4 leaves was higher and the
chlorophyll a/b ratio was lower compared to ambient controls (Kataria et al., 2013). Polyphasic
chlorophyll a fluorescence (OJIP) transients from UV excluded plants gave a higher fluorescence yield at
I–P phase in wheat variety Purna and Vidisha whereas other two varieties do not show any significant
changes (Figure 1). The performance index (PIABS) is a function of three independent functional steps of
photosynthesis, the density of reaction centers in the chlorophyll bed (RC/ABS), excitation energy
trapping (Φpo) and conversion of excitation energy to electron transport (Ψo). PIABS was increased in all
the four varieties of wheat studied. PIABS was maximally increased by 75% after exclusion of UV-B and
21% after UV-A/B exclusion as compared to the filter control in wheat variety- Purna.
Net photosynthesis rate in terms of CO2 absorbed and the stomatal conductance was significantly
enhanced in the three varieties of wheat by the exclusion of UV-B alone and exclusion of UV-A along
with UV-B. But the magnitude of enhancement was more by the exclusion of UV-B as compared to
exclusion of UV-A along with UV-B in all the four varieties. UV-B exclusion caused greater
enhancement in net rate of photosynthesis in Purna (52%) and Vidisha (48%) than in Swarna (13%) and
N. Chandausi (24%) as compared to their filter control. A similar observation of enhancement in the PSII
efficiency and net rate of photosynthesis after exclusion of UV-B has been made in many plant species
(Albert et al., 2010; Kataria et al., 2013)
Page 123
ISBN 978-967-10840-4-5
Proc. Int. Conf. Plt. Phy. 2014
First Published, 2015
117
0.01 0.1 1 10 100 1000
1
2
3
4
5
6 Naveen Chandausi
P
I
J
O
Flu
rosc
ence
In
ten
sity
(a.
u.)
Time (ms)
OC
FC
-UV-B
-UV-A/B
0.01 0.1 1 10 100 1000
1
2
3
4
5
6
Swarna
P
I
J
O
Flu
rosc
ence
In
ten
sity
(a.
u.)
Time (ms)
OC
FC
-UV-B
-UV-A/B
0.01 0.1 1 10 100 1000
1
2
3
4
5
6
VidishaP
I
J
O
Flu
ores
ecn
ce I
nte
nsi
ty (
a.u
.)
Time (ms)
OC
FC
-UV-A/B
-UV-B
0.01 0.1 1 10 100 1000
1.0
1.5
2.0
2.5
3.0
3.5
4.0
4.5
5.0
5.5
6.0
Purna
P
I
J
O
Flu
ores
cen
ce I
nte
nsi
ty (
a.u
.)
Time (ms)
OC
FC
-UV-B
-UV-A/B
Figure 1. Changes in Polyphasic chlorophyll a fluorescence (OJIP) transient curves in four wheat
varieties of wheat leaves after UV Exclusion.
Page 124
ISBN 978-967-10840-4-5
Proc. Int. Conf. Plt. Phy. 2014
First Published, 2015
118
The two enzymes involved in CO2 assimilation and carbon fixation in C3 plants like Wheat, Carbonic
anhydrase (CA) and Rubisco were examined for carboxylase activity. CA and Rubisco activity were
higher in all the four varieties of wheat by the exclusion of UV. The maximum enhancement in activity of
CA was observed in Purna (83%) by exclusion of solar UV-B as compared to FC, which is followed by
(39%) in Vidisha, (32%) in Swarna and minimum enhancement was found in N. Chandausi (23%)
(Figure 2A). The Rubisco activity was also remarkably enhanced by UV-B exclusion in Purna (88%)
which is followed by (49%) in Vidisha, (27%) in Swarna and minimum enhancement was found in N.
Chandausi (17%) (Figure 2B). The total soluble protein content was also increased in all the four varieties
of wheat.
Nitrate reductase (NRA; EC 1.6.6.4) is a key enzyme of N metabolism, which converts nitrate (NO3_) into
nitrite (NO2_) on the metabolic pathway leading to the formation of amino acids (Canovas et al., 2007). In
this study, exclusion of UV led to an induction in NR activity in flag leaves of all the four varieties of
wheat when compared to the filter control treatment. The extent of promotion was greater after exclusion
of UV-B as compared to the exclusion of UV-A/B. Maximum enhancement in NR activity was shown by
Purna (86%) after exclusion of solar UV-B as compared to FC, which is followed by (57%) in Vidisha,
(47%) in Swarna and minimum enhancement was found in N. Chandausi (36%) (Figure 2C). Moreover,
enhanced UV-B has been found to inhibit growth and decrease NR activity in dragon spruce (Picea
asperata Mast.) needles (Yao and Liu, 2007). We have not come across any report of enhanced activity of
CA, Rubisco and NR concurrently after exclusion of ambient UV-B and UV-A/B in higher plants as
presented here. Although earlier we have reported, the enhancement in Rubisco and CA activity by
exclusion of solar UV-B independently in different plant species (Kataria et al., 2013).
Exclusion of UV significantly enhanced photosynthetic capacity as a consequence of increased efficiency
of PS II, increased rate of photosynthesis and stomatal conductance along with a remarkable increase in
carbonic anhydrase, Rubisco and nitrate reductase activities. Thus UV exclusion increased light
utilization efficiency, CO2 fixation and nitrogen fixation and channelized the additional fixation of carbon
and nitrogen towards the improvement of yield in wheat varieties. In the present study, increased in grain
yield was more pronounced in both the sensitive varieties of wheat (Purna and Vidisha); these results are
in agreement with the earlier reports showing the increase in grain yield by the exclusion of UV (Kataria
and Guruprasad 2012b; Kataria et al., 2013). Germ et al. (2005) found that exclusion of UV-B from the
solar radiation led to more than double the yield of pumpkin fruits. The reason for yield reduction by
ambient UV-B may be due to alterations in plant vegetative and reproductive growth, e.g., plant stunting,
flower suppression and/or delay of flowering and lower ear/pod set.
Page 125
ISBN 978-967-10840-4-5
Proc. Int. Conf. Plt. Phy. 2014
First Published, 2015
119
0
0.5
1
1.5
2
2.5
3
3.5
N. Chandausi Swarna Vidisha Purna
Ca
rb
on
ic A
nh
yd
ra
se A
cti
vit
y
(un
its/
mg
FW
)
Wheat Varieties
A OC FC -UV-B -UV-A/B
0
50
100
150
200
250
300
N. Chandausi Swarna Vidisha Purna
Ru
bis
co
Acti
vit
y
(m
ole
14
CO
2fi
xed
/m2/s
ec
Wheat Varieties
B
0
5
10
15
20
25
30
35
N. Chandausi Swarna Vidisha PurnaNR
Acti
vit
y (
nm
NO
2/1
00 m
g
fresh
weig
ht/
hr)
Wheat Varieties
C
Figure 2. Effect of exclusion of UV-B and UV-A/B on Carbonic anhydrase (A), Rubisco activity (B) and
NRA activity (C) in wheat varieties.
Page 126
ISBN 978-967-10840-4-5
Proc. Int. Conf. Plt. Phy. 2014
First Published, 2015
120
Conclusions
Photosynthetic characteristics can be used as indicators of the sensitivity of wheat varieties to ambient
UV-B radiation under field conditions. In all the four wheat varieties, the responses of each
photosynthetic characteristic to ambient UV-B radiation were different. In this study, stomatal
conductance, net photosynthetic rate and the activity of CA and Rubisco were significantly enhanced by
the exclusion of UV-B radiation. Thus, they might be used as response-indicators for assessing the
sensitivity of plant to UV-B radiation. The magnitude of response for UV exclusion for all the measured
parameters was higher in two varieties; Vidisha and Purna in terms of photosynthetic CO2 assimilation,
PSII photochemistry, pigments, UV-B radiation absorbing ability, nitrogen fixation, grain yield and leaf
biomass. On the other hand, not much UV-B damaging effects were observed in the other two varieties;
Swarna and N. Chandausi because these varieties have higher levels of photosynthetic CO2 assimilation,
reduced damaging effect on photochemistry coupled with higher levels of pigments, and better UV-B
screening ability, high nitrogen fixation, grain yield and leaf biomass. Intraspecific differences were
found for different measured parameters; apart from variety- Vidisha all the three varieties are more
responsive to exclusion of UV-B. Sensitivity of four Indian wheat varieties to ambient level of UV (290–
400 nm) radiation at Indore (2244
-N), India had the following sequence; N. Chandausi > Swarna >
Vidisha > Purna. Thus Purna was the most sensitive and Naveen Chandausi the least sensitive to current
level of solar UV radiation in India. The least sensitive varieties may be used in the development of new
varieties tolerant to higher levels of UV-B in future attempts in plant breeding programmes.
Acknowledgements
Financial support by Department of Science Technology Women Scientists-A Scheme (SR/WOS-A/LS-
674/2012-G) to Dr. S. Kataria is thankfully acknowledged
References
Albert, K.R., Mikkelsen, T.N., Ro-Poulsen, H., Michelsen, A., Arndal, M.F., Bredahl, L., Hakansson,
K.B., Boesgaard, K. and Schmidt, N.M. 2010. Improved UV-B screening capacity does not
prevent negative effects of ambient UV irradiance on PSII performance in High Arctic plants.
Results from a six year UV exclusion study. Journal of Plant Physiology 167:1542-1549.
Ballaré, C.L., Caldwell, M.M., Flint, S.D., Robinson, A. and Bornman, J.F. 2011. Effects of solar
ultraviolet radiation on terrestrial ecosystems. Patterns, mechanisms, and interactions with
climate change. Photochemistry Photobiology Science 10: 226-241.
Bassman, J.H. 2004. Ecosystem consequences of enhanced solar ultraviolet radiation: secondary plant
metabolites as mediators of multiple trophic interactions in terrestrial communities.
Photochemistry Photobiology 79: 382-398.
Caldwell, M.M., Teramura, A.H. and Tevini, M. 1995. Effects of increased solar ultraviolet radiation on
terrestrial plants. Ambio 24: 166-173.
Canovas, F.M., Avila, C., Canton, F.R., Canas, R.A. and de la Torre, F. 2007. Ammonium assimilation
and amino acid metabolism in conifers. Journal of Experimental Botany 58: 2307-2318.
Germ, M., Kreft I. and Osvald, J. 2005. Influence of UV-B exclusion and selenium treatment on
photochemical efficiency of photosystem II, yield and respiratory potential in pumpkins
(Cucurbita pepo L.). Plant Physiology and Biochemistry 43: 445-448.
Kataria, S. and Guruprasad, K.N., 2012a. Intraspecific variations in growth, yield and photosynthesis of
sorghum varieties to ambient UV (280–400 nm) radiation. Plant Science 196: 85-92.
Kataria, S. and Guruprasad, K.N., 2012b. Solar UV-B and UV-A/B exclusion effects on intraspecific
variations in crop growth and yield of wheat varieties. Field Crops Research 125: 8-13.
Page 127
ISBN 978-967-10840-4-5
Proc. Int. Conf. Plt. Phy. 2014
First Published, 2015
121
Kataria, S., Guruprasad, K.N., Ahuja, S. and Singh, B. 2013. Enhancement of growth, photosynthetic
performance and yield by exclusion of ambient UV components in C3 and C4 plants.
Photochemistry Photobiology B: Biology 127: 140-152.
Li, X., Hou, J., Bai, K., Yang, X., Lin, J., Li, Z. and Kuang, T. 2004. Activity and distribution of carbonic
anhydrase in leaf and ear parts of wheat (Triticum aestivum L.). Plant Sciences 166: 627-632.
Li, Y., Zu, Y.Q., Chen, J.J., Chen, H.Y., Yang, J.L. and Hu Z.D. 2000. Intraspecific differences in
physiological responses of wheat cultivars to enhanced ultraviolet-B radiation under field
conditions. Environmental Experimental Botany 44: 95-103.
Lowry, O.H., Rosebrough, N.J., Farr, A.L. and Randall, R.J., 1951. Protein measurements with the Folin
phenol reagent. Journal of Biological Chemistry 193: 165-275.
Mazza, C.A., Battissta, D., Zima, A.M., Scwarcberg-Bracchitta, M., Giordano, C., Acevedo, A., Scopel,
A.L. and Ballare, C.L. 1999. The effects of solar ultraviolet-B radiation on the growth and yield
of barley are accompanied by increased DNA damage and antioxidant responses. Plant Cell
Environment 22: 61-70
Mohammed, A.R. and Tarpley, L., 2010. Differential response of Southern US rice (Oryza sativa L.)
cultivars to Ultraviolet-B radiation. Journal of Agronomy and Crop Science 196: 286-295.
Sahoo, A., Sarkar, S., Singh, R.P., Kafatos, M. and Summers, M.E. 2005. Declining trend of total ozone
column over the northern parts of India. International Journal of Remote Sensing 26: 3433-3440.
Singh, B. and Singh, B.K. 2001. Ribulose-1,5-Bisphosphate carboxylase/oxygenase content and activity
in wheat, rye and Triticale. Biologia Plantaum 44: 427-430.
Wellburn, A.R. and Lichtenthaler, H. 1984. Formulae and programme to determine total carotenoids and
chlorophylls a and b of leaf extracts in different solvents. In: Sybesma, C. (Ed.) Advances in
Photosynthesis Research, Martinus Nijhoff/Dr W Junk Publishers, Boston, Pp. 9-12.
Yao, X. and Liu, Q. 2007. Responses in growth, physiology and nitrogen nutrition of dragon spruce
(Picea asperata) seedlings of different ages to enhanced ultraviolet-B. Acta Physiologiae
Plantarum 29(3): 217-224.
Page 128
ISBN 978-967-10840-4-5
Proc. Int. Conf. Plt. Phy. 2014
First Published, 2015
122
Role of Salicylic Acid as a Plant Growth Regulator on Some Physiological
Features and Antioxidant Enzyme Activity in Ginger (Zingiber officinale
Roscoe)
Ali, G.* and Hawa, Z.E.J.
Department of Crop Science, Faculty of Agriculture, University Putra Malaysia, 43400 Serdang,
Selangor, Malaysia.
*E-mail: [email protected]
Introduction
Salicylic acid (SA) is classified as a phenolic compound, a group of substances that can regulate plant
growth (Amanullah et al., 2010). SA application influences a wide variety of plant processes, including
stomatal closure (Ananieva et al., 2002), plant growth and yield (Khodary 2004) and induction of
antioxidant synthesis (Ghasemzadeh and Jaafar, 2012; Yordanova and Popova, 2007). The effect of
salicylic acid on plant physiological processes varies depending on species, developmental stage, SA
concentration and environmental conditions (Shraiy and Hegazi, 2009). When SA was applied to leaves
of Phaseolus vulgaris and Commelina communis, transpiration rates decreased (Hayat et al, 2005),
however, increases in stomatal conductance and transpiration rate were observed in soybean and corn
leaves (Khan et al., 2008). In addition, rate of transpiration and internal CO2 increased in soybeans after
supplementation of SA (Kumar et al., 2009). Similarly, barley seedlings exposed to SA for one week
exhibited increases in CO2 compensation point and stomatal resistance and a decrease in photosynthetic
rate (Pancheva and Popova, 1998). In contrast to the above observations, application of SA increased
photosynthetic rate in maize and mustard plants (Fariduddin et al., 2011). Reactive oxygen species (ROS),
including hydrogen peroxide (H2O2), superoxide (O2−
), hydroxyl radical (HO−) and singlet oxygen, can
disrupt normal plant metabolism through oxidative damage to proteins, lipids, nucleic acids,
photosynthetic enzymes and pigments ( Fu and Huang, 2001). To overcome oxidative stress, plants have
developed enzymatic and non-enzymatic antioxidant defence mechanisms to scavenge ROS (Smirnoff,
1993). The most important antioxidant enzymes are peroxidase (POD; EC 1.11.1.7), catalase (CAT; EC
1.11.1.6) and superoxide dismutases (SOD; EC 1.15.1.1). SODs convert O2−
into H2O2 and O2, with CAT
and POD transforming H2O2 into H2O (Wang et al., 2009). Ginger (Zingiber officinale Roscoe) is a
traditional folk medicinal plant extensively used in Malaysian cooking. One of the most widely used
herbs, especially in Asia and contains several interesting bioactive constituents and possesses health-
promoting properties. In previous studies, we uncovered potent antioxidant and anticancer activities in
Malaysian young ginger (halia Bara and halia Bentong) (Ghasemzadeh and Jaafar, 2011). Useful
information regarding the effect of SA on growth of Malaysian ginger varieties, with their high levels of
beneficial compounds, is still scarce.
The objective of this study were (1) to examine the effect of SA foliar applications on net photosynthetic
rate, stomatal conductance, intercellular carbon and biomass production in two varieties of Malaysian
ginger, namely, halia Bentong and halia Bara, and (2) to determine the most effective SA concentration
and investigated alterations in nitrate reductase, POD, SOD and CAT activities.
Page 129
ISBN 978-967-10840-4-5
Proc. Int. Conf. Plt. Phy. 2014
First Published, 2015
123
Materials and Methods
Plant materials and cultivation
Rhizomes of ginger varieties halia Bentong and halia Bara were sprouted for two weeks in 10-cm
diameter pots filled with peat. Sprouted rhizomes were transferred to polyethylene bags (6 liter) filled
with a soilless mixture medium (burnt rice husks:coco peat, 1:1). The plants were raised in specially
constructed growth houses at the Glasshouse Complex, Universiti Putra Malaysia. Day and night
temperatures were 30±1.0 °C and 20±1.5 °C, respectively, and relative humidity was about 70–80%, 12-h
light photoperiod with an average photosynthetic photon flux density of 310 μmol m-2
s-1
. When the ginger
seedlings were at the second leaf stage, they were sprayed with two concentrations (10–3
and 10–5
M) of a
SA solution containing 2-hydroxybenzoic acid, 100 μL dimethyl sulfoxide, and 0.02% polyoxyethylene
sorbitan monolaurate (Tween-20; Sigma). Control plants were sprayed with a similar solution but without
SA. Leaves were sprayed at early in the morning, once weeklyfor one month.
Photosynthetic rate, stomatal conductance and transpiration measurements
One day after spraying, photosynthetic rate, stomatal conductance and transpiration rate of fully expanded
leaves were measured for 6 days using a LICOR-6400 Portable Photosynthesis System (LI-COR, Lincoln,
NE, USA).
Plant biomass
Plants were harvested 4 weeks after transplanting into the polyethylene bags. Plant parts were separated
into leaf, stem and rhizome, dried at 70 °C for 72 h, and weighed on an electronic weighing scale
(Mettler-Toledo Model B303-S, Switzerland).
Nitrate reductase activity
Leaves from different treatments were collected and cut into small pieces. About 500 mg of leaf pieces
from different treatments were incubated separately in a medium containing 1 mL of 1 M potassium
nitrate, 2 mL of 0.2 M phosphate buffer (pH 7.5) and 2 mL of 0.5% Triton X-100 for 1 h. One milliliter of
reaction mixture was transferred to another test tube and mixed with 1 mL of 1% sulfanilamide in 2 N
hydrochloric acid and 1 mL of 0.2% NEEDA (N-1-napthyl ethylenediamine dihydrochloride). Using a
mixture of 1 mL NEEDA as a blank, absorbance was recorded at 540 nm in a LKB Biochem Ultra
Spectrophotometer. A standard curve was prepared using different concentrations of potassium nitrite.
Enzyme activity was expressed as µmol of NO2 liberated per hour per gram FW (Hayat et al., 2009).
Antioxidant enzyme assays
The nitroblue tetrazolium (NBT) method was used for determination of SOD activity. One unit of SOD
activity was defined as the amount of enzyme required to produce 50% inhibition of NBT reduction at
560 nm. The methods of Fu and Huang (2001) were used to determine POD and CAT activities. For
POD, guaiacol oxidation was measured by monitoring increase in absorbance at 470 nm for 1 min. For
CAT, H2O2 decomposition was measured by recording decline in absorbance at 240 nm for 1 min. One
unit of CAT or POD activity corresponded to an absorbance change of 0.01 units per min. The activity of
each enzyme was expressed on a protein basis. Three replicates per treatment and variety were performed
at midday using the youngest fully expanded leaves of different individuals.
Page 130
ISBN 978-967-10840-4-5
Proc. Int. Conf. Plt. Phy. 2014
First Published, 2015
124
Statistical analysis
Data were analyzed using Statistical Analysis System (SAS) version 9.0 (2002). Treatment means were
separated using Duncan’s Multiple Range Test. Experimental results were expressed as means of three
replicates ± standard deviation. A P-value ≤ 0.05 was regarded as significant.
Results and Discussion
Effect of foliar application of SA on leaf gas exchange parameters
Two days after foliar application of 10–5
M SA, photosynthetic rate increases by 18% and 19.2% in halia
Bara and Bentong, respectively. While, spraying with 10–3
M SA resulted in 9.2% and 10.1% increases in
halia Bara and Bentong, respectively within the same time frame (Figure 1a). On day 2 to 5 following
either SA treatment, photosynthetic rate decreased significantly in halia Bentong, followed by a slight
increase at day 6, whereas photosynthetic rate in halia Bara increased significantly from days 2 to 4 and
then decreased. The highest photosynthetic rate in halia Bara was 7.8 µmol/m2/sobserved at day 4, while
the highest rate in halia Bentong, was 5.6 µmol/m2/s, at 2 d after spraying. Intercellular CO2 concentration
(Ci) was lower in treated plants than in the controls for both varieties (Figure 1c). Stomatal conductance
in treated and control plants show similar trend from day 1 to 6 after spray. Plants of both varieties
exposed to 10−5
M exhibited the highest photosynthetic rates. Induction of photosynthetic rate and
stomatal conductance by SA has been previously demonstrated (Khodary, 2004). Stomatal regulation and
behavior are very important factors controlling photosynthetic rate. While increased photosynthetic rates
seen 2 d after SA application were generally accompanied by increased or unchanged stomatal
conductance levels and transpiration rates, intercellular CO2 concentrations of treated plants were
generally lower than in control plants. If increased stomatal opening was the primary cause of increased
photosynthetic activity, increases in internal carbon would be expected. These results thus suggest that
increases in photosynthetic rate following SA spray applications were due to increased CO2 uptake at the
chloroplast level rather than simple increases in stomatal opening, i.e., reduced resistance to entry of CO2
in the leaves. Increased photosynthetic rates accompanied by increases in stomatal conductance and
lowered internal carbon values, as seen in our results, also imply that the photosynthetic rate increase may
have been due to enzyme-related activities at the chloroplast level. Stomatal conductance readings, along
with decreases in Ci values, strongly suggest that changes in photosynthetic rate were due to changes
within the leaf rather than increased stomatal opening. In this study, we used a commercially feasible
method of SA application—leaf spraying—to demonstrate how SA might be used to increase
photosynthetic and growth rates in a wide range of crop plants. We observed that the lower SA
concentration (10–5
M) was generally more effective in enhancing photosynthetic rate of the Malaysian
young ginger varieties halia Bentong and Bara under greenhouse conditions.
Effect of SA foliar application on plant height, leaf area and total dry weight
Foliar application of SA significantly affected (P ≤ 0.05) plant leaf area and total dry weight for both
varieties (Table 1), but not on plant height. Total dry weight and leaf area were greater in 10–5
M treated
plants than in 10−3
M treated and the controls plants (Table 1). The highest total dry weight (8.68 g per
plant) was observed in halia Bentong, and the largest leaf area (719.2 cm2
per plant) was recorded in halia
Bara. These results are consistent with published reports. A recent study by Nagasubramaniam et al. (2007)
demonstrated that SA (7.2 × 10⁻⁴
M) increased plant height, leaf area, crop growth rate and total dry
matter production in baby corn, while Jeyakumar et al. (2008) reported that SA (10–4
M) enhanced dry
matter production in black gram. Plant height and shoot and root dry weight were affected by SA
application, but no significant differences were observed between treatments.
Page 131
ISBN 978-967-10840-4-5
Proc. Int. Conf. Plt. Phy. 2014
First Published, 2015
125
Figure 1. Effect of foliar application of salicylic acid on photosynthetic rate, stomatal conductance and
intercellular CO2 (Ci) in ginger varieties (A: Halia Bentong and B: Halia Bara). Error bars
indicate means of triplicate measurements ± SEM.
Table 1. Effect of foliar SA application (10−3
and 10−5
M) on plant height, leaf area and dry weight of
ginger parts.
Variety SA Plant
height Leaf area
Leaf dry
weight
Shoot dry
weight
Root dry
weight
Rhizome
dry weight
Total dry
weight
H.Bentong Control 56.66±6.75a 506.6 ± 15.6c 1.79±0.53b 1.86±0.67a 0.214 ± 0.05a 3.42±0.66a 7.28±1.51ab
10−5 53.26±5.51a 603.6±16.14abc 2.31±0.21b 2.1 ± 0.49a 0.24 ± 0.06a 4.03±1.06a 8.68± 0.71a
10−3 55.43±4.55a 541.3 ± 62.02c 2.55±0.65b 1.98±0.21a 0.227±0.035a 3.56±0.78a 8.31± 1.09a
H.Bara Control 49.24 ± 0.9a 592.4± 16.1bc 2.64±0.29b 1.74±0.49a 0.252±0.068a 0.74±0.11b 5.37± 0.68b
10−5 48.5 ± 3.12a 719.2 ± 91.5a 3.72±0.93a 2.21±0.37a 0.281 ± 0.03a 0.99±0.37b 7.2 ± 1.73ab
10−3 48.36 ± 8.4a 673.9 ± 0.9ab 3.67±0.70a 2.13± .23a 0.263 ± 0.06a 0.95±0.25b 7.01±1.17ab
Data are means of triplicate measurements ± standard deviation. Means not sharing a common single letter were significantly
different at P ≤ 0.05. Plant height is expressed in cm, leaf area in cm2, and dry weight in g per plant.
Page 132
ISBN 978-967-10840-4-5
Proc. Int. Conf. Plt. Phy. 2014
First Published, 2015
126
When applied in various quantities, phenolic compounds are well known to rapidly alter plant phenotypes
and to influence plant growth from seed germination to senescence, either by enhancing or stimulating the
natural growth regulatory system (Amanullah et al., 2010). Our observations that stimulation of
photosynthetic rate by SA was due to increases in activity within the leaf generally support previous
findings and provide new information regarding mechanisms, levels of application and effective types of
phenolic compounds. Our results suggest that increases in photosynthetic rate may have stimulated plant
total dry weight production. Application of 10–5
M SA also resulted in higher net photosynthetic rates,
which should lead to increased crop productivity.
Effect of foliar application of SA on nitrate reductase activity
Spraying plants with SA, irrespective of concentration, generated significant increases in nitrate reductase
activity in rhizomes (Figure 2). Application of 10–5
M SA was significantly superior to 10–3
M and no
treatment, although lower nitrate reductase activity was observed in control plants. Nitrate reductase
activity was higher in Halia Bara than in Halia Bentong for all treatments, including controls. In general,
the highest nitrate reductase activity was recorded in Halia Bara sprayed with 10–5
M SA (621.9 nmol
nmol NO2h-1
g-1
FW), while the lowest activity was observed in untreated Halia Bentong (300 nmol NO2h-
1g
-1 FW). This SA concentration-based effect on nitrite reductase activity may indicate that nitrite
reductase activity was induced and/or enzyme degradation was prevented. Foliar application of Tween-20
generated a response that was statistically equal to that of the control. This finding was unexpected and
suggests that an SA concentration of 10–5
M might induce nitrite reductase synthesis by mobilizing
intracellular NO3– and protect against nitrite reductase degradation in vivo in the absence of NO3
– ( Singh,
1993). It can therefore be assumed that SA concentration plays an important role in regulating nitrate
reductase activity, with lower concentrations enhancing nitrate reductase protein and higher
concentrations decreasing it by affecting the above processes. Increases in nitrate concentration and in
turn nitrate reductase activity due to exogenous SA treatment under normal growth conditions have been
reported previously ( Hayat et al., 2005) and strongly support our observed results.
Figure 2. Nitrate reductase activity in Halia Bentong and Halia Bara treated with different concentrations
of SA (SA0: control; SA1: 10–3
M; SA2: 10–5
M).
Effect of foliar application of SA on antioxidant enzymes activities
Exogenous application of SA increased antioxidant enzyme activities, with the maximum response
generated in plants sprayed with 10–5
M SA. Significant increases were observed for POD (45.2%; Figure
3), SOD (44.1%; Figure 4) and CAT (20.1%; Figure 5). Tween-20 application did not generate any
significant response. Exogenous application of two different concentrations (10–3
and 10–5
M) of SA
resulted in increased growth and physiological responses, with the best response generated from 10–5
M
Page 133
ISBN 978-967-10840-4-5
Proc. Int. Conf. Plt. Phy. 2014
First Published, 2015
127
SA. Similar results have been obtained in B. juncea (Fariduddin et al., 2003) and wheat (Hayat et al.,
2005). Noreen et al., (2009) reported that increase in growth and photosynthetic capacity of sunflower due
to exogenously applied SA may have been due to SA-induced increase in activity of peroxidase. After
Rubisco, CAT is the most abundant soluble zinc-containing enzyme in C3 plant chloroplasts; it facilitates
CO2 diffusion across chloroplast membranes by catalyzing the reversible hydration of dissolved CO2
entering the highly alkaline stromal environment (Majeau and Coleman, 1994) and maintains a constant
supply of Rubisco. This enzyme’s concentration, and therefore its activity, is finely regulated at
transcriptional and/or translational levels (Okabe et al., 1980). In our study, however, neither of these
processes was favored by the application of 10–5
M SA, which increased CAT activity. Exogenous SA is
known to increase stomatal conductance (Table 1); by maintaining a constant supply of CO2 for reduction
by Rubisco, increased CAT activity in leaves is thus expected to increase photosynthetic efficiency and
thereby net photosynthesis (Table 1). The higher SA concentration, however, may have caused permanent
changes to cell membrane-level organization. These alterations would injure plant general metabolism
and thereby reduce overall growth and photosynthetic attributes. At the lower SA concentration, activities
of antioxidant enzymes POD, SOD and CAT were elevated, in accordance with other studies (Hayat et
al., 2005). This increased antioxidant enzyme activity might be due to SA’s regulatory role at
transcriptional and/or translational levels.
Figure 3. Peroxidase activity in Halia Bentong and Halia Bara leaf extracts treated with different
concentrations of SA (SA0: control; SA1: 10–3
M; SA2: 10–5
M).
Figure 4. Superoxide dismutase (SOD) activity in Halia Bentong and Halia Bara leaf extracts treated with
different concentrations of SA (SA0: control; SA1: 10–3
M; SA2: 10–5
M).
Page 134
ISBN 978-967-10840-4-5
Proc. Int. Conf. Plt. Phy. 2014
First Published, 2015
128
Figure 5. Catalase enzyme activity in Halia Bentong and Halia Bara leaf extracts treated with different
concentrations of SA (SA0: control; SA1: 10–3
M; SA2: 10–5
M).
Conclusions
This investigation has highlighted the usefulness of SA in plant growth regulation. One of the more
significant findings to emerge from this study is that foliar application of SA can improve plant
physiological efficiency, including photosynthetic rate, and can enhance effective partitioning of
accumulates from source to sink. Treatment with SA resulted in higher photosynthetic rates and increased
plant biomass. Most obviously, antioxidant enzyme activities were enhanced in ginger plants treated with
the lower SA concentration (10–5
M). In addition, exogenous application of two different concentrations
(10–3
and 10–5
M) of SA resulted in increased growth and physiological responses, with the best response
generated using 10–5
M SA. Our results support the idea that low SA concentrations (10–5
M) induce
nitrite reductase synthesis by mobilizing intracellular NO3–
and provide protection to nitrite reductase
degradation in the absence of NO3–
. By boosting photosynthetic rate in response to enhanced antioxidant
enzyme activities, it therefore appears that SA can generally be used as a growth regulator to enhance
plant growth and yield.
Acknowledgments
The authors are grateful to the Research Management Centre of University Putra Malaysia for financing
and supporting this work.
References
Amanullah, M.M., Sekar, S. and Vincent, S. 2010. Plant growth substances in crop production. Asian
Journal of Plant Sciences 9: 215-222.
Ananieva, E.A., Alexieva, V.S. and Popova, L.P. 2002. Treatment with salicylic acid decreases the
effects of paraquat on photosynthesis. Journal of Plant Physiology 159: 685-693.
Fariduddin, Q., Hayat, S. and Ahmad, A. 2003. Salicylic acid influences net photosynthetic rate,
carboxylation efficiency, nitrate reductase activity and seed yield in Brassica juncea.
Photosynthetica 41: 281-284.
Fu, J. and Huang, B. 2001. Involvement of antioxidants and lipid peroxidation in the adaptation of two
cool-season grasses to localized drought stress. Environmental and Experimental Botany 45: 105-
114.
Ghasemzadeh, A. and Jaafar, H.Z.E. 2011. Antioxidant potential and anticancer activity of Malaysian
young ginger (Zingiber officinale Roscoe) varieties grown under different CO2 concentration.
Journal of Medicinal Plants Research 5(14): 3247-3255.
Page 135
ISBN 978-967-10840-4-5
Proc. Int. Conf. Plt. Phy. 2014
First Published, 2015
129
Ghasemzadeh, A. and Jaafar, H.Z.E. 2012. Effect of salicylic acid application on biochemical changes in
ginger (Zingiber officinale Roscoe). Journal of Medicinal Plants Research 6(5):790-795.
Hayat, Q., Hayat, S., Ali, B. and Ahmad, A. 2009. Auxin analogues and nitrogen metabolism,
photosynthesis, and yield of chickpea. Journal of Plant Nutrition 32: 1469-1485.
Hayat, S., Fariduddin, Q., Ali, B. and Ahmad, A. 2005. Effect of salicylic acid on growth and enzyme
activities of wheat seedlings. Acta Agronomica Hungarica 53: 433-437.
Jeyakumar, P., Velu, G., Rajendran, C., Amutha, R., Savery, M.A.J.R. and Chidambaram, S. 2008.
Varied responses of black gram (Vigna mungo) to certain foliar applied chemicals and plant
growth regulators. Legume Research an International Journal 31: 110-113.
Khan, W., Prithviraj, B. and Smith, D.L. 2003. Photosynthetic responses of corn and soybean to foliar
application of salicylates. Journal of Plant Physiology 160: 485-492.
Khodary, S.E.A. 2004. Effect of salicylic Acid on the growth, photosynthesis and carbohydrate
metabolism in salt stressed maize plants. International Journal of Agriculture and Biology 6: 5-8.
Kumar, P., Lakshmi, N.J. and Mani V.P. 2000. Interactive effects of salicylic acid and phytohormones on
photosynthesis and grain yield of soybean (Glycine max L.). Physiology and Molecular Biology
of Plants 6:179-186.
Majeau, N. and Coleman, J.R. 1994. Correlation of carbonic anhydrase and ribulose-1,5-bisphosphate
carboxylase/oxygenase expression in pea. Plant Physiology 104: 1393-1399.
Nagasubramaniam, A., Pathmanabhan, G. and Mallika, V. 2007. Studies on improving production
potential of baby corn with foliar spray of plant growth regulators. Annual Review of Plant
Physiology and Plant Molecular Biology 21: 154-157.
Noreen, S., Ashraf, M., Hussain, M. and Jamil, A. 2009. Exogenous application of salicylic acid
enhances antioxidative capacity in salt stressed sunflower (Helianthus annuus l.) plants. Pakistan
Journal of Botany 41(1): 473-479.
Okabe, H., Miyahara, Y., Yamauchi, T., Miyahara, K. and Kawasaki, T. 1980. Studies on the
constituents of Momordica charantia L. I. Isolation and characterization of momordicosides A
and B, glycosides of a pentahydroxy-cucurbitane triterpene. Chemical and Pharmaceutical
Bulletin 28: 2753-2762.
Pancheva, T.V. and Popova, L.P. 1998. Effect of salicylic acid on the synthesis of ribulose-1,5,-
biphosphate carboxylase/oxygenase in barley leaves. Journal of Plant Physiology 152: 381-386.
Shraiy, A.M.E. and Hegazi, A.M. 2009. Effect of acetylsalicylic acid, indole-3-bytric acid and gibberellic
acid on plant growth and yield of pea (Pisum sativum L.). Australian Journal of
Basic and Applied Sciences 3: 3514-3523.
Singh, S.P. 1993. Effect of non-auxinic chemicals on root formation in some ornamental plant cuttings.
Advances in Horticultural Science 3: 207-210.
Smirnoff, N. 1993. The role of active oxygen in the response of plants to water deficit and desiccation.
New Phytologist 125: 27-58.
Wang, W.B., Kim, Y.H., Lee, H.S., Kim, K.Y., Deng, X.P. and Kwak, S.S. 2009. Analysis of antioxidant
enzyme activity during germination of alfalfa under salt and drought stresses. Plant
Physiology and Biochemistry 47: 570-577.
Yordanova, R. and Popova, L. 2007. Effect of exogenous treatment with salicylic acid on photosynthesis
activity and antioxidant capacity of chilled wheat. General and Applied Plant Physiology 33:155-
170.
Page 136
ISBN 978-967-10840-4-5
Proc. Int. Conf. Plt. Phy. 2014
First Published, 2015
130
Screening of Sorghum (Sorghum bicolor L. Moench) Genotypes for
Alumunium Stress Tolerance in Nutrient Culture
Lestari, T.1,*
, Sopandie, D.2, Trikoesoemaningtyas.
2 and Ardie, S.W.
2
1Faculty of Agricultural, Bangka Belitung University, Bangka 33126, Indonesia.
2Faculty of Agricultural, Bogor Agricultural University, Bogor 16680, Indonesia.
*E-mail: [email protected]
Introduction
Development of agriculture in acid soil (ultisol) in Indonesia is a challenge but opportunity to increase
food production towards food sovereignty in Indonesia. Projection of Indonesian food needs in 2025 will
reach 38.7 million tons of rice, 19.4 million tons of corn and 2.5 million tons of soybean. Indonesian
government policy plays a role in the development of diversification of food other than rice (BPS, 2012).
Sorghum, with scientific name Sorghum bicolor L. Moench, is a crop that is widely cultivated throughout
the world and has the potential as a source of food, feed and industry. Sorghum as food in the world is
ranked 5 after wheat, rice, maize and barley (Sirappa, 2003).
Acid dry land in Indonesia suitable for annual crops reached 18.2 million ha (Mulyani et al., 2010). The
main limiting factor for production in acid dry land is low soil fertility due to toxicity of aluminum (Al)
and deficiency of major nutrients of phosphorus (P), calcium (Ca) and magnesium (Mg) (Marschner,
2012). Al toxicity is a major limiting factor because it can lead to disruption of root growth so that the
plant faces problems in water and nutrient uptake (Kochian and Hoekenga, 2004; Kochian et al., 2005).
Impaired root growth begins with the accumulation of Al in the root tip. The genotypes sensitive to Al
toxicity will be affected more than tolerant genotypes (Matsumoto and Matoda, 2012). In addition to
inhibition of root growth, high Al solubility in the soil can also inhibit nutrient uptake, particularly cations
such as P, Mg and Ca (Marchner, 2012).
One of the aspects which indirectly affects the growth and yield of plants is chlorophyll content.
Chlorophyll content is an internal factor that greatly affects the efficiency of the plant and the rate of
photosynthesis. Plants that have high photosynthetic rates produce high amount of photosynthates.
Photosynthate availability is fundamental to plant metabolism (Taiz and Zeiger, 2002). One of the
constituent elements of the pigment of chlorophylls is Mg. The low uptake of Mg due to Al toxicity leads
to low chlorophyll content in plants (Chen and Ma, 2013).
Each plant has genotype-specific response to aluminum stress. Plant responses to stress can be in the form
of morphological, anatomical, and physiological. Changes in physiological responses can be easily
observed and can be selection characters to be used to screen and identify tolerant genotypes.
In addition to the characters above used for the selection, identification of genotypes tolerant method also
determines the success of the selection method. Generally, tolerant genotype identification is done only
on one character or the conclusions are drawn based on the observations of each character. Correlation
between the characters and complex tolerance mechanisms are difficult to identify tolerant genotypes
based on univariate analysis. Multivariate selection is an alternative approach and aimed to obtain a
comprehensive conclusion about the mechanism of tolerance and genotypes that are truly tolerant based
on all observed variables. Identification of tolerant genotypes using multivariate approach has been done
by several researchers (Natawijaya, 2012) and produced better selection results. This study aimed to
Page 137
ISBN 978-967-10840-4-5
Proc. Int. Conf. Plt. Phy. 2014
First Published, 2015
131
evaluate the response of sorghum genotypes on Al stress condition, identify Al tolerant genotypes and
evaluate and evaluate univariate and multivariate selection methods to identify tolerant genotypes.
Materials and Methods
This study was conducted in a greenhouse at Cikabayan University Farm and Laboratory of
Spectrophotometry, Faculty of Agriculture, Bogor Agricultural University, Bogor, from March to May,
2014. Randomized complete block design with three replications was used as experimental design. The
first factor was the seven genotypes of sorghum. Seven sorghum genotypes used in this study included
four sorghum lines of ICRISAT collection, 150-21-A , 5-193-C, 10-90-A and 150-20-A, 1 local sorghum
line of Watar Hammu Putih/WHP and 2 national varieties of Numbu and UPCA-S1. The second factor
was three levels of Al stress in the nutrient culture, i.e. 0 µM AlCl3 + 0 mM K2HPO4 (control), 74 µM
AlCl3 + 0 mM K2HPO4 (Al) and 74 µM AlCl3 + 0.1 mM K2HPO4 (Al+P). Numbu is a known acid soil
tolerant variety and was used as positive control.
Seeds were directly sown in the husk. Normal seedlings of one week old with uniform root length were
transferred to nutrient culture media. Stems were wrapped and then inserted into the holes of styrofoam
and floated in nutrient solution (Ohki, 1987). Oberservation was performed as follows: Plants treated with
Al and P for 7 DAP (days after planting) were then harvested to record the length of roots and shoots and
the leaves were analysed for chlorophyll a, chlorophyll b and total chlorophyll content. Plant canopy
photographs were captured prior to harvesting.
Data were analyzed using analysis of variance (ANOVA) with a confidence level of 95% to indicate
sensitivity index to Al stress. Grouping of genotypes according to tolerance and sensitivity to Al stress
was based on the value of the sensitivity index. It was calculated according to Fischer and Maurer (1978)
as below:
Sensitivity index (S) = (1-Yp/Y)/(1-Xp/X)
where,
Yp = average value of a genotype that received stress
Y = average value of a genotype that did not receive stress
Xp = average value of all genotype that received stress
X = average value of all genotype that did not receive stress
Tolerant genotypes are those having S<0.5. The moderate genotypes are identified as 0.5<S<1, and
sensitive ones are concluded if S>1. Analysis using a multivariate approach was conducted to determine
tolerant and sensitive strains, the selection of characters and relationships among strains and character
selection based on sensitivity index. The analysis was performed using Minitab software.
Results and Discussion
Table 1 indicated that genotype and Al treatment had significant effect on all observed variables. The
interaction was significant with contents of chlorophyll a, chlorophyll b and total chlorophyll, as well as
root length. The results were in line with Agustina et al. (2010) where plant tolerance for Al stress was
indicated by plant capability to retain potential yield.
Table 1. Recapitulation of the analysis of variance. Variable Chlorophyll a Chlorophyll b Total chlorophyll Root length
Genotype 0.140**
0.019**
0.273**
17.91**
Al treatment 1.09**
0.09**
1.83**
65.3**
Interaction 0.310**
0.029**
0.528**
5.031**
Page 138
ISBN 978-967-10840-4-5
Proc. Int. Conf. Plt. Phy. 2014
First Published, 2015
132
Selection based on sensitivity index
Sensitivity index is a measure that describes the deviation of the genotype value from the optimum
environmental stress. Greater sensitivity is shown by higher index value and greater reduction in the
phenotype. Tolerant genotype is a genotype that has phenotypic deviations lower than the other
genotypes.
Identification of tolerant genotypes using univariate analysis was performed by using the sensitivity index
values. Higher sensitivity index indicates tolerance to Al stress. Sensitivity index of the physiological
character of root length was used to seperate tolerant genotypes (WHP and Numbu) from the sensitive
genotypes of 150-21-A, 5-193-C, 150-20-A, UPCA and 10-90-A (Table 2). Root length is a good
indicator of growth as a result of the interaction between genetic and environmental factors (Taiz and
Zeiger, 2002). In this study, sensitive genotypes (UPCA and 150-20-A) suffered stunted growth due to Al
stress. Al stress in acid soils and nutrient deficiency cause stunted growth in plants (Kochian and
Hoekenga, 2004).
Table 2. Selection of tolerant genotype based on sensitivity index of root length.
Genotype Root length (cm)
% decrease Sensitivity index Criteria Control Al stress
150-21-A 20 14 43 1.47 Sensitive
5-193-C 20 14 43 1.47 Sensitive
10-90-A 20 14 43 1.47 Sensitive
WHP 20 17 18 0.60 Tolerant
150-20-A 20 14 42 1.47 Sensitive
NUMBU 20 20 0 0.00 Tolerant
UPCA 17 13 31 1.05 Sensitive
Table 3. Chlorophyll a content of genotypes as affected by Al stress.
Genotype Chlorophyll a content (mg/l) % decrease
Control Al Al+P Al Al+P
150-21-A 1.96 1.60 2.29 22.50 -30.13
5-193-C 2.05 1.28 2.01 60.16 -36.32
10-90-A 2.05 2.00 1.38 2.50 44.93
WHP 1.51 1.67 2.02 -9.58 -17.33
150-20-A 1.66 0.67 2.22 147.76 -69.82
NUMBU 1.44 1.77 1.91 -18.64 -7.33
UPCA 1.46 1.02 2.08 43.14 -50.96
Table 4. Chlorophyll b content of genotypes as affected by Al stress.
Genotype Chlorophyll b content (mg/l) % decrease
Control Al Al+P Al Al+P
150-21-A 0.72 0.59 0.80 22.03 -26.25
5-193-C 0.68 0.48 0.70 41.67 -31.43
10-90-A 0.70 0.71 0.51 -1.41 39.22
WHP 0.55 0.63 0.74 -12.70 -14.86
150-20-A 0.60 0.28 0.76 114.29 -63.16
NUMBU 0.51 0.64 0.68 -20.31 -5.88
UPCA 0.53 0.39 0.69 35.90 -43.48
Page 139
ISBN 978-967-10840-4-5
Proc. Int. Conf. Plt. Phy. 2014
First Published, 2015
133
The chlorophyll content (chlorophyll a, chlorophyll b and total chlorophyll) as in Tables 3, 4 and 5
implied that 10-90-A, WHP and Numbu were tolerant genotypes to Al stress. Numbu was known for its
tolerance to Al as determined by the sensitivity index (Table 2). The tolerant genotypes were able to
maintain chlorophyll a, b and total chlorophyll content under low Mg condition due to Al stress. The
ability to maintain chlorophyll content is closely related to the plant ability to stay green despite stress
condition and hence, maintain good photosynthesis. The ability to increase chlorophyll content in culture
(Numbu) with Al stress was shown by tolerant genotypes. The same result was shown by Agustina et al.
(2010), where the tolerant sorghum genotype of Numbu is capable to produce higher yield of dry matter
in acid soil as compared to sensitive genotypes.
Table 5. Total chlorophyll content of genotypes as affected by Al stress.
Genotype Total chlorophyll content (mg/l) % decrease
Control Al Al+P Al Al+P
150-21-A 2.68 2.20 3.09 21.82 -28.80
5-193-C 2.73 1.76 2.71 55.11 -35.06
10-90-A 2.75 2.71 2.71 1.48 0
WHP 2.05 2.30 2.76 -10.87 -16.67
150-20-A 2.26 0.95 2.98 137.89 -68.12
NUMBU 1.95 2.40 2.59 -18.75 -7.34
UPCA 1.99 1.42 2.77 40.14 -48.74
The difference in sensitivity index of the characters in the genotypes may complicate the grouping of
genotype tolerance to stress. Multivariate sensitivity analysis based index is an approach that can be used
to summarize genotype tolerance in a biplot. The influence of genotype and treatment of Al and P on
chlorophyll a, chlorophyll b and total chlorophyll as in Tables 3, 4 and 5 is only effectively expressed by
tolerant sorghum genotypes (10-90-A, WHP and Numbu). Availability of P in the growing media can
directly influence the growth of plants tolerant to Al. P deficiency can limit plant growth, and the
response will vary depending on the type of plant. According to Agustina et al. (2010), Numbu showed
very consistent level of tolerance to Al toxicity and P deficiency in both the field and nutrient culture
tests.
Sensitivity index based multivariate analysis for grouping of tolerant and sensitive genotypes
Tolerant genotype is a genotype that does not just have a single character that indicates tolerance but
many properties. The existence of interdependence between observations and characters makes
identification of tolerant genotypes difficult. Principal component analysis is an approach that can be used
to identify tolerant genotypes for all the characters at the same time. Multivariate analysis of tolerant
character based index and a decrease in the performance index are used in preparing biplots. Genotype
having higher index value is the more tolerant genotype. The results of biplot analysis showed that
genotypes of Numbu, WHP and 10-90-A had better tolerance to Al stress, based on all the under study
characters, as compared to the other genotypes (Figure 1).
Page 140
ISBN 978-967-10840-4-5
Proc. Int. Conf. Plt. Phy. 2014
First Published, 2015
134
3002001000-100
5
4
3
2
1
0
Indeks Penurunan Keragaan
Inde
ks Ju
mlah
Kar
akter
Tole
ran
UPCA
NUMBU
15020A
WHP
1090A
5193C
15021A
Figure 1. Biplot based on decrease in genotype variability index values; red: most sensitive for all the
characters (UPCA, 5-193-C, 150-20-A); orange: relative tolerant (150-21-A); green, purple and
blue: tolerant genotypes (10-90-A, WHP, Numbu).
The univariate and multivariate analyses of characters complete the identification of tolerant genotype.
Two-dimensional mapping of the index values of characters and a decrease in the performance index
showed that WHP had the highest tolerance to Al, followed by 10-90-A and Numbu. Genotypes of 150-
20-A, UPCA and 5-193-C had the lowest tolerance, or in other words, were the Al sensitive genotypes.
In general, the results of univariate and multivarate analysis were rather similar in this study on sorghum.
However, multivariate analysis provides better results for screening of tolerant genotypes. Based on this
analysis, we identified three Al stress tolerant sorghum genotypes.
Conclusions
The results showed that the tested genotypes had different responses to Al stress. The tolerant genotypes
had higher root length, chlorophyl a, chlorophyl b and total chlorophyll content as compared to sensitive
genotypes. In univariate selection, 10-90-A, WHP and Numbu were classified as Al tolerant genotypes
while 150-21-A, 5-193-C,150-20-A and UPCA-S1 were classified as Al sensitive genotypes. The tolerant
genotypes could be used as potential parents to develop a new Al tolerant sorghum variety.
Acknowledgements
This work was supported by a grant from the Directorate General of Higher Education (DGHE)
Indonesia.
References
Agustina, K, Sopandie, D, Trikoesoemaningtyas and Wirnas, D. 2010. Roots physiological response of
sorghum (Sorghum bicolor L. Moench.) to aluminum toxicity and phosphorous deficiencies in
rhizotron. Journal of Agronomy Indonesia 38(2): 88-94.
BPS. 2012. Rice production in Indonesia. Badan Pusat Statistik. Retrieved on 28 November 2012 from
http//www.bps.go.id/
Chen, Z.C. and Ma, J.F. 2013. Magnesium transporters and their role in Al tolerance in plant. Plant soil
368: 51-56. Fischer, R.A. and Maurer, R. 1978. Drought resistance in spring wheat cultivars. I.
Grain yield response. Australian Journal of Agricultural Research 29: 897-912.
Index of phenotypic deviation
Page 141
ISBN 978-967-10840-4-5
Proc. Int. Conf. Plt. Phy. 2014
First Published, 2015
135
Kochian, L.V. and Hoekenga, O.E. 2004. How do crop plants tolerate acid soils? Mechanism of
aluminium tolerance and phosphorus efficiency. Annual Review of Plant Biology 55: 459-493.
Kochian, L.V., Piñeros, M.A. and Hoekenga, O.A. 2005. The physiology, genetics and molecular biology
of plant aluminum resistance and toxicity. Plant and soil 274: 175-195.
Marschner, H. 2012. Mineral Nutrition of Higher Plants. 3rd ed. Harcourt Brace and Company
Publishers, Academic Press, London. Pp. 889.
Matsumuto, H. and Motoda, H. 2012. Aluminum toxicity recovery processes in root apices. possible
association with oxidative stress. Plant Science 185-186: 1-8.
Mulyani, A., Rachman, A. and Dariah, A. 2010. Acid dry land in Indonesia, the potential and availability
for agricultural development. Retrieved from http://balittanah.litbang.deptan. go.id.
Natawijaya, A. 2012. Genetic analysis and early generation selection to identifity high yielding segregants
in wheat (Triticum aestivum L.). Dissertation. Bogor Agricultural University, Bogor.
Ohki, K. 1987. Aluminium stress on sorghum growth and nutrient relationships. Plant and Soil 98: 195-
202.
Sirappa. 2003. Prospects of development of sorghum in indonesia as an alternative crop for food, feed and
industry. Jurnal Litbang Pertanian 22(4): 133-140.
Taiz, L. and Zeiger, E. 2002. Plant Physiology. 3rd ed. Sinauer Associates Publishing Company Inc.
Sunderland, Massachusetts. Pp. 690.
Page 142
ISBN 978-967-10840-4-5
Proc. Int. Conf. Plt. Phy. 2014
First Published, 2015
136
CHAPTER 3
POSTHARVEST TECHNOLOGY
AND QUALITY CONTROL
Page 143
ISBN 978-967-10840-4-5
Proc. Int. Conf. Plt. Phy. 2014
First Published, 2015
137
Challenges in Postharvest Handling of Fruits and Vegetables: Reducing
Losses and Maintaining Quality
Ahmad, S.H.* and Yap, E.S.P.
Department of Crop Science, Faculty of Agriculture, Universiti Putra Malaysia, 43400 Serdang, Selangor,
Malaysia.
*E-mail: [email protected]
Introduction
There are two terms in the postharvest system that is used to define losses which are postharvest losses
and food losses. Postharvest losses can be defined as the losses that occur between the completion of
harvesting and the moment of consumption by human or consumers (Harris and Lindblad, 1976). De
Lucia and Assennato (1994) however, define postharvest losses as a loss in the product during various
stages in the postharvest system that can be measured quantitatively and qualitatively. According to
Gustavsson et al. (2011), food losses are defined as a decrease in edible food mass during production,
postharvest, processing and distribution in value chains that are directed to human consumption. From all
the definitions, it can be concluded that postharvest losses are all directed from the point of how
producers handle their harvests until it reaches the consumer. These losses have become a major issue in
many countries whereby the estimated losses in terms of weight and quality are about 10% to 30%
(Hodges et al., 2011). In a study done by the African Postharvest Losses Information System (Rembold et
al., 2011), most of the weight loss from the product is due to harvesting or field drying, which is about
4% to 8% fruits and vegetables have the highest rate of wastage as compared to other products at 45%
(Anon, 2012). The losses in agricultural production dominate the three industrialized regions whereby the
postharvest losses are due to grading caused by quality standards set by retailers which can be seen in
Figure 1. In South and Southeast Asia, the losses are due to pre-harvest practices (15%), postharvest
practices (10%), processing (18%), distribution (5%) and consumption (5%) (FAO, 2012).
Figure 1. Percentage of postharvest losses for fruits and vegetables in different regions (Gustavsson et al.,
2011)
Page 144
ISBN 978-967-10840-4-5
Proc. Int. Conf. Plt. Phy. 2014
First Published, 2015
138
Cause of Losses
The causes of losses are physiological decay, physical damage and water loss or there is a surplus in the
market. There are two main causes of losses which are physiological and physical changes. The
physiological decay depends on the rates of respiration, transpiration, maturity and senescence, which in
turn are influenced by temperature, relative humidity and atmospheric composition. This can be seen in a
study done by Ferrante and Maggiore (2007) that a higher storage temperature (10 ºC) will hasten
chlorophyll and carotenoid loss as compared to storing at a low temperature (4 ºC). A study done by
Banaras et al. (2005) showed that peppers that are stored at 8 ºC only loose their quality after 10 days as
compared to peppers that are stored at 20 ºC due to high water loss. This study showed how temperature
and relative humidity have an effect on the quality of the fruit during storage. According to a review by
Hodges et al. (2011), growing consumer intolerance of substandard food or defect produce has increased
the rejection rate of a produce and thus the postharvest losses will also increase. For example, grading of
produce according to consumer’s preferences has led to the wastage of produce that did not meet the
specifications. The amounts of produce being supplied to consumers are mainly influenced by price
variation, weather and consumer demand.
Physical changes are related to mechanical damages, water stress, sprouting and rooting, physiological
disorders, insect pest and pathological breakdown. These losses can be slight or substantial, leading to a
reduction in the quantity, quality and safety of fruits and vegetables. These losses can be seen in a study
done by Genova et al. (2006) on postharvest loss of chillies in Vietnam whereby the losses are due to
diseases (90%), damage during harvest (10%), damage during transportation (15%) and poor quality
fruits (10%). In a survey done in collaboration between the World Vegetable Center (AVRDC) and
Department of Agronomy and Agricultural Land Improvement (DAALI) (2005), the main reasons for
cucumber postharvest loss at farm level in Cambodia are due to harvesting during hot weather (42%) and
diseases (46%). The same trend can be seen for Chinese kale whereby postharvest loss at farm level in
Cambodia due to harvesting during hot weather is 81% and due to diseases is 75% (AVRDC and DAALI,
2005). In the two studies, the time of harvesting the produce is also important to reduce the postharvest
losses by minimizing the physical change of the produce. High postharvest losses when produce is
harvested during hot weather are due to the loss of water from the produce. When there is a high water
loss from the produce, the produce will lose its turgidity and this will cause an unpleasant sight for the
consumers and they will not purchase the produce.
Assessment of Postharvest Losses
It is important to assess the postharvest losses to ensure that the product is being compensated by being
able to produce more than the usual standards. One of the methods that can be used to assess the
postharvest losses is the Commodity Systems Assessment Method which has 27 components that take
into account all steps related to the production, postharvest handling and marketing of any commodity
(LaGra, 1990). This process can assist in determining the source of postharvest, the causes of those losses
and also the economic value of the losses compared to the costs of current and proposed postharvest
practices. The questionnaire that is used in this method can be seen in the manual by LeGra (1990).
The purpose of assessing postharvest losses is to identify at which stage postharvest losses is the highest
and also to identify the most suitable strategy to reduce postharvest losses. Besides using a questionnaire
to determine the amount of losses that occur at each stage, product sampling at each stage can also be
done to determine the optimum maturity of a product. For example, in a research conducted by Fehr and
Romao (2001) to measure the losses of fruits and vegetables in Brazil, product sampling was done on
growing, marketing, consumption and disposal stages. This research was done to look at the specific
reasons of wastage in Brazil and it is found that the marketing stage has the highest wastage at 16.6%
Page 145
ISBN 978-967-10840-4-5
Proc. Int. Conf. Plt. Phy. 2014
First Published, 2015
139
weight. From this study, we can conclude that most of the wastage that occurred in Brazil is identified at
the level of producer, wholesaler and retailer. With this information, awareness on how to improved
postharvest handling at those stages can be implemented. In another example, Udas et al. (2005)
concluded that the highest wastage in the Eastern Hills of Nepal is mainly due to packaging whereby
losses as high as 47% for cauliflower from harvest to retail can be seen.
Physico-chemical quality of the produce is also vital in reducing postharvest losses in the world especially
in Asia. Physical characteristics that take into consideration are colour, firmness, weight loss, skin
browning, decay and defects whereas chemical characteristics such as soluble solids concentration,
titratable acidity, pH and ascorbic acid contents need to be evaluated. Biochemical changes in fruits and
vegetables during their growth and development is an important factor in fixing the appropriate maturity
standards of a particular produce both for local and distant markets. For example, the harvesting ‘Kew’
pineapple was found to be around 146 to 150 days after flowering which will produce a soluble solids
concentration of 18 to 19 ˚Brix, titratable acidity of 0.77 to 0.83% and ascorbic acid of 14.92 mg/100g
(Deka et al., 2005). These analyses could also help producers to maximize profit by harvesting at the
optimum maturity stage to help maximize consumer satisfaction, add value to the production, reduce
wastage from agricultural inputs and choosing the earlier ripening variety. This can be seen in a study
done on four accessions of hot pepper whereby each accession has their own harvesting time and storage
life ranging from less than one week to more than three weeks (Barrera et al., 2005). In this study, it is
also discovered that accession CS219 appeared to be earlier as compared to the other accession.
According to Joshi and Roy (1988), soluble solids concentration, starch, sugar, total carotenoid pigments
and pH are positively correlated with fruit maturity, whereas moisture content, acidity, ascorbic acid and
tannins are negatively correlated. Thus, it is important to harvest the produce at the right stage of maturity
to balance out the nutrients in the product. Weight loss in a produce depends on the environment where
the produce is kept. It is found that the weight loss of okra showed a positive correlation to the storage
duration (Hassan et al., 2010). However, the rates of moisture loss or weight loss are also influenced by
the packaging of the product. This can be seen in the study by Hassan et al. (2010), whereby the weight
loss in okra is minimal when stored at 10 ˚C with modified atmosphere packaging and the highest weight
loss was without packaging and stored at ambient temperature.
Methods to Reduce Postharvest Losses
There are various technologies that have been developed to reduce postharvest losses in every stage in the
supply chain, but they have not been effectively adopted or implemented. These might due to the lack of
training and information exchanges on postharvest handling, inadequate and unavailable tools and
equipment to carry out postharvest handling practices, lack of proper transportation, inadequate
maintenance of storage facilities and improper marketing systems. Most of these problems occur in
countries that are less developed as can be seen in a study carried out in the Eastern Hills of Nepal
whereby the main factors responsible for postharvest losses were inappropriate packaging, transportation
and grading systems (Udas et al., 2005). This was mainly due to the farmers who are not trained and
exposed to proper postharvest handling procedures which can be seen in the selected farm in this study
whereby no pre-cooling of produce was adopted both on the farm and collection centre.
Kader (2005) suggested that producers of major commodities should be encouraged to cooperate in order
to market their produce. This is because of the small farm size that are scattered around in developing
countries. Some of the advantages of marketing cooperatives include being able to provide a central
accumulation centre for harvesting commodity, purchasing of agricultural inputs in quantity to reduce
costs, providing a place for proper preparation for market and storage when needed, facilitating
transportation to the markets, coordinating the marketing program, distributing profits equitable and also
distribution of knowledge in the postharvest area. The lack of information on the postharvest handling of
Page 146
ISBN 978-967-10840-4-5
Proc. Int. Conf. Plt. Phy. 2014
First Published, 2015
140
produce in farmers or producers is also one of the main concerns. In order to ensure that any information
is readily available, an effective and educational extension program should be carried out by experts that
are able to reach the farmers or producers easily.
Network of Different Agencies to Reduce Losses
In order to reduce the postharvest losses at every step, it is important to have a network of different
agencies to reduce losses. The network of excellence postharvest food losses (NoE) definition process
includes relevance, vision, objective, target group, shareholders, stakeholders, network focus and content
(Gogh et al., 2013). The relevance of NoE lies in the black spot in which the network will be an additional
help to the current practices where PHL is a major issue. This is derived from the lack of knowledge
about PHL and the transfer of knowledge to countries with high postharvest losses. The vision of Noah is
to recruit an excellent network of experts, sustain local knowledge development, multiformity of involved
parties and have projects/investments that have an impact on the local supply chain. The objectives are to
have a multidisciplinary approach, transfer and development of knowledge and changes in supply chain
systems that are sustainable to a target group which has a direct interest and connection in solving
postharvest loss problems such as farmers, retail companies, trades, knowledge institute and others. Next
are the shareholders, which play an active role in reducing postharvest losses for the benefits of third
parties in developing countries and are selected based on their reputation and track record in their
professional field. Stakeholders are those who have a direct interest in the field of operation and activities
and may participate based on case by case. Some of the stakeholders are Food and Agriculture
Organization (FAO), Asia-Pacific Economic Cooperation (APEC), Multilateral Development Bank,
Monetary Financial Institutions and others. The network focuses on products such as fruits and vegetables
as they are highly perishable, and they are gaining importance in the local and global supply chains.
Besides that, they also focus on the geography of the country whereby food losses in developing countries
showed a higher food loss in the upstream activities. A third focus is the content whereby they provide an
opportunity for all postharvest experts in order to improve the postharvest performances in the fresh
supply chain.
Conclusions
Large losses in fruits and vegetables are mainly due to postharvest practices such as improper handling
(transport and storage) which will cause the product to be rejected, damaged or reduce in quality. Besides
that, consumer awareness of the quality of fruits and vegetables (colour, taste, shelf life, freshness) has
caused producers to grade and discard more produce after harvest. This is due to the inability of the
producers to maintain their produce quality after harvest to meet the consumer demand. In order to meet
consumer demand and also food security, it is important for the producers to be knowledgeable in
postharvest handling of fruits and vegetables, in addition to the usage of technologies that have been
introduced. Government agencies play an important role in extending service whereby experts in
postharvest handling reach out and transfer knowledge to the producers especially in the rural areas.
Incentives can also be given to producers that are able to produce good quality fruits or vegetables and at
the same time reduce postharvest losses. However, in order to reduce postharvest losses, the main factor
is to change the mindset of the producers and consumers so that they will take this matter seriously. In
summary, the goal is to ultimately zero down postharvest losses in the future through technology and
knowledge.
References
Anonymous. 2012. Save Food: Global Initiative on Food Loss and Waste Reduction. Available online at
http://www.fao.org/save-food/key-findings/infographics/fruit/en/.
Page 147
ISBN 978-967-10840-4-5
Proc. Int. Conf. Plt. Phy. 2014
First Published, 2015
141
Banaras, M., Bosland, P.W. and Lownds, N.K. 2005. Effects of harvest time and growth conditions of
storage and post-storage quality of fresh peppers (Capsicum annum.). Pakistan Journal of Botany
37(2): 337-344.
Barrera, J.A., Hernandez, M.S., Melgarejo, L.M. and Fernandez-Trujillo, J.P. 2005. Physiological
changes in ‘Amazonic’ hot pepper accessions during growth, ripening and storage. Acta
Horticulturae 682: 2207-2214.
De Lucia, M. and Assennato, D. 1994.Agricultural Engineering Development: Postharvest Operations and
Management of Foodgrains. FAO Agricultural Services 93.
Deka, B.C., Saikia, J. and Sharma, S. 2005. Standardization of maturity indices of ‘Kew’ Pineapple. Acta
Horticulturae 682: 2215-2219.
Fehr, M. and Romao, D.C. 2001. Measurement of fruit and vegetable losses in Brazil: A case study.
Environment, Development and Sustainability 3: 253-263.
Ferrante, A. and Maggiore, T. 2007. Chlorophyll a fluorescence measurements to evaluate storage time
and temperature of Valeriana leafy vegetables. Postharvest Biology and Technology 45: 73-80.
Genova II, C., Weinberger, K., Hoang, B.A., Dang, D.D., Nguyen, T.T.L., Le, N.T. and Nguyen, T.T.T.
2006. Postharvest loss in the supply chain for vegetables – the case of chilli and tomato in
Vietnam. AVRDC – The World Vegetable Center 18: 27-31.
Gogh, B., Aramyan, L., Sluis, A., Soethoudt, H. and Scheer, F.P. 2013. Feasibility of a network
excellence postharvest food losses: combining knowledge and competences to reduce food losses
in developing and emerging economies. Wageningen UR Food & Biobased Research.
Gustavsson, J., Cederberg, C., Sonesson, U., Otterdijk, R. and Meybeck, A. 2011. Global food losses and
food waste: Extent, causes and prevention. Food and Agriculture Organization.
Harris, K.L. and Lindblad, C.L. 1976. Postharvest grain loss assessment methods: A manual of methods
for the evaluation of postharvest losses. American Association of Cereal Chemists.
Hassan, M.K. 2010. A guide to postharvest handling of fruits and vegetables. Bangladesh Agricultural
University, Bangladesh.
Hassan, M.K., Chowdhury, B.L.D. and Akhter, N. 2010. Postharvest loss assessment: a study to
formulate policy for loss reduction of fruits and vegetables and socioeconomic uplift of the
stakeholders. Bangladesh Agricultural University.144-150.
Hodges, R.J., Buzby, J.C. and Bennett, B. 2011. Postharvest losses and waste in developed and less
developed countries: opportunities to improve resource use. Journal of Agricultural Science 149:
37-45.
Joshi, G.D. and Roy, S.K. 1988. Influence of maturity, transport and cold storage on biochemical
composition of Alphonso fruit. Journal of Maharashtra Agricultural University 13(1): 12-15.
Kader, A.A. 2005. Increasing food availability by reducing postharvest losses of fresh produce. Acta
Horticulturae 682: 2169-2175.
LaGra, J. 1990. A Commodity Assessment Methodology for Problem and Project Identification.
Postharvest Institute for Perishables.
Rembold, F., Hodges, R., Bernard, M., Knipschild, H. and Leo, O. 2011. African Postharvest Losses
Information System (APHLIS). European Union.
Udas, S., Rai, B.K., Gurung, M., Thapa, R. and Khatiwada, P.P. 2005. Assessment of postharvest
handling systems of vegetables in the Eastern Hills of Nepal. Acta Horticulturae 682: 2191-2197.
Page 148
ISBN 978-967-10840-4-5
Proc. Int. Conf. Plt. Phy. 2014
First Published, 2015
142
The Growth and Postharvest Performance of Misai Kucing (Orthosiphon
stamineus Benth) in Relation to Different Soilless Growing Media and
Biochar
Wan Zaliha, W.S.* and Nurul Azilla, M.
School of Food Science and Technology, Universiti Malaysia Terengganu, 21030 Kuala Terengganu,
Terengganu, Malaysia.
*E-mail: [email protected]
Introduction
Misai kucing or Orthosiphon stamineus Benth. is belongs to the family of Lamiaceae. In Malaysia, there
are two varieties of Misai Kucing known as MOS1 and MOS2 (Zaharah, 2005). Currently, the production
of local herbs mainly Misai Kucing increased year by year indicating the demand is increasing. However,
Misai Kucing demand exceed its supply particularly from pharmaceuticals, cosmetics, health care, heal
enhancing products, dietary supplements, flavours and fragrances and toiletries and various consumer
goods (ECER, 2011). Misai Kucing has become increasingly important worldwide since it has been
reported to contain terpenoids, polyphenols, and sterols which have an antiallergic, antihypertensive,
antiflammatory and diuretic properties and it is also used as a treatment for anteriosclorosis (capillary and
circulatory disorder), ghout, rheutism, kidney stones, diabetis and nephritis (Tezuka et al., 2000). Thus, it
is a great challenge to Malaysia government to focus and explore the imperative herbs industry mainly
Misai Kucing. In Terengganu, Misai Kucing is not yet exploited due to a large area of Beach Ridges
Interspersed with Swales (BRIS) soil which is infertile due to poor physico-chemical characteristics. One
of the possible alternatives to explore Misai Kucing cultivation is by using fertigation system. This
planting system has been widely used in growing tomato, rockmelon, chilli, and strawberry. However,
there is lack of research on growing of Misai Kucing using soilless growing system.
The most common soilless growing media used in fertigation is coco peat (CP) from coconut husk which
has the ability to enhance strong and healthy root system, water and nutrient holding capacity. Other than
that, new organic media have been widely used to replace soil which is believed to have an excellent
moisture holding capacity such as Oil Palm Fruit Bunch (OPFB) and Biochar. OPFB is widely used as
mulch for plant cultivation due to highly potential to improve the soil nutrient levels by increased the soil
exchangeable K, Ca, Mg, and pH. In the present study, OPFB with the combination of CP were used as
newly growth media to determine the growth and postharvest performance of Misai Kucing. Additionally,
biochar is an amendment to soilless substrates, which has been reported to improve plant growth and as
well as induce systemic resistance to disease (Elad et al., 2010; Graber et al., 2010). However, it is not yet
commercially used in herbs plant cultivation. The application these soilless growing media and its
combination could be the effective approach to be applied in improving the growth and postharvest
performance of Misai Kucing. The information on growth and postharvest performance of Misai Kucing
grown on soilless growth media under fertigation system is scarce and not yet extensively studied.
Therefore, this study aimed to determine the effects and the best combination of different soilless growing
media and biochar on the growth, yield and postharvest performance of Misai Kucing.
Materials and Methods
The experiment was carried out at the Greenhouse, Universiti Malaysia Terengganu. Misai Kucing plants
and coco peat, were purchased from Department of Agriculture, Ajil, Terengganu and Bumi Agro Sdn
Bhd, Kuala Terengganu respectively. While, biochar and OPFB were obtained from BERNAS Rice Mill
Page 149
ISBN 978-967-10840-4-5
Proc. Int. Conf. Plt. Phy. 2014
First Published, 2015
143
at Tumpat, Kelantan and Oil Palm Plantation, Terengganu, respectively. Thirty-six of two-node stem
cuttings (10-15 cm) of Misai Kucing were used and immediately transfer into seedling tray containing
sand. Mature stem cuttings, aged 4-5 weeks, were transplanted into polybags containing different
treatments as described below. Each polybags contain 3 kg of growth media either alone or combinations.
All Misai Kucing plants were irrigated by using fertigation system. Irrigation has being equipped with 8
L/hr dripper and scheduled for 6-7 min/day.
The experiment was arranged in a Randomized Complete Block (RCBD) with three replications. The
treatment were: i) coco peat alone (Cp, 3 kg), ii) coco peat + biochar (Cp, 2.85 kg + Bc, 150 g), iii) coco
peat + oil fruit bunch (OPFB) (Cp, 15 kg + Op, 1.5 kg), iv) OPFB alone (3 kg) v) OPFB + biochar (Op,
2.85 kg + BC, 150 g) and vi) Cp + Op + Bc (1:1:1). Two trees represented one experimental unit.
Parameters evaluation were pre and postharvest parameters such as stem diameter, number of branches,
leaves area, fresh weight (leaves and stem), and dry weight (leave and stem), mineral nutrients in leaf,
branch and root [nitrogen (N), pottasium (K), calcium (Ca), and magnesium (Mg)] (Husni et al., 1990).
chlorophyll content.
The data were subjected to the analysis of variance (ANOVA) using GLM (General Linear Models)
procedures and further separated by LSD for least significance at P≤0.05 (SAS Institute Inc., 1999).
Results and Discussion
The combination of Cp+Bc was significantly higher in number of branches, stem diameter, leaf area,
fresh weight, dry weight and cumulative fresh weight (leaves and branches) of Misai Kucing as compared
to other media (Figure 1, 2, 3, 4, 5, 6 and 7). However, Cp+Bc had similar values in all parameters as
mentioned above with Cp alone. This, reflected to the ability of Cp+Bc media to replace or better than Cp
alone based on the comparable values of pre- and postharvest performances evaluated. Wira et al. (2011)
claimed that the growth of cherry tomato on Cp+Bc might be associated to the change in soil structure,
soil organic content, and also aeration capacity. This was supported by Graber et al. (2010) who claimed
that the two possibility of biochar application with other growth media might be stimulated the
development of beneficial microorganism which promote plant growth or chemical in biochar directly
elicit positive plant responses.
Other than that, the hidden quality attributes evaluated were chlorophyll content, total chlorophylls, macro
and micro nutrient content. The chlorophyll content showed the higher value of chlorophyll a and
carotenoid which were obtained in plants grown on Cp+Op. While, no apparent effect of chlorophyll b
was recorded for all the treatments used (Figure 8). This was in agreement with Erwan et al. (2013), who
claimed that the highest value of chlorophyll content in cauliflower were found in plant grown on Cp+Op.
Possibly, the plant chlorophyll absorbs sunlight, which converts CO2 and water into glucose (Mansfield et
al., 1990; Sims and Gamon, 2003). However, in the present study, the total chlorophyll content was not
differ among soilless growing media applied.
Meanwhile for mineral nutrients, the N content in leaf, branch and root was the same among growth
media (Figure 9). Contradictly, Erwan et al. (2013) reported that the optimum levels of N were found in
the soilless cauliflower grown on Cp+Op. Other macronutrients such as K in Misai Kucing leaf had
higher concentration and comparable to Cp alone and Cp+Op (data not included). However, K
concentration in branch and root were the same among treatments. In general, the concentration of Ca and
Mg in leaf, branch and root showed comparable value among treatments. Regardless of growth media
used, the concentration of N was higher in Misai Kucing leaf (ranging from 1.16% to 1.67%), followed
by roots (0.01% and 0.43%) and branch (0.04% and 0.21%). In descending order, the K concentration
was the highest in leaf and branch (ranged 4.46% to 5.26% and 4.66% to 4.97%, respectively) followed
Page 150
ISBN 978-967-10840-4-5
Proc. Int. Conf. Plt. Phy. 2014
First Published, 2015
144
aa
b
dd
c
a a
b
dd
c
aa
b
c c
b
0
50
100
150
200
250
Cp Cp+Bc Cp+Op Op Op+Bc Op+Cp+Bc
Fresh
Weig
ht
(g)
Treatments
Leaf Branch Root
aa
b
dd
c
a a
b
c c
ba
a
b
c c
b
0
5
10
15
20
25
30
Cp Cp+Bc Cp+Op Op Op+Bc Op+Cp+Bc
Dry
Wei
gh
t (g
)
Treatments
Leaf Branch Roota a
b
dd
c
0
50
100
150
200
250
300
350
400
Cp Cp+Bc Cp+Op Op Op+Bc Op+Cp+Bc
Cu
mu
lati
ve
Fre
sh W
eigh
t (g
)
Treatments
Cp alone Cp+Bc Cp+Op Op alone Op+Bc Op+Cp+Bc
0
50
100
150
200
250
300
0 14 28 42 56 70
Nu
mb
er o
f B
ran
ch
es
Days
Cp Cp+Bc
Cp+Op Op
Op+Bc Op+Cp+Bc
1.00
2.00
3.00
4.00
5.00
6.00
7.00
8.00
9.00
10.00
0 7 14 21 28 35 42 49 56 63 70S
tem
Dia
mete
r (
mm
)
Days
Cp Cp+BcCp+Op OpOp+Bc Op+Cp+Bc ab
a
b
c c
c
0
1000
2000
3000
4000
5000
6000
7000
8000
9000
Cp Cp+Bc Cp+Op Op Op+Bc Op+Cp+Bc
Lea
ves
Area
(cm
²)
Treatments
by roots (range between 1.94% and 2.50%). Meanwhile, the Ca concentration, leaf > branch > root.
Similar pattern was also observed for Mg.
Figure 4. Effects of different soilless
growing media and biochar on fresh
weight of Misai Kucing. Means with
different letters are significantly
different at the 5% level according to
LSD test.
Figure 5. Effects of different soilless
growing media and biochar on dry
weight of Misai Kucing Means with
different letters are significantly
different at the 5% level according to
LSD test.
Figure 6. Effects of different soilless
growing media and biochar on
cumulative fresh weight of Misai
Kucing. Means with different letters
are significantly different at the 5%
level according to LSD test.
Figure 7. Effect of different soilless growing media and biochar on plant growth of Misai Kucing. Cp alone (coco peat
alone), Cp+Bc (coco peat+biochar), Cp+Op (coco peat+Oil palm fruit bunch), Op alone (Oil palm fruit bunch alone),
Op+Bc (Oil palm fruit bunch+biochar) and Op+Cp+Bc (Oil palm fruit bunch+coco peat+biochar).
Figure 1. Effects of different soilless
growing media and biochar on
number of branches of Misai Kucing.
Vertical bars represent LSD0.05
Figure 2. Effects of different soilless
growing media and biochar on stem
diameter of Misai Kucing. Vertical
bars represent LSD0.05
Figure 3. Effects of different soilless
growing media and biochar on leaf area
of Misai Kucing. Means with different
letters are significantly different at the
5% level according to LSD test.
Page 151
ISBN 978-967-10840-4-5
Proc. Int. Conf. Plt. Phy. 2014
First Published, 2015
145
a
b
aab ab ab
a aa a
aa
a a
a
a a a
0.00
0.50
1.00
1.50
2.00
2.50
3.00
3.50
Cp Cp+Bc Cp+Op Op Op+Bc Op+Cp+Bc
Ch
loro
ph
yll
Co
nte
nt
(mg
.gˡF
W)
Treatments
Chlorophyll a Chlorophyll b Carotenoid
a
a
a a
a a
a a
a
aa a
ab
aa
ab
0
0.2
0.4
0.6
0.8
1
1.2
1.4
1.6
1.8
2
Cp Cp+Bc Cp+Op Op Op+Bc Op+Cp+Bc
Nit
rogen
(%
)
Treatments
Leaf Branch Root
Conclusions
As a conclusion, Cp+Bc growth media had potential to replace commercial growth media (Cp alone) as
its exhibit higher and comparable values of yield and growth without significant reduction in postharvest
quality attributes. In addition, this newly-developed soilless growth media are light and easy to handle
and cost effective. Besides, the usage of fertilizers and environmental pollution could also be reduced by
minimizing rice husk waste.
References
Elad, Y., Rav David, D., Meller Harel, Y., Borenshtein, M., Ben Kalifa, H., Silber, A. and Braber, E.R.
2010. Induction of systemic resistance in plants by biochar, a soil-applied carbon sequestering
agent. Phytopathology 100: 913-921.
East Coastal Economic Region (ECER). 2011. Investment and business opportunities. In the herbal and
biotechnology cluster development. Retrieved September 21, 2013 from
http://www.ecerd.com.my/ecerd/pdf/HerbalBiotech.pdf.
Erwan, M.R., Ismail, M., Sariah, H.M., Saud, S.H., Habib, H., Kausar. and Naher, L. 2013. Effect of oil
palm frond compost amended coconut coir dust soilless growing media on growth and yield of
cauliflower. International Journal of Agriculture and Biology, 15: 731-736.
Graber, E.R., Harel, Y.M., Kolton, M., Cytryn, E., Silber, A., David, D.R., Tsechansky, L., Borenshtein,
M. and Elad, Y. 2010. Biochar impact on development and productivity of pepper and tomato
grown in fertigated soilless media. Plant Soil 337: 481-496.
Husni, H., Halimi, S. and Syed Omar, S.I.R. 1990. Panduan analisis tanah dan tumbuhan. Jabatan Sains
Tanah, Universiti Pertanian Malaysia.
Mansfield, T.A., Hertherington, A.M. and Atkinson, C.J. 1990. Some current aspect of stomatal
physiology. Annual Review of Plant Physiology and Plant Molecular Biology 41: 55-75.
SAS Institute Inc,. 1999. SAS Procedure Guide, Version 9.1. Cary. Nc.
Sims, D.A. and Gamon, J.A. 2003. Estimation of vegetation water content and photosynthetic tissue area
from spectral reflectance: a comparison of indices based on liquid water and chlorophyll
absorption features. Remote Sensing of Environment 84: 526-537.
Tezuka, Y., Stampoulis, P., Banskota, A.H., Awale, S., Tran, K.Q. and Saiki, I. 2000. Constituents of the
Vietnamese medicinal plant Orthosiphon stamineus. Chemical Pharmaceutical Bulletin 48: 1711-
1719.
Figure 8. Effects of different soilless growing media
and biochar on chlorophyll and carotenoid content of
Misai Kucing. Means with different letters are
significantly different at the 5% level according to
LSD test.
Figure 9. Effects of different soilless growing media
and biochar on macronutrients in leaf of Misai
Kucing. Means with different letters are significantly
different at the 5% level according to LSD test.
Page 152
ISBN 978-967-10840-4-5
Proc. Int. Conf. Plt. Phy. 2014
First Published, 2015
146
Wira A.B., Mohd Razi., I. and Abd Jamil, Z. 2011. Compost as additives in coconut coir dust culture for
growing rockmelon (Curcumis melo L.). Journal Tropical Agricultural and Food Science 39(2):
229-237.
Zaharah, A. 2005. Misai Kucing. Penanaman tumbuhan dan ubatan beraroma. Malaysia Agriculture
Research and Development Institute (MARDI). pp: 57.
Page 153
ISBN 978-967-10840-4-5
Proc. Int. Conf. Plt. Phy. 2014
First Published, 2015
147
Effects of Collecting Systems and Plantation Environment on Debris
Accumulation in a Collected Oil Palm Loose Fruits
Darius, E.P.1,2,*
and Muhammad Fairulnizam, H.1
1Faculty of Plantation and Agrotechnology, Universiti Teknologi MARA (UiTM) 40450, Shah Alam,
Selangor, Malaysia. 2Faculty of Plantation and Agrotechnology, Universiti Teknologi MARA (UiTM) Melaka, kampusJasin,
77300 Merlimau,Melaka, Malaysia.
*E-mail:[email protected] ; [email protected]
Introduction
The oil palm is one of the key crops that contribute in changing the scenario of Malaysian agriculture as
well as the economy. Currently, oil palm plantation sector is a strategic sector of the economy and has
contributed the export earnings of about RM61.36 billion for the country from various palm oil based
products. The oil palm plantation is also growing steadily to play its role as the main backbone of
commodity crop sector in this country. It could be seen from the escalation of total oil palm planted area
at about 5.23 million hectares in the year 2013, an increase of 7.27% from 4.85 million hectares
recorded in the year 2010 (MPOB, 2014).
The collection of loose fruit is one of the important processes in the oil palm harvesting that need great
and serious attention since there is an economic value of the fruits for upstream production of palm oil.
According to Turner and Gillbanks (2003), loose fruits are considered as apart of yield, which is derived
from oil palm trees, besides a fresh fruit bunch (FFB). Normally in the process of oil palm harvesting, the
ripeness of oil palm FFB is determined by the number of fruits that has been detached from the bunch
before it cut.
As part of the yield, the plantation management always insists on zero loose fruits left in the estate field in
order to minimize the decline of the oil extraction rate due to uncollected loose fruits and at the same time
inclines the profits. Seedlink (2008) reported that a loose fruit offers 40% of the oil extraction rate per
weight ratio or much higher as compared to 20 to 25% of the oil extraction rate per weight ratio given by
a bunch. In fact, a proper collection of only six loose fruits per palm could give an additional RM30
million in net profit to the oil palm plantation company. On the contrary, the loose fruits can give massive
lost incomes if loose fruits not well-managed or uncollected
Currently the collection of loose fruits in oil palm plantation is a labor-intensive operation. During the
collection process, the worker walks along planting rows while carrying along with him either a sack or
wheelbarrow and rake. He stops at the palm tree, collects the scattered loose fruits with rake into one
lump before lifting them into the sack or the wheelbarrow until it reaches its full capacity. These activities
are repeated at every harvested palm tree until the whole harvested areas are completed.
One of the major problems in the collection of loose fruits is the debris accumulation associated in a
collected loose fruits. Debris as defined by Warner (2006) is leaves and anything else that is not part of
the fruit. Ahmad et al. (1995) mentioned that debris accumulated in a collected loose fruits can reach up
to 60% of its total weight. Shuib and Khalid (2005) stated that the large amount of debris in a collected
loose fruits will affect the mill productivity since debris will absorb the oil content of the fruit, hence
reducing the oil extraction rate.
Page 154
ISBN 978-967-10840-4-5
Proc. Int. Conf. Plt. Phy. 2014
First Published, 2015
148
It is clear that the loose fruits should be clean before processing it to the mill in order to obtain a higher
oil extraction rate. However, it is very difficult for the workers in collecting the loose fruits effectively
and without any debris since there are a lot of obstacles faced by the workers such as plantation
environment, limitation of collecting system technology used, long working hours, loose fruits condition,
increasing the number of loose fruits due to over-ripe bunch and also physical limitation of workers as a
human.
The debris accumulation in a collected oil palm loose fruits has made the workers loosing a lot of
valuable time. Other than that, the plantation management also has to expense an extra cost to separate
the debris from a collected loose fruits or to minimize the percentage of debris in an acceptable level
before processing it in the mill. Some palm oil mills even give punishment to the estate management if
they keep sending collected loose fruits mixed with debris beyond the acceptable level.
Until today, there is no comprehensive study explored on the effect of collecting systems and plantation
environment on debris accumulation in a collected loose fruits. Studies reported by Amirshah and Hoong
(2003) and Hitam et al. (1995) were focused on the performance of a rake that is being used as a tool in
loose fruits collections in the estate. However, this study did not explore the effects of other conditions
such as types of containers used and plantation environment, i.e. level of ground cleanliness of plantation,
loose fruits conditions and working experience of the workers to the debris accumulated in a collected
loose fruit. All these conditions may influence the debris accumulation in a collected loose fruits.
This study investigates the effects of collecting systems and plantation environment on the percentage of
debris accumulation in a collected oil palm loose fruits. Comparisons of debris accumulation in a
collected loose fruit as a result of the effect of two above different conditions are presented.
Materials and Methods
The comprehensive data collection was carried out in the month of February 2012 at five oil palm estates
in Pahang State, Malaysia. The terrain conditions of the estates varied from flat to undulating. A total of
15 plantation workers that have familiarized with the collection of loose fruits were involved in the study.
These subjects were randomly selected to sufficiently represent a total of 20 workers population in the
estates. Throughout the data collection period, the daily ambient temperature of the estates was in the
range of 24 to 35 oC. Wind speeds during data collection ranged from 6 to 10 km/h while the relative
humidity between 67 to 88%. All the weather data was taken from Viewweather (2012). The collecting
systems used were from the two types of the common containers, i.e. sack and wheelbarrow for in field
loose fruits collection. Plantation environment refers to the plantation ground cleanliness, working
experience and loose fruits conditions. Each subject was assigned to collect loose fruits randomly in his
usual manner for three harvesting paths under the same working conditions. Once the container reached
its full capacity, the worker recorded the total weight of loose fruits associated with debris using a
portable digital weighing machine in the field. Debris accumulated was then separated from a collected
loose fruits. Immediately after the separation, he recorded the total weight of debris accumulated only
using the same weighing machine. Debris accumulation on a collected loose fruits was calculated by
dividing the total weight of accumulated debris with the total loose fruits and accumulated debris and
multiplying by 100%.
The T-test and Analysis of Variance of the statistical analysis produced in PC SAS Ver 6.12 software
were employed to analyze the collected data. The T-test was used to test the significant effects of two set
data of percentage of debris in a collected loose fruits that obtained from sack and wheelbarrow
containers used, wet and dry loose fruits condition, < 3 years and > 3 years working experiences. The
ANOVA was employed to determine the significant effect of debris accumulation in a collected loose
Page 155
ISBN 978-967-10840-4-5
Proc. Int. Conf. Plt. Phy. 2014
First Published, 2015
149
fruits under different of ground cleanliness of the estates. Duncan’s multiple range test (DMRT) was used
to statistically compare means values of the percentage of debris accumulation in the loose fruits.
Results and Discussion
There was a significant difference of mean percentage debris accumulation in a collected loose fruits
between using a sack and wheelbarrow as shown in Table 1. The mean percentage of debris accumulation
in a collected loose fruits using sack was found to be 34.74% of the total weight of collected loose fruits
or 11.14% higher than that of the wheel barrow.
Table 1. The mean percentages of debris accumulation in a collected loose fruits using differenttype of
containers. Type of containers Mean percentage of debris
1, % Different,%
Sack 37.74a 11.14
Wheelbarrow 26.60b
1Means in a given column having suffices with different letter are treated as significantly different at 0.05
probability level
Several factors have caused the different percentage of debris accumulation in a collected loose fruits
between two types containers used. Saving a collected loose fruits into the sack during the collection
operation is difficult to be inspected by the estate supervisor. This is because the collected loose fruits
were covered by the sack so that it cannot be seen by the supervisor. Normally under this condition, the
worker has a tendency to mix a lot of debris along a collected loose fruits into the sack with the purpose
of increasing the quantity of sacks that they can be filled with loose fruits in a day. By doing this, the
workers can significantly increase their income because usually the payment for the workers was made by
the estates management based on the amount of sacks occupied with a collected loose fruits in a day. The
situation was different when the worker using a wheelbarrow. The collected loose fruit was easy to be
watched by the estate supervisor because the wheelbarrow is an exposed container. The supervisor can
easily identify the amount of debris that being mixed together with a collected loose fruit inside
wheelbarrow. This situation has reduced the tendency of the workers collect extra debris in a collected
loose fruits to obtain additional sacks occupied since the estates send all the loose fruits into a separator to
separate the debris from the loose fruits before transporting them to the mill. The management only pays
on the basis of the amount of a collected loose fruits weight.
Table 2 shows that the percentage of debris accumulation in a dry collected loose fruits was slightly
higher than that of wet collected loose fruits. However, there was no significant difference of the
percentages of debris accumulated between two conditions of a collected loose fruits. It was observed that
wet and dry conditions did not give any significant effects on percentages debris accumulated in a
collected loose fruits. Thus, the collection of loose fruits can be made even after raining day operation to
maximize the daily output of the plantation.
Table 2. The mean percentages of debris accumulation in dry-collected loose fruits and wet-collected
loose fruits.
Loose fruit conditions Mean Percentage of debris1, % Different, %
Dry 34.60a 4.05
Wet 30.55a
1Means in a given column having suffices with the same letter are treated as not significantly different at 0.05
probability level
Page 156
ISBN 978-967-10840-4-5
Proc. Int. Conf. Plt. Phy. 2014
First Published, 2015
150
Table 3 shows that there was a significant difference in the percentages of debris accumulation in a
collected loose fruits between the workers who has experienced less than 3 years and more than 3 years.
The mean percentage of debris accumulation in a collected loose fruits as results of the workers having
experience less than 3 years was 39.75% of the total weight of the collected loose fruits or 18.98% higher
than that of the workers having experience more than 3 years.
Table 3. The mean percentages of debris accumulation in a collected loose fruits from two different
working experiences of the workers.
Workers experience levels Mean Percentage of debris1, % Different,%
Less than 3 years 39.75a 18.98
More than 3 years 20.77b
1Means in a given column having suffices with different letter are treated as significantly different at 0.05
probability level
The workers, having less than 3 years experienced had tendency to collect more debris alongside the
loose fruits. They did not yet have enough skill to operate the relevant tools to minimize the amount of
debris accumulation in a collected loose fruits. On the contrary, the workers having more than 3 years
working experience have skill to minimize the amount of debris in a collected loose fruits. The
experienced workers know how to operate rake and container properly. Besides, the workers, having
more than 3 years working experience have been classified in the check roll workers or permanent
workers while the workers having less than 3 years working experience are still under contract workers.
Since the dissimilarity of their status, the management paid the experienced worker on the basis of the
weight of the loose fruits itself while contract or inexperienced workers were paid by the numbers of sack
collected.
Table 4 shows there was a significant difference in the percentages of debris on the collected loose fruit
between estates 1, 2, 3 and estates 4, 5. The mean percentage of debris accumulated in a collected loose
fruits from the above estates was in the range of 19.60% to 39.10% of the total weight of the collected
loose fruits. The variation of range was created due to the different manner of estates in maintaining their
plantation environment. The major factor has been identified to be able to reduce the debris accumulation
in a collected loose fruit are cleanliness of plantation environment. The ways of the estate managing the
environment in a particularly cleaning the area around the palm base is very crucial. The estates that
conduct a regular palm circle spraying at every six month have offered a low debris accumulation in a
collected loose fruits as compared to those estates which did not manage to do so. It has been proven that
the more clean the field the less debris accumulation in a collected loose fruits. This agree with Orme
(2001) stated that a poor palm circle spraying not only results in high debris accumulation but also a
significant loss of loose fruit. Management manner of estates in running the collection of loose fruits also
affected the amount of debris accumulation in a collected loose fruits. As mentioned earlier, types of
container used and payment method also contributes to the debris accumulation in a collected loose fruits.
For example, wheelbarrow container has been proven to be able to reduce the amount of debris as
compare to the sack. Indirectly payment on the basis loose fruits itself weight has reduced the amount of
debris as compared to the payment based on sack.
Page 157
ISBN 978-967-10840-4-5
Proc. Int. Conf. Plt. Phy. 2014
First Published, 2015
151
Table 4: Percentages of debris accumulated in a collected loose fruits by different estates management
style. No. of estates Mean percentage of debris
1, %
Estates 1 39.10a
Estates 2 38.70a
Estates 3 34.70a
Estates 4 21.50b
Estates 5 19.60b 1Means in a given column having suffices with different letter are treated as significantly different at 0.05
probability level
Conclusions
Effects of collecting systems and plantation environment with regard to the types of container used, loose
fruits conditions, worker experience and estate environment on percentage of debris accumulation in a
collected oil palm loose fruits have been presented. Sack provided 37.74% debris accumulation in a
collected loose fruits or 11.14% higher as compared to 26.60% of the wheelbarrow. Statistically, there
was no significant difference of the percentages of debris accumulated between two conditions of a
collected loose fruits. The percentage of debris accumulation in a dry-collected loose fruits was 34.60%
or slightly higher as compared to 30.55% debris from wet-collected loose fruits. The workers having
experience less than 3 years gave 39.75% debris accumulation in a collected loose fruits or 18.98% higher
as compared to the workers with experience more than 3 years.
References
Hitam, A., Yahya, A.Z. and Jaafar, M.S. 1995. Loose fruit collector. PORIM Information series No.19.
PORIM, Kuala Lumpur, Malaysia.
Shuib, A.R. and Khalid, M.R. 2005. Air-assisted loose fruit separating machine. MPOB Information
Series (ISSN 1511-7871). No. 257-June 2005. Malaysian Palm Oil Board (MPOB) Kuala
Lumpur, Malaysia.
Turner, P.D. and Gillbanks, R.A. 2003. Oil palm cultivation and management. Incorporated Society of
Planter. Kuala Lumpur, Malaysia.
Viewweather. 2012. Weather in Gambang, Pahang, Malaysia. http://www.viewweather.com. Accessed on
February 2012.
Page 158
ISBN 978-967-10840-4-5
Proc. Int. Conf. Plt. Phy. 2014
First Published, 2015
152
Postharvest Life of Guava Fruit under Selected Postharvest Handling
Practices
Silip, J.J.*, Yung, R.R., Lim, K.S., Mohamad, M. and Hamdan, S.M.
Faculty of Sustainable Agriculture, Universiti Malaysia Sabah, Miles 10, Sungai Batang Road, P.O. Box
3, 90509 Sandakan, Sabah, Malaysia.
*E-mail: [email protected]
Introduction
Guava (Psidium guajava L.) of Myrtaceae family is one of most popular amongst tropical fruit because
containing high phytochemical content especially ascorbic acid which measured containing around 60 to
1000 mg/100g. Guava cultivated area in Malaysia showed increasing trend with only around 1,500 ha in
2009 to almost 3,500 ha in 2013 (KPIAT, 2014). Increase in the cultivation area followed by increase
production value pattern of only around RM50 million in 2009 into around RM120 million in 2013. The
data indicated an increment of 100% on the cultivated area and around 150% on the production value
within five years. Guava has a high economic potential with good yield that can produce fruits of around
15 mt/ha/yr (JPS, 2014). The statistics are expected to continue increase in the near future with opening of
more production zooning area with basic infrastructures called Permanent Food Production Area (TKPM)
throughout the Sabah state of Malaysia.
Like other tropical fruit, guava was also reported rapidly deteriorates in short time after harvest if not
properly handled. According to Omayma et al. (2010), guava is highly perishable, susceptible to
mechanical damage and chilling injury. Campbell (1994) reported shelf life of this fruit is only 3 to 10
days at room temperature. This fruit reported has a high respiration and ethylene production which lead to
a dramatic change on it physical and chemical attributes (Ali and Lazan 1997). Postharvest life or shelf
life is simply the time period that a fruit can be expected to maintain predetermined level of quality under
specified storage condition. In other word, the period (in days) between initiation or commencement of
ripening (i.e. end of green-life) and end of saleable life or edible life (of the fruit) on the shelf. Fruit which
have long postharvest life or ripen slowly would facilitate marketing of the fruit and reduce postharvest
losses.
Appearance is one of the major factors that a consumer uses to evaluate the quality of fruits and
vegetables because quality could be viewed as an absence of defects or degree of excellence (Shewfelt,
1999). Rapid visual assessment can, with experience, be made on the criteria of size, shape, colour,
condition (such as freshness), and the presence of defects or blemishes. Therefore, traditionally the
appearance, condition and defects qualities are normally done by experts according to his/her senses of
sight, touch and smell. However, using traditional methods are not sufficient to define what the
consumers want or look for in a certain product (Ismail et al., 2001).
Several postharvest handling have been recommended to extend the postharvest life of horticulture
produce. Temperature management has been the dominant main factor to consider longer postharvest life
of any harvested produce. For each 10 oC rise in temperature, respiration activity is increased by a factor
of two or three. Low temperature has been used to extend the shelf life of fruit and vegetable however, a
crucial point of this low temperature is that the commodities showed low temperature injury (Paull,
1993). Polysaccharide based coatings can be used to extend the shelf-life of some fruits and vegetables
during short term storage by preventing dehydration, oxidative rancidity, and surface browning (Nisperos-
Carriedo, 1994). Similar to coating, packaging has been well known to extend shelf life of harvested
produce. In addition, proper packaging will give advantages for easier handling and marketing attraction
Page 159
ISBN 978-967-10840-4-5
Proc. Int. Conf. Plt. Phy. 2014
First Published, 2015
153
as buyer buy form their eye judgment. The objective of this write up is to share results of our continuous
study to determine effect of several postharvest handling treatments to maintain visual appearances of
guava.
Materials and Methods
Plant materials - Mature-green, uniform sized (350+50 g) guava cv. Kampuchea fruits were harvested
from a Farm in Tenom, Sabah. Only well-formed and blemished-free fruits were selected for the
experiment.
Portable hydrocooler - A portable hydrocooler (PH) was designed and build at the Postharvest
Laboratory, Faculty of Sustainable Agriculture Universiti Malaysia Sabah. The principle operation of the
hydrocooler was very simple and the material used was considered low cost (Silip et al., 2003).
Hydrocooling treatments - Fruits were precooled by immersing them in water (1.5+1 oC) containing 300
μg ml-1
active benomyl (Benlate®) for 0, 1/8, 1/4 and 1/2 cooling time (CT) in the PH. Fruit for the
control treatment was dipped in distilled water (26+1 oC) for 1 minute. The storage temperatures (ST) of
fruits were 5, 10 and 15 oC and storage durations (SD) were 1, 2, 3, 4, 5 and 6 weeks, at relative humidity
of 80+15%. Two fruits from each treatment were taken out weekly for the visual quality analysis. The
experimental design was a randomized complete block design (RCBD) with a factorial arrangement of
treatments (4 CT x 3 ST x 6 SD), with four replications and two fruits per treatment per replication.
Hydrocooling and packaging study setup - The study was conducted using 6 x 4 factorial treatments in a
completely randomized design (CRD) with 6 hydrocooling and packaging combinations treatments (1.
precooling + packing with old new-paper, 2. precooling with plastic, 3. precooling only without
packaging, 4. without precooling but packed with old news-paper, 5. without precooling but packed with
plastic and 6. without precooling and packaging) with and four storage durations (1, 2, 3 and 4 weeks)
with three replications.
Hot water shocking time study setup - The study was conducted using 5 x 5 factorial treatments in a CRD
with 4 replications for each treatment. There were five dipping durations applied to the guava at
temperature of 46+1 oC (control, 15, 25, 35 and 45 min) and five storage duration (0, 5, 10, 15 and 20
days).
Sodium alginate coating study setup - For this experiment, 4 x 5 factorial treatment arrangements in a
CRD were used. Each guava fruit was tested on different concentrations of sodium alginate (1.0, 1.5 and
2.0 % w/v) and with a control (without coating). Each treatment had four replicates. The samples were
stored in a cold room 10+2 oC for 20 days.
Visual quality determination (the postharvest life) - A subjective hedonic score for visual appearances
was based on a scale of 9 to 1 where 9=0% defects, 7=up to 25% defects, 5=50% defects, 3=75% defects
and 1=100% defects. A score of 6 (37.5% defects) was considered the limit of acceptable visual
appearances.
Statistical analysis - The differences among the main and interaction effects were subjected to analysis of
variance (ANOVA) by using Statistical Packages for Social Science (SPSS). For the subjective visual
appearance, the square root transformation was applied before the analysis.
Page 160
ISBN 978-967-10840-4-5
Proc. Int. Conf. Plt. Phy. 2014
First Published, 2015
154
Results and Discussion
Effect of hydrocooling time, storage temperatures and storage duration to guava visual appearances
Visual appearance was significantly (P<0.05) affected by the interaction between storage temperature x
storage duration but there were no significant interaction effects of cooling time x storage temperature
and cooling time x storage duration on visual appearance. Visual appearance of guava stored at 5 oC
decreased linearly while those stored at 10 and 15 oC decreased quadratically with increased storage
duration from 1 to 6 weeks (Figure 1). Fruit stored at 5 oC only had acceptable visual appearance when
stored up to 1.6 weeks. Guava stored at 10 oC had acceptable visual appearance of up to 3.6 weeks of
storage. However, the negative quadratic relationship between visual appearance and storage duration of
fruit stored at 15 o
C indicated that the visual appearance decreased rapidly in the first 3 weeks and then
the decrease tend to level off until the sixth week of storage. Fruit stored at 15 o
C had acceptable visual
appearance for up to 1.3 weeks. In this study, the acceptable visual appearance was set at 2.44 (square
root transformation), which was equivalent to about 37.5% occurrence of defects on fruit. Fruit with
visual appearance score of 2.44 could still be sold, although it was of inferior appearance.
5 oC VA = -0.3623x + 2.97 (R
2 = 0.68, n=72)
10 oC VA = -0.0772x
2 + 0.144
2x + 2.85 (R
2 = 0.84, n=72)
15 oC VA= 0.0747x
2 - 0.8407x + 3.38 (R
2 = 0.67, n=72)
0.6
1.2
1.8
2.4
3
3.6
0 1 2 3 4 5 6 7
5C
10C
15C
Vis
ual
appe
aran
ce
(squ
are
root
tra
nsfo
rmat
ion)
10 oC
15 oC
5 oC
Limit of acceptable visual appearance
Storage duration (week)
Figure 1. Relationship between visual appearance (VA) and storage duration (week) of guava cv.
Kampuchea after storage at 5, 10 and 15 oC.
Precooling at 1/8, 1/4 and 1/2 cooling time indicated a reduction of 12.5, 25 and 50% respectively, of
temperature differences between product and its surroundings as illustrated by Wills et al. (1998). This
study suggested that cooling time of more than 1/2 could be suitable to get better visual appearance of
guava. Guillou (1959) reported that the remaining field heat from application of precooling with high
Page 161
ISBN 978-967-10840-4-5
Proc. Int. Conf. Plt. Phy. 2014
First Published, 2015
155
level of cooling time can be gradually removed with short time and low energy cost at storage. Hence,
temperature of products was reduced within a short time, while rate of product metabolic process was
expected to be slow while visual appearance in guava could be prolonged. Application of precooling
could also ensure greater customer satisfaction is achieved and therefore repeated purchases can be
ensured. Freeman (1984) had identified the economic benefits of early precoolings. He also reported that
different products are better suited to certain cooling technique so that the cost efficiency could be
improved and better results are attained.
In this study, the guava showed different trends of the defects at each storage temperature. The defects in
guava stored at 5 oC increased linearly while those stored at 10 and 15
oC increased quadratically with
increased storage duration from 1 to 6 weeks. In this study, increase in defects is referred to as a decrease
in the visual appearance. Therefore, this study suggested that the differences could affect the consumer
perception to buy this fruit. Dever et al. (1995) reported that even different side of the same fruit could
have a different sensory characteristic that effect consumer perception. However, Deliza and MacFie
(1996) reported that consumer only reject the products if the disparity was large.
Effect of hydrocooling, packaging materials & storage duration to guava visual appearances
Application of hydrocooling followed by any packaging has extended visual appearances of the guava
fruits (Figure 2). Precooling followed by plastic give much batter visual appearances compare to other
handling in this study. Visual appearances of guava after treatment of precooling and packaging with
plastic showed above acceptable visual appearance even after 20 days of storage followed by fruit which
previously precooled and packed with newspaper. According to Ahlawat and Jindal, (1980), packaging
with plastic will create modified atmosphere that can reduce transpiration, gas exchanges and directly
reduce water loss. Appropriate atmosphere condition was expected achieved since the fruit has been
precooled earlier. Seymour et al. (1993) confirmed that fruit kept at low temperature has less ethylene
production and Lim and Khoo (1985) confirmed less pathogen and rotting in guava stored at low
temperature.
-
0.50
1.00
1.50
2.00
2.50
3.00
3.50
1 2 3 4
Vis
uL
Ap
pe
ara
nce
s S
core
(S
QR
T)
Storage Duration (Weeks)
Precooling + newspaper Precooling + plastic
Precooling
Figure 2. Visual appearance score of guave fruit after subjected to combination treatment with
hydrocooling, packaging and storage duration (days).
Acceptable
visual
appearances
Page 162
ISBN 978-967-10840-4-5
Proc. Int. Conf. Plt. Phy. 2014
First Published, 2015
156
Effect of hot water treatments & storage duration to guava visual appearances
Dipping duration and storage duration has a significant effect on the visual appearances for guava (Figure
3). The highest visual appearance was always associated with hot water treatment of 15 minutes. Visual
appearances are acceptable until the end of observation period compared with other treatments. The
lowest visual appearances was always associated with longer dipping duration (35 and 45 minutes). Hot
water treatments of 15 min had the highest visual appearances (2.63), while both hot water treatments of
35 and 45 min had the lowest visual appearances (1.98) at the end of 20 days of storage (Figure 3). Yusof
and Hashim (1999) pointed out that the incidence of brown scorches especially around the stalk region
will be increased with increasing duration of guava pulp exposure to temperature of 46 °C. Mansour et al.
(2006) also showed that no blackening occurred on mango dipped in hot water at 45 and 50°C with
shorter duration for 5 min, while with raised water temperature and dipping duration at 10 and 15 min,
degrees of blackening will increased and severe damage occurred at 50°C and increased gradually as
exposure time increased.
Figure 3. Visual appearance score of guave fruit after subjected to combination treatment hot water
treatments and storage duration (days).
Some fruit may be sensitive to heat damage while some are not. According to Woolf and Lay-Yee (1996),
avocado fruit are unacceptably damaged by hot water treatments of 3 to 5 min at 50˚C and heat damage
symptoms in avocado fruit are usually predominantly in the skin, browning of tissue and hardening when
ripe. Hot water treatment with shorter dipping duration can maintain the visual appearances of guava
during low temperature storage. However, with increased dipping duration, the level of visual appearance
degradation becomes more severe. Therefore, guava should not be treated with longer hot water dipping
duration to avoid heat damage.
Effect of sodium alginate coating concentration and storage durations on guava visual appearances
Visual appearances was significantly affected by the interaction between the sodium alginate coating and
storage duration (p<0.05) (Figure 4). The score of visual appearances for each treatment was shown to be
decreasing as the storage duration was increased. The result indicated that the fruits coated with 1.5%w/v
and 2.0% w/v of sodium alginate showed better visual appearance than control and 1.0%w/v of sodium
Acceptable
visual
appearances
Page 163
ISBN 978-967-10840-4-5
Proc. Int. Conf. Plt. Phy. 2014
First Published, 2015
157
alginate at 15 days of storage. Waxing or coatings of certain fruits and vegetables could reduce their rate
of respiration and enhance the gloss product, improving merchandising and marketing (Salunkhe et al.,
1991).
Figure 4. Visual appearance score of guave fruit after subjected to combination treatment of sodium
alginate coating concentration and storage duration (days).
Conclusions and Recommendations
Temperature management is very important in maintaining the visual appearances of guava fruit. This
study recommended precooling guava at minimum of 1/8 cooling time, applying packaging with plastic
materials and storing at 10 oC. Application of hot water treatments should be carefully supervise to ensure
not more than 25 minutes of dipping time with 46 oC hot water medium. Producers are recommended to
apply coating treatment to get advantages on the extending visual appearances.
References
Ahlawat, V.P. and Jindal P.C. 1980. Studies on the effect of postharvest treatment on storage behavior of
guava (Psidium guajava) cv. Sagar. Haryana Agricultural Journal 10: 242-247.
Ali, Z.M. and Lazan, H., 1997. Guava. In: Mitra, K.S. (Ed.), Postharvest Physiology and Storage of
Tropical and Subtropical Fruits. CAB International, Wallingford, UK.
Campbell, C.A. 1994. Handling of Florida-grown and Imported Tropical Fruits and Vegetables.
HortScience 29: 975-978.
Deliza, R. and MacFie, H.J.H. 1996. The generation of sensory expectation by external cues and its
effects on sensory perception and hedonic rating: A review. Journal of Sensory Studies 11: 103-
128.
Dever, M.C., Cliff, M.A. and Hall, J.W. 1995. Analysis of variation and multivariate relationships among
analytical and sensory characteristics in whole apple evaluation. Journal of the Science of Food
and Agriculture 69: 329-338.
Freeman, C.D. 1984. Cost reduction technologies in cooling fresh vegetables. St. Joseph (MI): American
Society of Agricultural and Engineers, Pp.84-1074.
Guillou, R. 1959. Some engineering aspects of cooling fruits and vegetables. Transactions of the ASAE.
1(1): 38-942.
Acceptable
visual
appearances
Page 164
ISBN 978-967-10840-4-5
Proc. Int. Conf. Plt. Phy. 2014
First Published, 2015
158
Ismail, A. and Embong, S.M. 1984. Pembuangan tanin dalam jus gajus. Pertanika 7(2):83-90.
Jabatan Pertanian Sabah. 2014. Perangkaan Tanaman Negeri Sabah.
Kementerian Pertanian dan Industri Asas Tani Malaysia. 2014. Perangkaan Agromakanan 2013.
Lim, T.K. dan Khoo, K.C., 1990. Guava in Malaysia; production, pests and diseases. Tropical Press,
Kuala Lumpur, Malaysia.
Mansour, F.S., Abd-El-Aziz, S.A. and Helal, G.A. 2006. Effect of fruit heat treatment in three mango
varieties on incidence of postharvest fungal disease. Journal of Plant Pathology 88 (2): 141-148.
Omayma, M.I., Eman, A.A., Abd El-Moniem, A.S.E., Abd-Allah. and El-Naggar. M.A.A. 2010.
Influence of some post-harvest treatments on guava fruits. Agriculture and Biology Journal of
North America 6: 1309-1318.
Salunkhe, D.K., Bolin, H.R. and Reddy, N.R. 1991. Storage, processing and nutritional quality of fruits
and vegetables, 2nd
ed., Vol. 1 CRC Press, Boca Raton, FL.
Seymour, G.B, Taylor, J.E. and Tucker, G.A. 1993. Biochemistry of fruit ripening. Chapman and Hall,
London.
Shewfelt, R.L. 1999. What is quality? Postharvest Biology and Technology 15: 197-200.
Silip, J.J. 2003. Quality characteristics of guava (Psidium guajava L. cv. Kampuchea) in response to
hydrocooling time, storage temperature and storage duration. Ms. Agr. Sc. Universiti Putra
Malaysia.
Wills, R.B., Lee, T.H., Graham, D., McGlasson, W.B. and Hall, E.G. 1989. Postharvest. An introduction
to the physiology and handling of fruits and vegetables. Australia: N.S.W. University Press.
Yusof, S. and Hashim, H. 1999. Hot water dip versus vapour heat treatment and their effects on guava
(Psidium guajava L.) fruits. ISHS Acta Horticulturae 292: Recent Advances in Horticultural
Science in the Tropics.
Page 165
ISBN 978-967-10840-4-5
Proc. Int. Conf. Plt. Phy. 2014
First Published, 2015
159
Sabah Castor (Ricinus communis Linn) Maturity Stages Based on Oil Content
and Fruit Development Changes
Hilarion, C.C.C.1,*
, Silip, J.J.1, Atong, M.
1, Jalloh, M.B.
1 and Gansau, J.A.
2
1Faculty of Sustainable Agriculture, Universiti Malaysia Sabah Sandakan Campus, Beg Berkunci No.3,
90509 Sandakan, Sabah, Malaysia. 2Faculty of Science and Natural Resources, Universiti Malaysia Sabah, Jalan UMS, 88400 Kota Kinabalu,
Sabah, Malaysia.
*E-mail: [email protected]
Introduction
Castor is an important oilseed crop with indeterminate maturity due to its indeterminate growth habit. The
flowering and fruiting of castor in the same raceme do not occurred at the same time (David et al., 2013).
In addition, successive generations of racemes continues to sprout before the primary raceme enter full
maturity stage resulting in the existence of mature racemes, immature racemes and flowering raceme
(Baldanzi et al., 2002; Vallejos et al., 2011; David et al., 2013). The indeterminate maturity of castor
causes difficulty in determining whole raceme maturity making it hard to decide the optimum harvest
time for castors.
Crop maturity determination is crucial as it affects quality perception and the rate of quality changes
during harvesting and postharvest handling (Shewfelt, 2014). The maturation process can be described by
crop maturity stages or index which serves as a guide in measuring crop maturity. There is still limited
information on castor maturity stages for harvesting and postharvest handling. This study aim to
characterize castor maturity stages based on the fruit development changes, rather than seed development
due to the fact that fruit changes can easily be observed without destructive sampling. Moreover, the
maturity stages also focus on extractable castor oil yield, rather than seed physiological quality, which
had been described in many previous study. Thus, the objective of this study is to determine Sabah castor
maturity stages based on oil content and fruit development changes.
Materials and Methods
Plant materials
Wild Sabah castor from Luanti accessions was grown in a plot at UMS Sandakan Campus. Castor seeds
were directly sowed at 0.06 m depth in the planting bed size 3.00 m x 1.00 m x 0.15 m. Basal treatments
of vermicompost 6 t/ha was applied and left for one week before the sowing process. Five castor plants
were planted in each planting bed with the spacing of 0.50 m within row and 1.30 m between rows.
Fertilizer, NPK Blue (12-12-17-2) was applied at the rate of 6.65 g at third week and sixth week after
planting. Chemical pesticide was used to control pest.
Sampling procedures
Castor tree was tagged after the first days of anthesis to determine sampling time. The sampling began at
21 days after anthesis with seven days intervals for the green stage and was continued until the fruit enter
ripe brown stage. Sampling was only conducted on fruits from the first raceme.
Page 166
ISBN 978-967-10840-4-5
Proc. Int. Conf. Plt. Phy. 2014
First Published, 2015
160
Determination of castor oil content
Soxhlet extraction was used for crude castor oil extraction with 95% ethanol as a solvent. The seeds were
first oven-dried at 60 oC for 7 h before it was crushed. Approximately 10 g of dry ground seeds with 300
mL ethanol were refluxed for 6 hours at 70 oC in a Soxhlet extractor. The extracted oil was obtained by
using rotary evaporator to filtrate the solvent at 70 oC. The extracted oil was heat in the oven at 70
oC for
30 min before being weighed. Extracted oil yield was measured by weight basis for oil content
determination.
Determination of castor fruit development changes
Hundred fruits were randomly selected from each sample for castor fruit colour, size and weight changes
determination. The fruit colour was measured by using colour meter, Konica Minolta Japan CR-10.
Castor fruit size was determined by measuring the fruit length and width using vernier calliper. Castor
fruit moisture content was determined using oven dried method by Zuchi et al. (2009). Fresh fruits were
weighed before and after drying at 105 oC for 24 h.
Experimental design and data analysis
Factorial completely randomized design with maturity stages as a factor was used in the study of fruit
development changes with a minimum of five replications. One-way ANOVA and Tukey test using SPSS
21.0 was used to determine if there is significant difference in the data.
Results and Discussion
Castor oil content at different maturity stages
Castor fruit oil content changes are presented in Table 1. The oil content significantly increased as castor
fruits reached the ripened stage. This finding corroborates previous study that reported oil content to
increase with fruit maturation (Janick and Paull, 2008; Pinto et al., 2012). There is no significant
difference between the oil content of fruits from 21 to 28 DAA green stages. This suggested that castor
fruits at 21 and 28 DAA belong in the same maturity stage which is young green stages and castor fruits
reached mature green stage at 35 DAA. The oil content is considered as the main indicator for castor
maturity stages since it is the main product of castor.
Table 1. Sabah castor oil content changes during castor fruit maturation (N=5).
Maturity stages Oil content (%)
21 DAA green 28.08d
28 DAA green 29.37d
35 DAA green 40.21c
Dried green 46.28b
Ripe brown 50.41a
Mean followed by the same letter within each column are not significantly different by Tukey test p<0.05
Castor colour at different maturity stages
Castor fruit colour changes is shown in Table 2. There is no significant difference in hue, light and
chroma between fruit green stages from 21 to 35 DAA. Based on the colour value in Table 2, colour is not
a good indicator for maturity determination of castor green stages. The hue value suggested that castor
fruits become greener at dried green stages. Castor fruit is a dry fruit with orthodox seeds, thus the fruits
Page 167
ISBN 978-967-10840-4-5
Proc. Int. Conf. Plt. Phy. 2014
First Published, 2015
161
undergo maturation drying to cracked open after ripened (Black et al., 2006; Schmidt, 2007). The fruits
lose its ability to photosynthesise at maturity causing the breakdown of chlorophyll (Rees and Hammond,
2002; Schmidt, 2007; Barry and Roux 2010; Shewfelt, 2014). Therefore, the fruits colour changed from
green to brown and the colour value reduced as the fruit colour turned darker as it gradually entered
ripening stage.
Table 2. Sabah castor fruit colour (ho, L
* and C
* value) changes during castor fruit maturation (N=100).
Maturity stages L*
ho
C*
21 DAA green 41.0a
22.7b
114.7a
28 DAA green 41.1a
23.6b
115.3ab
35 DAA green 40.6a
23.8b
128.9a
Dried green 37.8a
31.5a
93.1bc
Ripe brown 29.0b 14.4
c 79.1
c
Mean followed by the same letter within each column are not significantly different by Tukey test p<0.05
Castor size and weight at different maturity stages
Castor fruit size and weight changes are presented in Table 3. The fruit length and width significantly
increased from 21 to 28 DAA green stages before significantly decreased from 35 DAA green stages to
dried green and increased significantly at the ripe brown stage. The increase in fruit size at brown stage is
due to the changes of castor fruit morphology. Castor fruits at ripened stage will split open especially in
dehiscent fruit such as Sabah castor to release its seeds, thus it become longer and wider. (Hocking, 1982;
Vallejos et al., 2011; Anjani 2012). There are no significant differences between the fruit weight from 21
to 28 DAA green stages and this suggested that the fruits can be categorized in the same maturity stages
as young green fruit. The fruits weight starts to significantly decrease from 35 DAA which is similar to
the fruit size. Thus, fruit at 35 DAA can be categorized as mature green stage since castor fruits go
through drying process at maturity. Although, there is no significant difference in fruit weight between
dried green and brown stages, these maturity stages can be differentiated based on its colour changes.
Fruit size and weight can be used as a good indicator for castor maturity when combined with the fruit
colour. The green stages are hard to be identified only by colour since there is no significant difference
between the colour values. However, young green fruits can be differentiated from the mature green by
their size. Fruit with bigger size can be considered as mature green, while smaller fruits as young green.
Table 3. Sabah castor fruit size (i.e. length and width) and weight changes during castor fruit maturation
(N=100).
Maturity stages Length (cm) Width (cm) Weight (g)
21 DAA green 1.69b
1.63b
2.72a
28 DAA green 1.78a
1.71a
2.83a
35 DAA green 1.62c
1.60c
2.57b
Dried green 1.49e
1.51e
1.07c
Ripe brown 1.53d
1.55d 0.98
c
Mean followed by the same letter within each column are not significantly different by Tukey test p<0.05
Castor fruit moisture content at different maturity stages
Castor fruit moisture content changes are presented in Table 4. There is no significant difference between
fruits from 21 to 28 DAA and fruit from 28 to 35 DAA. The fruit moisture content starts to significantly
decrease from 35 DAA as fruit undergoes maturation drying at physiological maturity. Fruit moisture
content is not a good indicator for castor young and mature green stages since there is no significant
difference. Moreover, fruit moisture content is affected by weather conditions during fruit development
and maturation.
Page 168
ISBN 978-967-10840-4-5
Proc. Int. Conf. Plt. Phy. 2014
First Published, 2015
162
Table 4. Sabah castor fruit moisture content changes during castor fruit maturation (N=5).
Maturity stages Fruit moisture content (%)
21 DAA green 79.30a
28 DAA green 71.78ab
35 DAA green 68.19b
Dried green 28.77c
Ripe brown 8.62d
Mean followed by the same letter within each column are not significantly different by Tukey test p<0.05
Conclusions
The changes in extractable oil content and its fruit physical characters during fruit development and
maturation had been observed to produce castor maturity stages. Castor maturity stages can be divided
into four indices stages; young green, mature green, dried green and ripe brown. Sabah castor fruits
reached its physiological maturity or mature green stage at 35 DAA when the fruit turns to darker green
(i.e. 23.8 ho, 40.6 L
*, 128.9 C
*), measured 1.62 cm in length and 1.60 cm in width, weighed 2.57 g,
moisture content reaching 68.19% and produce 40.21% extractable oil yield.
References
Anjani, K. 2012. Castor genetic resources: A primary gene pool for exploitation. Industrial Crops and
Products 35(1): 1-14.
Baldanzi, M., Fambrini, M. and Pugliesi, C. 2002. Redesign of castor bean plant body plan for optimal
combine harvesting. Annals of Applied Biology 142: 299-306.
Barry. G.H. and Roux, L.S. 2010. Preharvest foliar sprays of prohexadione-calcium, a gibberellin
biosynthesis inhibitor, induce chlorophyll degradation and carotenoid synthesis in citrus rinds.
HortScience 45: 242-247.
Black, M., Bewley, J.D. and Halmer, P. (eds.). 2006. The Encyclopedia of Seeds: Science, Technology
and Uses. United Kingdom: Cromwell Press.
David, A.M.S.S., Araujo, E.F., Araujo, R.F., de Resende, M.A.V., Dias, D.C.F.S. and Nobre, D.A.C.
2013. Physiological quality of castor bean seeds originating from different racemes in the plant.
Journal of Seed Science 35(2): 45-51.
Hocking, P.J. 1982. Accumulation and distribution of nutrients in fruits of castor bean (Ricinus
communis L.). Annals of Botany 49: 51-62.
Janick, J. and Paull, R.E. (eds.). 2008. The Encyclopedia of Fruits and Nuts. United Kingdom:
Cambridge University Press.
Pinto, L.F., da Silva, D.I.S., da Silva, F.R., dos Santos, V.B., Soletti, J.I. and de Carvalho, S.H.V. 2012.
Assessment of the feasilibility of different oil sources to biodiesel production.Acta Scientiarum.
Technology 34(2): 227- 231
Rees, D. and Hammond, L. 2002. Biology of Plant Commodities. In Golob, P., Farrell, G. and Orchard,
J.E. (eds.). Crop Post Harvest: Science and Technology. Vol 1 Principles and Practice. Oxford,
United Kingdom: Blackwell Science Ltd.
Schmidt, L.H. 2007. Tropical Forest Seed. United States: Springer-Verlag Berlin Heidelberg.
Shewfelt, R.L. 2014. Measuring Quality and Maturity. In Florkowski, W.J., Shewfelt, R.L., Brueckner,
B., and Prussia, S.E. (eds). Postharvest Handling: A System Approach. 3rd
ed. United States:
Elsevier Inc.
Vallejos, M., Rondanini, D. and Wassner, D.F. 2011. Water relationships of castor bean (Ricinus
communis L.) seeds related to final seed dry weight and physiological maturity. European Journal
of Agronomy 35: 93-101.
Page 169
ISBN 978-967-10840-4-5
Proc. Int. Conf. Plt. Phy. 2014
First Published, 2015
163
Zuchi, J.I, Peske, S.T., Bevilaqua, G.A.P. and Silva, S.D.D.A. 2009. Harvest delaying, drying temperature
and castor seed quality. Revista Brasileira de Semente 31(3): 9-15.
Page 170
ISBN 978-967-10840-4-5
Proc. Int. Conf. Plt. Phy. 2014
First Published, 2015
164
CHAPTER 4
BIOTECHNOLOGY
Page 171
ISBN 978-967-10840-4-5
Proc. Int. Conf. Plt. Phy. 2014
First Published, 2015
165
Functional Analysis of Eucheuma denticulatum Gene Involved in
Phytoremediation
Othman, R.1,2,*
and Murthy, S.1
1Institute of Systems Biology (INBIOSIS),
2School of Biosciences and Biotechnology, Faculty of Science and Technology, Universiti Kebangsaan
Malaysia, 43600 UKM Bangi, Selangor, Malaysia.
*E-mail: [email protected]
Introduction
Phytochelatins (PCs) are short polypeptides which are rich in cysteine residues with the size of 1.5 to 4
kDa (Vestergaard et al., 2008). It acts as thiol-reactive peptides which can chelate heavy metals like
cadmium (Cd) (Li et al., 2004). Phytochelatin synthase (PCS; EC 2.3.2.15) is responsible for the synthesis
of PCs from glutathione under transpeptidase reaction (Clemens, 2006). The presence of activators like
Cd is essential for the synthesis to proceed (Osaki et al., 2008). The PCS gene has been identified in plant,
fungi, algae and recently in nematode, Caenorhabditis elegans (Vatamaniuk et al., 2002). In this study,
the PCS cDNA clone has been isolated from the marine red algae, Eucheuma denticulatum and was
further used for the expression of recombinant PCS protein in various Cd2+
concentrations.
Materials and Methods
Isolation and cloning of EdPCS1
The full-length clone for E. denticulatum PCS (EdPCS1) has been isolated using PCR and rapid
amplification of cDNA ends (5’ RACE-PCR) techniques. Total RNA was extracted from seaweed using
the modified method described by Lopez-Gomez and Gomez-Lim (1992). A pair of primers was designed
based on the partial sequence of Expressed Sequence Tag (EST) for 5’ RACE-PCR, pPCS1 (5’-TTC CTT
CGA GTT CAT TGT CGC TGC CT-3’) and nPCS1 (5’-CGT TGG TTT GCC GAA TCG CTT CTC G-
3’). PCR amplification was performed with the following conditions: 94 °C for 30 s, 68 °C for 30 s, and
72 °C for 3 min (25 cycles). The resulting 1.6kb product was cloned in pTZR/T (Fermentas) and the open
reading frame was cloned into pET-32b(+) expression vector (Novagen). The isolated recombinant
vector, pET-PCS1 was analysed by PCR, digestion by restriction enzymes and sequencing.
Expression and purification of recombinant PCS1 in Escherichia coli
The expression of recombinant PCS1 protein using pET32b(+) was carried out in E. coli strain Origami
(DE3). The E. coli cells transformed with recombinant PCS1 vector were grown in Luria Bertani (LB)
medium supplemented with kanamycin (15 µg/ml), tetracycline (12.5 µg/ml) and ampicillin (50 µg/ml).
After the cells growth reached about 0.6 at OD600nm, the cultures were induced with final concentration of
0.6 mM of isopropyl-ß-D-1-thiogalactopyranoside (IPTG), followed by a further incubation at 16 °C and
150 rpm for 18 h. Cells were harvested and resuspended with lysis buffer, 20 mM Tris-HCl (pH 8). The
cells were also treated with lysozyme (1 mg/ml) and β-mercaptoethanol (1 mM). The total protein
fractions were collected after sonification and centrifugation. The total protein fractions were analysed by
SDS-PAGE and western blot using monoclonal anti-polyhistidine clone His-1. Then, the total soluble
protein fractions were purified using HisTrapTM
HP column by AKTA-Purifier system. The purified
protein fractions dialysed and concentrated using Milipore Vivaspin (10 k MVCO).
Page 172
ISBN 978-967-10840-4-5
Proc. Int. Conf. Plt. Phy. 2014
First Published, 2015
166
Growth assay under various concentrations of metals
Recombinant E. coli cells to be used in metal treatment were grown at 37 °C with shaking 250 rpm for
overnight. These recombinant cells were spread on the LB agar plates contained 0.6 mM IPTG and
various concentrations (0-1000 µM) of different metals (Cd2+
, Pb2+
, Cr3+
, Cu2+
and Mn2+
). The next day,
the colony forming unit (CFU) for each plate was collected.
Phytochelatin synthase enzyme assay
The PCS activity was measured using the procedure described by Grill et al. (1989) with some
modifications. The reaction mixture containing 200 mM TRIS-HCl pH 8, 2 mM 2-mercaptoethanol, 1
mM GSH, and 200 mM CdCl2, respectively, in a total volume of 1 ml. After 5 min preincubation at 35
°C, the reaction was started by adding the 20 μg of enzyme extract. After 30 min incubation, the reaction
was terminated by adding 100 μl 10% trifluoroacetic acid and centrifuged at 10,000×g for 10 min. The
supernatant was saved and quantitated using a Cl8 RP-HPLC eluted with a 60% acetonitrile and the active
fractions were measured at 214 nm. GSH was used as HPLC standards.
PCS cDNA transformation into Arabidopsis thaliana via Agrobacterium culture
Primary cloning of full-length PCS1 cDNA clone fused with hexahistidine tag (PCS1h) was carried using
pCAMBIA1301 binary vector. PCS1h insert replaced the GUS sequence in pCAMBIA1301. The isolated
recombinant vector, pCAM-PCS1h were used as template for secondary cloning of expression cassette
consisting of CaMV 35S promoter, PC1S cDNA, hexahistidine tag and NOS poly-A terminator and was
cloned into pCAMBIA1301 to form pCAM-gPCS1h. Plant expression vector, pCAM-gPCS1h was
transformed into Agrobacterium tumefaciens strain GV3101 and verification analyses were performed on
pCAM-gPCS1h. Arabidopsis thaliana plants were inverted and the inflorescences (flowers) were dipped
into the Agrobacterium suspension and swirled for about 5 sec. Bacterial suspension were drained from
the plants and the plants were laid on their side and covered with plastic wraps to maintain high humidity
at low light for overnight. The next day, the plastic wraps were removed and plants were set upright to
normal growth. Plants were grown until maturation and seeds were harvested for analysis.
Transformation of PCS promoter into Arabidopsis thaliana via Agrobacterium culture
A total of 15 µg of genomic DNA was extracted from 30 g E. denticulatum using the method of Kaufman
et al. (1995) with modification. The genomic DNA was digested with two restriction enzymes (Dra1 and
EcoRV). The amplification the PCS promoter sequence was carried out using Clontech GenomeWalkerTM
Kit (TaKaRa, USA) according to the manufacturer’s recommendations. The primary PCR product with
the size of ~1200bp was used for nested PCR. The PCR product of promoter was cloned into pBI121
binary vector producing pB-pPCS construct. Recombinant binary vector, pB-pPCS was transformed into
Agrobacterium strain GV3101. A. thaliana was transformed by floral dip method using Agrobacterium
tumefaciens strain GV 3101 harbouring PCS promoter construct.
Results and Discussion
Full-length cDNA of E. denticulatum PCS1
The full-length clone for E. denticulatum PCS1 (EdPCS1) has been isolated using PCR and rapid
amplification of cDNA ends (RACE) techniques with the size of 1.6kb which contains a single open
reading frame encoding a protein containing 218 amino acids. From the BLASTp analysis, the expected
Page 173
ISBN 978-967-10840-4-5
Proc. Int. Conf. Plt. Phy. 2014
First Published, 2015
167
amino acid sequence of EdPCS1 shared high similarity with PCS1 from Cyanidioschyzon merolae (44%)
and Arabidopsis thaliana (42%). Multiple sequence alignment of EdPCS1 with other PCS sequences
showed conserved region at C-terminal (Figure 1).
Figure 1. Multiple sequence alignment between Eucheuma denticulatum PCS1 (Eucheuma) and amino
acid sequences from Arabidopsis thaliana (AtPCS1 & AtPCS2), Oryza sativa (Oryza) and
Cyanidioschyzon merolae (Cyanidioschyzon). The conserved region was highlighted in yellow
(_).
Growth assay under various concentrations of metals
In the presence of metal, recombinant E. coli cells were more tolerant compared to control E. coli cells
(Figure 2). This shows that recombinant PCS protein was properly expressed and functioned well in E.
coli cell. The difference in tolerance level of recombinant E. Coli and control cell was higher in the metals
like Cd2+
, Cr3+
and Pb2+
compared to metals like Cu2+
and Mn2+
. This could be because Cu2+
and Mn2+
are
micronutrients that are needed for the growth of organisms (Tangahu et al., 2011). Recombinant E. coli
cells were tolerant to the concentration of Cd2+
up to 600 µM, Cr3+
and Pb2+
up to 800 µM.
Page 174
ISBN 978-967-10840-4-5
Proc. Int. Conf. Plt. Phy. 2014
First Published, 2015
168
Cd (uM) 10008006004002000
1600
1400
1200
1000
800
600
400
200
0
Bil
anga
n k
olo
ni/
pir
ing
(x10
00)
pET
pET-PCS
Plasmid
Cu (uM) 10008006004002000
1600
1400
1200
1000
800
600
400
200
0
Bil
anga
n k
olo
ni/
pir
ing
(x10
00)
pET
pET-PCS
Plasmid
Mn (uM) 10008006004002000
1600
1400
1200
1000
800
600
400
200
0
Bil
anga
n k
olo
ni/
pir
ing
(x10
00)
pET
pET-PCS
Plasmid
Cr (uM) 10008006004002000
1600
1400
1200
1000
800
600
400
200
0
Bil
anga
n k
olo
ni/
pir
ing
(x10
00)
pET
pET-PCS
Plasmid
Pb (uM) 10008006004002000
1600
1400
1200
1000
800
600
400
200
0
Bil
anga
n k
olo
ni/
pir
ing
(x10
00)
pET
pET-PCS
Plasmid
Figure 2. Growth assays of recombinant protein E. coli and control cells expressing cells at different
metals and at various concentrations (0 - 1000 µM). (a) Growth bar for Cd2+
. (b) Growth bar for
Cu2+
. (c) Growth bar for Mn2+
. (d) Growth bar for Cr3+
. (e) Growth bar for Pb2+
. Data obtained
mean ± standard deviation with p<0.05 (n=3).
(a) (b)
(c) (d)
(e)
Page 175
ISBN 978-967-10840-4-5
Proc. Int. Conf. Plt. Phy. 2014
First Published, 2015
169
Phytochelatin synthase enzyme assay
The PCS activity was measured using HPLC method. Enzyme assay mixture was quantitated using a Cl8
RP-HPLC eluted with a 60% acetonitrile as mobile phase and the active fractions were measured at 214
nm. Based on the chromatograms obtained, the reduction of GSH was deduced using the standard curve.
The retention time for GSH is about 2 min. The specific activity 2661.3 pmol substrate converted/s/mg
(pkat/mg) compared to crude protein at 256.4 3 pkat/mg. The enzyme activity assay showed the Km value
for purified recombinant protein was 3.38 mM and Vmax value of 1610.3 nmol min-1
mg-1
.
Plant expression vector
The full-length PCS1 cDNA clone fused with hexahistidine tag (PCS1h) was clone into pCAMBIA1301
binary vector. The isolated recombinant vector, pCAM-PCS1h was analysed by PCR, digestion by
restriction enzymes and sequencing. Then, the expression cassette consisting of CaMV 35S promoter,
PCS1 cDNA, hexahistidine tag and NOS poly-A terminator (Figure 3) was cloned into pCAMBIA1301’s
MCS for secondary cloning to form pCAM-gPCS1h.
Figure 3. Expression cassette (gPCS1h) consisting of CaMV 35S promoter, PCS1 cDNA, hexahistidine
tag and NOS poly-A terminator.
Conclusions
Recombinant PCS1 protein was successfully expressed and purified in E. coli. PCS1 protein expressing
E. coli cells were more tolerant to metals like Cd2+
, Cr3+
and Pb2+
compared to control cells. The enzyme
activity assay of the purified recombinant protein gave Km value of 3.38 mM. Functional analysis of
PCS1 in transgenic A. thaliana may contribute towards further application of this recombinant enzyme in
heavy metal remediation.
Acknowledgements
This work was supported under the 02-01-02-SF0586 and 02-01-02-SF0835 Science Fund grant.
References
Clemens, S. 2006. Evolution and function of phytochelatin synthases. Journal of Plant Physiology 163:
319-332.
Grill, E., Löffler, S., Winnacker, E.L. and Zenk, M.H. 1989. Phytochelatins, the heavy-metal-binding
peptides of plants, are synthesized from glutathione by a specific -glutamylcysteine dipeptidyl
transpeptidase (phytochelatin synthase). Proceedings of the National Academy of Sciences,
86(18): 6838.
Kaufman, P.B., Wu, W., Kim, D. and Cseke, L.J. 1995. Handbook of molecular and cellular methods in
biology and medicine. Boca Raton: CRC Press.
Page 176
ISBN 978-967-10840-4-5
Proc. Int. Conf. Plt. Phy. 2014
First Published, 2015
170
Li, Y., Dhankher, O.P., Carreira, L., Lee, D., Chen, A., Schroeder, J.I., Balish, R.S. and Meaghe, R.B.
2004 Overexpression of phytochelatin synthase in Arabidopsis leads to enhanced arsenic
tolerance and cadmium hypersensitivity. Plant Cell Physiology 45(12): 1787-1797.
Osaki, Y., Shirabe, T., Tamura, S. and Yoshimura, E. 2008. A functional putative phytochelatin synthase
from the primitive red algae Cyanidioschyzon merolae. Bioscience, Biotechnolgy and
Biochemistry 72(12): 3306-3309.
Tangahu, B.V., Abdullah, S., Rozaimah, S., Basri, H., Idris, M. and Anuar, N. 2011. A review on heavy
metals (As, Pb, and Hg) uptake by plants through phytoremediation. International Journal of
Chemical Engineering 2011: 1- 31.
Vatamaniuk, O.K., Bucher, E.A., Ward, J.T. and Rea, P.T. 2002. Worms take the ‘phyto’ out of
‘phytochelatins’. Trends in Biotechnology 20(2): 61-64.
Vestergaard, M., Matsumoto, S., Nishikori, S., Shikari, K., Hirata, K. and Takagi, M. 2008. Chelation of
cadmium ions by phytochelatin synthase: Role of the cystein-rich C-terminal. Analytical Sciences
24: 277-281.
Page 177
ISBN 978-967-10840-4-5
Proc. Int. Conf. Plt. Phy. 2014
First Published, 2015
171
In vitro Regeneration of Jatropha curcas: Cotyledonary Leaf Induced More
Shoots than Other Explants
Azmi, A.R.1, Maheran, A.A.
1,*, Mariah, A.H.
2 and Halimi, M.S.
1
1Department of Agriculture Technology, Faculty of Agriculture, Universiti Putra Malaysia, 43400
Serdang, Selangor, Malaysia. 2Sekolah Menengah Kebangsaan Taman Desaminium, 43300 Seri Kembangan, Selangor, Malaysia.
*E-mail: [email protected]
Introduction
Jatropha (Jatropha curcas L.) which belongs to the Euphorbiaceae family is a plant that can grow on
marginal land. This plant is important for biodiesel production. Besides, the leaves have medicinal
properties and the oil seed cakes can be used as fertilisers (Becker and Francis, 2005; Mkoka and
Shanahan, 2005). For large scale planting, in vitro approaches via multiple shoot induction is needed to
mass produce planting materials. Also being a perennial plant, conventional breeding via crossing can be
a bottle neck due to its long vegetative growth phase. Thus in vitro approaches through adventitious shoot
induction coupled with Agrobacterium-mediated transformation can be a very powerful tool in improving
the crop and solving the above mentioned problems. In the development of an in vitro regeneration
protocol it is important to maximise shoot formation in order to reduce the production cost. Also, the
ease in maximizing shoot formation will determine the success of transgenic plant production via
Agrobacterium-mediated transformation. Under in vitro condition, multiple shoots can be induced either
adventitiously or through axillary proliferation depending on the type of explants used. Adventitious
shoot can be induced on leaf, root, petiole or hypocotyl explants (Hartmann et al., 2007; He et al, 2007;
Wang and Bao, 2007; Tian et al., 2007; Selvaraj et al., 2007; Shang et al., 2006) while axillary budding
can be induced from shoot tip and node explants (Rajore and Batra, 2005). There are several factors
enhancing multiple shoot induction on an explant. Among them include plant growth regulators, explant
type and age, plant genotype and pre-treatment of the mother plant prior to the excision of explant
(George et al., 2008). This paper compares the production of adventitious shoots from various explants of
J. curcas using 6-benzyl amino purine (BAP) at different concentrations.
Materials and Methods
Fruits of J. curcas were collected from mature trees grown in Field 2, Faculty of Agriculture, Universiti
Putra Malaysia, Serdang, Selangor. The fruits were placed in a 1 L beaker and a few drop of Tween 20
were pipetted on to them followed by washing under running tap water. Then the fruits were brought to
the laminar airflow cabinet, the pericarp was peeled off using a sharp sterile blade and the seeds were
isolated. The seeds were put in a 1 L beaker, rinsed with 70% ethanol for 20 seconds followed by washing
in sterile distilled water. The seeds were then sterilized with 20% Clorox added with a few drops of
Tween 20 for 15 min. The seeds were rinsed with sterile distilled water thrice, then transferred into sterile
petri dishes containing sterilized dry Whatman filter paper and blotted dry. Using a sharp sterile blade, the
seeds were cut into halves, their testa and endosperm removed and the embryos isolated and cultured
vertically in vials containing modified MS (Murashige and Skoog, 1962) medium supplemented with 3%
(w/v) sucrose, 0.1 gL-1
myo-inositol and 4.2 gL-1
gelrite. After eight days, cotyledonary leaf, hypocotyl
and root explants were excised from the germinated seedling. Hypocotyl and root explants were cultured
in vials containing modified Murashige and Skoog (1962) medium supplemented with 3% (w/v) sucrose,
0.1 gL-1
myo-inositol, 4.2 gL-1
gelrite and BAP at 0, 1.0, 2.5, 5.0, 10.0 mgL-1
. Cotyledonary leaf explants
were cultured on medium containing 10.0 mgL-1
of BAP (the best treatment determined from previous
experiment). All media were prepared by adjusting the pH at 5.8 and 10ml of medium was poured into
Page 178
ISBN 978-967-10840-4-5
Proc. Int. Conf. Plt. Phy. 2014
First Published, 2015
172
each vial before autoclaving at 15 psi and 121 OC for 20 min. The cotyledonary leaf explants were
cultured with the abaxial surface touching the medium while the hypocotyl and root explants were
cultured horizontally with part of the explant submerged in the medium. Ten explants were cultured per
treatment per replication. Each treatment was replicated thrice. The experiment was conducted using
Completely Randomized Design (CRD). All data were analysed statistically using the analysis of variance
(ANOVA) and treatment means were compared using Duncan New Multiple Range Test. Cultures were
maintained at 270C for a 12 hour photoperiod in the growth room with a daily lighting of 30 µmol m
-2 s
-1
intensity using cool white Philips fluorescent tubes.
Results and Discussion
Cotyledonary leaf explant cultured on modified MS medium supplemented with 10.0 mgL-1
of BAP
started to curl at its outer end after a week of culture. At the same time, the injured portion of the veins on
the adaxial region of the cotyledonary leaf swelled followed by callus initiation. Adventitious shoots
were regenerated from the callus but some were regenerated directly from the explant. Adventitious shoot
regeneration from the explant started with the formation of shoot initials, followed by the development of
meristem and leaf primordia and then the elongation of shoots, similar to the findings of Cheah and
Cheng (1978) on cotyledon explant of Douglas fir. The formation of adventitious shoots on the
cotyledonary leaf explant can be seen clearly by the fifth week of culture. By the eighth week, many
adventitious shoots were already formed on the cotyledonary leaf explant. Adventitious shoots were
initiated from different parts of the cotyledonary leaf explant. Some of the shoots were initiated either
directly at the abaxial region or adaxial part of the cotyledonary leaf segment or from callus initiated on
that region.
Root explants cultured horizontally on modified MS medium supplemented with BAP started to swell at
its proximal end after three days of culture. By the second week, calli were initiated on the wounded end
of the root explant. By the fifth week, adventitious shoots were induced from the callus. In the case of
hypocotyl, the cut end of the explant began to swell after a few days of culture. By the second week, calli
were initiated on the wounded end of the hypocotyl explant. By the third week, greenish spots were
observed on the callus. By the fourth week, adventitious shoots could be seen visibly on the callus in the
culture vessels.
Table 1 shows the response of cotyledonary leaf, hypocotyl and root explants at different BAP
concentrations on percentage and mean number of adventitious shoot formation. Data were taken eight
weeks after culturing. It was observed that the cotyledonary leaf explant showed significant difference on
percentage of explant regenerating adventitious shoots and mean number of shoots regenerated per
explant compared with the hypocotyl explant cultured on most BAP treatments and the root explant in all
the BAP treatments. The hypocotyl explant cultured on medium with 1.0 mgL-1
BAP did not differ
significantly in terms of percentage of explant regenerating shoots compared with the cotyledonary leaf
explant. Eighty percent of the cotyledonary leaf explants induced adventitious shoots in the medium
supplemented with 10.0 mgL-1
BAP with a mean of five shoots per explant. The percentage of hypocotyl
explants regenerating shoots ranged from 6.7 to 76.7%, while the root explants exhibited a range of 6.7 to
60.0% in the respective concentrations of BAP tested. The mean number of adventitious shoots
regenerated from both the hypocotyl and root explants was very low, within the range of 0.1 to 2.2 shoots
only. The success of using cotyledonary leaf explant for in vitro adventitious shoot regeneration has been
reported by many researchers (Hartmann et al., 2007; Selvaraj et al., 2007; Lee et al., 2003). Tian et al.
(2007) reported high frequency of shoot regeneration from hypocotyl explants of Prunus, while Lee et al.
(2003) observed no shoot formation from hypocotyl and root explants of winter squash. In this
experiment, cotyledonary leaf explant of J. Curcas exhibited prolific shoot regeneration ability compared
with the hypocotyl and root explants.
Page 179
ISBN 978-967-10840-4-5
Proc. Int. Conf. Plt. Phy. 2014
First Published, 2015
173
Table1: Adventitious shoot formation from cotyledonary leaf, hypocotyl and root explants of Jatropha
curcas cultured on medium supplemented with different concentrations of BAP. Data were taken
eight weeks after culturing.
Mean followed by the same letter(s) in the same column are not significantly different based on DNMRT at p= 0.05
Conclusion
The results revealed that cotyledonary leaf explant regenerated adventitious shoots better than hypocotyl
and root explants within the BAP range tested.
Acknowledgements
The authors wish to thank the Ministry of Higher Education Malaysia for providing the fund under the
Research University Grant Scheme to carry out this research.
References
Becker, K. and Francis, G. 2005. Biodiesel from Jatropha plantations on degraded land. University of
Hohenheim, Stuggart, Germany.
Cheah, K.T. and Cheng, T.Y. 1978. Histological analysis of adventitious bud formation in cultured
Douglas fir cotyledon. American Journal of Botany 65: 845-849
George, E.F., Hall. M.A. and Klerk, G.J.D. 2008. Plant propagation by tissue culture: Vol.1, Third
Edition, Springer Publisher, Dordrecht.
Hartmann, H. T., Kester, D. E., Davies Jr., F.T. and Geneve, R. L. 2000. Plant propagation, Principles
and Practices. Prentice-Hall of India, New Delhi, India. pp. 637-689
He, S.S., Liu, C.Z. and Saxena, P.K. 2007. Plant regeneration of an endangered medicinal plant Hydrastis
canadensis L. Scientia Horticulturae 113: 82-86
Mkoka, C. and Shanahan, M. 2005. The bumpy road to clean, green fuel. Science and Development
Network.
Murashige, T. and Skoog, F. 1962. A revised medium for rapid growth and bioassays with tobacco tissue
culture. Plant Physiology 15: 473-497
Rajore, S. and Batra, A. 2005. Plant regeneration via shoot tip explant in Jatropha curcas L. Journal of
Plant Biochemistry and Biotechnology 14: 73-75.
Shang, A.Q., Cai, H., Yan, X.J., Hu, H.Z. and Zhao, L.J. 2006. Plant regeneration from in vitro cultured
hypocotyl explants of Euonymus japonicus. Agricultural Sciences in China 5(3): 196-201.
Selvaraj, N., Vasudevan, A., Manickavasagam, M., Kasthurirengan, S. and Ganapathi, A. 2007. High
frequency shoot regeneration from cotyledon explants of cucumber via organogenesis. Scientia
Horticulturae 112(1): 2-8
Explant type BAP (mgL-1
) Percentage of explant
regenerating shoots
Mean number of shoots
per explant
Cotyledonaryleaf 10.0 80.0 a 5.0 a
Hypocotyl 1.0 76.7a 2.2 b
Hypocotyl 2.5 6.7 c 0.1 c
Hypocotyl 5.0 6.7c 0.1 c
Hypocotyl 10.0 0 c 0 c
Root 1.0 50.0 b 1.7 b
Root 2.5 60.0 b 2.1 b
Root 5.0 6.7 c 0.2 c
Root 10.0 6.7 c 0.1 c
Page 180
ISBN 978-967-10840-4-5
Proc. Int. Conf. Plt. Phy. 2014
First Published, 2015
174
Tian, L., Sibbald, S., Subramaniam, J. and Svircev, A. 2007. Characterisation of Prunus domestica L. in
vitro regeneration via hypocotyls. Scientia Horticulturae 112(1): 462-466
Wang, J. and Bao, M.Z. 2007. Plant regeneration of pansy (Viola wittrockiana) via petiole derived callus.
Scientia Horticulturae 111: 266-270
Page 181
ISBN 978-967-10840-4-5
Proc. Int. Conf. Plt. Phy. 2014
First Published, 2015
175
The Effects of Carbon Dioxide in the ex vitro Germination on Coffee Somatic
Embryogenesis
Rina, A.
Indonesian Coffee and Cocoa Research Institute, Jl. P. B. Sudirman No.90, Jember 68118, East Java,
Indonesia.
E-mail: [email protected]
Introduction
Commercial use of micropropagation by somatic embryogenesis technology is still limited because of its
relatively high production cost resulting mainly from high labor costs, low growth rate in vitro and poor
survival rate of the planlet during acclimatization. The goal of somatic embriogenesis technology is to
mass-produce genetically identical, physiologically uniform, developmentally normal, and pathogen-free
planlets which can be acclimatized in a reduced time period and at a lower cost. Development of both
automated environmental control system and improved in vitro culture systems are essential for a
significant reduction in production cost (Aitken-Christie et al., 1995).
Cultured plant cells require carbohydrate as a source of carbon and energy. Sucrose is the main
carbohydrate which supports growth in vitro (Thompson and Thorpe, 1987). Presence of sucrose in the
medium induces heterotrophy or mixoheterotrophy in the cultures (Kozai et al., 1992). This and other in
vitro condition contribute a culture induce phenotype in planlets (Kozai et. al., 1992), which impedes their
normal growth when transferred directly from culture to ambient greenhouse or field conditions and
necessitates a period of acclimatization (Deng and Donnelly, 1993). Recent studies have shown that the
culture-induced phenotype can be modified towards autotrophy by reducing or completely eliminating
sucrose in the medium (Kozai and Iwanami,1988; Nguyen and Kozai, 2001) and increasing CO2
concentration (Desjardins et al., 1988). This concept of photoautotrophic micropropagation has recently
been proposed as a mean of reducing production cost, improving planlet growth and survival (Langford
and Wainwright, 1987) and reducing the hazards of biological contamination (Hazarika, 2003).
The induction of somatic embryogenesis has been recognized as a technique for producing large numbers
of individuals and consequently, there is a great interest in its use for mass propagation (von Arnold et al.
2005; Preil 2005; Takayama and Akita 2005). The application of propagation by somatic embryogenesis
required the optimization and control the environment. The influence of environment especially of the
concentration of carbon dioxide is a factor that has very little study in the process of somatic
embryogenesis from cotyledonary embryo to become planlet. The present research was carried out with
the objective to determine the effects of carbon dioxide on cotyledonary embryo in the ex vitro
germination.
Materials and Methods
This research was conducted at Nestle Research and Development Centre, Tours (NR&DC-T), France.
This experiment used cotyledonary embryos of the FRT 04 and FRT 65 Robusta genotype. Three systems
were tested in germination medium such as rockwoll plugs, Jiffy plugs and paper. Each medium soaked
with 50% MS liquid medium and each system were compared with and without a concentration of 3%
CO2. Each treatment was replicated three times and observed for four weeks by measuring the percentage
of the number of leaves.
Page 182
ISBN 978-967-10840-4-5
Proc. Int. Conf. Plt. Phy. 2014
First Published, 2015
176
Results and Discussion
Micropropagation is being widely used for the clonal propagation of selected horticultural plants, estate
crops, and forest trees. In commercial tissue culture labortaories, much concern has been placed on the
culture media, optimal culture conditions, and culture techniques for such elite plants. The culture vessels
usually used for the shoot development and rooting stages in the micropropagation are still the
conventional glass or plasticwares. These vessels, however, may have some disadvantages: they are
relatively expensive, less transportable, inflexible in shape and size, and the chance of contamination with
microorganisms through their opening is relatively high when using aluminium foil covers or loosely-
closed caps. Furthermore, the accumulation of ethylene (Mele et al., 1982) or the decrease in CO2
concentration during light period (Fujiwara et al., 1987) in conventional closed (air tight) culture vessels
may have an adverse effect on planlet development.
Plants remove carbon dioxyde from the atmosphere by photosynthesis, also called carbon assimilation,
which uses light energy to produce organic compounds (cellulose, lipids, and various proteins) by
combining carbon dioxyde and water. Plants can grow up to 50 percent faster in concentrations of 1,000
ppm CO2 when compared with ambient conditions.
The results demonstrate that concentration of 3% CO2 can promote and stimulate the shoot by using plugs
of rockwooll plugs, Jiffy plugs and paper. The shoot percentage by using CO2 is higher than that of
without CO2 (Figure 1). In FRT 04, the highest percentage was reached by using rockwooll plugs with a
concentration of 3% CO2 (Figure 2). Whilst in FRT 65, the highest percentage was reached by using Jiffy
plugs with a concentration of 3% CO2 (Figure 3). We conclude that an enrichment CO2 at 3% has strongly
improved the percentage of shoot in germination stage of coffee. Whereas, to our understanding, the high
CO2 concentrations has never been related to the positive effect on germination. We usually connect with
humidity or temperature only. An enrichment of the headspace with exogenous CO2 at 2% strongly
promotes the germination when the coffee embryos are grown in a no-emitting media as plugs of
rockwool (Ducos et. al., 2009).
Page 183
ISBN 978-967-10840-4-5
Proc. Int. Conf. Plt. Phy. 2014
First Published, 2015
177
Treatment Rockwooll Plugs Jiffy Plugs Paper
FRT 04
With CO2
FRT 04
Without C02
FRT 65
With CO2
FRT 65
Without CO2
Figure 1. The performance of leaves after the effect of CO2 released by the media on cotyledonary
embryos in FRT 04 and FRT 65.
Figure 2. The percentage of leaves in different material on the effect of exogenous CO2 on FRT 04
cotyledonary embryos.
Page 184
ISBN 978-967-10840-4-5
Proc. Int. Conf. Plt. Phy. 2014
First Published, 2015
178
Figure 3. The percentage of leaves in different material on the effect of exogenous CO2 on FRT 65
cotyledonary embryos.
Conclusions
The concentration of 3% CO2 could directly promote and stimulate the shoot by using plugs of rockwooll
plugs, Jiffy plugs and paper in germination stage of coffee. Whereas, to our understanding, the high CO2
concentrations has never been related to the positive effect on germination. We usually connect
germination with humidity or temperature only. These results showed the necessity to carry out other
studies that allow elucidating the influence of CO2 on cells and tissues cultured in vitro under conditions
of non phototrophic.
Acknowledgements
The authors acknowledge the Nestle Research and Development Centre, Tours (NR&DCT), France for
the financial support. Thanks to Jean Paul Ducos for helpful suggestions.
References
Aitken-Christie, J., Kozai, T. and Smith, M.A.L. 1995. Automation and environmental control in plant
tissue culture. Kluwer Academic Publisher, Dordrecht. P. 500.
Deng, R. and Donnelly, D.J. 1993. In vitro hardening of red raspberry through CO2 enrichment and
relative humidity reduction on sugar free medium. Canadian Journal of Plant Science 73: 1105-
1113.
Desjardins, Y., Laforge, F., Lussier, C. and Gosselin, A. 1988. Effects of enrichment and high
photosynthetic photon flux on the development of autotrophy and growth of tissue cultured
strawberry raspberry and asparagus plants. Acta Horticulturae 230: 47-57.
Ducos, J.P., Prévot, A., Lambot, C. and Pétiard, V. 2009. Positive effect of the CO2 released by
commercial substrates on the ex vitro germination of coffee somatic embryos. Acta Horticulturae
812:329-336.
Fujiwara, K., Kozai, T. and Watanabe, I. 1987. Fundamental studies on environments in plant tissue
culture vessels. (3) Measurements of carbon dioxide gas concentration in stoppered vessels
containing tissue-cultured planlets and estimates of net photosynthetic rates of the planlets.
Journal of Agricultural Meteorology 43: 21-30.
Hazarika B.N. 2003. Acclimatization of tissue cultured plants. Current Science 85, 1704-1712.
Page 185
ISBN 978-967-10840-4-5
Proc. Int. Conf. Plt. Phy. 2014
First Published, 2015
179
Kozai, T. and Iwanami, Y. 1988. Effect of CO2 enrichment and sucrose concentration under high photon
fluxes on plantlet growth of carnation (Dianthus caryophyllus L.). In: Tissue culture during
preparation stage. Journal of Japanese Society for Horticulral Science 57: 279-288.
Kozai, T., Fujiwara, K., Hayashi, M. and Aitken-Christie, J. 1992. The in vitro environment and its
control in micropropagation. In: Transplant production system. Edited by Kurata, K. and Kozai,
T. Kluwer Academic Publisher, Dordrecht, The Netherlands. Pp. 247-282.
Kozai, T., Koyama, Y. and Watanabe, I. 1988. Multiplication and rooting of potato plantlets in vitro with
sugar free medium under high photosynthetic photon flux. Acta Horticulturae 230: 121-127.
Langford, P.J. and Wainwright, H. 1987. Effects of sucrose concentration on the photosynthetic ability of
rose shoots in vitro. Annals of Botany 60: 633-640.
Mele, E., Messeguer, J. and Camprubi, P. 1982. Effect of ethylene on carnation explants grown in sealed
vessels. Proceedings of the 5th International Congress of Plant Tissue and Cell Culture, 1982, at
Tokyo. Pp. 69-70.
Nguyen, Q.T. and Kozai, T. 2001. Photoautotrophic micropropagation of tropical and subtropical woody
plants. Progress in Biotechnology 18: 335.
Preil, W. 2005. General introduction: a personal reflection on the use of liquid media for in vitro culture.
In: Hvoslef-Eide, A.K. and Preil, W. (Springer eds) Liquid culture systems for in vitro plant
propagation. Pp. 1-18.
Takayama, S. and Akita, M. 2005. Practical aspects of bioreactor application in mass propagation of
plants. In: Hvoslef-Eide, A.K., Preil, W. (Springer eds) Liquid culture systems for in vitro plant
propagation. Pp. 61-78.
Thompson, M.R. and Thorpe, T.A. 1987. Metabolic and non-metabolic roles of carbohydrate. In: Cell
and tissue culture in forestry. Edited by J M Bonga & D J Durzan (Martinus Nijhoff, Dordrecht,
The Netherlands). Pp. 89-112.
Von Arnold, S., Bozhkov, P., Clapham, D., Dyachok, J., Filanova, L. and Hoegberg, K.A. 2005.
Propagation of spruce via somatic embryogenesis. In: Hvoslef-Eide AK, Preil W (Springer eds)
Liquid culture systems for in vitro plant propagation. Pp. 283-293.
Page 186
ISBN 978-967-10840-4-5
Proc. Int. Conf. Plt. Phy. 2014
First Published, 2015
180
Characterizing Patterns in Developmental Stages of Somatic Embryo of
Cocoa (Theobroma cacao L.)
Pancaningtyas, S.
Indonesian Coffee and Cocoa Research Institute, Jl. P. B. Sudirman No.90, Jember 68118, East Java,
Indonesia.
E-mail: [email protected]
Introduction
Plant regeneration using tisssue culture was achieved through organogenesis and somatic embryogenesis.
Somatic embryogenesis can be described as the process by which haploid or diploid somatic cells develop
into structures that resemble zygotic embryos (i.e. bipolar structures without any vascular connection with
the parental tissue) through an orderly series of characteristic embryological stages without fusion of
gametes (Williams and Maheswaran, 1986; Emons, 1994; Raemakers et al., 1995). These methods were
also used for plant genetic transformation efficiently (Jimenez et al., 2001).
Somatic embryogenesis process influenced by several factors, such as plant genotype, developmental
stage and type of the explant, medium composition, growth regulators, light intensity and physiology of
cells that play a crucial role in the induction and maintenance of somatic embryogenesis in many plants
(Terzi and Loschiavo, 1990; Ehsanpour, 2002; Jimenez, 2005). The cells which represent an intermediate
state between somatic and embryogenic cells are called competent. Cellular competence is associated
with the dedifferentiation of somatic cells that allows them to respond to new developmental signals. It is
well accepted that embryogenic competent cells can be morphologically recognized as small, rounded
cells with rich cytoplasm and small vacuoles (Feher, 2005).
The procedure for plant regeneration of cocoa (Theobroma cacao L.) from staminode explants has been
developed through somatic embryogenesis technology. In the process of callus induction with staminode
explants can be grown rapidly in media containing hormones auxin and cytokinin with a certain balance.
Furthermore, the embryo will develop from the callus after sub-cultured on medium without hormones.
The concentration of TDZ used in PCG medium significantly affected the rate of callus growth, the
frequency of embryogenesis, and the number of somatic embryos produced from each responsive explant.
2,4-dicholorophenoxy acetic acid at 5 μM was the most effective plant growth regulator (PGR) among all
PGRs used. A large number of cacao plants have been regenerated from somatic embryos and established
in soil in a greenhouse. Plants showed morphological and growth characteristics similar to those of seed-
derived plants. The described procedure may allow for the practical use of somatic embryogenesis for
clonal propagation of elite cacao clones and other applications that require the production of a large
number of plants from limited source materials.
These early studies were very significant, because they confirmed Haberlandt’s prediction that embryos
can arise from single cells in culture (i.e. cellular totipotency) (Kiyosue et al., 1993; Höxtermann, 1997).
The ability to understand the mechanisms involved in the induction and expression of somatic
embryogenesis in different species will increase the number of genotypes capable of regeneration by this
process.
Page 187
ISBN 978-967-10840-4-5
Proc. Int. Conf. Plt. Phy. 2014
First Published, 2015
181
Materials and Mehods
The medium used consisted of MS (Murashige and Skoog, 1962) basal medium supplemented with 3%
(w/v) sucrose and 3% gelrite. The pH of media was adjusted to 5.6-5.8 and then autoclaved at 121oC for
20 min.
Plant materials
Embryogenic callus and somatic embryos were obtained from cocoa flower bud (staminode and petal)
induction for five different clones, I03, I04, Sul 1, Sul 2, and Scavina 6. Callus induction were cultivated
on induction medium supplemented with 2,4 dichlorophenoxyacetic acid as plant growth regulators. For
each condition and cultivar, 50 petridishes with 5 clusters per plate were used. After four weeks, each
callus observed their capability to formed embryogenic callus. Embryogenic callus transferred to the
expression medium supplemented with cytokinin for four weeks to obtain somatic embryos. Regeneration
efficiency and morphological characteristics were observed for each clone. The cultures were subcultured
monthly and maintained at 25 oC with 16 h photoperiod.
Results and Discussion
Developmental stages of cocoa somatic embryo
During development stages, somatic embryos change in shape and size. Expression pattern influence by
gen regulation that controlled morphological and physiological changes. Somatic embryogenesis
development broadly divided into two phases, first is competence cell differentiated into embryogenic
callus. For the next phase is the expression of embryogenic callus to form somatic embryos. Those two
phases can develop independently due to the process influence by different factors such as plant growth
regulators. The removal of auxin results in the inactivation of a number of genes so that the embryogenic
program can now proceed. The observation that some carrot cell lines are able to develop to the globular
stage, but not beyond in the continued presence of auxin, suggests that new gene products are needed for
the transition to the heart stage and that these new products are synthesized only when exogenous auxin is
removed (Zimmerman, 1993).
Embryogenic callus induction
Secondary embryogenic callus was obtained from primary somatic embryos induction. Primary and
secondary embryos development exhibits the same morphology during the process (Maximova et al.,
2002; Feher et al., 2003). Nevertheless, primary somatic embryos hystologically dominated by
multicellular tissue but secondary somatic embryos dominated by unicellular tissue (Alemano et al.,
1996).
They can also form indirectly via an intermediary step of callus or suspension culture (in these cases a
more complex medium should be used, including additional factors to induce dedifferentiation and
reinitiation of cell division of already differentiated cells before they can express embryogenic
competence) (Williams and Maheswaran, 1986; Ammirato, 1987). Embryogenic cells are unique:
superficially they resemble meristematic cells, though they generally are smaller, more isodiametric in
shape, have larger, more densely staining nuclei and nucleoli, and have a denser cytoplasm (Williams and
Maheswaran, 1986; Carman, 1990).
Page 188
ISBN 978-967-10840-4-5
Proc. Int. Conf. Plt. Phy. 2014
First Published, 2015
182
The average of embryogenic callus competence ranged between 11-37% for five clones of cocoa. The
highest percentage shown in Scavina 6 clone and ICCRI 04 clone as the lowest. However, after the
addition of auxin (2,4 D) then each clone cappability to form embryogenic callus increased to 85%
(Figure 1).
Figure 1. Somatic embryogenesis process of five clones of cocoa on proliferation medium.
Explant (non-embryogenic) cells can be induced to an embryogenic state by a variety of procedures that
usually include exposure to plan growth regulators, pH shock, heat shock or treatment with various
chemical substances. However, it is still not clear whichchanges asomatic cell must undergo in order to
become an embryogenic cell capable of forming an embryo. There appears to be no single, universally
applicable signal that renders cells embryogenic (Mordhorst et al., 1998). Moreover, in general only a
very limited number of cells in any given explant respond by becoming embryogenic (Toonen and de
Vries, 1997). Typically, embryogenic and non-embryogenic callus are distinguishable based on their
morphology and color (Von Arnold et al., 2002; Yang et al., 2010). Embryogenic callus presents nodular
features and a smooth surface (Yang et al., 2010). They are composed of proembryogenic masses or
PEMs (Von Arnold et al., 2002), which can usually be defined as clusters of small cytoplasmic cells (De
Jong et al., 1993), i.e. embryogenic cells. Such type of cells form somatic embryos and are generally
small and isodiametric in shape (Yang et al., 2010). These types of cells usually appear after re-initiation
of cell division and a period of proliferation of the released explant cells in the presence of auxin (De
Jong et al., 1993). In contrast, non-embryogenic cells are rough, friable, and translucent (Jimenez and
Bangerth, 2001). Callus competences of each clone are shown in the Figure 2.
The capability of explants to generate embryogenics cells is depend on genotype of each clone. However,
the addition of suitable plant growth regulators can enhance the competence of clones to proliferate.
Auxins are important in somatic embryogenesis for being the primary promoters of growth and
differentiation of embryogenic cells through the regulation of changes in cellular gene expression (Gray,
2004).
Page 189
ISBN 978-967-10840-4-5
Proc. Int. Conf. Plt. Phy. 2014
First Published, 2015
183
Figure 2. Morphology of callus in different cocoa clones. A) ICCRI 03 clone, B) ICCRI 04 clone, C) Sul
1 clone, D) Sul 2 clone, E) Sca 6 clone and F) Aqueous callus.
Expression of somatic embryos
Somatic embryogenesis is defined as a developmental process by which somatic cells induced through the
embryogenetic pathway to generate embryogenic cells. These cells then go through a series of
morphological and biochemical changes that result in the formation of a somatic embryo making it
possible to regenerate new plants in large scale (Schmidt et al., 1997; Komamine et al. 2005). It can be
also described in a more simple way as a process by which somatic cells develop into plants through
characteristic morphological stages such as globular stage, heart stage, torpedo stages (De Jong et al.,
1993). Development through somatic embryogenesis includes a number of characteristic events:
dedifferentiation of cells, activation of cell division, and reprogramming of their physiology, metabolism,
and gene expression patterns (Yang and Zhang, 2010).
A
F E
D C
B
Page 190
ISBN 978-967-10840-4-5
Proc. Int. Conf. Plt. Phy. 2014
First Published, 2015
184
Figure 3. Embryo development phases. A) Globular, B) Heart, C) Torpedo, and D) Cotyledon.
Figure 4. Expression of somatic embryos. A) Proliferation of embryogenic callus, B, C, D) Expression of
embryogenic callus becomes somatic embryo.
A
D C
B
A
D C
B
Page 191
ISBN 978-967-10840-4-5
Proc. Int. Conf. Plt. Phy. 2014
First Published, 2015
185
Figure 5. Abnormal embryos.
Table 1. Morphological development of somatic embryos on expression medium (Figure 3).
Embryo phase Expression medium
Number of embryo % Abnormal embryo Embryo size
Globular Normal 3.67 d 10.67 c 0.1 c
Torpedo Normal 2.33 d 13.67 c 0.4 b
Kotiledon Normal 2.67 d 6.33 c 0.7 a
Globular Normal 68.33 a 7.33 c 0.1 c
Torpedo Normal 25.67 b 27.67 b 0.43 b
Kotiledon Normal 18.67 c 60.00 a 0.7 a
Somatic embryogenesis response was visible within two weeks of explant culturing. Extending incubation
for further 4-5 weeks was found optimum for obtaining large numbers of suitable-to-process size somatic
embryos. The expressions of embryogenic callus in one cluster are diverse in size and shape, including
callus, normal and abnormal embryos (Figure 4). Comparison between the number of normal and
abnormal embryos is highly dependent on the composition of the media and plant genotype (Table 1).
The embryo will immediately express after hormone auxin was removed.
The Somatic embryogenesis process begins with the induction through cocoa flower induction (petal and
staminode). SE development has been divided into two main phases, namely, the one whereby
differentiated somatic cells acquire embryogenic competence and proliferate as embryogenic cells, and
the phase whereby the embryogenic cells display their embryogenic competence and differentiate into
somatic embryos. Both processes appear to be independent from each other and thus to be influenced by
different factors. The term ‘embryogenic cell’ is restricted to those cells that have completed their
transition from a somatic (non-embryogenic) state to one in which no further exogenously applied stimuli,
Page 192
ISBN 978-967-10840-4-5
Proc. Int. Conf. Plt. Phy. 2014
First Published, 2015
186
such as the application of growth regulators, are necessary to produce the somatic embryo (Komamine et
al., 1992; De Jong et al., 1993). The cells that have reached this transitional state and have already started
to become embryogenic, but that still require exogenously applied stimuli, are designated as competent
cells (Mordhorst et al., 1997). Although plant growth regulators play a key role in inducing somatic
embryogenesis, there are many other factors that have been found which could affect the disposition of a
particular tissue to undergo somatic embryogenesis. The range of possible induction treatments suggests
that it is unlikely that a single inducing molecule is responsible (Toonen and de Vries, 1996). Examples of
these other factors that can direct the transition from somatic cells to cells able to form embryo-like
structures are: in Citrus suspension cultures a change in carbon source from sucrose to glycerol (Ben-
Hayyim and Neumann, 1983; Gavish et al., 1991; Jiménez and Guevara, 1996); in carrot the NH4+
concentration (Smith and Krikorian, 1989) and pH changes (Smith and Krikorian, 1990, 1992) in the
culture medium; in Araujia sericifera the light quality (Torné et al., 2001), in Brassica microspores a
temperature shock (Pechan and Keller, 1988); also pre-treatment of donor plants and subculture duration
(Mórocz et al., 1990), to name only a few factors.
The process of embryogenesis is influenced by several factors, among others, plant genotype, explant
source, the composition of media, growth regulators and physiological state of the cell (Terzi and
Loschiavo, 1990; Ehsanpour, 2002). Several previous studies have successfully induced and regenerate
plants from a variety of sources via somatic embryogenesis ekspan age. Meristematic tissue is used as a
source of explants in meristem culture may be apical meristems or axillary shoot meristem. Propagation
of plants through somatic embryogenesis is the formation, growth and development of the embryonic
cells of the soma or body cells (Ammirato, 1983). Embryogenesis technique has advantageous for mass
vegetative propagation of the species that have high economic value (Blanc et al., 1999). Furthermore,
Molina et al. (2002) suggests that somatic embryogenesis can occur either directly or indirectly. Somatic
embryogenesis that occurs indirectly preceded by callus formation and embryoid can be generated
through callus or cell suspension cultures (Noerhadi, 1974). Embryogenic callus can be generated from
the treatment of 2,4-D and or in combination with other plant growth regulators. Somatic embryos have
the same clonal characteristics and juvenile as derived from the seed. Propagation of plants through
somatic embryogenesis consists of several phases: initiation of embryogenic callus, embryogenic callus
multiplication, maturation and germination of somatic embryos (Von Arnold et al., 2002).
Conclusions
In vitro somatic embryogenesis of cocoa is an important prerequisite for the use of many biotechnological
tools for genetic improvement, as well as for mass propagation which have limitations of conventional
propagation. In this study, a protocol for somatic embryogenesis of cocoa was developed for mass
propagation with efficient regeneration. Meanwhile, this protocol offers itself not only as a highly
efficient method for mass clonal propagation of this species but also for its conservation. The expression
of embryogenic callus in one cluster is diverse in size and shape, including callus, normal and abnormal
embryos. Comparison between the number of normal and abnormal embryos is highly dependent on the
composition of the media and plant genotype. The embryo will immediately express after auxin was
removed.
References
Alemano, L., Bethouly, M. and Michaux-Ferriére, N. 1996. Histology of somatic embryogenesis form
floral tissues of cocoa. Plant Cell, Tissue and Organ Culture 46: 187-194.
Ammirato, P.V. 1983. Embryogenesis. In: Evans, D.A., Sharp, W.R., Ammirato, P.V. and Yamada, Y.
(eds). Handbook of Plant Cell Culture. MacMillan Publishing Co. New York, 970 p.
Page 193
ISBN 978-967-10840-4-5
Proc. Int. Conf. Plt. Phy. 2014
First Published, 2015
187
Ammirato, P.V. 1987. Organizational events during somatic embryogenesis. In: Green, C.E., Somers,
D.A., Hackett, W.P. and Biesboer D.D. (Eds.) Plant Tissue and Cell Culture. New York, Alan R.
Liss, pp. 57-81.
Ben-Hayyim, G. and Neumann, H. 1983. Stimulatory effect of glycerol on growth and somatic
embryogenesis in Citrus callus cultures., Zeitschrift für Pflanzenphysiologie 110: 331-337.
Blanc, G., Michaux‐Ferrière, N., Teisson, C., Lardet, L. and Carron, M.P. 1999. Effects of carbohydrate
addition on the induction of somatic embryogenesis in Hevea brasiliensis. Plant Cell, Tissue and
Organ Culture 59: 103-112.
Carman, J.G. 1990. Embryogenic cells in plant tissue cultures: occurrence and behavior. In Vitro Cellular
and Developmental Biology 26: 746-753.
De Jong, A.J., Schmidt, E.D.L. and De Vries, S.C. 1993. Early events in higher plant embryogenesis.
Plant Molecular Biology 22: 367-377.
Ehsanpour, A.A. 2002. Induction of somatic embryogenesis from endosperm of Oak (Quercus
castanifolia). In: The importance of and B (The Australian Region). 20-23 Jan 2002. pp. 273-
277.
Emons, A.M.C. 1994. Somatic embryogenesis: cell biological aspects. Acta Botanica Neerlandica 43: 1-
14.
Fehér, A., Pasternak, T.P. and Dudits, D. 2003. Review of Plant Biotechnology and Applied Genetics.
Transition of somatic plant cells to an embryogenic state. Plant Cell, Tissue and Organ Culture
74: 201-228.
Fehér, A. 2005. Why Somatic Plant Cells Start to form Embryos? In. Mujib A., Samaj J. (eds). Plant Cell
Monographs. Somatic Embryogenesis. Springer-Verlag Berlin Heidelberg. pp. 85-101.
Gavish, H., Vardi, A. and Fluhr, R. 1991. Extracellular proteins and early embryo development in Citrus
nucellar cell cultures. Physiologia Plantarum 82: 606-616.
Gray, W.M. 2004. Hormonal regulation of plant growth and development. PLOS Biology 2(9): 311.
Höxtermann, E. 1997. Cellular ‘elementary organisms’ in vitro. The early vision of Gottlieb Haberlandt
and its realization. Physiologia Plantarum 100: 716-728.
Jiménez, V.M. and Bangerth, F. 2001. Endogenous hormone levels in explants and in embryogenic and
non-embryogenic cultures of carrot. Physiologia Plantarum 111: 389-395.
Jiménez, V.M. and Guevara, E. 1996. Regeneración in vitro mediante embryogenesis somática de
variedades de cítricos. II. Efecto del ‘plateo’ de suspensiones celulares en medio de cultivo con
diferentes carbohidratos sobre la inducción de embriones. Agronomía Costarricense 20: 9-16.
Jiménez, V.M., Guevara, E., Herrera, J. and Bangerth, F. 2001. Endogenous hormone levels in habituated
nucellar Citrus callus during the initial stages of regeneration. Plant Cell Reports 20: 92-100.
Jiménez, V.M. 2005. Involvement of plant hormones and plant growth regulators on in vitro somatic
embryogenesis. Plant Growth Regulation 47: 91-110.
Kiyosue, T., Satoh, S., Kamada, H. and Harada, H. 1993. Somatic embryogenesis in higher plants.
Journal of Plant Research (Special Issue) 3: 75-82.
Komamine, A., Kawahara, R. Matsumoto, M., Sunabori, S., Toya, T., Fujiwara, A. Tsukuhara, M Smith,
J. Ito, M. Fukud, H. Nomura, K. and Fujimura, T. 1992. Mechanisms of somatic embryogenesis
in cell cultures: physiology, biochemistry, and molecular biology. In Vitro Cellular &
Developmental Biology 28: 11-14.
Komamine, A., Murata, N. and Nomura, K. 2005. Mechanisms of somatic embryogenesis in carrot
suspension cultures-morphology, physiology, biochemistry and molecular biology. In Vitro
Cellular & Developmental Biology Plant 41: 6-10.
Maximova, S.N., Alemano, L., Young, A., Ferriere, N., Traore, A. and Guiltinan, M.J. 2002. Efficiency,
genotypic variability, and cellular origin of primary and secondary somatic embryogenesis of
Theobroma cacao L. In Vitro Cellular & Developmental Biology 38: 252-259.
Molina, D., Aponte, M.E., Cortina H. and Moreno, G. 2002. The effect of genotype and explant age on
somatic embryogenesis of coffee. Plant Cell, Tissue and Organ Culture 71(2): 117-123.
Page 194
ISBN 978-967-10840-4-5
Proc. Int. Conf. Plt. Phy. 2014
First Published, 2015
188
Mordhorst, A.P., Toonen, M.A.J. and De Vries, S.C. 1997. Plant embryogenesis. Critical Reviews in
Plant Sciences 16: 535-576.
Mórocz, S., Donn, G., Németh, J. and Dudits, D. 1990. An improved system to obtain fertile regenerants
via maize protoplasts isolated from a highly embryogenic suspension culture. Theoretical and
Applied Genetics 80: 721-726.
Murashige, T. and Skoog, F. 1962. A revised medium for rapid growth and bioassays with tobacco tissue
cultures. Physiologia Plantarum 15: 473-497.
Noerhadi, E. 1974. Kultur jaringan tumbuhan sebagai bahan penyelidikan dan potensinya dalam
pembangunan negara. Pidato pengukuhan guru besar tetap ITB. Penerbit ITB. Bandung.
Pechan, P.M. and Keller, W.A. 1988. Identification of potentially embryogenic microspores in Brassica
napus. Physiologia Plantarum 74: 377-384.
Raemakers, C.J.J.M., Jacobsen, E. and Visser, R.G.F. 1995. Secondary somatic embryogenesis and
applications in plant breeding. Euphytica 81: 93-107.
Schmidt, E.D.L., Guzzo, F., Toonen, M.A.J. and De Vries, S.C. 1997. A leucine-rich repeat containing
receptor-like kinase marks somatic plant cell cultures. Development 124: 2049-2062.
Smith, D.L. and Krikorian, A.D. 1989. Release of somatic embryogenic potential from excised zygotic
embryos of carrot and maintenance of proembryonic cultures in hormone-free medium. American
Journal of Botany 76: 1832-1843.
Smith, D.L. and Krikorian, A.D. 1990. Somatic embryogenesis of carrot in hormone-free medium:
external pH control over morphogenesis. American Journal of Botany 77: 1634-1647.
Smith, D.L. and Krikorian, A.D. 1992. Low external pH prevents cell elongation but not multiplication
of embryogenic carrot cells. Physiologia Plantarum 84: 495-501.
Terzi, S.A. and Loschiavo, F. 1990. Somatic embryogenesis. In: Bhojwani, S.S.(Ed.) Plant tissue culture:
applications and limitations. New York, Elsevier, pp. 54-66.
Toonen, M.A.J. and De Vries, S.C. 1996. Initiation of somatic embryos from single cells. In: Wang, T.L.
and Cuming, A. (Eds.) Embryogenesis: the Generation of a Plant. Oxford, Bios Scientific
Publishers. pp. 173-189.
Torné, J.M., Moysset, L., Santos, M. and Simón, E. 2001. Effects of light quality on somatic
embryogenesis in Araujia sericifera. Physiologia Plantarum 111: 405-411.
Von, Arnold, S., Sabala, I., Bozhlov, P., Dyachok, J. and Filonova, L. 2002. Developmental Pathway of
Somatic Embryogenesis. Plant Cell, Tissue and Organ Culture 69: 233-249.
Williams, E.G. and Maheswaran, G. 1986. Somatic embryogenesis: Factors influencing coordinated
behaviour of cells as an embryogenic group. Annal of Botany 57: 443-462.
Yang, J.L., Seong, E.S., Kim, M.J., Ghimire, B.K., Kang, W.H., Yu, C.Y. and Li, C.H. 2010. Direct
somatic embryogenesis from pericycle cells of broccoli (Brassica oleracea L. var. italica) root
explants. Plant Cell Tiss. Org. Cult. 100: 49-58.
Yang, X.Y. and Zhang, X.L. 2010. Regulation of somatic embryogenesis in higher plants. Critical
Reviews in Plant Science 29: 36-57.
Zimmerman, J.L. 1993. Somatic embryogenesis: a model for early development in higher plants. Plant
Cell 5: 1411-1423.
Page 195
ISBN 978-967-10840-4-5
Proc. Int. Conf. Plt. Phy. 2014
First Published, 2015
189
In vitro Seeds Germination, Protocorms Proliferation and Shoots
Development of Borneo Wild Native Orchid, Dimorphorchis rossii
Gansau, J.A.1,2,
*, Roslina, J.1 and Spiridrin, S.J.
2
1Faculty of Science and Natural Resources, University Malaysia Sabah, UMS Road, 88400 Kota
Kinabalu, Sabah, Malaysia. 2Unit for Orchid Studies, Institute for Tropical Biology and Conservation University Malaysia Sabah,
UMS Road, 88400 Kota Kinabalu, Sabah. Malaysia.
*E-mail: [email protected]
Introduction
Most of the orchid could be found in Borneo and particularly, in state of Sabah. Sabah has approximately
150 genera consisting of 1500-2000 orchid species. Dimorphorchis rossii belong to the tribe Vandeae and
sub tribe Aeridinae (Beaman and Wood, 2001) and grown as epiphytic and endemic to Sabah. There are
only two species in these genera which are D. rossii and D. lowii (Chan et al., 1994). D. rossii is
becoming seriously endangered in the wild due to forest clearance for urbanization and agricultural
development, and illegal collections (Chan et al., 1994). Therefore, there is an urgent need to conserve
this ecstatic species. The conventional propagation methods cannot be applies effectively since this
species is monopodial and has a slow growth cycle. In addition, orchid seeds do not have endosperm, so
their natural germination is limited and need a symbiotic association with specific mycorrhizal fungus
(Arditti and Ernst, 1993). Application of plant tissue culture offered various ways for orchid propagation
in large scale by using meristem culture or asymbiotic seeds germination (Arditti and Ernst, 1993). Seeds
are able to germinate up to 83% as seen in Vanda dearei (Roslina and Gansau, 2007). Thus, the objectives
of this present study were to determine optimum growth condition for high percentage of in vitro seed
germination and protocorm development and established higher number of seedlings/ plantlets through
protocorms proliferation study.
Material and Methods
Dimorphorchis rossii grown ex situ at Green House of Unit Studies of Orchids, Institute for Tropical
Biology and Conservation, University Malaysia Sabah, Malaysia. Flowering orchid was pollinated by
transferring pollen to other flower in same plant by using needle. Immature capsules were harvested and
cleaned under running tap water for 30 minutes before surface sterilized by soaking in 30% (v/v) sodium
hypochlorite solution (Clorox®) with two drops of Tween 20 and agitated for 20 minutes. The capsules
were then rinsed five times with sterile distilled water. Seeds from dissected capsule were sprinkled onto
the surface of plastic Petri dish containing 25ml media. Series of treatments were studied to optimized
nutrient composition such as basal medium [KC (Knudson, 1946), MS (Murashige and Skoog, 1962) and
VW (Vacin and Went, 1945)], carbon sources [sucrose, glucose and fructose ,1%, 2%, or 3% (w/v)],
complex additives [coconut water (CW) (10-20%, v/v), fresh tomato (FT) (10-20%, w/v), potato
homogenate (PH) (10-20%, w/v), yeast extract (YE) and peptone (PE) (0.10-0.3%, w/v)], and light
conditions (16 hours light, 24 hours light or 24 hours in the dark). For protocorm proliferation and
development, three months old protocorms (1.0 to 2.0mm in size) were cultured on KC, MS, half strength
of MS (1/2MS) and VW. Selected basal medium was later supplemented with complex additives such as
CW (10-20%, v/v), FT (10-20%, w/v), YE and PE (0.10-0.3%, w/v). All treatments fortified with 2%
(w/v) sucrose. The pH of the medium was adjusted to respective pH value of basal medium [KC (pH5.3);
MS (pH5.7); VW (pH5.2)] before solidified with 0.9% (w/v) agar (Sigma) and autoclaved at 121 oC
(15p.s.i) for 20 min. The cultures were grown at 25±2 oC and the illumination provided by cool white
fluorescent tubes (Philips, Malaysia). All experiments were performed in a Completely Randomized
Page 196
ISBN 978-967-10840-4-5
Proc. Int. Conf. Plt. Phy. 2014
First Published, 2015
190
Design (CRD) and repeated in 5 replicates. Cultures were observed using Dino Lite Digital Microscope.
Analysis of variants (ANOVA) was performed on the data and mean values were compared by using
Duncan Multiple Range Test (DMRT) at p<0.05.
Results and Discussion
In vitro seeds germination
Seeds of orchids contain small embryos without any associated endosperm storage tissue. During
germination process, embryo became swollen and formed small-corm like structure which known as
protocorm (George et al., 2008). Now days many studies have been advocate asymbiotic seed
germination as suitable propagation technique for conservation of orchid species (Srivastava et al., 2013).
Pod that harvested on day 210 showed the highest seed germination compare to other days which indicate
210th day was the ideal time to harvest the pod and culture in the laboratory (data not shown). In the basal
media studies (Table 1), MS basal media showed the highest seed germination (29.47±5.98%) compare to
other media. The response depending on type of media use which related to the nutrient composition in
the media. MS medium were highly enriched with macro- and micro-elements compared to KC and VW
media (Hossain et al., 2010). Similar result was obtained by Abraham et al. (2012) and Srivastava et al.
(2013) where MS medium promoted maximum seed germination of Vanda coerulea, Coelogyne nervosa
and Aerides masculum respectively. Besides that, in carbon source study (Table 2), 2% (w/v) sucrose
showed maximum germination (33.33±3.65%) while other treatments especially in high concentration led
to necrosis of the seeds. Tokuhara and Mii (2003) had also reported in their study the significant effect of
sucrose in callus and protocorm-like-bodies (PLBs) proliferation of Phalaenopsis orchids. In complex
additives study, 15% (w/v) PH gave the highest percentage of seed germination (95.56%) followed by
20% FT (91.00%) (Table 3). Potato extract alone or potato extract combined with components of
conventional culture media has been found to provide a useful medium for the anther culture of wheat and
some other cereal plants (Chuang et al., 1978). Addition of potato extract to orchid culture medium was
reported by Sagawa and Kunisaki (1982). Potato fresh treatment has also been reported to help cultures of
Doritaenopsis (Orchidaceae) to recover from hyperhydricity (Zhou, 1995). The seeds also germinated the
best when exposed to 16 hour light rather than continuous exposure to light or dark (Table 4).
Proliferation and shoot development of protocorm
In protocorm proliferation, MS basal media recorded the highest percentage of protocorm proliferation
(33.33±0.49%) as seen in Table 5. For study that involved complex additives (Table 6), 0.2% YE
recorded the highest percentage of protocorm proliferation (41.67±0.51%) followed by 20% (v/v) FT and
control media (33.33±0.49%) based on. Meanwhile 0.1% (w/v) PE showed no response in protocorm
proliferation. YE normally enhances growth in media containing relatively low concentration of nitrogen
or where vitamins are lacking and have been shown to have some unusual properties which may relate to
its amino acid content (George et al., 2008). Protocorm showed the best growth and development in MS
basal media when effect of basal media was studied (Table 5). MS basal media recorded the highest
percentage of protocorm formed leaf (41.67±0.51%) and root (16.67±0.39%). Besides that, the highest
mean number of new leaf and root was observed in MS basal media as well (4.40±3.82 and 3.50±1.51
respectively). While VW media showed no response in formation of root and most of the protocorm
became necrosis (43.75±0.51%). For the effect of complex additives (Table 6), 20% FT recorded the
highest percentage of protocorm formed leaf (83.33±0.39%) followed by 10% CW (78.33±0.42%). The
lowest percentage of necrosis or dead protocorm was also observed in 10% CW (6.67±0.63%). CW can
be beneficial to some orchid plant where it can induce proliferation and development of protocorm into
complete seedling (Arditti and Ernst, 1993). Besides that, CW also has been found to be beneficial for
Page 197
ISBN 978-967-10840-4-5
Proc. Int. Conf. Plt. Phy. 2014
First Published, 2015
191
inducing growth of both callus and suspension culture and for induction of morphogenesis (George et al.,
2008).
Table 1. Effect of basal media on seed germination of Dimorphorchis rossii under 16h light observed
after 140 days of culture. Basal medium Seed germination (%)
MS 29.00±6.98a
KC 12.00±5.87b
VW 0c
Table 2. Effect of carbon source on seed germination of Dimorphorchis rossii on MS medium under 16h
light observed after 140 days of culture. % Carbon sources (w/v) Seed germination (%)
Control 24.00±3.47b
Sucrose 1.0 22.69±5.35b
2.0 33.33±3.65a
3.0 31.00±4.65a
Glucose 1.0 12.10±1.25c
2.0 3.10±1.25d
3.0 0e
Fructose 1.0 0e
2.0 18.38±3.87b
3.0 5.36±2.25d
Table 3. Effect of complex additives on seed germination of Dimorphorchis rossii on MS medium
supplemented with 2% (w/v) sucrose and grown under 16h light observed after 140 days of
culture. Complex additives Seed germination (%)
Control 10.62±2.56e
Coconut water (CW, v/v)
10 89.44±26.87ab
15 57.53±10.85d
20 56.73±10.27d
Potato homogenate (PH, w/v)
10 88.00±27.94ab
15 13.27±5.72e
20 91.00±35.41a
Fresh tomato (FT, w/v)
10 78.44±26.87c
15 95.00±38.35a
20 74.69±24.87c
Peptone (PE, w/v)
0.1 0f
0.2 44.00±10.00e
0.3 0f
Yeast extract (YE, w/v)
0.1 57.00±8.00d
0.2 0f
0.3 79.94±26.84c
Table 4. Effect of light conditions on seed germination of Dimorphorchis rossii on MS medium
supplemented with 2% (w/v) sucrose and 15% (v/v) fresh tomato observed after 140 days of
culture. Light condition Seed germination (%)
16 hours light 96.00±5.94a
24 hours light 88.00±6.87b
24 hours dark 49.26±8.25c
Page 198
ISBN 978-967-10840-4-5
Proc. Int. Conf. Plt. Phy. 2014
First Published, 2015
192
Table 5. Effect of basal media on protocorm proliferation and growth development under 16h light observed after 130 days of culture.
Basal media
Percentage of
protocorm
proliferation
(%±SD)
Mean
number of
new
protocorm
(±SD)
Percentage
number of
protocorm
with leaf
(%±SD)
Number of
leaf (±SD)
Length of
leaf
(mm±SD)
Percentage
number of
protocorm
with root
(%±SD)
Number of
root (±SD)
Length of
root
(mm±SD)
Percentage of
necrosis
(%±SD)
1/2MS 16.67±0.58b 0.67±0.58
d 33.33±0.49
b 2.00±0.98
c 1.27±0.72
b 16.67±0.39
a 1.00±0.39
b 1.11±0.45
b 33.33±0.49
c
MS 33.33±0.49a 2.67±1.60
b 41.67±0.51
a 4.40±3.82
a 2.62±0.59
a 16.67±0.39
a 3.50±1.51
a 4.10±1.69
a 16.67±0.39
a
KC 12.50±0.34c 1.00±0.68
c 25.00±0.25
c 2.00±0.97
c 1.26±0.61
b 6.25±0.25
b 1.00±0.25
b 1.36±0.34
b 18.75±0.40
b
VW 12.50±0.34c 3.75±3.04
a 18.75±0.40
d 2.33±1.03
ab 0.98±0.43
C 0
c 0
c 0
c 43.75±0.51
d
Note : Significant at P<0.01 level. Means in a column followed by a same letter(s) are not significantly (P<0.05) different according to DMRT.
Table 6. Effect of complex additives added in MS medium on protocorm proliferation and growth and development observed after 130 days of
culture.
Complex
additives
Percentage of
protocorm
proliferation
(%±SD)
Mean
number of
new
protocorm
(±SD)
Percentage
number of
protocorm
with leaf
(%±SD)
Mean
number of
leaf (±SD)
Length of
leaf
(mm±SD)
Percentage
number of
protocorm
with root
(%±SD)
Mean
number of
root (±SD)
Length of
root
(mm±SD)
Percentage of
necrosis
(%±SD)
Control 33.33±0.49b 2.67±1.60
b 41.67±0.51
f 4.83±3.82
bc 1.09±0.59
c 16.67±0.39
e 2.33±1.51
ab 0.68±1.69
d 16.67±0.39
d
CW
(v/v)
10 11.67±0.32f 2.80±2.25
b 78.33±0.42
b 5.12±3.57
b 3.43±2.46
a 66.67±0.48
a 2.27±1.31
ab 2.82±2.93
b 6.67±0.63
a
15 16.67±0.39d 2.33±1.38
c 66.67±0.49
c 6.28±3.90
a 2.48±2.02
b 58.33±0.52
b 2.22±1.50
ab 3.71±3.76
a 16.67±0.39
d
20 8.33±0.29g 1.67±1.44
e 33.33±0.49
g 3.50±3.33
e 0.94±1.49
d 25.00±0.45
d 1.50±1.08
c 1.12±2.25
c 66.67±0.49
i
TF
(w/v)
10 12.50±0.34e 0.75±0.54
g 56.25±0.51
cd 3.08±1.81
e 0.99±1.15
d 31.25±0.48
c 0.58±0.62
f 0.27±0.82
g 12.50±0.34
c
15 12.50±0.34e 2.00±1.75
c 68.75±0.48
c 2.90±1.72
f 0.93±0.78
d 31.25±0.48
c 2.33±1.56
a 0.54±1.44
de 12.50±0.34
c
20 33.33±0.49b 1.83±1.00
e 83.33±0.39
a 2.22±1.27
g 0.77±0.48
e 16.67±0.39
e 0.67±0.39
e 0.16±0.41
h 8.33±0.29
b
PE
(w/v)
0.1 0.00±0.00h 0.00±0.00
h 33.33±0.49
g 2.56±2.68
f 1.01±1.68
c 33.33±0.49
c 0.89±0.90
d 0.63±1.43
d 50.00±0.52
h
0.2 18.75±0.40c 2.38±3.16
c 50.00±0.52
e 2.63±1.97
f 0.74±1.06
e 12.50±0.34
f 0.25±0.34
g 0.13±0.39
h 18.75±0.40
de
0.3 18.75±0.40c 1.17±2.22
f 50.00±0.53
e 2.00±1.50
g 0.92±1.26
d 25.00±0.45
d 1.13±0.72
c 0.40±0.72
f 25.00±0.45
f
YE
(w/v)
0.1 12.50±0.34e 3.00±2.08
a 75.00±0.45
b 2.81±1.76
f 1.27±0.96
c 25.00±0.45
d 0.88±0.60
d 0.24±0.47
g 12.50±0.34
c
0.2 41.67±0.51a 1.94±2.35
cd 50.00±0.52
e 4.11±2.87
d 0.89±0.94
e 25.00±0.45
d 1.83±1.24
c 0.26±0.48
g 16.67±0.40
d
0.3 31.25±0.48b 1.50±1.02
e 56.25±0.51
cd 4.33±2.78
d 0.89±1.06
e 25.00±0.45
d 0.75±0.45
e 0.18±0.32
h 37.50±0.50
g
Note: CW-coconut water;TF-fresh tomato;PE-peptone;YE-yeast extract. Significant at P<0.01 level. Means in a column followed by a same letter(s) are not
significantly (P<0.05) different according to DMRT.
Page 199
ISBN 978-967-10840-4-5
Proc. Int. Conf. Plt. Phy. 2014
First Published, 2015
193
Conclusions
The present study has described the efficient method for in vitro seed germination and protocorm
proliferation and development of Dimorphorchis rossii. These findings are important as a reference or
guideline to those interested in doing this species as there are few or none paper that had been reported so
far. Considering the dwindling population of this orchid, this technique can serve as an alternative to
multiply this orchid in large scale for the purpose of conservation.
Acknowledgements
We would like to thank Ministry of Education, Malaysia for the financial support for this research
(RAG0025-STWN).
References
Abraham, S., Augustine, J. and Thomas, T.D. 2012. Asymbiotic seed germination and in vitro
conservation of Coelogyne nervosa A. Rich. an endemic orchid to Western Ghats. Physiology and
Molecular Biology of Plants 18(3): 245-251.
Arditti, J. and Ernst, R. 1993. Micropropagation of Orchids. New York: John Wiley and Sons.
Beaman, T.E., Wood, J.J., Beaman, R.S. and Beaman, J.H. 2001. Orchids of Sarawak. Natural History
Publication and Kew Royal Botanic Gardens, Kota Kinabalu.
Chan, C.L., Lamb, A., Shim, P.S. and Wood, J.J., 1994. Orchids of Borneo, Volume 1. The Sabah Society
and Kew Royal Botanic Gardens.
Chuang C.C., Ouyang, T.W., Chia, H., Chou, S.M. and Ching, C.K. 1978. A set of potato media for
wheat anther culture. Pp. 51-56 in Plant Tissue Culture. Proceedings of the Peking Symposium
1978. Pitnam, Boston, London, Melbourne.
George, E.F., Hall, M.A. and Klerk, G.D. 2008. Plant Propagation by Tissue Culture, 3rd
Edition, Volume
1.Springer, The Netherlands.
Hossain, M.M., Sharma, M., Teixeira da Silva, J. and Pathak, P. 2010. Seed germination and tissue
culture of Cymbidium giganteum Wall. ex Lindl. Scientia Horticulturae 123: 479-487.
Knudson, L., 1946. A new nutrient solution for germination of orchid seed. American Orchid Society
Bulletin 15: 214-217.
Murashige, T. and Skoog, F., 1962. A revised medium for rapid growth and bioassays with tobacco tissue
cultures. Plant Physiology 15: 493-497.
Roslina, J. and Gansau, J.A 2007. Effect of medium composition on in vitro seed germination of Vanda
dearei. Proceeding of Seminar on Science and Technology, 25-27 Oktober 2007, Shan Shui Golf
Resort, Tawau, Sabah. pp. 178-187.
Sagawa, Y. and Kunisaki, J.T. 1982. Clonal propagation of orchids by tissue culture. In.Fujiwara, A.,
Plant Tissue culture, Maruzen, Tokyo. pp. 683-684.
Srivastava, G., Gayatri, M.C. and Sarangi, S. 2013. In vitro seed germination as an aid to conserve
Aerides maculosum lindl., an endemic and endangered orchid of western ghats, India.
International Journal of Pharma and Bio Sciences 4(2): 478-486.
Tokuhara, K. and Mii, M. 2003. Highly-efficient somatic embryogenesis from cell suspension cultures
ofphalaenopsis orchids by adjusting carbohydrate sources. In Vitro Cellular and Developmental
Biology – Plant 39: 635-639.
Vacin, E. and Went, F.W. 1949. Some pH changes in nutrient solutions. Botanical Gazette 110: 605-661.
Zhou, T.S. 1995. In vitro culture of Doritaenopsis: comparison between formation of hyperhydric
protocorm-like body (PLB) and the normal PLB. Plant Cell Reproduction 15: 181-185.
Page 200
ISBN 978-967-10840-4-5
Proc. Int. Conf. Plt. Phy. 2014
First Published, 2015
194
Pregermination of Coffea canephora cv Robusta Young Embryo by the
Plating Method in Somatic Embryogenesis Propagation
Rina, A. Indonesian Coffee and Cocoa Research Institute, Jl. P. B. Sudirman No.90, Jember 68118, East Java,
Indonesia.
E-mail: [email protected]
Introduction
The capacity to produce morphologically well-formed and normally developed embryos from somatic
cells resided uniquely within the plant kingdom (Zimmerman, 1993) up to the present time. In addition,
the development of somatic and zygotic embryos is highly similar (Zimmerman, 1993; Dodeman et al.,
1997). Therefore, somatic embryogenesis (SE) provides a useful model to study embryo development in
plants. In contrast to zygotic embryogenesis, SE can easily be observed, the culture conditions can be
controlled, and large quantities of embryos can be easily obtained (Kawahara and Komamine, 1995).
Somatic embryogenesis is the process by which somatic cell develop into plants through characteristic
embryological stages without fusion of gamete. Culture tissues of coffee species exhibit a high
embryogenic potential with somatic embryogenesis first reported for Coffea canephora in 1970
(Staritsky, 1970) and plant formation from Coffea arabica embryos in 1977 (Sondhal and Sharp, 1977).
Two types of SE are recognized. The term “direct” is applied to explants that undergo a minimum
proliferation before forming somatic embryos whereas “indirect” refers to explants that undergo an
extensive proliferation before the development of somatic embryos (Sharp et al.,1980). It has been
suggested that in direct embryogenesis, embryogenic cells are present and simply require favorable
conditions for embryo development whereas indirect embryogenesis requires the redetermination of
differentiated cells (Yeung, 1995). However, the terms “direct” and “indirect” are still useful in
describing cases in which either very little or a great deal of explant proliferation precedes embryogenesis
although not necessarily indicating fundamental differences in the cells involved (Halperin, 1995).
In Coffea spp several model systems have been reported for in vitro SE induction. SE in Coffea
canephora was first reported by Staritsky (1970), who described the induction of callus tissue from
orthotropic internodes. Subsequently, Herman and Haas (1975) obtained SE for Coffea arabica from
callus cultures derived from leaf explants. Söndahl and Sharp (1977) developed a two-phase experimental
protocol for SE from leaves of C. arabica. Dublin (1981) reported SE from leaf explants of Arabusta
using a medium with cytokinins (6-Benzylaminopurine [BA] and kinetin) whereas Yasuda et al. (1985)
induced embryogenic calli and somatic embryos from C. arabica leaf explants using only BA.
From an economical point of view, it is more relevant to achieve somatic embryogenesis in liquid
medium. Production of coffee somatic embryos in Erlenmeyer flasks was first reported by Zamarripa et
al., (1991) and by Van Boxtel and Berthouly (1996), for Coffea canephora and Coffea arabica
respectively. The yield achieved could be as high as 400,000 torpedo embryos per liter within 7 weeks
(Zamarripa et al., 1991).
Somatic embryogenesis process in Indonesian Coffee and Cocoa Research Institute (ICCRI) includes the
callus induction, maintenance of the embryogenic callus, multiplication of the embryogenic callus in solid
media, expression embryo in solid medium, maturation embryos in liquid medium, shooting and rooting
in solid medium. This research aimed to find alternative methods to reduce the numbers of workers in the
Page 201
ISBN 978-967-10840-4-5
Proc. Int. Conf. Plt. Phy. 2014
First Published, 2015
195
laboratory as reducing the last two steps in maturation embryo, namely shooting and rooting step, to
become the pregermination step of young embryo by the plating method.
Materials and Methods
This research was conducted at Nestle Research and Development Centre, Tours (NR&DC-T), France.
This experiment used embryos of the FRT04 Robusta genotype. The PGR1 medium contained MS
medium with cytokinin as the growth hormone and the PGR2 medium contained MS medium free
hormone. Embryos were collected using an autoclaved glass system containing a filter (nylon Bluttx 50
µm) fixed by rubber band. Petri dishes were filled with 100 ml of solid medium and boxes containing
blue foam with 150 ml of liquid medium. Each recipient was inoculated with 1g of torpedo embryos. All
the treatments were replicated twice.
Five protocols were used in this experiment as follows:
- A: Plating of the embryos on PGR1 medium then individual subculture on PGR2 solid medium in
large petri dishes (d=140mm) then acclimatization of complete plantlets
- B: Plating of the embryos on PGR1 medium then plating on PGR2 solid medium in large petri
dishes (d=140mm) then acclimatization of complete plantlets
- C: Plating of the embryos on PGR1 medium with Whatman paper then plating on PGR2 solid
medium with Whatman paper in large petri dishes (d=140mm) then acclimatization of complete
plantlets
- D: Plating of the embryos on 100 mm high blue foam soaked wih PGR1 liquid medium then
plating on blue foam soaked with PGR2 liquid medium in plastic boxes then acclimatization of
cotyledonary embryos
- E: Plating of the embryos on 100 mm high blue foam soaked with PGR1 liquid medium with
Whatman paper then plating on blue foam soaked with PGR2 liquid medium with Whatman paper
in plastic boxes then acclimatization of cotyledonary embryos.
Development of embryos into cotyledonary embryos were observed at seven days. Observations were
made by measuring the percentage of the number of green and brown cotyledonary embryos.
Results and Discussion
Stage of embryonic development starts from globular, heart and torpedo shape. In embryonic
development, torpedo shape is characterized by the presence of cell differentiation and polarization of
growth, in particular the initiation of the formation of cotyledons. Green and open cotyledonary embryo
can stimulate apical dominance of shoots (shoot tip of the stem). This phase is the final stage of
embryonic development that leads to maturation with marked enlargement of cotyledon size.
The percentage of green and brown embryos would determine the success of the plantlets for
acclimatization. The results showed that embryos of FRT04 genotype gave a higher green number of
embryos (100%) using protocols A and B after one week starting from 1 g of torpedo. The embryos
plated on filter (C) or on blue foam (D, E) turned necrotic (Figure 1). Hence, protocols A and B were
better than the other protocols. More than 50% embryos were green using protocol C but more than 70%
embryos were brown using protocols D and E (Table 1, Figure 2).
Embryos that had reached physiological maturity usually have better germination capacity, although the
conversion of plant from somatic embryos was generally low. The rate ofconversion of somatic embryos
into plants averageranged from 0 to 50%. This value was much lower than zygotic embryos of
commercial commodity which have capacity for growing an average of over 90%.
Page 202
ISBN 978-967-10840-4-5
Proc. Int. Conf. Plt. Phy. 2014
First Published, 2015
196
Protocol Production Torpedo Step 1 Step 2
A .
B.
C.
D.
E.
Figure 1. Pre-germination step in various protocols. A: plating DES1 – individual PGR2 with Gelrite, B:
plating DES1 – plating PGR2, C: plating Whattman DES1 – plating PGR2 with Whattman, D:
plating DES1 – plating PGR2 with Whattman, E: plating DES1 – plating PGR2 without
Whattman.
Page 203
ISBN 978-967-10840-4-5
Proc. Int. Conf. Plt. Phy. 2014
First Published, 2015
197
Table 1. Pre-germination step in various protocols. A: plating DES1 – individual PGR2 with Gelrite, B:
plating DES1 – plating PGR2, C: plating Whattman DES1 – plating PGR2 with Whattman, D:
plating DES1 – plating PGR2 with Whattman, E: plating DES1 – plating PGR2 without
Whattman.
Protocol Protocols % Green embryos % Brown embryos
A Plating DES1 – individual PGR2 with Gelrite 100 0
B Plating DES1 – plating PGR2 100 0
C Plating Whattman DES1 – plating PGR2 with Whattman 54.3 45.6
D Plating DES1 – plating PGR2 with Whattman 13.8 84.8
E Plating DES1 – plating PGR2 without Whattman 26.3 73.6
Figure 2. Pre-germination step in various protocols. A: plating DES1 – individual PGR2 with Gelrite, B:
plating DES1 – plating PGR2, C: plating Whattman DES1 – plating PGR2 with Whattman, D:
plating DES1 – plating PGR2 with Whattman, E: plating DES1 – plating PGR2 without
Whattman.
Conclusions
The percentage of green and brown embryos would determine the success of the plantlets when
acclimatized. Protocols A and B described in this work reduced the culture time required, and made it
more time- and cost- effective. It will be interesting to validate this protocol with other economically
important coffee varieties.
Acknowledgements
The authors acknowledge the Nestle Research and Development Centre, Tours (NR&DCT), Francefor the
financial support. Thanks to Jean Paul Ducos for helpful suggestions.
References
Dodeman, V. L., Ducreux, G. and Kreis, M. 1997. Zygotic embryogenesis versus somatic embryogenesis.
Journal of Experimental Botany 48: 1493-1509.
Page 204
ISBN 978-967-10840-4-5
Proc. Int. Conf. Plt. Phy. 2014
First Published, 2015
198
Dublin, P. 1981. Embryogenèse somatique directe sur fragments de feuilles de caféier Arabusta. Café
Cacao Thé 25: 237-242.
Halperin, W. 1995. In vitro embryogenesis: some historical issues and unresolved problems, in In Vitro
Embriogenesis in Plants, (Thorpe, T.A., ed.), Kluwer Academic Publishers, Netherlands, pp. 1-
16.
Herman, E.B. and Haas, G.J. 1975. Clonal propagation of Coffea arabica L. from callus culture.
HortScience 10: 588-589.
Kawahara, R. and Komamine, A. 1995. Molecular basis of somatic embryogenesis, in Biotechnology in
Agriculture and Forestry. Vol. 30. Somatic Embryogenesis and Synthetic Seed I (Bajaj, Y.P.S.,
ed.), Springer-Verlag, Berlin, pp. 30-40.
Sharp, W.R., Söndahl, M.R., Caldas, L.S. and Maraffa, S.B. 1980. The physiology of in vitro asexual
embryogenesis. Horticulture Review 2: 268-310.
Söndahl, M.R. and Sharp, W.R. 1977. High frequency induction of somatic embryos in cultured leaf
explants of Coffea arabica L. Zeitschrift fur Pflanzenphysiologie 81: 395-408.
Staritsky, G. 1970. Embryoid formation in callus tissues of coffee. Acta Botanica Neerlandica 19: 509-
514.
Van Boxtel, J. and Berthouly M. 1996. High frequency somatic embryogenesis from coffee leaves. Plant
Cell Tissue and Organ Culture 44: 7-17.
Yasuda, T., Fuji, Y. and Yamaguchi, T. 1985. Embryogenic callus induction from Coffea arabica leaf
explants by benzyladenine. Plant and Cell Physiology 26: 595-597.
Yeung, E.C. 1995. Structural and developmental patterns in somatic embryogenesis, in In Vitro
Embryogenesis in Plants, (Thorpe, T. A., ed.), Kluwer Academicb Publishers, Netherlands, pp.
205-247.
Zamarripa, A., Ducos, J.P., Bollon, H., Dufour, M. and Petiard, V. 1991. Production d'embryons
somatiques de caféier en milieu liquide: effets densité d'inoculation et renouvellement du milieu.
Café Cacao Thé 35(4): 233-243.
Zimmerman, J.L. 1993. Somatic embryogenesis: a model for early development in higher plants. The
Plant Cell 5: 1411-1423.
Page 205
ISBN 978-967-10840-4-5
Proc. Int. Conf. Plt. Phy. 2014
First Published, 2015
199
Asymbiotic Germination of Borneo Endemic Orchid Vanda hastifera
Immature Seed
Gansau, J.A.1,*, Bong, C.S.
1, Hartinie, M.
1 and David, D.
2
1Faculty of Science and Natural Resources, Universiti Malaysia Sabah, Jalan UMS, 88400 Kota Kinabalu,
Sabah, Malaysia. 2Faculty of Sustainable Agriculture, Universiti Malaysia Sabah, Locked Bag No.3, 90702 Sandakan,
Sabah, Malaysia.
*E-mail: [email protected]
Introduction
Orchid seeds are tiny, extremely light and often referred as "dust seeds". The seeds produced in vast
numbers and contain very small nutrient reserves (Arditti and Abd Karim, 2000). Seeds may germinate in
nature but will not grow unless infected by mycorrhizal fungus, which supplies the young plants with all
the sugars and nutrients they need until the plants are old enough to produce food on their own (Rajkumar
et al., 2008). In spite of huge number of seeds produce, only few seeds germinated in nature. In natural
conditions, the life cycle of orchid is very long, it takes them approximately 4 to 10 years to bloom and
produce seeds and this bring the difficulties for wild orchids to re-establish their position in natural
habitats (Arditti, 1967). Therefore the application of plant tissue culture technique is proved to be the
most efficient approach to conserve orchid species. In the present study, Vanda hastifera was selected
because of the distribution of this Borneo endemic orchid has been depleted from its natural habitat
because of the deforestation activities towards urban and agriculture development. This orchid was
originally found mainly in Mt. Kinabalu and Tambunan district of Sabah (Chan et al., 1994). The flower
of V. hastifera is white-cream with brown spots and it has a sweet scented which remain flowered
throughout the year. The purpose of this study is to optimize the best medium for in vitro seed
germination by determine the effect of basal media, complex additives and carbon sources for nurturing
the conservation efforts of this valuable native orchid.
Materials and Methods
Immature, green V. hastifera capsules were harvested at 150 days after pollination from Tenom Orchid
Centre in Sabah Agriculture Park, Lagud Sebrang. Capsules of V. hastifera were characterized by weight
(g), length, diameter (cm) and color. Capsules were cleaned under running tap water for 30 min before
surface sterilized by soaking in 30% (v/v) sodium hypochlorite solution (Chlorox™) added with two
drops of Tween 20 for 20 min. The capsules were rinsed five times with sterile distilled water, dipped in
95% (v/v) alcohol for five seconds and flamed to evaporate the alcohol. Seeds from dissected capsules
were cultured on petri dish containing media treated with different basal media, complex additives and
carbon sources. Basal media tested are Knudson C (KC, Knudson, 1946), MS (Murashige and Skoog,
1962), and Vacin and Went (VW, Vacin and Went, 1949). Each basal medium was added with 2% (w/v)
of sucrose. Selected basal medium (KC) was then supplemented with various types of complex additives
such as 10% (v/v) coconut water, 10% (v/v) tomato juice, 10% (v/v) banana pulp, 10% (v/v) potato
homogenate, 0.2% (w/v) peptone and 0.2% (w/v) yeast extract. KC medium without additive served as
control. After that, four types of sugars, which are sucrose (Sigma), glucose (Fluka), fructose
(Mallinckrodt) and galactose (Sigma) at concentrations of 1 to 4% (w/v) were tested using KC medium
supplemented with 10% (v/v) potato homogenate. The medium without sugars served as control. The pH
was adjusted to 5.3 and solidified with 0.8% (w/v) of agar (Sigma) prior autoclaving for 20 min at 121 ºC
(15 p.s.i). Cultures were incubated at 25±2 ºC under continuous illumination of fluorescent light 800W
(Philip, Japan). Cultures were observed weekly for seed germination and protocorm development. The
Page 206
ISBN 978-967-10840-4-5
Proc. Int. Conf. Plt. Phy. 2014
First Published, 2015
200
germination percentage and growth index (GI) were determined as reported by Harrison and Arditti,
(1978). All experiments were performed in a Completely Randomized Design with five replicates.
Analysis of variants was performed on the data and the mean values were compared using Duncan
Multiple Range Test (DMRT) at p<0.05.
Results and Discussion
Seed characterization
The immature capsule of V. hastifera harvested after 150 days pollination has 6.88 g of weight, 4.5 cm
length, and 2.0 cm diameter (Figure 1b). Seeds of V. hastifera were yellowish, very minute and extremely
light (Figure 1c). The length of seed ranged from 200 µm to 300 µm. The testa was transparent and the
length was double of the embryo, which creates empty space in the seed. This observation is in agreement
with Arditti and Abd Karim (2000) for other species of Vanda.
Effect of basal media on seed germination
After 150 days of culture, it was observed that KC basal medium was found superior to MS and VW
media. The germination percentage of V. hastifera on KC medium was 77.84±1.14% with growth index
(GI) value of 164.72 (Table 1). The seeds started to germinate when the embryo swelled and emerged
from testa on this medium after 30 days of culture (Figure 1e). The result also showed that VW basal
medium was not suitable to germinate seeds of V. hastifera. Knudson C (Knudson, 1946) medium has a
simple formulation with few macro and micro salt elements compared to MS basal medium that consists
of four main components such as macronutrients, micronutrients, iron and vitamins (Murashige and
Skoog, 1962). Meanwhile, VW basal medium is made up only of macronutrients and iron (Vacin and
Went, 1949). The variety of macro- and micro-elements in these three types of basal media gave different
responses on seed germination of V. hastifera. Since V. hastifera is an epiphytic orchid, the current result
was supported by Arditti (1967) where KC basal medium is commonly used for seed germination of
epiphytic tropical orchids. Other differences in KC, MS and VW media are the nitrogen concentration and
ratio of ammonium to nitrate. MS medium consists of ammonium nitrate (1650 mg/L) and potassium
nitrate (1900 mg/L), KC medium contains ammonium sulfate (500 mg/L) and calcium nitrate (1000
mg/l), while VW medium consists of ammonium sulfate (500 mg/L) and potassium nitrate (525 mg/L).
The result showed that nitrogen concentration and the ratio of ammonium to nitrate on KC medium was
more suitable for V. hastifera seed to germinate. The efficiency of KC as basal medium for seed
germination was also reported previously for V. tessellate (Roy and Banerjee, 2002), Vanda hybrids
(Johnson and Kane, 2007) and Dendrobium lituiflorum (Vyas et al., 2009).
Table 1. Effect of basal media on seed germination of Vanda hastifera after 150 days of culture. Treatment Germination time (days) Germination (Means±SD)% Growth Index (GI)
KC 30 77.84±1.14 a 167.72
a
MS 30 30.75±8.81b 125.15
b
VW 0 0 0
Mean values within a column followed by the same letters are not significantly different at p<0.05 according to
Duncan’s Multiple Range Test; Treatments were conducted in 5 replicates. SD= Standard Deviation.
Effect of complex additives on seed germination
Addition of 10% (v/v) potato homogenate in KC basal medium has reduced the germination period to 19
days. After 90 days of culture, seed of V. hastifera was significantly germinated on KC basal medium
containing 10% (v/v) potato homogenate with 95.6±1.67% and GI value of 293.90 (Table 2, and Figure
Page 207
ISBN 978-967-10840-4-5
Proc. Int. Conf. Plt. Phy. 2014
First Published, 2015
201
1g). From the results, addition of complex additives has significantly increased the germination
percentage as compared to control medium which devoid of any complex additives. Previous studies also
reported that addition of organic additives such as potato homogenate, banana homogenate and coconut
water have a significant contribution on germination of many orchid species (Rosmah et al., 2010; Zeng
et al., 2012). Complex additive is natural sources of minerals such as carbohydrates, protein, fat, vitamins,
phenolic compounds, growth substances, a lower level of amino acids, and organic acids that can enhance
the orchid seeds growth (Islam et al., 2003). In this study, seeds of V. hastifera were significantly
germinated on medium supplemented with potato homogenate. Potato is a carbohydrate-rich food which
contains about 80% water and 20% dry matter (mainly as starch). Potato tubers also contain protein, fat,
several vitamins, phenolic compounds and low levels of some amino acids and fatty acids (Islam et al.,
2003). The beneficial of potato homogenate was also reported earlier by Rosmah et al. (2010), on seeds
germination of Phalaenopsis gigantea.
Figure 1. In vitro seed germination of Vanda hastifera. (a) Flower of V. hastifera, (b) Capsule, (c) Seeds
of V. hastifera, (d) Seeds at Stage 1, (e) Germinated seed (Stage 3), (f) Protocorm, (g) Seeds
germinated on KC basal medium supplemented with 10% (v/v) potato homogenate, (h)
Germinated seeds treated on medium containing sucrose 1% (w/v), (i) Germination inhibited on
medium containing galactose. Bar: (a) and (c) 1cm; (d) and (e) 200µm; (f) and (g) 1mm; (h)
0.5mm.
Effect of sugars on seed germination
After 30 days of culture, the germination performance of seeds on Knudson C medium supplemented with
10% (v/v) potato homogenate was greatly influenced by type and concentration of sugar. Culture medium
containing 1% and 2% (w/v) of sucrose gave the highest percentage of germinated seeds, that are
86.13±1.90% and 88.39±4.83% and GI value of 281.75±2.95 and 284.20±6.94, respectively (Table 3,
Figure 1h). However, higher concentration of sucrose (4%, w/v) reduced the seeds germination
percentage. Carbohydrate serves primarily as energy which acts as signaling molecules that involved in
the integration and regulation of some important biochemical pathways that influence germination, seed
dormancy and seed reserve mobilization (Johnson and Kane, 2007). From this study, sucrose was found
superior compared to other source of carbon in germinating the seeds of V. hastifera. Sucrose has been
widely used as the major carbohydrate source in plant tissue culture because of its efficiency in being
a b
b c d
e f g h
Page 208
ISBN 978-967-10840-4-5
Proc. Int. Conf. Plt. Phy. 2014
First Published, 2015
202
transported across the plasma membrane (Kumaraswami et al., 2010). Increase osmotic stress at higher
concentration of sucrose (4%, w/v) has led to the reduction of seeds germination (Karami et al., 2006).
Sucrose at 2% (w/v) in culture medium was also reported beneficial in earlier study for V. tessellata (Roy
and Banerjee, 2002), Dendrobium lituiflorum (Vyas et al., 2009) and Ansellia africana (Vasudevan and
van Staden, 2010). This study also proof that galactose is not suitable seeds germination of V. hastifera.
According to Arditti (1967), galactose has long been known to inhibit the growth of orchid seed
germination because of orchid’s inability to utilize it. George et al. (2008) also reported that galactose is
toxic to most plant tissues, which inhibits the growth of orchids and other plants in concentration as low
as 0.01% (w/v).
Table 2. Effect of complex additives on seed germination of Vanda hastifera after 90 days of culture.
Mean values within a column followed by the same letters are not significantly different at p<0.05 according to
Duncan’s Multiple Range Test; Treatments were conducted in 5 replicates. SD= Standard Deviation
Table 3. Effect of carbon sources on seed germination of V. hastifera cultured on KC medium with 10%
(v/v) potato homogenate observed after 30 days of culture.
Mean values within a column followed by the same letters are not significantly different at p<0.05 according to
Duncan’s Multiple Range Test; Treatments were conducted in 5 replicates. SD= Standard Deviation
Conclusions
From these experiments, this study concluded that the best culture medium for seed germination of
V. hastifera is KC basal medium supplemented with 10% (v/v) of potato homogenate and 1% (w/v) of
sucrose.
Treatment Germination time (Days) Germination (Means±SD), % Growth index (GI)
Control 30 15.46±2.58 e 153.14
e
10% (v/v) coconut water 28 27.45±0.20 d 205.26
d
10% (v/v) tomato juice 26 81.76±0.46 b 278.36
b
10% (v/v) banana pulp 22 79.77±5.55 b 277.23
b
10% (v/v) potato homogenate 19 95.61±1.67 a 293.90
a
0.2% (w/v) peptone 29 36.91±3.04 c 221.24
c
0.2% (w/v) yeast extract 22 34.22±2.70 c 277.24
b
Treatment Concentration (%, w/v) Germination (Means±SD), % Growth Index (GI)
Control 63.58±13.35 bc
250.60 c
Sucrose 1 86.13±1.90 a 281.75
a
2 88.39±4.83 a 284.20
a
4 58.75±12.83 c 258.62
c
Glucose 1 69.30±13.21 bc
255.60 c
2 76.05±3.00 ab
270.78 b
4 64.48±12.93 bc
249.46 c
Fructose 1 38.30±10.85 d 223.33
d
2 32.86±17.66 d 219.25
d
4 13.07±6.88 e 200.65
e
Galactose 1 0 0
2 0 0
4 0 0
Page 209
ISBN 978-967-10840-4-5
Proc. Int. Conf. Plt. Phy. 2014
First Published, 2015
203
Acknowledgements
We would like to thank Sabah Agriculture Park, Lagud Sebrang Tenom for providing orchid capsules and
to Universiti Malaysia Sabah (UMS) for the financial support for this research.
References
Arditti, J. 1967. Factors affecting the germination of orchid seeds. Botanical Review 33: 1-97.
Arditti, J. and Abdul Karim, A. G. 2000. Numerical and physical properties of orchid seeds and their
biological implications. New Phytologist 145:367-421.
Chan, C.L., Lamb, A., Shim, P.S. and Wood, J.J. 1994. Orchids of Borneo. Volume 1. Introduction and a
Selection of Species. Kuala Lumpur: Print and Co. Sdn. Bhd.
George, E.F., Hall, M.A. and Klerk, G.J.D. 2008. Plant propagation by tissue culture. The background. 3rd
edition. London:Springer.
Johnson, T.R. and Kane, M.E. 2007. Asymbiotic germination of ornamental Vanda: in vitro germination
and development of three hybrids. Plant Cell Tissue and Organ Culture 91: 251-261.
Karami, O., Deljou, A., Esna-Ashari, M. and Ostad-Ahmadi, P. 2006. Effects of sucrose concentrations
on somatic embryogenesis in carnation (Dianthus caryophyllus L.). Scientia Horticulturae 110(4):
340-344.
Knudson, L. 1946. A new nutrient solution for germination of orchid seeds. American Orchid Society
Bulletin 15: 214-217.
Kumaraswami, M., Sudipta, K.M., Balasubramanya, S. and Anuradha, M. 2010. Effect of different
carbon sources on in vitro morphogenetic responses of patchouli (Pogostemon cablin Benth.)
Journal of Phytology 2(8): 11-17.
Harrison, C.R. and Arditti, J. 1978. Physiological changes during the germination of Cattleya aurantiaca
(orchidaceae). Botanical Gazette 139(2): 180-189.
Islam, M.O., Rahman, A.R., Matsui, S., and Prodhan, A.K.M. 2003. Effects of Complex Organic Extracts
on Callus Growth and PLB Regeneration through Embryogenesis in the Doritaenopsis Orchid.
Japan Agricultural Research Quarterly 37: 229-235.
Murashige, T. and Skoog, F. 1962. A revised medium for rapid growth and bioassays with tobacco tissue
cultures. Plant Physiology 15: 473-497.
Rajkumar, K., Devi, H.S., Jeyaram, K. and Singh, M.R.K. 2008. Molecular characterization of reciprocal
crosses of Aerides vandarum and Vanda stangeana (Orchidaceae) at the protocorm stage. Plant
Biotechnology Report 2: 145-152.
Rosmah, M., Mariam A.L., Zaleha, A.A. and Rimi, R. 2010. Effects of carbon source and potato
homogenate on in vitro growth and development of Sabah’s endangered orchid: Phalaenopsis
gigantea. Asia Pacific Journal of Molecular Biology and Biotechnology 18(1): 199-202.
Roy, J. and Banerjee, N. 2002. Optimization of in vitro seed germination, protocorm growth and seedling
proliferation of Vanda tessellate (Roxb.) Hook. Ex G. Don. Phytomorphology 52: 167-178.
Vasudevan, R. and van Staden, J. 2010. In vitro asymbiotic seed germination and seedling growth of
Ansellia africana Lindl. Scientia Horticulturae 123: 496–504.
Vacin, E.F. and Went, F.W. 1949. Some pH changes in nutrient solutions. Botanical Gazette 110: 604-
613.
Vyas, S., Guha, S., Bhattacharya, M. and Rao, I.U., 2009. Rapid regeneration of plants of Dendrobium
lituiflorum Lindl. (Orchidaceae) by using banana extract. Scientia Horticulturae 121: 32-37.
Zeng, S., Wu, K., Teixeira da Silva, J.A., Zhang, J., Chen, Z., Xia, N. and Duan, J. 2012. Asymbiotic seed
germination, seedling development and reintroduction of Paphiopedilum wardii Sumerh., an
endangered terrestrial orchid. Scientia Horticulturae 138: 198-209.
Page 210
ISBN 978-967-10840-4-5
Proc. Int. Conf. Plt. Phy. 2014
First Published, 2015
204
Formation of Callus in Hylocereus polyrhizus Using Immature Flower Parts
Yap, L.V.*, Davies, J.J., Nur Izzati, M. and Nur Farhana, A.H.
Faculty of Science, the University of Nottingham Malaysia Campus, Jalan Broga, 43500 Semenyih,
Selangor Darul Ehsan, Malaysia.
*E-mail: [email protected]
Introduction
Red pitaya (Hylocereus polyrhizus) is a tropical fruit that is well sought after for its nutritive values (Wu
et al., 2006), high economic value and potential in the ornamental and fruit production industries (Le
Bellec et al., 2006). This red fleshed pitaya is preferred by the farmer for its higher market value
compared to the white fleshed Hylocereus undatus. Red pitaya had recently been reported as one of the
important fruit crops in South East Asia with increasing cultivation land area for each year (Halimi and
Satar, 2007). Naturally, Hylocereus spp. propagates via stem cuttings and seed germinations but these
conventional methods have many weaknesses. Insufficient planting material for propagation had resulted
in low multiplication rate; approximately 50 cm long of the cuttings are needed to produce well
established plantlets. Seed derived plants have long juvenile period and delay in fruit production even
though the seed germination efficiencies were reported to be acceptable. Such drawbacks of propagations
are not commercially feasible and were not preferred by the farmers (Le Bellec et al., 2006). Therefore, in
vitro tissue culture serves as a good alternative for pitahaya vegetative propagation as an unconventional
technique for massive plantlet productions (Dhanayake and Ranawake, 2011).
Research on the tissue culture of Hylocereus spp has been so far limited to using young stems (Viñas et
al., 2012), joints (Mohamed-Yasseen, 2002), seeds (Rodziah et al., 2010) and immature ovules and
embryos (Cisneros and Tel-Zur, 2010) as explants. Most of them were concentrating on micropropagation
producing multiple shoots. Therefore, the aim of this study was to develop a protocol for in vitro
establishment and callus formation of H. polyrhizus using various parts of flower bud as explants.
Material and Methods
Preparation of explants
Flower buds of approximately 8 to 10cm in length were obtained from a dragon fruit farm in Lenggeng,
Negeri Sembilan. These immature flower buds were kept in a cool box and were transported to the
laboratory for immediate use. The flower buds were stripped of all opened sepals and rinsed under
running tap water for approximately 5 min. They were then subjected to surface sterilization with 70%
ethanol for 1 min followed by 20% commercial bleach (1% (v/v) sodium hypochlorite) for 20 min with
constant agitation. The flower buds were then rinsed three times with sterile distilled water before the
excision of various flower parts was performed. The sepals, petals, styles and stigmas of the flowers were
excised, cut into the size of 0.5x0.5 mm (sepal and petal) or at the length of 0.5 mm (style and stigma).
The cylindrical style segments were then cut longitudinally into two. The explants were placed in petri
dishes with moistened filter papers for the experiments.
Culture conditions
Explants were cultured horizontally on the medium in petri dishes. The cultures were placed under a
photoperiod of 16 h (3,000 lux) at 24 to 25 OC.
Page 211
ISBN 978-967-10840-4-5
Proc. Int. Conf. Plt. Phy. 2014
First Published, 2015
205
Determination of the best explant for callus induction
To determine the best explant for callus formation, all four types of explants described earlier were
cultured on MS medium supplemented with 2.0 mg/L BAP and 2.0 mg/L NAA. The cultures were put
under culture conditions as described for four weeks (28 days).
Effects of various plant growth hormones on the proliferation of callus using styles as explants
Various cytokinins and auxins were tested individually to see their effects on H. polyrhizus styles for
callus production. The cytokinin tested were 6-Benzylaminopurine (BAP), thidiazuron (TDZ) and kinetin
(Kn) while the auxin were indole-3-acetic acid (IAA), naphthalene acetic acid (NAA) and 2,4-
dichlorophenoxyacetic acid (2,4-D). These hormones were tested at the concentration of 2.0mg/L.The
cultures were put under culture conditions as described for four weeks (28 days).
Experimental design
All experiments were conducted using completely randomized block design. Ten explants were used in
each treatment and each experiment was repeated three times.
Statistical analysis
Non-invasive data was used to prevent contamination. Percentage of explants that produced callus, and
the surface area of the callus formed after the designated culture period were evaluated. The data were
evaluated by analysis of variance.
Results and Discussion
Determination of the best explant for callus induction
Physical changes of the explants were observed after a few days of culture. The styles were expanded in
size while the sepal curled inward into the medium. The edges of petal and the stigma began to have some
sign of browning. Sepal was the first to show signs of callus formation after one week of culture with
16.0% of the sepal explants producing calli (Figure 1). The percentage of callus formation for sepal
explants increased slowly to 24.0%, 32.0% and 45.3% after 2, 3 and 4 weeks of culture respectively.
Though the petal responded slowly to the medium, high percentage of the explants produced calli (80.0%)
after 4 weeks. The style explants started to produce some calli after 2 weeks of culture (12.0%) but the
percentage increased quickly to 98.7% after 3 weeks, and all style explants produced calli after 4 weeks.
Stigma explants have failed to produce callus and turned brown after 4 weeks (Figure 2). The calli
produced by various types of explants differ from one another. The initial calli on sepal explants were
loosely packed and light green in colour (Figure 3). The calli then developed into mixture of various
shades of green with scarce clumps of whitish callus towards the end of 4 week culture. Calli from the
petal explants on the other hand were either whitish or yellowish (Figure 4).
Page 212
ISBN 978-967-10840-4-5
Proc. Int. Conf. Plt. Phy. 2014
First Published, 2015
206
Figure 1. Percentage of various H. polyrhizus explants producing calli after 4 weeks of culture. As
expected, wounded surfaces of the explants have high tendency to produce callus (Slater,
2008).
Some of these calli changed into compact and light green clumps at the end of 4 weeks. The style explants
expanded to approximately three times its original size and produced abundance of calli (Figure 5).
Interestingly, the style explants produced some red calli (Figure 6), resembling the peel colour of ripe
dragon fruit. The red callus appeared randomly and in mixture with green or whitish calli or sporadic
especially the explants that are closer towards the ovary. The red callus was not found on callus formed
from sepal or petal.
Figure 2. Fresh H. polyrhizus stigma explants (1)
curved after 1 week (2), slowly turned brown
after 2 weeks (3), and became entirely brown
after 4 weeks culture (4).
Figure 3. H. polyrhizus sepal explants were thin
when fresh (1) but thickened after 1 week (2),
produced light green callus on the 3rd
week (3),
and at the end of the 4th week, some calli turned
whitish (4).
Page 213
ISBN 978-967-10840-4-5
Proc. Int. Conf. Plt. Phy. 2014
First Published, 2015
207
Figure 4. White petal explant of the H. polyrhizus
(1) turned yellowish and slightly transparent after
1 week (2); the edges turned brown on the 3rd
week and some whitish loosely packed calli were
produced (3). The calli proliferated on the 4th
week (4).
Figure 5. The style explants of H. polyrhizus were
yellowish when fresh (1), slowly expanded and
turned greenish on week 2 (2), the calli were
abundant on week 3 (3) and the edges of the
explants were fully covered with calli on week
4(4).
Figure 6: The red calluses produced from the H. polyrhisuz style explants were random, either appeared
with mixture of other calluses (1) or sporadic (2).
To avoid contamination, non-invasive surface area measurement was used to measure the quantity of calli
produced by the various explants. At the end of four weeks, style explants produced highest amount of
callus with a mean surface area per explant of 173.3 mm2
(Table 1). Zakaria and colleagues (2010) also
found out that the style of Citrus grandis was also very responsive to culture media and had demonstrated
high capacity of callus production. Undoubtedly, the increase in size of the style during culture had also
contributed to the larger wounded surface, thus giving more opportunity to produce calli. Sepal explants
came second with a mean surface area of 144mm2. Petal produced significantly lower amount of callus of
82.3 mm2 only.
3 4
Page 214
ISBN 978-967-10840-4-5
Proc. Int. Conf. Plt. Phy. 2014
First Published, 2015
208
Table 1. Mean surface area of calli per explant induced from various parts of H. polyrhizus immature
flowers after 4 weeks of culture on MS medium supplemented with 2.0mg/L of BAP and NAA
each. Explant Mean surface area (mm
2)
Sepal 144.0 ± 16.2a
Petal 82.3 ± 6.7b
Style 173.3 ± 18.9a
Stigma 0.0 ± 0.0c
Effects of various plant growth hormones on the proliferation of callus using styles as explants
The potential of the style explants to produce callus was further investigated using single hormone
treatments of cytokinins and auxins at the concentration of 2.0mg/L. It was shown that none of the
explant produced callus when cultured on medium with auxin (IAA, NAA and 2,d-D) (Table 2). They all
either did not respond to the culture media or turned brown at the end of four weeks culture. The explants
seemed to only respond to cytokinins, BAP and TDZ, with 100% of the explants produced callus. Kn had
failed to induce any callus. BAP proved to be better and had induced callus formation with significantly
higher mean surface area of 60.2 ± 5.7mm2. The calli induced by TDZ were slightly lower at 42.8 ±
3.4mm2. The results showed that culture medium with combination of cytokinin and auxin hormones are
superior over medium with single hormone. Similar observation was reported on three types of Cactaceae
(Giusti et al., 2002) and Kigelia pinnata shoot tips (Thomas and Puthur, 2004).
Table 2. The mean surface area of calli produced from style explants when cultured on various plant
growth hormones at the concentration of 2mg/L and cultured for 4 weeks.
Hormone Callus (%) Mean surface area (mm2)
BAP 100.0a 60.2± 5.7a
TDZ 100.0a 42.8± 3.4b
Kn 0.0b 0.0± 0.0b
IAA 0.0b 0.0 ± 0.0b
NAA 0.0b 0.0 ± 0.0b
2,4D 0.0b 0.0 ± 0.0b
Conclusions
The style explant of H. polyrhizus was found to be very responsive to culture media of MS supplemented
with 2.0mg/L of BAP and NAA, producing calli with high mean surface area of 173.3mm2. The style
explants seemed to be responsive to cytokinin instead of auxin. Further research is required to look into
the various combinations of cytokinin and auxin at various concentrations to produce more calli.
References
Cisneros, A. and Tel-Zur, N. 2010. Embryo rescue and plant regeneration following interspecific crosses
in the genus Hylocereus (Cactaceae). Euphytica 174(1): 73-82.
Dahanayake, N. and Ranawake, A.L. 2011 Regeneration of dragon fruit (Hylocereus undatus) plantlets
from leaf and stem explants. Tropical Agricultural Research and Extension 14(4): 85-89.
Giusti P., Vitti D., Fioccetti F., Colla G., Saccardo F. and Tucci M. 2002. In vitro propagation of three
endangered cactus species. Scientia Horticulturae 95: 319-332.
Halimi, M.A. and Satar, M.G.M. 2007 Mata Naga, Dewan Bahasa danPustaka, Kuala Lumpur, Malaysia.
Page 215
ISBN 978-967-10840-4-5
Proc. Int. Conf. Plt. Phy. 2014
First Published, 2015
209
Le Bellec, F., Vaillant, F. and Imbert, E. 2006. Hylocereus spp.: a new fruit crop, a market with a future.
Fruits 61: 237-250.
Mohamed-Yasseen, Y. 2002. Micropropagation of pitaya (Hylocereus undatus Britton et Rose). In Vitro
Cellular & Developmental Biology-Plant 38(5): 427-429.
Rodziah, K, Ahmad Lutfi, L., Rokiah, Z. and Hafsah, J. 2010 Basal media for in vitro germination of red-
purple dragon fruit Hylocereus polyrhizus. Journal of Agrobiotechnology 1: 87-93.
Thomas, T.D. and Puthur, J.T. 2004 Thidiazuron induced high frequency shoot organogenesis in callus
from Kigelia pinnata L. Botanical Bulletin of Academia Sinica 45: 307-313.
Viñas, M., Fernández-Brenes, M., Azofeifa, A. and Jiménez, V.M. 2012. In vitro propagation of purple
pitahaya (Hylocereus costaricensis [FAC Weber] Britton & Rose) cv. Cebra. In Vitro Cellular
and Developmental Biology – Plant 48(5): 469-477.
Wu, L.C., Hsu, H.W., Chen, Y.C., Chiu, C.C., Lin, Y.I. and Ho, J.A. 2006. Antioxidant and
antiproliferative activities of red pitaya. Food Chemistry 95(2): 319-327.
Zakaria, Z., Zakaria, S., Khalid, A.H. and Mohd Ishak, M.A. 2010 Induction of callus formation from
different parts of Citrus grandis (OSBECK) flowers. Biotopia 17(1): 1-7.
Page 216
ISBN 978-967-10840-4-5
Proc. Int. Conf. Plt. Phy. 2014
First Published, 2015
210
Effect of in vitro Vertical Cutting and Leaf Decapitation on Shoot
Multiplication of Janggut Adam (Tacca integrifolia)
Mohd Zulhilmi, M.1,2
, Abdullah, T.L.1,*
, Maheran, A.A.2 and Stanslas, S.
3
1Department of Crop Science,
2Department of Agrotechnology, Faculty of Agriculture, Universiti Putra
Malaysia, 43400 Serdang, Selangor Darul Ehsan, Malaysia. 3Department of Medicine, Faculty of Medicine and Health Sciences, Universiti Putra Malaysia, 43400
Serdang, Selangor Darul Ehsan, Malaysia.
*E-mail: [email protected]
Introduction
In Malaysia, one out of 10 species of bat flowers, the Tacca integrifolia or “Janggut Adam” can be found
in the tropical rain forest areas and has been specifically used in Malay traditional medicine as well (Nor
Aini et al., 2008). In Malaysia, it is also known as Belimbing Tanah dan Keladi Murai (Faridah and
Shamsul, 2004). Its values are not only the medicinal properties but also the chemical compounds
extracted from rhizome which are able to fight against plant pest (Nuanla and Sruamsiri, 2000). Besides,
its inflorescence has an outlandish bract (rabbit-look) and long bracteoles (cat’s whiskas-look) with rich
dark maroon to purple colour making this plant favourably use as an ornamental purpose.
Indiscriminate collections by native people, habitat destruction and over exploitation for medicinal
purposes are the main factors that have threatened the survival of this species. Therefore conservation of
T. integrifolia is now a matter of universal concern. Normally, the bat flower propagates from seeds and
stem budding but plants and seeds are rarely collected from the natural forest. Moreover, its seed
germination rate is quite low. Tissue culture technique has been used for the in vitro mass propagation
serving the future requirement instead of the conventional propagation method. The micropropagation of
T. chantrieri has been done using young leaves and leaf stalks of seedling via callus induction (He et al.,
2002). There has been a report of using axillary and adventitious shoots of seedling as explants for in
vitro propagation of T. chantrieri (Charoensub et al., 2008). This research is carried out to determine
effect of in vitro vertical cutting and decapitation on shoot multiplication of T. integrifolia.
Materials and Methods
Plant materials
The plant materials used in this study were collected from local forest in Ayer Hitam Reserve Forest,
Puchong, Selangor.
Surface sterilization of explants
The sterile seeds for the sterile seedlings were prepared by removal of sterile seeds from sterilized freshy
fruits (berry like). The whole cleaned fruits were dipped in 95% ethanol and directly flamed 2 – 3 times
prior to dissection and removal of the sterile seeds. Mature T. integrifolia seeds were immersed in 70%
ethanol for 1 min prior to surface-sterilization in 10% commercial bleach, Clorox (6%w/w sodium
hypochlorite), for 25 – 30 min and rinsed 3 times with sterile water. The sterilized seeds of T. integrifolia
were grown in culture bottles containing 10 ml of half strength Murashige and Skoog (½ MS). The pH of
all culture medium was adjusted to 5.7 with 0.1 N NaOH or HCl before adding 0.75% agar and
autoclaving at 1x10⁵ Pa, 121 oC for 15 min. The cultures were placed under light conditions (300-350 lux
illumination for a 16 h photoperiod) at 27±2 oC.
Page 217
ISBN 978-967-10840-4-5
Proc. Int. Conf. Plt. Phy. 2014
First Published, 2015
211
In vitro vertical cutting, leaf decapitation and media
Shoot tips (2–4 cm in length) derived from 16 week-old seedlings were used as explants (Figure 1A). The
shoot tips were cut directly by vertical cutting (Figure 1B) and for the decapitation method, 2–3 leaves
were removed using a sterile blade (Figure 1C). The explants were cultured on MS hormone-free medium
(MS) and MS with 1 mg/L of BAP (MSH). The number of shoot bud, leaves and root were counted after
12 weeks of culture.
Figure 1. Sixteen weeks-old in vitro seedling were used as explants. (A) intact, (B) vertical cutting and
(C) leaf decapitation method for shoot bud induction.
Experimental design and data analysis
All experiments were performed in a completely randomized design (CRD). Each experiment included
three replicates, with five planlets per treatment. The number of new shoots per explants, number of roots
and number of new leaves were determined for each experiment after 12 weeks of culture. Analysis of
variance (ANOVA) was performed by using SAS version 9.1 and mean separation with the LSD test. A
significance level was set at P=0.05.
Results and Discussion
The 16 week-old germinated seedlings maintained in ½ MS medium were used as explants. For each
explant, the roots were cut to determine the effect of the growth regulators. The different types of method
showed significant differences in shoot multiplication of T. integrifolia.
The highest number of shoots was observed when the shoot tips were decapitated as compared to other
methods. After 12 weeks in culture, the decapitated explants produced an average of 3.3 new shoots on
MS medium supplemented with 1 mg/L BAP, whereas those vertical cutting and intact method showed
less shoots (Table 1). The new shoot emerged from tightly grown and around cutting area (Figure 2C).
The newly formed young shoots could grow readily on basal MS medium without plant growth regulator
for shoot proliferation. Moreover, the original plant of vertical cutting produced callus on MS medium
supplemented with 1 BAP, probably due to heavy wounding of the explants (Figure 2B).
There were significant differences between the composition of culture medium on mean number of shoots
and roots produced (Table 1). Shoot multiplication was significantly higher on MSH medium than on MS
medium. In combination treatments, there were significant differences between different technique of
shoot multiplication and composition of culture medium (Table 1). The highest number of shoots was
observed on leaf decapitated seedling cultured on MSH medium at 3.33, followed by intact seedling on
Page 218
ISBN 978-967-10840-4-5
Proc. Int. Conf. Plt. Phy. 2014
First Published, 2015
212
MSH at 1.33 and vertically cut seedling on MSH at 0.67. No development of shoot was observed in the
other three combination treatments.
Development of axillary buds following decapitation is a common phenomenon observed in plants. The
removal of the apices and whole leaves is used practically in propagation of Euphorbia pulcherrima via
shoot cuttings (Wilkins, 1988). In this study, the attempts to maximize the production of T. integrifolia
shoots through vertical cutting and leaf decapitation technique were successful. Leaf decapitated explant
induced the highest shoot multiplication using shoot tips as explants placed on MS medium supplemented
with 1 BAP. Orlikowska et al. (2000) reported that defoliated shoot tips produced significantly more
axillary shoots in comparison to non-defoliated shoot tips on Codiaeum variegatum Blume var. pictum
Muell. Arg. cv. Excellent. This effect was caused by the weakling of shoots (marked by small diameter)
due to defoliation.
Table 1. Effect of vertical cutting, leaf decapitation and its combination with media on shoot
multiplication and growth of T. integrifolia after 12 weeks of culture.
No. of shoot No. of root No. of new leaves
Method
Intact 0.67b 0.00b 2.67a
Vertical cutting 0.33b 0.67a 0.00c
Decapitation 1.67a 0.83a 1.17b
Media MS 0.00b 1.00a 1.22a
MSH 1.78a 0.00b 1.33a
Combination
Intact x MS 0.00c 1.33a 2.00b
Intact x MSH 1.33b 0.00b 3.33a
Vertical x MS 0.00c 0.00b 0.00c
Vertical x MSH 0.67b 0.00b 0.00c
Decapitation x MS 0.00c 1.67a 1.67b
Decapitation x MSH 3.33a 0.00b 0.67c
MS= Free-hormone MS medium, MSH= MS medium supplemented with 1 mg/L BAP. Means with the same letter
are not significantly different according to Least Significant Different (LSD) test at P=0.05%
Figure 2. Shoot proliferation by intact (A), vertical cutting (B) and decapitation method (C) for shoot
multiplication of T. integrifolia. Shoot primordia (yellow arrow) and normal new shoots (red
arrow) were obtained when planlets were cultured on MS medium supplemented with 1 mg/L
BAP after 12 weeks culture.
Page 219
ISBN 978-967-10840-4-5
Proc. Int. Conf. Plt. Phy. 2014
First Published, 2015
213
Conclusions
Micropropagation of T. integrifolia can be done by culturing sterile seedlings. Decapitation method is
recommended with MS medium supplemented with cytokinin to obtain multiple shoots. Therefore, this
technique presents an efficient system of in vitro clonal propagation compared to seed propagation for
rapid multiplication, production of disease-free plants, non-seasonal production, germoplasm
conservation and facilitating their easy exchange.
References
Charoensub, R., Thiantong, D. and Phansiri, S. 2008. Micropropagation of bat flower plant, Tacca
chantrieri Andre. Kasetsart Journal (Natural Science) 42(5): 7-12.
Faridah Hanum, I. and Shamsul K. 2004. A Guide to the Common Plants of Ayer Hitam Forest, Selangor,
Peninsular Malaysia. Universiti Putra Malaysia Press, Serdang: 219.
He, H.Y., Lan, Q.Y. and Zhang, Y.J. 2002. In vitro propagation of Tacca chantrieri. Journal of Guanxi
Agriculture and Biology Science 21: 107-109. (in Chinese with English abstract).
Nor Aini, A.S., Merrina, A., Stanslas, J. and Sreramanan, S. 2008. Cytotoxic potential on breast cancer
cells using selected forest species found in Malaysia. International Journal of Cancer Research 4:
103-109.
Nuanla, R. and Sruamsiri, P. 2000. Insecticidal activity of bat flower plant crude extraction against
common cutworm. In Seminar Report on Tendency of the Medicinal Plant Improvement in
Thailand. 13-14 September 2000. Office of the National Research Council of Thailand. Bangkok:
200-209.
Orlikowska, T., Sabala, I. and Kucharska, D. 2000. The effects of leaf and shoot tip removal and explants
orientation on axillary shoot proliferation of Codiaeum variegatum Blume var. pictum Muell.
Arg. cv. Excellent. Scientia Horticulturae 85: 103-111.
Sanatombi, K. and Sharma, G.J. 2007. Micropropagation of Capscicum annuum L. Notulae Botanicae
Horti Agrobotanici Cluj-Napoca 35(1): 57-64
Wilkins, H.F. 1988. Techniques to maximize cutting production. Acta Horticulturae 226: 137-143.
Page 220
ISBN 978-967-10840-4-5
Proc. Int. Conf. Plt. Phy. 2014
First Published, 2015
214
CHAPTER 5
NUTRITION, PLANT-MICROBE
INTERACTION AND INNOVATIVE
PRACTICES
Page 221
ISBN 978-967-10840-4-5
Proc. Int. Conf. Plt. Phy. 2014
First Published, 2015
215
Mycorrhizal Symbiosis in Managing Phosphorus Efficiency in Theobroma
cacao L.
Baon, J.B.
Indonesian Coffee and Cocoa Research Institute, Jl. P.B. Sudirman 90, Jember, Indonesia 68118
E-mail: [email protected]
Introduction
For many tropical countries of Asia, Africa and South and Central America, cocoa (Theobroma cacao L.)
is an important plantation crop (Hartemink, 2005). Meanwhile soils of most cocoa growing regions are
acidic and infertile which caused by nutrient loss by leaching, soil erosion and intensive longterm
cultivation (Wessel, 1971). In those highly weathered tropical soils, phosphorus (P) deficiency or
unavailability has been generally identified as one of the major limiting factors for cocoa production
(Smyth, 1966). As one of the most important nutrients, P plays a main role in development and
reproduction for growth of cocoa. To improve the P nutrition of plants, the traditional approach is by
applying large amounts of P fertilizers to soils. It has been estimated that around 35 million tons of P-
based fertilizers (in terms of P2O5) are applied worldwide every year (IFIA, 2013). However, the use
efficiency of applied P is generally very low, ranging from 10% to 30% in the year applied (McLaughlin
et al., 1991). Continuous application of P fertilizers also increases the risk of P loss from soil to water,
causing toxic algal blooms in water bodies (Barber, 1984). Improving plant uptake of P from soil is an
obvious alternative to the management of low P soils and the enhancement of P efficiency soil P.
Phosphorus efficiency is usually known either as P uptake efficiency or as P use efficiency. P uptake
efficiency is usually defined as P uptake per plant, or per unit root biomass or root length, while P use
efficiency defined as plant biomass produced per unit of available P. Genetic variations in P uptake
efficiencies have been widely reported in many crops, such as cocoa (Baon and Winarno, 1998), coffee
(Baon et al., 1999), sorghum (Neumann and George, 2004) and millet and cowpea (Bagayoko et al.,
2000). Plant traits that can influence P uptake efficiency include rhizosphere acidification, root exudation
of organic anions, root morphology, uptake kinetics and symbiotic association with mycorrhizal fungi
(Smith et al., 2011). Symbiotic association between plants and arbuscular mycorrhizal fungi (AMF) is
widespread and of particular importance in improving plant P uptake efficiency (Smith and Read, 2008).
Most plants are engaged in symbiotic relationships with mycorrhizal fungi, and our works have shown
that cocoa is a mycorrhizal dependent plant (Baon, 1994). The beneficial effects of AMF are due mainly
to the ability of mycorrhizal fungal hyphae to acquire P well beyond the limits of the rhizosphere
depletion zone (Li et al., 1991), especially on soils with low available P (Smith et al., 2011). However, the
advantages of increased P-uptake and growth over comparative, non-mycorrhizal plants at low P diminish
with increasing soil P availability (Rai et al., 2013). As a key component of soil microbiota in
rhizosphere, AMF may change several aspects of plant physiology and some nutritional properties of
rhizospheric soil. The aim of this review paper was to discuss current developments and future trends
concerning the significance of mycorrhizal fungi in contributing P efficiency of cocoa plants.
Phosphorus Need in Cocoa
Once converted from forest to cocoa farms, tropical soils tend to have structure suitable for crop growth
but lack quantities of plant essential nutrients required for long-term agricultural productivity (Lindell et
al., 2010). Commonly, productivity of the continuously cultivated tropical soils is limited by insufficient
supplies of soil minerals, particularly P (Wood and Lass, 2001). Depletion of soil P pools continues
through sequential harvest and removal of cocoa products (Cardoso et al., 2003). Application of inorganic
P containing fertilizers to remedy the infertility of these soils is not an option for many subsistence cocoa
Page 222
ISBN 978-967-10840-4-5
Proc. Int. Conf. Plt. Phy. 2014
First Published, 2015
216
farmers in developing countries without money to buy, or means to transport them (Appiah et al. 1997). It
is possible that with better management, fertility of these soils can be maintained for a longer period,
enhancing their capacity to sustain cocoa productivity (Lindell et al., 2010).
Phosphorus is the second most important macronutrient, second to nitrogen, that is crucial for the stability
and continued existence of cocoa life (Wood and Lass, 2001). There are many principal roles of P in the
plant physiological processes, such as photosynthesis, utilization of sugar and starch, and energy transfer.
Aside from this vital metabolic role, P is an indispensable structural component of numerous molecules,
including nucleic acids, which are the building blocks of genes and chromosomes in the cell nucleus and
are obligatory for cell division and formation of meristematic tissues (Marschner, 1995). For maximum
yield, cocoa plants are in need for a sufficient amount of P from the very early stages of growth.
Therefore, direct availability of P determines the crop growth, and limited supply of P results in yield loss
(Grant et al., 2005). A regular insufficient early-growth P supply can limit crop yield and thus P fertilizer
is commonly applied to ensure that sufficient P is available to optimize crop production.
Removal of nutrients from cocoa ecosystems includes yield (beans and husks), immobilization in stem
and branches, and leaching of nutrients below the rooting zone. Most nutrients in cocoa ecosystems are
lost by the harvest of beans and husks. About 4 kg P is removed with 1000 kg dry beans, while when the
husks are also removed, the amount is increased to about 6 kg P. Nutrients immobilized in the stem and
branches of cocoa and shade trees are also considered lost for the system as they are excluded from
nutrient cycling. Immobilization of nutrients is particularly important for young cocoa, but is unimportant
for mature cocoa (Wessel, 1971).
Mycorrhizal Dependency of Cocoa
There is a wide variation in the mycorrhizal dependency of agricultural crop species, even inter clones or
hybrids, usually related to root morphology, root hair formation and seed P content (Smith and Read,
2008). Variation between clones of cocoa (Baon and Winarno, 1998) and varieties of coffee (Baon et al.,
1999) has also been shown. For cocoa plants, the work showed that there is a tendency for greater reliance
on symbiosis in the older cultivated genotypes than in newly cocoa clones. Breeding and choice of
cultivar are thus important tools in AM management.
Arbuscular mycorrhizal fungi are associated with improved growth of cocoa crop due to increased
nutrient uptake (Widiastuti and Baon, 1994), production of growth promoting substances, tolerance to
drought, salinity and transplant shock and synergistic interaction with other beneficial soil
microorganisms such as N-fixers and P-solubilizer (Smith and Read, 2008). Symbiotic association of
cocoa roots with VA-fungi often result in enhanced growth because of increased acquisition of P and
other low mobility mineral nutrients (Baon, 1996). Advantages of AM symbiosis over the non-
mycorrhizal state of among cocoa clones are inextricably associated with root architecture, in that plants
with extensive, branched root systems, very fine roots and long root hairs (Baon et al., 1994) tend to show
relatively low improvement in growth when they are mycorrhizal, even in low P soils (Simpson et al.
2011).
Factors Affecting Phosphorus Efficiency
There are two factors controlling the rate of P absorption or P influx into roots (Rai et al., 2013). First, the
quantity of various nutrients, available for plant, including C, N, P and others, determine the capability of
the root surface area (root morphology) to absorb P from the soil, and controls P absorption by the plant,
all else being equal. The more P held by the plant (internal P reserve) the more can be used to produce
root surface area in order to acquire P from the soil (Bloom et al. 1985). Therefore, the most critical of
Page 223
ISBN 978-967-10840-4-5
Proc. Int. Conf. Plt. Phy. 2014
First Published, 2015
217
these nutrient elements under the control of the plant is P itself. Second factor is the efficiency with which
the internal P reserve is used to absorb P from the soil. There is no immediate negative consequence to
inefficient use of a non-limiting resource, simply because it is available in non-limiting amounts.
However, immediate benefit is a consequence of more efficient use of plant P, because P is the limiting
resource. Koide (1991) defined the efficiency with which the internal P reserve is used to absorb P from
the soil as the phosphorus efficiency index (PEI). The PEI is analogous with which determines how
efficiently the plant’s current dry mass is used to gain more mass. It can often be expressed as the relative
growth rate. Similarly, PEI is defined as a measure of how efficiently the plant’s internal P reserve is used
to gain more P. Thus, phosphorus influx into roots is a function of both plant P content and PEI, and
accordingly, growth rate is a function of the PUE, the P content and the PEI.
Cocoa Growth and Phosphorus Efficiency
Presence of shade trees in cocoa farm system may delay decomposition rate of organic matter, suggesting
slower but sustained release of available nutrients into the topsoil. Isaac et al. (2007) showed that cocoa
under artificial shade, both with and without fertilization, exhibited the greatest nutrient responses as
compared to unfertilized monoculture cocoa, where P uptake was very stimulated. When fertilizers are
undesirable or unavailable, intercropping of cocoa with appropriately selected shade trees will not
competitively suppress early growth of cocoa but will improve light regulation and nutritional status of
cocoa saplings.
Nutrient efficiency is mainly considered as dry matter produced per unit nutrient element concentration in
dry matter (Gourley et al., 1994), which can also be termed as the internal nutrient requirement.
Considering yield parameters, efficiency with regard to a specific mineral nutrient, is the capability of any
clones or hybrids in producing dry matter, in a soil limiting in that particular nutrient element (Buso and
Bliss, 1988). Agronomic efficiency is defined as the total harvestable amount per unit of growth limiting
nutrient element applied in the soil (Caradus and Woodfield, 1990). External efficiency is the sum of
nutrient content in soil primarily taken up by plants to produce a certain fraction of whole dry matter
produced (Fohse et al., 1988). Some researchers have used the term nutrient efficiency ratio, which is
calculated as the reciprocal of the nutrient concentration in the whole plant (Gourley et al., 1994). Other
workers have used the term nutrient uptake efficiency (Buso and Bliss, 1988). Uptake efficiency is
defined in terms of total uptake per plant or specific uptake per unit root length (Marschner, 1995).
Internal P management, like the effects of P stress on yield components and the way the plant distributes
the acquired P among shoot organs, varies widely between genotypes (Sattelmacher et al., 1994).
However, even greater genetic variation has been found in traits for acquisition of nutrients by roots
(Caradus and Woodfield, 1990). Root morphological characters, such as root length, surface area, root
radius, and density of root hairs, are regarded as having primary importance for P-uptake efficiency
(Sattelmacher et al., 1994). Root morphology is determined not only by genetic but also by environmental
factors, including soil P availability (Hajabbasi and Schumacher, 1994). Plasticity of the root system can
be exploited for developing P efficient cultivars. Nuruzzaman et al. (2005) hypothesized that P-
acquisition efficiency in plant species varies with their rhizosphere volume and chemistry.
The second component of uptake efficiency is root physiological activity such as differing uptake
kinetics, i.e. Imax, Km and Cmin, which result in different nutrient uptake rates per unit root and time
(Steingrobe and Classen, 2000). Plants differ in P-absorbing capacity of their roots, and even inter-
specific variations have been found (Krannitz et al., 1991). The parameter found to differ most among
genotypes is the maximum net influx, Imax and plants are considered efficient when Imax is high.
However, when soil P availability is low, the rate limiting step in P uptake is its transport to the root
surface and a high Imax is useless (Jungk and Claassen, 1997). Other mechanisms or traits that affect
Page 224
ISBN 978-967-10840-4-5
Proc. Int. Conf. Plt. Phy. 2014
First Published, 2015
218
specific uptake efficiency include chemical mobilization of nutrients by root exudates, induced pH
changes in the rhizosphere and AM associations (Marschner, 1995).
When a plant is P deficient, two factors control plant growth. One is the rate of P absorption or P influx.
The other is the ratio of dry mass increase to P content increase, which can be thought of as the efficiency
with which P is used to produce dry matter, the P-use efficiency (PUE) (Koide, 1991). The PUE is
expected to vary according to tissue type. Seeds, for example, often have lower PUE than stems, because
seeds require more P to produce a given dry mass than do stems. Variation in PUE also occurs among
plant species, hybrids and clones (Christie and Moorby 1975), and as a consequence of variation in P
availability and mycorrhizal colonization (Haynes et al., 1991).
Mycorrhizal Role in Phosphorus Transport
Accordingly, plants have evolved a range of strategies that increase either Pi uptake capacity or
availability of Pi in soil. The most widespread of these strategies worldwide is AM symbiosis (Cheng et
al., 2011). AM symbioses are widespread in the plant kingdom and contribute significantly to plant P
nutrition and growth in natural ecosystems. Association of AM may improve P uptake from soil (Smith et
al., 2011). The ability of AM to enhance host-plant uptake of relatively immobile nutrients, in particular P
(Smith and Read, 2008), and their requirement for up to 20% of host photosynthate for establishment and
maintenance, is well accepted. Plant benefits with this association under nutrient-poor conditions
increasing phosphorus uptake by the host plant (Koide, 1991). Miller et al. (1995) reported that
disturbance of arable and no-till soil resulted in reduced AM development and subsequently less
absorption of P by seedlings of maize in the field. Neumann and George (2004) concluded that
mycorrhizal colonization seems to increase P uptake from dry soil. Therefore, mycorrhizal symbiosis may
improve the uptake of P by cocoa plants which are commonly grown in dry and hilly area.
P is critical for plant growth and makes up about 0.2% of dry mass, but it is one of the most difficult
nutrients for plants to acquire. In soil, it may be present in relatively large amounts, but much of it is
poorly available because of the very low solubility of phosphates of iron, aluminium, and calcium,
leading to soil solution concentrations of 10 mM or less and very low mobility (Bucher, 2007). In
consequence, uptake of orthophosphate (Pi) by root epidermal cells including root hairs leads to lower Pi
concentrations in the rhizosphere, as replacement does not keep pace with uptake. Plants and fungi take
up P as negatively charged Pi ions (H2PO4–), which possess additional problems, because the
concentration in cells is about 1000-fold higher than in the soil solution and the cell membrane has an
inside-negative electric potential. Pi uptake, therefore, requires metabolic energy and involves high-
affinity transporter proteins (Bucher, 2007). Mycorrhizal plants deplete phosphate to lower levels and to a
much larger soil volume per unit root length than nonmycorrhizal plants. Influx of P in roots colonized by
AM fungi can be three to five times that in nonmycorrhizal roots (Smith and Read, 2008). Jakobsen
(1986) reported a two to three times increase in influx of P to roots of pea and clover plants, respectively,
due to the effect of mycorrhiza.
Plants grown at high P in the presence of mycorrhizae accumulated only 88% of biomass of plants grown
at high P in absence of mycorrhizae, indicating that mycorrhizae can reduce plant growth when not
contributing to the symbiosis. Although a beneficial role of mycorrhizal symbiosis has been frequently
observed, there have been cases reported where mycorrhizal inoculation has led to a decrease in plant
productivity, particularly in AM plants (Schroeder and Janos 2004). Similar result on cocoa was shown
by the work of Baon (1996) which showed that in high P content soil, there was no improve in plant
growth even decrease in growth of mycorrhizal cocoa.
Page 225
ISBN 978-967-10840-4-5
Proc. Int. Conf. Plt. Phy. 2014
First Published, 2015
219
Plant response to AM inoculation is extremely variable both among and within species. Inoculation by
AM has a wide range of effects on different plant species in relation to P nutrition in different situations.
The effectiveness of AM fungi in increasing plant growth was observed to be closely correlated with root
hair (Baon et al., 1994), soil temperature and light intensity (Baon et al., 1995). Generally, the
development of AM inoculation seemed to follow a three phase growth curve i.e. a lag phase, a phase of
rapid growth and a phase of constancy or plateau phase with increase age of plants (Saif, 1986). Upon
mycorrhizal inoculation, increase in shoot growth is generally lower at the initial stage, and then increases
rapidly with age of plants (Bethlenfalvay and Linderman, 1992).
P Uptake Mechanism by Mycorrhiza
Leaching losses in cocoa ecosystems are much lower than under annual crops. Van Noordwijk (1989)
provide evidence for the “safety net” theory of tree crops such as in cocoa plants whereby nutrients
leached to a deeper soil horizon can be taken up by tree roots at great depths. The external hyphae of AM
extend from the root surface to the soil beyond the P depletion zone and have access to a greater volume
of undepleted soil than the root alone (Lambers et al., 2011). Some hyphae may extend more than 10 cm
from root surfaces (Rai et al., 2013) which is further than most root hairs. Also, the small diameter of
hyphae (20 to 50 μm) allows access to soil pores that cannot be explored by roots. Therefore, a root
system forming a mycorrhizal network will have a greater effective surface area (Richardson et al., 2011)
for absorbing nutrients and exploring a greater volume of soil than nonmycorrhizal roots. The volume was
calculated to be at least 100 times greater with mycorrhizal association than in its absence. Moreover,
mycorrhizal colonization may induce formation of lateral roots or increase root branching (Lynch and
Brown, 2001), further increasing the volume of soil explored.
Mycorrhizal plants can absorb more P at lower concentration in the soil solution than nonmycorrhizal
plants (Lynch and Brown, 2001). One possible explanation is that mycorrhizal hyphae have a higher
affinity (lower Km) for P than roots (Zhu et al., 2010). But this phenomenon is not necessary for
explaining improved P uptake by mycorrhizal roots. Barber (1984) explained that there is a very limited
concentration gradient around hyphae (i.e., minimal depletion zone) since the radius of hyphae is much
smaller than that of roots plus root hairs (0.005 mm versus 0.15 mm). Hence, P concentration in soil
solution around hyphae is always higher than in the P depletion zone around roots, and hyphae may
absorb more P in low P soil even without having a higher affinity for P.
Organic anion exudation in the rhizospheric environment plays a vital role in the bioavailability of soil P.
Mycorrhiza releases organic anions such as citrate, malate and oxalate, which can occupy sorption sites
that might otherwize mobilize P, or replace P in the sparingly soluble complexes with aluminium, iron
and calcium (Richardson et al., 2011). Thus it can enhance availability of P into soil solution, which
might be accountable for the greater release of organic forms of soil P (Wei et al., 2010). Mycorrhiza is
also reported to produce carboxylates, which influence ligand exchange, ligand-promoted dissolution of
P-bearing minerals such as Fe/Al oxides, and thus having a significant contribution in P mobilization.
Mycorrhiza was shown to induce increased proton efflux or pCO2 activity around the rhizosphere,
lowering pH to around 6.3 (Rigou and Mignard, 1994) resulting in greater solubilization of P,
predominantly in neutral to calcareous soils. Citric acid and siderophores produced by mycorrhizae can
enhance bioavailability of P supply in the soil more specifically in the case of Fe- or Al-bound P in acidic
soils (Haselwandter, 1995). Furthermore, mycorrhizae has been reported to produce alkaline
phosphatases, which can mobilize P from organic sources, and a low rate of this can have a long-term
impact on mobilizing phosphate (Tarafdar and Marschner, 1994). The hydrolysis of organic P by
extracellular phosphatases secreted by mycorrhizae, excretion of protons, hydroxyls and organic anions
and modifications of the redox potential around mycelium and roots of the mycorrrhizal association might
Page 226
ISBN 978-967-10840-4-5
Proc. Int. Conf. Plt. Phy. 2014
First Published, 2015
220
also hasten the release of P ions from soil to solution. Alteration in rhizospheric pH is also associated with
the soil-buffering capacity, microbial activities, and plant genotypes (Hinsinger et al., 2003). These
different mechanisms play a significant role, especially in response to phosphorus mobilization (Lambers
et al., 2011).
Management of Mycorrhial Symbiosis
Several researchers worldwide proposed rhizospheric microbial inoculants as integral and indispensable
components of integrated nutrient management systems (Adesemoye and Kloepper, 2009), particularly
regarding their ability to increase the availability of P for crops (Smith et al., 2011). Mycorrhizae play a
considerable role in alteration of the biochemical environment (Bhadoria et al., 2004) and in the
physiological characteristics of the rhizosphere, which can improve P accessibility in the rhizosphere.
Mycorrhizal inoculations can be used in cocoa plantations for stimulating rooting and growth, and thereby
transplant survival of cuttings and seedlings rose in sterilized nursery media, which is essential for the
establishment of the crop. The inoculation with appropriate AM fungi may give good results in plants
(Baon et al., 1994). Successful AMF establishment has been obtained in nursery of cocoa. Mycorrhizas,
through their role in increasing the natural resistance of plants to abiotic and biotic stresses and in
rendering their underground organs more efficient in exploiting soil resources, have opened interesting
possibilities for the production of high-quality micropropagated plants with low inputs (Gianinazzi et al.,
1990). AM fungi inoculation has been found to improve growth and nutrient uptake of cocoa plant
especially during seedling stage. The ability of the AMF to develop together without negative interactions
opens the possibility of creating a given diversified microbial-rich environment around cocoa roots,
beneficial for plantlet development and therefore increasing the levels of tolerance of plantlets for a large
spectrum of biotic and abiotic stresses, linked to their transplantation into the field.
Conclusions
Published works gathered so far in this review indicates that mycorrhiza is likely to have a significant
impact on P uptake by cocoa plants followed by its allocation and cycling. There is substantial evidence
from the cocoa farm system that mycorrhizal symbiosis facilitate enhancement of phosphorus efficiency.
Mechanisms of mycorrhizal mediated advantages have been identified at inside cocoa plant roots and
outside cocoa plant roots and new findings continue to highlight the importance of the AMF association
in this system. However, the responses of cocoa growth and production to P-limitation can only be
understood when the interactions of this limitation with multiple other abiotic resources and biotic
interactions are taken into consideration. With rising prices for P fertilizers, the use of mycorrhiza and the
breeding of cocoa clones and hybrids with adapted root systems or exudation strategies are possible tools
in maintaining or increasing productivity. While not all cocoa plants both as seedlings or plantlets form
AMF associations, there is a prospect for development of early association by inoculation either in
laboratories or during rising in nursery.
References
Adesemoye, A.O. and Kloepper, J.W. 2009. Plant-microbes interactions in enhanced fertilizer-use
efficiency. Applied Microbiology and Biotechnology 85: 1-12.
Appiah, M.R., Sackey, S.T., Ofori-Frimpong, K. and Afrifa, A.A. 1997. The consequences of cacao
production on soil fertility in Ghana: a review. Ghana Journal of Agricultural Science 30: 183-
190.
Page 227
ISBN 978-967-10840-4-5
Proc. Int. Conf. Plt. Phy. 2014
First Published, 2015
221
Bagayoko, M., George, E., Romheld, V. and Buerkert, A. 2000. Effect of mycorrhizal fungi and
phosphorus on growth and nutrient uptake of millet, cowpea and sorghum on a West African soil.
Journal of Agricultural Science 135: 399-407.
Baon, J.B. 1994. Growth of mycorrhizal cocoa on a red yellow podzolic soil. Pelita Perkebunan 9: 148-
154.
Baon, J.B. 1996. Peranan jamur mikoriza pada tanah Acrisol dalam meningkatkan pertumbuhan tanaman
kakao. Agrivita 19: 121-124.
Baon, J.B., Hulupi, R. and Wibawa, A. 1999. Phosphorus efficiency of selected coffee genotypes.
Indonesian Journal of Crops Science 14: 17-26.
Baon, J.B. and Winarno, H. 1998. Posphorus response, efficiency and adaptation of some cocoa
genotypes to low phosphorus soil. Pelita Perkebunan 14: 26-38.
Baon, J.B., Smith, S.E. and Alston, A.M. 1994. Growth response and phosphorus uptake of rye with long
and short root hairs: interaction with mycorrhizal infection. Plant and Soil 167: 247-254.
Baon, J.B.,Smith, J.B. and Alston, A.M. 1995. P efficiency of barley infected by Glomus intraradices:
Influences of soil temperatures and light intensity. In: Biology and Biotechnology of Mycorrhiza.
BIOTROP Special Publication No. 56: 107-120.
Barber S.A., 1984. Soil Nutrient Bioavailability. A Mechanistic Approach. John Wiley and Sons, New
York, USA.
Bethlenfalvay, G.J. and Linderman, R.G. 1992. Mycorrhizae in Sustainable Agriculture. American Social
of Agronomy Inc. Wisconsin, USA.
Bhadoria, P.S., Dessougi, H.E., Liebersbach, H. and Claassen, N. 2004. Phosphorus uptake kinetics, size
of root system and growth of maize and groundnut in solution culture. Plant and Soil 262: 327-
336.
Bloom, A.J., Chapin, F.S.III and Mooney, H.A. 1985. Resource limitation in plants: An economic
analogy. Annual Review of Ecology, Evolution, and Systematics. 16: 363-392.
Bucher, M., 2007. Functional biology of plant phosphate uptake at root and mycorrhiza interfaces. New
Phytologist 173: 11-26.
Buso, G.S.C. and Bliss, F.A. 1988. Varibility among lettuce cultivars grown at two levels of available
phosphorus. Plant and Soil 111: 67-73.
Caradus, J.R. and Woodfield, D.R. 1990. Estimates of heritability for and relationships between root and
shoot characters of white clover. I. Replicated clonal material. Euphytica 46: 203-209.
Cardoso, I.M., Janssen, B.H., Oenema, O. and Kuyper, T.W. 2003. Phosphorus pools in Oxisols under
shaded and unshaded coffee systems on farmers’ fields in Brazil. Agroforestry Systems 58: 55-64
Cheng, L., Bucciarelli, B., Shen, J., Allan, D.L. and Vance C.P. 2011. Update on white lupin cluster roots
acclimation to phosphorus deficiency. Plant Physiology 156: 1025-1032.
Christie, E.K. and Moorby, J. 1975. Physiological responses of semiarid grasses. I. The influence of
phosphorus supply on growth and phosphorus absorption. Australian Journal of Agricultural
Research 26: 423-436.
Fohse, D., Claassen, N. and Jungk, A. 1988. Phosphorus efficiency of plants. I. External and internal P
requirement and P uptake efficiency of different plant species. Plant and Soil 110: 101-109.
Gianinazzi, S., Trouvelot, A. and Gianinazzi-Pearson, V., 1990, Role and use of mycorrhizasin
horticultural crop production. XXIII International Horticulture Congress Plenary Lecture, Italy,
pp. 25–30.
Gourley, C.J.P., Allan, D.L. and Russsele, M.P. 1994. Plant nutrient efficiency: A comparison of
definitions and suggested improvement. Plant and Soil 158: 29-37.
Grant, C., Bittman, S., Montrea, M., Plenchette, C. and Morel, C. 2005. Soil and fertilizer phosphorus:
Effects on plant P supply and mycorrhizal development. Canadian Journal of Plant Science 85: 3-
14.
Hajabbasi, M.A. and Schumacher, T.E., 1994. Phosphorus effects on root growth and development in two
maize genotypes. Plant and Soil 158: 39-46.
Page 228
ISBN 978-967-10840-4-5
Proc. Int. Conf. Plt. Phy. 2014
First Published, 2015
222
Hartemink, A.E. 2005. Nutrient stocks, nutrient cycling, and soil changes in cocoa ecosystems: A review.
Advances in Agronomy 86: 227-253.
Haselwandter, K., 1995. Mycorrhizal fungi: Siderophore production. Critical Reviews
in Biotechnology15: 287-291.
Haynes, B., Koide, R.T. and Elliott, G. 1991. Phosphorus uptake and utilization in wild and cultivated
oats Avena sp. Journal of Plant Nutrition 14: 1105-1118.
Hinsinger, P., Plassard, C., Tang, C. and Jaillard, B. 2003. Origins of root-mediated pH changes in the
rhizosphere and their responses to environmental constraints: A review. Plant and Soil 248: 43-
59.
IFIA. 2013. Total fertilizer consumption statistics by region from 1992/93 to 2012/13. International
Fertilizer Industry Association. http://www.fertilizer.org/stats.htm
Isaac, M. E., Ulzen-Appiah, F., Timmer, V. R. and Quashie-Sam, S. J. 2007. Early growth and nutritional
response to resource competition in cocoa-shade intercropped systems. Plant and Soil 298:243-
254
Jakobsen, I. 1986. Phosphorus inflow into roots of mycorrhizal and non mycorrhizal peas under field
conditions. In: Gianinazzi-Pearson, V. and Gianinazzi, S. (Eds.) Physiological and Genetic
Aspects of Mycorrhiza. INRA, Paris. pp. 317-322.
Jungk, A. and Claassen,N. 1997. Ion diffusion in soil-root system. Advances in Agron. 61: 53-110.
Koide, R.T. 1991. Nutrient supply, nutrient demand and plant response to mycorrhizal infection. New
Phytologist 117: 365-386
Krannitz, P.G., Aarssen, L.W. and Lefebvre, D.D. 1991. Relationships between physiological and
morphological attributes related to phosphate uptake in 25 genotypes of Arabidopsis thaliana.
Plant and Soil 133: 169-175.
Lambers, H., Finnegan, P.M., Laliberte, E., Pearse, S.J., Ryan, M.H., Shane, M.W. and Veneklaas, E.J.
2011. Phosphorus nutrition of Proteaceae in severely phosphorus-impoverished soils: Are there
lessons to be learned for future crops? Plant Physiology 156: 1058-1066.
Li, X.L., George, E. and Marschner, H. 1991. Extension of the phosphorus depletion zone in VA-
mycorrhizal white clover in a calcareous soil. Plant and Soil 136: 41-48
Lindell, L., Astrom, M. and Oberg, T. 2010. Land-use versus natural controls on soil fertility in the
Subanean Amazon, Peru. Science of Total Environment. 408: 965-975.
Lynch, J.P. and Brown, K.M., 2001. Topsoil foraging-an architectural adaptation of plants to low
phosphorus availability. Plant and Soil 237: 225-237.
Marschner, H. 1995. Mineral Nutrition of Higher Plants. San Diego, CA. Academic Press.
McLaughlin, M.J., Fillery, I.R. and Till, A.R. 1991. Operation of the phosphorus, sulphur and nitrogen
cycles. In: Gifford, R.M. and Barson, M.M. (Eds.) Australia’s Renewable Resources:
Sustainability and Global Change. Bureau of Rural Resources, Canberra, Australia. Pp 67-116.
Miller, R.M., Reinhardt, D.R. and Jastrow, J.D. 1995. External hyphal production of vesicular-arbuscular
mycorrhizal fungi in pasture and tallgrass prairie communities. Oecologia 103: 17-23.
Neumann, E. and George E. 2004. Colonisation with the arbuscular mycorrhizal fungus Glomus mosseae
(Nicol. & Gerd.) enhanced phosphorus uptake from dry soil in Sorghum bicolor (L). Plant and
Soil 261: 245-255.
Nuruzzaman, M., Lambers, H., Bolland, M.D.A. and Veneklaas, E.J. 2005. Phosphorus benefits of
different legume crops to subsequent wheat grown in different soils of Western Australia. Plant
and Soil 271: 175-187.
Rai, A., Rai, S. and Rakshit, A. 2013. Mycorrhiza-mediated phosphorus use efficiency in plants.
Environmental and Experimental Biology 11: 107-117
Richardson, A.E., Lynch, J.P., Ryan, P.R., Delhaize, E. and Smith F.A. 2011. Plant and microbial
strategies to improve the phosphorus efficiency of agriculture. Plant and Soil 349: 121-156.
Rigou, L. and Mignard, E. 1994. Factors of acidification of the rhizosphere of mycorrhizal plants.
Measurement of pCO2 in the rhizosphere. Acta botanica gallica 141: 533-539.
Page 229
ISBN 978-967-10840-4-5
Proc. Int. Conf. Plt. Phy. 2014
First Published, 2015
223
Saif, S.R. 1986. Vesicular-arbuscular mycorrhizae in tropical forage species as influenced by season, soil
texture, fertilizers, host species and ecotype. Angewandte Botanik 60: 125-139.
Sattelmacher, B., Horst, W.J. and Becker H.C. 1994. Factors that contribute to genetic variation for
nutrient efficiency of crop plants. Z. Pflanzenernahr Bodenkult. 157: 215-224.
Schroeder, M.S. and Janos D.P. 2004. Phosphorus and intraspecific density alter plant responses to
arbuscular mycorrhizas. Plant and Soil 264: 335-348.
Simpson, R.J., Oberson, A., Culvenor, R.A., Ryan, M.H. and Veneklaas E.J., 2011. Strategies and
agronomic interventions to improve the phosphorus-use efficiency of farming systems. Plant and
Soil 349: 89-120.
Smith, S.E. and Read, D.J. 2008. Mycorrhizal Symbiosis. 3rd Ed., Academic Press, London.
Smith, S.E., Jakobsen, I., Gronlund, M. and Smith, F.A. 2011. Roles of arbuscular mycorrhizas in plant
phosphorus nutrition: Interactions between pathways of phosphorus uptake in arbuscular
mycorrhizal roots have important implications for understanding and manipulating plant
phosphorus acquisition. Plant Physiology 156: 1050-1057.
Smyth, A.J. 1966. The selection of soils for cocoa. Soils Bulletin No. 5. Food and Agricultural
Organization of the United Nation, Rome.
Steingrobe, B. and Classen, N. 2000. Potassium dynamics in the rhizosphere and efficiency of crops. J.
Plant Nutrition and Soil Science 163: 101-106.
Tarafdar, J.C. and Marschner, H. 1994. Phosphatase activity in the rhizosphere and hyphosphere of VA-
mycorrhizal wheat supplied with inorganic and organic phosphorus. Soil Biology and
Biochemistry 26: 387-395.
van Noordwijk, M. 1989. Rooting depth in cropping systems in the humid tropics in relation to nutrient
use eYciency. In “Nutrient Management for Food Crop Production in Tropical Farming Systems”
(J.V.D. Heide, Ed.), Institute of Soil Fertility, Haren. Pp. 129-144.
Wei, L., Chen, C. and Xu, Z. 2010. Citric acid enhances the mobilization of organic phosphorus in
subtropical and tropical forest soils. Biology and Fertility of Soils 46: 765-769.
Wessel, M. 1971. Fertilizer requirements of cocoa (Theobroma cacao L.) in South-Western Nigeria.
Communication No. 61. Dept. Agricult.Res. Royal Tropical Institute, Wageningen, The
Netherlands.
Widiastuti, H. and Baon, J.B. 1994. Nutrient uptake and growth of cocoa fertilized with rock phosphate
and inoculated with Acaulospora delicata and Glomus fasiculatum. Pelita Perkebunan
Wood, G.A.R. and Lass, R.A. 2001. Cocoa. Blackwell Science, Great Britain
Zhu, J., Zhang, C. and Lynch, J.P. 2010. The utility of phenotypic plasticity for root hair length for
phosphorus acquisition. Funct. Plant Biology 37: 313-322.
Page 230
ISBN 978-967-10840-4-5
Proc. Int. Conf. Plt. Phy. 2014
First Published, 2015
224
Root Nodulation and Nitrogen-Fixation in Pterocarpus indicus
Lok, E.H.1,*
, Dell, B.2 and O’Hara, G.
2
1Forest Plantation Program, Forest Research Institute Malaysia (FRIM), 52109 Kepong, Selangor,
Malaysia. 2School of Veterinary and Life Sciences, Murdoch University, Perth, 6150, Western Australia.
*E-mail: [email protected]
Introduction
There are a number of commercial timber tree species belonging to the family Leguminosae-subfamily
Papilionoideae (Fagaceae) that are N-fixing. These include genera like Acacia, Casuarina, Dalbergia,
Paraserianthes and Pterocarpus. Despite their flora abundance, diversity and economic importance, few
have been studied for their ability to nodulate, fix atmospheric N symbiotically with root nodule bacteria
(rhizobia) and soil type preference especially in Pterocarpus indicus and Dalbergia spp. (Allen and Allen,
1981; de Faria et al., 1989; Sprent, 2001). According to de Faria et al. (1989) and Sprent (1995), there are
only 57% and 20% of the genera and species respectively in the tropical legumes that have been
examined but poorly studied. Pterocarpus indicus or Angsana is of no exception as it is identified as one
of the potential ‘millenium tree’ species for timber forest plantation by FRIM due to its fast growth rates
and other desirable characteristics for planting (Appanah and Weinland, 1983; Lok, 1996).
Legumes are often used for managing agricultural ecosystems in order to improve their organic fertility,
N economy or farming system flexibility (Brockwell et al., 2005; Sprent, 2001). At times, optimum
growth performance of the N-fixing symbiosis depends upon pre-selection of both symbiotic partners for
adaptation to the target environment which in turn pose a challenge to root nodulation and survival
(Howieson and Ballard, 2004). P. indicus are reported to nodulate with Rhizobium and Bradyrhizobium in
the field but little is known on the symbiotic relationships and capacity to fix nitrogen (Lim, 1976; Allen
and Allen, 1981; Sprent, 2001). However, inoculation with rhizobia is an advantage where soil
populations of compatible microsymbionts are low or absent (Berger, 1993; Ndiaye and Ganry, 1997).
Inoculation using effective strains may be useful in commercial forest nurseries so as to increase N2-
fixation capability before transplanting to fields (Chee et al., 1989; Perez-Fernandez and Lamont, 2003).
Hence, the aim of this study was to determine the ability of P. indicus to nodulate with diverse strains of
rhizobia for N2-fixation and to identify possible strains with potential for application as inocula in the
nursery or field.
Materials and Methods
A complete randomized block design was used, comprising of 18 strains of rhizobia and two controls (C1
as uninoculated without added inorganic N and C2 as uninoculated plus inorganic N) (Table 1). Four
replicates per treatment were set up and carried out at Murdoch University glasshouse. The mean
minimum and maximum temperature (±SE) were 18 ± 2 oC and 30 ± 3
oC respectively.
Seeds and a local strain were collected from the mature P. indicus growing in Forest Research Institute
Malaysia (FRIM) and surface sterilize before sown in plastic trays containing yellow sand. The sand has a
pH (H2O) range from 5.3 to 6.0 and has been used in different plant nutrition and mycorrhizal responses
studies (Bougher et al., 1990; Brundrett et al., 1996). After transplanting and inoculation, all pots were
given a pulse of 20 ml aqueous solution containing KNO3 and weekly with required nutrient solution
(minus N) (Howieson, et al., 1995). The local strain in WSM 3712 was isolated from a nodule of P.
indicus in a potted seedlings growing in FRIM and extracted according to Vincent, 1970 and transferred
Page 231
ISBN 978-967-10840-4-5
Proc. Int. Conf. Plt. Phy. 2014
First Published, 2015
225
onto yeast mannitol agar (YMA) (Howieson et al. 1988). All other strains in WSM and TAL were
obtained from the Centre for Rhizobium Studies (CRS), Murdoch University, Western Australia.
Table 1. Root nodule bacteria (Rhizobia) used in the study
Strain No. Strains Source
TAL 643 Bradyrhizobium sp. RRIM
TAL 648 Bradyrhizobium sp. RRIM
TAL 651 Bradyrhizobium sp. RRIM
TAL 656 Bradyrhizobium sp. RRIM *R 602 Rhizobium gallicum INRA
WSM 2096 Bradyrhizobium elkanii CRS
WSM 2097 Bradyrhizobium japonicum CRS
WSM 2098 Bradyrhizobium liaoningense CRS
WSM 2100 Mesorhizobium ciceri CRS
WSM 2105 Rhizobium galegae CRS
WSM 2106 Rhizobium hainanense CRS
WSM 2108 Rhizobium leguminosarum CRS
WSM 2110 Rhizobium tropici CRS
WSM 2114 Sinorhizobium meliloti CRS
WSM 2115 Sinorhizobium saheli CRS
WSM 2116 Sinorhizobium terangae CRS
WSM 2117 Mesorhizobium loti CRS
WSM 3712 Bradyrhizobium sp. FRIM
Source: CRS: Centre for Rhizobium Studies, INRA: Institute National de la Recherche Agronomique (France),
FRIM: Forest Research Institute of Malaysia and RRIM: Rubber Research Institute of Malaysia.
Sufficient culture strains were then obtained for inoculation using YMA plates and grown at 28 oC. A
suspension of 10 ml was used to inoculate into each pot for all newly transplanted seedlings to ensure
evenly distributed suspension on the soil surface. Plants were harvested after three months and with
visible growth effects. Roots were extracted and nodulation was examined based on nodules size, color
and position on the roots (Howieson et al., 1995). The shoots were separated and oven dried to constant
weight at 70 oC. Microscopic studies were fixed overnight in gluteraldhyde (3% v/v) and in phosphate
(0.025 M) buffer before being dehydrated and embedded in Spurr’s resin (Spurr, 1969). Observations on
nodules were made using stereo and compound microscopes. Later, the data were subjected to analysis of
variance (ANOVA) using SPSS version 11.5 after three months.
Results
Nodulation and shoot dry weight
Nodules were formed from all four genera of rhizobia: Bradyrhizobium, Mesorhizobium, Sinorhizobium
and Rhizobum except the two uninoculated controls. Out of eighteen strains used, only ten strains were
found to have nodulated. These strains are TAL 643, TAL 651, R602, WSM 2096, WSM 2098, WSM
2100, WSM 2106, WSM 2110, WSM 2114 and WSM 3712. Interestingly, the slow growing strains,
Bradyrhizobium (WSM 3712, TAL 643, WSM 2096 and TAL 651) formed greater mean number of
nodules per seedlings and larger in sizes (Table 2).
Bradyrhizobium strains (WSM 3712, WSM 2096 and TAL 643) also formed on the tap and lateral roots
while others were only confined to the collar region (Table 2, Figure 1a). The larger nodules formed by
WSM 3712 and WSM 2096 were observed to be pink internally (active) whereas all other nodules were
whitish (inactive) in color. The nodules of Pterocarpus indicus are mainly globose, smooth, internally
Page 232
ISBN 978-967-10840-4-5
Proc. Int. Conf. Plt. Phy. 2014
First Published, 2015
226
b
b
a
a a
aa a
a
a a a
C1
(-N
)
TA
L 6
51
WS
M 2
110
R 6
02
WS
M 2
100
TA
L 6
43
WS
M 2
098
WS
M 2
106
WS
M 2
114
WS
M 3
712
WS
M 2
096
C2
(+N
)
Strain
0.0
0.1
0.2
0.3
0.4
Sh
oot
Dry
Wei
gh
t (g
)
a
b
b
aeschynomenoid in shape, determinate growth in oblate form and containing central infected tissues with
few or no uninfected cells (astragaloid in the terminology of Sprent, 2001; Brown and Walsh, 1994).
Nodulated strains in WSM 2096 and WSM 3712 were observed to have dark green shoots as compared to
other control uninoculated plants without added N. However, only WSM 2096 had significantly increased
shoot dry weight at the time of harvest which was similar to the control with added N (Figure 1b).
Table 2. Mean nodule number, nodulated seedlings, nodule distribution, nodule size and nodule colour in
Pterocarpus indicus seedlings for ten treatments.
** Nodule distribution (%) at: A = 0-3 cm; B = 3-5 cm and C = >5 cm from the root collar for all four replicates,
#Size (%):
L = large: > 5mm, M = medium: 3-5 mm and S = small: < 3mm in diameter for all four replicates
(Howieson et al., 1995).
Figure 1. Aeschynomenoid nodules of P. indicus nodules formed a) Tap root with Bradyrhizobium elkanii
(WSM 2096) and b) Mean shoot dry weight obtained from nodulated rhizobia strains. Bars with
the same letter are not significantly different at P ≤ 0.05.
Strain
Mean number of
nodules per
nodulated seedling
(± S.E.)
Nodulated
seedlings
(%)
**Nodule
distribution1
(%)
A B C
#Nodule size2
(%)
L M S
Nodule
colour
WSM 3712 25.3±6.3 83 93 7 - - 18 82 pink
TAL 643 17.3±5.0 83 57 28 15 - 19 81 white
WSM 2096 19.0±9.0 42 38 46 16 16 42 42 pink
TAL 651 16 8 100 - - - - 100 white
WSM 2106 3 8 100 - - - 100 - white
WSM 2114 2 8 100 - - - 100 - white
WSM 2100 1 8 100 - - - - 100 white
R 602 1 8 100 - - - - 100 white
WSM 2098 1.0±0.0 8 100 - - - - 100 white
WSM 2110 1 8 100 - - - - 100 white
(a)
(b)
Page 233
ISBN 978-967-10840-4-5
Proc. Int. Conf. Plt. Phy. 2014
First Published, 2015
227
Discussion
Knowledge of rhizobia associated with P. indicus is lacking. A significant finding from this study shows
that P. indicus can be nodulated by diverse strains of rhizobia comprising of four genera i.e
Bradyrhizobium, Rhizobium, Sinorhizobium and Mesorhizobium. Nodulation using slow-growing strain
such as Bradyrhizobium, has previously reported (Lim, 1976) but this is the first study of nodulation on P.
indicus using diverse strains of rhizobia. This study also provides strong evidence to support the
suggestion by Sprent and Parsons (2000) that nodulating species of Pterocarpus are promiscuous.
Nodulation ability of other tree species has been reported to vary among and within plant species under
different locations and environmental conditions (Moreira et al., 1992). However, further work is required
to quantify the role for some of these strains and its effectiveness in nitrogen fixation.
Conclusions
The results showed that P. indicus can be nodulated by a diverse range of rhizobia and that it is
promiscuous host species. However, this initial study showed that only two strains may be effective.
Further inoculation studies with a wide range of strains from taxonomically related species such as in
Dalbergia are required. Whether woody legumes require inoculation in the nursery depends on the
availability of compatible and effective rhizobia in the soils and where they are to be planted in the fields.
Acknowledgements
The first author acknowledged Ministry of Science, Technology and Innovation for financial support and
FRIM for the permission granted to present these findings.
References
Allen, O.N., Allen, E.K., 1981. The Leguminosae: A Source Book of Characteristics, Uses and
Nodulation. University of Wisconsin Press, Madison, WI. 812 pp.
Appanah, S., Weinland, G.W., 1993. Planting Quality Timber Trees in Peninsular Malaysia-A Review.
Malayan Forest Record. 221 pp
Berger, J.I. 1993 Ecological restoration and non-indigenous plant species: a review. Restoration Ecology
1: 74-82.
Bougher, N.L., Grove, T.S. and Malajczuk, N. 1990. Growth and phosphorus acquisition of karri
(Eucalyptus diversicolor) seedlings inoculated with ectomycorrhizal fungi in relation to
phosphorus supply. New Phytologist 114: 77-85.
Brockwell, J., Searle, S.D., Jeavons, A.C. and Waayers, M. 2005. Nitrogen Fixation in Acacias: an
Untapped Resource for Sustainable Plantations, Farm Forestry and Land Reclamation. ACIAR
Monograph 115, 132 pp.
Brown, S.M. and Walsh, K.B. 1994. Anatomy of the legume nodule cortex with respect to nodule
permeability. Australian Journal of Plant Physiology 21: 49-68.
Brundrett, M., Brougher, N., Dell, B., Grove, T. and Malajczuk, N. 1996. Working with Mycorrhizas in
Forestry and Agriculture. Australian Centre for Inernational Agricultural Research, Canberra,
Australia.
Chee, C.W., Sundram, J., Date, R.A. and Roughley, R.J. 1989. Nodulation of Leucaena leucocephala in
acid soils of Peninsular Malaysia. Tropical Grasslands 23: 171-178.
Cheng, Y., Watkin, E.L.J., O'Hara, G.W. and Howieson, J.G. 2002. Medicago sativa and Medicago
murex differ in the nodulation response to soil acidity. Plant and Soil 238: 31-39.
Page 234
ISBN 978-967-10840-4-5
Proc. Int. Conf. Plt. Phy. 2014
First Published, 2015
228
De Faria, S.M., Lewis, G.P., Sprent, J.I. and Sutherland, J.M. 1989. Occurrence of nodulation in the
Leguminosae. New Phytologist 111: 607-619.
Howieson, J.G., Ewing, M.A. and D'Antuono, M.F. 1988. Selection of acid tolerance in Rhizobium
meliloti. Plant and Soil 105: 179-188.
Howieson, J.G., Loi, A. and Carr, S.J. 1995. Biserulla pelecinus L.-legume pasture species with potential
for acid, duplex soils which is nodulated by unique root-nodule bacteria. Australian Journal of
Agriculture Research. 46: 997-1009.
Howieson, J. and Ballard, R. 2004. Optimising the legume symbiosis in stressful and competitive
environments within southern Australia-some contemporary thoughts. Soil Biology and
Biochemistry 36: 1261-1273.
Lim, G. 1976. Rhizobium and nodulation of legumes in Singapore. In 'Proceedings of Symposium
Somiplan'. Kuala Lumpur, Malaysia. In: Broughton, W.J., John, C.K., Rajarao, J.C. and Lim, B
(eds.), University Malaya Press. pp 159-175.
Lok, E.H. 1996. The Branching Behaviour and Silvicultural Potential of Pterocarpus indicus Using Small
Cuttings. M.Sc. thesis, Universiti Pertanian Malaysia. 75 pp.
Moreira, F.M.S., da Silva, M.F. and de Faria, S.M. 1992. Occurrence of nodulation in legume species in
the Amazon region of Brazil. New Phytologist 121: 563-570.
Ndiaye, M and Ganry, F. 1997. Variation in the biological N fixation by tree legumes in three ecological
zones from the north to the south of Senegal. Arid Soil Research and Rehabilitation 11: 245-254.
Perez-Fernandex, M.A. and Lamont, B.B. 2003. Nodulation and performance of exotic and native
legumes in Australian soils. Australian Journal of Botany 51: 543-553.
Sprent, J.I. 1995. Legume trees and shrubs in the tropics: N2 fixation in perspective. Soil Biology and
Biochemistry. Soil Biology and Biochemistry 27: 401-407.
Sprent, J.I. and Parson, R. 2000. Nitrogen fixation in lgume and non-legume trees. Field Crops Research
65: 183-196.
Sprent, J.I. 2001. Nodulation in Legumes. Royal Botanic Gardens: Kew, United Kingdom.
Spurr, A.R. 1969. A low viscosity epoxy resin embedding medium for electron microscopy. Journal of
Ultrastructure Research 26: 31.
Vincent, J.M. 1970. A Manual for the Practical Study of the Root Nodule Bacteria. International
Biological Program, Handbook 15, Blackwell Scientific Publications, Oxford.
Page 235
ISBN 978-967-10840-4-5
Proc. Int. Conf. Plt. Phy. 2014
First Published, 2015
229
Interaction of Microbes Application and Vegetation Cover towards Slope
Protection
Normaniza, O.1,*
, Aimee, H.1, Tan, G.Y.A.
1, Rozainah, M.Z.
1 and Noorlidah, A.
1
Institute of Biological Sciences, Faculty of Science, University of Malaya, 50603 Kuala Lumpur,
Malaysia.
*E-mail: [email protected]
Introduction
Most developing countries are now practicing extensive and rapid progress for improvement in terms of
infrastructure such as slope cutting for highway development as well as the hillside housing project for a
better standard of living. Simultaneously, reduction in vegetation cover has ensued to increase the
problems of erosion and landslide. Thus, understanding of both suitable plant species and the role of re-
vegetation of slope are vitally needed with a potential towards a systematic and non-destructive methods
approach. Microbes are known to play a role in enhancing soil nutrients via its biomass and biological
activities (Haslam and Hopkins, 1999) that promotes plant growth. Thus, this study attempts to relate the
physiological aspects of selected potential slope plants and soil-microbes application with respect to
different vegetation density. It is anticipated that this interaction would enhance the slope plant
physiological characteristics, resulting in a more stable and sustainable resources of the slope.
Materials and Methods
Experimental set up
Six experimental plots of three different coverages; bare (control), less dense (50% of plant coverage),
and dense (100 % of plant coverage) with the size of 8 m x 8 m for each have been set up on selected
slopes at Guthrie Corridor Expressway (GCE), Sg. Buloh, Selangor. Two treatments; microbe (M) and
non-microbe (NM) soils were applied on each plant coverage; bare (BM and BNM), less dense (LDM and
LDNM), and dense (DM and DNM).
Plants transplanting on slope and microbe application
Three species of potential slope plants were chosen and transplanted onto slopes; Melastoma
malabathricum, Lantana camara and Bauhinia purpurea. The transplanting of these species on slope was
conducted using a Microclimate Plant Propagation Technique with modified soil depth (Normaniza and
Barakbah, 2011). Each seedling was transplanted into holes by using a soil coring machine (Eijelkamp
Agrisearch Equipment, Model Cobra, the Netherlands) at 0.6 m of soil depth. Plant supplements such as
NPK fertilizer, sphagnum moss and rock-phosphate (15 g each/hole) were applied only in the beginning
of treatment in order to initiate the establishment of the roots and other physiological processes. After a
week of transplanting, 50 g of commercialized microbe fertilizer was applied at 10 cm of soil depth near
the transplanted plants, representing the microbe treated plots.
Data measurement: isolation of bacteria and fungi, erosion rate, physiological parameters, soil npk and
soil saturation level (STL)
After six months, the soil samples (n=3) for each slope plant species were collected at 10 cm radius from
the stem at both treated and non-treated plots using steriled spatula and containers. Bacterial and fungi
were isolated on soil extract agar and potato dextrose agar media, respectively. Soil sample (1 g) was ten-
Page 236
ISBN 978-967-10840-4-5
Proc. Int. Conf. Plt. Phy. 2014
First Published, 2015
230
fold serially diluted quarter strength Ringer’s solution and 100 µl of soil suspension spread on to agar
plates in triplicates. All the agar plates were incubated for 3 to 7 days at 28 oC. Growth of bacteria and
fungi were enumerated as colony forming unit per gram of soil (cfu/g).
The eroded soils in the PVC containers that placed below the erosion boxes were collected, air dried and
weighed weekly for duration of six months. The erosion rate was manually calculated and determined in
g/m2, with three replications. .
Physiological performances of the species studied were observed for six months in triplicates using a
portable photosynthesis system (6400XT, LiCOR, USA) in an open system mode, between 0930 and
1200 hours. During early and at the end of experiment, the soil samples within the perimeter of 0.5 m
from the root were taken using soil coring machine and the soil nutrient; N, P, and K were analyzed at
Department of Geology, Faculty of Science, University of Malaya. N was analysed using Kjeldahl
digestion method (Bremmer, 1965) and P was detected by using colorimetric Sharpley et al. (1992).
Whilst K was determined by ignition method using atomic absorption spectrophotometry (Fishman and
Downs, 1966).
Soil water profiles such as soil water content (SWC), soil field capacity (SFC) and soil saturation level
(STL) were determined. The soils were sampled using cylindrical soil cores (11 cm in diameter; 100 cm
depth). The measurements of SWC and SFC were taken at the beginning and the end of the experiment,
diagonally across the plot with three replications, as follows:
i) Soil water content (SWC)
The soil samples were oven dried at 85 0C to a constant weight. SWC was calculated as
[(Fresh weight – dry weight)/ Fresh weight] X 100%.
ii) Soil field capacity (SFC)
SFC was determined by pouring excess water into a container filled with soil so that the
soil becomes supersaturated. The excess water was drained out through small holes at the
bottom of the container. Once the water stopped dripping, the saturated soil was weighed
(SW) and then dried in the oven at 85 0C to obtain a constant weight (DW). SFC was
calculated as [(SW – DW)/SW] X 100%.
iii) Soil saturation level (STL)
The soil saturation level was determined as [SWC / SFC] X 100%.
Statistical analysis
Statistical analysis was performed using SPSS version 20. The two way ANOVA was applied to evaluate
the significant difference between plant density and microbe application factors. LSD (p=0.05) was
calculated using the error mean squares of the analysis of variance.
Results and Discussion
Enumeration of soil microbes
In general, the counts of bacteria and fungi (both treated and untreated plots) ranged from 5.7 x 10⁵ to 7.1
x 106 cfu/g and 1.0 x 10
3 to 3.8 x 10
5 cfu/g, respectively. The result recorded that L. camara in treatment
DM exhibited the highest in number of cultured bacteria and fungi (Figure 1), implying that microbe
fertilizer has enhanced soil microbial activity of soil. In addition, these results were in accordance with
Page 237
ISBN 978-967-10840-4-5
Proc. Int. Conf. Plt. Phy. 2014
First Published, 2015
231
finding by Fan et al. (2009) which described that the microbiological properties of arid soil in Southern
China had improved in the presence of L. camara, thus, it will lead to accelerate the cycles of soil
nutrients. Furthermore, bacterial and fungal counts from microbe treated soils of M. malabathricum in
both LD and D plots showed no significant difference in numbers (Figure 1), indicating that the microbe
fertilizer altered the soil microenvironment of the slope plants and the effects varied according to types of
plants and density of the plots.
Figure 1: Bacterial and fungal counts in soil collected from the different plant species at six months after
microbe application.
Physiological parameters
In general, the physiological values of all species were significantly influenced by the interaction between
plant density and application of microbe fertilizer. At the end of observation, the stomatal conductance,
photosynthetic rate and transpiration rate of L. camara of treatment DM exhibited significantly the highest
value amongst species and treatments (Figure 2a-c). Previous study described that this invasive species
showed an outstanding performance in growth rate at the harsh environment (Sharma et al., 2005). Thus,
this result implies that the sun tolerant feature of L. camara as well as having higher number of branching
and leaves, resulting in the increased of stomata (Figure 2a). Thus, a higher in stomata opening will
subsequently lead to the significant light utilization efficiency of the plant in photosynthesis (Figure 2b).
Concurrently, it will contribute in enhancing the transpiration capacity of the plant (Hertwitz et al., 2004)
(Figure 2c). Furthermore, dense plant coverage and microbe treatment showed a positive influence on the
growth performance of all the species studied. Thus, this will improve the water absorption capacity at the
plot areas via evapo-transpiration in order to release excessive water. Subsequently, it may increase the
safety aspect of the slope through above ground biomass (Greenwood et al., 2004) and help to reduce the
amount of eroded soil.
Interestingly, M. malabathricum grown in microbe treated plot has shown a lower assimilation rate as
compared to those grown naturally on slopes and in untreated plots (Figure 3). It is known that microbial
community structures and ecological functions can have a positive, negative or neutral impact on
diversity of plants and soil microbes (Singh et al., 2004). Thus, in this case, the species performance was
not influenced by additional microbe fertilizer. This may suggest that plant specific interaction with the
microbes is a complex phenomena and this species might be in response to the microbe fertilizer by
enhancing growth and development of plant roots rather than the aboveground properties.
Page 238
ISBN 978-967-10840-4-5
Proc. Int. Conf. Plt. Phy. 2014
First Published, 2015
232
(a) Stomatal conductance (b) Photosynthetic rate (c) Transpiration rate
Figure 2: Physiological performances of species studied grown on the experimental plots.
Figure 3: Photosynthetic rate of M. malabathricum grown on the experimental and existing plots.
Soil nutrients (N, P, and K)
Overall, there was a significant interaction between plant density and application of microbe fertilizer,
contributing to the positive changes in soil nutrients. At the end of experiment, the soil NPK values
showed the highest in DM whilst the lowest in BNM (Figure 4), implying the positive contribution of the
microbe applied and higher density of the species studied to improve the soil nutrients content.
Furthermore, at the end of experiment, the N, P, and K values were higher at the microbe treated plots,
indicating that interaction between soil microbe and higher plant density have increased the number of
plants associated with the soil microorganisms, thus, helping to obtain nutrients for the plant use
(Dobermann and Fairhust, 2000). Consequently, it will enhance the soil fertility as well. Furthermore, a
higher number of plants also attributed to the increased of decomposition process of litter, subsequently,
releasing the nutrients back into the soil.
In addition, a higher organic matter at the top layer of soil also enhanced the root formation. In aftermath,
roots and organic matter physically bind the soil particles and increase the soil aggregation, thus, reducing
the soil erosion problem.
Page 239
ISBN 978-967-10840-4-5
Proc. Int. Conf. Plt. Phy. 2014
First Published, 2015
233
Figure 4: Soil nutrients status at six months of the observation. Vertical lines represent LSDp<0.05
Soil saturation level (STL)
A significant interaction between plant density and microbes application exhibited the positive effect
towards reduction of soil saturation level (STL). The result showed that treatment DM recorded the lowest
value of STL which was by 39.6% (Figure 5). The highest STL was observed in bare treatments,
implying that the direct impact of rainfall to the soil surface without interception contributed to the
increased amount of water in soil. In addition, it is known that the increment of soil water content will
lead to the increasing percentage of saturation level (Bouman and Tuong, 2001). Consequently, it led to
the increased soil erosion. In contrast, a higher plant density improved the interception rate of the slope
due to the increased leaf area coverage. It indicates that a higher plant density could be considered to be a
good indicator as it serves as a good drying agent (Normaniza and Barakbah, 2011) especially during
monsoon period, thus, preventing the soil from getting oversaturated. Furthermore, microbe application
indirectly reduced the erosion rate of slope soil via increasing the number of bacteria and fungi, thus,
enhancing the plant growth performance of the species studied. Therefore, it is anticipated that a higher
vegetation coverage would enhance the evapo-transpiration process on slope, hence, alleviating the
erosion problem. Moreover, the interaction of roots system amongst species studied tend to increase the
surface roughness by adding organic substances to the soil and enhance the creation of soil macropores,
thus providing a greater capacity for infiltration (Noguchi et al., 1997).
Figure 5: The soil saturation level (STL) at six months of observation. Vertical lines represent LSDp<0.05.
Page 240
ISBN 978-967-10840-4-5
Proc. Int. Conf. Plt. Phy. 2014
First Published, 2015
234
Erosion rate
In general, the result showed that the increased of plant density and microbe application had significantly
reduced the erosion rate in the plots studied. The treatment DM recorded the lowest erosion rate by 93.3%
at the end of experiment (Figure 6). Furthermore, the higher coverage of plant canopy in treatment DM
resulted in the increased interception rate by foliage and stem, hence, reducing the direct impact of
rainfall to the soil surface. In addition, interspecific (mixed species) interaction amongst the species
studied as well as microbe application enhanced the canopy sizes and growth performances, thus,
anticipating that the evapo-transpiration rate will also increase (Figure 2). Since high amount of water will
be extracted out from the soil to the atmosphere, thus, it would prevent the slope soil from oversaturated
(Figure 5) and less consolidates, thus, increasing the soil stability.
Despite the effect of plant canopy coverage, the plant litter contributed by reducing the runoff during
rainfall events, hence, decreased the amount of soil loss. In addition, a higher plant density (treatment
DM), due to their relatively dense plants canopy, giving rise to a thick litter cover at the soil surface,
which in turn increased the organic matter at the top layer of soil (Figure 4). Thus, it will enhance the root
system and increase the soil-root interaction. Ultimately, it will reduce the soil erosion rate as well as
improve the slope stability.
Figure 6: Erosion rate of the experimental plots.
Correlations amongst the parameters studied
The STL is positively related to the erosion rate of the slope soil (Figure 7). This indicates that the
increased soil saturation level leads to a higher infiltration rate, thus, increased the possibility for the soil
to be eroded. In terms of STL, the increasing amount of water in the soil referred to low amount of water
extracted through evapo-transpiration process, resulting in oversaturated of the soil and tendency for the
soil particles deformation. Therefore, vegetation cover is viewed as an important factor for soil erosion
control (Morgan, 2005; Shakesby et al., 2000). The introduction of the suitable species associated with
the microbe application on slope will provide the increased in interception of the rainfall (Liao et al.,
2001), as well as affected the hydraulic conductivity of the soil by extensive root system activity (Haynes
and Naidu, 1998), and accumulation of organic matter to the soil. Ultimately, it will reduce the erosion
rate on slope.
Page 241
ISBN 978-967-10840-4-5
Proc. Int. Conf. Plt. Phy. 2014
First Published, 2015
235
Figure 7: Relationship between soil saturation level (STL) and erosion rate of slope soil.
Conclusions
In conclusion, the interaction between microbe and dense coverage have improved the plant growth
performance and alleviated the erosion problem. Dense plant coverage contributes to the maximum
protection of the soil surface from raindrop impact, reducing the erosion rate of the slope soils. In
addition, the performance of species chosen in microbe treated plots was observed higher in terms of
physiological performance, consequently, provides a positive influence in reducing the erosion rate of the
slope soils. This study has proven that the right planting density and amount of microbe fertilizer
application has positively influenced the growth of the species studied and reducing the soil erosion rate
of the slope. Thus, become the key factors in bioengineering development towards the slope stabilization.
References
Bouman, B.A.M. and Tuong, T.P. 2001. Field water management to save water and increase its
productivity in irrigated lowland rice. Agricultural Water Management 49: 11-30.
Bremmer, J.M. 1965. Total nitrogen. In: Black, C.A. et al. (Eds.) Methods of Soil Analysis. Part 2.
Agronomy 9. American Society of Agronomy, Madison, Wisconsin. Pp. 1149-1178.
Dobermann, A. and Fairhurst, T. 2000. Rice: Nutrient disorders and nutrient management. Potash &
Phosphate Institute (PPI), Potash & Phosphate Institute of Canada (PPIC), and International Rice
Research Institute (IRRI), Singapore and Los BaÒos, Pp.191.
Fan, L., Chen, Y., Yuan, J. and Yang, Z. 2009. The effect of Lantana camara Linn. invasion on soil
chemical and microbiological properties and plant biomass accumulation in southern China.
Geoderma 154: 370-378.
Fishman, M.J. and Downs, S.C. 1966. Methods for analysis of selected metals in water by atomic
Absorption. U.S. Geological Survey Water-Supply Paper 1540(C): C26-C28.
Greenwood, J.R., Norris, J.E. and Wint, J. 2004. Assessing the contribution of vegetation to slope
stability. Proceedings of the ICE - Geotechnical Engineering. 157(4): 199-207.
Haslam, S.F.I. and Hopkins, D.W. 1996. Physical and biological effects of kelp (seaweed) added to soil.
Applied Soil Ecology 3: 257-261.
Haynes, R.J. and Naidu, R. 1998. Influence of lime, fertilizer and manure applications on soil organic
matter content and soil physical conditions: A review. Nutrient Cycling in Agroecosystems 51:
123-137.
Herwitz, S.R., Levia Jr., D.R. and Ewe, S.M.L. 2004. Transpiration rates of the understorey annual
Impatiens capensis (Balsaminaceae) in response to the autumnal changes in canopy leaf area.
Flora Morphology, Distribution, Functional Ecology of Plants 199: 524-530.
Page 242
ISBN 978-967-10840-4-5
Proc. Int. Conf. Plt. Phy. 2014
First Published, 2015
236
Liao, H., Rubio, G., Yan, X., Cao, A., Brown, K.M. and Lynch, J.P. 2001. Effect of phosphorus
availability on basal root shallowness in the common bean. Plant Soil 232: 69-79.
Morgan, R.P.C. 2005. Soil Erosion and Conservation. Blackwell, Oxford.
Noguchi, S., Tsuboyama, Y., Sidle, R.C. and Hosoda, I. 1997. Spatially distributed morphological
characteristics of macropores in forest soils of Hitachi Ohta Experimental Watershed, Japan.
Journal of Forest Research 2: 207-215.
Normaniza, O. and Barakbah, S.S. 2011. The effect of plant succession on slope stability. Ecoloogical
Engineering 37: 139-147.
Shakesby, R.A., Doerr, S.H. and Walsh, R.P.D. 2000. The erosional impact of soil hydrophobicity:
Current problems and future research directions. Journal of Hydrology 231-232: 178-191.
Sharma, G.P., Raghubanshi, A.S. and Singh, J.S. 2005. Lantana invasion: An overview. Weed Biological
Management 5: 157-165.
Sharpley, A.N., Smith, S.J., Jones, O.R., Berg, W.A. and Coleman, G.A. 1992. The transport of
bioavailable phosphorus in agricultural runoff. Journal of Environmental Quality 21: 30-35.
Singh, B.K., Millard, P., Whiteley, A.S., Murrell, J.C. 2004. Unravelling rhizosphere–microbial
interactions: Opportunities and limitations. Trend Microbiology 12: 386-393.
Page 243
ISBN 978-967-10840-4-5
Proc. Int. Conf. Plt. Phy. 2014
First Published, 2015
237
Biomass Production, Physiological Changes and Secondary Metabolites of
Andrographis paniculata Influenced by EFB Media and Water Stress
Siti Zaharah, S.1,*
, Shara Salih, A.1, Radziah, O.
2 and Puteri Edaroyati, M.W.
1
1Department of Crop Science,
2Department of Land Management, Faculty of Agriculture, Universiti Putra Malaysia, 43400 Serdang,
Selangor, Malaysia.
*E-mail: [email protected]
Introduction
Andrographis paniculata commonly known as ‘king of bitter’ or ‘Hempedu bumi’ belongs to the family
Acanthaceae and it is native to India and Sri Lanka. It is an annual herb that has been commonly grown as
a medicinal herb. Recently, the plant has received increased interest due to the valuable pharmaceutical
properties that have been used traditionally for the treatments of enormous types of ailment around the
world especially in Asia. The active compound of this plant is andrographolide that act as a good source
of antioxidants, thereby contributing to treatments of appetite loss, diabetes reduction, liver tonic
property, and gallbladder protection (Aziz, 2003). Hempedu bumi’ is mainly propagated by seeds and the
seedlings are then established in open fields. Soil is mostly used as rooting medium for Andrographis
paniculata production, which jeopardizes the production of quality seedlings. Thus, cultivation method
can be optimized to maximize the organically production of king of bitter by using modern technologies
such as soilless media (SM). SM is a system of providing plant with nutrients that results in production of
highly qualified crop yields, even in areas with adverse growing circumstance (Gruda, 2012). Waters
stress is one of the most essential abiotic stress factors that enhance the biochemical contents of plants. It
is known to alter the secondary metabolite production in several varieties of medicinal plants. Therefore,
exposure to drought conditions may improve the value of Andrographis paniculata as medicinal herb
plants which contain higher biochemical contents. However, under certain condition such as water deficit
the physical and chemical properties of the growing media influence the biomass production of the plant
(Ahmad et al., 2004). Several studies have demonstrated that application of different form of fertilizers
either organic, inorganic or bio-fertilizer mitigated the detrimental effect of drought on biomass yield
(Karkanis et al., 2007). Microorganism also plays an important role in enhancing the productivity of
secondary metabolite in plant. For examples, the content of indole alkaloids ajmalicine, serpentine, and
catharanthine has been reported to be increased up to five times when the Catharanthus roseus plant
treated with fungal cell wall fragments (Namdeo et al., 2002). Little information is available about the
effect of drought-stress on biomass production and biochemical content of Andrographis paniculata
grown under SM warrants further investigation.
Therefore, the objective of this study was to stimulate the accumulation of secondary metabolite in
Andrographis paniculata and reduce the adverse effect of water stress on biomass production by growing
the plant in SM containing EFBC.
Materials and Methods
Plant materials
The plant material and seed germination of Andrographis paniculata was prepared by using a physical
scarification method (Talei et al., 2012). After germination, the seedlings with two expanded cotyledons
were transferred into tray with equal proportion of EFBC and CCD (1: 1) (v/v) until 6-8 leaf stage
germination. Then healthy seedlings were transplanted into plastic pots measuring 12 cm × 17 cm with
Page 244
ISBN 978-967-10840-4-5
Proc. Int. Conf. Plt. Phy. 2014
First Published, 2015
238
different ratio of SM. The plant was established for eight weeks and well watered twice a day then
subjected to water stress for 21 days until harvested.
Experimental site and treatments combinations
This experiment was also carried out in the glasshouse, Faculty of Agriculture, Universiti Putra Malaysia.
It was designed to test two main factors which are soilless media (SM) and water stress (WS) treatment.
In this study, the potting media consisted of (i) M1 - solely coconut coir dust (CCD) as control and (ii)
M2 - mixture of CCD and EFBC (7:3, v/v) were used. Besides that, the application of indigenous
microorganism (IMO) as organic enhancer was added to all treatments a week before transplanting as bio-
enhancer and also supplemented with a foliar spray at every 2 weeks. In each application of IMO, the
leaves and the surface of the media were sprayed twice to all pots. The treatment combination comprised
of three water stress (WS) level, which included well watered (WW), moderate stressed (MS) and severe
stressed (SS). Before beginning WS treatment, the field capacity of each pot were measured and all pots
were watered to field capacity (FC). When the plants were subjected to WW condition, continuous
watering was given to maintain the FC to 100% FC. The FC was determined by weighting the pots every
day and at the same time adding the amount of water that equal to the loss in weight from the pots. Under
MS, watering was given to 50% FC at which half of the amount of water loss in weight from the pots. For
SS treatment, the plants were watered only at 25% FC in which quarter amount of water loss in weight
from the pots. The WS treatments were given for 21 days until harvested only after eight weeks of plant
establishment. The plants in the pots were received 60 kg N ha-1
, 15 kg P ha-1
and 20 kg K ha-1
for each of
the plant. Basic fertilizer from urea, muriate of potash (MOP) and Christmas Island rock phosphate
(CIRP) as source of N, P and K were used, respectively. The amount of P and K fertilizer were given
based on the previous finding (Parvin, 2007). The fertilization was applied by top dressing in three split
doses, 50% dose at transplanting, 30% at 15 days after transplanting and 20% before the WS treatment
was began. Following the WS treatment, the pots were weighted at 9:00 am in the morning to obtain daily
cumulative water transpired. The plant was harvested after 21 days receiving WS treatment. Parameters
including plant growth [plant height, number of leaves and total leaf area (TLA)], biomass production and
partitioning (fresh and dry weight of shoot), chlorophyll content and proline accumulation were
determined once only after 21 days of WS treatment.
Plant growth, biomass productionand partitioning
At the end of WS treatment, the plant height and number of leaves were first measured after transplanting
using a standard ruler from the media surface to the tip of the main stem while, the number of leaves
produced or maintained was also recorded. After harvesting, the leaves were individually separated from
the stem and the total leaf area per plant was estimated by using Automatic Leaf Area Meter (LI-3100C
Area Meter). Plants were separated into root and shoot (stem, leaves) and the fresh weight of the shoot
was measured by using a digital balance (QC 35EDE-S Sartorius, Germany). The plants part were dried
individually under sunlight for one day and then oven dried at 40 for 48 h prior the dry weight was
recorded.
Total chlorophyll content
Chlorophyll content was determined using chlorophyll meter (Spad-502, Minolta, Japan) and the value
was converted to mg cm-2
(Coombs et al., 1985).
Page 245
ISBN 978-967-10840-4-5
Proc. Int. Conf. Plt. Phy. 2014
First Published, 2015
239
Proline accumulation
Free proline content in Andrographis paniculata leaves was determined by using the methods described
by Bates et al. (1973). Proline was extracted by homogenizing 0.5 g young fully expanded fresh leaves in
10 ml of 3% aqueous solution of sulfosalsilic acid at 25 °C. The homogenize was then filtered through
Whatman No. 2 filter paper, and 2 ml of the filter reacted with 2 ml of glacial acetic acid and 2 ml of acid
ninhydrin in a test tube for one hour in water bath at 95 °C. The reaction mixture was then cooled in an
ice bath. Then 4 ml of toluene was added to the reaction mixture and mixed vigorously with a test tube
magnetic stirrer for 20 seconds. The toluene layer at the top with pink-red in color was collected with a
pipette. The absorbency of the toluene layer was read at 520 nm by using a UV-visible spectrophotometer
(UV 3101 PC, Shimadzu Co., Ltd., Japan) and toluene was used as blank. The standard curve was
produced with 0 to 30 µg ml-1 of L-proline (Sigma Chemical Co., St. Louis, USA) dissolved in 3%
aqueous solution of sulfosalsilic acid. The curve was then used to determine the proline content of the
samples on a fresh weight basis as the unit was represent as µmol proline g FW-1
.
Statistical analysis
The statistical analysis was determined by using 1 or 2 ways ANOVA using Statistical Analysis System
(SAS) (release 9.3, SAS Institute Inc., Cary, NC, USA). Fisher’s Least Significant Differences (LSD) was
used for comparison of treatments mean when F values were significant at (P ≤ 0.05).
Results and Discussion
Plant height, number of leaves and total leaf area
The plant height of Andrographis paniculata was significantly affected by both media and water stress
treatments (Figure 1A). Increase in the plant height of Andrographis paniculata grown in M2 was noticed
compared to plants grown in control media (M1). However, there were no significant different in the plant
height of Andrographis paniculata grown in M2 media under well watered (WW) and moderate stressed
(MS) condition. Plant height under severe stressed (SS) gave minimum value which differed significantly
from other WS treatment. The plant grown in M1 and M2 exhibited shorter height under MS (43% and
34.4%) and SS (29% and 11.4%) than under WW condition, respectively. The reduction in the plant
height under SS condition in both media is possibly due to the reduction of cell turgor which affect the
cell division and expansion (Luvaha et al., 2008). Similar result have been observed by Kharadi et al.
(2011) when a minimum plant height was observed indicating that the plant is under deficit water stress.
In addition, the sensitivity of the plant cell division, enlargements and differentiations process to water
stress depends on the turgor which is responsible for the growth and development of the plant cell. This
sensitivity results in the decrease in the cell growth when the plant undergoes water stress condition.
These results are in agreement with Tiwari et al. (2013) who found the plant height of each of Jatropa
curcas and common wheat was adversely affected by subjecting the plants to water stress.
The number of leaves of Andrographis paniculata was significantly affected by different combination of
SM and WS (Figure 1B). The number of leaves of plant grown in M2 is increased as compared to plants
grown in control media (M1). The highest number of leaves was observed in plants grown in M2 media
under WW condition. However, there were no significant different in the number of leaves of plant grown
in M2 media under MS and SS treatment. Number of leaves is decreased by increasing the water stress
level and decreased when exposed to MS (47.03% and 48.2%) and SS (35.3% and 66.1%) compared to
WW plant when the plant grown in M1 and M2, respectively. The mean number of leaves of plant grown
in M2 media exhibited 66.67% higher than plants grown in M1. The total leaf area (TLA) of
Page 246
ISBN 978-967-10840-4-5
Proc. Int. Conf. Plt. Phy. 2014
First Published, 2015
240
Andrographis paniculata was significantly affected by SM combination and different WS (Figure 1C).
The maximum TLA was found in plants grown in M2 compared to that of plants grown in control media
(M1) and the highest TLA of plant grown in M2 was registered under WW condition while, there was no
significant difference in the TLA of plants grown in same media and water regime treatment. Plant
subjected to SS condition reduced the TLA of plant grown in both SM. The percentage of TLA of plant
grown in media M2 under SS condition was reduced by 34.4% compared to WW condition. Greater
mean of TLA by 31.2% was resulted under M2 media compared to control media (M1) when averaged
overall different WS level. There was a significant interaction between the SM and WS in TLA of
Andrographis paniculata. It has been reported that decreased in the number of leaves and TLA of plants
are common occurrences in water stressed plants (Luvaha et al., 2008). Less number of leaves under SS
condition attributed to the reduction in the leaf formation and it can be a survival phenomenon by the
plant in order to reduce the transpiration rate (Ahmad et al., 2004). The decline in the TLA of the
Andrographis paniculata under SS might be due to the decrease in the interception of solar radiation
which results in the reduction of biomass of most of the crops. These results are in line with the
conclusion drawn by Zhang et al. (2004) in soybean,Wullschleger et al. (2005) in populous, and (Hayatu
and Mukhtar, (2010) in cowpea in which severe water stress mostly reduced the leaf growth and TLA,
implying an important parameter that indicated the level of stress in plant. In addition, the leaf growth and
plasticity decreased under drought condition in many plant species, such as peanut and Oryza sativa
(Demmig-Adams and Adams Iii, 1992).
Fresh and dry weight of shoot
The shoot dry weight (SDW) and fresh weight (SFW) of Andrographis paniculata was significantly
affected by different combination of SM and different WS (Figure 2A and B), respectively. Although,
there was a significant difference in the SFW and SDW of plants grown in both media M1 and M2 under
different WS, it showed that plant grown in media M2 increased more SFW and SDW as compared to
plants grown in control media (M1). However there was no significant difference in the SFW of plants
grown in media M1 under MS and SS condition while the SFW of plants grown in M2 were differed
significantly under different WS level. In both media WW condition applied exhibited higher SFW and
SDW, than plant under MS and SS condition. Under SS condition, SFW and SDW of Andrographis
paniculata decreased when plant grown in M1 (37.4% and 54.8% ) and M2 (46.1% and 56.7%),
respectively, compared to WW condition. Wu et al. (2008) observed that the adverse influence of water
stress on growth of Sophora davidii could be alleviated with application of appropriate fertilizer.
Similarly, application of suitable fertilizers could significantly enhance the shoot biomass production in
Bupleurum chinense under water stress conditions (Zhu et al., 2009). The mean SFW and SDW of plant
grown in M2 was 44.2% and 92.8% higher, respectively, compared to M1. This indicates that the
availability of plant nutrient supply in media M2 is more than in control media. Similarly in previous
report it has also shown that the EFB compost increased nutrient uptake and yield of palm oil plantation
when used as cultivation media (Zaharah and Lim, 2000). Farahzety and Siti Aishah (2013) reported that
EFBC has great potential to be used in organic cabbage production. In general, drought stress has adverse
effects on the crop production because it inhibits the growth performance of plant, but the application of
suitable rate of fertilizers and microorganism can alleviate these effects (Wu et al., 2008; Zhu et al.,
2009). There was a significant interaction between SM and different WS in both fertilization applications.
Page 247
ISBN 978-967-10840-4-5
Proc. Int. Conf. Plt. Phy. 2014
First Published, 2015
241
Chlorophyll content
The chlorophyll content in the leaf of Andrographis paniculata was significantly affected by growing the
plant in different proportion of SM and different WS (Figure 4A). Different WS treatment resulted in
higher chlorophyll content of plants grown in media M2 than control media (M1). The maximum
chlorophyll content was found in plants grown in M2 under WW condition but the content were not
significantly different with subjecting the plant to MS and SS condition. There were a significant different
in the chlorophyll content of plants grown in M1 under different WS treatment. Subjecting the plant to SS
condition had 44.2% and 51.2% lower chlorophyll content in plants grown in M1 and M2, respectively as
compared to the plants under WW condition. These results are in agreement Mafakheri et al. (2010)
who described a significant decrease of total chlorophyll content caused by water deficit in six wheat and
three chickpea cultivars. A decline of the total chlorophyll due to water regimes treatments reveals a
lower capacity for light harvesting. In this study, higher total chlorophyll content of plants grown in M2
Pla
nt
Heig
ht
(cm
pla
nt-1
)
0
10
20
30
40
50
60WW
MS
SS
(A)a
a
a
bb
b
Nu
mb
er
of
Lea
ves
(lea
f p
lan
t-1
)
0
50
100
150
200
250
300
350 (B)a
ba
baa
Soilless Media
To
tal L
ea
f A
rea
(cm
2
)
0
100
200
300
400
500
(C)
M1 M2
a
a b
bb
b
Figure 1: Plant height (A), number of leaves (B)
and total leaf area (C) of Andrographis
paniculata as influenced by soilless media (SM)
and different water stress level (WS).Vertical
bars represent S.E. of mean followed by the
same letter are not significantly different at (P ≤
0.05).
Soilless Media
Sh
oo
t D
ry W
eig
ht
(g p
lan
t -1
)
0
2
4
6
8
10
12
(B)
M1 M2
a
ba
c
bc
Sh
oo
t F
resh
Weig
ht
(g p
lan
t -1
)
0
2
4
6
8
10
12
14
16
18 WW
MS
SS
(A)a
b
aba
b
Figure 2. Shoot fresh weight (A) and shoot
dry weight (B) of Andrographis paniculata
as influenced by soilless media (SM) and
different water stress level (WS). Vertical
bars represent S.E. of mean followed by the
same letter are not significantly different at
(P ≤ 0.05).
Page 248
ISBN 978-967-10840-4-5
Proc. Int. Conf. Plt. Phy. 2014
First Published, 2015
242
media comprising of CCD and EFB (7:3 v/v) regardless of fertilizer application and across different WS
was noticed than plant grown in solely CCD medium. Similar result was also obtained in previous studies
by Uwumarongie-Ilori et al. (2012) which revealed that additional of EFB as media induced the highest
chlorophyll content in palm oil.
Proline content
The proline content in fresh leaves of Andrographis paniculata was significantly affected by different
combination of SM and WS (Figure 4B). Proline content was found significant and highly increased by
subjecting the plant to SS condition grown in both media M1 and M2 than plant under MS and WW
condition. However, it can be seen clearly that the proline content of plant grown in media M2 under
different WS treatment was significantly higher compared to plants grown under control media (M1).
However, there were no significant difference in the proline content subjecting to MS and SS condition in
plants grown in both media. The proline content of plants grown in M1 and M2 under SS condition was
75.1% and 88.8% respectively higher than under WW condition. Increasing of proline content due to
drought stress has been observed in another researches (Safarnejad, 2004).
Increases in proline content under SS condition were in agreement with Wu (2006) who stated that the
content of free proline in Rosmarinus officinalis L. had significantly increased under water stress. Water
deficits induce dramatic increases in the proline content of phloem sap in medicinal and aromatic plants,
suggesting that increased deposition of proline at the root apex in water stressed plants could in part occur
via phloem transport of proline. A proline transporter gene involved namely ProT2 was determined
strongly induced by water and salt stress in Arabidopsis thaliana (Kharadi et al., 2011). Plant grown in
M2 increased 11.4% higher proline content compared to M1. Growing the plant in EFBC as a biofertilizer
in SM promoted elevated level of proline in the plant leaves. The main reason for this is matric potential
of media M2 might be lower during water stress periods. Similar results were also obtained by Sarkar et
al. (2008) who found that proline content of tomato plant significantly increased when grown in low
matric potential medium.
Page 249
ISBN 978-967-10840-4-5
Proc. Int. Conf. Plt. Phy. 2014
First Published, 2015
243
Conclusions
In summary, it can be concluded that different WS and SM have significant effect on the growth, dry
herbage yield, plant water status, and proline content of Andrographis paniculata. Subjecting the plant to
water stress condition adversely affected the plant growth performance. On the contrary the activity of
secondary metabolites (proline content) increased in the plant leaf tissue. The results also indicated that
application of EFBC (M2) as a growing media and under WW condition for Andrographis paniculata can
enhance the growth performance while activity of secondary metabolites of the plant was increased in M2
media under SS condition. Growing the plant in optimum proportion of SM significantly alleviated the
water stress effect on the plant growth and further increased the proline content of the plant. Proline
accumulation was significantly improved with the combined application of EFBC (M2 + SS) as organic
amendment to SM showed better effects than solely conventional media (CCD).
References
Ahmad, A., Ismail, M.R., Yusop, M.K., Mahmood, M., and Mohd, S. 2004. Physical and chemical
properties of coconut coir dust and oil palm empty fruit bunch and the growth of hybrid heat
tolerant cauliflower plant. Pertanika Journal of Tropical Agricultural Science 27: 121-133.
Aziz, R., 2003. Turning Malaysia Into A Global Herbal Producer: A Personal Perspective. Kuala Lumpur,
Malaysia: University Technology Malaysia, Professional Inaugural Lecture Series.
To
tal C
hlo
rop
hyl
l Co
nte
nt
(mg
cm
-2
)
0
2
4
6
8
10
12
WW
MS
SS
(A)a
a
bb
bc
Soilless Media
Pro
line
Co
nte
nt
(µm
ole
g-1
FW
)
0.0
0.5
1.0
1.5
2.0
2.5
3.0
3.5(B)
M1 M2
a
a
bb
cc
Figure 4.Total chlorophyll (A) and proline content (B) of Andrographis paniculata as influenced by
soilless media (SM) and different water stress level (WS). Vertical bars represent S.E. of mean
followed by the same letter are not significantly different at (P ≤ 0.05).
Page 250
ISBN 978-967-10840-4-5
Proc. Int. Conf. Plt. Phy. 2014
First Published, 2015
244
Bates, L., Waldren, R. and Teare, I. 1973. Rapid determination of free proline for water-stress studies.
Plant and Soil 39: 205-207.
Coombs, J., Hall, D.O., Long, S. and Scurlock, J. 1985. Techniques in bioproductivity and
photosynthesis. Pergamon Press, Oxford, p. 298.
Demmig-Adams, B. and Adams Iii, W. 1992. Photoprotection and other responses of plants to high light
stress. Annual Review of Plant Biology 43: 599-626.
Farahzety, A.M. and Siti Aishah, H. 2013. Effects of organic fertilizers on performance of cauliflower
(Brassica oleracea var. botrytis) grown under protected structure. Journal of Tropical Agriculture
and Food Science 41(1): 15-25.
Gruda, N., 2012. Do soilless culture systems have an influence on product quality of vegetables? Journal
of Applied Botany and Food Quality 82: 141-147.
Hayatu, M. and Mukhtar, F. 2010. Physiological responses of some drought resistant cowpea genotypes
(Vigna unguiculata (L.) Walp) to water stress. Bayero Journal of Pure and Applied Sciences 3:
69-75.
Karkanis, A., Bilalis, D. and Efthimiadou, A. 2007. The effect of green manure and irrigation on
morphological and physiological characteristics of Virginia (flue-cured) organic tobacco
(Nicotiana tabacum). International Journal of Agricultural Research 2: 910-919.
Kharadi, R., Upadhyaya, S., Upadhyay, A. and Sagar, N.P. 2011. Differential responses of plumbagin
content in Plumbago zeylanica L.(Chitrak) under controlled water stress treatments. Journal of
Stress Physiology & Biochemistry, 7: 114- 121.
Luvaha, E., Netondo, G. and Ouma, G. 2008. Effect of water deficit on the physiological and
morphological characteristics of mango (Mangifera indica) rootstock seedlings. American
Journal of Plant Physiology 3: 1-15.
Mafakheri, A., Siosemardeh, A., Bahramnejad, B., Struik, P. and Sohrabi, Y. 2010. Effect of drought
stress on yield, proline and chlorophyll contents in three chickpea cultivars. Australian Journal of
Crop Science 4(8): 580-585.
Namdeo, A., Patil, S. and Fulzele, D.P. 2002. Influence of fungal elicitors on production of ajmalicine by
cell cultures of Catharanthus roseus. Biotechnology Progress 18: 159-162.
Parvin, S., 2007. Response of kalmegh (Andrographis paniculata) to nitrogen and cowdung. The
Bangabandhu Sheikh Mujibur Rahman Agricultural University Master.
Safarnejad, A., 2004. Characterization of somaclones of Medicago sativa L. for drought tolerance.
Journal of Agricultural Science and Technology 6: 121-127.
Sarkar, S., Y.K. , M.E. , S.U. , and a.A. Nukaya, 2008. Possibility of high soluble solid content tomato
production under water stress conditions controlled by matric potential. Journal of the Japanese
Society for Horticultural Science 77: 251-258.
Talei, D., Valdiani, A., Abdullah, M.P. and Hassan, S.A. 2012. A rapid and effective method for
dormancy breakage and germination of King of Bitters (Andrographis paniculata Nees.) seeds.
Maydica 57: 98-105.
Tiwari, N., Purohit, M., Sharma, G. and Nautiyal, A. 2013. Changes in morpho-physiology of Jatropha
curcas grown under different water regimes. Nature and Science of Sleep 11: 76-83.
Uwumarongie-Ilori, E., Sulaiman-Ilobu, B., Ederion, O., Imogie, A., Imoisi, B., Garuba, N. and Ugbah,
M. 2012. Vegetative growth performance of oil palm (Elaeis guineensis) seedlings in response to
inorganic and organic fertilizers. Greener Journal of Agricultural Sciences 2(2276-7770): 26-30.
Wu, F., Bao, Li, W. F. and Wu, N. 2008. Effects of drought stress and N supply on the growth, biomass
partitioning and water-use efficiency of Sophora davidii seedlings. Environmental and
Experimental Botany 63: 248-255.
Wu, X.H., Tang, Z.H. and Zn, Y.G. 2006. Effect of water stress on free amino acid content in Rosmarinus
officinalis L. J. North East Forcs. Univ., 34: 57- 58
Page 251
ISBN 978-967-10840-4-5
Proc. Int. Conf. Plt. Phy. 2014
First Published, 2015
245
Wullschleger, S.D., Yin, T., DiFazio, S., Tschaplinski,T., Gunter, L., Davis, M. and Tuskan, G. 2005.
Phenotypic variation in growth and biomass distribution for two advanced-generation pedigrees
of hybrid poplar. Canadian Journal of Forest Research 35: 1779-1789.
Zaharah, A. and Lim, K. 2000. Oil palm empty fruit bunch as a source of nutrients and soil ameliorant in
oil palm plantation. Malaysian Journal of Soil Science 4: 51-66.
Zhang, M., Duan, L., Zhai, Z., Li, J., Tian, X., Wang, B., He, Z. and Li, Z. 2004. Effects of plant growth
regulators on water deficit-induced yield loss in soybean. In: Proceedings of the 4th International
Crop Science Congress Brisbane, Australia.
Zhu, Z., Liang, Z., Han, R. and Wang, X. 2009. Impact of fertilization on drought response in the
medicinal herb Bupleurum chinense DC.: Growth and saikosaponin production. Industrial Crops
and Products 29: 629-633.
Page 252
ISBN 978-967-10840-4-5
Proc. Int. Conf. Plt. Phy. 2014
First Published, 2015
246
Approaches Used to Compare Cropping Systems
Jagatheeswaran, S.* and Walker, S.
Crops for the Future Research Centre, 43500 Semenyih, Selangor, Malaysia.
*E-mail: [email protected]
Introduction
Intercropping is growing two or more crop species simultaneously on the same field and is a common
practice in most countries in the tropics. Farmers practice different cropping systems in order to increase
productivity of their fields and sustainability of their farms (Hauggard-Nielson et. al., 2001). The most
common advantage of intercropping is to produce a higher yield from a given piece of land by achieving
more efficient use of the available natural resources for crop growth that would otherwise not be utilized
by each single crop grown alone (Lithourgidis et. al., 2011). Therefore, in terms of land use efficiency
intercropping is regarded as more productive than sole cropping (Andrews and Kassam, 1976). Higher
nutrient uptake and better water use efficiency have also been suggested (Dallal, 1974), but probably need
to be tested for each different combination of crops used for intercropping systems.
Better use of solar radiation by intercrops was attributed to increased interception of photosynthetically
active radiation resulting in a higher radiation use efficiency (RUE). Spatial arrangement of intercrops is
an important management practice that can improve radiation interception through a more complete
ground cover (Reddy et al., 1989). However, Keating and Carberry (1993) have suggested that increased
radiation interception due to better ground cover of intercrops may be due to sub-optimal sole crop
population densities used in comparisons.
Doorenbos et al., (1979) defined water use efficiency (WUE) as a measure of the amount of dry matter
produced per unit amount of water evapotranspired. When soil water conditions are not limiting, water
use efficiency differences between plants are insignificant as long as other conditions are not limiting.
However, under water stress conditions crop response to water varies between varieties and at different
growth stages. Maize, for example has a relatively higher WUE than sorghum when soil water conditions
are not limiting. However, sorghum produces more dry matter than maize when soil water is deficient
(Doorenbos et al., 1979). Crop demand for water is generally higher during germination, flowering,
pollination and the early grain-filling stage, so these are often called ‘critical growth’ stages.
The land equivalent ratio (LER) has been developed for use in evaluating the yield advantage of
intercropping systems, particularly under a replacement series. LER is defined as the area that a sole crop
has to occupy in order to produce the same amount as its component in the intercrop (Mead and Willey,
1980; Baldy and Stigter, 1997). Baldy and Stigter (1997) stated that “it is the only method which permits
an effective comparison of different yields from the same surface because each intercrop is compared
with its sole stand”. The LER compares the yield of each part of the intercrop to the yield of that same
species grown alone as a sole crop, thus the advantage of the combination of species or intercrop becomes
obvious.
The objective of this paper was to provide an overall view and evaluation of cereal-legume intercropping
as compare to sole cropping in terms of productivity; radiation use efficiency (RUE), water use efficiency
(WUE) and land equivalent ratios (LER), supported by a number of key examples from the published
literature which point out its great value in the context of sustainable agriculture.
Page 253
ISBN 978-967-10840-4-5
Proc. Int. Conf. Plt. Phy. 2014
First Published, 2015
247
Materials and Methods
This paper is a review of the literature available and also forms a scoping study in preparation for detailed
intercropping trials with underutilised crops, particularly legumes. Searches were performed in the library
collection of books, reports, and proceedings of congresses. All efforts have been made to review articles
and abstracts.
Results and Discussion
Tsubo et al., (2001) reported that the radiation intercepted was higher in maize-bean intercropping than
the sole crop. Tsubo and Walker (2003) found that intercropped bean and maize had 77 % higher RUE
than sole – cropped beans. Keating and Carberry (1993) found that maize – soyabean intercropping has
better use of solar radiation over monocrops. Other studies from outside sub-Saharan African region had
proven the same results (Reddy et al., 1980; Ennin et al., 2002). For RUE the total system radiation
interception can be determined by crop geometry and foliage architecture (Trenbath, 1983). Intercropping
combinations of high and low canopy crops is usually to improve radiation interception and hence yields
of the shorter crops, but it requires that they be planted between sufficiently wide rows of the taller crop
(Seran and Brintha, 2010). Two factors that affects yield in relation to incident radiation in an
intercropping system are the total amount of radiation intercepted and the efficiency with which
intercepted radiation is converted to dry matter (Keating and Carberry, 1993). Therefore, in an evaluation
of an intercropping system, one needs to be sure to measure the total radiation received above and below
the canopy, to calculate that intercepted, as well as the biomass accumulation through the season.
When total LER values were higher than one, the advantage of intercropping over sole stands is shown, in
regard to the use of environmental resources for plant growth and thus crop production (Mead and Willey,
1980). Similar results, of LER>1, were reported for mix-proportions of pea-barley (Chen et al., 2004),
bean-wheat (Hauggaard-Nielsen et al., 2001), and maize-faba bean (Li et al., 1999) showing that the
intercropping of a legume with a cereal is advantageous. The LER values from crop mixtures were
significantly different with each other, having maximum land indices when two crops were grown in the
same rows. It seems profitable on unit area basis to have the two crop combined in the same rows for
most economical yields and the best usage of available land. These results provide documentary evidence
of the superiority of intercropping over sole cropping by having maximum LER from 1.50 to 1.68 (Zada
et al., 1988). Many other scientific articles have reported similar results with various combinations of
crops, and under a range of environmental conditions and locations. For example, a LER from 1.2 to 1.5
(Curnard, 1976), 0.9 to 1.4 and 1.2 to 1.4 (Singh et al., 1973) have been reported from intercropping
maize with soybean under various combinations.
The availability of water is one of the most important factors determining productivity in cereal- legumes
intercropping systems. Improvements of WUE in these type of systems led to an increase in the uses of
other natural resources (Hook and Gascho, 1988), and intercropping has been identified to conserve water
largely because of early high leaf area index (i.e. initial fast leaf expansion) and higher overall combined
leaf area of both crops (Ogindo and Walker, 2005). Garba and Renard (1991) reported that the continuous
pearl millet/forage legumes system was the most efficient in terms of production and water use efficiency.
Hulugalle and Lal (1986) found that WUE in a maize-cowpea intercrop was higher than in the sole crops,
when soil water not limiting. It shows that intercropping results in improved WUE. However, this
improvement could not be attributed to improved consumptive use as the values in the monocrops were
not significantly different from those of the intercrops, meaning that WUE was not affected by crop
interactions arising from intercropping. Rather, WUE improved due to high planting densities in the
intercrops which resulted in higher biomass yield for the equivalent amount of water used. The advantage
Page 254
ISBN 978-967-10840-4-5
Proc. Int. Conf. Plt. Phy. 2014
First Published, 2015
248
of intercropping in terms of WUE occurs only when yields are treated on the basis of land equivalents
(Trenbath, 1974).
Conclusions
Radiation use efficiency (RUE), water use efficiency (WUE) and land equivalent ratios (LER) indices
show that intercropping is more efficient that sole cropping. For example, in maize-legume intercropping
systems, the legume-based cropping systems were 32–49% more profitable than continuous sole maize
under farming conditions in South Africa. These three indices must be calculated from complex
measurements, as the biomass outputs from the systems are not all of identical composition, but have
different protein and carbohydrate contents, therefore the energy values of each must be used when the
combination of crops are compared. This demonstrates that using a combination of physiological, and
quantitative approaches can be useful to assess the diversity of any essentially complex system and
promote overall benefit to all by improving livelihoods and productivity of the water and land which are
the basic natural resources in farming systems.
References
Andrews, D.J. and Kassam, A.H. 1976. In Multiple Cropping. edited by Paperdick, R.I. Sanchez, P.A.
and Triplett, G.B. pg 16.
Baldy, C. and Stigter, C.J. 1997. Agrometeorology of Multiple Cropping in Warm Climates. Science
Publ., USA. Pp. 237.
Dallal, R.C. 1974. Effect of intercropping maize with pigeon peas on grain yield and nutrient uptake.
Experimental Agriculture 10: 219-224.
Doorenbos, J., Kassam, A.H, Bentvelsen, C.L.M., Branscheid, V., Plusje, J.M.G.A., Smith, M.,
Uittenbogaard, G.O. and van Der Wal, H.K. 1979. Yield Response to Water. FAO Irrigation and
Drainage Paper 33: 1-137.
Chen, C., Westcott, M., Neill, K., Wichman, D. and Knox, M. 2004. Row configuration and nitrogen
application for barley–pea intercropping in Montana. Agronomy Journal 96: 1730-1738.
Curnard, A.C. 1976. The influence of interplanting on yield parameters of component plants. In: Ruttle, J.
(ed) Interplanting. Rodale Press INC. Emmaus, Penn.
Ennin, S.A., Clegg, M.D. and Francis, C.A. 2002. Resource utilization in soybean/maize intercrops.
African Crop Science Journal 10(3): 251-261.
Garba, M. and Renard, C. 1991. Biomass production, yields and water use efficiency in some pearl
millet/legume cropping systems at Sadore, Niger. Proceedings of the Niamey Workshop,
February 1991. IAHS Publ. No. 199431-441.
Mead, R. and R.W. Willey. 1980. The concept of a land equivalent ratio and advantages in yields for
intercropping. Experimental Agriculture 16: 217-228
Hook, J.E. and Gascho, G.J. 1988. Multiple cropping for efficient use of water and nitrogen.. In:Hargrove
W.L. (Ed.) Cropping Strategies for Efficient Use of Water and Nitrogen. ASA Special
Publication Number 51. American Society of Agronomy, Inc., Madison, Wisconsin, USA. pp. 7-
20
Hulugalle, N.R. and Lal, R. 1986. Soil water balance in intercropped maize and cowpea grown in a
typical hydromorphic soil in Western Nigeria. Agronomy Journal. 77: 86-90.
Hauggard-Nielson, H., Ambus P. and Jensen, E.S. 2001. Evaluating pea and barley cultivars for
complementary in intercropping at different levels of soil N availability. Field Crops Research 72:
185-196.
Keating, B.A. and Carberry, P.S. 1993. Resource capture and use in intercropping: Solar radiation. Field
Crops Research 34: 273-301.
Page 255
ISBN 978-967-10840-4-5
Proc. Int. Conf. Plt. Phy. 2014
First Published, 2015
249
Ogindo, H.O. and Walker, S. 2005. Comparison of measured changes in seasonal soil water content by
rained maize-bean intercrop and component cropping in semi-arid region in South Africa. Phys.
Chem. Earth. 30(11-16): 799-808.
Li, L., S. Yang, X. Li, F. Zhang and F. Christie. 1999. Interspecific complementary and competitive
interactions between intercropped maize and faba bean. Plant Soil 212: 105-114.
Lithourgidis, A.S. Dordas, C.A. Damalas, C.A. and Vlachostergios, D.N. 2011. Annual intercrops: Ann
alternative pathway for sustainable agriculture. Australian Journal of Crop Science 5(4): 396-410.
Reddy, S.N., Reddy, E.V.R., Reddy, V.M. Reddy, M.S. and Reddy, P.V. 1989. Row arrangement in
groundnut/pigeonpea intercropping. Tropical Agriculture 66: 309-312.
Reddy, M.S., Floyd, C.N. and Willey, R.W. 1980. Groundnut in intercropping systems. In: Proceedings
of the International Workshop on Groundnuts, 13-17 October 1980, ICRISAT Center Patancheru,
India.
Seran, T.H. and Brintha, I. 2010. Review on maize based intercropping. Journal of Agronomy 9(3): 135-
145.
Singh, J.P, Neti, P.S., and Tripathy, K.S. 1973. Studies on intercropping soyabean with maize and jawar.
Indian Journal of Applied Sciences 4; 201-204
Trenbath, B.R. 1974. Biomass production of mixtures. Advances in Agronomy 24: 117-120.
Trenbath, B.R. 1983. The dynamic properties of mixed crops. In: Roy, S.K. (Ed.). Frontiers of Research
in Agriculture. Calcutta, India: Indian Statistical Institute. pp. 265-286.
Tsubo, M. and Walker, S. 2003. Shade effects on Phaseolus vulgaris L. Intercropped with Zea mays L.
under well- watered conditions. Journal of Agronomy and Crop Science 190: 168-176.
Tsubo, M., Walker, S. and Mukhala, E. 2001. Comparisons of radiation use efficiency of mono-/inter-
cropping systems with different row orientations. Field Crops Research 71(1): 17-22.
Zada, L. Ahmad, S. and Nazar, M.S. 1988. Land equivalent ratios, relative yields and relative yield totals
of intercropped maize and soybean. Pakistan Journal of Agricultural Research 9(4): 122-143.
Page 256
ISBN 978-967-10840-4-5
Proc. Int. Conf. Plt. Phy. 2014
First Published, 2015
250
Corm Nursery Technique for Mass Propagation of Banana Seedlings of Musa
acuminata cv. Berangan
Ahmad Yusuf, M.K.1 and Suhaimi, O.
1,*
1Faculty Agro Based Industry, Universiti Malaysia Kelantan Jeli Campus, 17600 Jeli, Kelantan, Malaysia.
*E-mail: [email protected]
Introduction
Banana is the fourth most important fruit crop in the world (Saha et al., 2010) and grown in 132 countries
worldwide. It is believed to be originated from the Southeast Asia and it is an important crop in Malaysia.
However, disease outbreak had caused the reduction of banana production. The diseases are transmitted
from infected banana tree to the banana seedling such as banana suckers and it also can be transferred via
pest. Banana suckers are the product of conventional propagation method and through this method it is
very difficult to breed banana seedling with resistance to disease (Namuddu et al., 2013). Besides that,
naturally regenerated suckers often harbored pest and diseases (Njau et al., 2011). Thus, a simple
technique to produce free disease planting materials of banana is required.
Besides, the other constraint in the cultivation of banana is inconsistence supply of quality banana
planting materials. Micro propagation technique also known as tissue culture technique is used to
propagate disease-free planting materials (Kamaludin et al., 2012) and also as a tool for mass propagation
of banana planting materials. However, tissue culture technique required expensive instruments and
sophisticated technique, skill and cares to handle (Dayarani et al., 2013). In Malaysia, cultivators of
banana are mainly from smallholder. Smallholder always cultivate banana in small scale. Normally, they
get the banana seedling either from tissue culture seedling which is sometimes expensive and depends on
accessibility.
Since there is no formal standards to regulate banana planting material (Macharia et al., 2010), the
growers use conventional method to produce banana planting material as an alternative to reduce the cost
of production rather than buying tissue culture banana seedlings. However, these suckers are prone to pest
and disease attack. In conventional propagation there are two types of banana sucker being used; sword
and water suckers. Sword suckers are recommended because it has better output yield (Robinson and
Sauco, 2010). The problem with these conventional seedlings is its availability, where water sucker
cannot be utilized because of low quality and sword sucker produced is not as much as tissue culture
seedling. Thus, a simple and cheaper technique is needed to produce banana seedling and that is why
corm nursery technique of banana was introduced.
Corm nursery technique is a macro propagation method of banana which will not only help the
smallholder to cultivate the banana but they also can generate their income from producing banana
seedling. Corm nursery technique of banana can provide the smallholder with both availability and
accessibility of banana seedling. This technique can be installed in their farm and by performing this
technique they can mass propagate banana seedling in faster period. This macro propagation technology
can use whole suckers, large pieces of parent corms or sword suckers to produce planting material
(Dayarani et al., 2013). In corm nursery technique, the material used is banana corm. This technique
consists of several parts; corm preparation (corm-prep), corm seedling in polybag (corm-poly) and
stacking of corm-poly (corm-stad). In each technology, selection is made to grade a better quality of
banana planting material. In conventional propagation of banana, whole one sucker is used while giving
high growth rate but produce less. In corm nursery technique, a whole one sucker’s corm is slice to
produce more section. Thus, the objectives of this experiment are to evaluate whether corm nursery
Page 257
ISBN 978-967-10840-4-5
Proc. Int. Conf. Plt. Phy. 2014
First Published, 2015
251
technique can mass propagate or not based on seedling emergence percentage and number of seedling
produced, and to identify growth performance of new seedling from corm nursery technique based on
plant height.
Materials and Methods
Study area
The experiment was taken place at banana plantation of Musa acuminate cv. Berangan in Bukit Perawas,
Ayer Lanas, Jeli, Kelantan. The plantation was actually integrated farm, where rubber tree is integrated
with banana. This farm had been established since 2012 with an area of approximately six acres of land.
Selection of corm
The selection of banana corms started from the selection of farm, where banana corms were collected
from the non-infected farm. Banana farms are normally infected by diseases such as black and yellow
Sigatoka (Castelan et al., 2012) and Panama disease caused by Fusarium oxysporum (Borges et al., 2004),
where these diseases are very dangerous and need to be avoided in order to produce high quality of
banana planting materials. The symptoms of the diseases are clearly can be seen on the tree. Thus, healthy
banana corms were selected from healthy banana trees or suckers without the symptoms of those diseases.
Cleaning and sterilization of corm
The selected banana corms were sterilized in order to kill microorganism, insect, and nematode. The
corms were soaked into sodium hypochlorite (Chikezie, 2012) with 50% concentration for 15 min and
were washed with plain water. After the sterilization process, the treated corms were exposed to the
sunlight for drying process for one day.
Corm nursery technique
Corm Preparation (corm-prep)
Again the treated corms were graded according to size and then it was sliced horizontally from side of the
corm. The treated corms then were layout on the bed with the mixture of coco peat and compost with the
ratio of 3:1. Coco peat has good physical properties, high total pore space, high water content, low
shrinkage, low bulk density and slow biodegradation (Evans et al., 1996; Prasad, 1997; Jadwiga, 2008).
The bed with the established treated corms was then covered with polyethylene tarp (PE) which it create
the dark environment and retain the humidity and heat of the bed for early bud induction (Robin, 2010).
Corm Seedling in Polybag (corm-poly)
Again banana seedling that grows from banana corm was selected to consider the uniformity. Banana
seedlings were then transferred into 22 14 cm polybag at the 21 days after layout. The same media was
used, the mixture of coco peat and compost were used.
Propagation banana seedling through conventional method
The sword sucker and water sucker were excised from the mother plant and the pseudostem was cut left
out only corm of the suckers. The materials were then undergoing sanitization process to clean from soil
Page 258
ISBN 978-967-10840-4-5
Proc. Int. Conf. Plt. Phy. 2014
First Published, 2015
252
and pest. Treated corm of sword and water sucker were then layout on the bed same as corm nursery
technique. But in the conventional technique of propagating banana, soil is used as a media.
Maintenance of the corm
The corms were let to grow for seven weeks and along the weeks the beds were watered evenly with one
liter water once every two days and if it is not raining, it was watered every day.
Experimental design
There were two factors which are method of propagation (conventional method and corm nursery
technique) and types of sucker (sword sucker and water sucker). These two factors were combined to be a
factorial design with three replications for each treatment and were layout in a completely randomized
design (CRD). Each sample was randomly layout on the bed by using random number table (New York:
The Free Press, 1955).
Data collection
The plants were let to grow for seven weeks, prior to the emergence or production of new seedlings.
Parameters that were taken are seedling emergence percentage, seedling height and number of seedling
produced.
Emergence rate and emergence percentage
Emergence rate is how fast the new seedlings can emerge and emergence percentage is how many
emergences occur out of 80 corms. This data is simple to collect only by counting the emergence of the
new seedling for seven weeks.
Measurement of seedling height
The height of the new seedling was taken from the point at the above surface up to the point at the last
intersection of two new leaves. Plant height was taken to see the growth rate of the plant and to determine
the quality of the plant.
Number of seedling produced
Number of seedling were count every once a week in each factors or treatment to determine which
treatment has the highest number of seedling.
Data analysis
Firstly, all of the data taken were test with Kolmogorov-Smirnov Z test to check the normality. The
normal data then tested with ANOVA to see the different in each treatment and the significant data then
further analyzed with post-hoc analysis. For the abnormal data also called non-parametric data of
ANOVA were tested with non-parametric Kruskal-Wallis test (Rosner, 2000).
Page 259
ISBN 978-967-10840-4-5
Proc. Int. Conf. Plt. Phy. 2014
First Published, 2015
253
Results and Discussion
Percentage of seedling emergence
Based on Figure 1, there are not much of differences between both methods. Test of normality found that
the data were not normally distributed with Kolmogorov-Smirnov Z of 0.00. This suggested that the use
of one-way analysis of variance or ANOVA was not appropriate to test the difference of mean emergence
percentage among the four groups. Instead the Kruskal Wallis H test, a non-parametric test which does
not require normality of the data, was used. The test resulted in a fairly small Chi-Square value of 2.40
which was not significant at 0.05 level of significance (p = 0.49). Therefore, this study concludes that the
mean emergence percentage of the different methods of propagation with different sucker’s corm type
were similar in conventional method (sword sucker), conventional method (water sucker), corm
techniques (sword sucker), and corm techniques (water sucker).
Both techniques having similar mean percentage of seedling emergence probably because Bayeri and Aba
(2007) said that corm is a nutrient reserve and with the support information from Tropical Permaculture
(2007), what can be tells is that corm has growing points and they turn into new suckers with the support
from its nutrient reserved. However, there were slight different in types of sucker used, where sword
sucker was slightly higher in terms of mean percentage of seedling emergence compared to water sucker
based on the preliminary data, Figure 1. Thus, as mentioned by Robinson and Sauco (2010), the growth of
sword sucker is better and faster than water sucker because it has strong physical and physiological
connection with mother plant.
Kruskal-Wallis, chi-square=2.40, Significant value=0.49
Figure 1. The mean percentage of seedling emergence from different methods of propagation with
different type of sucker’s corms.
Number of seedling
Test of normality found that the data were not normally distributed with Kolmogorov-Smirnov Z of 0.00.
This suggested that the use of one-way analysis of variance or ANOVA was not appropriate to test the
difference of emergence percentage among the four groups. Instead the Kruskal Wallis H test, a non-
parametric test which does not require normality of the data, was used. The test resulted in a fairly large
Chi-Square value of 9.83 which was significant at 0.05 level of significance (p = 0.02).
Page 260
ISBN 978-967-10840-4-5
Proc. Int. Conf. Plt. Phy. 2014
First Published, 2015
254
Therefore, this study concludes that the total seedling produced from different methods of propagation
with different sucker’s corm type were different in conventional method (sword sucker), conventional
method (water sucker), corm techniques (sword sucker), corm techniques (water sucker). However,
further analysis by using Duncan was used and it discovered that the difference only occurred among
method of propagation used and there were no significant different among sucker types in both
propagation method (Table 1).
Corm nursery technique has higher number of seedling produced compared to conventional. According to
Namuddu et al. (2013), conventional method has low number of seedling is because this method is very
difficult to breed banana seedling. Corm nursery technique can produce more seedlings because the corm
was sliced the apical dominance of the corm was repressed and this is consistent with finding of Dayarani
et al. (2013) about that this technique in which apical dominance is repressed to stimulate lateral bud
development and increased suckering rate.
Table 1. The mean rank of seedling number produced in different propagation methods with different
sucker types.
Sources of Mean (Treatment) Total Seedling Produced Mean Rank of Seedling Produced
Conventional (Sword Sucker) 39 48.63a
Conventional (Water Sucker) 44 53.47a
Corm Technique (Sword Sucker) 71 71.53b
Corm Technique (Water Sucker) 66 68.37b
Kruskal-Wallis, chi-square=9.83, Significant value=0.02, a ≠ b
The height of seedling
Preliminary analysis of the data revealed that an average of seedling height for the different methods of
propagation with different sucker types are 19.11 cm, but the average of seedling height in each of the
method used seemed to be different. Corm technique with sword sucker had the highest seedling height
and conventional method with water sucker had the lowest (Figure 2). Therefore, one of the appropriate
hypotheses in his study is that, there is a significant difference in the seedling height for the different
methods of propagation with different sucker types. To test this hypothesis, the one-way ANOVA was
used. ANOVA yield a significant result with F-ratio 12.97 and p value 0.00 which was significant at the
0.05 level. Therefore, it can be concluded that the different methods of propagation with different sucker
types had different average of seedling height.
From the analysis of Post-hoc test by using Duncan test, there were no significant different in seedling
height for both type of sucker’s corm used in corm technique. However, height of seedlings that emerged
in corm technique was varied significantly from the height of seedling grown under conventional method.
In the conventional method, seedling height of sword sucker was significantly different from seedlings
height of water sucker. Thus, in terms of mean seedling height, corm nursery technique was better than
conventional methods. Kasyoka et al. (2010) studies showed that, conventional method of propagation is
a slow process and quite often does not yield adequate suckers of the desired varieties, where the results
of this experiment also described the process of conventional method in the same manners. Whereas,
corm nursery technique has better performance and faster in process this is probably because of the
propagation media.
Page 261
ISBN 978-967-10840-4-5
Proc. Int. Conf. Plt. Phy. 2014
First Published, 2015
255
F-value= 12.969, P-value=0.000
Figure 2. The mean of seedling height from different propagation methods and different type of sucker’s
corm.
The initiation media used in the corm nursery technique was coco peat, as mentioned before by Jadwiga
(2008), coco peat has good physical properties, high total pore space, high water content, low shrinkage,
low bulk density and slow biodegradation and as reported by Bayeri and Aba (2005), the initiation media
which served as anchorage, moisture supply source and helped in proper root aeration. Besides that,
further study about this soilless media by Farzad et al. (2011), said that soilless media have proven
popular with the majority of producers because of consistency, excellent aeration, reproducibility, and
low bulk density. In contrast, the initiation media used in the conventional method was soil which
naturally exists in Jeli area and this soil has less aeration for root development and drainage compared to
coco peat. Soil is prone to compaction where Beattie and White (1992) and Jadwiga (2008) found that
compacted or heavy soils without drainage and less aeration, suppressed the development of root and also
increase the chances for the plant to be susceptible to soil borne diseases.
Table 2. The mean of seedling height among propagation methods with different sucker types.
Sources of Mean (Treatment) Mean of Seedling Height
Conventional (Sword Sucker) 17.83a
Conventional (Water Sucker) 13.55b
Corm Technique (Sword Sucker) 23.59c
Corm Technique (Water Sucker) 21.45c
F-value= 12.969, P-value=0.000, a ≠ b ≠ c
Conclusions
Corm nursery technique can help in mass propagate banana seedling of Musa acuminata cv. Berangan.
Besides that, the growth of banana seedlings of corm nursery technique was higher than banana seedling
from conventional method based on descriptive statistics. Not only banana of Musa acuminata cv.
Berangan, this corm nursery technique can also be implemented in propagating other types of banana and
plantain. But further study need to be done to improve the technique, so it can produce better quality of
banana planting materials.
Page 262
ISBN 978-967-10840-4-5
Proc. Int. Conf. Plt. Phy. 2014
First Published, 2015
256
References
Anonymous. 2008. International Tropical Fruits Network. Retrieved July 10, 2014 from
http://www.itfnet.org/index_archive.jsp?page=1&process=11&mid=1&fid=13.
Baiyeri, K.,P. and Aba, S.C. 2005. Response of Musa species to macro-propagation. 1:
Genetic and initiation media effects on number, quality and survival of plantlets at pre
nursery and early nursery stages. African journal of Biotechnology 4(3): 223-228.
Baiyeri, K.P., and Aba, S.C. 2007. A review of protocol for macropropagation in Musa
species. Fruits, Vegetables and Cereal Science and Biotechnology 1(2): 110-115.
Beattie, D.J. and White, J.W. 1992. Lilium – hybrids and species. In: De Hertogh A.A. and Le Nard
M. (eds.). The Physiology of Flower Bulbs. Elsevier, Amsterdam.
Borges, A.A., Borges-Pérez, A. and Fernández-Falcón, M. 2004. Induced resistance to Fusarium
wilt of banana by menadione sodium bisulphate treatments. Journal of Crop Protection 23(12):
1245-1247.
Castellan, F.P., Saraiva, L.A., Lange. F., de Lapeyre de Belllaire, L., Cordenunsi, B.R. and Chillet,
M. 2012. Effects of black leaf streak disease and Sigatoka disease on fruit quality and maturation
process of banana produced in the subtropical conditions of southern Brazil. Journal of Crop
Protection 35: 127-131.
Chikezie, U.N.Y. 2012. Effect of ascorbic acid on blackening and sprouting of Musa spp shoot
tips. Journal of Biotechnology and Bioinformatics 2(2): 11-17.
Dayarani, M., Dhanarajan. M.S., Uma, S. and Durai, P. 2013. Macro propagation for
regeneration of wild bananas (Musa spp.). Advanced Biology and Technology 12: 2319-6750.
Evans, M.R., Konduru, S. and Stamps, R.H. 1996. Source variation in physical and chemical
properties of coconut coir dust. HortScience 31: 965-967.
Farzad, N., Homayoun F., Morteza, K. and Hassan, S. 2011. Effects of coir as a component of
potting media on growth, flowering and physiological characteristics of hyacinth (Hyacinthus
orientalis L. cv. Sonbol-e-Irani). International Journal of Agricultural and Food Science 1(2): 34-
38.
Jadwiga, T. 2008. The effects of cocopeat and fertilization on the growth and flowering of
oriental lily ‘star gazer’. Journal of Fruit and Ornamental Plant Research 16: 361-370.
Kamaludin, R., Arash, N., Rofina, Y. O., Nurul, A.I., Shamrul, A. and Shahril, E. 2012.
Micropropagation of ornamental plant Musa beccarii through tissue culture technique using
suckers and male buds as explants. Life Science Journal 9(4): 2046-2053.
Kasyoka, M.R., Mwangi, M., Kori, N., Gitonga, N. and Muasya, R. 2010. Evaluating the
macropropagation efficiency of banana varieties preferred by farmers in Eastern and Central
Kenya. Second RUFORUM Biennial. Research application summary.
Macharia, I., Kagundu, A.M., Kimani, E.W. and Otieno, W. 2010. Combating phytosanitary
constraints to banana (Musa spp.) production: the Kenyan Example. Acta Horticulturae 879: 561-
565.
Namuddu, A., Kiggundu, A., Mukasa, S.B., Kurnet, K., Karamura, E. and Tushemereirwe, W.
(2013). Agrobacterium mediated transformation of banana (Musa sp.) cv. Sukali Ndiizi (ABB)
with a modified Carica papaya cystatin (CpCYS) gene. African Journal of Biotechnology 12(15):
1811-1819.
New York: The Free Press. 1955. A million random digits with 100,000 normal deviates. The
Rand Corporation
Njau, N., Mwangi. M., Kahuthia-Gathu, R., Muasya, R. and Mbaka, J. 2011. Macropropagation
technique for production of healthy banana seedlings. African Crop Science Conference
Proceedings, 10: 469-472.
Prasad, M. 1997. Physical, chemical and biological properties of coir dust. Acta Horticulturae 450:
Page 263
ISBN 978-967-10840-4-5
Proc. Int. Conf. Plt. Phy. 2014
First Published, 2015
257
21-29.
Robin, M. 2010. Using plastic mulch in the garden. Retrieved July 14, 2014 from
www.eagleheightsgardens.org/tips/plastic_mulch_handout.pdf.
Robinson, J.C. and Sauco, V.G. 2010. Bananas and plantains. 2nd Edition, CABI International,UK
Rosner, B. 2000. Fundamentals of Biostatistics, California: Duxbury Press.
Saha, R.O., Pranay, B. and Kumar, S.G 2010. Micropropagation and Field Performance of‘Malbhog’
(Musa paradisiaca, AAB group): A popular Banana Cultivar with High Keeping Quality OH
North East India. Tree and Forestry Science and Technology, Global Science Book.
Page 264
ISBN 978-967-10840-4-5
Proc. Int. Conf. Plt. Phy. 2014
First Published, 2015
258
Effect of Ratios on pH and Selected Nutrient Contents in Compost Tea
Produced from Agricultural Waste
Saidin, A.A.1,*
, Kasim, S.1, Ahmed, O.H.
1 and Shuib, E.M.
1
Department of Crop Science, Faculty of Agriculture and Food Science, Universiti Putra Malaysia
Bintulu Campus, Sarawak, 97008, Bintulu, Sarawak, Malaysia.
*E-mail: [email protected]
Introduction
Compost tea or known in agriculture sectors as compost extract is fermented watery extract of
compost materials produced from mixing matured composts with water. Compost tea can be prepared
using a wide range of composts and nutrients extracted from this process may supply organic matter
to the soil, improving soil structure and water holding capacity by improving soil aggregates (Shrestha
et al., 2011). Utilization of compost tea improved soil quality because they can alter the chemical and
physical properties of soil. Compost tea may improved water holding capacity and organic matter
content, microbial population, supply micro and macro nutrient concentration that are necessary in
promoting high crop yield. Compost tea can also be used in fertigation system. Cultivation of
muskmelon (Cucumis melo L.) under fertigation system using compost tea had enhances growth,
yield, and quality (Naidu et al., 2013). As an inorganic fertilizer NPK mixed with compost tea at
50:50, the vegetative growth, yield, and antioxidant content in the Centella asiatica L. increased
(Siddiqui et al., 2011). Compost tea can be used as an alternative source in substituting the chemical
fungicides (Siddiqui et al., 2009). Although compost tea has many functions in soil, plant and
ecosystem as a whole, limited study can be found in relation to ratios and quality of compost tea
(Archana et al., 2012). Thus, a study was conducted in the laboratory to identify the effect of ratio on
pH and nutrients content in the compost tea.
Materials and Methods
Chicken manure was collected from poultry unit, University Agriculture Park at Universiti Putra
Malaysia Bintulu Campus (UPMKB) while sawdust was collected from Ling Brothers Sdn. Bhd. at
Bintulu City. The dried sawdust and CaCO3 were weighed and mixed thoroughly with the chicken
manure slurry in the polystyrene box. The preparation of chicken manure slurry was carried out by
dissolving the chicken manure in washing machine wastewater and then it was poured into the
polystyrene box. All the materials were mixed thoroughly and the moisture in the compost pile was
maintained at the optimum level which was between 60 to 70%. The composting was conducted in
polystyrene box size of 38 cm x 36 cm x 32 cm. The composting experiment was conducted at
Research Complex in Universiti Putra Malaysia Bintulu Campus. The initial temperature of the
compost was monitored 3 times per day (morning, afternoon and evening) until the temperature
reached ambient temperature. Mature compost was air-dried to remove the moisture content and pH
and nutrients concentration in the compost were analyzed. Compost tea was prepared by mixing
washing machine disposal water with mature compost. Washing machine wastewater was firstly
collected from the hostel laundry in Sri Rajang College. About 5 g of mature compost was weighed
and placed into the tea bag. Then they were placed into the incubation bottle for compost tea
extraction purposes. Different amount of washing machine disposal water in different volume was
then poured into the incubation bottle and the mixture was leaved for 30 days for incubation. Compost
tea was filtered to remove the sediments and nutrient concentrations in compost tea were analyzed for
pH, NH4+, NO3 and P. Total NH4
+ and NO3
were analyzed using distillation method and P
concentration was analyzed using Blue Development Method. The pH of compost tea was analyzed
by using Mettler Toledo pH meter and other nutrient concentrations were analyzed using Atomic
Absorption Spectroscopy (AAS).
Page 265
ISBN 978-967-10840-4-5
Proc. Int. Conf. Plt. Phy. 2014
First Published, 2015
259
Results and Discussion
The characteristics of chicken dung and sawdust compost are presented in Table 1. The produced
compost was alkaline in pH (8.45). This indicates that the produced composts are well aerated
because well aerated compost pile generally produced high pH compost (Iglesias-Jimenez and Perez-
Garcia, 1992). Compost tea prepared from chicken dung and sawdust at 1:1 ratio was significantly
affect the pH, NO3 , NH4+
, P, K, Ca, Cu and Zn contents (Table 3 and Figure 1) as different ratios
used for the extraction of compost tea (1:10, 1:20, 1:30, 1:40 and 1:50). Ratio of 1:10 was the best
ratio to maximize the amount of NH4+, NO3
-, P, K, Ca, Cu and Zn contents. This might be due to the
present of high concentration of humic acid in the compost tea at 1:10 ratio.
The pH of the compost tea ranges from 8.80 to 9.96 (Table 3). The increasing volume of the washing
machine disposal water during extracting the compost not significantly affects the pH value. The
compost tea showed highest pH at 1:10 ratio (9.66) followed by 1:50 (9.25) (Table 3). This could be
due to high amount of compost used during the extraction of compost tea or might be caused by the
dissolution of organic acid in the compost. As reported by Stephen (1996), alkaline solution might
have neutralization effect on the organic acids present in the compost extract. Alkaline solution and
organic acids in compost might react together and produced water and ionic compound which affect
the pH value.
The concentration of NO3 , NH4+
, P, K, Ca, and Mg in the compost tea was significantly affected by
the volume of the washing machine disposal water added during extraction process. The nutrients
present in the washing machine disposal water might contribute to the nutrient concentration in the
compost tea. The characteristics of the washing machine disposal water are presented in Table 2. High
concentration of Na and surfactants in soap powders used in the laundry has make the compost extract
pH to be increased (Dixon et al., 1999). Amount of NH4+
extracted from the compost was slightly
decreased at 1:40 (144.71 mg/L) and 1:50 (147.08 mg/L) ratios as compared to other ratio (Figure 1).
In order to maximize the amount of N03 , P, K, Ca and Zn, the compost tea required 1:10 ratio (Table
3). In contrast, 1:30 was required by the compost to extract the maximum amount of Mg while Na
required 1:50 ratio (Table 3). Ratio of 1:40 and 1:50 was required by the compost to extract the
maximum amount of Cu (Table 3).
Table 1. Selected characteristics of chicken dung and sawdust compost (1:1 ratio). Parameters Value
pH 8.45
N (%) 1.26
P (mg/kg) 3.47
K (mg/kg) 3783.96
Ca (mg/kg) 24825.48
Mg (mg/kg) 1174.08
Na (mg/kg) 2949.66
Table 2. Selected characteristics of washing machine wastewater. Parameters Concentration Standard Concentration (provided
by other researchers)
pH 8.78 8.3-9.3
Total N (mg/L) Nd 14.28
Total P (mg/L) 99.9 51.58
Ca (mg/L) 385.83 18.7-24
Mg (mg/L) 41.97 15.1-60.8
Na (mg/L) 228633 302.1-667
Cu (mg/L) Nd 0.0064-0.01
Zn (mg/L) Nd 0.14
Source: Dilip and Kunwar (2013); Jamrah et al. (2011); Jamrah et al. (2008); Kotut et al. (2011); Prataphar et
al. (2005); Friedler (2004); Jeffersen et al. (2004); Nd- Not determined
Page 266
ISBN 978-967-10840-4-5
Proc. Int. Conf. Plt. Phy. 2014
First Published, 2015
260
Table 3. Effect of ratio on pH and selected nutrient concentration in compost tea. Ratio pH P
(mg/L)
K
(mg/L)
Ca
(mg/L)
Mg
(mg/L)
Na
(mg/L)
Zn
(mg/L)
Cu
(mg/L)
1:10 9.66a
103a
295.00a
374.50a
49.00ab
253.50b
4.08a
8.27ab
1:20 9.11a
63.5b
228.50b
292.00bc
42.33bc
250.00b
3.62ab
7.93b
1:30 8.97a
53.0d
277.50a
317.50b
52.50a
237.50b
3.35ab
8.53ab
1:40 8.80a
70.0bc
224.00b
297.00bc
37.33bc
233.50b
2.90b
8.97a
1:50 9.25a
71.7b
240.00b
282.00c
32.50c
303.00a
3.75a
8.90a
Note: Means with the different letter in column were not significantly different using Tukey Studentized Range
Test at p≤0.05
Conclusions
Different ratio used during the extraction process affect the characteristics of compost tea. The
compost required specific ratio to enhance their pH and nutrients concentration in the compost tea.
Acknowledgements
The researchers would like to acknowledge the financial support of this research by Ministry of
Education Malaysia under Knowledge Transfer Program Grant (6204300) and Universiti Putra
Malaysia.
References
Archana, P., Theodore, J.K., Nguyen, V. and Robert, E. 2012. Biochemical properties of compost tea
associated with compost quality and effects on pakchoi growth. Scientia Horticulturae 148:
138-146.
Christova-Boal, D., Eden, R.E. and McFarlane, S. 1996. An investigation into greywater reuse for
urban residential properties. Desalination 106: 391-397.
Dilip, M. and Kunwar, D. 2013. Characteristics and treatment of greywater-a review. Environment
Science Pollution Resources 20: 2795-2809.
Dixon, A., Butler, D. and Fewkes, A. 1999. Water saving potential of domestic water reuse systems
using greywater and rainwater in combination. Water Science and Technology 39: 25-32.
Friedler, E. 2004. Quality of individual domestic greywater streams and its implication for on-site
treatment and reuse possibilities. Environmental Technology 25: 997-1008.
Figure 1 Effect of ratio on NH4+
and NO3- content in compost tea
Page 267
ISBN 978-967-10840-4-5
Proc. Int. Conf. Plt. Phy. 2014
First Published, 2015
261
Hernandez, L., Zeeman, G., Temmink, H. and Buisman, C. 2007. Characterization and biological
treatment of greywater. Water Science Technology 56: 193-200.
Iglesias-Jimenez, E. and Perez-Garcia, V. 1992.Determination of maturity indices for city refuse
composts. Agricultural Ecosystem Environment 38: 331-343.
Jamrah, A., Al-Futaisi, A., Prathapar, S. and Al-Harrasi, A. 2008. Evaluating greywater reuse
potential for sustainable water resources management in Oman. Environmental Monitoring
Assessment 137: 317-320.
Jamrah, A., Al- Omari, A., Al- Qasem, L. and Abdel Ghani, N. 2011. Assessment of availability and
characteristics of greywater in Amman. Water International 31(2): 210-220.
Kotut, K., Nganaga, V.G. and Kariuki, F.W. 2011.Physico-chemical and microbial quality of
greywater from various households in Homa Bay Town. Open Environment English Journal
4: 162-169.
Jefferson, B., Palmer, A., Jeffery, P., Stuez, R. and Judd, S. 2004. Grey water characterisation and its
impact on the selection. Water Science Technology 50(2): 157-164.
Leconte, M.C., Mazzarino, M.J., Satti, P., Iglesias, M.C. and Laos, F. 2009. Co-composting of rice
hulls and or sawdust with poultry manure in NE Argentina. Waste Management 29: 2446-
2453.
Pidou, M., Avery L., Stephenson, T., Jeffery, P., Simon, A.P., Shuming Liu, Fayyaz, A., Memon, B.,
and Jefferson, P. 2008. Chemical solutions for greywater recycling. Chemosphere 71: 147-
155.
Prathapar, S.A, Jamrah, A., Ahmed, M., Al-Adawi, S., Al-Sidari, S. and Al-Harassi, A. 2005.
Overcoming constraints in treated greywater reuse in Oman. Desalination 186: 177-186.
Ramon, G., Green, M., Semiet, R. and Desoretz, C. 2004. Low strength greywater characterization
and treatment. Desalination, 170: 241-250.
Shrestha, K., Shrestha, P., Walsh, K.B., Harrower, K.M. and Midmore, D.J. 2011. Microbial
enhancement of compost extracts based on cattle rumen content compost characterisation of a
system. Bioresource Technology 102: 8027-8034.
Siddiqui, Y., Meon, S., Ismail, R. and Rahmani, M. 2009. Bio-potential of compost tea from agro-
waste to suppress Choanephora cucurbitarum L. the causal pathogen of wet rot of okra.
Biological Control 49: 38-44.
Siddiqui, Y., Islam, T.M., Yuvarani, N. and Sariah, M. 2011. The conjunctive use of compost tea and
inorganic fertiliser on the growth, yield and terpenoid content of Centella asiatica (L.). Urban
Science Horticulture 130: 289-295.
Page 268
ISBN 978-967-10840-4-5
Proc. Int. Conf. Plt. Phy. 2014
First Published, 2015
262
Effect of Using Leguminous Cover Crop (Calopogonium mucunoides Desv.)
on Leaf N, Chlorophyll Content and Gas Exchange Rate of Black Pepper
(Piper nigrum L.)
Sulok, K.M.T.1,*, Zainudin, S.R.
2, Jarroop, Z.
1, Shang, C.Y.
1 and Lanying, F.
3
1Research and Development Division, Malaysian Pepper Board, 93916 Kuching, Sarawak, Malaysia.
2Faculty of Resource Science and Technology, Universiti Malaysia Sarawak, 94300 Kota Samarahan,
Malaysia. 3Soil Management Branch, Department of Agriculture Sarawak, Badruddin Road, 93400 Kuching,
Sarawak, Malaysia.
*Email: [email protected]
Introduction
Piper nigrum Linn.is one of the most common condiments and features prominently in most of the
gastronomical cuisines worldwide. Being known as a tropical climbing vine and a member of the
family Piperaceae, the genus piper has more than 1000 species but the most economically important
species is P. nigrum (Shanmugapriya et al., 2012). Pepper cultivation in the Sarawak state of Malaysia
dates back to 1856 but more extensive planting started in the 1900s. Overall, the state has produced
10,588 tonnes of pepper valued at RM245 million in the year 2012 thus highlighting the importance
of pepper as one of the important cash crops supporting the livelihood of about 67,000 rural dwellers
in upland areas of Sarawak (Malaysian Pepper Board, 2013). Currently, Malaysia ranks number five
after Vietnam, India, Indonesia, and Brazil in terms of pepper production.
Calopo (Calopogonium mucunoides Desv.) is indigenous to tropical America and the West Indies but
it is wide-spread in the tropics of Asia and Africa through introduction in the early 1900s. Pizarro
(2002) reported that it is the most popular legume amongst Brazilian farmers and it is the legume seed
produced in greatest volume in Brazil. As a legume, the plant helps to improve soil fertility with its
nitrogen-fixing bacteria found in the root nodules.
Previously, there is no knowledge on how a legume cover crop particularly C. mucunoides affects the
various physiological characteristics of P. nigrum. Furthermore, the documentation on C. mucunoides
usage in black pepper vineyards in Sarawak is still lacking, which needs attention if cultivation of
leguminous cover crops were to be undertaken seriously. Therefore, this study was conducted with the
following objectives: (i) to investigate the leaf total N and chlorophyll content of P. nigrum grown in
a C. mucunoides establishment, (ii) to investigate the gas exchange rate of P. nigrum grownin a C.
mucunoides establishment, and (iii) to examine the role of certain soil properties in influencing leaf
total N, chlorophyll content and gas exchange rate of P. nigrum.
Materials and Methods
The experiment was a field study and conducted in a 12 m x 12 m plot near Kampung Jagoi, Duyoh,
Bau, Sarawak, Malaysia. The soil texture at planting site was sandy clay loam which has a low to
moderate permeability status. The crops involved in this study were P. nigrum and C. mucunoides.
Piper nigrum var. Kuching cuttings were rooted in a sand bed. After 4 weeks, the pepper cuttings
were then selected and transplanted to the planting site.
In order to break the dormancy of the Calopo cover crop seeds, scarification with concentrated
sulphuric acid for 30 minutes was done. After scarification, the seeds were germinated on moist
cotton for 3 days. The seeds were then transplanted to the planting site by dibbling 3 – 4 seeds into a
hole. Calopo seeds were planted in holes placed 20 cm apart within each row. The study was
conducted from the month of August 2013 – June 2014.
Page 269
ISBN 978-967-10840-4-5
Proc. Int. Conf. Plt. Phy. 2014
First Published, 2015
263
Experimental design and treatments
The experiment was a randomized complete block design (RCBD) with two treatments replicated nine
times. Treatments were: (i) control (C0) – P. nigrum plot without application of C. mucunoides and
(ii) Calopo cover crop (C1) –P. nigrum plot with application of C. mucunoides. Pepper vines were
carefully selected to avoid erroneous result due to the nature of most part of the terrain being flat to
slightly undulating.
Selected soil properties determination
After 10 months, the soil was analyzed for its water content and texture. Soil moisture content was
measured by using a soil moisture sensor equipment (WS SMEC 300, Spectrum Technologies,
Chicago, Illinois, USA) to obtain the soil volumetric water content (VWC) (% volume).
In order to further understand the fertility status of the soil, samples were collected with an auger at a
depth of 0 – 15 cm and analyzed for its total organic carbon (TOC), total nitrogen (N) and available
phosphorus (P).The sieved soil samples were analyzed for its chemical properties at Sarawak
Plantation Chemistry Laboratory Kuching, Sarawak.
Leaf total nitrogen, chlorophyll and gas exchange rate measurement of P. nigrum
At the end of the study, 0.1 g of leaf samples was collected for the purpose of this experiment. The
samples were washed clean with distilled water, oven-dried at 60 oC and grounded. A kitchen blender
(Takada Food Blender, ISB-035) was used to ground the dried leaf samples.The grounded leaf
samples were analyzed for total N at Sarawak Plantation Chemistry Laboratory Kuching, Sarawak.
The total N for black pepper leaves was determined using the micro-Kjeldahl method (Tan, 1995).
Value is recorded as % N for plant tissue on a dry weight basis.
The relative chlorophyll content of leaves was determined by using the SPAD-502 chlorophyll meter
(Konica Minolta Co. Ltd., Japan). Readings were recorded when mature fully expanded leaves with
the same orientation and the same layer in the crown (middle bottom) are still attached to the tree.
Gas exchange measurement was determined according to the method by DiCristina and Germino
(2006), carried out on young fully expanded leaves with the same orientation and the same layer in
the crown (middle bottom). Measurements of net photosynthesis on an area basis (A) (µmol CO2 m-2
s-
1), leaf stomatal conductance (gs) (mol H2O m
-2s
-1), and transpiration rate (E) (mmol H2O m
-2s
-1) of
nine different leaves per treatment were monitored using a photosynthesis system (LI-6400, LICOR,
USA) of infrared gas analyzer (IRGA). Light intensity (Photosynthetically active radiation, PAR)
within the sampling chamber was set as close to outside PAR at 1500 µmol m-2
s-1
. The CO2 flow into
the chamber was maintained at a concentration of 400 µmol mol-1
. The humidity flow into the
chamber was fixed at 500 µmol s-1
. Statistical assessment was done on gas exchange parameters at
between 1100 to 1200 h, which was presumed to be the diurnal period when photosynthetic rates
would be maximal.
Statistical analysis
Data was analyzed statistically by using an independent and paired t-test to detect the treatment effect.
The statistical software used was the SPSS. The relationship between leaf chlorophyll content and leaf
total N of P. nigrum and photosynthesis and leaf chlorophyll content were correlated using regression
of best fit.
Page 270
ISBN 978-967-10840-4-5
Proc. Int. Conf. Plt. Phy. 2014
First Published, 2015
264
Results and Discussion
Selected soil properties
Table 1 shows the effect of C. mucunoides on soil volumetric water content (VWC). The result
indicates that soil VWC in C1 was 40 % higher than that of C0. This result concurs with a report by
Hoorman (2009) which mentioned an increased in stored soil moisture was seen in cover crop
treatments compared to standard no-till and conventional till treatments after the first major rainfall
event after planting. Hoorman (2009) added that deep rooted cover crop such as C. mucunoides can
improve rooting depth to attain subsoil moisture and water content is conserved by mulching the
topsoil as soil compaction decreases and soil quality improves with time. Research by Jasa (2011) has
shown that while a cover crop uses some soil moisture as it grows, it tends to use less water than is
lost to evaporation from a bare soil surface.
Total organic carbon (TOC) increased significantly in a C. mucunoides establishment (Table 1). This
may be due to addition of organic matter from cover crop biomass decomposition process. A similar
study done by Ngome et al. (2011) observed that cover crop are known to increase soil organic carbon
content by expanding biomass production for restoration and maintenance of soil productivity.
The results in Table 1 also show that the usage of C. mucunoides has increased both total N and
available P in the soil (Table 1). The increased in soil total N indicates that it is most probably due to
the capture of atmospheric N2 by nitrogen-fixing bacteria found in the root nodules of C. mucunoides
into the soil. When a legume cover crop is incorporated into the soil, a substantial amount of nitrogen
is usually mineralized, converted from organic to plant-available forms within a few weeks (Ngome et
al., 2011). Meanwhile, The increased in soil available P could be partly due to the presence of
beneficial fungi known as mycorrhizae housed by the roots of leguminous cover crops which
accumulates P. The filaments (hyphae) of these fungi effectively extend the root systems and help the
cover crop tap more soil P (Ngome et al., 2011). Parameters such as soil nitrogen (N), total organic
carbon (TOC) and available soil phosphorus (P) are major indicators of the productivity and
sustainability of an agricultural production system (Kifuko et al., 2007).
Table 1. Effect of C. mucunoides on VWC, TOC, Total N and Available P in the soil
Treatment VWC (%) TOC (% oven
dry)
Total N (% oven
dry)
Available P (ppm oven
dry)
C0 19.81 + 0.90a 2.57 + 0.09
a 0.26 + 0.02
a 4.78 + 0.67
a
C1 32.89 + 0.73b 3.82 + 0.11
b 0.44 + 0.03
b 7.11 + 1.05
b
Note: Means with different alphabets within column indicate significant difference between treatments by
independent t-test at p< 0.05. Treatments are C0 – control and C1 – Calopo cover crop.
Leaf total nitrogen, chlorophyll and gas exchange rate
Table 2 shows that C1 had a significantly higher leaf total N than those in C0 which could be due to
higher availability of N in the soil. Both field and laboratory investigations by Cechin and Fumis
(2004) have demonstrated that increasing supply of N availability in soil may result in higher leaf N
content. Furthermore, Tucker (2004) hypothesized that total N content in leaves depend on the N
content in the soil.
Chlorophyll (SPAD) content increased by 17 % in the C. mucunoides treatment when compared to the
control which is attributed primarily to higher N concentration and the presence of cytoplasmic fluid
at the leaf cellular level (Table 2). Cabrera (2004) and Sulok et al. (2012a) observed that plants with
higher nitrogen content and presence of sufficient fluid tend to have darker green leaves.
Page 271
ISBN 978-967-10840-4-5
Proc. Int. Conf. Plt. Phy. 2014
First Published, 2015
265
Photosynthesis rate (A) increased by 27 % in the C1 treatment suggesting that C. mucunoides
application increased the selected gas exchange rate of Piper nigrum. Lawlor (2002) mentioned that
the photosynthesis process that leads to increase in reproductive growth and yield is totally dependent
upon the adequate supply of nitrogen and soil moisture. Hak et al. (1993) reported that up to 75% of
leaf nitrogen is found in the chloroplasts, most of it invested in ribulose-biphosphate carboxylase
alone. The process of photosynthesis takes place in the chloroplasts, specifically using chlorophyll,
the green pigment involved in photosynthesis.
Table 2 shows that leaf stomatal conductance (gs) increased by 44 % in the C. Mucunoides treatment
when compared to that of the control. The result was parallel to that of Sulok et al. (2012b) where
plant subjected to higher soil VWC tends to open its stomata as the soil water potential was at its field
capacity.Table 2 shows that transpiration rates (E) were higher for black pepper vines subjected to C.
Mucunoides treatment, increasing by 55 % of the control value. Result for leaf transpiration rates (E)
concurs to that of Ashizawa et al. (2003) in which they concluded that E rate was progressively
increased under conditions of sufficient soil moisture. Additionally, Hoorman (2009) reported that
due to stored soil moisture in some cover crop treatments, the soil is able to provide adequate supply
of water to plants thus negating the effects of lower water availability that inhibits stomatal openings
thus led to lower E and A rates.
Table 2. Effect of C. mucunoides on leaf total N, Chlorophyll and selected gas exchange rate of
Piper nigrum
Treatme
nt
Leaf Total
N (%)
Chlorophyl
l (SPAD)
Net Photosynthesis
Rate
(µmol CO2 m-2
s-1
)
Leaf Stomatal
Conductance
(mol H2O m-2
s-1
)
Transpiration rate (mmol
H2O m-2
s-1
)
C0 1.63 + 0.06a
33.87 +
3.82a
10.47 + 0.65a 0.09 + 0.01
a 1.55 + 0.1
a
C1 2.43 + 0.12b
40.60 +
2.28b
14.4 + 1.4b 0.16 + 0.01
b 3.41 + 0.17
b
Note: Means with different alphabets within column indicate significant difference between treatments by
independent t-test at p< 0.05.Treatments are C0 – control and C1 – Calopo cover crop.
Figure 1 shows the relationship between chlorophyll (SPAD) and leaf total N of P. nigrum. The
strong relationship between chlorophyll and leaf total N regardless of treatments shows a polynomial
cubic regression line of zero intercept with r2 = 0.88 indicating that higher N content in the leaf
increased chlorophyll in plants. Previous report by Tucker (2004) and Daughtry et al. (2000) revealed
that because N is a structural element of chlorophyll, thereby it affects formation of chloroplasts and
accumulation of chlorophyll in them.
Similarly, the relationship between leaf photosynthetic rate (A) and chlorophyll (SPAD) of P. nigrum
exposed to different treatments were highly correlated, r2 = 0.91 (Figure 2). The relationship between
the two regardless of treatments was best described by a polynomial cubic regression line of zero
intercept which explains a value of around 91% of the variation in leaf photosynthesis. This
consequence showed close relations between the two in which leaf Arate increased with increasing
chlorophyll (SPAD) content. Ndukwe et al. (2011) revealed that the concentration of chlorophyll
affects the rate of photosynthesis as they absorb the light energy without which the reactions cannot
proceed. Consequently, higher rates of photosynthesis under conditions of higher nitrogen and soil
water availability are often attributed to the formation of chlorophyll photosynthetic pigments and
Rubisco activity (Toth et al., 2002).
Page 272
ISBN 978-967-10840-4-5
Proc. Int. Conf. Plt. Phy. 2014
First Published, 2015
266
Figure 1: Relationship between chlorophyll (SPAD) and leaf total N of P. nigrum subjected to
different treatments. Values are means +s.e. of nine leaves taken from different plants per
treatment. The regression line (continuous) is shown. The values of the determination
coefficient are included.
Figure 2: Relationship between leaf Arate and chlorophyll (SPAD) of P. nigrumsubjected to different
treatments. Values are means +s.e. of nine leaves taken from different plants per treatment.
The regression line (continuous) is shown. The values of the determination coefficient are
included.
Conclusions
The establishment of the C1 plot using C. mucunoides as cover crop responded better in terms of its
improvement in soil properties as well as leaf total N, chlorophyll content and gas exchange rate of P.
nigrum. In the C1 treatment, the application of C. mucunoides affects the selected soil properties
considerably by showing comparatively highersoil VWC, soil TOC, soil total N and soil available P.
Leaf total N, chlorophyll content, photosynthesis rates, stomatal conductance, and transpiration rates
of P. nigrum grown in the Calopo cover crop treatment were significantly higher than the control.
Furthermore, it was found that leaf total N and photosynthesis rate was significantly correlated to
chlorophyll content of P. nigrum. It can be said that the use of leguminous cover crops such as C.
mucunoides can bring benefits such as fixing nitrogen, improving soil properties, managing soil
moisture and increasing photosynthesis of P. nigrum.
Acknowledgments
This research work was supported by the Malaysian Pepper Board.
Page 273
ISBN 978-967-10840-4-5
Proc. Int. Conf. Plt. Phy. 2014
First Published, 2015
267
References
Ashizawa, M., Wariishi, T. and Manabe, K. 2003. Leaf transpiration rate as an indicator of irrigation
timing for Satsuma mandarin trees in summer. Technical Bulletin of Faculty of Agriculture
Kagawa University 35: 5-12.
Cabrera, R.I. 2004. Evaluating yield and quality of roses with respect to nitrogen fertilization and leaf
nitrogen status. XXV International Horticulture Congress, ISHS Acta Horticulture 511: 157-
170.
Cechin, I. and Fumis, F. 2004. Effect of nitrogen supply on growth and photosynthesis of sunflower
plants grown in the greenhouse. Plant Science 166: 1379-1385.
Daughtry, C.S.T., Walthall, C.I., Kim, M.S., Brown de Colstoun, E. and McMurtrey, J.E. 2000.
Estimating corn leaf chlorophyll concentration from leaf and canopy reflectance. Remote
Sensing of Environment 74: 229-239.
DiCristina, K. and Germino, M. 2006. Correlation of neighbourhood relationships, carbon
assimilation, and water status of sagebrush seedlings establishing after fire. Western North
American Naturalist 66(4): 441-449.
Hak, R., Rinderle-Zimmer. U., Lichtenthaler, H.K. and Natr, L. 1993. Chlorophyll a fluorescence
signatures of nitrogen deficient in barley leaves. Photosynthetica 28: 151-159.
Hoorman, J.H. 2009. Using cover crops to improve soil and water quality. Fact Sheet: Agriculture and
Natural Resources. P. 3.
Jasa, P. 2011. Cover crops for soil health. Fact Sheet: Flood Recovery for Cropland. P. 1.
Kifuko, M.N., Othieno, C.O., Okalebo, J.R. Kimenye, L.N. Ndungu, K.W. and Kipkoech, A.K. 2007.
Effect of combining organic residues with minjingu phosphate rock on sorption and
availability of phosphorus and maize production in acid soils of Western Kenya.
Experimental Agriculture 43: 51-66.
Lawlor, D.W. 2002. Carbon and nitrogen assimilation in relation to yield: mechanisms are the key to
understanding production systems. Journal of Experimental Botany 53: 773-787.
Malaysian Pepper Board. 2013. Website visited on the 7th of June 2013.
http://www.mpb.gov.my/mpb/images/Penerbitan/keratanakhbar/eksport-produk-lada-
malaysia-boleh-cecah-rm650-juta-pada-2020-BERNAMA.pdf
Ndukwe, K.O., Edeoga, H.O. and Omosun, G. 2011. Soil fertility regeneration using some fallow
legumes. Continental Journal of Agronomy 5(2): 9-14.
Ngome, A.F.E., Becker, M. and Mtei, K.M. 2011. Leguminous cover crops differentially affect maize
yields in three contrasting soil types of Kakamega, Western Kenya. Journal of Agriculture
and Rural Development in the Tropics and Subtropics 112(1): 1-10.
Pizarro, E.A. 2002. Important forage grasses, legumes and shrub legumes for tropical zones of Latin
America. Australian Journal of Crop Science 4: 324-329.
Shanmugapriya, K., Saravana, P.S., Harsha, P., Peer Mohammed, S. and Binnie, W. 2012.
Antioxidant potential of pepper (Piper nigrum Linn.) leaves and its antimicrobial potential
against some pathogenic microbes. Indian Journal of Natural Products and Resources 3(4):
570-577.
Sulok, K.M.T., Zainudin, S.R., Hassim, M.I. and Suhaili, S. 2012a. Effects of different watering
regimes on foliar spectral reflectance and chlorophyll content of Jatrophacurcas Linn. Journal
of Tropical Plant Physiology 4: 41-51.
Sulok, K.M.T., Zainudin, S.R., Mustafa, K., Mohideen, J.S., and Othman, Y. 2012b. Physiological
adaptation of Jatropha curcas to water deficit. Proceedings of the 23rd
Malaysian Society of
Plant Physiology Conference. Pp. 55-59.
Tan, K.H. 1995. Soil sampling, preparation, and analysis. New York: Marcel Dekker, Inc. Pp. 34.
Page 274
ISBN 978-967-10840-4-5
Proc. Int. Conf. Plt. Phy. 2014
First Published, 2015
268
Toth, V.R. Meszkaros, S. Veres, S. and Nagy, J. 2002. Effect of the available nitrogen on the
photosynthetic activity and xanthophyll cycle pool of maize in the field. Journal of Plant
Physiology 159: 627–634.
Tucker, M. 2004. Primary nutrients and plant growth. In: Essential Plant Nutrients (SCRIBD, Ed.).
North Carolina Department of Agriculture. Pp. 28.
Page 275
ISBN 978-967-10840-4-5
Proc. Int. Conf. Plt. Phy. 2014
First Published, 2015
269
Improving Rice (Oryza sativa L. cv. MR219) Growth, Nutrient Uptake and
Recovery Using Clinoptilolite Zeolite
Palanivell, P.1, Ahmed, O.H.
1,2,*, Susilawati, K.
1 and Nik Muhamad, A.M.
2
1Department of Crop Science, Faculty of Agriculture and Food Sciences, Universiti Putra Malaysia
Bintulu Sarawak Campus, 97008 Bintulu, Sarawak, Malaysia. 2Institute of Tropical Forestry and Forest Products (INTROP), Universiti Putra Malaysia, 43400
Serdang, Selangor, Malaysia.
*E-mail: [email protected]
Introduction
Nitrogenous fertilizers such as urea in rice fields (under waterlogged condition) are lost through
ammonia volatilization. Ammonia loss is higher in waterlogged or anaerobic condition compared to
aerobic condition (Zhengping et al., 1991). Besides N fertilizers, phosphorus and potassium fertilizers
tend to leach through surface run-off due to high average annual rainfall of 2,500 mm in Malaysia
(Huey and Ibrahim, 2012). These problems lead to less availability of nutrients for rice growth and
development. Thus, farmers apply fertilizers excessively in rice fields to attain higher yield. However,
unbalanced use of fertilizers cause eutrophication, groundwater pollution, acid rain deposition, soil
acidification and greenhouse gas emissions (Tang et al., 2008; Adesemoye and Kloepper, 2009; Ju et
al., 2009; Moose and Below, 2009).
Ammonia loss and nutrient leaching from fertilizers can be reduced with application of materials
which are high in CEC such as Clinoptilolite zeolite (Sommer et al., 2006; Latifah et al., 2011).
Clinoptilolite zeolite was mixed with sago waste water and peat water to reduce N loss from urea (
Omar et al., 2010; Latifah et al., 2011). Amending fertilizers with Clinoptilolite zeolite creates a pool
of negative charges around nutrients. With the use of Clinoptilolite zeolite, ammonium and potassium
ions will also be efficiently retained and released in a timely manner to ensure optimum plant use.
Proper retention and release of ammonium ions by Clinoptilolite zeolite during hydrolysis of urea, as
an example, may significantly reduce nitrogen loss through ammonia volatilization, hence improving
nutrient uptake, nutrient recovery and increase rice plant growth. Amending acid soils and fertilizers
with Clinoptilolite zeolite could reduce N loss from urea, nutrient leaching as well as improve rice
plants’ growth, nutrient uptake, nutrient recovery and selected chemical properties of acid soils. A pot
study was carried out to determine the effects of amending an acid soil and fertilizers with
Clinoptilolite zeolite on rice plants’ growth, nutrient uptake and recovery using Clinoptilolite zeolite.
Materials and Methods
Typic Paleudults (Bekenu series) soil was sampled at 0 to 25 cm in an undisturbed area of Universiti
Putra Malaysia Bintulu Sarawak Campus, Malaysia. The soil was air-dried, crushed, and sieved to
pass to a 5 mm sieve. The Clinoptilolite zeolite and soil were analyzed before and at the end of pot
study for pH, bulk density, total carbon, total N, available NO3-, exchangeable NH4
+, exchangeable
cations, available P and CEC using standard procedures.
The selected chemical and physical properties of the soil (Table 1) used in this study were typical of
Typic Paleudults (Bekenu series) and they were comparable to those reported by Paramananthan
(2000), except for CEC. The pH of Clinoptilolite zeolite was higher as expected, but the CEC and
total N content of the Clinoptilolite zeolite were lower than expected (Table 2).
The quantity of the soil used in this pot study was calculated based on its bulk density. About 1 kg of
air-dried soil was filled in a pot measuring 12.5 cm (top diameter) × 10 cm (bottom diameter) × 9 cm
(height). Before planting, rice seeds variety of MR219 were germinated in a plastic ware filled with
germination medium (85% sand + 15% Clinoptilolite zeolite). At 7 days after germination, the
Page 276
ISBN 978-967-10840-4-5
Proc. Int. Conf. Plt. Phy. 2014
First Published, 2015
270
seedlings were transferred into pots (3 seedlings per pot) (Bozorgi et al., 2011) and submerged in tap
water. The pot trial was carried out in Completely Randomized Design (CRD) with 4 replications.
Table 1. Selected chemical and physical properties of Typic Paleudults (Bekenu Series) soil before
incubation and pot study.
Property Soil Standard Data Range*
(0-36 cm)
pHwater 4.41 4.6-4.9
CEC (Cmol(+) kg-1
) 11.97 3.86-8.46
Total Carbon (%) 2.43 0.57-2.51
Total N (%) 0.08 0.04-0.17
Exchangeable NH4+ (mg kg
-1) 21.02 Nd
Available NO3- (mg kg
-1) 7.01 Nd
Available P (mg kg-1
) 4.85 Nd
Exchangeable K+ (Cmol(+) kg
-1) 0.10 0.05-0.19
Bulk density (g cm-3
) 1.16 Nd
CEC: Cation Exchange Capacity; *Paramananthan (2000)
Table 2. Selected chemical properties of Clinoptilolite zeolite. Property Clinoptilolite Zeolite
pHwater 8.20
CEC (Cmol(+) kg-1
) 71.30
Total N (%) 0.22
Total P (%) 0.01
Total K (%) 0.37
Total Ca (%) 0.67
Total Mg (%) 0.10
Total Na (%) 0.76
The treatments evaluated were: T1: soil alone, T2: soil + complete fertilization, T3: soil + complete
fertilization + 20 g zeolite, T4: soil + complete fertilization + 40 g zeolite and T5: soil + complete
fertilization + 60 g zeolite. The complete fertilization was equivalent to 1.31 g urea + 1.39 g ERP +
0.88 g MOP + 0.16 g kieserite + 0.53 g chelated Zncobor per pot. The amount of fertilizers used was a
scaled down for plant density of 3 rice plants hill-1
. The fertilizer rate (151 kg ha-1
N, 97.8 kg ha-1
P2O5, 130 kg ha-1
K2O, 7.6 kg ha-1
MgO) was based on the recommended fertilizer for rice by Muda
Agricultural Development Authority, Malaysia, with additional micronutrients (2.3 kg ha-1
B, 4 kg ha-
1 Cu and 4 kg ha
-1 Zn) (Liew et al., 2010). The amount of zeolite used was deduced from the literature
(Kavoosi, 2007; Bernardi et al., 2009; Gevrek et al., 2009; Sepaskhah and Barzegar, 2010), where 5,
10 and 15 tons ha-1
, equivalent to 20, 40 and 60 g hill-1
, were used.
Plant height, number of tillers and number of leaves were recorded at harvest (90 days after seeding).
The rice plants were oven-dried at 60 °C until a constant weight was obtained. The dried plant
samples were ground using a grinding machine, after which they were analysed for total N, P, K, and
crude silica using standard procedures. Plant nutrient recovery was calculated using the method of
Dobermann (2005).
Analysis of variance (ANOVA) was used to detect significant differences among treatments, whereas
Tukey’s HSD test was used to compare treatment means using Statistical Analysis System version 9.2
(SAS, 2008).
Results and Discussion
The effects of treatments on number of leaves, tillers, plant height, and total biomass production at 90
days after seeding (DAS) are shown in Figure 1. Application of Clinoptilolite zeolite (T4 and T5)
significantly increased number of leaves and total dry matter production compared with normal
Page 277
ISBN 978-967-10840-4-5
Proc. Int. Conf. Plt. Phy. 2014
First Published, 2015
271
fertilization (T2). However, the application of Clinoptilolite zeolite showed no significant effect on
number of tillers and plant height.
Figure 1. Treatment effects on number of leaves, tillers, plant height and total biomass production of
rice plant at 90 DAS. Different alphabets indicate significant difference between means
using Tukey’s test at P ≤ 0.05.
The highest amount of Clinoptilolite zeolite (T5) improved nutrient uptake (N, P, K and crude silica)
and recovery (N, P and K) compared with the normal fertilization (T2) (Figures 2 and 3). T3 and T4
showed higher N and crude Si uptake and N recovery compared with the normal fertilization.
Sepaskhah and Barzegar (2010) also found that nutrient use efficiency and nutrient recovery efficieny
in rice plants were increased with increasing rate of zeolite application. The higher cation exchange
capacity of Clinoptilolite zeolite enabled nutrients retention from leaching. Thus, the nutrients were
timely absorbed to support growth of the rice plants as plant dry matter production and leaf number of
rice plant was higher.
T4 and T5 significantly increased soil pH and CEC compared with the normal fertilization (T2)
(Figure 4). However, total N, available P and exchangeable K decreased with increasing rate of
Clinoptilolite zeolite compared with the normal fertilization. Reduction of nutrients in the soil was
because of efficient nutrient uptake in rice plants. The basic nature and higher CEC of the
Clinoptilolite zeolite played important role in increasing soil pH and CEC (Kavoosi, 2007).
Figure 2. Treatment effects on N, P, K and crude silica uptake of rice plant at 90 DAS. Different
alphabets indicate significant difference between means using Tukey’s HSD test at P ≤
0.05.
Page 278
ISBN 978-967-10840-4-5
Proc. Int. Conf. Plt. Phy. 2014
First Published, 2015
272
Figure 3. Treatment effects on N, P and K use efficiency of rice plant at 90 DAS. Different alphabets
indicate significant difference between means using Tukey’s HSD test at P ≤ 0.05.
Figure 4. Treatment effects on soil pH, CEC, total N, available P and exchangeable K at 90 DAS.
Different alphabets indicate significant difference between means using Tukey’s test at P ≤
0.05.
Conclusions
Clinoptilolite zeolite can be used to enhance rice plant growth, nutrient uptake, recovery and improve
selected chemical properties of acid soils but field experiment has to be carried out to confirm the
findings.
Acknowledgements
Authors acknowledge Ministry of Education (MOE), Malaysia, for Long-term Research Grant
Scheme LRGS (Food Security-Enhancing sustainable rice production) and Universiti Putra Malaysia
for funding this research project.
Page 279
ISBN 978-967-10840-4-5
Proc. Int. Conf. Plt. Phy. 2014
First Published, 2015
273
References
Adesemoye, A. and Kloepper, J. 2009. Plant-microbes interactions in enhanced fertilizer-use
efficiency. Applied Microbiology and Biotechnology 85: 1-12.
Bernardi, A.C.D.C., Mendonça, F.C., Haim, P.G., Werneck, C.G. and Monte, M.B.D.M. 2009. Water
availability and rice yield due to levels of zeolitic concentrate. Irriga 14: 123-134.
Bozorgi, H.R., Faraji, A. and Danesh, R.K. 2011. Effect of plant density on yield and yield
components of rice. Applied Sciences 12(11): 2053-2057.
Dobermann, A.R. 2005. Nitrogen use efficiency – State of the Art. In: IFA International Workshop on
Enhanced-Efficiency Fertilizers, Frankfurt, Germany: 17p.
Gevrek, M.N., Tatar, Ö., Yağmur, B. and Özaydin, S. 2009. The effects of clinoptilolite application
on growth and nutrient ions content in rice grain. Turkish Journal of Field Crops 14: 79-88.
Huey, T.T. and Ibrahim, A.L. 2012. Statistical analysis of annual rainfall patters in Peninsular
Malaysia using TRMM algorithm. In: The 33rd Asian Conference on Remote Sensing,
Pattaya, Thailand, 7p.
Ju, X.T., Xing, G.X., Chen, X.P., Zhang, S.L., Zhang, L.J., Liu, X.J. and Zhu, Z.L. 2009. Reducing
environmental risk by improving N management in intensive Chinese agricultural systems.
Proceeding of the National Academy of Sciences 106: 3041-3046.
Kavoosi, M. 2007. Effects of zeolite application on rice yield, nitrogen recovery, and nitrogen use
efficiency. Communications in Soil Science and Plant Analysis 38: 69-76.
Latifah, O., Ahmed, O.H. and Muhamad, A.M.N. 2011. Ammonia loss, ammonium and nitrate
accumulation from mixing urea with zeolite and peat soil water under waterlogged condition.
African Journal of Biotechnology 10: 3365-3369.
Liew, Y.A., Omar, S.R.S., Husni, M.H.A., Abidin, M.A.Z. and Abdullah, N.A.P. 2010. Effects of
micronutrient fertilizers on the production of MR 219 Rice (Oryza sativa L .). Malaysian
Journal of Soil Science 14: 71-82.
Moose, S. and Below, F.E. 2009. Biotechnology approaches to improving maize nitrogen use
efficiency. In: Kriz, A.L. and Larkins, B.A. (Eds.). Molecular Genetic Approaches to Maize
Improvement. Vol. 63. Springer, Berlin, Heidelberg: 65-77.
Omar, L., Ahmed, O.H. and Majid, N.M.A. 2010. Minimizing ammonia volatilization in waterlogged
soils through mixing of urea with zeolite and sago waste water. International Journal of the
Physical Sciences 5: 2193-2197.
Paramananthan, S. 2000. Soils of Malaysia: Their characteristics and identification. Vol. 1. 616p.
SAS. 2008. SAS/STAT Software. Cary, NY: SAS Institute.
Sepaskhah, A. and Barzegar, M. 2010. Yield, water and nitrogen-use response of rice to zeolite and
nitrogen fertilization in a semi-arid environment. Agricultural Water Management 98: 38-44.
Sommer, S.G., Jensen, L.S., Clausen, S.B. and Søgaard, H.T. 2006. Ammonia volatilization from
surface-applied livestock slurry as affected by slurry composition and slurry infiltration depth.
The Journal of Agricultural Science 144: 229-235.
Tang, G.L., Huang, J., Sun, Z.J., Tang, Q.Q., Yan, C.H. and Liu, G.Q. 2008. Biohydrogen production
from cattle wastewater by enriched anaerobic mixed consortia: Influence of fermentation
temperature and pH. Journal of Bioscience and Bioengineering 106: 80-87.
Zhengping, W., Cleemput, O., Demeyer, P. and Baert, L. 1991. Effect of urease inhibitors on urea
hydrolysis and ammonia volatilization. Biology and Fertility of Soils 11: 43-47.
Page 280
ISBN 978-967-10840-4-5
Proc. Int. Conf. Plt. Phy. 2014
First Published, 2015
274
CHAPTER 6
PEST AND DISEASE
MANAGEMENT, BEST
PRACTICES AND CURRENT
TECHNIQUES
Page 281
ISBN 978-967-10840-4-5
Proc. Int. Conf. Plt. Phy. 2014
First Published, 2015
275
Association of Copper and Zinc to Ganoderma spp. Spatial Distribution in
Oil Palm (Elaeis guineensis) Plantations on Peat
Rakib, M.R.M.1, Bong, C.F.J.
1,*, Khairulmazmi, A.
2 and Idris, A.S.
3
1Department of Crop Science, Faculty of Agriculture and Food Sciences, Universiti Putra Malaysia,
Bintulu Sarawak Campus, Nyabau Road, 97000 Bintulu, Sarawak, Malaysia. 2Department of Plant Protection, Faculty of Agriculture, Universiti Putra Malaysia, 43400 UPM
Serdang, Selangor, Malaysia. 3Biological Research Division, Malaysian Palm Oil Board (MPOB), No. 6, Persiaran Institusi, Bandar
BaruBangi, 43000 Kajang, Selangor, Malaysia.
*E-mail: [email protected]
Introduction
Ganoderma species are a devastating basidiomycete fungus that has been reported to cause basal stem
rot (BSR) and upper stem rot (USR) in oil palm (Elaeis guineensis) which threatening the
sustainability of the plantations throughout the Southeast Asia region, especially in Malaysia and
Indonesia (Hasan et al., 2005; Rees et al., 2012; Rakib et al., 2014a). Oil palm cultivation on peat in
Malaysia, especially in the state of Sarawak is becoming more important due shortage of the mineral
soil in other regions of Malaysia and the abundance of peat lands in the state (Said et al., 2009).
Although peat soil is suitable for oil palm cultivation through improvements of soil physical and
chemical properties (Mutert et al., 1999), oil palms cultivated on peat are more prone to nutrient
deficiency as peat soils have very low nutrient availability of the oil palm, especially micronutrients
such as copper (Cu) and zinc (Zn) because they are highly adsorbed or fixed in soil organic matter of
peat (McGrath et al., 1988; Fageria et al., 2002). Optimum level of essential nutrients in a plant is
crucial for normal physiological process, which include the role in the defence mechanisms of the
plant against pests and diseases (Marschner, 1995). Therefore, Cu and Zn level in the oil palm may
have an important role in the distribution of Ganoderma species in an oil palm plantation.
Geographical Information System (GIS) has been adapted for application in plant pathology to
quantitatively characterize the spatial distribution pattern of a disease or pathogen. This information is
useful as an aid in the design of epidemiological studies, development of more accurate sampling
programs, design and analyze experiments more efficiently, monitoring programs, better disease
management (Azahar et al., 2011).
Spatial distribution of pathogens and its relation to the nutrient status of its host may provide useful
information for disease management through nutrient manipulation. Thus, the objectives of this study
were to investigate the association of foliar Cu and Zn of oil palm in relation to spatial distribution of
Ganoderma species in oil palm plantations on peat.
Materials and Methods
This study was conducted in two oil palm plantations on peat in Betong (873 ha) and Miri (2801 ha),
located in Sarawak, Malaysia, with study areas of 15 ha and 16 ha, respectively. Foliar samples of oil
palm were collected from frond 17 (Tohiruddin et al., 2010) based on the geostatistics analysis of
spatial distribution of Ganoderma species provided in other study (Rakib et al., 2014b), namely, from
i) uninfected area (< 15% Ganoderma density) and; ii) infected area (15.1-100% Ganoderma density).
Samples were collected two times (two rounds) from both study sites at one year interval in 2011 and
2012, where a total of 30 samples were collected in each trial (Figure 1).
Total Cu and Zn from the foliar samples were extracted using the single dry ashing method and their
concentrations were determined spectrometrically using an atomic absorption spectrometer (AAS)
Page 282
ISBN 978-967-10840-4-5
Proc. Int. Conf. Plt. Phy. 2014
First Published, 2015
276
(Korn et al., 2008). A factorial arrangement was adopted in the field design and data were subjected to
analysis of variance (ANOVA) and the Duncan’s new multiple range test (DNMRT) for mean
comparisons.
Source: Rakib et al. (2014b)
Figure 1. Foliar samples of oil palm from uninfected and infected area based on the spatial
distribution of Ganoderma spp. in (A) Betong 2011, (B) Betong 2012, (C) Miri 2011 and
(D) Miri 2012.
Results and Discussion
Foliar concentration of Cu and Zn in oil palms on infected area was significantly lower compared to
an uninfected area (Figure 2). Cu in oil palms on infected area in Betong 2011 and 2012, Miri 2011
and 2012 were 5.41, 6.03, 2.11 and 3.54 mgkg-1
, respectively, and these were significantly lower
compared to uninfected area which was 5.87, 5.67, 4.10 and 6.21 mgkg-1
, respectively, except
inBetong2012. Similarly, Zn in oil palms on infected area in Betong2011 and 2012, and Miri 2011
and 2012 were 15.07, 14.16, 9.58 and 8.91 mg kg-1, respectively, and these were significantly lower
compared to an uninfected area which was 16.86, 15.74, 10.61 and 11.43 mgkg-1
, respectively.
Furthermore, oil palms in the infected area in Miri suffered Cu and Zn deficiency, which were below
critical level of 3 mgkg-1
and 10 mgkg-1
, respectively (von Uexkull and Fairhurst, 1991; Goh, 2003).
Moreover, Miri has higher occurrence and rapid progression of Ganoderma species compared to
Betong (Rakib et al., 2014b). Comparisons between the two study sites showed that the mean
concentration of Cu was significantly lower (3.04 to 4.80 mgkg-1
) in Miri which has higher
Ganoderma occurrence, compared to Betong which has significantly higher Cu (5.64 to 5.87 mgkg-1
)
but lower Ganoderma occurrence. Similarly, the mean concentration of Zn was significantly lower
(10.05 to 10.15 mgkg-1
) in Miri which has higher Ganoderma occurrence, compared to Betong which
has significantly higher Zn (15.03 to 15.93 mgkg-1
) but lower Ganoderma occurrence.
(A) (B) (C) (D)
Page 283
ISBN 978-967-10840-4-5
Proc. Int. Conf. Plt. Phy. 2014
First Published, 2015
277
Note: = Uninfected area and = Infected area
Figure 2. Foliar (frond 17) nutrient content, (A) total copper and (B) total zinc of oil palms on
uninfected and infected area in Betong and Miri in 2011 and 2012.
In other studies, Nur Sabrina et al. (2012) reported reduction in disease progression by Ganoderma
species in oil palm seedlings supplemented with Cu. Cu also has been reported to reduce verticillium
disease by Verticillium dahlia in pepper (Chmielowska et al., 2009), leaf blight by Alternaria
palandui in onion (Karthikeyan et al., 2005) and Xanthomonasoryzae in rice (Yuan et al., 2010).
Meanwhile, increases in Zn has been related to reduction in Fusarium graminearum causing crown
rot and (Grewal et al., 1996) Gaeumannomyces graminis causing root rot (Graham and Webb, 1991)
in wheat.
Both Cu and Zn are essential micronutrients as they are associated with many physiological functions,
enzyme systems, antioxidant properties, maintaining cell membrane integrity and required in
chlorophyll in a plant. In addition, Cu is required for electron transport in photosynthesis, while Zn is
required for protein and starch synthesis, and hormone metabolism (Goh, 2003; Dordas, 2008). The
primary function of Cu in plant’s defense mechanism against disease is a cofactor for peroxidase and
laccase enzymes, which are important in lignification (Diaz et al., 2001; Chen et al., 2002). Lignin
provide physical barrier against pathogen penetration into a plant (Rengel et al., 1994; Paterson et al.,
2009). Besides that, increase in Cu has also been related to increase in phenolic compounds such as
flavonoids as reported in Digitalis lanata cell cultures (Bota and Deliu, 2011). This phenolic
compounds act as antifungal agent as in wheat (Caruso et al., 2001) and sweet flag (Acoruscalamus)
(Ghosh, 2006), antioxidant and building blocks for lignin (Lattanzio et al., 2006). Meanwhile, the
primary function of Zn in plant’s defence mechanism against disease is related to its function in
maintaining membrane integrity of a plant. Zn is a cofactor for enzymes involved in protection of
membrane against oxidative damage by free radicals (Sakihama et al., 2002; Michalak, 2006) that
could cause membrane leakage of high molecular compounds (sugar and amino acids) which favours
infection of pathogens (Marschner, 1995; Graham and Webb, 1991). On the other hand, low Zn has
been related to accumulation of those sugar and amino acids (Marschner, 1995). Hence, it is assumed
that membrane leakage together with increased accumulation of high molecular compounds made the
pathogens infection more successful. Furthermore, shortage of Zn also reduces plant’s natural
antifungal compounds such as phenolic compounds and flavonoids which are important in plant
defence mechanism as these compounds are secreted once a plant becomes infected by pathogens
(Sakihama et al., 2002). Both Cu and Zn itself are antifungal elements which are toxic to both plants
and pathogens, however they are not harmful to plant but pathogen when they are present in optimum
level in the plant as the pathogen required much less concentration (Marschner, 1995; Yruela, 2005).
Page 284
ISBN 978-967-10840-4-5
Proc. Int. Conf. Plt. Phy. 2014
First Published, 2015
278
Conclusions
Low or deficiencies in foliar concentration of Cu and Zn in the oil palm were associated with higher
distribution of Ganoderma species in oil palm plantations on peat in this study. This information
could be useful in management of the disease through nutrients manipulation as in integrated pest
management and site-specific disease management.
Acknowledgements
We acknowledge the Malaysian Palm Oil Board (MPOB) for providing technical assistance and
facility for foliar analysis.
References
Azahar, T.M., Mustapha, J.C., Mazliham, S. and Patrice, B. 2011. Temporal analysis of basal stem rot
disease in oil palm plantations: An analysis on peat soil. International Journal of Engineering
and Technology 11: 96-101.
Bota, C. and Deliu, C. 2011. The effect of copper sulphate on the production of flavonoids in Digitalis
lanata cell cultures. Farmacia 59: 113-118.
Caruso, C., Chilosi, G., Leonardi, L., Bertin, L., Magro, P., Buonocore, V. and Caporule, C. 2001. A
basic peroxidase from wheat kernel with antifungal activity. Phytochemistry 58: 43-50.
Chen, E.L., Chen, Y.A., Chen, L.M. and Liu, Z.H. 2002. Effect of copper on peroxidase activity and
lignin content in Raphanus sativus. Plant Physiology and Biochemistry 40: 439-444.
Chmielowska, J., Veloso, J., Gutierrez, J., Silvar, C. and Diaz, J. 2009. Cross-protection of pepper
plants stressed by copper against a vascular pathogen is accompanied by the induction of a
defence response. Plant Science 178: 176-182.
Diaz, J., Barnal, A., Pomar, F. and Merino, F. 2001. Induction of shikimate dehydrogenase and
peroxidase in pepper (Capsicum annuum L.) seedlings in response to copper stress and its
relation to lignifications. Plant Science 161: 179-188.
Dordas, C. 2008. Role of nutrients in controlling plant diseases in sustainable agriculture: A review.
Agronomy for Sustainable Development 28: 33-46.
Fageria, N.K., Baligar, V.C. and Clark, R.B. 2002. Micronutrients in crop production. Advanced in
Agronomy 77: 185-268.
Ghosh, M. 2006. Antifungal properties of haem peroxidase from Acoruscalamus. Annual Botany 98:
1145-1153.
Goh, K.J. 2003. General oil palm nutrition. In: Fairhurst, T. and Hardter, R. (Eds.) Oil Palm:
Management for Large and Sustainable Yields. Potash and Phosphate Institute of Canada
(PPIC), Canada. Pp. 191-230.
Graham, D.R. and Webb, M.J. 1991. Micronutrients and disease resistance and tolerance in plants. In:
Mortvedt, J.J., Cox, F.R., Shuman, L.M. and Welch, R.M. (Eds.) Micronutrients in
Agriculture, 2nd ed. Soil Science Society of America Inc., Madison, Wisconsin, USA. Pp.
329-370.
Grewal, H.S., Graham, R.D. and Rengel, Z. 1996. Genotypic variation in zinc efficiency and
resistance to crown rot disease (Fusarium graminearum Schw. Group 1) in wheat. Plant Soil
186: 219-226.
Karthikeyan, M., Jayakumar, V., Radhika, K., Bhaskaran, R., Velazhahan, R. and Alice, D. 2005.
Induction of resistance in host against the infection of leaf blight pathogen (Alternaria
palandui) in onion (Allium cepa var. aggregatum). Indian Journal of Biochemistry and
Biophysics 42: 371-377.
Korn, M.D.G.A., Morte, E.S.D.B., Santos, D.C.M.B.D., Castro, J.T., Barbosa, J.T.P., Teixeira, A.P.
Fernandes, A.P., Welz, B., Santos, W.P.C.D. Santos, E.B.G.N.D. and Korn, M. 2008. Sample
preparation for the determination of metals in food samples using spectroanalytical method -
A review. Applied Spectroscopy Reviews 43: 67-92.
Page 285
ISBN 978-967-10840-4-5
Proc. Int. Conf. Plt. Phy. 2014
First Published, 2015
279
Lattanzio, V., Lattanzio, V.M.T. and Cardinali, A. 2006. Role of phenolics in the resistance
mechanisms of plants against fungal pathogens and insects. In: Imperato, F. (Ed.)
Phytochemistry: Advances in Research. Research Signpost, Kerala, India. Pp. 23-67.
Marschner, H.1995. Mineral Nutrition of Higher Plants, 2nd ed. Academic Press Ltd., London, 889.
McGrath, S.P., Sanders, J.R. and Shalaby, M.H. 1988. The effects of soil organic matter level on soil
solution concentration and extractabilities of manganese, zinc and copper. Geoderma 42: 177-
188.
Michalak, A. 2006. Phenolic compounds and their antioxidant activity in plants growing under heavy
metal stress. Polish Journal of Environmental Studies 15: 523-530.
Mutert, E., Fairhurst, T.H. and von Uexkull, H.R. 1999. Agronomic management of oil palms on deep
peat. In: Armstrong, D.L. and Griffin, K.P. (Eds.) Better Crops International volume 13,
No.1. Potash and Phosphate Institute of Canada (PPIC), Canada. Pp. 22-27.
Nur Sabrina, A.A., Sariah, M. and Zaharah, A.R. 2012. Suppression of basal stem rot disease
progress in oil palm (Elaeis quineensis) after copper and calcium supplementation. Pertanika
Journal of Tropical Agriculture Science 35: 13-24.
Paterson, R.R.M., Sariah, M. and Nelson, L. 2009. The feasibility of producing oil palm with altered
lignin content to control Ganoderma disease. Journal of Phytopathology 157: 649-656.
Rakib, M.R.M., Bong, C.F.J., Khairulmazmi, A. and Idris, A.S. 2014a. Genetic and morphological
diversity of Ganoderma species isolated from infected oil palms (Elaeis guineensis).
International Journal of Agriculture and Biology 16: 691-699.
Rakib, M.R.M., Bong, C.F.J., Khairulmazmi, A. and Idris, A.S.2014b. Occurrence and spatial
distribution of Ganoderma species causing upper and basal stem rot in oil palm. Journal of
Food, Agriculture and Environment. (in press)
Rengel, Z., Graham, R.D. and Pedler, J.F. 1994. Time-course of byosynthesis of phenolics and lignin
in roots of wheat genotypes differing in manganese efficiency and resistance to take-all
fungus. Annals of Botany 74: 471-477.
Said, J.M. and Taib, S.N.L. 2009. Peat stabilazation with carbide lime. UNIMAS E-Journal of Civil
Engineering 1: 1-6.
Sakihama, Y., Cohen, M.F., Grace, S.C. and Yamasaki, H. 2002. Plant phenolic antioxidant and
prooxidant activities: phenolics-induced oxidative damage mediated by metals in plants.
Toxicology 177: 67-80.
Tohiruddin, L., Tandiono, J., Abner, J.S., Prabowo, N.E. and Foster, H.L. 2010. Effects of N, P and K
fertilizers on leaf trace element levels of oil palm in Sumatra.Journal of Oil Palm Research
22: 869-877.
von Uexkull, H.R. and Fairhurst, T.H.1991. Fertilizing for High Yield and Quality. The Oil Palm.
International Potash Institute (IPI), Bern, pp. 78.
Yruela, I. 2005. Copper in plants. Brazilian Journal of Plant Physiology 17: 145-156.
Yuan, M., Chu, Z., Li, X., Xu, C. and Wang, S. 2010. The bacterial pathogen Xanthomonas oryzae
overcomes rice defences by regulating host copper redistribution. The Plant Cell 22: 3164-
3176.
Page 286
ISBN 978-967-10840-4-5
Proc. Int. Conf. Plt. Phy. 2014
First Published, 2015
280
Improving Cocoa Yield and Suppress Pod Rot Disease through Thinning
and Pruning Modification
Prawoto, A.A.
Indonesian Coffee and Cocoa Research Institute, JL. PB. Sudirman 90 Jember 68118, East Java,
Indonesia.
E-mail: [email protected]
Introduction
Indonesia is the third biggest cocoa producer in the world after Ivory Coast and Ghana, by producing
about 833,310 tonnes per year. Cocoa farming involves 1.6 million farmers and millions of jobs for
the dairy industry (Anonymous, 2011). The cocoa bean productivity is around 564 kgha-1
which is
higher than Ivory Coast (450 kgha-1
) and Ghana (500 kgha-1
). However, this figure is still far lower
than the true potential of the clone, which can produce more 2000 kgha-1
.
There are many causes of this low productivity of cocoa and one of them is due to black pod disease,
Phytophthora palmivora. This fungus is the main disease in Indonesia and also in the most of other
cocoa producers in the world (Semangun, 2000; MacMahon and Purwantara, 2004). It causes the
yield loss up to 20-30% (Guest, 2007). In Indonesia, the yield loss was recorded up to 60% in
Sulawesi during rainy season (Rosmana et al., 2006) and around 54% in government estate in East
Java (ICCRI, 2012). Over-lapped branches due to high humidity and incorrect cocoa pruning have
triggered this disease attack. Beside soil, diseased pods left on the tree and stem canker, older trees,
high and dense canopy, would complicate sanitation of those sources of inoculation.
The recommended control methods are (a) environmental management by regular pruning of cocoa
and shade trees, (b) disease management, by sanitation of infected pods and buried its, (c) pod
management by application of protective fungicide. In general, those methods are well versed by
farmers but pod rot infection still occurred because those methods were not applied properly. Newest
technique in order to control this fungus is by using oil-based formulation of Trichoderma asperellum.
Tested on detached pods, the formulation was completely found to inhibit the development of the
disease. When sprayed in the field on cacao clones that is highly sensitive to P. megakarya, the
formulation resulted in 90% protection of treated pods after 1 week, and 50% after 3.2 weeks
(Mbargaa et al., 2014).
Cocoa farm humidity is influenced by spacing and optimum cocoa spacing is depending on the
planting materials, soil fertility and rainfall type. The optimum cocoa spacing vary between countries,
i.e. Ghana 2.3 x 2.3 m to 3 x 3m, Ivory Coast 3 x 2 m to 3 x 2.5 m, Trinidad 2.4 x 2.4 m maximum,
Brazil 2 x 2 m, Papua New Guinea 3.7 x 3.7 m (Soenaryo and Winaryo, 1988),
Pruning modification to prevent branches over-lapping especially on vigorous farm is able to increase
flowering, pod setting and decrease pod rot incidence. Although this method will incur high pruning
cost but it is still consider more profitable. Heavier pruning will allow more sunlight to penetrate the
canopy and creating a warm condition which lead to induce flowering and pods production (Prawoto,
2008).
Hence, the aim of this research was to determine the effects of cocoa spacing and thinning on clone
and hybrid materials as well as the effect of pruning modification on pod and bean yield, incidence of
pod rot and mirids attack, and also the net income of farmers.
Page 287
ISBN 978-967-10840-4-5
Proc. Int. Conf. Plt. Phy. 2014
First Published, 2015
281
Materials and Methods
Activity 1: Cocoa spacing and thinning
a. Young trees
a.1. In spacing treatment, cocoa farms of Pa 191, BL 703 and GC 29 clones planted in 2007
were used. The farms received rainfall under B rainfall type (0.143 < Q < 0.333, Q= Ratio between
the number of dry months and wet months in a year) according to Schmidt & Fergusson classification
(Lakitan, 2002). Leucaena sp. planted at 3 x 6 m was used as shade trees. Meanwhile spacing
treatments were (a) 3 x 3 m; and (b) 3 x 3 x 6 m. The data were collected from the sampling plot for
Pa 191 clone comprising five rows with five trees per row. The observed data was analyzed using
descriptive statistic.
a.2. In thinning treatment, hybrid planting materials which was planted in 2006 in C rainfall
type (0.333 < Q < 0.600). The coconut trees planted at 12 x 9 m was used as shade trees. The initial
spacing was 3 x 3 m and some part of them was thinned systematically to 3 x 3 x 6 m (double rows)
or one third of the population after 7 years. Therefore, the sampling plots were 3 x 3 m and 3 x 3 x 6
m spacing. The number of replications was 10 rows and 5 plants per row. The observed data was
analyzed using descriptive statistic.
The study was conducted in wet (B to A rainfall type) estate on hybrids planting materials planted in
1995. The initial spacing was 3 x 2 m and after 17 years old apart of them thinned selective
systematically to 3 x 2 x 4 m (double rows). The sample trees were 5 trees and replicated 10 times
(rows).
Variables; for all of treatments the variables were number of harvested pods, pod value, dry bean
yield, number of pods infested by pod rot and Helopeltis antonii, microclimate indicators of
illumination, temperature and relative humidity. Cost components i.e. fertilizer, insecticide, fungicide
and their application, cost of cocoa pruning were observed and also gross and net income. Those
variables were observed during semester I and II.
Activity 2: Pruning modification
This study was conducted in B rainfall type, using Pa 191 clone spacing 3 x 3 m and planted in 2006.
The growth was vigorous so at 5 years old the overlapping branches were enormous. The tested
pruning type were heavy pruning all of over-lapping branches every two rows of plants and control.
Each model was tested on 2 ha. Coconut at 15 x 15 m was the shade trees. The samples were 5 plants
and replicated 10 rows. The parameters and analyzed method was similar with the previous study.
Results and Discussion
Activity 1: Spacing and thinning
Wider spacing on young cocoa at 5 years old showed increased pod yield per tree, decrease PPR and
Helopeltis (Table 1). But for one area calculation, those increasing pod setting was still lower than the
standard spacing 3 x 3 m. This facts lead to lower revenue although cost for pruning, fertilizing, pest
and disease controlling one third lower (Table 4). It seen that until 6 years old, cocoa population 730
pph (plant per ha) decrease net income 12.9% to standard population 1100 pph.
Unlike the case with thinning treatment at 7 years old on vigorous hybrid materials, systematic
thinning 30% of its population for initial spacing 3 x 3 m (one row for each three rows) increase pod
yield per tree about 66%, dry bean 12.9% and net revenue 30.8% (Table 2 and 5). Pod rot and
Helopeltis attack in this young plantation was not different to control. Hybrid material is much more
vigorous and higher canopy compared to clone materials because of its orthotropic vs plagiotropic
Page 288
ISBN 978-967-10840-4-5
Proc. Int. Conf. Plt. Phy. 2014
First Published, 2015
282
characters. So, in general it can be said that hybrids planting materials need wider spacing than
plagiotropic ones.
The more dynamic impact of cocoa thinning appeared on matured farm. Systematic selective thinning
one third population on 17 years old increase yield 36.5% per ha and decrease pod rot attack 11.6%,
so this action improve revenue about 11.3%. This study was conducted in wet rainfall type estate
(Table 3 and 6). This result was similar with cocoa thinning in Central America that removal of all
weak trees (of less than average diameter) on spacing 2x2m and 2x3m increase bean yield from 437
kg.ha-1
to 545 kg.ha-1
and reduce monilia pod rot (Moniliophthora roreri) incidence (Quirós-Conejo
et al., 1988).
Table 1. Average per tree of harvested pods, number of pod rot and Helopeltis attack on spacing
treatment at 5 years old.
Spacing (m) Harvested pods per tree Pod rot per tree Infested pod of
Helopeltis Sem. I Sem. II Total Sem. I Sem. II Total
Final 3x3x6 18.7± 3.6 19.4± 4.3 38.1 2.8 ±0.6 15.4 ±3.2 18.2 5.2 ±1.2
Initial 3x3 12.3 ± 2.7 18.6±6.4 30.9 2.0 ±0.2 28.4 ±6.4 30.4 9.0 ±2.4
Notes: Data ± standard deviation
Table 2. Average per tree of harvested pods, number of pod rot and Helopeltis attack on thinning
treatment at 7 years old.
Spacing (m)
Harvested pods per tree Pod rot per tree Infested pod of
Helopeltis Sem. I Sem. II Total Sem. I Sem. II Total
Final 3x3x6 10.4±3.7 39.6±12.8 50.0 5.5±1.2 19.0±6.4 24.5 1.6±0.3
Initial 3x3 6.4±2.1 23.8±7.4 30.2 5.2±1.6 19.8±7.5 24.9 1.7±0.5
Notes: Data ± standard deviation
Table 3. Average per tree of harvested pods, number of pod rot and Helopeltis attack on thinning
treatment at 17 years old.
Spacing (m) Harvested pods per tree Pod rot per tree Infested pod
of Helopeltis Sem. I Sem. II Total Sem. I Sem. II Total
Final 3x2x4 11.7 ±4.2 23.8 ±9.2 35.5 17.9 ±4.3 13.2 ±4.3 31.1 2.5 ±0.6
Initial 3x2 6.6 ±2.3 19.4 ±5.3 26.0 17.7 ±3.6 17.0 ±4.2 34.7 1.8 ±0.2
Notes: Data ± standard deviation
Effect of thinning on increasing pod yield physiologically can be explained as follows; to induce
cushion to grow flowers, needs warm temperature (Alvim, 1977). This condition can be obtained from
pruning or in this case by thinning or by shade tree felling. Air temperature more than 27 °C induced
more flower than 23 °C.
Effect of thinning on lowering pod rot disease related with decreasing of relative humidity is showed
in Table 7. The moist farm and continued availability of sources of inoculum be the main cause of this
disease (Guest, 2007). Cocoa thinning followed by frequent pruning and pod rot sanitation shown
effective to suppres its attack. Beside that, in Indonesia RidomillGold fungicide is used for preventive
treatment. The use of Trichoderma as biofungicide is still in optimization stage while in Kamerun
Trichoderma asperellum formulated in oil dispersion has therefore great potential for the control of
cacao black pod disease with less recourse to synthetic fungicides (Mbarga et al., 2014). Research in
Kamerun showed effect of rainfall on effectiveness method to control P. megakarya (Deberdt et al.,
2008). The disease rates were 1.73%, 47.1% and 71.23% in the plots treated with fungicide, T.
asperellum and untreated, respectively, in 2004, and 0.67%, 11.35% and 34.04% in the same plots in
2005.
Page 289
ISBN 978-967-10840-4-5
Proc. Int. Conf. Plt. Phy. 2014
First Published, 2015
283
As the result of improvement of pod setting and decreament of pod rot attack was appear on
improvement of revenue. Cocoa thinning of seedling materials at 5 years old increase net revenue
30.8% and thinning on 17% years old of seedling about 11.3 % (Table 5 and 6).
Optimum population of cocoa which is reflected from the plant spacing treatment tighly correlated
with vigority of materials, soil fertility, climate type and plant age. In relation with plant age, this
research proved that at the early years of its growth the optimum population more and wider along
with the addition of age. Cocoa thinning for the old trees beginning after most of branches overlap,
gave positive effect on yield. The problem of overlapping branches actually can be eliminate by
frequent pruning, but in this case thinning suspected more effective because wage labor costs become
a prominent source in the estate plantation. In addition, crop thinning impact on the lowering need for
fertilizers and pesticides and application costs and increase yield and income planters (Table 4, 5 and
6).
There are many research on annual crops about spacing that indicate there was an optimum spacing to
obtain maximum yield and income. On Phazeolus vulgaris, a results indicate that narrow and
equidistant planting has potential to increase bean yield by 30%-70%, when compared to random
planting (normal practice) while at the same time suppressing weed growth and is recommended for
smallholder farmers in Rwanda and other semi-arid areas in sub-Saharan Africa (Dusabumuremyi et
al., 2014). On Medicago sativa, Mattera et al. (2013) stated that reducing row spacing to an optimal
distance is a practice that allows for more favorable spatial arrangements has a positive impact on
forage production.
Page 290
ISBN 978-967-10840-4-5
Proc. Int. Conf. Plt. Phy. 2014
First Published, 2015
284
Table 4. Economic analysis per ha impact of planting distance at 5 years old.
Spacing,
m
Population,
pph Pod per ha
Dry bean,
kg ha-1
Gross
income, IDR
Cost, IDR Total
cost, IDR
Net
income,
IDR
Decreasing,
% Pruning Fertilizing Insecticide Fungicide
3x3x6 730 27813 927 27813000 250000 2344000 1840000 1800000 6234000 21579000 -12.90
3x3 1100 33990 1133 33990000 375000 3380000 2760000 2700000 9215000 24775000
Table 5. Economic analysis per ha impact of cocoa thinning at 7 years old.
Spacing,
m
Population,
pph Pod per ha
Dry bean kg
ha-1
Gross
income, IDR
Cost of, IDR Total
cost, IDR
Net
income,
IDR
Increasing,
% Pruning Fertilizing Insecticide Fungicide
3x3x6 730 36500 1304 39120000 250000 1698710 1209610 1183330 4341650 34778350 19.76
3x3 1100 33220 1186 35580000 375000 2559700 1822700 1783100 6540500 29039500
Table 6. Economic analysis per ha impact of thinning at 17 years old.
Spacing,
m
Population,
pph
Pod per
tree.
year-1
Dry bean kg
ha-1
Gross
income, IDR
Maintenance cost, IDR Total
cost, IDR
Net
income,
IDR
Decreasing,
% Pruning Fertilizing Insecticide Fungicide
3x2x4 1110 35.5 1,408 42852857 333,333 2,583,100 1,840,000 1,800,000 6,556,433 36296424 -1.17
3x2 1667 26 1,393 46437857 500,000 3,750,700 2,760,000 2,700,000 9,710,700 36727157
Page 291
ISBN 978-967-10840-3-8
Trans. Malaysian Soc. Plant Physiol. 22
First Published, 2014
285
Table 7. Microclimate condition inside farm plot
Object Spacing, m Temperature, °C RH, % Illumination, % direct
Seedling,
5 years old
3x3x6 30 53 2.31
3x3 28 56 1.95
Clonally,
7 years old
3x3x6 32 56 1.98
3x3 30 59 1.80
Seedling,
17 years old
3x2x4 29 66 1.69
3x2 28 69 1.45
Activity 2, Pruning modification
Pruning modification by avoid overlapping branches proved effective to prevent pod rot attack and
increase pod yield. Pod yield at 2nd
semester increase 26.1% and brings the total pod harvested within
one year increased by 19.6% (Table 8). Pod yield during 1st semester was not different to control because
pruning treatment was conducted during that semester. Although this pruning modification adds more
cost, but this additional was still covered by the increased of yield, the revenue increase about 25.5%
(Table 9). As the cause of the fact that due to the pruning modification increase the intensity of radiation,
boost air temperature and lower RH inside the canopy.
Table 8. Average of harvested pods, number of pod rot and Helopeltis attack per tree.
Harvested pods Pod rot infection, pods Helopeltis attack,
pods
Sem. I Sem. II Total Sem. I Sem. II Total
Modified
trimming 12.2 ± 4.3 34.8 ± 11.6 47.0 5.4 ± 1.1 17.8 ± 4.2 23.2 13.8 ± 4.7
Control 11.6 ± 5.2 27.6 ± 9.5 39.3 5.9 ± 2.1 39.3 ± 13.6 45.1 15.5 ± 5.2
Notes: data ± standard deviation
Table 9. Yield and economic analysis per hectare.
Pods Dry bean, kg Gross, Rp Pruning cost Net Increase, %
Modified
trimming 54,450 1,944,643 58,339,286 600,000 57,739,286 25.47
Control 43,230 1,543,929 46,317,857 300,000 46,017,857
Table 10. Microclimate inside tree canopy.
Treatment Temperature, °C RH, % Illumination, % direct
Modified trimming 29 64 2.02
Control 27 68 1.85
Conclusions
a) Wider spacing of 730 pph on young cocoa at 5 years old although increase pod per tree but the
revenue still 12.9% lower than control of 1100 pph.
Page 292
ISBN 978-967-10840-3-8
Trans. Malaysian Soc. Plant Physiol. 22
First Published, 2014
286
b) Systematic thinning increase pod yield and lower pod rot attack. Thinning cocoa derived from F1
hybrid at 7 and 17 years old, increase pod yield per tree by 66% and 36% and lower PPR 1.7% and
11.6% respectively as compared to the control. Despite the lower cost for fertilizing, pruning, and
pest and disease controlling, net income of this methods were 19.8% but -1.2% respectively to the
control.
c) Pruning modification increase average of pod yield per tree 19.6%, lower PPR (Phytophthora Pod
Rot) incidence 48.6% and Helopeltis attack by 5.1% and net income 25.5% higher.
d) Increasing yield and reduce of PPR are associated with the increase of air temperature and decrease
of relative humidity in the farm.
Acknowledgements
Author would like to thank to Manager of Kendeng Lembu and Kalisepanjang Estates of PTPN XII for
the location facilities of the research and support workforce. The similar thanks were addressed to
Director of ICCRI for the funding.
References
Alvim, P. de T. 1977. Cacao. P. 291-296. In: P.de T. Alvim and T.T. Kozlowski (Eds.). Ecophysiology of
Tropical Crops. Acad. Press, New York.
Anonymous. 2011. Tree Crop Estate Statistic of Indonesia 2919-2012. Cocoa. Directorate General of
Estate, Jakarta, Indonesia.
Borrás, L., Maddonni, G.A. and Otegui, M.E . 2003. Leaf senescence in maize hybrids: plant population,
row spacing and kernel set effects. Field Crops Research 23: 13-26.
Deberdt, P., Mfegue, C.V., Tondje, P.R., Bon, M.C., Ducamp, M., Hurard, C., Begoude, B.A.D.,
Ndoumbe-Nkeng, M., Hebbar, P.K. and Cilas, C. 2008. Impact of environmental factors,
chemical fungicide and biological control on cacao pod production dynamics and black pod
disease (Phytophthora megakarya) in Cameroon. Biological Control 44: 149-159.
Dusabumuremyi, P., Niyibigira, C. and Mashingaidze, A.B. 2014. Narrow row planting increases yield
and suppresses weeds in common bean (Phaseolus vulgaris L.) in a semi-arid agro-ecology of
Nyagatare, Rwanda. Crop Protection 64: 13-18.
Guest, D. 2007. Black pod: Diverse pathogen with a global impact on cocoa yield. Phytophatology 97:
1650-1653.
Indonesian Coffee and Cocoa research Institute. 2012. Operasional Cooperation of Investation and
Exploitation of Cocoa Farm in PTPN XII (Persero). ICCRI, Jember.
Lakitan, B. 2002. Dasar Dasar Klimatologi. PT. Raja Grafindo Persada. Jakarta.
Mbarga, J.B., Begoude, A.D., Ambang, Z., Meboma, M., Kuate, J., Schiffers, B., Ewbank, W. and
Dedieu, L. 2014. A new oil-based formulation of Trichoderma asperellum for the biological
control of cacao black pod disease caused by Phytophthora megakarya. Biological Control 77:
15-22.
McMahon, P. and Purwantara, A. 2004. Phytophthora on cocoa. P. 104-115. In: A. Drenth and D.I. Guest
(Eds.). Diversity and Management of Phytophthora in Southeast Asia. ACIAR Monograph 114.
Mattera, J., Luis A. Romero, Alejandra L. Cuatrín, Patricia S. Cornaglia, and Agustín A. Grimoldi. 2013.
Yield components, light interception and radiation use efficiency of lucerne (Medicago sativa L.)
in response to row spacing. European Journal of Agronomy 45: 87-95.
Prawoto, A.A. 2008. Pruning, p. 123-132. In: T. Wahyudi, T.R. Panggabean and Pujiyanto (Eds.).
Complete Guide of Cocoa. Management, From Upstream to Downstream Agribusiness. Penebar
Swadaya, Jakarta.
Purwantara, A. 2008. Infection of Phytophthora palmivora from soil on cocoa plantation. Pelita
Perkebunan 24: 205- 218.
Page 293
ISBN 978-967-10840-3-8
Trans. Malaysian Soc. Plant Physiol. 22
First Published, 2014
287
Quirós-Conejo, Salvador. Coope San Carlos, R.L Ciudad Quesada CR. 1988. Effect of five thinning
systems on production, incidence of disease and other characteristics of 17-year-old cocoa
planted at 2 x 2 and 2 x 3 m spacings. Proceedings International Cocoa Research Conference. X.
Santo Domingo DO 17-23 May 1987. p. 57-61.
Rosmana, A., Sahrani, E., Saharuddin, W. and Junaid, M. 2006. Comparison of Trichoderma use with
synthetic fungicide to control phythophthora pod rot of cocoa. Fitomedika 6: 22-25.
Semangun, H. 2000. Penyakit-Penyakit Tanaman Perkebunan di Indonesia. Gadjah Mada Univ. Press,
Yogyakarta.
Singels, A. and Smit, M.A. 2009. Sugarcane response to row spacing-induced competition for light. Field
Crops Research 113: 149-155.
Soenaryo and Winaryo. 1988. Jarak tanam dan produktivitas kakao di berbagai negara produsen. Pros.
Komunikasi Teknis Kakao 1988, 87-116.
Page 294
ISBN 978-967-10840-3-8
Trans. Malaysian Soc. Plant Physiol. 22
First Published, 2014
288
Clonal Selection on Cocoa Resistance to Vascular-Streak Dieback
Susilo, A.W.* and Anita-Sari, I.
Indonesian Coffee and Cocoa Research Institute, Jl. PB Sudirman 90 Jember 68118 East Java Indonesia.
E-mail: [email protected]
Introduction
Vascular-streak dieback (VSD) is the most serious disease on cocoa in Indonesia which results in plant
damage. The fungus Oncobasidium theobromae of the VSD agent infects cocoa through young emerged-
leaves then penetrates to xylem bundle-sheet so the nutrient transport is blocked. Method for controlling
VSD has been recommended as integrated management such as regular pruning of the infected branches,
application of more organic material to soil and inorganic fertilizer to support plant regrowth followed by
spraying of the new emerged-leaves using fungicide of Azocystrobin and Difenoconazole (Sri-Sukamto et
al., 2008). These approaches look more effective when applied in case of light and moderate damages but
in case of high damages the use of resistant planting material is the most effective method for controlling
VSD. Febriantomo (2012) reported the success on reducing VSD incidence from 38% to 9% by
implementing those methods in cocoa plantations in Java. As the long term approach for controlling VSD
by using resistant planting material, there are some recommended resistant clones and hybrids, namely
Sulawesi 01, Sulawesi 02, Sca 6 and ICCRI 06H (Susilo et al., 2013). The genetic potency of cocoa
planting material should be improved to contruct polygenic resistance by which the resistant genotypes
should also perform resistance to other pests or diseases, besides VSD.
Breeding for VSD resistance on cocoa in Indonesia has been carried out simultaneously by selecting the
promising genotypes through hybrid population. Selection was carried out based on individual basis and
population basis to develop both clones and hybrids as cocoa planting materials. Clonal selection was
carried out in the endemic area of VSD in Kaliwining Experimental Station of ICCRI to select the
resistant clones, which are also potentially resistant to other diseases. Results of the selection will be
discussed in this paper.
Materials and Methods
Genetic material
Genetic materials of this trial consisted of the introduced clones from the University of Reading (RU),
selected genotypes through hybrid population of multilocation trials (Susilo and Anita-Sari, 2011) and
exploratory genotypes at the Sumatra region. A total of 44 clones were collected for testing against both
the resistant (Sulawesi 01) and susceptible (NIC 7) (Table 1) controls.
Trial design
Field testing of this trial established in Kaliwining Experimental Station of the VSD endemic were based
on randomized complete block design with 3 blocks as replication. Seedlings of the tested clones were
propagated by top grafting method in which the scions were derived from plagiotropic branches. The
seedlings were planted in 2008 at the spacing distance of 3 x 3 m with 5 trees per plot. Management of the
trial was carried out according to the standard of good agriculture practices (GAP) on cocoa.
To perform the resistance record, the symptom of damage due to VSD was noted as scoring of the
damage in the tree level using 0-6 scale (Susilo and Anita-Sari, 2011). Resistant evaluations were carried
Page 295
ISBN 978-967-10840-3-8
Trans. Malaysian Soc. Plant Physiol. 22
First Published, 2014
289
out in dry season in the year of 2012-2013. The yield performance of the tree was also recorded by
counting the number of pods per tree. The data were then converted to yield potency by multiplying with
pod index. The pod index was calculated based on the parameter of the number of beans per pod and
weight of a dry bean. Mean of the variables were tabulated to indicate differences among clones.
Table 1. The list of tested clones for selection of the VSD resistant genotype. No KW serried Selection code/Progeny Origin
1. KW 176 NIC 7 Introduction (susceptible)
2. KW 162 Sulawesi 01 Recommended clone (resistant)
3. KW 255 JTC 25 Selected at Jatirono
4. KW 433 RU I - SCA 11 Introduced from RU
5. KW 443 RU I - SPA 9 Introduced from RU
6. KW 444 RU I - BORNE 7 A2 Introduced from RU
7. KW 454 RU I - KER 3 Introduced from RU
8. KW 467 RU I -BORNE 7 A6 Introduced from RU
9. KW 468 RU I - EQ X 3360-3 Introduced from RU
10. KW 490 DRC 15 Selected at Djati Roenggo
11. KW 514 ICCRI 07 Selected at North Sumatra
12. KW 516 PABA/VIII/78B/2 Selected at North Sumatra
13. KW 535 ADO 1 Selected at North Sumatra
14. KW 562 PABA/I/90C/2 Selected at North Sumatra
15. KW 563 PABA/I/90C/4 Selected at North Sumatra
16. KW 564 PABA/IX/90O/2 Selected at North Sumatra
17. KW 566 PABA/V/81L/1 Selected at North Sumatra
18. KW 567 PABA/IX/90O/3 Selected at North Sumatra
19. KW 570 Sulawesi 03 Selected at South Sulawesi
20. KW 606 BLITAR 01 Selected at Blitar
21. KW 608 ADO/IV/90B/53/38 Selected at North Sumatra
22. KW 609 ADO/IV/90B/149/13 Selected at North Sumatra
23. KW 614 ADO/IV/91EU/11/33 Selected at North Sumatra
24. KW 615 ADO/IV/91FU/51/32 Selected at North Sumatra
25. KW 616 ADO/IV/91FU/149/96 Selected at North Sumatra
26. KW 617 KWN 2.2.9 (TSH858xKW162) Selected at Kaliwining, Jember
27. KW 618 KWN 3.10.1 (KW162xTSH858) Selected at Kaliwining, Jember
28. KW 619 KPSA - 2.7.16 (KEE2xNIC7) Selected at Sumber Asin, Malang
29. KW 621 KPSA - 3.15.8 (Prop.ICS 60) Selected at Sumber Asin, Malang
30. KW 623 SBRM 01 Selected at Jembrana, Bali
31. KW 626 RANTO JAYA 1 Selected at Lampung
32. KW 629 KALIDADI 1 Selected at Lampung
33. KW 630 GNRG 02 Selected at Jatirono
34. KW 631 KEMBU 01 (TSH 858xPBC 123) Selected at Kendeng Lembu
35. KW 635 KEMBU 05 (TSH 858x BC 123) Selected at Kendeng Lembu
36. KW 636 KEMBU 06 Selected at Kendeng Lembu
37. KW 637 KATE 01 - 1.2.16 (TSH 858xKW 162) Selected at Kalitelepak
38. KW 638 KATE 02 - 2.2.3 (TSH 858xKW 162) Selected at Kalitelepak
39. KW 641 KATE 05 - 2.13.11 (KW163xKEE2) Selected at Kalitelepak
40. KW 642 KATE 06 - 2.3.7 (TSH858xNIC7) Selected at Kalitelepak
41. KW 649 KATE 13 - 3.2.15 (TSH858xKW162) Selected at Kalitelepak
42. KW 651 KATE 15 - 1.4.10 (TSH858xICS13) Selected at Kalitelepak
43. KW 684 RU III - CCN .51 Introduced from RU
44. KW 685 YPSI (MUCHTAR 1) Selecetd at South Sulawesi
Other than VSD evaluation, the resistance to pod rot disease was also tested for obtaining the promising
clones using laboratory study by inoculating the detached pod using isolate of Phytophthora palmivora
(Susilo and Anita-Sari, 2014). The tested clones were KW 617 and control of the susceptible clone of
TSH 858, the resistant clone of Sca 6, ICCRI 03 and ICCRI 04. Lession size due to P. palmivora was
measured from 1st to 7
th day after inoculation.
Page 296
ISBN 978-967-10840-3-8
Trans. Malaysian Soc. Plant Physiol. 22
First Published, 2014
290
Data analysis
Means of the scores were clustered by fastclass analysis method using SAS program. The resistance was
clasified into 5 groups of resistance, namely resistant, moderate resistant, moderate susceptible,
susceptible and very susceptible.
Results and Discussion
The results on VSD evaluation during for 2 years (2012-2013) indicate that there was varying
performance of VSD resistance among tested clones (Table 2). Mean of the score varied among clones in
the range of 1.93 – 4.80. The susceptible clone of NIC 7 had the highest score in contrary with the
resistant clone of Sulawesi 01 that had the lowest score. Grouping of the resistance showed that some
clones were classified into the group of Sulawesi 01 as the resistant control, namely ICCRI 07, KW 562,
Sulawesi 3, KW 606 and KW 617. Of those clones, ICCRI 07 and Sulawesi 3 had been released as the
resistant clones to cocoa pod borer (Susilo et al., 2012). This result confirms any potency of polygenic
resistant on cocoa to some pests and diseases. For example, Sca 6 had resistance to VSD (Susilo et al.,
2009), pod rot (P. palmivora) and anthracnose (Colletotrichum sp.) (Napitupulu et al., 1991) and witches’
broom (Dos Santos et al., 2005). The results also indicated that the introduced clones from international
collection of the University of Reading (RU code) also had varying resistance from that of moderate
resistance to very susceptible ones. The selected resistant clones were then subjected to selection for the
high yielding clones.
Mechanism on VSD resistance has been intensively studied. There were some hypothesis tested to
identify the most appropriate mechanism of the resistance that is able for use to develop criteria for
selection and control method. Antibiosis mechanism would also control the resistance as reported by
Prawoto et al. (2013), in which the resistant clones showed higher concentration of secondary metabolite
(terpenoid and polyphenol), which was also supported by structural mechanism as the greater thickness of
cuticle, epidermis and palisade tissues in the resistant leaves as compared to susceptible clones. Susilo
and Anita-Sari (2014) reported the potency of tolerant mechanism on VSD resistance as the resistant trees
exhibited higher rejuvenation process after pruning for controlling VSD. Furthermore, the selected
resistant clones can be confirmed for their resistance using those resistant variables in field evaluation of
the resistance.
Visual evaluation of the selected clones shows that KW 617 of the selected resistant clone had high
potency of yield with higher number of pods per tree (Figure 1). Performance of the clone appeared stable
among locations. However, mean pod number for 2 years’ evaluation of 2012 - 2013 in Kaliwining was
lower than that of Sulawesi 01. KW 617 is of the progeny of Sulawesi 01 with TSH 858 that indicated
that there was no hybrid vigor performance for yield component inherited through KW 617 but potential
hybrid vigor was found for VSD resistance as the mean score of KW 617 was lower than Sulawesi 01.
Pang and Lockwood (2008) suspected that the hybrid vigor was ephygenetic process of the differences in
tree performance between parental clones and hybrids. These results also showed that CCN 51 of the
recommended clone from Ecuador had lower number of pods as the clone was susceptible to VSD with
higher score of 3.21.
Evaluation on bean quality was performed to all the under study clones as whether trees of the susceptible
clones are growing well and bearing pods (Table 4). The selected clones of KW 562 and KW 617 gave
better quality beans with bean dry weight of 1.0 and 0.97 g respectively (grade A and B of national
standard). Their pod indices were up to 21.4 and 23.6 respectively, which are equavalent to that of
Sulawesi 01 as the control. The bean dry weight was, however, lower as compared to the highest potency
of bean dry weight as cocoa planting material, which was reported on ICS 60 and UIT 1, performing bean
Page 297
ISBN 978-967-10840-3-8
Trans. Malaysian Soc. Plant Physiol. 22
First Published, 2014
291
dry weight of 1.67 and 1.64 g respectively (Iswanto et al., 2001). These two clones were, however, highly
susceptible to VSD. Further criteria for selection are not dependent on just a few traits but should refer to
some traits which are the attributes of the high quality cocoa planting material.
Table 2. Mean score of VSD-symptom damage of the tested clones in Kaliwining Experimental Station,
Jember (2012-2013).
No KW serried Clone Year
Mean*
2012 2013
1. KW 176 NIC 7 5.6 4.0 4.80 A
2. KW 162 Sulawesi 01 1.9 2.5 2.20 E
3. KW 255 JTC 25 4.7 2.3 3.46 B
4. KW 433 RU I - SCA 11 5.3 3.5 4.42 A
5. KW 443 RU I - SPA 9 3.5 3.3 3.43 C
6. KW 444 RU I - BORNE 7 A2 3.0 2.9 2.96 D
7. KW 454 RU I - KER 3 3.5 2.8 3.15 D
8. KW 467 RU I -BORNE 7 A6 2.6 3.3 2.93 D
9. KW 468 RU I - EQ X 3360-3 4.3 2.6 3.45 B
10. KW 490 DRC 15 5.5 3.5 4.48 A
11. KW 514 ICCRI 07 2.0 2.8 2.42 E
12. KW 516 PABA/VIII/78B/2 2.7 3.1 2.89 D
13. KW 535 ADO 1 3.1 3.0 3.08 D
14. KW 562 PABA/I/90C/2 2.1 2.9 2.51 E
15. KW 563 PABA/I/90C/4 4.9 2.8 3.83 B
16. KW 564 PABA/IX/90O/2 3.2 3.1 3.13 D
17. KW 566 PABA/V/81L/1 6.0 6.0 6.00 A
18. KW 567 PABA/IX/90O/3 2.7 2.6 2.62 D
19. KW 570 Sulawesi 03 2.2 2.9 2.52 E
20. KW 606 BLITAR 01 2.3 2.6 2.41 E
21. KW 608 ADO/IV/90B/53/38 4.7 3.2 3.95 B
22. KW 609 ADO/IV/90B/149/13 3.9 3.3 3.60 D
23. KW 614 ADO/IV/91EU/11/33 3.0 2.8 2.89 D
24. KW 615 ADO/IV/91FU/51/32 4.4 3.3 3.88 B
25. KW 616 ADO/IV/91FU/149/96 2.7 2.8 2.77 D
26. KW 617 KWN/II/2/9 (TSH858xKW162) 1.9 2.0 1.93 E
27. KW 618 KWN/III/10/1 (KW162xTSH858) 3.6 2.1 2.86 D
28. KW 619 KPSA/II/7/16 (KEE2xNIC7) 5.1 3.0 4.07 A
29. KW 621 KPSA /III/15/8 (Prop.ICS 60) 6.0 6.0 6.00 A
30. KW 623 SBRM 01 3.4 2.7 3.04 D
31. KW 626 RANTO JAYA 1 4.7 3.3 3.96 B
32. KW 629 KALIDADI 1 4.7 3.0 3.83 B
33. KW 630 GNRG 02 3.2 2.4 2.78 C
34. KW 631 KEMBU 01 (TSH 858xSul01) 4.7 3.0 3.87 B
35. KW 635 KEMBU 05 (TSH 858x Sul 01) 5.4 3.8 4.55 A
36. KW 636 KEMBU 06 2.8 2.5 2.64 C
37. KW 637 KATE/I/2/16 (TSH 858xKW 162) 4.3 1.8 3.05 B
38. KW 638 KATE/II/2/3 (TSH 858xKW 162) 4.6 3.0 3.80 B
39. KW 641 KATE/II/13/11 (KW163xKEE2) 2.6 3.0 2.80 D
40. KW 642 KATE/II/3/7 (TSH858xNIC7) 3.1 2.6 2.84 C
41. KW 649 KATE/III/2/15 (TSH858xKW162) 4.3 2.3 3.33 B
42. KW 651 KATE/I/4/10 (TSH858xICS13) 4.0 3.3 3.68 B
43. KW 684 RU III - CCN .51 3.9 2.5 3.21 C
44. KW 685 YPSI (MUCHTAR 1) 3.2 2.7 2.96 D
Note: * indicates that means within column with same letter were classified in the same group of VSD
resistance based on fastcluss analysis using statistical analysis system (SAS)
Page 298
ISBN 978-967-10840-3-8
Trans. Malaysian Soc. Plant Physiol. 22
First Published, 2014
292
KP Sumber Asin KP Kaliwining Polman, Sulbar
Figure 1. The performance of KW 617, the selected resistant clones to VSD in three different trial
locations; KP Sumber Asin, Malang (left), KP Kaliwing, Jember (centre) and Polman, West
Sulawesi (right)
Table 3. Mean of pod number per tree of clones tested in Kaliwining Experimental Station (2012-2013).
No KW serried Clone Year
Mean*
2012 2013
1. KW 176 NIC 7 0 18.3 9.1
2. KW 162 Sulawesi 01 60.8 56.0 58.4
3. KW 255 JTC 25 5.7 19.7 12.7
4. KW 433 RU I - SCA 11 0.5 3.5 2.0
5. KW 443 RU I - SPA 9 13.1 15.3 14.2
6. KW 444 RU I - BORNE 7 A2 27.4 12.5 19.9
7. KW 454 RU I - KER 3 11.5 6.0 8.7
8. KW 467 RU I -BORNE 7 A6 18.1 10.1 14.1
9. KW 468 RU I - EQ X 3360-3 3.9 2.4 3.1
10. KW 490 DRC 15 3.2 1.5 2.3
11. KW 514 ICCRI 07 17.0 25.1 21.0
12. KW 516 PABA/VIII/78B/2 29.9 15.2 22.5
13. KW 535 ADO 1 16.2 13.9 15.1
14. KW 562 PABA/I/90C/2 37.2 27.0 32.1
15. KW 563 PABA/I/90C/4 0 0 0
16. KW 564 PABA/IX/90O/2 19.1 21.0 20,0
17. KW 566 PABA/V/81L/1 - - -
18. KW 567 PABA/IX/90O/3 20.0 29.7 24.8
19. KW 570 Sulawesi 03 21.5 30.4 26.0
20. KW 606 BLITAR 01 49.6 45.3 47.4
21. KW 608 ADO/IV/90B/53/38 1.9 7.8 4.9
22. KW 609 ADO/IV/90B/149/13 0.3 10.3 5.3
23. KW 614 ADO/IV/91EU/11/33 16.9 15.9 16.4
24. KW 615 ADO/IV/91FU/51/32 1.9 4.9 3.4
25. KW 616 ADO/IV/91FU/149/96 0.9 2.0 1.4
26. KW 617 KWN/II/2/9 (TSH858xKW162) 22.9 33.0 27.9
27. KW 618 KWN/III/10/1 (KW162xTSH858) 14.0 25.1 19.6
28. KW 619 KPSA/II/7/16 (KEE2xNIC7) 5.3 0.8 3.0
29. KW 621 KPSA /III/15/8 (Prop.ICS 60) - - -
30. KW 623 SBRM 01 19.9 16.3 18.1
31. KW 626 RANTO JAYA 1 0.2 1.3 0.7
32. KW 629 KALIDADI 1 0 2.4 1.2
33. KW 630 GNRG 02 13.6 30.4 22.0
34. KW 631 KEMBU 01 (TSH 858xSul01) 15.8 12.5 14.1
35. KW 635 KEMBU 05 (TSH 858x Sul 01) 0.2 7.6 3.9
36. KW 636 KEMBU 06 9.2 8.8 9.0
37. KW 637 KATE/I/2/16 (TSH 858xKW 162) 12.7 23.8 18.2
38. KW 638 KATE/II/2/3 (TSH 858xKW 162) 0 0.8 0.4
39. KW 641 KATE/II/13/11 (KW163xKEE2) 5.3 8.1 6.7
40. KW 642 KATE/II/3/7 (TSH858xNIC7) 7.2 15.7 11.5
41. KW 649 KATE/III/2/15 (TSH858xKW162) 19.6 24.0 21.8
42. KW 651 KATE/I/4/10 (TSH858xICS13) 3.0 12.6 7.8
43. KW 684 RU III - CCN .51 1.4 3.5 2.4
44. KW 685 YPSI (MUCHTAR 1) 24.3 27.8 26.0
Page 299
ISBN 978-967-10840-3-8
Trans. Malaysian Soc. Plant Physiol. 22
First Published, 2014
293
Table 4. Yield component of the clones tested in Kaliwining Experimental Station (2013).
No KW serries Clone Dry weight
bean (g)
Shell content
(%)
No of bean
per pod
Pod
Index
1. KW 176 NIC 7 - -
2. KW 162 Sulawesi 01 1.06 8.88 37.6 25.0
3. KW 255 JTC 25 - -
4. KW 433 RU I - SCA 11 1.12 9.78 47.0
5. KW 443 RU I - SPA 9 1.12 9.78 35.8 24.9
6. KW 444 RU I - BORNE 7 A2 0.90 6.07 33.6 33.0
7. KW 454 RU I - KER 3 0.65 8.65 34.5 44.9
8. KW 467 RU I -BORNE 7 A6 0.66 15.49
9. KW 468 RU I - EQ X 3360-3 - -
10. KW 490 DRC 15 1.05 9.61
11. KW 514 ICCRI 07 0.83 10.09 43.1 27.9
12. KW 516 PABA/VIII/78B/2 1.04 11.37 43.0 22.4
13. KW 535 ADO 1 1.42 7.78 41.6 17.0
14. KW 562 PABA/I/90C/2 1.00 9.86 46.5 21.4
15. KW 563 PABA/I/90C/4 - -
16. KW 564 PABA/IX/90O/2 - -
17. KW 566 PABA/V/81L/1 0.56 14.66
18. KW 567 PABA/IX/90O/3 1.06 7.81 39.6 23.7
19. KW 570 Sulawesi 03 0.75 3.95 46.5 28.6
20. KW 606 BLITAR 01 0.67 12.74 37.7 39.5
21. KW 608 ADO/IV/90B/53/38 - -
22. KW 609 ADO/IV/90B/149/13 - -
23. KW 614 ADO/IV/91EU/11/33 _ - 39.6
24. KW 615 ADO/IV/91FU/51/32 1.61 6.15
25. KW 616 ADO/IV/91FU/149/96 - -
26. KW 617 KWN/II/2/9 (TSH858xKW162) 0.97 14.06 43.5 23.6
27. KW 618 KWN/III/10/1 (KW162xTSH858) 1.01 12.35
28. KW 619 KPSA/II/7/16 (KEE2xNIC7) - -
29. KW 621 KPSA /III/15/8 (Prop.ICS 60) - -
30. KW 623 SBRM 01 0.69 14.12 33.0 43.8
31. KW 626 RANTO JAYA 1 _ -
32. KW 629 KALIDADI 1 - -
33. KW 630 GNRG 02 0.82 8.36 41.3 29.7
34. KW 631 KEMBU 01 (TSH 858xSul01) 1.29 7.81
35. KW 635 KEMBU 05 (TSH 858x Sul 01) - -
36. KW 636 KEMBU 06 1.21 7.91 42.0 19.6
37. KW 637 KATE/I/2/16 (TSH 858xKW 162) 0.77 14.13 28.0 46.4
38. KW 638 KATE/II/2/3 (TSH 858xKW 162) - -
39. KW 641 KATE/II/13/11 (KW163xKEE2) - -
40. KW 642 KATE/II/3/7 (TSH858xNIC7) 1.62 8.32 39.3 15.7
41. KW 649 KATE/III/2/15 (TSH858xKW162) 1.03 5.70 42.0 23.2
42. KW 651 KATE/I/4/10 (TSH858xICS13) 0.78 8.68
43. KW 684 RU III - CCN .51 - -
44. KW 685 YPSI (MUCHTAR 1) 0.74 17.72 40.0 33.8
Evaluation on the resistance to pod rot (P. palmivora) of the promising clone of KW 617 indicated the
potency on pod rot resistance. Lesion of KW 617 due to P. palmivora infection was smaller than the
susceptible clone of TSH 858 and not quite different from the resistant clones of Sca 6, ICCRI 03 and
ICCRI 04 (Figure 2). This result confirmed the potency of polygenic resistance in KW 617 to VSD and
pod rot.
Page 300
ISBN 978-967-10840-3-8
Trans. Malaysian Soc. Plant Physiol. 22
First Published, 2014
294
0
50
100
150
200
250
1st day 2nd day 3th day 4th day 5th day 6th day 7th day
Les
sio
n s
ize
(m
m2)
Day after inoculation
KW 617 TSH 858 (Susceptible) Sca 6 (Resistant)
ICCRI 03 (Resistant) ICCRI 04 (Resistant)
Figure 2. Comparison of lesion size at 1st to 7
th day after inoculation of P. palmivora in the selected
VSD-resistant clone of KW 617 and other susceptible and resistant clones.
Conclusions
The tested clones had varied VSD resistance in the range of resistant, moderate resistant, moderate
susceptible, susceptible, and very susceptible. The resistant group included clones of Sulawesi 01, ICCRI
07, KW 562, Sulawesi 3, KW 606 and KW 617. Among the selected VSD-resistant clones, ICCRI 07 and
Sulawesi 03 showed potency on polygenic resistance and were released with cocoa pod borer resistance
while KW 617 exhibited smaller pod rot lesion after inoculation by P. palmivora. KW 617 was promising
VSD resistant clone having yield potency equavalent to Sulawesi 01 as the control for high yielding VSD
resistant clone.
References
Dos-Santos, R.C., Pires, J.L., Lopes, U.V., Gramacho, K.P.G., Flores, A.B., Bahia, R.S., Cristine-Ramos,
H.C., Xorrêa, R.X. and Ahnert, D. 2005. Assesment of genetic diversity on a sample of cocoa
accession resistant to witches’ broom disease based on RAPD and pedigree data. Bragantia,
Campinas 64(3): 361-368.
Febriantomo, A. 2012. Pengalaman pengendalian penyakit VSD (vascular-streak dieback) di Kebun
Kendenglembu. In: Wahyudi, T., Baon, J.B., Abdoellah, S., Misnawi, Susilo, A.W. (Eds.).
Prosiding Simposium Kakao 2012, Padang, 5-8 November 2012. P. 148-159.
Iswanto, A., Suhendy, D. and Susilo, A.W. 2001. Hasil seleksi dan persilangan genotipe penghasil biji
kakao lindak dan mulia. Warta Pusat Penelitian Kopi dan Kakao 17: 46-60.
Napitupulu, L.A., Iswanto, A., Winarno, H. and Soedarsono. 1991. Penampilan beberapa bahan tanaman
kakao seleksi Pusat Penelitian Perkebunan Medan dan Jember. Konp. Nas. Kakao III, Medan. P.
125-140.
Prawoto, A.A., Santoso, T.I., Marifah, Hartanto, L. and Sutikno. 2013. Terpene profile, leaf anatomy, and
enzyme activity of resistant and susceptible cocoa clones to vascular-streak dieback disease.
Pelita Perkebunan 29(3): 197-209.
Page 301
ISBN 978-967-10840-3-8
Trans. Malaysian Soc. Plant Physiol. 22
First Published, 2014
295
Susilo, A.W., Mawardi, S. and Sudarsianto. 2009. Keragaan dayahasil klon kakao (Theobroma cacao L.),
Sca 6 dan DRC 15, tahan penyakit pembuluh kayu. Pelita Perkebunan tahun 2011 25(2): 76-85.
Susilo, A.W. and Anita-Sari, I. 2011. Respons ketahanan beberapa hibrida kakao (Theobroma cacao L.)
terhadap serangan penyakit pembuluh kayu (vascular-streak dieback). Pelita Perkebunan 27(2):
77-87.
Susilo, A.W., Anita-Sari, I., Sobadi, Suwitra, I.K. and Nurlia. 2012. Stabilitas dayahasil klon-klon
harapan kakao (Theobroma cacao L.) tahan hama penggerek buah kakao (Conopomorpha
cramerella Snell.). Pelita Perkebunan 28(3): 123-135.
Susilo, A.W., Anita-Sari, I. and Mawardi, S. 2013. Seratus tahun pemuliaan kakao di Indonesia. In:
Wahyudi, T., Baon, J.B., Abdoellah, S., Misnawi, Susilo, A.W. (Eds.). Prosiding Simposium
Kakao 2012, Padang, 5-8 November 2012. P. 110-121.
Susilo, A.W. and Anita-Sari, I. 2014. Evaluasi ketahanan beberapa klon kakao (Theobroma cacao L.)
terhadap Phytophthora palmivora. Pelita Perkebunan 30(1): 1-14.
Susilo, A.W. and Anita-Sari, I. 2014. Hubungan antara karakteristik pertunasan dengan ketahanan kakao
(Theobroma cacao L.) terhadap penyakit vascular-streak dieback. Unplished.
Sri-Sukamto, Susilo, A.W., Abdoellah, S., Santoso, T.I. and Yuliasmara, F. 2008. Perkembangan teknik
pengendalian penyakit pembuluh kayu (VSD) pada tanaman kakao. In: Wahyudi, T., Abdoellah,
S., Prawoto, A.A., Baon, J.B., Mawardi, S. and Sri-Mulato (Eds.). Prosiding Simposium Kakao
2008, Denpasar, 28-30 Oktober 2008. P. 152-173.
Pang, T.Y. and Lockwood, G. 2008. A re-interpretation of hybrid vigour in cocoa. Expl. Agric. 44: 329-
338.
Page 302
ISBN 978-967-10840-3-8
Trans. Malaysian Soc. Plant Physiol. 22
First Published, 2014
296
Bioactive Compounds Profiling and Their Antioxidant Properties in the
Leaves of Curcuma alismatifolia (Zingiberaceae)
Taheri, S.*, Abdullah, T.L.
and Karimi, E.
Departments of Crop Science, Faculty of Agriculture, Universiti Putra Malaysia, 43400 UPM Serdang,
Selangor, Malaysia.
*E-mail: [email protected]
Introduction
Bioactive compounds often accumulate in the plant in small quantities and sometimes in specific cells
(Finley, 2005). Among them some are known as phenolic, flavonoids, and essential oils, which possess a
wide range of biological activities such as antioxidant, anti-inflammatory, anti-aging, anti-bacterial, anti-
tumor, and other functions (Karimi et al., 2013).
Antioxidants are compounds known to slow or delay lipid oxidation. Suppressive antioxidants can
separate free radicals or single oxygen before any significant oxidant occurrence. However, chain-
breaking antioxidants delay or slow the oxidative processes after they start up (Argolo et al., 2004). The
genus Curcuma from Zingiberaceae family originated from the Indo-Malayan Region (Purseglove, 1968)
with a wide-spread distribution in the tropics of Asia to Africa and Australia. Curcuma alismatifolia is a
monocotyledonous perennial, originating from tropical and subtropical areas of Northern Thailand and
Cambodia (Apavatjrut et al., 1999). One of the most challenging pursuits in the realm of pharmaceutical
and medical sciences is to investigate the latest and more potent drugs with fewer toxic effects and
completely reversible. Much of these features can easily be found from the natural compounds of plants
(Lewis, 2001). This research was carried out to analyze the bioactive compounds, such as the phenolic,
flavonoid and antioxidant activities using the high performance liquid chromatography (HPLC) in the
leaves of C. alismatifolia var. sweet pink.
Materials and Methods
Plant material
The plant materials used in this study were the leaves of C. alismatifolia var. sweet pink which their
rhizomes were provided from a Curcuma nursery (Ubonrat) in Doisaket District, Chiang Mai 50220,
Thailand.
Plant extraction
Samples were extracted using methanol solvent and the extraction techniques used were reflux method
(Crozier et al., 1997) with slight modifications.
Determination of total phenolic compound
Total phenolic content of the extract was determined colorimetrically, using the Folin-Ciocalteu method
as illustrated by Ismail et al. (2010). The extract was measured using a visible spectrophotometer
(Novaspec II Visible Spectrophotometer, Pharmacia Biotech, Cambridge, UK) at absorbance at 765 nm
and the result expressed as milligrams of gallic acid equivalents (GAE) per gram of dry weight (DW).
Page 303
ISBN 978-967-10840-3-8
Trans. Malaysian Soc. Plant Physiol. 22
First Published, 2014
297
Determination of total flavonoid compound
Total flavonoid content (TFC) was determined using the method of Ismail et al. (2010) with standard
favonoid rutin. The extract was measured using absorbance at 510 nm and the result was expressed as
milligrams of rutin equivalents per gram of dry matter.
Evaluation of phenolic and flavonoid compounds
The phenolic and flavonoid compounds of samples were quantitatively measured by the reversed-phase
HPLC technique based on Crozier et al. (1997). The standards for phenolic compounds were ellagic acid,
salicylic acid, gallic acid, catechin, epicatechin, caffeic acid, cinnamic acid and resorcinol. The standard
for flavonoid compounds were naringin, apigenin, rutin, quercetin, and myricetin.
Antioxidant activity
1,1-Diphenyl-2-picryl-hydrazyl (DPPH) free radical scavenging activity
The DPPH of the extracts were determined by the method of Gulcin et al. (2004). Butylated
hydroxytoluene BHT, α-tocopherol and vitamin C were utilized as the standard antioxidants.
Ferric reducing antioxidant power (FRAP)
The FRAP property of the extracts was determined using the method as described by Yen and Chen
(1995). BHT, α-tocopherol and vitamin C were utilized as the standard antioxidants.
2,2-azino-bis-3-ethylbenzothiazoline-6-sulfonic acid ABTS radical cation-scavenging
The ABTS was evaluated by the method of Giao et al. (2007). ABTS radical cation (ABTS*+) was
produced by reacting ABTS stock solution with 2.45 mM K2S2O8 and allowing the mixture to stand at
room temperature (dark place) overnight before utilization.
Results and Discussion
Curcuma species plants have received much attention, since they produce many beneficial compounds
that are useful in the food industry as herbs, flavoring and in the medical industries, as antioxidants and
antimicrobial agents. The obtained results showed that the total phenolic value was 2.08±0.02 mg GAE/g
DW, and total flavonoid was 1.61±0.17 mg rutin equivalent/g DW. Meanwhile, the HPLC results
indicated the presence of phenolic compounds in the leaves of C. alismatifolia var. sweet pink which were
salicylic acid (406.2 μg/g), caffeic acid (125.2 μg/g), catechin (212.9 μg/g), epicatechin (856.2 μg/g),
cinnamic acid (10215.4 μg/g), ellagic acid (182.6 μg/g), resorcinol (195.9 μg/g). In addition, flavonoids
were rutin (1032.7 μg/g), naringenin (271.5 μg/g), quercetin (964.1 μg/g), and myricetin (166.1 μg/g)
respectively. The HPLC chromatogram in Figure 1 shows the phenolic compounds in the leaves of C.
alismatifolia var. Sweet Pink. Furthermore, the antioxidant properties of the methanolic extract at a
concentration of 300 μg/ml in all the assays were 53.5%, 51.7% and 54.1%, respectively, but the activities
were lower than those of antioxidant standards, such as vitamin C and E. The IC50 value of the leaf
extracts is presented in Table 1.
Page 304
ISBN 978-967-10840-3-8
Trans. Malaysian Soc. Plant Physiol. 22
First Published, 2014
298
Figure 1. The HPLC chromatogram of phenolic compounds in the leaves of C. alismatifolia var. sweet
pink.
Table 1. The IC50 values of extracts and standards in DPPH, FRAP and ABTS scavenging activities
(Mean ± SEM; n = 3).
IC50 (µg/mL)
Samples Free radical Scavenging Activity Total Antioxidant Activity ABTS Scavenging Activity
Control 260.7 ± 1.29 278.1 ± 1.42 288.1 ± 1.35 a
Vitamin C 58.1 ± 1.47 90.9 ± 2.11 -
Vitamin E 60.3 ± 3.04 61.88 ± 1.86 -
BHT 89.7 ± 2.43 89.7 ± 1.37 -
Trolox - - 174.47 ± 012 e
Conclusions
Phytochemical compounds like phenolic acids and flavonoids are believed to be responsible for the wide
spectrum of pharmacological activities attributed to the herb. It could be concluded that the leaves of C.
alismatifolia var. sweet pink contain variable patterns of phenolic and flavonoid compounds which might
play a major role as antioxidants
References
Apavatjrut, P., Anuntalabhochai, S., Sirirugsa, P. and Alisi. C. 1999. Molecular markers in the
identification of some early flowering Curcuma L. (Zingiberaceae) species. Annals of Botany
(London) 84: 529-534.
Argolo, A.C.C., Sant-Ana, A.E.G., Pletsch, M. and Coelho, L.C.B.B. 2004. Antioxidant activity of leaf
extracts from Bauhinia monandra. Bioresource Technology 95: 229-233.
Crozier, A., Jensen, E., Lean, M.E.J. and McDonald, M.S. 1997. Quantitative analysis of flavonoids by
reversed-phase high-performance liquid chromatography. Journal of Chromatography 761: 315-
321.
Finley, J.W. 2005. Bioactive compounds and designer plant foods: The need for clear guidelines to
evaluate potential benefits to human health. Chronica horticulturae 45: 6-11.
Giao, M.S., Gonzalez-Sanjose, M.L., Rivero-Perez, M.D., Pereira, C.I., Pintado, M.E. and Malcata, F.X.
2007. Infusions of Portuguese medicinal plants: Dependence of final antioxidant capacity and
phenolic content on extraction features. Journal of Science and Food Agriculture 87: 2638-2647.
Page 305
ISBN 978-967-10840-3-8
Trans. Malaysian Soc. Plant Physiol. 22
First Published, 2014
299
Gulcin, I., Gungor Sat, I., Beydemir, S., Elmastas, M. and IrfanKufrevioglu, O. 2004. Comparison of
antioxidant activity of clove (Eugenia caryophylata Thunb) buds and lavender (Lavandula
stoechas L.). Food Chemistry 87: 393-400.
Ismail, H.I., Chan, K.W., Mariod, A.A. and Ismail, M. 2010. Phenolic content and antioxidant activity of
cantaloupe (cucumismelo) methanolic extracts. Food Chemistry 119: 643-647.
Karimi, E., Jaafar, H.Z.E. and Ahmad, S. 2013. Antifungal, anti-inflammatory and cytotoxicity activities
of three varieties of Labisia pumila Benth: From microwave obtained extracts. BMC
Complementary and Alternative Medicine 13: 1-10.
Lewis, M.E. 2001. Should we be concerned about herbal remedies. Journal of Ethnopharmacology 75:
141-164.
Purseglove, J.W. 1968. Tropical Crops: Dicotyledons 1, Dicotyledons 2; Longmans: London, UK, 1968.
Yen, G.C. and Chen, H.Y. 1995. Antioxidant activity of various tea extracts in relation to their
antimutagenicity. Journal of Agriculture and Food Chemistry 43: 27-32.
Page 306
ISBN 978-967-10840-3-8
Trans. Malaysian Soc. Plant Physiol. 22
First Published, 2014
300
Comparison of Column Performance between Monolithic and Particulate
Packing for the Separation of Photosynthetic Pigments
Indriatmoko, Shioi, Y., Brotosudarmo, T.H.P. and Limantara, L.*
Ma Chung Research Center for Photosynthetic Pigments, Universitas Ma Chung, Malang 65151, East
Java, Indonesia.
*E-mail: [email protected]
Introduction
Pleomele angustifolia N. E. Brown was one of the Indonesian local species which has been used as
natural colorants. This species provides strong green coloration for food without unhealthy side effects.
Accordingly, P. angustifolia is considered as one of the potential natural sources for colorants and
functional foods. High-performance liquid chromatography (HPLC) method has been employed for
analyzing photosynthetic pigments. Ultra-fast liquid chromatography (UFPLC) was one of the newest
generations of HPLC which has special advantages in conducting researches with low time consuming
and high resolution. It is generally known that in HPLC/UFPLC, separation quality is affected by four
main parameters, i.e. mobile phase, flow rate, column temperature and column type. Among them,
column had been understood as an important part where pigment separation occurred during analysis.
Other separation parameters are depending on the column type used. HPLC/UFPLC columns are
distinguished as monolithic and particulate packed type (Unger et al., 2008). Monolithic column is
consisting of small-sized skeletons and wide through-pores which can achieve higher separation
efficiency than the case with particulate packed columns at a similar pressure drop (Nunez et al., 2008).
Thus, this column type has advantages in providing good separation and short time analysis. On the other
hand, particulate packed column is also widely used for pigment separation. Two most well-used
particulate packed columns are octyl (C8) and octadecyl (C18) types based on silica and they are much
used compared to monolithic column in separating photosynthetic pigments (Wright et al., 1991; Jeffrey
et al., 1997; Zapata et al., 2000; Garrido et al., 2003). In this report, we compare the column performance
between monolithic and particulate packing columns for the separation of photosynthetic pigments
extracted from leaves of P. angustifolia using a simple isocratic system. Our findings provide important
basic information and can help to develop low-cost and simple HPLC technique for separation of plant
pigments.
Materials and Methods
Plant materials and pigments extraction
Leaves of P. angustifolia were collected from MRCPP Arboretum and used throughout this study.
Sample leaf was ground using a mortar with small amount of sodium ascorbate and CaCO3 to avoid
pigment oxidation and acidification. Liquid nitrogen was added to prevent enzymatic reaction which acts
on the pigment deterioration. The homogenate (0.2 g wet weight) was extracted with 3 ml of 100%
methanol (GR for analysis, MERCK, Darmstadt, Germany). In order to minimize photo-degradation and
oxidation of the pigments, the extractions and measurements were carried out under green dimmed light
and nitrogen (99%) atmosphere at room temperature. This extraction method was conducted in less than 1
min.
Page 307
ISBN 978-967-10840-3-8
Trans. Malaysian Soc. Plant Physiol. 22
First Published, 2014
301
UFPLC analysis
UFPLC analysis was performed using LC-20AD XR (Shimadzu, Kyoto, Japan) equipped with
photodiode array detector SPD-20MA and column oven CTO-20AC. Pigments separation was carried out
using a simple isocratic mobile phase consisted of acetonitrile (ACN) (HPLC Grade, MERCK) and
methanol (MeOH) at a fixed flow rate of 0.5 ml per min. These ACN:MeOH (v/v) compositions were
varied for analysis: 20:80 (Sys. 1), 35:65 (Sys. 2), 50:50 (Sys. 3), 65:35 (Sys. 4), and 80:20 (Sys. 5) at
temperatures of 30 and 40 °C. Three different types of column were used: i.e. Chromolith (Performance
RP-18e, 4.6 mm i.d. x 100 mm, MERCK), Shim-Pack XR-ODS (3 mm i.d. x 100 mm, Shimadzu) and
Shim-Pack XR-C8 (3 mm i.d. x 100 mm, Shimadzu). Pigments were detected in the range of absorbance
at 190-800 nm. Prior to injection, sample pigment was filtrated through a membrane filter (0.2 µm,
Nylon, Whatman, Maidstone, UK). Pigment solution, 20 µL, was injected for analyses through an auto-
sampler SIL-20AC XR (Shimadzu).
Pigment identification and data analysis
All targeted peaks were isolated for identification. Visible absorption spectra were obtained by UV-
Visible Spectrophotometer 1800 (Shimadzu) in the absorbance range of 350-800 nm. Isolated pigments
were checked by diluted different solvents. Chlorophyll (chls) groups were measured in acetone, diethyl
ether and ethanol, while carotenoid groups in acetone, n-hexane and ethanol. Spectral maximum
absorbance was then compared with those of references and standard spectra from plant pigments (Gross,
1991; Britton et al., 1995; Jeffrey et al., 1997; Hegazi et al., 1998). UFPLC data were revealed from
original Shimadzu UFPLC operation software, Lab Solution. Plot data and polynomial regression were
created by Origin 7.0 (Origin Lab Corp, Northampton, USA). Both numeric and graphic data were
representing an average from triplicate.
Results and Discussion
Methanol extract of P. angustifolia was analyzed using UFPLC in the indicated conditions as mentioned
in the text. Six dominant pigment species were separated from all samples using different columns
(Figure 1). These pigments were then isolated and subjected to UV-Vis spectroscopy for identification.
Pigments were identified as followed: violaxanthin (1st peak), zeaxanthin (2
nd peak), chl b (3
rd peak), chl a
(4th peak), α-carotene (5
th peak) and β-carotene (6
th peak) (data not shown). These pigments are found in
most of the higher plants as similar to the previous reports (Gross, 1991; Ottander et al., 1995; Schoefs,
2004; Timperio et al., 2007).
Performance of three columns was compared with different column temperatures at 30 and 40 °C under
fixed conditions (isocratic, Sys. 3 mobile phase, 0.5 mL/min) (data not shown). Generally, retention times
of pigment separation varied depending on the mobile phase compositions used in any column types. In
C18 columns, particulate packed column needed longer time analysis than monolithic column. In terms of
column temperature, higher temperature (40 °C) shortened analysis times in any column types used. XR-
ODS column was superior to other two columns for the separation of non-polar pigments, although it
needed longer time of separation and gave lower resolution. XR-C8 column had advantage for fast
separation of polar pigments, but it was inferior for separation of non-polar pigments.
Subsequently, several chromatogram parameters were analyzed in order to understand the actions of
solvent composition in details. Retention time difference (ΔtR) and peak retention time ratio (tR ratio) were
important factors which can be applied to analyze separation characteristics of non-polar and polar
pigments. Separation of non-polar pigments using a simple isocratic mobile phase based on acetonitrile
Page 308
ISBN 978-967-10840-3-8
Trans. Malaysian Soc. Plant Physiol. 22
First Published, 2014
302
and methanol (Sys. 3, 50:50) was not perfectly sufficient for any columns used and can only be done by
changing solvent ratio under the conditions used (0.5 ml/min and 40 °C). We selected retention time of
chl a, violaxanthin (viol), and β-carotene (β-car), as peak position indicators in calculating ΔtR and tR ratio
and also to see time difference between polar (viol) and semi-polar (chl a) pigments and between semi-
polar (chl a) and non-polar (β -car) pigments. Data of ΔtR calculated from the results of Chromolith and
XR-ODS columns indicated that time of separation for polar pigment increased when acetonitrile
concentration increased, but decreased for that of non-polar pigment (Figure 2).
Another parameter, tR ratio, tR chl_a/viol and tR b-car/chl_a ratios were used as peak indicators. Solvent
composition (ACN: MeOH) and column temperature gave the different results of separations. Column
temperatures (30 and 40 °C) had little effect on the separation for non-polar pigments (data not shown).
These findings were also supported by their polynomial regressions (data not shown). Moreover, tR b-
car/chl_a polynomial regression (R2=0.99) was obtained at both temperatures in any columns used. These
three columns were again proved to be superior in separating polar pigments. The results of tR chl_a/viol
gave slight differences in all conducted analyses (data not shown). It is likely that column temperature at
40 °C and high concentration of methanol decreased time analysis.
0
50
100
0
50
100
150
0
100
200
Retention Time (Min)
Inte
nsi
ty (
mA
U)
1
2
3
4
5 6
1
2
3
5 6
1
2
3
4
5 6
1
2
3
4
5 6
4
A. Chromolith, 30 °C
B. Chromolith, 40 °C
C. XR-ODS, 30 °C
D. XR-ODS, 40 °C
0 10 20 30 40
0
100
200
E. XR-C8, 30 °C
F. XR-C8, 40 °C
0
200
400
Retention Time (Min)
Inte
nsi
ty (
mA
U)
1
2
3
4
5 6
1
2
3
4
5 6
A
1
13
4
5 6
2
0 2.5 5 7.5 10
0
200
400
Figure 1. UFPLC chromatograms of photosynthetic pigments from leaves of P. angustifolia. UFPLC was
carried out on an isocratic mode with ACN:MeOH (50:50, v/v) (Sys. 3) as a mobile phase at a
flow rate of 0.5 ml per min. Other conditions are described in the text.
Page 309
ISBN 978-967-10840-3-8
Trans. Malaysian Soc. Plant Physiol. 22
First Published, 2014
303
5
10
15
20
5
10
15
20
1.5
3.0
4.5
20:80 35:65 50:50 65:35 80:20
5
10
15
20
20:80 35:65 50:50 65:35 80:20
5
10
15
20
20:80 35:65 50:50 65:35 80:20
1.5
3.0
4.5
B. XR-ODS, 30 CA. Chromolith, 30 C
C. XR-C8, 30 C
D. Chromolith, 40 C
E. XR-ODS, 40 C
Solvents Composition (ACN:MeOH, V:V)
F. XR-C8, 40 C
t R (
min
)
Figure 2. ΔtR chl_a-viol (solid circle) and ΔtR b-car-chl_a (open circle) were calculated from the results of
UFPLC separation of photosynthetic pigments extracted from leaves of P. angustifolia. Other
conditions are the same as in Figure 1. Data were average of three experiments. SE is less than
±0.5.
To obtain further information to optimize separation, retention time (tR), separation factor (α) and
resolution (Rs) were calculated to chl a as a representative pigment using three columns and different
solvent systems (Sys. 1 to 5), then the data were analyzed. Separation time was strongly influenced by
both high concentration of acetonitrile in methanol mixture and column temperature. The most rapid
pigment separation was performed by the use of XR-C8 column (cf. Figure 1). Total analysis was
completed within less than 5 min under any solvent systems (Sys. 1 to 5). Highest separation factor was
achieved by XR-C8 in Sys. 2 (α 1.3) and Sys 4 (α 1.3) at 30 °C, while the highest resolution was achieved
in Sys. 4 at 30 °C (Rs 3.5). High column temperature influenced separation time and only needed 2.8 min
in Sys 1. XR-ODS gave the slowest pigment separation, e.g. 6.6 min in Sys 1 at 40 °C to 16.3 min in Sys.
5 at 30 °C. However, highest separation factor was obtained in Sys 3 (α 1.3) at 30 °C as well as highest
resolution (Rs 5.3). Chromolith column was likely the most effective column to separate chl a among
three columns used. At high column temperature (40 °C), it needed minimum 7 min in Sys. 1. High
separation factor and resolution were found in Sys. 4 at 30 °C (α 1.7, Rs 5.9).
Conclusions
In this report, we compared the column performance between monolithic and particulate packing columns
for the separation of photosynthetic pigments extracted from leaves of P. angustifolia using simple
isocratic system. Although each column showed their own features, monolithic column Chromolith
provided better resolution and faster analysis among three columns used. These findings can help to
optimize pigment separation in rapid time analysis by using simple, safe and low cost mobile phase
system.
Acknowledgements
This project was supported by National Innovation System Research Grant (RT-2015-0270, No:
147/M/Kp/IV/2015) and National Research Center of Excellence (Pusat Unggulan Iptek) Program (SK
Page 310
ISBN 978-967-10840-3-8
Trans. Malaysian Soc. Plant Physiol. 22
First Published, 2014
304
No. 284/M/Kp/XI/2013) provided by Indonesian Ministry of Research, Technology and Higher
Education.
References
Britton, G., Liaaen-Jensen, S. and Pfander, H. 1995. Carotenoids. Volume 1A: Isolation and Analysis.
Brikhäuser Verlag, Basel, Switzerland.
Garrido, J.L., Rodriguez, F., Campana, E. and Zapata, M. 2003. Rapid separation of chlorophylls a and b
and their demetallated and dephytylated derivatives using a monolithic silica C18 column and a
pyridine-containing mobile phase. Journal of chromatography A 994: 85-92.
Gross, J. 1991. Pigments in Vegetables: Chlorophylls and Carotenoids. Van Nostrand Reinhold.
Hegazi, M.M., Ruzafa, A.P., Almela, L. and Candela, M.E 1998. Separation and identification of
chlorophylls and carotenoids from Caulerpa prolifera, Jania rubens and Padina pavonica by
reversed-phase high-performance liquid chromatography. Journal of Chromatography A 829:
153-159.
Jeffrey, S.W., Mantoura, R.F.C. and Wright, S.W. 1997. Phytoplankton Pigments in Oceanography:
Guidelines to Modern Methods. UNESCO Publishing. 661p.
Ottander, C., Campbell, D. and Oquist, G. 1995. Seasonal changes in photosystem II organisation and
pigment composition in Pinus sylvestris. Planta 197: 176-183.
Nunez, O., Nakanishi, K. and Tanaka, N. 2008. Preparation of monolithic silica columns for high-
performance liquid chromatography. Journal of Chromatography A 1191: 231-252.
Schoefs, B. 2004. Determination of pigments in vegetables. Journal of Chromatography A 1054: 217-226.
Timperio, A.M., D'Amici, G.M., Barta, C., Loreto, F. and Zolla, L. 2007. Proteomics, pigment
composition and organization of thylakoid membranes in iron-deficient spinach leaves. Journal of
Experimental Botany 58: 3695-3710.
Unger, K.K., Skudas, R. and Schulte, M.M. 2008. Particle packed columns and monolithic columns in
high-performance liquid chromatography-comparison and critical appraisal. Journal of
Chromatography A 1184: 393-415.
Wright, S., Jeffrey, S.W., Mantoura, M., Llewellyn, C., Bjoernland, T., Repeta, D. and Welschmeyer, N.
1991. Improved HPLC method for the analysis of chlorophylls and carotenoids from marine
phytoplankton. Marine Ecology Progress Series 77: 183-196.
Zapata, M., Rodriguez, F. and Garrido, J.L. 2000. Separation of chlorophylls and carotenoids from marine
phytoplankton: a new HPLC method using a reversed phase C8 column and pyridine-containing
mobile phases. Marine Ecology Progress Series 195: 29-45.
Page 311
ISBN 978-967-10840-3-8
Trans. Malaysian Soc. Plant Physiol. 22
First Published, 2014
305
Chlorophyll Values of Local Green Vegetables Common in Malang, East Java
Dettling, M.1,2
, Indrawati, R.1, Indriatmoko
1, Adhiwibawa, M.A.S.
1, Brotosudarmo, T.H.P.
1 and
Limantara, L.1,*
1Ma Chung Research Center for Photosynthetic Pigments, Universitas Ma Chung, Villa Puncak Tidar N-
1, Malang, East Java, Indonesia. 2SRH Distance Education University Riedlingen, Lange Strasse 19, 88499 Riedlingen, Germany.
*E-mail: [email protected]
Introduction
Healthy human diet is generally associated with an adequate consumption of fresh colored vegetables as
source of micronutrient as well as dietary fiber (Jaiswal McEligot et al., 2006). Varieties of vegetable
types and quality are normally affected by their cultivation area, particularly related to soil and water
quality, as well as temperature and air cleanliness. Malang area is one of the highland areas in Indonesia
that has great potential in providing diverse vegetables. The city is surrounded by several active volcanoes
and hence providing appropriate soil and environmental condition for vegetable production. In fact,
Malang has become the center of urban vegetable production in East Java.
The presence of chlorophylls in the leafy vegetables is a simple and facile indicator of the quality. The
consumers usually assume bright green color for fresh and nutritious vegetable. As the major
photosynthetic pigments in leaves, chlorophyll is visually observable by human eyes. Two most dominant
pigments found in higher plants are chlorophyll a and b (Quach et al., 2004). These pigments are not only
offering us coloration in our daily diet, but also biological activities (Ferruzzi et al., 2002). Having
chemical structure which is close to hemoglobin, chlorophylls intake is presumed to play a distinct role in
the regeneration of blood cell (Mujoriya et al., 2012).
Several investigations have reported photosynthetic pigment composition which exist in several edible
leaves (Lai et al., 1980; de Vogel et al., 2005). However, quantity of chlorophyll a in numeric data keeps
showing their importance. There is some indication about correlation between leaves color visibility and
chlorophyll content, but there are only few reports aimed to prove this phenomenon (Yamamoto et al.,
2002; Gitelson and Merzlyak, 2003). Presently, photometric UV-Vis Spectroscopy is enhanced to non-
destructive application for conducting simple rapid analysis. Manual color indicators are also replaced by
L* (lightness), a* (redness/greenness), b* (yellowness/blueness) based on colorimeter, which is able to
reduce error due to human subjectivity (Leon et al., 2006). The development of these instruments offers
us a chance to conduct in vivo experiments. In this report, we provide comparison data between the
chlorophylls content of some Indonesian leafy vegetables and their color value using in vivo non-
destructive method.
Materials and Methods
Plant materials
Ten species of edible leafy vegetables (Table 1) were purchased from five different markets in Malang
area (East Java, Indonesia). All samples were collected early in the morning to get fresh condition of the
product. The samples were directly measured by in vivo procedure without any involved sample
destruction, and then stored at -20 °C deep freezer for further analysis. All samples were collected during
May until June 2014.
Page 312
ISBN 978-967-10840-3-8
Trans. Malaysian Soc. Plant Physiol. 22
First Published, 2014
306
Colorimetric assay
Colorimetric measurement was conducted using Colorflex EZ (Hunterlab, USA). L*, a*, and b*
parameters were used to quantify the leaves color. L* value represents color brightness (luminosity; 0:
black, 100: white), while a* (positive values: red, negative values: green) and b* (positive values: yellow,
negative values: blue) show color dimension.
Chlorophyll content assay
The chlorophyll content was determined by using the chlorophyll meter SPAD-502 (Konica Minolta,
Japan). Several experiments were accomplished in order to have representative data of each sample.
Three leaves per species were used, and then each leaf was spotted in five to fourteen different positions
for measurements. As for Kemangi, due to its smaller leaf size, seven leaves were used and two up to
three spots were measured per leaf.
Data analysis
All data in this report are provided as the average value of multiple experiments. Figures were created
from numeric data and plotted using Origin 7 Software (OriginLab).
Results and Discussion
Ten leafy vegetables as listed in Table 1 were analyzed using in-vivo method. Photometric chlorophyll
and color detection were applied in order to evaluate chlorophyll content in its correlation with color
appearance. SPAD data provides us representative chlorophyll concentration which is available on the
sample (Chang and Robison, 2003). Higher SPAD values signify higher chlorophyll content. The mostly
advanced rapid colorimeter assay is according to L*, a*, b* parameter developed by the Commission
Internationale de l'Eclairage (CIE) of France. L*, a*, b* dimension was built in order to standardize
color appearance and decrease subjectivity of human visualization. Lower L* value represents darker
appearance, while higher value represents brighter appearance. The chromatic value of a* and b* are the
two dimensional color parameter that will provide us color position of the measured samples.
Table 1. The ten species of leafy vegetables collected from five local markets in Malang, East Java,
Indonesia. Local Name Abbr. Common Name Scientific Name
Kailan Kai Chinese kale Brassica oleracea var. alboglabra Bailey
Chaisim or sawi hijau Cha Chinese flowering
cabbage
Brassica rapa L. var. parachinensis (L. H. Bailey)
Hanelt
Bayam Bay Spinach Amaranthus spinosus L.
Kangkung Kan Water spinach Ipomoea aquatica Forsk
Daun Singkong Sin Cassava leaf Manihot utilissima Pohl
Selada Sel Green leaf lettuce Lactuca sativa L.
Pakcoy Pch Chinese cabbage pak-
choi
Brassica rapa L. subsp. chinensis
Kemangi Kgi Basil Ocimum citriodorum Vis.
Siomak Sak Sworn-leaf lettuce Lactuca sativa L. var. augustana
Kubis Kbs Head cabbage Brassica oleracea L. var. capitata
Abbr. = abbreviation used in the text
Page 313
ISBN 978-967-10840-3-8
Trans. Malaysian Soc. Plant Physiol. 22
First Published, 2014
307
Figure 1 shows the results of in vivo analysis of green leafy vegetables by means of SPAD-502
Chlorophyll meter as well as the Colorflex. The SPAD, L*, and b* values were significantly varied
(p<0.01), while the difference of a* values did not show any statistical significance (p<0.05) among all
the vegetables. Pch was proved to be superior in providing chlorophyll on our daily diet (51.6±2.4
SPAD), while the chlorophyll content of most others species were comparable, i.e. Kai, Cha, Bay, Kan,
Sin, and Kgi. Three vegetables which provide less chlorophyll content were Kub, Sel, and Sak (Figure
1A). Further investigation was then carried out by employing colorimetric assays. Kbs exhibited
considerably higher L* value (Figure 1B) since its foliage has pale color. This characteristic revealed
inverse correlation between lightness value and chlorophyll concentration. The L* value of vegetables
rich in chlorophyll were maximum at about forties. On the other hand, according to chromatic values, the
parameter of a* includes green to red region, while b* value covers blue to yellow color, from negative to
positive denomination, respectively. The SPAD data of chlorophyll contents were found to be positively
correlating toward chromatic value. Kbs possessed lowest chlorophyll content as well as lowest green
coloration (Figure 2). Therefore, low chlorophyll vegetables, such as Kbs, Sel, and Sak, were easily
identified through their higher L* value as well as lower absolute a* value (Figure 1C). Higher b* value
indicates yellowish coloration, bearing low chlorophyll content (see b* value of Sel) (Figure 1D). Better
interpretation of color space was provided in Figure 2. Compared to L* value, there is no strong
correlation between chromatic value and SPAD value. The presence of other colorful plant pigments (e.g.
carotenoid, anthocyanin) is suggested to cause greater variety in chromatic value.
Figure 1. Distribution of chlorophyll content and color parameters of ten leafy vegetables. Abbreviations
were defined in Table 1.
Page 314
ISBN 978-967-10840-3-8
Trans. Malaysian Soc. Plant Physiol. 22
First Published, 2014
308
10
15
20
2530
-8
-6
-4
40
60
80
L*
b*
KanKgi
Sak
Bay
Sin
Kai
Cha
Sel
Pch
Kbs
a*
Figure 2. L*, a*, b* color space (left) and 3D Scattergram of colorimetric parameters (right) measured
from ten leafy vegetables. Abbreviations were defined in Table 1.
Leafy vegetables, as other higher plant leaves, consist of chlorophylls (green) and carotenoids (yellow to
red) to perform its photosynthetic function. Nevertheless, green coloration is generally exhibited in visual
appearance due to domination of chlorophylls as the primary photosynthetic pigment, assisted by
carotenoids as the accessory pigment (Sarijeva et al., 2007). The a* value could be considered as
chlorophyll color space while b* value characterizes the presence of carotenoid group. At the present
study, fresh samples were subjected to each measurement in order to provide the best natural condition of
the sample. Otherwise, domination of yellowness color space (high b* value) can be interpreted as
indication of chlorophyll degradation during senescent or decay process (Tijskens et al., 2001; Schelbert
et al., 2009). Overall, colorimetric assay has proven its advantage in providing information which can be
used as consideration of chlorophyll content in leafy vegetables. Development opportunity of new and
non-destructive method for rapid determination of vegetable quality is still widely opened.
Conclusions
The correlation between SPAD and L*, a*, b* values were acceptable to evaluate chlorophyll content
based on color appearance. Therefore, this information becomes important as the basic information of
proposing in vivo measurement method to determine vegetable quality as well as chlorophyll analysis
based on color values. Among ten different species of leafy vegetables which were obtained from local
market in Malang, high chlorophyll content was found in Pch>Kai>Sin>Cha>Kan>Bay>Kgi.
Acknowledgements
This project was supported by National Innovation System Research Grant (RT-2015-0270) and National
Center of Excellence (Pusat Unggulan Iptek) Program (SK No. 48/M/Kp/XII/2014) provided by
Indonesian Ministry of Research, Technology, and Higher Education.
References
Chang, S.X. and Robison, D.J. 2003. Nondestructive and rapid estimation of hardwood foliar nitrogen
status using the SPAD-502 chlorophyll meter. Forest Ecology and Management 181: 331-338.
de Vogel, J., Jonker-Termont, D.S., van Lieshout, E.M., Katan, M.B. and van der Meer, R. 2005. Green
vegetables, red meat and colon cancer: chlorophyll prevents the cytotoxic and hyperproliferative
effects of haem in rat colon. Carcinogenesis 26: 387-393.
Page 315
ISBN 978-967-10840-3-8
Trans. Malaysian Soc. Plant Physiol. 22
First Published, 2014
309
Ferruzzi, M., Bohm, V., Courtney, P. and Schwartz, S. 2002. Antioxidant and antimutagenic activity of
dietary chlorophyll derivatives determined by radical scavenging and bacterial reverse
mutagenesis assays. Journal of Food Science 67: 2589-2595.
Gitelson, A.A. and Merzlyak, M.N. 2003. Relationships between leaf chlorophyll content and spectral
reflectance and algorithms for non-destructive chlorophyll assessment in higher plant leaves.
Journal of Plant Physiology 160: 271-282.
Jaiswal McEligot, A., Largent, J., Ziogas, A., Peel, D. and Anton-Culver, H. 2006. Dietary fat, fiber,
vegetable, and micronutrients are associated with overall survival in postmenopausal women
diagnosed with breast cancer. Nutrition and Cancer 55: 132-140.
Lai, C.-N., Butler, M.A. and Matney, T.S. 1980. Antimutagenic activities of common vegetables and their
chlorophyll content. Mutation Research/Genetic Toxicology 77: 245-250.
Leon, K., Mery, D., Pedreschi, F. and Leon J. 2006. Color measurement in L, a, b units from RGB digital
images. Food Research International 39: 1084-1091.
Mujoriya, R., and Bodla, R. B. 2012. A study on wheat grass and its nutritional value. Food Science and
Quality Management 2: 1-8.
Quach, H.T., Steeper, R.L. and Griffin, G.W. 2004. An improved method for the extraction and thin-layer
chromatography of chlorophyll a and b from spinach. Journal of Chemical Education 81: 385.
Sarijeva, G., Knapp, M. and Lichtenthaler, H.K. 2007. Differences in photosynthetic activity, chlorophyll
and carotenoid levels, and in chlorophyll fluorescence parameters in green sun and shade leaves
of Ginkgo and Fagus. Journal of Plant Physiology 164: 950-955.
Schelbert, S., Aubry, S., Burla, B., Agne, B., Kessler, F., Krupinska, K. and Hortensteiner, S. 2009.
Pheophytin pheophorbide hydrolase (pheophytinase) is involved in chlorophyll breakdown during
leaf senescence in Arabidopsis. The Plant Cell Online 21: 767-785.
Tijskens, L., Barringer, S. and Biekman, E. 2001. Modelling the effect of pH on the colour degradation of
blanched broccoli. Innovative Food Science and Emerging Technologies 2: 315-322.
Yamamoto, A., Nakamura, T., Adu-Gyamfi, J. and Saigusa, M. 2002. Relationship between chlorophyll
content in leaves of sorghum and pigeonpea determined by extraction method and by chlorophyll
meter (SPAD-502). Journal of Plant Nutrition 25: 2295-2301.