Enhancing Sustainability at the District and State Levels Kent McIntosh, University of Oregon Bridget Drobac, Bethel School District Eric Kloos, Minnesota Dept. of Ed. 2014 PBIS Implementers Forum Handouts: http://pbis.org
Transcript
Enhancing Sustainability at the District and State Levels
Social Sciences and Humanities Council of Canada (SRG F09-05052)
Hampton Endowment Fund (J07-0038)
Participants in these studies State Networks
Jerry Bloom, Susan Barrett and PBIS Maryland Cristy Clouse, Barbara Kelley and CalTAC Eric Kloos and Minnesota DOE Mike Lombardo, Celeste Rossetto Dickey, and Placer COE Nanci Johnson and MO SW-PBS Justyn Poulos, Wisconsin PBIS Cayce McCamish, NC DOE
Co-authors
Thanks and Acknowledgments
1. Research on strategies to support implementation and sustainability of PBIS
Kent
2. Systems for sustainability at the district level Bridget, Bethel School District (OR)
3. Systems for sustainability at the state level Eric, Minnesota Department of Education
Perceived Importance of Contextual Features for Sustainability of PBISMcIntosh, K., Predy, L., Upreti, G., Hume, A. E. & Mathews, S. (2014). Perceptions of contextual features related to implementation and sustainability of School-wide Positive Behavior Support. Journal of Positive Behavior Interventions, 16, 29-41.
Sample: 257 schools from 14 US states 49% Elementary 16% Middle 5% High School Average implementation: 6 years (1 to 15)
Open-ended question:
“What is the most important enabler of sustainability of PBIS?”
Perceived Factors Related to Sustainability of PBIS
Admini
strato
r Sup
port
Staff B
uy-in
Fidelity
Data
Teaming
Resou
rces
Stakeh
older
Invo
lvemen
t
Trainin
g
SWPBS P
hilos
ophy
Moti
vatio
n
Distric
t Sup
port
0
10
20
30
40
50
60
70
Nu
mb
er o
f R
esp
onse
s
Enablers of Sustainability
How would you answer?
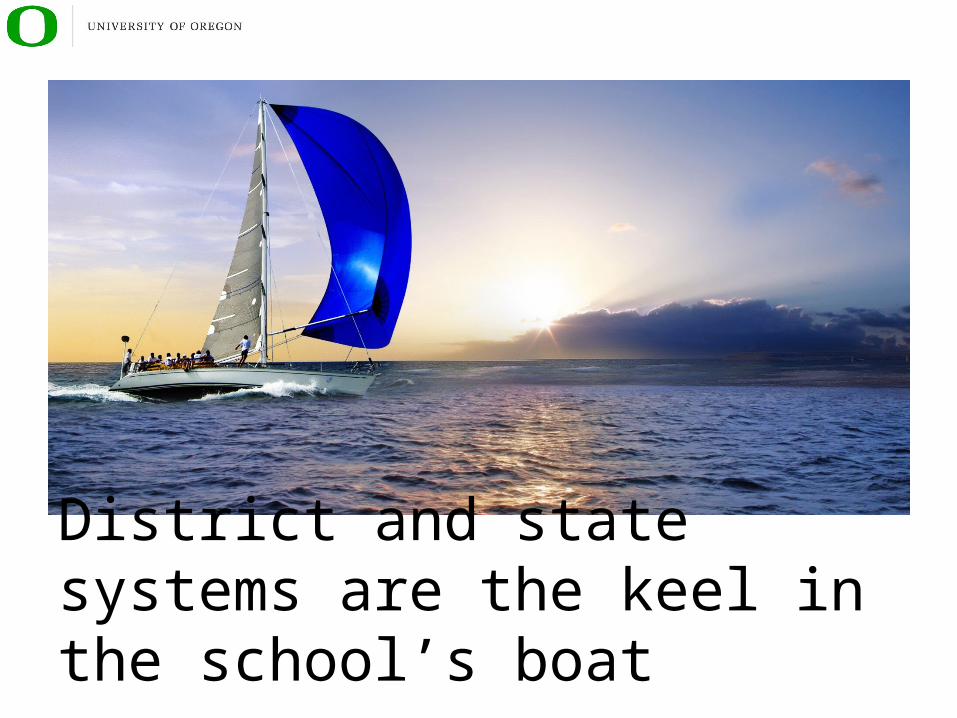
District and state systems are the keel in the school’s boat (McIntosh & Goodman, in press)
School Administrator Support
Can districts play a role in increasing school administrator support?
Most Important Single Perceived Factor in Sustainability?
School TeamMaintain the PBIS handbookDocument support among staff and stakeholdersCollect and share outcomes dataMeet with the new administrator
District TeamBuild PBIS into written policyBuild PBIS competencies into hiring criteriaDevelop district coaching capacity
Sustaining PBIS through Administrator Turnover(Strickland-Cohen, McIntosh, & Horner, 2014)
How Do Principals Go From Skeptics to PBIS Champions?
McIntosh, K., Kelm, J. L., & Canizal Delabra, A. (2014). In search of how principals change: Critical incidents in enhancing administrator support for school-wide prevention. Manuscript submitted for publication.
Qualitative interviews with 10 principals initially opposed or lukewarm to PBIS but now champions
Interview questions:1. What helped your active support for PBIS?
2. What hindered your active support for PBIS?
3. What would have made you support PBIS from the onset?
Research into Enhancing Principal Support
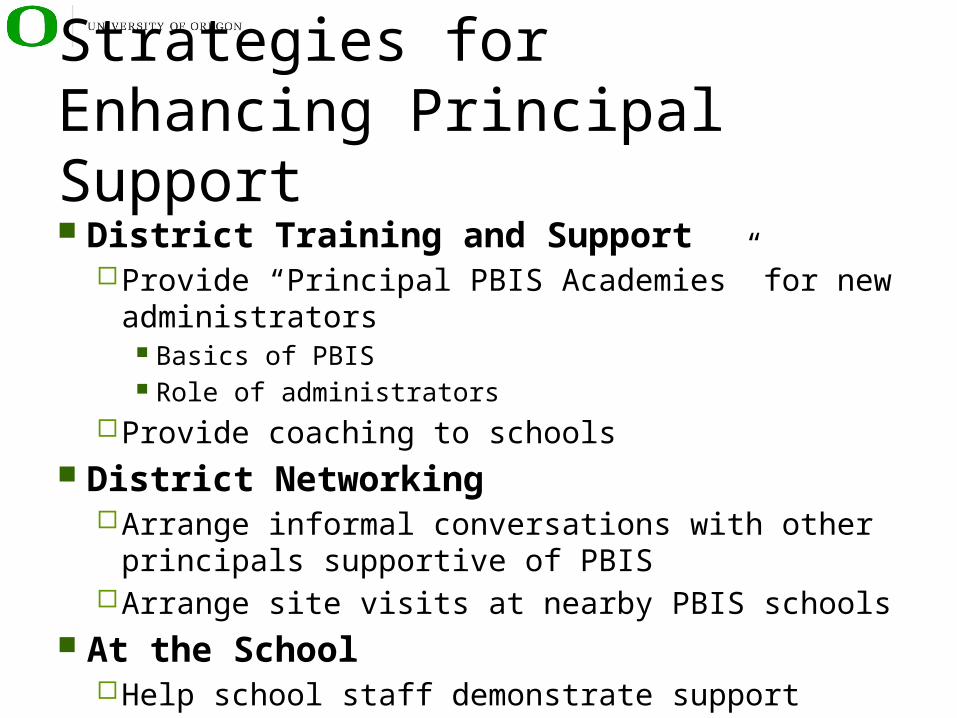
District Training and Support Provide “Principal PBIS Academies” for new
administrators Basics of PBIS Role of administrators
Provide coaching to schools District Networking
Arrange informal conversations with other principals supportive of PBIS
Arrange site visits at nearby PBIS schools At the School
Help school staff demonstrate support
Strategies for Enhancing Principal Support
What is the strongest predictor of PBIS sustainability?
McIntosh, K., Mercer, S. H., Hume, A. E., Frank, J. L., Turri, M. G., & Mathews, S. (2013). Factors related to sustained implementation of School-wide Positive Behavior Support. Exceptional Children, 79, 293-311.
Model fit indices acceptable (except χ2) χ2 (731) = 881.55, p < .001, CFI = .96, TLI = .96,
RMSEA = .03 R 2 = .45 Factors
Priority (B = .14, SE = .39, p > .05)Team Use of Data (B = .61, SE = .24, p < .05)District Priority (B = -1.14, SE = .66, p > .05)Capacity Building (B = .98, SE = .43, p < .05)
Results: Predictive Model
Sustained PBIS
Fidelity
5.38**
.07
Team Use of Data
School Priority
.47
8888888888888888888888888888888
District Priority
Capacity Building
Sustained PBIS
Fidelity
-.34
.41
88888
888
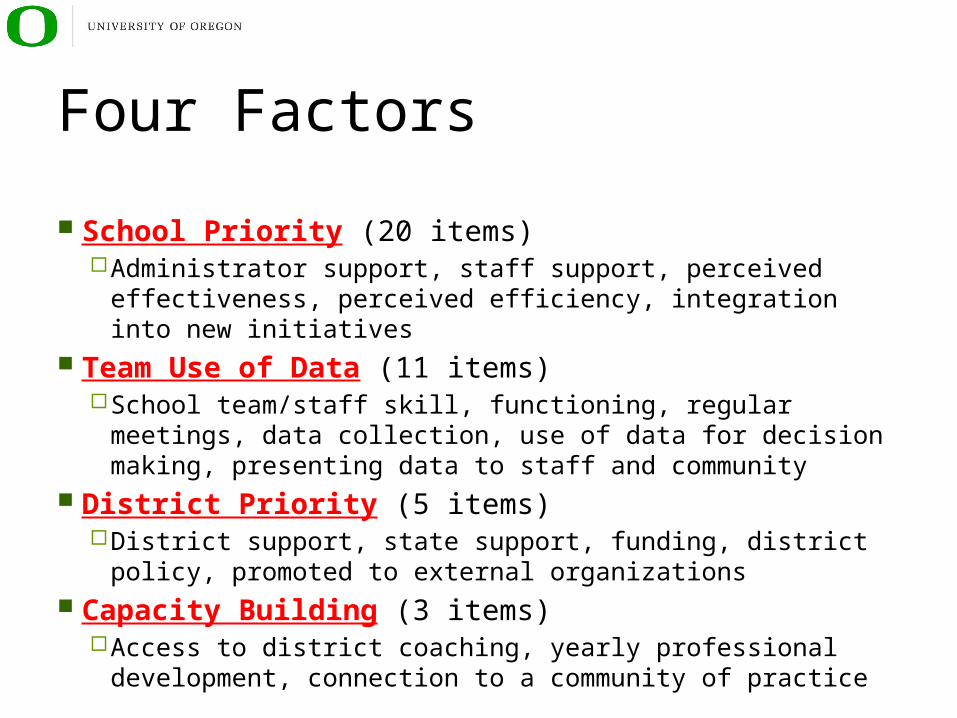
School Priority (20 items) Administrator support, staff support, perceived effectiveness,
perceived efficiency, integration into new initiatives Team Use of Data (11 items)
School team/staff skill, functioning, regular meetings, data collection, use of data for decision making, presenting data to staff and community
District Priority (5 items) District support, state support, funding, district policy,
promoted to external organizations Capacity Building (3 items)
Access to district coaching, yearly professional development, connection to a community of practice
Four Factors
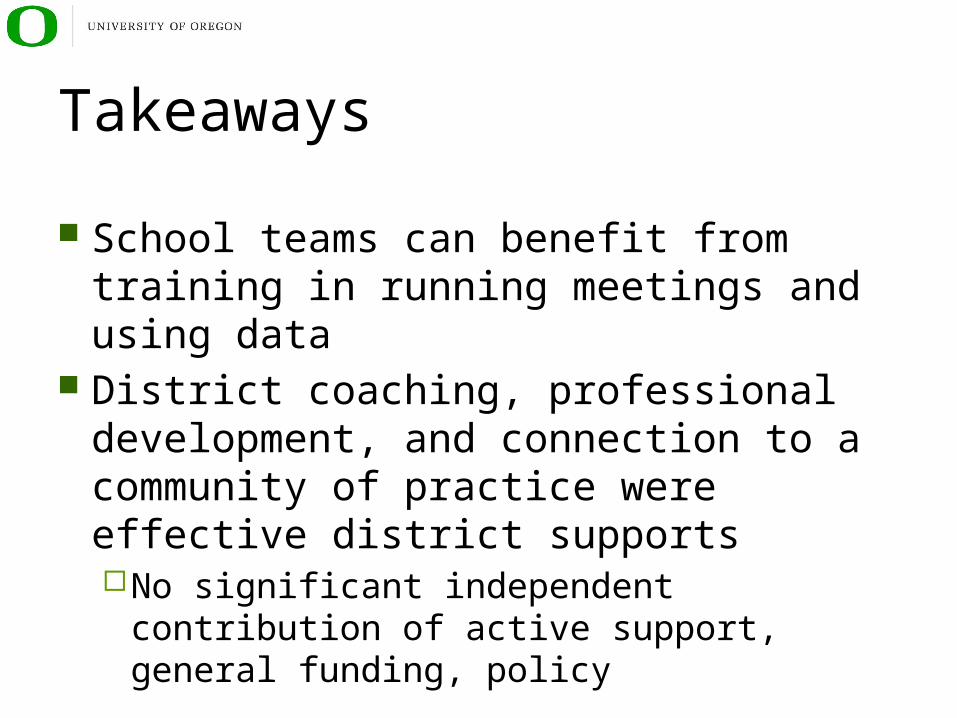
School teams can benefit from training in running meetings and using data
District coaching, professional development, and connection to a community of practice were effective district supportsNo significant independent contribution of
active support, general funding, policy
Takeaways
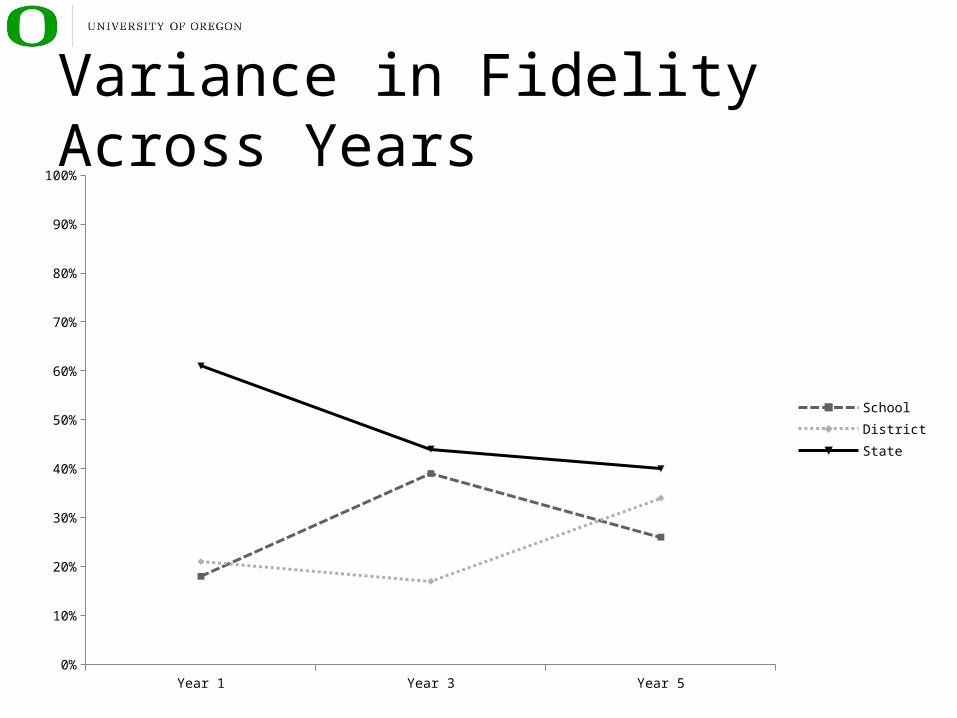
What predicts sustained PBIS implementation at 3 and 5 years after training?McIntosh, K., Mercer, S. H., Nese, R. N. T., Strickland-Cohen, M. K., & Hoselton, R. (2014). Predictors of sustained implementation of School-wide PBIS at 3 and 5 years after initial implementation. Manuscript in preparation.
1242 schools submitting fidelity data in PBIS Assessment (starting from 05-06 to 12-13)530 districts29 statesGrade levels:
70% elementary schools 21% middle schools 9% high schools
Sample
Year 1 Year 3 Year 50%
10%
20%
30%
40%
50%
60%
70%
80%
90%
100%
SchoolDistrictState
Variance in Fidelity Across Years
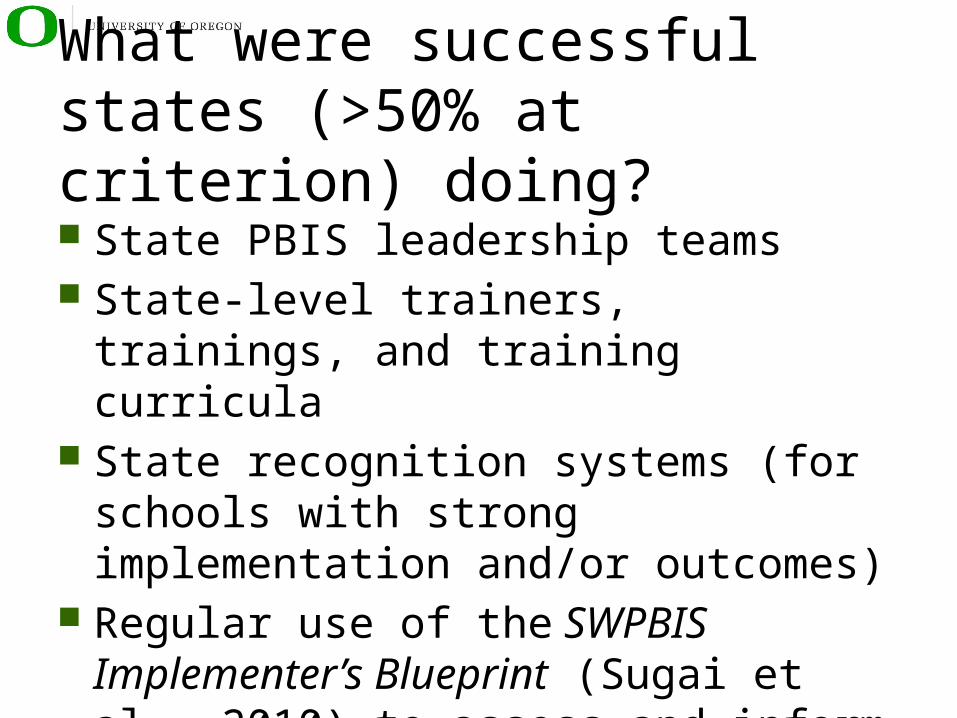
State PBIS leadership teams State-level trainers, trainings, and training
curricula State recognition systems (for schools with
strong implementation and/or outcomes) Regular use of the SWPBIS Implementer’s
Blueprint (Sugai et al., 2010) to assess and inform implementation
What were successful states (>50% at criterion) doing?
Bethel School District
PBIS Team Approach
Be the guiding/driving force for Bethel’s Systems Approach to improving behavior and
achievement for all the students in the district.
Adapted from Horner, Sugai and Bethel Staff
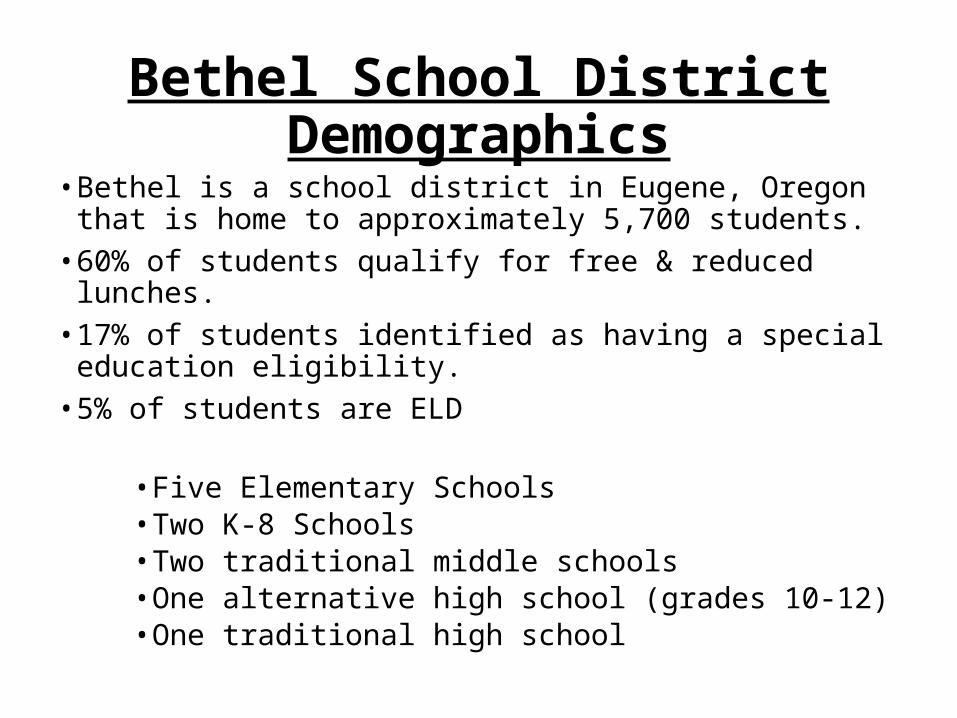
Bethel School District Demographics
• Bethel is a school district in Eugene, Oregon that is home to approximately 5,700 students.
• 60% of students qualify for free & reduced lunches. • 17% of students identified as having a special education
eligibility.• 5% of students are ELD
• Five Elementary Schools• Two K-8 Schools• Two traditional middle schools• One alternative high school (grades 10-12)• One traditional high school
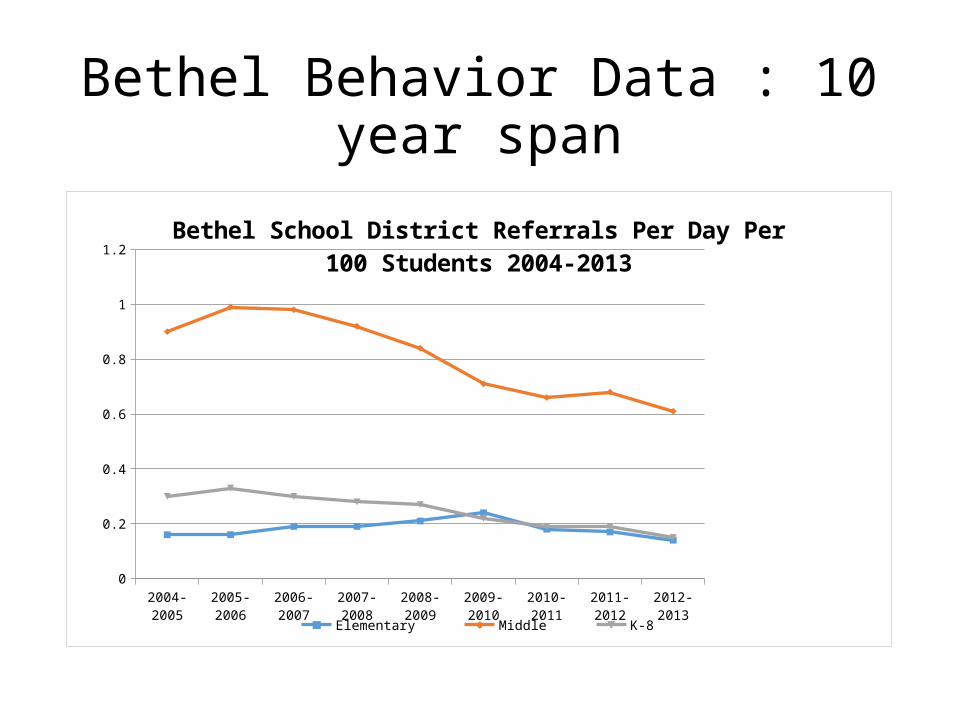
Bethel School District Referrals Per Day Per 100 Students 2004-2013
Elementary Middle K-8
Bethel PBS Structure
B e th e l S c h o o l D is trictA d m in is tra tion
S ch oo l P B S Te a m sM e et m on th ly
F o c us o n P os it iveB e h av io r S u pp o rt
D e c is io n M a k ingD a ta -B a sed
E ffic ie n tR e lia b le
T ra in in g S tra n dsS ch oo lw ide
N o n C la ss ro o m /C la ss ro omIn d ivid u a l S tud e n t S yste m s
P B S L e ad e rsh ip T e amM e e ts M o n th ly
P la ns T ra in in g , Im p le m e n ta tio n a ndP ro v id e s D ire c tion fo r D istric t P B S
28
Academic Social Behavior
1-5% 1-5%
5-10% 5-10%
80-90% 80-90%
Individual• Individually Design
Instruction
Individual• Behavior Support Plan (BSP)• Safety Plan
Targeted: Some Students (at-risk)• Core Plus Pre-teach, Re-teach Supplemental Programs Alter Group Size
Targeted: Some Students (at-risk)• Advance CICO• Social Skills• Lunch Buddies• Boy/Girls Groups• Check-in, Check-out (CICO)
Universal Screening: All Students• Core Program
Universal Screening: All Students• Schoolwide expectations taught explicitly reinforced frequently
Practices for Student Success: Linking of Academic and Behavioral Interventions
Adapted from: Horner & Sugai
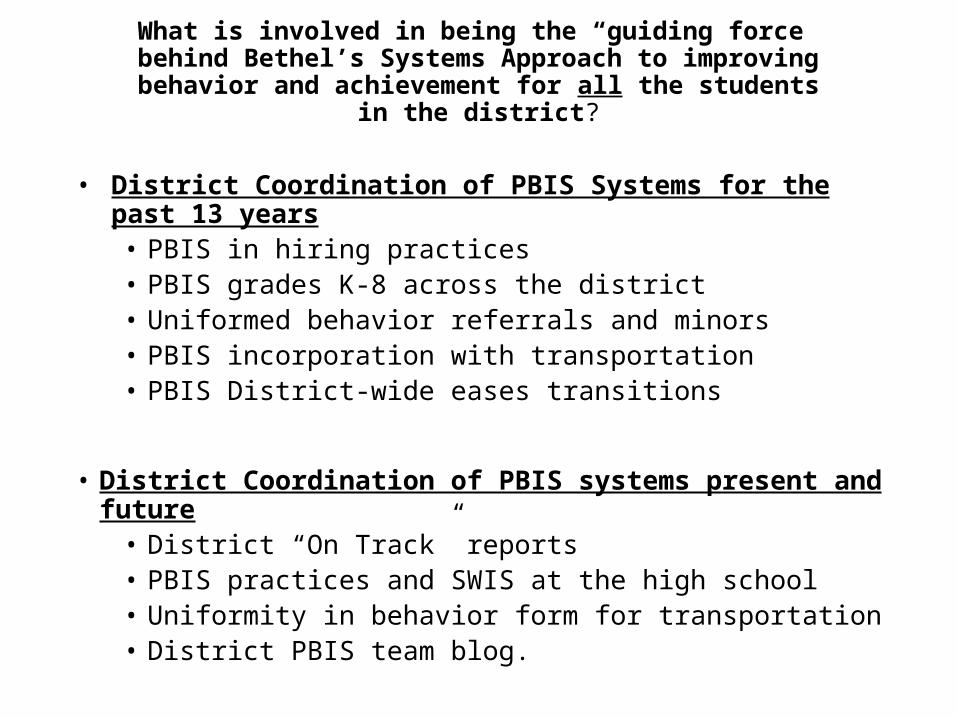
What is involved in being the “guiding force” behind Bethel’s Systems Approach to improving
behavior and achievement for all the students in the district?
• District Coordination of PBIS Systems for the past 13 years• PBIS in hiring practices• PBIS grades K-8 across the district• Uniformed behavior referrals and minors• PBIS incorporation with transportation• PBIS District-wide eases transitions
• District Coordination of PBIS systems present and future• District “On Track” reports• PBIS practices and SWIS at the high school• Uniformity in behavior form for transportation• District PBIS team blog.
Bethel Triangle DataComparison of behavior data with PBIS
implementation in Elementary 2000/2001 compared to 2013-2014
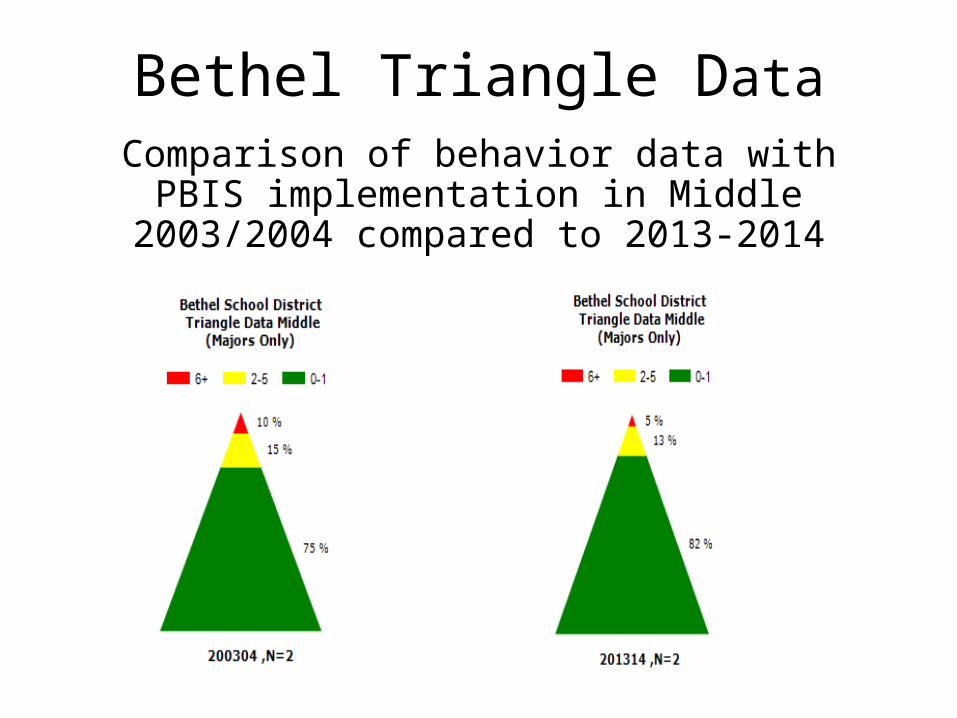
Bethel Triangle DataComparison of behavior data with PBIS
implementation in Middle 2003/2004 compared to 2013-2014
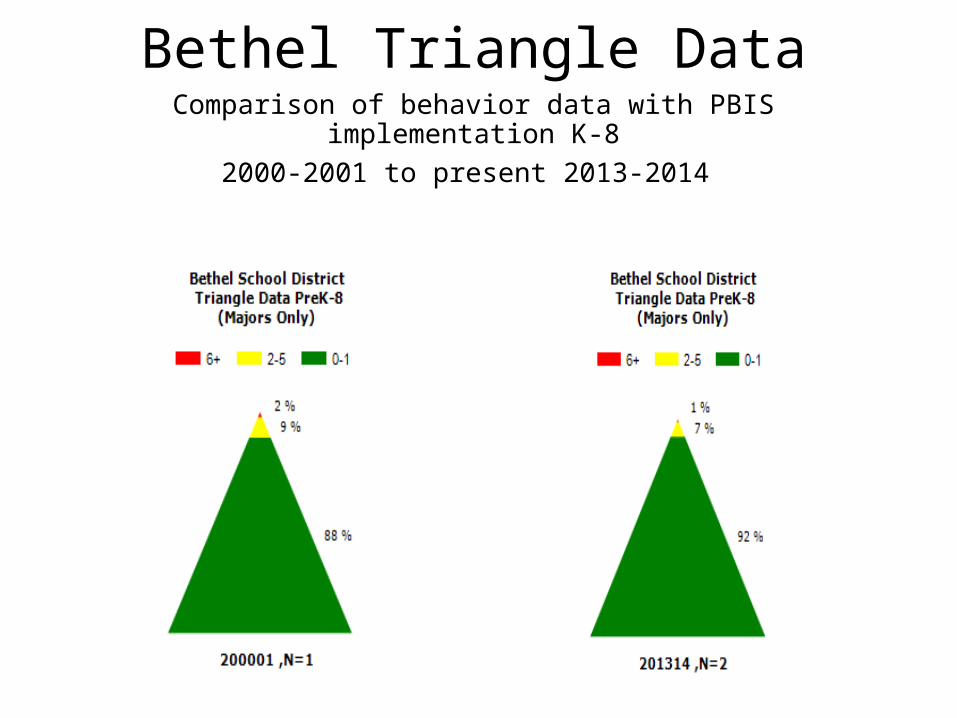
Bethel Triangle DataComparison of behavior data with PBIS implementation K-8
2000-2001 to present 2013-2014
Coordination of PBIS : the team approach
• Ensuring coordination and implementation is a District Lead Team member responsibility
• The DLT includes:• PBIS Coordinator• Behavior Specialist• Building Administrators• Director of Special Services• School Counselor/PBIS Facilitators• District Equity Coordinator • First Student transportation representative
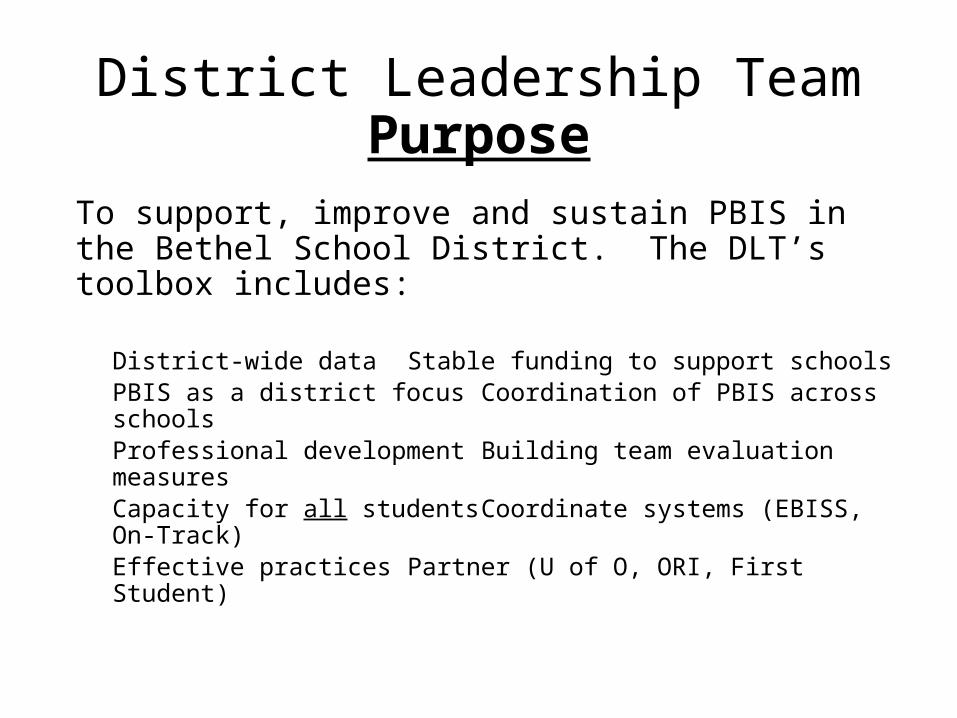
District Leadership TeamPurpose
To support, improve and sustain PBIS in the Bethel School District. The DLT’s toolbox includes:
District-wide data Stable funding to support schoolsPBIS as a district focus Coordination of PBIS across schoolsProfessional development Building team evaluation measuresCapacity for all students Coordinate systems (EBISS, On-Track)Effective practices Partner (U of O, ORI, First Student)
• Team Implementation Checklist (TIC)• Benchmarks of Quality (BOQ)• Tiered Fidelity Inventory (TFI)
• Results are indicator of possible growth for building team
• Results provide information to the PBIS District Lead Team
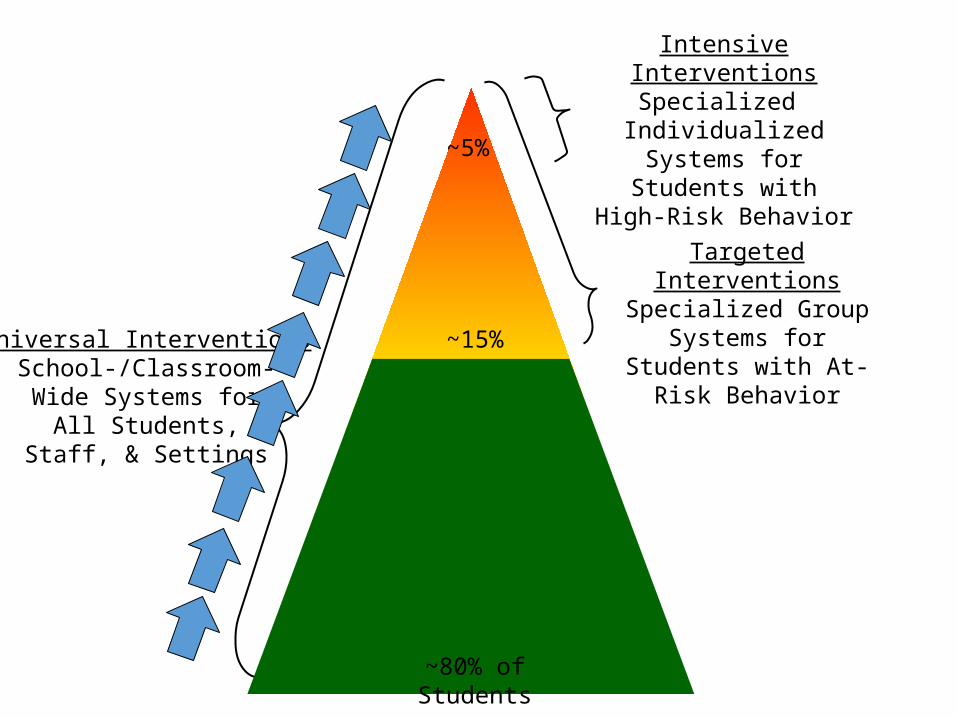
Intensive InterventionsSpecialized
IndividualizedSystems for Students with
High-Risk Behavior
Targeted InterventionsSpecialized Group
Systems for Students with At-Risk BehaviorUniversal Interventions
School-/Classroom-Wide Systems for
All Students,Staff, & Settings
~80% of Students
~15%
~5%
AgreementsEstablish PBS Goals
Administrative SupportDistrict PBIS TeamSchool PBS Team
Representative Staff
Develop Data-based Action Plan
ImplementationEvaluation
BETHEL PBS IMPLEMENTATION PROCESS
Snapshot of District Team Survey Data2013-2014
1 2 375
80
85
90
95
100
Team Response to Survey of Implementation
CommitmentTeamSupport (3 Tiers)
Elementary Middle K-8
Perc
ent o
f Im
plem
enta
tion
Recent Barriers and Challenges
• Counseling FTE reduced by .5• Administrative changes/reduction• Staff changes/new staff• Maintaining contextual fit within district-wide
system • Competing foci• Partial implementation or “drift” from best practice
Provision of support for Bethel’s District PBIS
• Attend building level PBIS meetings • Monitor transitions between PBIS Tier I, II, III teams• Meet as a team with building level Tier I & Tier II/III
facilitators each trimester • Review building level data• Provide district, local, state and national training
information • Maintain connection and engagement with Bethel
transportation
From power-point to practice
• District-wide data indicates increase in percent of ODRs for physical aggression.
• DLT response: PBIS coach meets with building level teams to review data and increase school wide interventions to address percentage change
• Revitalize focus on safety and Stop/Walk/Talk programs• Increase pro-social lessons• Use of peer mediation programs• Provide retraining, as needed
2010-2011 2011-2012 2012-2013 2013-20140
5
10
15
20
25
Physical Aggression ODR Data
ElementaryMiddleK-8
Percent of
ODR
District Level Implementation: What to do to be effective?
• Investment and Commitment to School-Wide Prevention
• Provision of District Training for Personnel
• Use of Data Systems
• Team-Based Decision Making Model
43
Contact Information
• Bridget Drobac- PBIS CoordinatorBethel School District
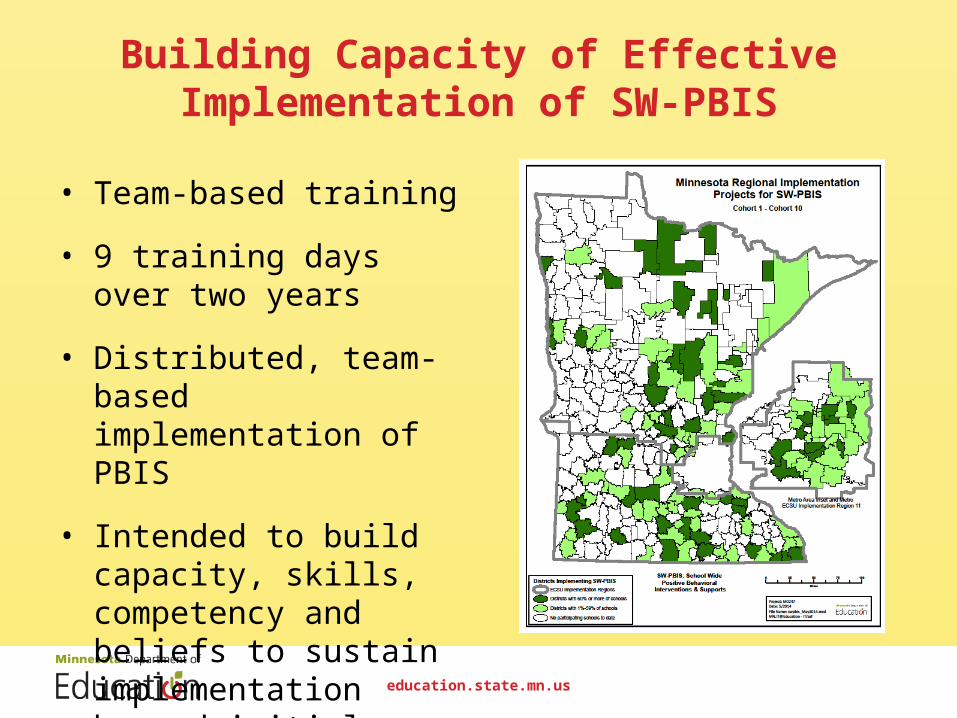
Building Capacity of Effective Implementation of SW-PBIS
• Team-based training
• 9 training days over two years
• Distributed, team-based implementation of PBIS
• Intended to build capacity, skills, competency and beliefs to sustain implementation beyond initial training
education.state.mn.us
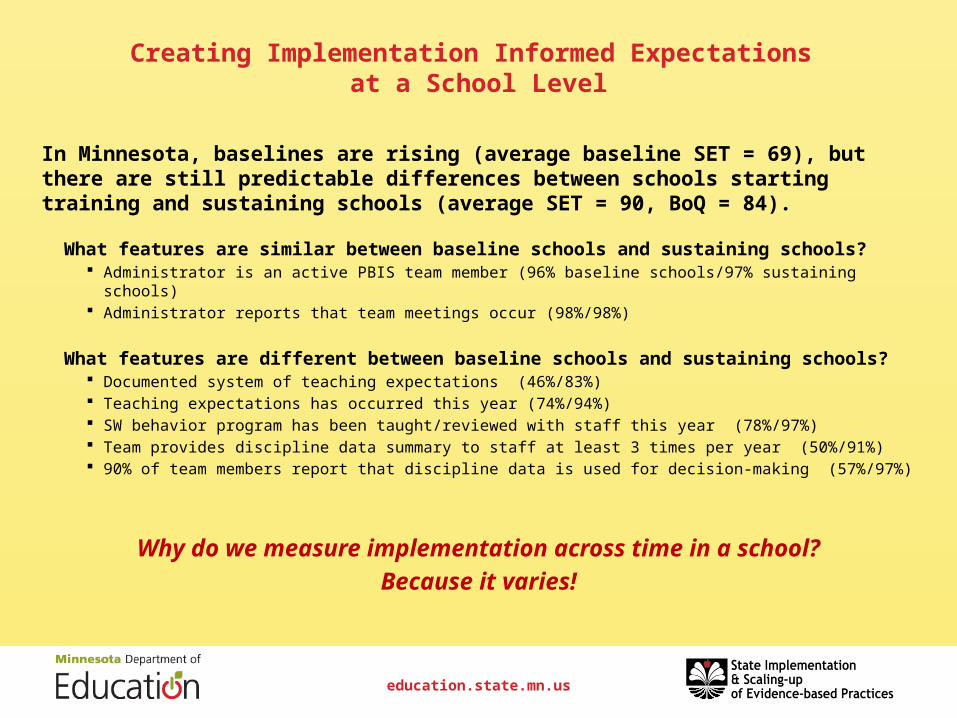
Creating Implementation Informed Expectations at a School Level
In Minnesota, baselines are rising (average baseline SET = 69), but there are still predictable differences between schools starting training and sustaining schools (average SET = 90, BoQ = 84).
What features are similar between baseline schools and sustaining schools? Administrator is an active PBIS team member (96% baseline schools/97% sustaining schools) Administrator reports that team meetings occur (98%/98%)
What features are different between baseline schools and sustaining schools? Documented system of teaching expectations (46%/83%) Teaching expectations has occurred this year (74%/94%) SW behavior program has been taught/reviewed with staff this year (78%/97%) Team provides discipline data summary to staff at least 3 times per year (50%/91%) 90% of team members report that discipline data is used for decision-making (57%/97%)
Why do we measure implementation across time in a school?
Because it varies!
education.state.mn.us
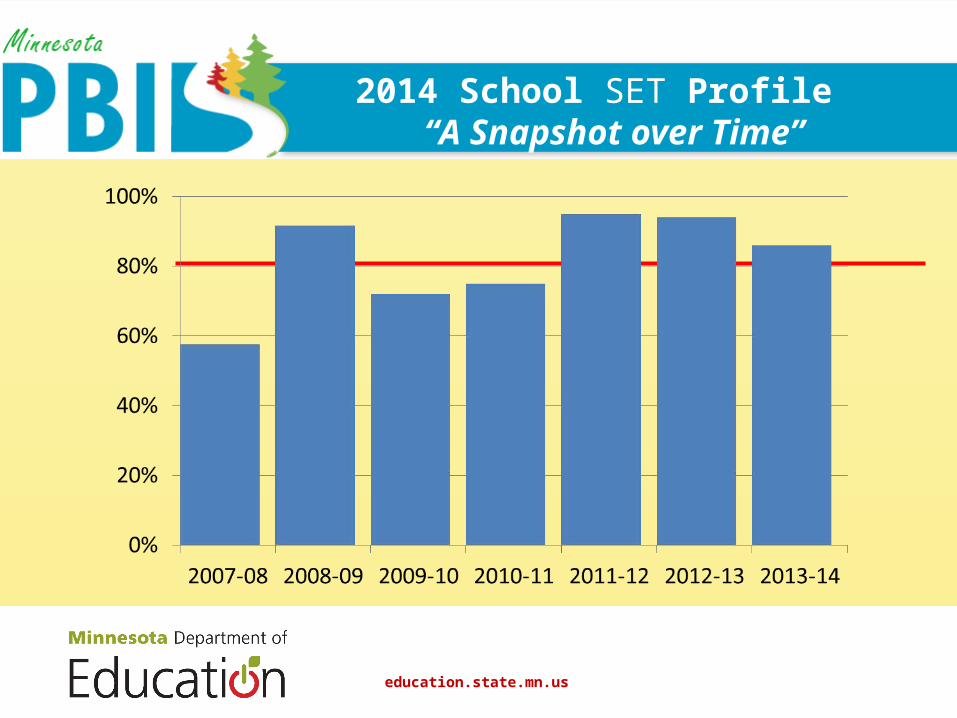
2014 School SET Profile “A Snapshot over Time”
education.state.mn.us
Creating Implementation Informed Expectations at a District-Level
• At a district-level, it is often a challenge to accurately track which schools:
• have been trained,• are in training, and• have yet to participate in training.
• Differentiate outcome expectations for schools by what we know about their implementation.
• Get the right information to the right people at the right time to inform district decisions.
• Support patience and focus to get to results.
Why do we measure implementation across a District?
- Because it varies!
education.state.mn.us
2014 District SET Profile “A Snapshot in Time”
education.state.mn.us
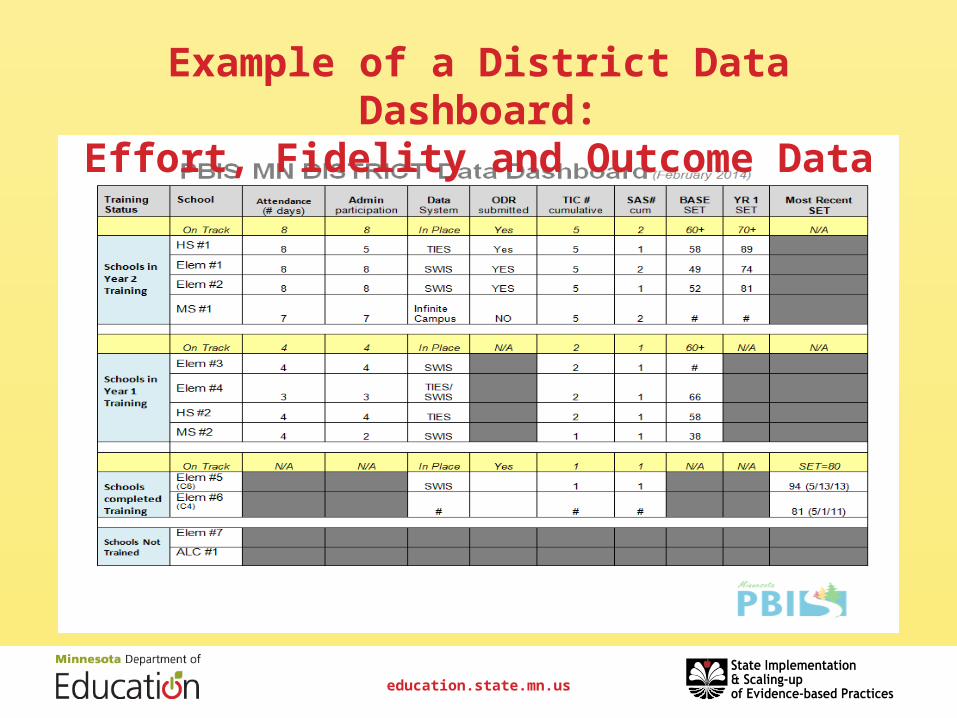
Example of a District Data Dashboard:Effort, Fidelity and Outcome Data
education.state.mn.us
District Capacity Assessment (DCA)
education.state.mn.us
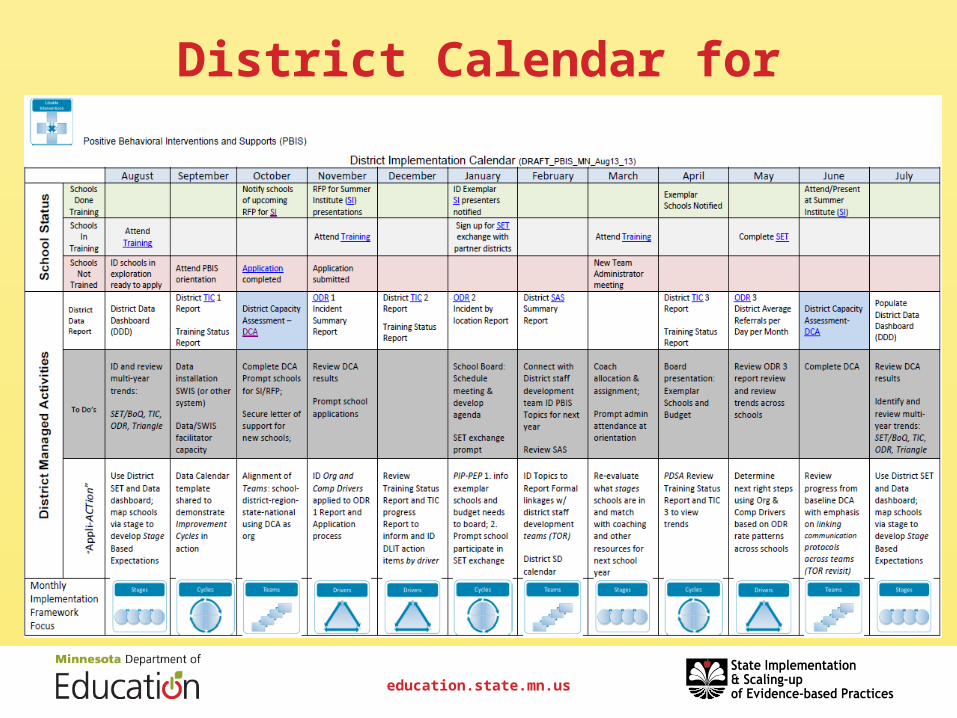
District Calendar for Implementation
education.state.mn.us
Implementation Informed Expectations for States
When do we expect to see state-level outcome changes? How many schools and districts need to be implementing? At what standard?
As many variables change, can we continue to produce good outcomes
Change in team members New trainers New coaches New evaluators
Why do we measure implementation across the state? It varies across schools, districts, regions and over time
education.state.mn.us
Cohort 8 SET Results Fall 12-Spring 14
NorthMetro
SouthState
0102030405060708090
100
Baseline
Yr 1
Yr 2
BaselineYr 1Yr 2
education.state.mn.us
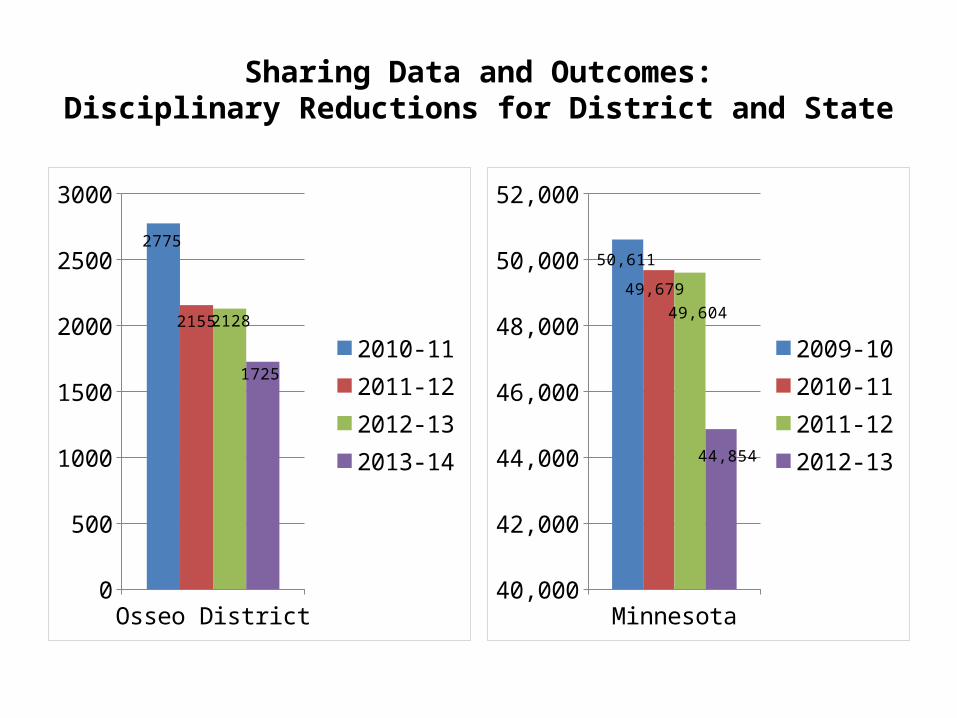
Sharing Data and Outcomes:Disciplinary Reductions for District and State
Osseo District0
500
1000
1500
2000
2500
3000
2775
2155 2128
17252010-112011-122012-132013-14
Minnesota40,000
42,000
44,000
46,000
48,000
50,000
52,000
50,611
49,67949,604
44,854
2009-102010-112011-122012-13
Closing Thoughts
• We are learning a lot by studying schools and districts that have been doing PBIS well over time.
• Tools and processes that synthesize data for school and district teams support sustained implementation.
• Watch for larger data sets and outcomes to change when at least 25% are effectively implementing.
education.state.mn.us
• Minnesota PBIS:http://pbismn.org
• The Minnesota Department of Education:http://education.state.mn.us
• The Active Implementation Hub:http://implementation.fpg.unc.edu/about-the-ai-hub
McIntosh, K., & Goodman, S. (in press). Multi-tiered systems of support: Integrating academic RTI and school-wide PBIS. New York: Guilford Press.
McIntosh, K., Kelm, J. L., & Canizal Delabra, A. (2014). In search of how principals change: Critical incidents in enhancing administrator support for school-wide prevention . Manuscript submitted for publication.
McIntosh, K., Mercer, S. H., Hume, A. E., Frank, J. L., Turri, M. G., & Mathews, S. (2013). Factors related to sustained implementation of school-wide positive behaviour support. Exceptional Children, 79, 293-311.
McIntosh, K., Mercer, S. H., Nese, R. N. T., Strickland-Cohen, M. K., & Hoselton, R. (2014). Predictors of sustained implementation of School-wide PBIS at 3 and 5 years after initial implementation. Manuscript in preparation.
McIntosh, K., Predy, L. K., Upreti, G., Hume, A. E., Turri, M. G., & Mathews, S. (2014). Perceptions of contextual features related to implementation and sustainability of school-wide positive behaviour support. Journal of Positive Behavior Interventions, 16, 29-41.
Strickland-Cohen, M. K., McIntosh, K., & Horner, R. H. (2014). Sustaining effective practices in the face of principal turnover. Teaching Exceptional Children, 46(3), 18-24.
Sugai, G., Horner, R. H., Algozzine, R., Barrett, S., Lewis, T., Anderson, C., . . . Simonsen, B. (2010). School-wide positive behavior support: Implementation blueprint and self-assessment (2nd ed.). Eugene, OR: University of Oregon. Available at http://pbis.org/resource/216.