40 TOYOTA Annual Report 2017 Message from the President Long-term Strategy At a Glance History Initiatives for Sustainable Growth Financial Information Non-Automotive Business/Corporate Information and Stock Information Table of Contents Developing a Strong Financial Foundation We believe that by striving to make ever-better cars that provide value to cus- tomers and enriching lives of communities we can sus- tainably increase our corpo- rate value and enjoy stable, ongoing development with our stakeholders. To realize this goal, we are implementing a financial strategy based on the three pillars of growth, efficien- cy, and stability, striving to maintain balance between said pillars over the medium and long-terms. 1. Growth: Continuous Investments for Sustainable Growth in the Future The auto industry is on the verge of a once-in-a-century turning point. We believe that artificial intelligence (AI), automated driving, robotics, and other new fields are especially important to the mobility of the future. Given these circumstances, we must nurture both the strengths that will enable us to survive today and the strengths that will enable us to survive tomorrow. If the strengths for surviving today are essentially defense-oriented, then I think those for surviving tomorrow are offense-oriented. We have always sought to promote both, but I think we may have been shifting more toward the defensive. Going for- ward, we will seek to focus more on our offense. We have already begun initiatives to this end through such measures as shifting resources to R&D in key fields and investing through Toyota AI Ventures and the Mirai Creation Investment Limited Partnership in order to secure technical prowess. Moreover, we have spent around 1 trillion yen on R&D investment, capital expenditure, and sharehold- er returns each to date. However, this will not be enough to provide new value going forward; we will also need to work with partners in different industries and new fields. We will consider all available options, including M&A, as we work to develop the strengths that will enable us survive tomorrow. 2. Efficiency: Enhancing Profitability and Efficiency of the Balance Sheet We continue to work to strengthen our profit structure. Through the Toyota New Global Architecture, we are working not only to dramatically enhance the basic performance and product appeal of our cars, but also to enhance development efficiency by standardizing parts and components through grouping develop- ment. Furthermore, we will continue efforts to reduce expenses and appropriately manage fixed costs. In terms of capital expenditure, we are working to thoroughly revise our expenditure priorities and plans, make equipment more compact, shorten pro- cesses, enable multi-model production, facilitate faster response to changes in production quantities, and make effective use of existing equipment in order to improve productivity and reduce the need for investment. We aim to make smart and efficient use of man- agement resources, including people, things and money, and by doing so maintain and enhance our asset efficiency. 3. Stability: Maintenance of Liquidity Having experienced the global financial crisis and the Great East Japan Earthquakes, we believe it is important to maintain a sufficient level of net cash to cover both the fixed costs for the automotive busi- ness for half a year and the refinance requirement for the financial services for half a year. This represents a financial foundation which enables Toyota to grow sustainably in any business environment. The above level of net cash is not only necessary for creation of further corporate value but also essen- tial for Toyota’s management in order to maintain a full line-up in each region while responding to all options and opportunities, including next-generation technologies and M&A. Through our full line-up and all-embracing approach, we are able to hedge risks and continue operations timely in an adequate scale no matter how and unexpectedly our business environment changes. In summary, it is our aim to establish a strong finan- cial foundation which will support Toyota’s sustainable growth by pursuing growth and efficiency in the medi- um to long-term while maintaining sufficient stability. Financial Information Financial Strategy Financial Results and Position Financial Summary Financial Strategy Osamu Nagata Chief Financial Officer, Executive Vice President, Member of the Board of Directors Ever-Bet etter er Cars s Enriching Lives E E Enr E Enr Enric Communities of C of C C Co fC Toyota Values Toyota Values oyota Value To Toyota a Value Stable Base of Business
Transcript
40TOYOTA Annual Report 2017
Message from the President Long-term Strategy At a Glance History
Initiatives for Sustainable Growth
Financial Information Non-Automotive Business/Corporate Information and Stock Information
Table of Contents
Developing a Strong Financial Foundation
We believe that by striving
to make ever-better cars
that provide value to cus-
tomers and enriching lives
of communities we can sus-
tainably increase our corpo-
rate value and enjoy stable,
ongoing development with
our stakeholders.
To realize this goal, we are implementing a fi nancial
strategy based on the three pillars of growth, effi cien-
cy, and stability, striving to maintain balance between
said pillars over the medium and long-terms.
1. Growth: Continuous Investments for Sustainable Growth in the Future
The auto industry is on the verge of a once-in-a-century
turning point. We believe that artifi cial intelligence (AI),
automated driving, robotics, and other new fi elds are
especially important to the mobility of the future.
Given these circumstances, we must nurture both
the strengths that will enable us to survive today and
the strengths that will enable us to survive tomorrow.
If the strengths for surviving today are essentially
defense-oriented, then I think those for surviving
tomorrow are offense-oriented. We have always
sought to promote both, but I think we may have
been shifting more toward the defensive. Going for-
ward, we will seek to focus more on our offense.
We have already begun initiatives to this end
through such measures as shifting resources to R&D
in key fi elds and investing through Toyota AI Ventures
and the Mirai Creation Investment Limited Partnership
in order to secure technical prowess.
Moreover, we have spent around 1 trillion yen on
R&D investment, capital expenditure, and sharehold-
er returns each to date. However, this will not be
enough to provide new value going forward; we will
also need to work with partners in different industries
and new fi elds.
We will consider all available options, including
M&A, as we work to develop the strengths that will
enable us survive tomorrow.
2. Effi ciency: Enhancing Profi tability and Effi ciency of the Balance Sheet
We continue to work to strengthen our profi t structure.
Through the Toyota New Global Architecture, we
are working not only to dramatically enhance the basic
performance and product appeal of our cars, but also
to enhance development effi ciency by standardizing
parts and components through grouping develop-
ment. Furthermore, we will continue efforts to reduce
expenses and appropriately manage fi xed costs.
In terms of capital expenditure, we are working to
thoroughly revise our expenditure priorities and
plans, make equipment more compact, shorten pro-
cesses, enable multi-model production, facilitate
faster response to changes in production quantities,
and make effective use of existing equipment in order
to improve productivity and reduce the need for
investment.
We aim to make smart and effi cient use of man-
agement resources, including people, things and
money, and by doing so maintain and enhance our
asset effi ciency.
3. Stability: Maintenance of Liquidity
Having experienced the global fi nancial crisis and the
Great East Japan Earthquakes, we believe it is
important to maintain a suffi cient level of net cash to
cover both the fi xed costs for the automotive busi-
ness for half a year and the refi nance requirement for
the fi nancial services for half a year. This represents a
fi nancial foundation which enables Toyota to grow
sustainably in any business environment.
The above level of net cash is not only necessary
for creation of further corporate value but also essen-
tial for Toyota’s management in order to maintain
a full line-up in each region while responding to all
options and opportunities, including next-generation
technologies and M&A.
Through our full line-up and all-embracing
approach, we are able to hedge risks and continue
operations timely in an adequate scale no matter how
and unexpectedly our business environment changes.
In summary, it is our aim to establish a strong fi nan-
cial foundation which will support Toyota’s sustainable
growth by pursuing growth and effi ciency in the medi-
um to long-term while maintaining suffi cient stability.
Financial Information Financial Strategy Financial Results and Position Financial Summary
Financial Strategy
Osamu NagataChief Financial Offi cer, Executive Vice President, Member of the Board of Directors
Ever-BetettererCarss
Enriching Lives EEEnrEEnrEnricCommunitiesof Cof CCCof C
Toyota ValuesToyota Valuesoyota ValueToToyota a Value
Stable Base of Business
41TOYOTA Annual Report 2017
Message from the President Long-term Strategy At a Glance History
Initiatives for Sustainable Growth
Financial Information Non-Automotive Business/Corporate Information and Stock Information
Table of Contents
Model AA Class Shares
Toyota issued the Model AA class shares to develop
a new relationship with shareholders. The purpose of
the issuance was to 1) raise funds for medium to
long-term R&D activities, 2) enhance the base of
long-term shareholders, and 3) diversify the means of
fund raising. The raised funds will be utilized for R&D
in the areas of advanced and cutting-edge technolo-
gies such as fuel cells, infrastructure, information
technology and highly intelligent mobility.
We appreciate opinions of our shareholders who
support Toyota from a long-term stand point. By
refl ecting them in Toyota’s management, we intend
to increase our corporate value further.
Shareholder Return
Shareholder return is an important part of our man-
agement policies. In principle, it is determined on the
basis of net income.
With regard to dividends, we strive for a stable and
sustainable payment benchmarked at 30% of con-
solidated dividend payout ratio while considering fac-
tors such as our fi nancial results, investment plans
and liquidity. For the fi scal year to March 2017, we
paid an annual dividend of 210 yen per share. Since
the interim period ended September 30, 2015, we
have pursued a better balance between interim and
year-end dividends.
As for repurchase of shares, we intend to exercise
fl exibly in consideration of long-term capital effi ciency
and in response to changes in our business environ-
ment. For the fi scal year to March 2017, we repur-
chased 449.9 billion yen, equivalent to 69 million
shares as shareholder return.
Going forward, we intend to build a strong fi nancial
foundation while further improving profi tability. At the
same time, we would like to enhance long-term rela-
tionships of trust with our shareholders through con-
structive dialogues and stable shareholder return. On
the basis of this, we aim to realize both sustainable
growth and increased corporate value.
100
50
150
200
250
� Interim dividend � Year-end dividend � Net income (right axis)
Dividend per Share and Net Income
800
400
600
1,000
1,200
1,400
1,600
� Total amount of dividends (common shares) � Total amount of dividends (First Series Model AA Class Shares) � Share repurchase for shareholder returns � Share repurchase to avoid dilution of common shares
* Payout ratio: This is the ratio of (i) the amount of dividend per common share to (ii) net income attributable to Toyota Motor Corporation per common share.
Total shareholders’ equity 18,183,076 17,608,407 574,669
Total liabilities, mezzanine equity and shareholders’ equity 48,750,186 47,427,597 1,322,589
Note: Mezzanine equity consists of the Model AA Class Shares, which is reported as a separate line item between Liabilities and Shareholders’ equity.
Consolidated Balance Sheets (Yen in millions)
Financial Results and Position
Financial Information Financial Strategy Financial Results and Position Financial Summary Ever-BetettererCarss
Enriching Lives EEEnrEEnrEnricCommunitiesof Cof CCCof C
Toyota ValuesToyota Valuesoyota ValueToToyota a Value
Stable Base of Business
44TOYOTA Annual Report 2017
Message from the President Long-term Strategy At a Glance History
Initiatives for Sustainable Growth
Financial Information Non-Automotive Business/Corporate Information and Stock Information
Table of Contents
FY2017(For the year ended
March 31, 2017)
FY2016(For the year ended
March 31, 2016)Increase
(Decrease)
Net revenues 27,597,193 28,403,118 (805,925)
Sales of products 25,813,496 26,549,111 (735,615)
Financing operations 1,783,697 1,854,007 (70,310)
Costs and expenses 25,602,821 25,549,147 53,674
Cost of products sold 21,543,035 21,456,086 86,949
Cost of fi nancing operations 1,191,301 1,149,379 41,922
Selling, general and administrative 2,868,485 2,943,682 (75,197)
Operating income 1,994,372 2,853,971 (859,599)
Other income (expense) 199,453 129,410 70,043
Interest and dividend income 158,983 157,862 1,121
Interest expense (29,353) (35,403) 6,050
Foreign exchange gain (loss), net 33,601 (5,573) 39,174
Other income (loss), net 36,222 12,524 23,698
Income before income taxes and equity in earnings of affi liated companies 2,193,825 2,983,381 (789,556)
Provision for income taxes 628,900 878,269 (249,369)
Equity in earnings of affi liated companies 362,060 329,099 32,961
Net income 1,926,985 2,434,211 (507,226)
Less – Net income attributable to noncontrolling interests (95,876) (121,517) 25,641
Net income attributable to Toyota Motor Corporation 1,831,109 2,312,694 (481,585)
Note: Net income attributable to common shareholders for the fi scal year ended March 31, 2017 and 2016 is 1,821,314 million yen and 2,306,607
million yen, respectively, which is derived by deducting dividend and accretion to Model AA Class Shares of 9,795 million yen and 6,087 million
yen, respectively, from Net income attributable to Toyota Motor Corporation.
Net Income Attributable to Toyota Motor Corporation per Common Share (Yen)
Basic 605.47 741.36 (135.89)
Diluted 599.22 735.36 (136.14)
Consolidated Statements of Income (Yen in millions)
2,853.9
1,994.3
2,750.5
2,292.1
(%)
500 2.0
1,000 4.0
1,500 6.0
2,000 8.0
2,500 10.0
3,000 12.0(Billions of yen)
8,6818,9718,9729,116
8,871
2,000
4,000
6,000
8,000
10,000(Thousands of units)
1,831.1
2,173.3
1,823.1
(%)
500 2.5
1,000 5.0
1,500 7.5
2,000 10.0
2,500 12.5
3,000 15.0(Billions of yen)
28,403.127,597.127,234.5
25,691.9
22,064.1
5,000
10,000
15,000
20,000
25,000
30,000(Billions of yen)
1,320.8
2,312.6
962.1
2013 2014 2015 2016 2017FY
�� Operating income�� % to net revenues (Right scale)
�� Net income attributable to Toyota Motor Corporation�� ROE (Right scale)
Operating Income andRatio of Operating Income to Net Revenues
2013 2014 2015 2016 2017FY
Consolidated Vehicle Sales
2013 2014 2015 2016 2017FY
Net Income Attributable to Toyota Motor Corporation and ROE
2013 2014 2015 2016 2017FY
Net Revenues
0 0
10.0
7.2
10.1
8.9
6.0
0
0 0
13.8
10.6
13.913.7
0
8.5
Financial Results and Position
Financial Information Financial Strategy Financial Results and Position Financial Summary Ever-BetettererCarss
Enriching Lives EEEnrEEnrEnricCommunitiesof Cof CCCof C
Toyota ValuesToyota Valuesoyota ValueToToyota a Value
Stable Base of Business
45TOYOTA Annual Report 2017
Message from the President Long-term Strategy At a Glance History
Initiatives for Sustainable Growth
Financial Information Non-Automotive Business/Corporate Information and Stock Information
Table of Contents
FY2017(For the year ended
March 31, 2017)
FY2016(For the year ended
March 31, 2016)
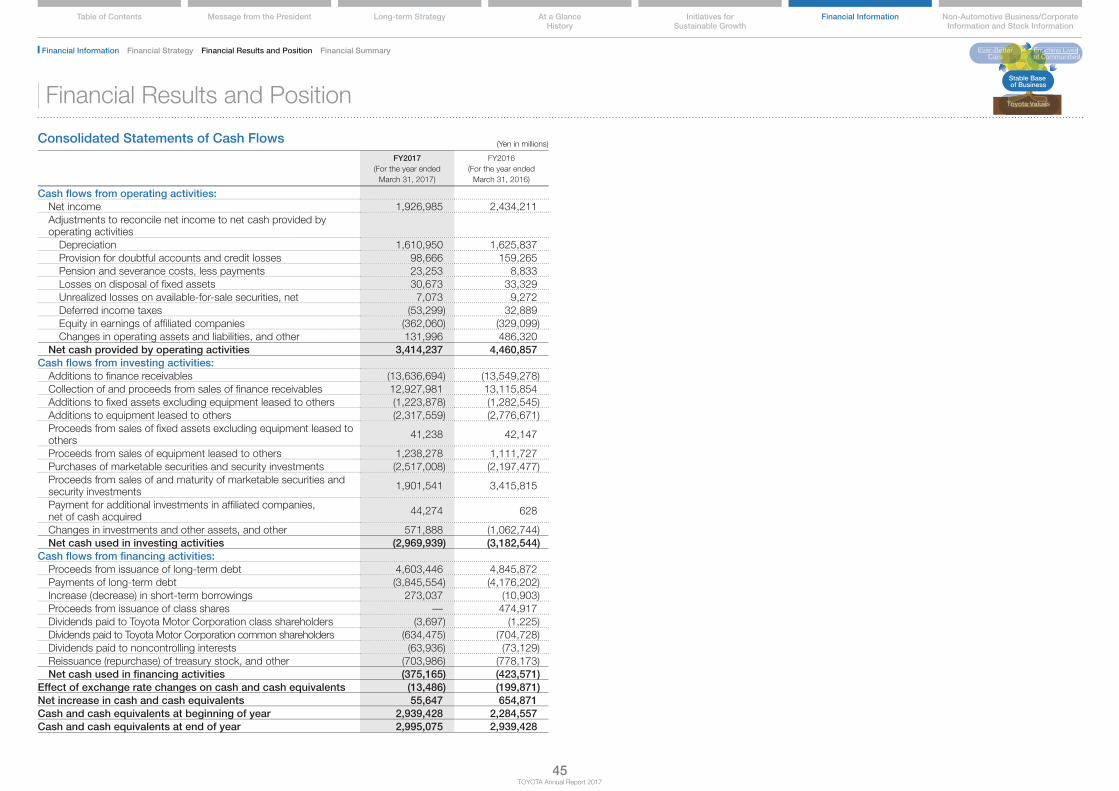
Cash fl ows from operating activities: Net income 1,926,985 2,434,211 Adjustments to reconcile net income to net cash provided by
operating activities Depreciation 1,610,950 1,625,837 Provision for doubtful accounts and credit losses 98,666 159,265 Pension and severance costs, less payments 23,253 8,833 Losses on disposal of fi xed assets 30,673 33,329 Unrealized losses on available-for-sale securities, net 7,073 9,272 Deferred income taxes (53,299) 32,889 Equity in earnings of affi liated companies (362,060) (329,099) Changes in operating assets and liabilities, and other 131,996 486,320 Net cash provided by operating activities 3,414,237 4,460,857Cash fl ows from investing activities: Additions to fi nance receivables (13,636,694) (13,549,278) Collection of and proceeds from sales of fi nance receivables 12,927,981 13,115,854 Additions to fi xed assets excluding equipment leased to others (1,223,878) (1,282,545) Additions to equipment leased to others (2,317,559) (2,776,671) Proceeds from sales of fi xed assets excluding equipment leased to
others 41,238 42,147
Proceeds from sales of equipment leased to others 1,238,278 1,111,727 Purchases of marketable securities and security investments (2,517,008) (2,197,477) Proceeds from sales of and maturity of marketable securities and
security investments 1,901,541 3,415,815
Payment for additional investments in affi liated companies, net of cash acquired 44,274 628
Changes in investments and other assets, and other 571,888 (1,062,744) Net cash used in investing activities (2,969,939) (3,182,544)Cash fl ows from fi nancing activities: Proceeds from issuance of long-term debt 4,603,446 4,845,872 Payments of long-term debt (3,845,554) (4,176,202) Increase (decrease) in short-term borrowings 273,037 (10,903) Proceeds from issuance of class shares — 474,917 Dividends paid to Toyota Motor Corporation class shareholders (3,697) (1,225) Dividends paid to Toyota Motor Corporation common shareholders (634,475) (704,728) Dividends paid to noncontrolling interests (63,936) (73,129) Reissuance (repurchase) of treasury stock, and other (703,986) (778,173) Net cash used in fi nancing activities (375,165) (423,571)Effect of exchange rate changes on cash and cash equivalents (13,486) (199,871)Net increase in cash and cash equivalents 55,647 654,871Cash and cash equivalents at beginning of year 2,939,428 2,284,557Cash and cash equivalents at end of year 2,995,075 2,939,428
Consolidated Statements of Cash Flows (Yen in millions)
Financial Results and Position
Financial Information Financial Strategy Financial Results and Position Financial Summary Ever-BetettererCarss
Enriching Lives EEEnrEEnrEnricCommunitiesof Cof CCCof C
Toyota ValuesToyota Valuesoyota ValueToToyota a Value
Stable Base of Business
46TOYOTA Annual Report 2017
Message from the President Long-term Strategy At a Glance History
Initiatives for Sustainable Growth
Financial Information Non-Automotive Business/Corporate Information and Stock Information
Table of Contents
FY2017(As of and for the year ended March 31, 2017) (Yen in millions)
AutomotiveFinancial Services All Other
Inter-segment Elimination and/or
Unallocated Amount Consolidated
Net revenues:
Sales to external customers 25,032,229 1,783,697 781,267 — 27,597,193
Inter-segment sales and transfers 49,618 39,903 539,785 (629,306) —
Total 25,081,847 1,823,600 1,321,052 (629,306) 27,597,193
Capital expenditure 1,389,289 2,638,111 41,826 (10,010) 4,059,216
Note: Unallocated corporate assets included under "Inter-segment Elimination and/or Unallocated Amount" for FY2017 and FY2016 are 9,177,953 million yen and 9,369,868 million yen, respectively, and consist primarily of
funds such as cash and cash equivalents, marketable securities and portion of security investments held by TMC.
Segment Operating Results
Automotive
Net revenues for the automotive operations
decreased by 895.5 billion yen, or 3.4%, to 25,081.8
billion yen in FY2017 compared with FY2016, and
operating income decreased by 756.0 billion yen, or
30.9%, to 1,692.9 billion yen in FY2017 compared
with FY2016. The decrease in operating income was
mainly due to the effects of changes in exchange
rates and the increase in expenses and others.
Financial services
Net revenues for the fi nancial services operations
decreased by 72.6 billion yen, or 3.8%, to 1,823.6
billion yen in FY2017 compared with FY2016, and
operating income decreased by 116.7 billion yen, or
34.4%, to 222.4 billion yen in FY2017 compared with
FY2016. The decrease in operating income was
mainly due to the increase in expenses related to
credit losses and residual value losses in sales
fi nance subsidiaries.
All other
Net revenues for all other businesses increased by
143.6 billion yen, or 12.2%, to 1,321.0 billion yen in
FY2017 compared with FY2016, and operating
income increased by 14.8 billion yen, or 22.3%, to
81.3 billion yen in FY2017 compared with FY2016.
Financial Results and Position
Financial Information Financial Strategy Financial Results and Position Financial Summary Ever-BetettererCarss
Enriching Lives EEEnrEEnrEnricCommunitiesof Cof CCCof C
Toyota ValuesToyota Valuesoyota ValueToToyota a Value
Stable Base of Business
47TOYOTA Annual Report 2017
Message from the President Long-term Strategy At a Glance History
Initiatives for Sustainable Growth
Financial Information Non-Automotive Business/Corporate Information and Stock Information
Table of Contents
FY2017(As of and for the year ended March 31, 2017) (Yen in millions)
Note: 1. Unallocated corporate assets included under “Inter-segment Elimination and/or Unallocated Amount” for FY2017 and FY2016 are 9,177,953 million yen and 9,369,868 million yen, respectively, and consist primarily of
funds such as cash and cash equivalents, marketable securities and portion of security investments held by TMC.
2. “Other” consists of Central and South America, Oceania, Africa and the Middle East.
Geographic Information
JapanNet revenues in Japan increased by 71.3 billion yen, or 0.5%, to 14,830.8 billion yen in FY2017 compared with FY2016. However, operating income decreased by 475.2 billion yen, or 28.3%, to 1,202.2 billion yen in FY2017 compared with FY2016. The decrease in operating income was mainly due to the effects of changes in exchange rates and the increase in expenses and others.
North AmericaNet revenues in North America decreased by 812.8 billion yen, or 7.4%, to 10,239.0 billion yen in FY2017 compared with FY2016, and operating income decreased by 217.6 billion yen, or 41.2%, to 311.1 billion yen in FY2017 compared with FY2016. The decrease in operating income was mainly due to the increase in expenses and others as well as the increase in expenses related to credit losses and residual value losses, and the recording of valuation losses on interest rate swaps stated at fair value, both in sales fi nance subsidiaries.
EuropeNet revenues in Europe increased by 19.7 billion yen, or 0.7%, to 2,681.0 billion yen in FY2017 compared with FY2016. However, operating income decreased by 84.6 billion yen to an operating loss of 12.2 billion yen in FY2017 compared with FY2016. The decrease in operating income was mainly due to the increase in expenses and others.
AsiaNet revenues in Asia decreased by 184.0 billion yen, or 3.7%, to 4,819.8 billion yen in FY2017 compared with FY2016, and operating income decreased by 14.0 billion yen, or 3.1%, to 435.1 billion yen in FY2017 compared with FY2016. The decrease in operating income was mainly due to the effects of changes in exchange rates.
Other (Central and South America, Oceania, Africa and the Middle East)
Net revenues in other regions decreased by 49.1 bil-lion yen, or 2.2%, to 2,161.0 billion yen in FY2017 compared with FY2016, and operating income decreased by 50.2 billion yen, or 46.1%, to 58.6 bil-lion yen in FY2017 compared with FY2016. The decrease in operating income was mainly due to the increase in expenses and others.
Financial Results and Position
Financial Information Financial Strategy Financial Results and Position Financial Summary Ever-BetettererCarss
Enriching Lives EEEnrEEnrEnricCommunitiesof Cof CCCof C
Toyota ValuesToyota Valuesoyota ValueToToyota a Value
Stable Base of Business
48TOYOTA Annual Report 2017
Message from the President Long-term Strategy At a Glance History
Initiatives for Sustainable Growth
Financial Information Non-Automotive Business/Corporate Information and Stock Information
Table of Contents
Fiscal years ended March 31 2008 2009 2010 2011 2012 2013 2014 2015 2016 2017
(Note 1) Shows “Net income (loss) attributable to Toyota Motor Corporation”
(Note 2) Value of common shares repurchased (shareholder return on Net Income for the period, excluding shares constituting less than one unit that were purchased upon request and repurchases made to avoid dilution of shares)
(Note 3) Figures for depreciation expenses and capital expenditures do not include vehicles in operating lease
(Note 4) Excludes fi nancial subsidiaries
Financial Summary (Consolidated)<U.S. GAAP>
Financial Information Financial Strategy Financial Results and Position Financial Summary Ever-BetettererCarss
Enriching Lives EEEnrEEnrEnricCommunitiesof Cof CCCof C
Toyota ValuesToyota Valuesoyota ValueToToyota a Value