© 2015 Enroll America and Get Covered America
EnrollAmerica.org | GetCoveredAmerica.org
Click to edit master title style.
1
Enroll America Uninsured Landscape Findings for 2015
October 30, 2015
© 2015 Enroll America and Get Covered America
EnrollAmerica.org | GetCoveredAmerica.org 2
Overview
1. National Uninsured Rates and Trends
2. State Uninsured Rates and Trends
3. Demographic Trends
4. Where the Uninsured are Located
© 2015 Enroll America and Get Covered America
EnrollAmerica.org | GetCoveredAmerica.org 3
NATIONAL UNINSURED RATE
© 2015 Enroll America and Get Covered America
EnrollAmerica.org | GetCoveredAmerica.org 4
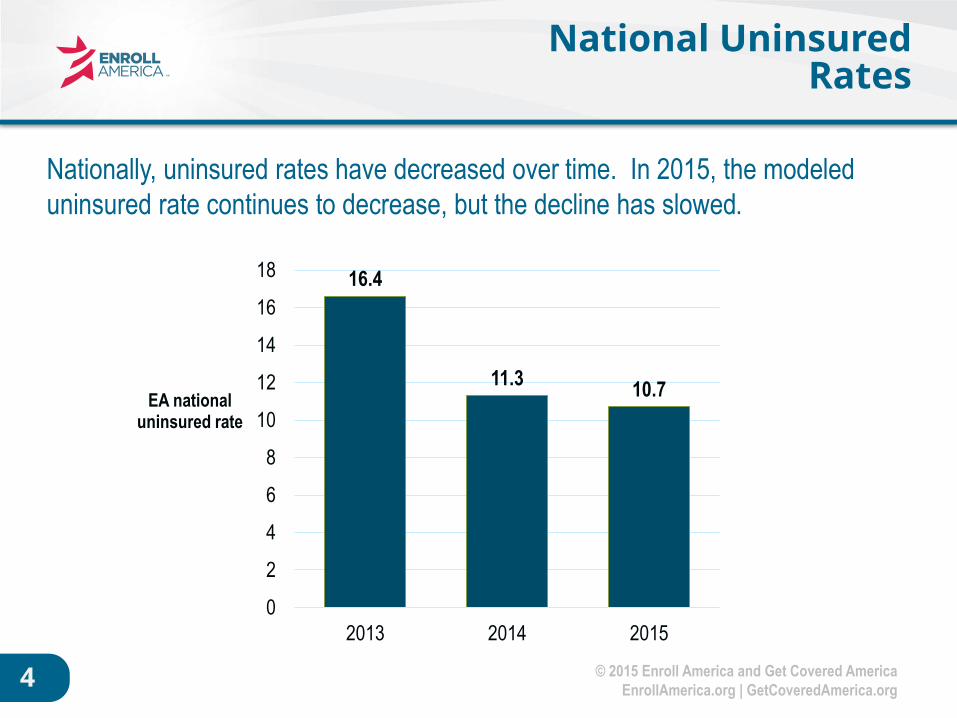
National Uninsured Rates
16.4
11.310.7
0
2
4
6
8
10
12
14
16
18
2013 2014 2015
EA national uninsured rate
Nationally, uninsured rates have decreased over time. In 2015, the modeled
uninsured rate continues to decrease, but the decline has slowed.
© 2015 Enroll America and Get Covered America
EnrollAmerica.org | GetCoveredAmerica.org 5
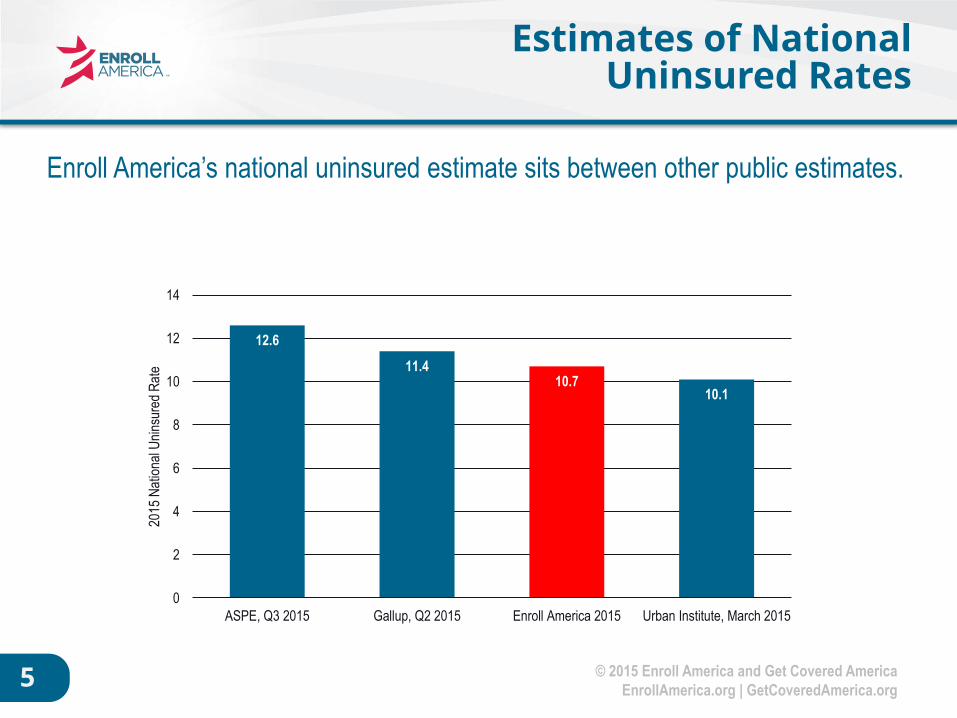
Estimates of National Uninsured Rates
12.6
11.410.7
10.1
0
2
4
6
8
10
12
14
ASPE, Q3 2015 Gallup, Q2 2015 Enroll America 2015 Urban Institute, March 2015
2015
Nat
iona
l Uni
nsur
ed R
ate
Enroll America’s national uninsured estimate sits between other public estimates.
© 2015 Enroll America and Get Covered America
EnrollAmerica.org | GetCoveredAmerica.org 6
STATE UNINSURED RATES
AND TRENDS
© 2015 Enroll America and Get Covered America
EnrollAmerica.org | GetCoveredAmerica.org 7
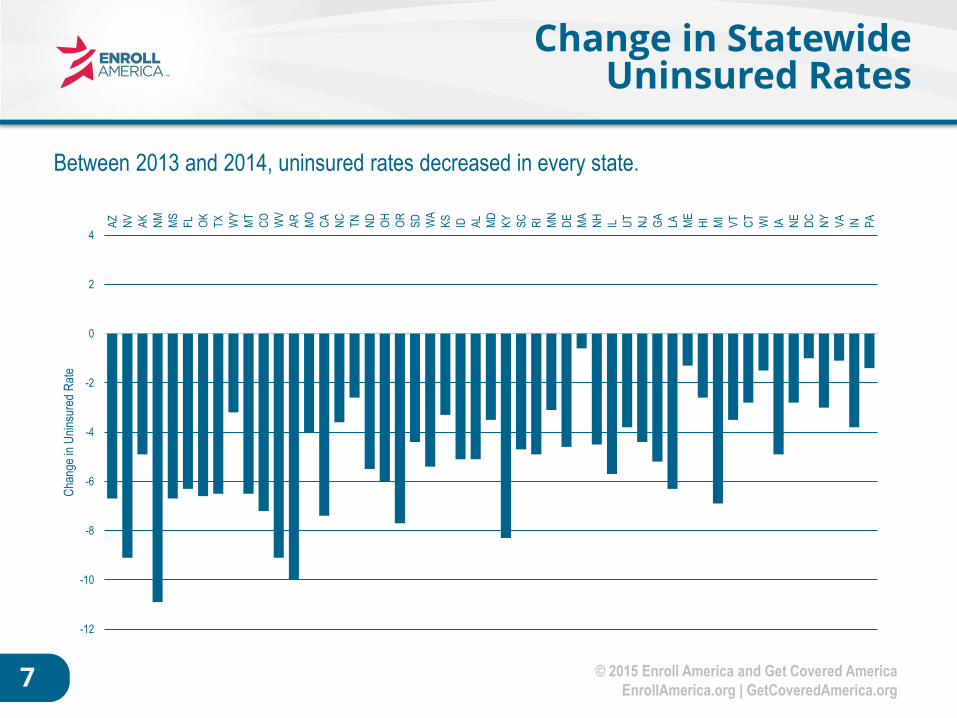
Change in Statewide Uninsured Rates
Between 2013 and 2014, uninsured rates decreased in every state.
-12
-10
-8
-6
-4
-2
0
2
4
AZ
NV
AK
NM
MS
FL
OK
TX
WY
MT
CO
WV
AR
MO
CA
NC
TN
ND
OH
OR
SD
WA
KS
ID AL
MD
KY
SC
RI
MN
DE
MA
NH
IL UT
NJ
GA
LA ME
HI
MI
VT
CT
WI
IA NE
DC
NY
VA
IN PA
Cha
nge
in U
nins
ured
Rat
e
© 2015 Enroll America and Get Covered America
EnrollAmerica.org | GetCoveredAmerica.org 8
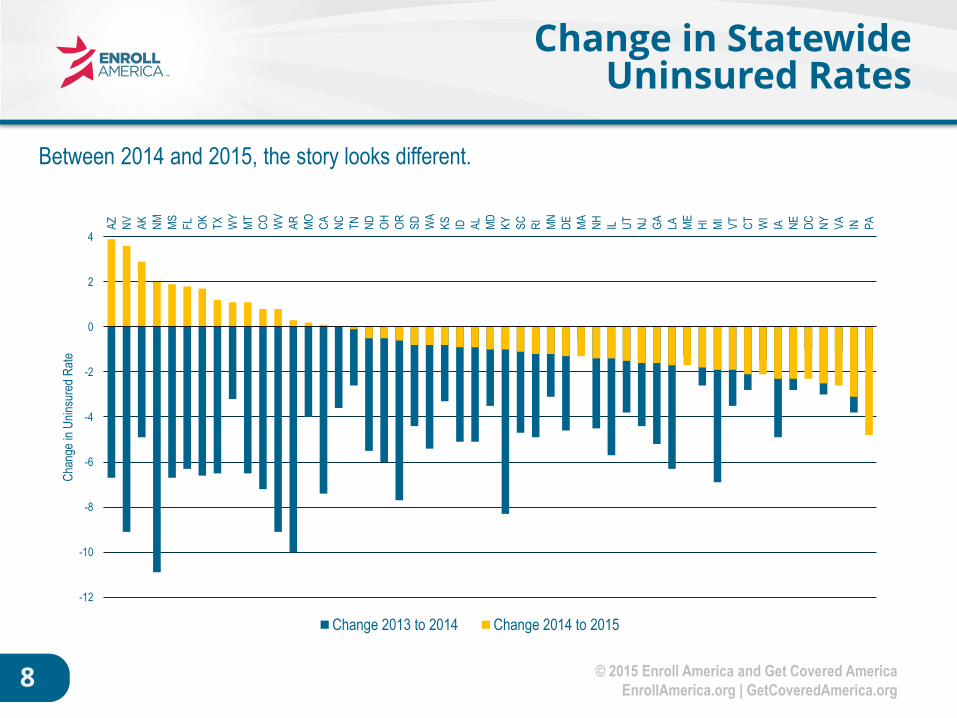
Change in Statewide Uninsured Rates
Between 2014 and 2015, the story looks different.
-12
-10
-8
-6
-4
-2
0
2
4
AZ
NV
AK
NM
MS
FL
OK
TX
WY
MT
CO
WV
AR
MO
CA
NC
TN
ND
OH
OR
SD
WA
KS
ID AL
MD
KY
SC
RI
MN
DE
MA
NH
IL UT
NJ
GA
LA ME
HI
MI
VT
CT
WI
IA NE
DC
NY
VA
IN PA
Cha
nge
in U
nins
ured
Rat
e
Change 2013 to 2014 Change 2014 to 2015
© 2015 Enroll America and Get Covered America
EnrollAmerica.org | GetCoveredAmerica.org 9
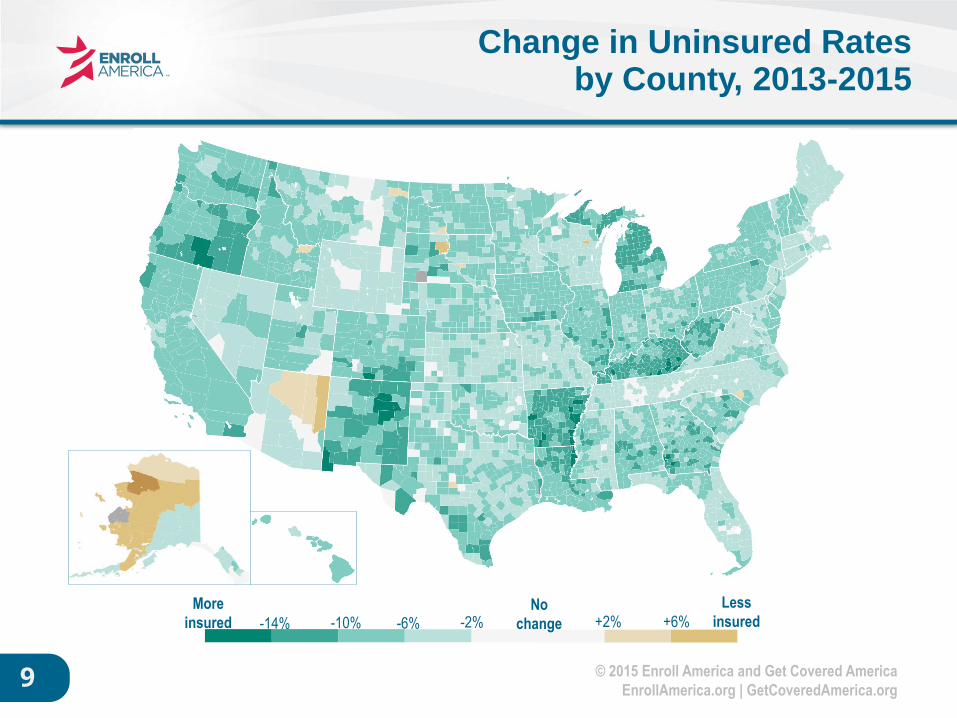
Change in Uninsured Rates by County, 2013-2015
-14% -10% -6% -2%No
change +2% +6%More
insured
Less
insured
© 2015 Enroll America and Get Covered America
EnrollAmerica.org | GetCoveredAmerica.org 10
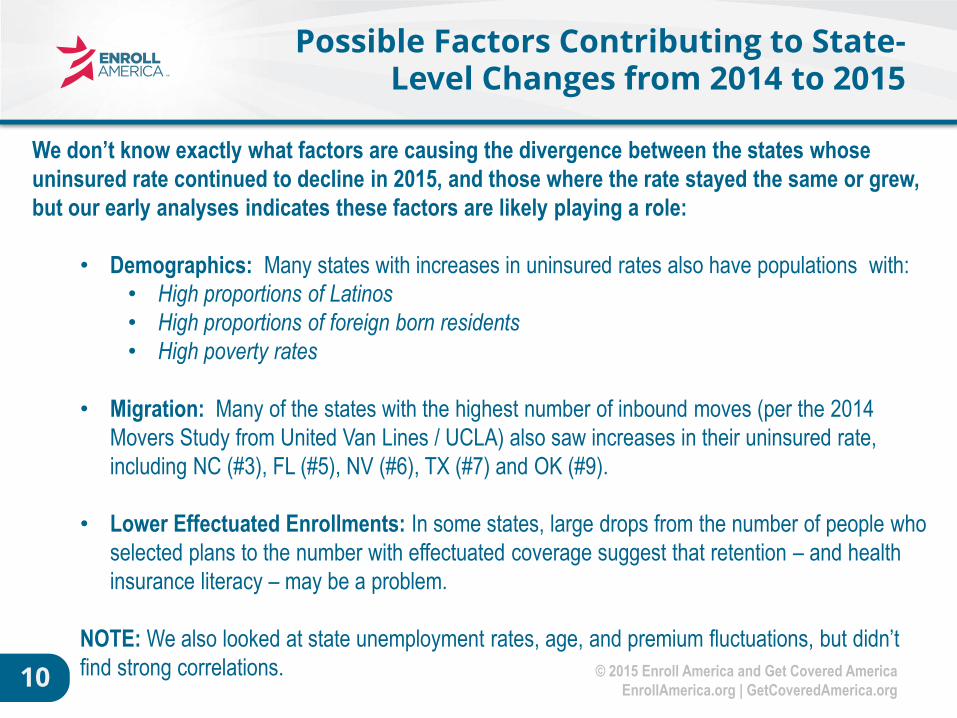
Possible Factors Contributing to State-Level Changes from 2014 to 2015
We don’t know exactly what factors are causing the divergence between the states whose
uninsured rate continued to decline in 2015, and those where the rate stayed the same or grew,
but our early analyses indicates these factors are likely playing a role:
• Demographics: Many states with increases in uninsured rates also have populations with:
• High proportions of Latinos
• High proportions of foreign born residents
• High poverty rates
• Migration: Many of the states with the highest number of inbound moves (per the 2014
Movers Study from United Van Lines / UCLA) also saw increases in their uninsured rate,
including NC (#3), FL (#5), NV (#6), TX (#7) and OK (#9).
• Lower Effectuated Enrollments: In some states, large drops from the number of people who
selected plans to the number with effectuated coverage suggest that retention – and health
insurance literacy – may be a problem.
NOTE: We also looked at state unemployment rates, age, and premium fluctuations, but didn’t
find strong correlations.
© 2015 Enroll America and Get Covered America
EnrollAmerica.org | GetCoveredAmerica.org 11
DEMOGRAPHIC TRENDS
© 2015 Enroll America and Get Covered America
EnrollAmerica.org | GetCoveredAmerica.org 12
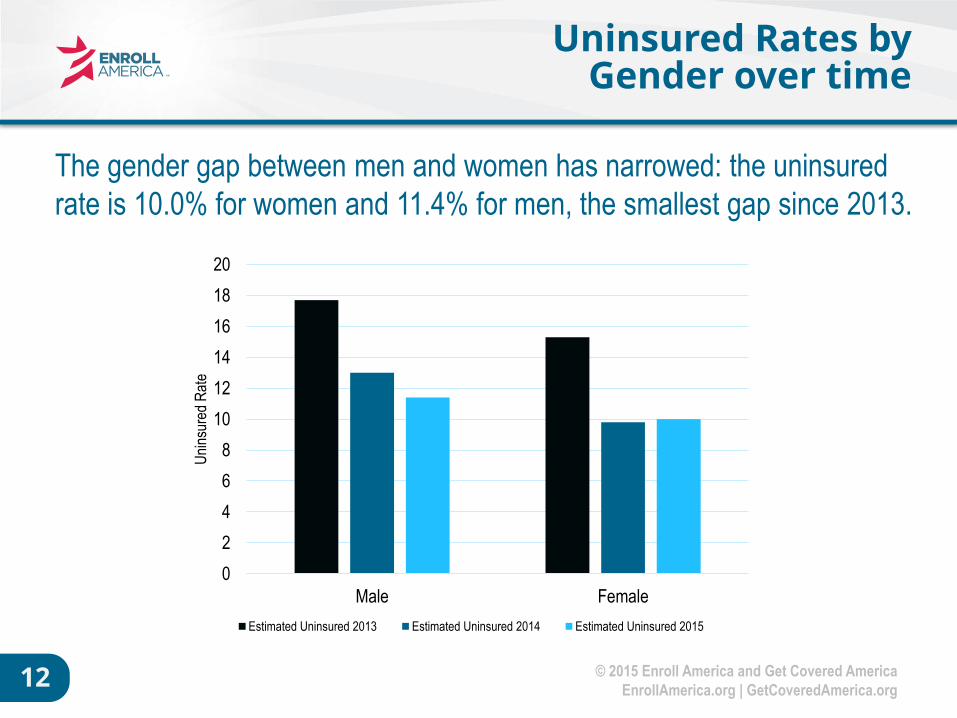
Uninsured Rates by Gender over time
The gender gap between men and women has narrowed: the uninsured
rate is 10.0% for women and 11.4% for men, the smallest gap since 2013.
0
2
4
6
8
10
12
14
16
18
20
Male Female
Uni
nsur
ed R
ate
Estimated Uninsured 2013 Estimated Uninsured 2014 Estimated Uninsured 2015
© 2015 Enroll America and Get Covered America
EnrollAmerica.org | GetCoveredAmerica.org 13
Uninsured Rates by Age over time
The uninsured rate for young adults aged 18 to 35 continues to be higher
than the national average.
0
5
10
15
20
25
Estimated Uninsured 2013 Estimated Uninsured 2014 Estimated Uninsured 2015
18 - 34
35 - 44
45 - 54
55 - 64
© 2015 Enroll America and Get Covered America
EnrollAmerica.org | GetCoveredAmerica.org 14
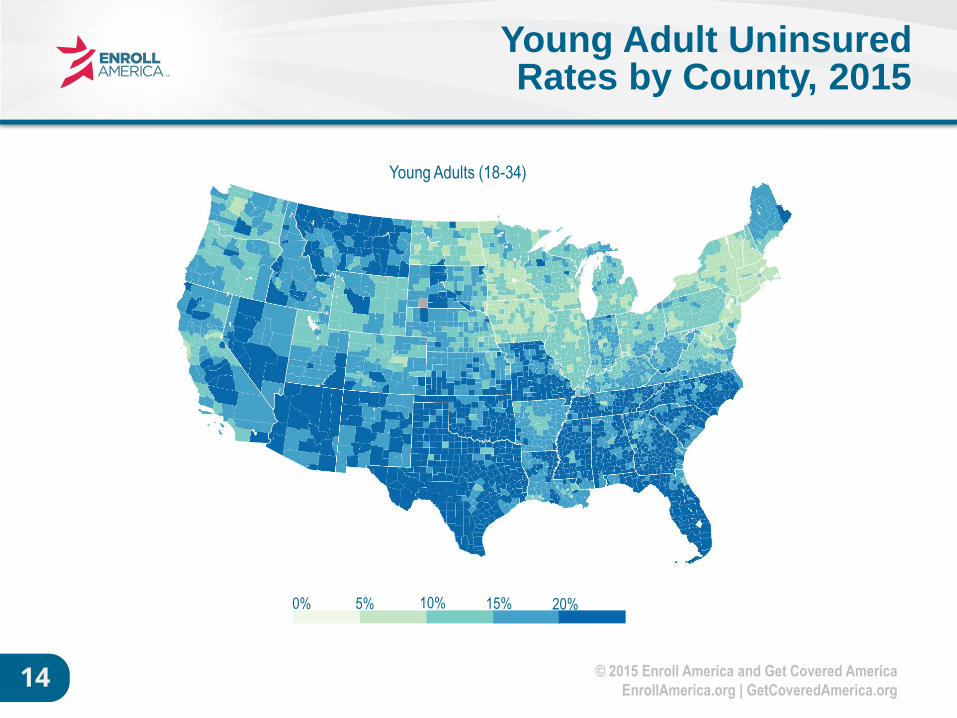
Young Adult Uninsured Rates by County, 2015
Young Adults (18-34)
5% 10% 15% 20%0%
© 2015 Enroll America and Get Covered America
EnrollAmerica.org | GetCoveredAmerica.org 15
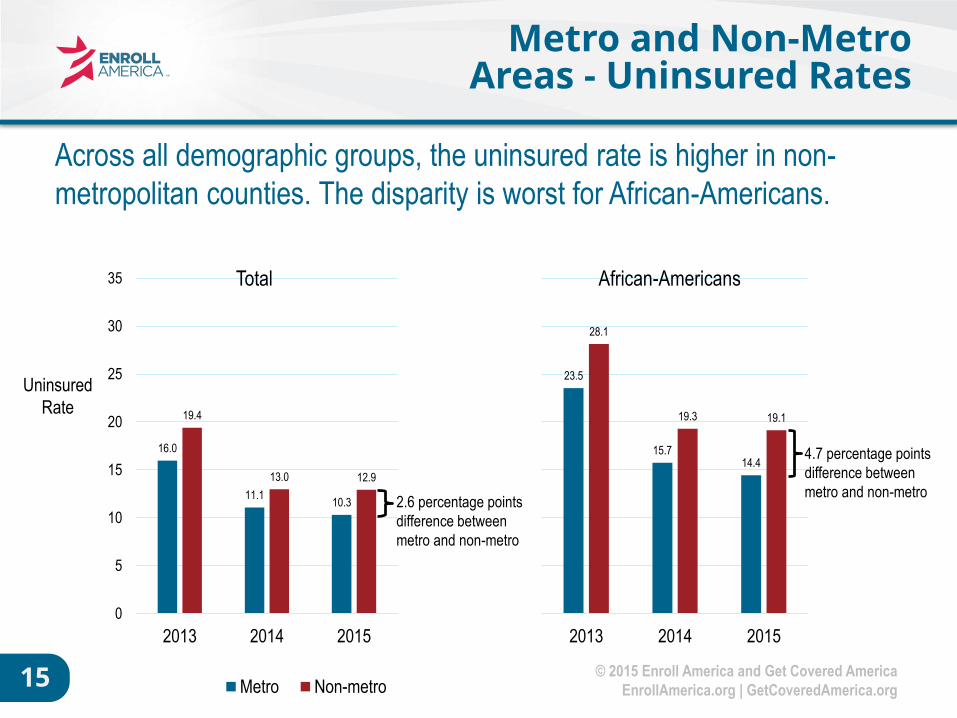
Metro and Non-Metro Areas - Uninsured Rates
Across all demographic groups, the uninsured rate is higher in non-
metropolitan counties. The disparity is worst for African-Americans.
23.5
15.714.4
28.1
19.3 19.1
2013 2014 2015
African-Americans
4.7 percentage points
difference between
metro and non-metro
16.0
11.110.3
19.4
13.0 12.9
0
5
10
15
20
25
30
35
2013 2014 2015
Total
Metro Non-metro
2.6 percentage points
difference between
metro and non-metro
Uninsured
Rate
© 2015 Enroll America and Get Covered America
EnrollAmerica.org | GetCoveredAmerica.org 16
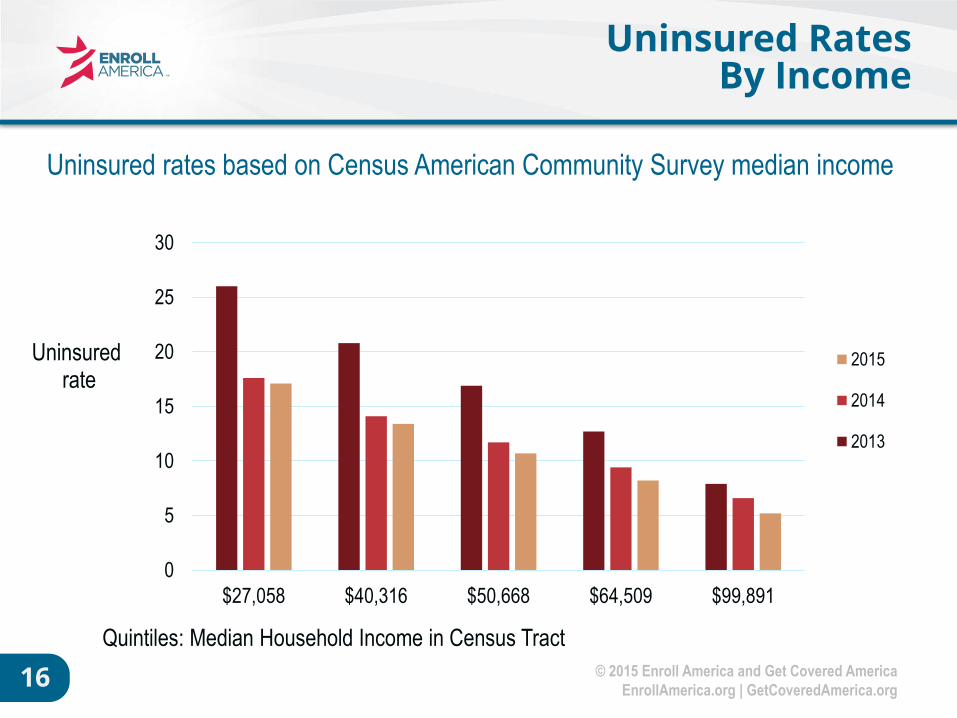
Uninsured RatesBy Income
Uninsured rates based on Census American Community Survey median income
0
5
10
15
20
25
30
$99,891$64,509$50,668$40,316$27,058
Uninsuredrate
Quintiles: Median Household Income in Census Tract
2015
2014
2013
© 2015 Enroll America and Get Covered America
EnrollAmerica.org | GetCoveredAmerica.org 17
WHERE THE UNINSURED ARE
LOCATED
© 2015 Enroll America and Get Covered America
EnrollAmerica.org | GetCoveredAmerica.org 18
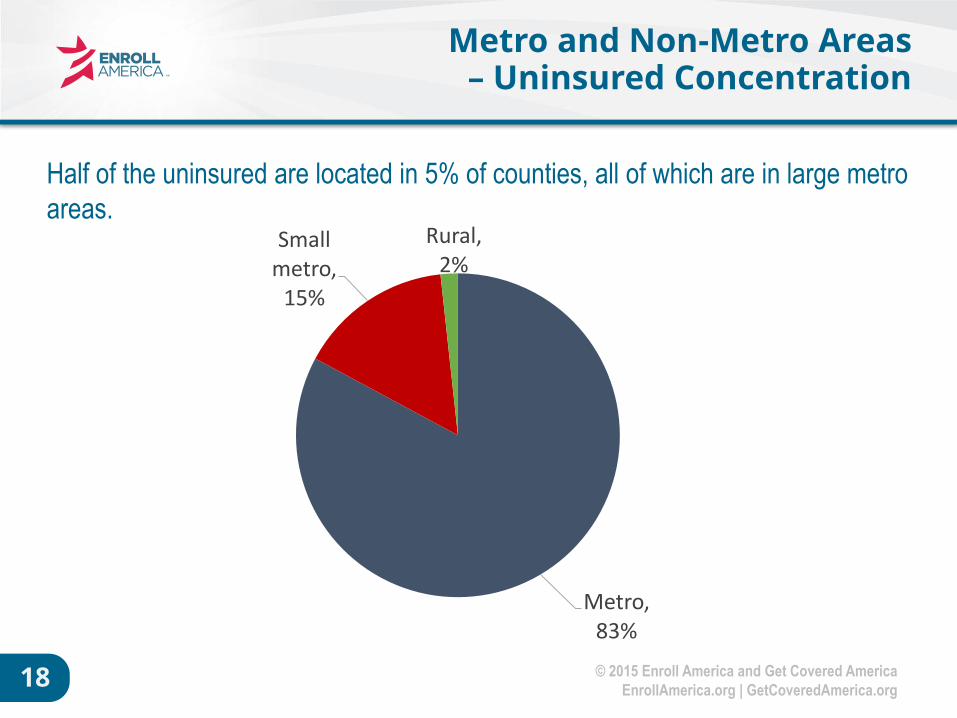
Metro and Non-Metro Areas – Uninsured Concentration
Half of the uninsured are located in 5% of counties, all of which are in large metro
areas.
Metro, 83%
Small metro,
15%
Rural, 2%
© 2015 Enroll America and Get Covered America
EnrollAmerica.org | GetCoveredAmerica.org 19
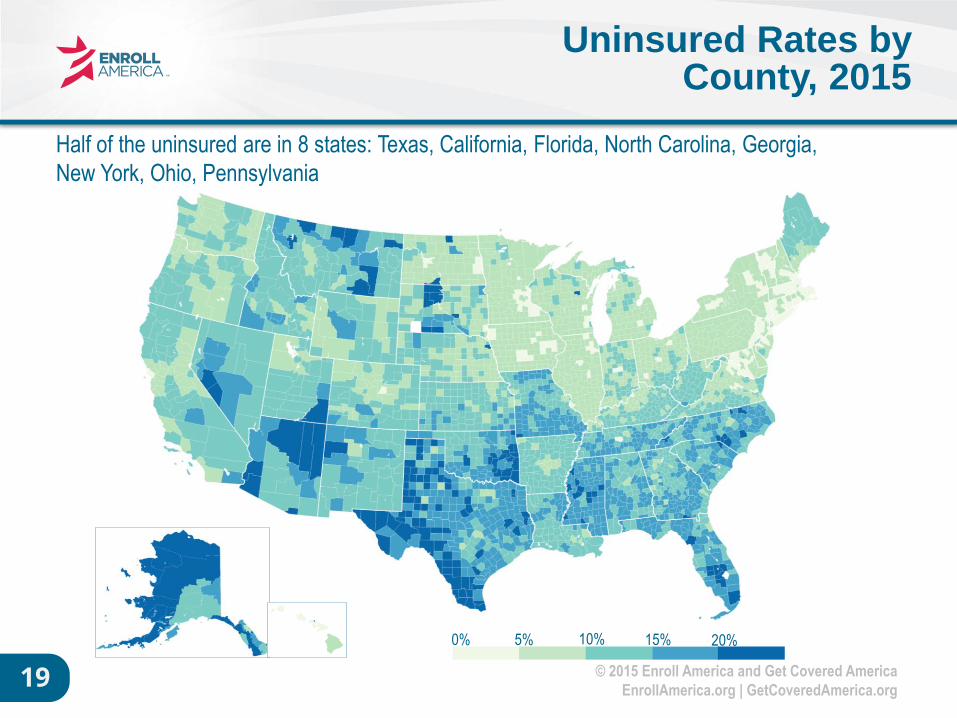
Uninsured Rates by County, 2015
5% 10% 15% 20%0%
Half of the uninsured are in 8 states: Texas, California, Florida, North Carolina, Georgia,
New York, Ohio, Pennsylvania