26
1 Enrollment & Graduates in 2021 Tennessee Board of Regents September Quarterly Meeting

1
Enrollment & Graduates in 2021Tennessee Board of RegentsSeptember Quarterly Meeting

2
OPEN ACCESS
COMPLETION
COMMUNITY & WORKFORCE
DEVELOPMENT
STRATEGIC PLANPillars of TBR’s Work

Open AccessTBR is an open-access community and technical college system that serves students of all backgrounds, demographics, income levels, readiness or circumstances and is committed to meeting student, workforce and community needs for education and training.
Key Metrics: Enrollment by student type, demographics, income, and college readiness.Volunteer State, 2019

Enrollment in Fall 2021OPEN
ACCESS
National & State Context
At two-year colleges across the country, enrollment fell 10% in fall 2020.
In Tennessee, total undergraduate enrollment including universities fell 5% in fall 2020.
Data from the National Student Clearinghouse & Tennessee Higher Education Commission
TN Community Colleges
At community colleges in Tennessee:
• Last fall, enrollment fell 9.8%.
• This fall, enrollment fell 8.8%.
TCATs
At TCATs:
• Last fall, enrollment fell2.2%.
• This fall, registrations have increased 9.4%.
2021 data compares preliminary census enrollment in fall 2021 to data from the end of the term in 2020.
2021 data compares student registrations to the same day in the prior year.

Community college enrollment declined 8.8% in 2021.
OPEN ACCESS
010,00020,00030,00040,00050,00060,00070,00080,00090,000
100,000
2011 2012 2013 2014 2015 2016 2017 2018 2019 2020 2021*
Fall Terms
Community College Enrollment
Headcount Full-Time Equivalent Enrollment
73,123 students are enrolled in fall 2021.
• That’s 7,043 fewer students than at the end of the term in fall 2020 and 15,823 fewer students than in fall 2019.
• Two colleges saw enrollment increasessince fall 2020—Cleveland State and Dyersburg State each grew by almost 2%.
*Preliminary fall 2021 enrollment is based on unedited census (14th day) enrollment data. Prior years are reported with official end-of-term data. Historically, the end-of-term headcount is 1% higher than census, while end-of-term full-time equivalent (FTE) enrollment is 2% higher than census. Census enrollment may not reflect enrollments in courses that begin after the 14th day.

Enrollment numbers will rise between now and the end of the term.
OPEN ACCESS
• This fall, several community colleges have increased their offering of accelerated courses.
• These courses are typically seven weeks long, so a normal fall semester might include two accelerated terms.
• Accelerated courses offer students more flexibility and often lead to higher success rates.
• Chattanooga is delivering most of their courses in accelerated formats. Southwest, Roane, and others are also offering accelerated courses.
• Since the second accelerated term starts in October, enrollment will likely increase between now and the end of the term, especially the count of full-time equivalent enrollment (FTE).
From ChattanoogaState.edu/7weekclasses

Community college enrollment by group
OPEN ACCESS
From fall 2020 to 2021:• Enrollment by dual enrolled high
school students decreased only 1%.
• Enrollment by first-time freshmen decreased 6%.
• Enrollment by transfer/readmitted students fell 1%.
• Enrollment by continuing students fell 15%.
0
10,000
20,000
30,000
40,000
50,000
60,000
2011 2012 2013 2014 2015 2016 2017 2018 2019 2020 2021*
Fall Terms
Community College Headcount
Dual Enrollment First-Time FreshmenTransfer/Readmitted Continuing/Other
*Preliminary fall 2021 enrollment is based on unedited census (14th day) enrollment data. Prior years are reported with official end-of-term data.

Fall-to-fall retention declined slightly.
OPEN ACCESS
Among first-time, full-time students who began college in fall 2020:• Fall-to-fall retention fell to 51%
(compared to 54% last year).
• However, because the 2020 cohort was also smaller overall, the impact of this decline in retention was magnified.
0 5,000 10,000 15,000 20,000
2018
2019
2020En
terin
g Co
hort
Fall-to-Fall Retention
Entering Cohort Returned
*The fall-to-fall retention rate measures the proportion of students from a first-time, full-time freshman cohort who return the following fall semester to any Tennessee community college or who graduated in their first year. The retention rate for the 2020 cohort is based on preliminary census data, while prior years are based on end-of-term data. Therefore, the retention rate for the 2020 cohort may increase slightly when end-of-term data is available.
55% retention rate
54% retention rate
51% retention rate

Gains in EnrollmentDual enrollment increased at seven colleges. Three colleges saw increases over 2019 levels too.
First-time students enrolling after a “gap year” following high school increased by 57% from last year.
Students participating in higher education in prison programs doubled over 2019 rates.
Declines in EnrollmentFirst-time enrollment by recent high school graduates fell by 10%, representing 1,500 fewer students.
The number of Black students dropped by 8% from 2020 and by 22% from 2019.
The number of female students decreased by 10%, compared to a 7% drop for male students.
OPEN ACCESSCommunity colleges in 2021 compared to 2020

Community college enrollment in online and remote courses remained high.
OPEN ACCESS
• In 2019, 83% of students took at least one conventional course. In 2021, only 53% of students took at least one conventional course.
• In 2019, 41% of students took at least one online or remote course. In 2021, 65% of students took at least one online or remote course.
0%
20%
40%
60%
80%
100%
2015 2016 2017 2018 2019 2020 2021
Fall Terms
Community College Students by Delivery Method
Conventional Hybrid Online/Remote Other
*Summing the delivery method categories will result in a headcount over 100%, as many students take classes though multiple delivery methods and are therefore counted multiple times.

TCAT registrations have increased 9% in 2021.
OPEN ACCESS
More than 12,000 students are registered for fall 2021. • That’s approximately 1,000 more
students than at the same time in fall 2020.
• 16 TCATs reported registration increases compared to this time last year.
11,0
72 12,1
17
0
2,000
4,000
6,000
8,000
10,000
12,000
2020 2021Fall Terms
TCAT Registrations
*TCAT registration data reflects the number of students registered for courses as of September 21 in each year. Since TCAT Chattanooga is not in the central student information system, the above data does not include Chattanooga. Registration and attendance will continue to grow throughout the term, so these figures are preliminary.
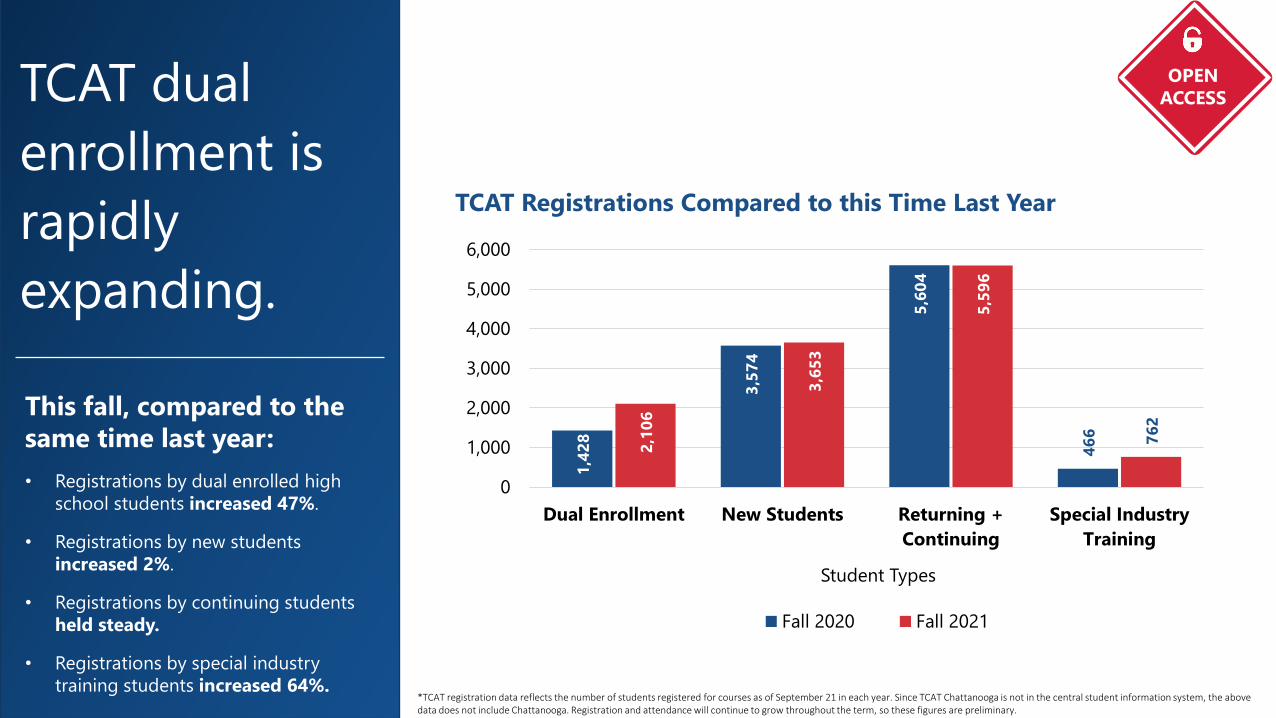
TCAT dual enrollment is rapidly expanding.
OPEN ACCESS
This fall, compared to the same time last year:• Registrations by dual enrolled high
school students increased 47%.
• Registrations by new students increased 2%.
• Registrations by continuing students held steady.
• Registrations by special industry training students increased 64%.
1,42
8
3,57
4
5,60
4
466
2,10
6
3,65
3
5,59
6
762
0
1,000
2,000
3,000
4,000
5,000
6,000
Dual Enrollment New Students Returning +Continuing
Special IndustryTraining
Student Types
TCAT Registrations Compared to this Time Last Year
Fall 2020 Fall 2021
*TCAT registration data reflects the number of students registered for courses as of September 21 in each year. Since TCAT Chattanooga is not in the central student information system, the above data does not include Chattanooga. Registration and attendance will continue to grow throughout the term, so these figures are preliminary.

How are colleges working to boost enrollment and fulfill the system’s open-access mission?
OPEN ACCESS
Strategic Enrollment Management
All colleges in our system have developed specific goals and actionable strategies to boost
recruitment and retention.
More Information
Achieving the Dream
All colleges are working with Achieving the Dream to increase retention, improve teaching &
learning, and close equity gaps.
More Information
Center for Innovation in Teaching & Learning
TBR’s Center for Innovation in Teaching & Learning equips
faculty and staff with resources to improve student learning and
boost student success.
More Information
TCAT Capacity
TCATs are putting state investments to work by
expanding their capacity to serve students in high-demand
fields and meet the state’s workforce needs.

Key Takeaways
Overall enrollment
• Community college enrollment fell 8.8% from fall 2020 to 2021.
• TCAT registrations rose 9.4% from fall 2020 to 2021.
New students Returning or continuing students
• The number of continuing students at community colleges fell 15%.
• The number of continuing students at TCATs held steady.
• The number of first-time freshmen at community colleges fell 6%.
• The number of dual enrolled high school students held steady or even increased.
OPEN ACCESS

CompletionTBR values completion and is committed to helping students address and confront any existing barriers to completing their programs, whether students are pursuing a transfer degree, a diploma, a short-term certificate or other credential.
Key Metrics: Credentials earned, graduation rates, and progress toward the Drive to 55.TCAT Chattanooga, 2020

Students earned degrees, certificates, and diplomas at high rates in 2021.
12,993
13,643
14,136
15,240
14,968
15,874
15,791
2015
2016
2017
2018
2019
2020
2021
Community College Awards
COMPLETION
*Community college awards include associate degrees and technical certificates earned during the academic year of preceding summer, fall, and spring terms. TCAT awards include diplomas and certificates earned during the academic year of fall, spring, and trailing summer. TCAT 2020-21 awards are preliminary and will be revised when final data is available. 2020-21 awards for TCAT Chattanooga are calculated using summer 2020 data.
7,528
7,470
7,709
7,219
7,181
7,083
7,165
2015
2016
2017
2018
2019
2020
2021*
TCAT Awards
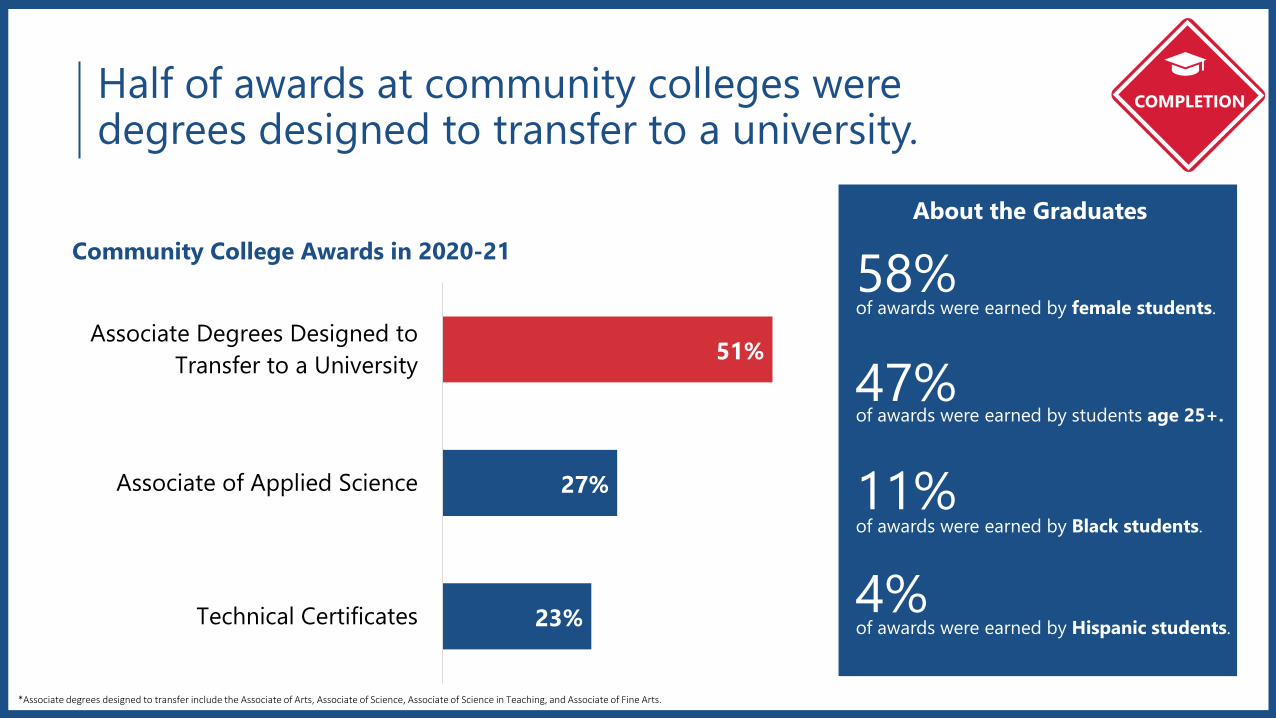
Half of awards at community colleges were degrees designed to transfer to a university.
*Associate degrees designed to transfer include the Associate of Arts, Associate of Science, Associate of Science in Teaching, and Associate of Fine Arts.
51%
27%
23%
Associate Degrees Designed toTransfer to a University
Associate of Applied Science
Technical Certificates
Community College Awards in 2020-21About the Graduates
58%of awards were earned by female students.
47%of awards were earned by students age 25+.
11%of awards were earned by Black students.
4%of awards were earned by Hispanic students.
COMPLETION

Fall 2020 Enrollment at TCATsTennessee community college students graduated at the highest rate ever.
*Graduation rates include degrees and technical certificates earned at any TBR community college.
14%16%
17%20% 22%
24%25% 25% 26%
0%
5%
10%
15%
20%
25%
30%
2010-13 2011-14 2012-15 2013-16 2014-17 2015-18 2016-19 2017-20 2018-21
Entering Cohort
26.0% of students from the 2018 cohort graduated within three years.
At four community colleges, graduation rates in 2021 exceeded 30%.
Motlow had the highest rate at 34%.
Graduation rates have nearly doubled since 2010.
COMPLETION
This graduation rate measures how many students who began as first-time, full-time students earned a degree or certificate within three years.

*Graduation rates include degrees and technical certificates earned at any TBR community college. Data on low-income students is not available prior to 2015.
0%
5%
10%
15%
20%
25%
30%
2010-13 2011-14 2012-15 2013-16 2014-17 2015-18 2016-19 2017-20 2018-21
Three-Year Graduation Rate by Race and Ethnicity
Black and African American Hispanic White Low Income
For students who began in 2018:
• 23% of low-income students graduated within three years.
• 25% of Hispanic students graduated within three years.
• 13% of Black students graduated within three years.
• To close the gap between White and Black students from the 2018 cohort, community colleges would have needed to graduate 523 additional Black students.
COMPLETIONGraduation rates increased for Black, Hispanic, and low-income students. Yet, gaps persist.

Community college graduation rates have accelerated over time.
Many students graduate after the three-year mark.
Graduation rates have accelerated over the past decade.
• For students who entered a decade ago in 2011, it took 9 years (27 semesters) to reach a 26% graduation rate.
• For students who entered in 2018, it took only 3 years (9 semesters) to reach 26%.
COMPLETION
26%
29% 31% 31% 32% 31%29%
27%
0%
5%
10%
15%
20%
25%
30%
35%
1 2 3 4 5 6 7 8 9 10 11 12 13 14 15 16 17 18 19 20 21 22 23 24 25 26 27 28 29 30
Cum
ulat
ive
Gra
duat
ion
Rate
Number of Semesters Since First Enrollment
2018
2017
2016
2015
2014
2013
2012
2011
*The cumulative graduation rate reflects the cumulative number of students in a cohort who earned a technical certificate or degree from any TBR community in each semester, beginning with the student’s first semester of enrollment as a first-time, full-time freshman. The count of semesters includes fall, spring, and summer terms.
Thre
e Ye
ars
Six Ye
ars
Nin
e Ye
ars

The graduation rate in Tennessee is similar to other states in the region. But Tennessee has outpaced most other states in graduation rate growth.
0%
5%
10%
15%
20%
25%
30%
35%
40%
2011-14 2012-15 2013-16 2014-17 2015-18 2016-19
Entering Cohort
Three-Year Graduation Rate at Community Colleges in the South
Georgia
Kentucy
Louisiana
North Carolina
South Carolina
Tennessee
Texas
COMPLETION
• The three-year graduation rate for community college students in Tennessee is just below the average rate for the region (28%).
• However, since 2011, the graduation rate has grown quicker in Tennessee than almost any other state. Only two other states saw more growth in their graduation rates (North Carolina and Georgia).
*Source: US Department of Education, National Center for Education Statistics, IPEDS Graduation Rates for public two-year institutions offering associate degrees and certificates; average calculated based on states who are part of the Southern Regional Education Board (SREB).
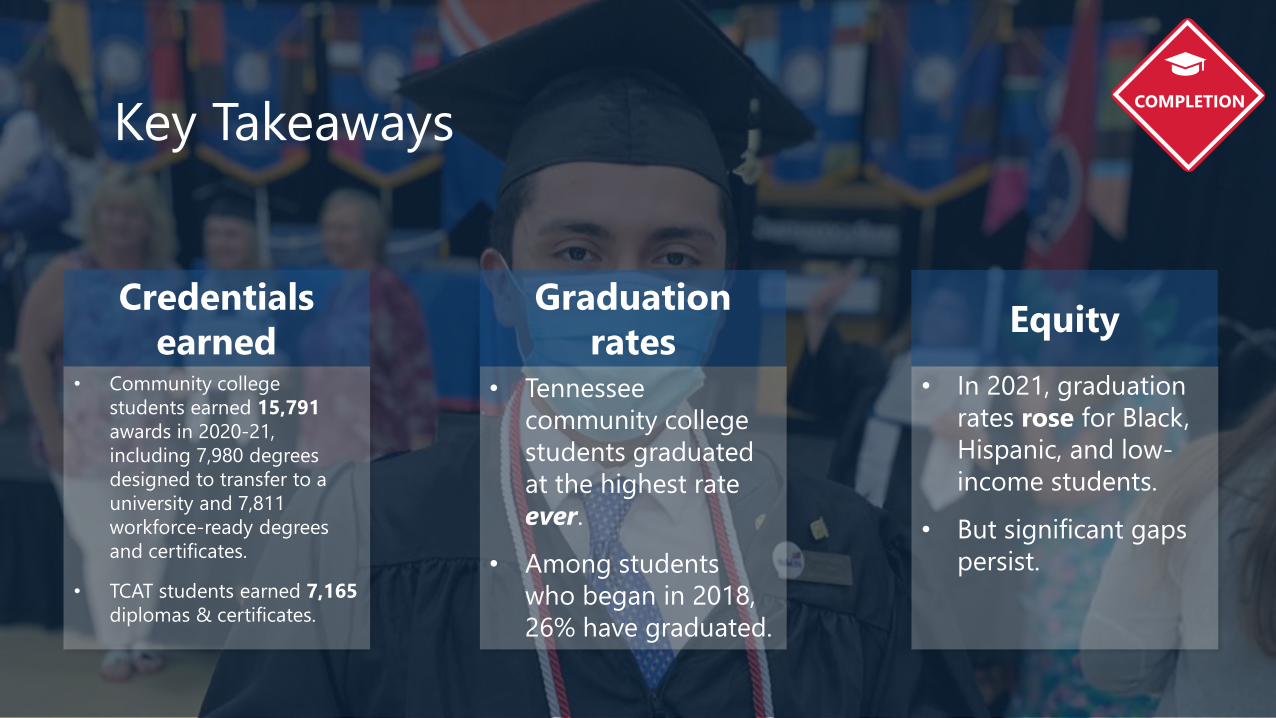
Credentials earned
• Community college students earned 15,791awards in 2020-21, including 7,980 degrees designed to transfer to a university and 7,811 workforce-ready degrees and certificates.
• TCAT students earned 7,165diplomas & certificates.
Graduation rates
• Tennessee community college students graduated at the highest rate ever.
• Among students who began in 2018, 26% have graduated.
Equity• In 2021, graduation
rates rose for Black, Hispanic, and low-income students.
• But significant gaps persist.
COMPLETIONKey Takeaways

Community & Workforce DevelopmentTBR is committed to improving the condition of individuals, families, and communities across the state, which manifests itself in tangible ways such as economic vitality and mobility, but also by improving and enriching the communities it serves.
Key Metrics: job placement rates and impact on the community.TCAT Jackson, 2019

Job placement rates remained high at TCATs in 2020.
*Data on completion, job placement, and licensure are based on data reported to the Council on Occupational Education (COE), the accrediting body for TCATs.
TCAT StudentSuccess
in 2019-20
85%Job Placement Rate
95%Licensure Pass Rate
Completion Rate79%
90%
89%
85%
82%
82%
Automotive Technology
Practical Nursing
Welding Technology
HVAC
Cosmetology
Job Placement Rates in 2019-20
COMMUNITY & WORKFORCE
DEVELOPMENT
For five of the largest programs

As we work toward the Drive to 55, the statewide postsecondary educational attainment rate has risen to 47%. Community colleges and TCATs are making progress toward their Drive to 55 goals.
*Drive to 55 targets capture the annual number of unique graduates. Since some individuals earn multiple awards, the number of award recipients differs from the number of awards.
6,674
1,849
TCAT Goal
In 2019-20, 6,674 students graduated from TCATs.
An additional 1,849 graduates next year will help us reach the target.
Annual Target: 8,523
14,514
381
Community College Goal
In 2020-21, 14,514 students graduated from community colleges.
An additional 381 graduates next year will help us reach the annual target.
Annual Target: 14,895Graduates Graduates
COMMUNITY & WORKFORCE
DEVELOPMENT
26
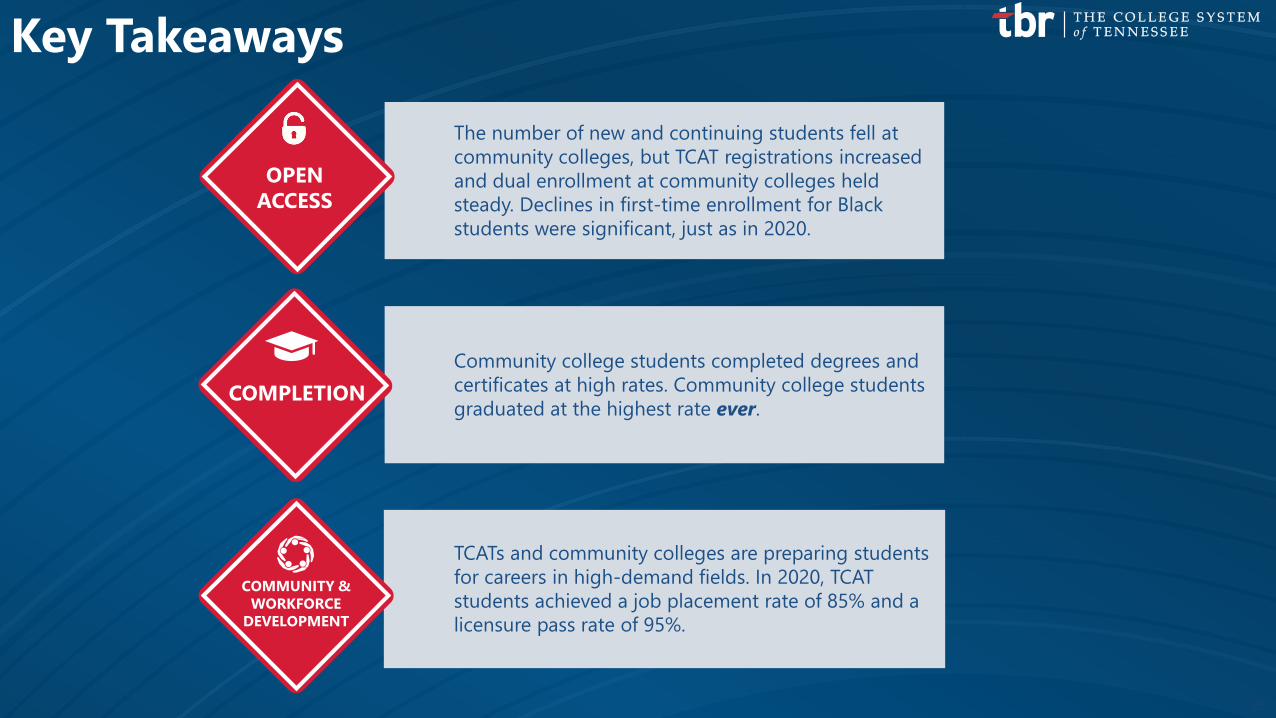
The number of new and continuing students fell at community colleges, but TCAT registrations increased and dual enrollment at community colleges held steady. Declines in first-time enrollment for Black students were significant, just as in 2020.
Community college students completed degrees and certificates at high rates. Community college students graduated at the highest rate ever.
TCATs and community colleges are preparing students for careers in high-demand fields. In 2020, TCAT students achieved a job placement rate of 85% and a licensure pass rate of 95%.
COMMUNITY & WORKFORCE
DEVELOPMENT
COMPLETION
OPEN ACCESS
Key Takeaways


